ten year power plant site plan 2014 – 2023
TRANSCRIPT

Ten Year Power Plant Site Plan 2014 – 2023

Ten Year Power Plant Site Plan 2014-2023 Submitted To: Florida Public
Service Commission
Miami, Florida April 2014

(This page is intentionally left blank.)

Table of Contents List of Figures and Tables ............................................................................................................ iii List of Schedules .......................................................................................................................... iv Overview of the Document ........................................................................................................... 1 List of Abbreviations ..................................................................................................................... 3 Executive Summary ...................................................................................................................... 5 I. Description of Existing Resources .............................................................................. 11
A. FPL-Owned Resources ..................................................................................... 13 B. Capacity and Energy Power Purchases ......................................................... 17 C. Demand Side Management (DSM) .................................................................... 22
II. Forecast of Electric Power Demand ............................................................................. 25
A. Overview of the Load Forecasting Process .......... …………………………….27 B. Comparison of FPL’s Current and Previous Load Forecasts ....................... 28 C. Long-Term Sales Forecasts ............................................................................. 29 D. Net Energy for Load .......................................................................................... 32 E. System Peak Forecasts .................................................................................... 33 F. Hourly Load Forecast ....................................................................................... 35 G. Uncertainty ……………………………………………………………………… ....... 35 H. DSM ..................................................................................................................... 36
III. Projection of Incremental Resource Additions ........................................................... 45
A. FPL’s Resource Planning ................................................................................. 47 B. Projected Incremental Resource Additions/Changes in the
Resource Plan ............................................................................................................. 57 C. Discussion of the Projected Resource Plan and Issues Impacting
FPL’s Resource Planning Work…………………… ........................................... 58 D. Demand Side Management (DSM) .......................................................................... 65 E. Transmission Plan....................................................................................................... 66 F. Renewable Resources ................................................................................................ 71 G. FPL’s Fuel Mix and Price Forecasts ................................................................. 77
IV. Environmental and Land Use Information ................................................................. 107
A. Protection of the Environment ...................................................................... 109 B. FPL’s Environmental Statement .................................................................... 110 C. Environmental Management .......................................................................... 111 D. Environmental Assurance Program .............................................................. 112 E. Environmental Communication and Facilitation ......................................... 112 F. Preferred and Potential Sites ......................................................................... 113
1. Preferred Site # 1 - Port Everglades Plant ................................ 114 2. Preferred Site # 2 - Lauderdale Plant ......................................... 119 3. Preferred Site # 3 - Hendry County ............................................ 124 4. Preferred Site # 4 - NE Okeechobee County ............................. 127 5. Preferred Site # 5 - Putnam County ........................................... 130
Florida Power & Light Company i

6. Preferred Site # 6 – Turkey Point Plant ...................................... 133 7. Potential Site # 1 - Babcock Ranch ........................................... 143 8. Potential Site # 2 - DeSoto Solar Expansion............................. 143 9. Potential Site # 3 - Manatee Plant Site ....................................... 144 10. Potential Site # 4 - Martin County .............................................. 145
V. Other Planning Assumptions and Information .............................................................. 193 Introduction ................................................................................................................... 195 Discussion Item #1 ................................................................................................. 195 Discussion Item #2 ................................................................................................. 196 Discussion Item #3 ................................................................................................. 197 Discussion Item #4 ................................................................................................. 197 Discussion Item #5 ................................................................................................. 197 Discussion Item #6 ................................................................................................. 198 Discussion Item #7 ................................................................................................. 198 Discussion Item #8 ................................................................................................. 199 Discussion Item #9 ................................................................................................. 200 Discussion Item #10 ................................................................................................. 200 Discussion Item #11 ................................................................................................. 201 Discussion Item #12 ................................................................................................. 202
Florida Power & Light Company ii

List of Figures and Tables Table ES-1 Projected Capacity & Firm Purchase Power Changes ................................... 10 Figure I.A.1 Capacity Resources by Location (Map) ........................................................... 14 Table I.A.1 Capacity Resource by Unit Type ..................................................................... 15 Figure I.A.2 FPL Substation & Transmission System Configuration (Map) ..................... 16 Table I.A.3 Purchase Power Resources by Contract......................................................... 19 Table I.B.1 FPL’s Firm Purchased Power Summer MW ................................................... 20 Table I.B.2 FPL’s Firm Purchased Power Winter MW........................................................ 21 Table I.C.1 As-Available Energy Purchases From Non-Utility Generators in 2012 ........ 26 Figure III.A.1 Overview of FPL’s IRP Process ........................................................................ 48 Table III.E.1 List of Proposed Power Lines .......................................................................... 66 Table IV.E.1 2012 FPL Environmental Outreach Activities ............................................... 113
Preferred Site # 1 - Port Everglades Plant Maps ........................................... 147 Preferred Site # 2 - Lauderdale Plant Maps ................................................... 153 Preferred Site # 3 - Hendry County Maps ...................................................... 185 Preferred Site # 4 - Northeast Okeechobee County Maps ........................... 161 Preferred Site # 5 – Putnam Site Maps .......................................................... 167 Preferred Site # 6 – Turkey Point Maps ........................................................ 171 Potential Site # 1 – Babcock Ranch Maps ..................................................... 177 Potential Site # 2 – Desoto Solar Expansion Maps ...................................... 181 Potential Site # 3 - Manatee Plant Maps......................................................... 185 Potential Site # 4 – Martin County Maps ........................................................ 189
Florida Power & Light Company iii

List of Schedules Schedule 1 Existing Generating Facilities ........................................................................... 23 Schedule 2.1 History and Forecast of Energy Consumption & Number of
Customers by Customer Class (Rural & Residential) .................................... 37
Schedule 2.2 History and Forecast of Energy Consumption & Number of Customers by Customer Class (Industrial) ..................................................... 38
Schedule 2.3 History and Forecast of Energy Consumption & Number of Customers by Customer Class (Sales for Resale) ......................................... 39
Schedule 3.1 History and Forecast of Summer Peak Demand (Base Case) ........................................................................................................ 40
Schedule 3.2 History and Forecast of Winter Peak Demand (Base Case) ........................................................................................................ 41
Schedule 3.3 History and Forecast of Annual Net Energy for
Load GWh (Base Case)...................................................................................... 42
Schedule 4 Previous Year Actual and Two-Year Forecast of Retail Peak Demand and Net Energy for Load by Month ................................................... 43
Schedule 5 Fuel Requirements ............................................................................................. 85 Schedule 6.1 Energy Sources .................................................................................................. 86 Schedule 6.2 Energy Sources % by Fuel Type ...................................................................... 87 Schedule 7.1 Forecast of Capacity, Demand and Scheduled Maintenance at
Time of Summer Peak........................................................................................ 88
Schedule 7.2 Forecast of Capacity, Demand and Scheduled Maintenance at Time of Winter Peak ........................................................................................... 89
Schedule 8 Planned and Prospective Generating Facility Additions and Changes ....... 90 Schedule 9 Status Report and Specifications of Proposed Generating Facilities .......... 92 Schedule 10 Status Report and Specifications of Proposed Transmission Lines ........... 98
Schedule 11.1 Existing Firm and Non-Firm Capacity & Energy by Primary Fuel Type .... 106 Schedule 11.2 Existing Non- Firm Self-Service Renewable Generation Facilities ............ 106
Florida Power & Light Company iv

Overview of the Document
Chapter 186, Florida Statutes, requires that each electric utility in the State of Florida with a minimum
existing generating capacity of 250 megawatts (MW) must annually submit a Ten Year Power Plant Site
Plan (Site Plan). This Site Plan should include an estimate of the utility’s future electric power generating
needs, a projection of how these estimated generating needs could be met, and disclosure of information
pertaining to the utility’s preferred and potential power plant sites. The information contained in this Site
Plan is compiled and presented in accordance with rules 25-22.070, 25-22.071, and 25-22.072, Florida
Administrative Code (F.A.C.).
Site Plans are long-term planning documents and should be viewed in this context. A Site Plan contains
uncertain forecasts and tentative planning information. Forecasts evolve, and all planning information is
subject to change at the discretion of the utility. Much of the data submitted is preliminary in nature and is
presented in a general manner. Specific and detailed data will be submitted as part of the Florida site
certification process, or through other proceedings and filings, at the appropriate time.
This Site Plan document is based on Florida Power & Light Company’s (FPL) integrated resource planning
(IRP) analyses that were carried out in 2013 and that were on-going in the first Quarter of 2014. The
forecasted information presented in this plan addresses the years 2014 through 2023.
This document is organized in the following manner:
Chapter I – Description of Existing Resources This chapter provides an overview of FPL’s current generating facilities. Also included is information on
other FPL resources including purchased power, demand side management, and FPL’s transmission
system.
Chapter II – Forecast of Electric Power Demand FPL’s load forecasting methodology, and its forecast of seasonal peaks and annual energy usage, is
presented in Chapter II.
Chapter III – Projection of Incremental Resource Additions This chapter discusses FPL’s integrated resource planning (IRP) process and outlines FPL’s projected
resource additions, especially new power plants, based on FPL’s IRP work in 2013 and early 2014. This
chapter also discusses a number of issues that may change the resource plan presented in this Site Plan.
Furthermore, this chapter briefly discusses the status of FPL’s DSM planning efforts, as well as FPL’s,
renewable energy efforts, transmission planning additions, and fuel cost forecasts.
Florida Power & Light Company 1

Chapter IV – Environmental and Land Use Information This chapter discusses environmental information as well as Preferred and Potential site locations for
additional electric generation facilities.
Chapter V – Other Planning Assumptions and Information This chapter addresses twelve “discussion items” which pertain to additional information that is included in
a Site Plan filing.
Florida Power & Light Company 2

Reference Abbreviation DefinitionCC Combined CycleCT Combustion TurbineGT Gas TurbineST Stean Unit (Fossil or Nuclear)PV Photovoltaic
NUC UraniumBIT Bituminous CoalFO2 #1, #2 or Kerosene Oil (Distillate)FO6 #4,#5,#6 Oil (Heavy)NG Natural GasNo None
Solar Solar EnergySUB Sub Bituminous CoalPet Petroleum CokeNo NonePL PipelineRR RailroadTK TruckWA WaterOT OtherL Regulatory approval pending. Not under constructionP Planned UnitT Regulatory approval received but not under constructionU Under construction, less than or equal to 50% CompleteV Under construction, more than 50% Complete
Other ESP Electrostatic Precipitators
FPLList of AbbreviationsUsed in FPL Forms
Unit/Site Status
Fuel Type
Fuel Transportation
Unit Type
Florida Power & Light Company 3

(This page is left intentionally blank.)
Florida Power & Light Company 4

Executive Summary
Florida Power & Light Company’s (FPL) 2014 Ten Year Power Plant Site Plan (Site Plan) presents FPL’s
current plans to augment and enhance its electric generation capability (owned or purchased) as part of its
efforts to meet its projected incremental resource needs for the 2014 - 2023 time period. By design, the
primary focus of this document is on supply side additions; i.e., electric generation capability and the sites
for these additions. The supply side additions discussed in this document are resources projected to be
needed, based on FPL’s load forecast, after accounting for FPL’s demand side management (DSM)
resource additions. In 2014, new DSM Goals for FPL for the time period 2015 through 2024 will be set by
the Florida Public Service Commission (FPSC). At almost the same time FPL is filing this 2014 Site Plan,
FPL will also be filing its proposed DSM Goals with the FPSC. Consequently, the level of DSM additions
reflected in the 2014 Site Plan is consistent with FPL’s proposed DSM Goals. The proposed level of DSM
is discussed further below and in Chapter III.
FPL’s load forecast accounts for a significant amount of efficiency that results from federal and state
energy efficiency codes and standards. The projected impacts of these codes and standards are directly
accounted for in FPL’s load forecast as discussed below and in Chapter II.
The resource plan that is presented in FPL’s 2014 Site Plan contains four key similarities to the resource
plan presented in FPL’s 2013 Site Plan. However, there are several factors that have contributed to
differences between the resource plan presented in the 2014 Site Plan and the resource plan that was
previously presented in FPL’s 2013 Site Plan. Additional factors will continue to influence FPL’s on-going
resource planning work and could result in changes in the resource plan presented in this document. A
brief discussion of these similarities and factors is provided below. Additional information regarding these
topics is presented in Chapter III.
I. Similarities Between the Current Resource Plan and the Resource Plan Previously Presented in FPL’s 2013 Site Plan:
There are four key similarities between the current resource plan presented in this document and the
resource plan presented in the 2013 Site Plan. Similarity # 1: Modernizations of Existing Power Plant Sites.
The modernization of FPL’s Cape Canaveral plant site was completed on time in 2013 and the
modernization of FPL’s existing Riviera Beach plant site is scheduled to be completed on/near the April 1,
Florida Power & Light Company 5

2014 date this 2014 Site Plan is to be filed. In addition, the modernization of FPL’s existing Port
Everglades plant site is underway and is projected to be completed in 2016.
Similarity # 2: FPL continues to pursue additional nuclear energy generation to significantly (i) reduce its use of fossil fuels, (ii) lower system fuel costs, (iii) lower system air emissions, and (iv) provide a valuable hedge against future increases in fuel costs and environmental compliance costs.
In 2013 FPL successfully completed its capacity uprate projects at its four existing nuclear units
; Turkey Point Units 3 & 4 and St. Lucie Units 1 & 2. The nuclear uprate project added about 520 MW of
additional nuclear capacity to FPL’s system which was about 30% more additional nuclear capacity than
was originally projected when the project began. FPL’s customers are already benefiting from lower fuel
costs and reduced system air emissions provided by this additional nuclear capacity.
FPL is also continuing its work to obtain all of the licenses, permits, and approvals that will be necessary to
construct and operate two new nuclear units at its Turkey Point site in the future. The earliest deployment
dates for these two new units remain 2022 and 2023, respectively, and this Site Plan projects the two new
nuclear units going in-service in those years.
Similarity #3: FPL is projected to serve Vero Beach’s electrical load. An agreement to this effect was reached between Vero Beach and FPL on February 19, 2013, and a
referendum was held on March 12, 2013 that resulted in a majority of Vero Beach voters approving the
agreement. FPL’s current load forecast projects that FPL will begin serving Vero Beach’s load in January
2015.
Similarity #4: Specific generating units are projected to be retired and/or converted to synchronous condenser operation. In the last two years, FPL has retired a number of older, less efficient generating units including: Sanford
Unit 3, Cutler Units 5 & 6, Cape Canaveral Units 1 & 2, Riviera Beach Units 3 & 4, and Port Everglades
Units 1 – 4. In addition, Turkey Point Unit 2 has been converted to operate in synchronous condenser
mode to provide voltage support for the transmission system in Southeastern Florida.
This trend is projected to continue. Putnam Units 1 & 2 are now projected to be retired by the end of 2014.
And, similar to the earlier conversion of Turkey Point Unit 2, FPL projects that Turkey Point Unit 1 will be
converted to run in synchronous condenser mode starting in 2016. In addition, for planning purposes, FPL
is projecting that all of its existing gas turbines (GTs) at its two Broward County sites will be retired by the
Florida Power & Light Company 6

end of 2018 and that 5 new combustion turbines (CTs) will be installed at FPL’s Lauderdale plant site also
by the end of 2018. This projection is further discussed later in this executive summary and in Chapter III.
II. Factors Influencing FPL’s Resource Planning Work Which Have Impacted, or Which Could Impact, FPL’s Resource Plan:
There are a number of factors that influence FPL’s resource planning work. Eight (8) of these are briefly
discussed below and are discussed again in Chapters II and/or III.
Two of these factors are on-going system concerns that FPL has considered in its resource planning work
for a number of years. These two on-going system concerns are: (1) maintaining/enhancing fuel diversity
in the FPL system, and (2) maintaining a balance between load and generating capacity in Southeastern
Florida, particularly in Miami-Dade and Broward Counties.
The third and fourth factors that will be discussed are factors that directly impacted the resource plan
presented in this document because they affect FPL’s forecast of its future load and its future firm load.
The third factor is the impact of federal and state energy efficiency codes and standards on FPL’s future
loads. The impact of these codes and standards has been incorporated into FPL’s current load forecast.
The magnitude of efficiency that is being delivered to FPL’s customers through these codes and standards
is significant. For example, by the year 2023 (the last year addressed in this Site Plan), FPL’s Summer
peak is projected to be lower by approximately 3,477 MW compared to what the projected load would
have been without the codes and standards based on cumulative savings beginning in 2005. This
represents a decrease of approximately 12% in what the forecasted Summer peak load for 2023 would
have been without the codes and standards. Likewise, FPL’s forecasted net energy for load (NEL) in the
year 2023 is projected to be approximately 9,991 GWh lower compared to what the projected NEL would
have been without the efficiency codes and standards based on cumulative savings beginning in 2005.
This represents a decrease of approximately 7% from what the forecasted NEL for 2023 would have been
without the codes and standards.
There are two significant impacts from these codes and standards. The first impact is to substantially lower
FPL’s forecasted peak load and NEL. The second impact is that the codes and standards lower the
potential for future MW and GWh reductions from FPL’s DSM programs that address the specific
appliances and equipment impacted by the codes and standards. Thus, significant energy efficiency
regarding this equipment will be delivered to FPL’s customers through codes and standards, thus
precluding the potential for FPL to pursue these same efficiency gains through utility DSM programs.
The fourth factor is a projected decline in the cost-effectiveness of a number of utility DSM measures due
to reasons that are beneficial overall for FPL’s customers. Compared to 2009 (when DSM Goals were last
Florida Power & Light Company 7

set): (i) forecasted fuel costs have dropped by 50%, thus lowering the potential benefits from DSM kwh
reductions; (ii) projected compliance costs for carbon dioxide (CO2), have not only been significantly
lowered, but their forecasted start date has been delayed by almost a decade, thus again lowering the
potential benefits from DSM kwh reductions; and, (iii) FPL’s generating system, due to the retirement of
older, less efficient generators and replacement with highly efficient generators, plus additional nuclear
capacity, has gotten more fuel-efficient, thus lowering fuel-related costs that would otherwise represent
potential benefits for DSM kwh reductions. These factors are benefitting FPL’s customers through lower
electric rates, but they also lower the potential economic benefits that otherwise could be offered by DSM.
When combined with the previously discussed fact that codes and standards have reduced the potential
for efficiency gains in regard to appliance and equipment addressed by these codes and standards, the
result is that FPL is logically projecting a lower contribution from utility DSM in the near-term. That lower
contribution is accounted for in the 2014 Site Plan. These factors are discussed in detail in the filing FPL is
making in its DSM Goals proceeding.
The fifth factor is the need to take measures to limit FPL’s projected increasing dependence upon DSM
resources to maintain system reliability. This factor has been previously discussed in FPL’s 2011, 2012,
and 2013 Site Plans. In these previous Site Plans, FPL has discussed this projection of increasing
dependence upon DSM resources using a new type of reserve margin projection as an indicator: a
“generation-only reserve margin” or “GRM”.
The GRM projections from the 2011, 2012, and 2013 Site Plans consistently showed that these values
were projected to significantly decrease over the 10-year reporting period of the Site Plans, declining to
single-digit values in the latter years of the reporting periods. These projections indicated a steadily
growing dependence on DSM resources to maintain system reliability. FPL’s analyses show that system
reliability risk increases, particularly from a system operations perspective, as dependence on DSM
resources increases to a point where DSM resources account for more than half of FPL’s 20% total
reserve margin criterion value. Therefore, FPL is implementing a new reliability criterion of a 10% GRM in
its resource planning work to complement its other two reliability criteria: a 20% total reserve margin
criterion for Summer and Winter, and an annual 0.1 day/year loss-of-load-probability (LOLP) criterion. FPL
is implementing the GRM criterion so that FPL’s resource plans will begin to meet this criterion in the year
2019. A further discussion of the GRM criterion is presented in Chapter III.
There are additional factors that did not impact FPL’s resource plan presented in this document, but which
could result in future changes to this resource plan. For example, a sixth factor is the project schedule for
the Turkey Point Units 6 & 7 nuclear units. At the time the 2014 Site Plan is being finalized, the Nuclear
Regulatory Commission (NRC) has not provided a schedule for its review of FPL’s Combined Operating
License Application (COLA). Once the NRC’s COLA review schedule is available, FPL will review the
overall schedule for the Turkey Point Units 6 & 7 project. FPL’s review will also consider the impacts of the
Florida Power & Light Company 8

recently amended nuclear cost recovery clause (NCRC) statute and the ongoing feasibility analyses that
are part of Florida Nuclear Cost Recovery process.
The seventh factor is environmental regulation. As developments occur in regard to either new
environmental regulations, and/or in how environmental regulations are interpreted and applied, the
potential exists for such developments to affect FPL’s resource plan that is presented in this document.
For example, FPL is aware of potential impacts to generating units of recent EPA changes to the National
Ambient Air Quality Standards that include shorter duration 1-hour standards for nitrogen dioxide (NO2)
and sulfur dioxide (SO2). As a consequence, FPL filed in mid-2013 for FPSC approval to recover costs
through the environmental cost recovery clause for removing all of its existing gas turbines (GTs) and
partially replacing that peaking unit capacity with new combustion turbines (CTs). Although FPL withdrew
its filing in December 2013 pending further analyses including on-site monitoring, FPL believes that the
results of the monitoring and analyses will require that the Broward GTs be replaced. Therefore, FPL is
currently projecting the retirement of all GTs in Broward County; i.e., at its existing Lauderdale and Port
Everglades plant sites (a decrease in generating capacity of 1,260 MW Summer), and the installation of 5
new 201 MW CTs at its existing Lauderdale plant site (an increase of 1,005 MW Summer).
The eighth factor that will be discussed is the possibility of the establishment of a Florida standard for
renewable energy or clean energy. Although no such legislation has been enacted to-date, Renewable
Portfolio Standards, or Clean Energy Portfolio Standards legislation, or other legislative initiatives
regarding renewable or clean energy contributions, may occur in the future at either the state or national
level. If such legislation is enacted, FPL would then determine what steps need to be taken to address the
legislation.
Each of these factors will continue to be examined in FPL’s on-going resource planning work during the
rest of 2014 and in future years.
Table ES-1 presents a current projection of major changes to specific generating units and firm capacity
purchases for 2014 – 2023. (Although this table does not specifically identify the impacts of projected DSM
additions on FPL’s resource needs and resource plan, FPL’s projected DSM additions have been fully
accounted for in the resource plan presented in this Site Plan.)
Florida Power & Light Company 9

Table ES-1: Projected Capacity & Firm Purchase Power Changes
SummerSummer Reserve
Year * Projected Capacity & Firm Purchase Power Changes MW Date Margin **2014 Martin Unit 1 ESP - Return from ESP outage 823 March-14
Martin Unit 2 ESP - Temporary Outage to install ESPs (826) March-14Turkey Point Unit 5 CT Upgrade 30 March-14Sanford 5 CT Upgrade 9 September-13Riviera Beach Next Generation Clean Energy Center 1,212 April-14
Total of MW changes to Summer firm capacity: 1,247 28.0%2015 Manatee Unit 3 CT Upgrade 32 October-14
Martin Unit 2 ESP - Returned from ESP Outage 823 December-14Putnam 1&2 Retirement (498) December-14OUC - Stanton PPAs 37 January-15Vero Beach Combined Cycle 1/ 46 January-15Palm Beach SWA - additional capacity 70 January-15Fort Myers Unit 2 CT Upgrades 18 June-15Fort Myers Unit 2 CT Upgrades 18 March-15Fort Myers Unit 2 CT Upgrades 18 May-15
Total of MW changes to Summer firm capacity: 563 27.5%2016 UPS Replacement (928) December-15
Port Everglades Next Generation Clean Energy Center 1,237 June-16Total of MW changes to Summer firm capacity: 309 26.6%
2017 Turkey Point Unit 1 synchronous condenser (396) October-16Total of MW changes to Summer firm capacity: (396) 22.6%
2018 OUC - Stanton PPAs (37) December-17Vero Beach Combined Cycle 1/ (46) January-18
Total of MW changes to Summer firm capacity: (83) 20.5%2019 Port Everglades GT retirement (420) December-18
Lauderdale GT retirement (840) December-18Lauderdale CT 1,005 January-19SJRPP suspension of energy (381) April-19Unsited CC 1,269 June-19
Total of MW changes to Summer firm capacity: 633 21.6%2020 Unspecified Purchase 129 June-20
Total of MW changes to Summer firm capacity: 129 20.5%2021 Eco-Gen PPA 180 January-21
Unspecified Purchase 168 June-21Total of MW changes to Summer firm capacity: 348 20.6%
2022 Cape Next Generation Clean Energy Center 87 June-22Turkey Point Nuclear Unit 6 1,100 June-22
Total of MW changes to Summer firm capacity: 1,187 22.6%2023 Riviera Beach Next Generation Clean Energy Center 55 June-23
Turkey Point Nuclear Unit 7 1,100 June-23Total of MW changes to Summer firm capacity: 1,155 24.4%
* Year shown reflects when the MW change begins to be accounted for in Summer reserve margin calculations. (Note that addition of MW values for each year will not yield a current cumulative value.)
** Winter Reserve Margins are typically high than Summer Reserve Margin. Winter Reserve Margin are shownon Schedule 7.2 in Chapter III.
1/ This unit will be added as part of the agreement that FPL will serve Vero Beach's electric load starting January, 2015. This unit is expected to be retired within 3 years.
Florida Power & Light Company 10

CHAPTER I Description of Existing Resources
Florida Power & Light Company 11

(This page is left intentionally blank.)
Florida Power & Light Company 12

I. Description of Existing Resources
FPL’s service area contains approximately 27,650 square miles and has a population of
approximately 9.0 million people. FPL served an average of 4,626,934 customer accounts in
thirty-five counties during 2013. These customers were served by a variety of resources including:
FPL-owned fossil-fueled, renewable, and nuclear generating units, non-utility owned generation,
demand side management (DSM), and interchange/purchased power.
I.A. FPL-Owned Resources
The existing FPL generating resources are located at fourteen generating sites distributed
geographically around its service territory, plus one site in Georgia (partial FPL ownership of one
unit) and one site in Jacksonville, Florida (partial FPL ownership of two units). The current
electrical generating facilities consist of four nuclear units, three coal units, sixteen combined cycle
(CC) units, five fossil steam units, forty-eight combustion gas turbines, two simple cycle
combustion turbines, and two photovoltaic facilities1. The locations of these eighty generating units
are shown on Figure I.A.1 and in Table I.A.1.
FPL’s bulk transmission system is comprised of 6,734 circuit miles of transmission lines.
Integration of the generation, transmission, and distribution system is achieved through FPL’s 589 substations in Florida.
The existing FPL system, including generating plants, major transmission stations, and
transmission lines, is shown on Figure I.A.2.
1 FPL also has one 75 MW solar thermal facility at its Martin plant site. This facility does not generate electricity as the other units mentioned above do. Instead, it produces steam that reduces the use of fossil fuel to produce steam for electricity generation.
Florida Power & Light Company 13

Figure I.A.1: Capacity Resources by Location (as of December 31, 2013)
Collier
Dade
Palm Beach
Broward
HendryLee
Glades
St.Lucie
Okeechobee
MartinDeSoto
Charlotte
Manatee
Brevard
IndianRiver
Flagler
St. Johns
Suwanee
Putnam
Clay
Colum
bia
Brad-ford
Baker
Union
Nassau
Duval
Hamilton
Lafayette
DixieGil-christ
Levy
Polk
Highlands
Hardee
Hills
boro
ugh
Pinellas
Sarasota
Monroe
Marion
Osceola
OrangeLake
Pasco
Hernando
Sum
ter
Citrus
A
EF
GD
B
C
I
H
J
K
L
Alachua
Volusia
Seminole
FPL Generating Resources by Location
Non-FPL Territory
N
M
O
Location/ Number SummerMap Key Plant Name of Units MW
A Turkey Point 4 3,176B St. Lucie 1/ 2 1,821C Manatee 3 2,729D Fort Myers 3 1,748E Lauderdale 2 884F Everglades 2/ 0 0G Riviera 2/ 0 0H Martin 5 3,731I Cape Canaveral 1 1,210J Sanford 2 1,980K Putnam 2 498L St. John's River Power Park 1/ 2 254M West County 3 3,657N DeSoto 3/ 1 25O Space Coast 3/ 1 10
Scherer 4/ 1 643Gas Turbines 48 1,908
Total System Generation = 80 24,274 System Firm Generation = 78 24,239
1/ Represents FPL’s ownership share: St Lucie nuclear: 100% Unit 1, 85% Unit 2: St. Johns River: 20% of two units. 2/ Will be site of new Modernization Plants. 3/ The 25 MW of PV at DeSoto and the 10 MW of PV at Space Coast are considered as non-firm generating capacity
and the capacity from these units has been removed from the "System Firm Generation" row at the end of the table.4/ The Scherer unit is located in Georgia and is not shown on this map.
Florida Power & Light Company 14

Table I.A.1: Capacity Resource by Unit Type (as of December 31, 2013)
Number SummerUnit Type/ Plant Name Location of Units Fuel MW
NuclearSt. Lucie 1/ Hutchinson Island, FL 2 Nuclear 1,821Turkey Point Florida City, FL 2 Nuclear 1,632
Total Nuclear: 4 3,453
Coal SteamScherer Monroe County, Ga 1 Coal 643St. John's River Power Park 2/ Jacksonville, FL 2 Coal 254
Total Coal Steam: 3 897
Combined-Cycle Fort Myers Fort Myers, FL 1 Gas 1,432Manatee Parrish, FL 1 Gas 1,111Martin Indiantown, FL 3 Gas 2,079Sanford Lake Monroe, FL 2 Gas 1,980Cape Canaveral Cocoa, FL 1 Gas/Oil 1,210Lauderdale Dania, FL 2 Gas/Oil 884Putnam Palatka, FL 2 Gas/Oil 498Turkey Point Florida City, FL 1 Gas/Oil 1,148West County Palm Beach County, FL 3 Gas/Oil 3,657
Total Combined Cycle: 16 13,999
Oil/Gas SteamManatee Parrish, FL 2 Oil/Gas 1,618Martin Indiantown,FL 2 Oil/Gas 1,652Turkey Point Florida City, FL 1 Oil/Gas 396
Total Oil/Gas Steam: 5 3,666
Gas Turbines(GT)Fort Myers (GT) Fort Myers, FL 12 Oil 648Lauderdale (GT) Dania, FL 24 Gas/Oil 840Port Everglades (GT) Port Everglades, FL 12 Gas/Oil 420
Total Gas Turbines/Diesels: 48 1,908
Combustion Turbines Fort Myers Fort Myers, FL 2 Gas/Oil 316
Total Combustion Turbines: 2 316
PVDeSoto 3/ DeSoto, FL 1 Solar Energy 25Space Coast 3/ Brevard County, FL 1 Solar Energy 10
Total PV: 2 35
Total System Generation as of December 31, 2013 = 80 24,274 System Firm Generation as of December 31, 2013 = 78 24,239
1/ Total capability of St. Lucie 1 is 981/1,003 MW. FPL's share of St. Lucie 2 is 840/860. FPL's ownership share of St. Lucie Units 1 and 2 is 100% and 85%, respectively.
2/ Capabilities shown represent FPL's output share from each of the units (approx. 92.5% and exclude the Orlando UtilitiesCommission (OUC) and Florida Municipal Power Agency (FMPA) combined portion of approximately 7.44776% per unit.Represents FPL's ownership share: SJRPP coal: 20% of two units).
3/ The 25 MW of PV at DeSoto and the 10 MW of PV at Space Coast are considered as non-firm generating capacity and the capacity from these units has been removed from the "System Firm Generation" row at the end of the table.
Florida Power & Light Company 15

Figure I.A.2: FPL Substation and Transmission System Configuration
Florida Power & Light Company 16

Description of Existing Resources I.B Capacity and Energy Power Purchases
Firm Capacity Purchases from Qualifying Facilities (QF) Firm capacity power purchases are an important part of FPL’s resource mix. FPL currently has
contracts with eight qualifying facilities; i.e., cogeneration/small power production facilities, to
purchase firm capacity and energy during the 10-year reporting period of this Site Plan as shown
in Table I.A.3, Table I.B.1, and Table I.B.2.
A cogeneration facility is one which simultaneously produces electrical and thermal energy, with
the thermal energy (e.g., steam) being used for industrial, commercial, or cooling and heating
purposes. A small power production facility is one which does not exceed 80 MW (unless it is
exempted from this size limitation by the Solar, Wind, Waste, and Geothermal Power Production
Incentives Act of 1990) and uses as its primary energy source solar, wind, waste, geothermal, or
other renewable resources.
Firm Capacity Purchases from Utilities FPL has a Unit Power Sales (UPS) contract to purchase 928 MW from the Southern Company
(Southern) through the end of December 2015. This capacity is being supplied by Southern from a
mix of gas-fired and coal-fired units.
In addition, FPL has contracts with the Jacksonville Electric Authority (JEA) for the purchase of
375 MW (Summer) and 383 MW (Winter) of coal-fired generation from the St. John’s River Power
Park (SJRPP) Units No. 1 and No. 2. However, due to Internal Revenue Service (IRS) regulations,
the total amount of energy that FPL may receive from this purchase is limited. FPL currently
assumes, for planning purposes, that this limit will be reached in April 2019. Once this limit is
reached, FPL will be unable to receive firm capacity and energy from these purchases. (However,
FPL will continue to receive firm capacity and energy from its ownership portion of the SJRPP
units.)
As part of the agreement that FPL will begin serving Vero Beach’s electrical needs beginning in
January 2015, FPL has acquired two existing power purchase agreements totaling approximately
37 MW of coal-fired capacity. These agreements will run through the end of 2017.
Florida Power & Light Company 17

These purchases are shown in Table I.A.3, Table I.B.1, and Table I.B.2. FPL also has ownership
interest in the SJRPP units. The ownership amount is reflected in FPL’s installed capacity shown
on Figure I.A.1, in Table I.A.1, and on Schedule 1.
Firm Capacity Other Purchases FPL has two other firm capacity purchase contracts with non-QF, non-utility suppliers. These
contracts with the Palm Beach Solid Waste Authority were previously listed as QFs. However, the
addition of a second unit will cause both units to no longer meet the statutory definition of a QF.
These contracts are therefore listed as “Other Purchases” after the current estimated in-service
date of the new unit. Table I.B.1 and I.B.2 present the Summer and Winter MW, respectively,
resulting from these contracts under the category heading of Other Purchases.
Non-Firm (As Available) Energy Purchases FPL purchases non-firm (as-available) energy from several cogeneration and small power
production facilities. Table I.A.3 shows the amount of energy purchased in 2013 from these
facilities.
Florida Power & Light Company 18

Firm Capacity Purchases (MW) Location Summer(City or County) Fuel MW
I. Purchases from QF's: Cogeneration/Small Power Production FacilitiesCedar Bay Generating Co. Duval Coal (Cogen) 250Indiantown Cogen., LP Martin Coal (Cogen) 330Broward South Broward Solid Waste 4Broward North Broward Solid Waste 11Palm Beach SWA - extension 40
Total: 635
II. Purchases from Utilities:UPS from Southern Company Various in Georgia Coal 928SJRPP Jacksonville, FL Coal 381
Total: 1,309
Total Net Firm Generating Capability: 1,944
Non-Firm Energy Purchases (MWH)
Energy (MWH)In-Service Delivered to
Project County Fuel Date FPL in 2013Okeelanta (known as Florida Crystals and New Hope Power Partners) * Palm Beach Bagasse/Wood 11/95 87,723Broward South * Broward Solid Waste 9/09 90,116Broward North * Broward Solid Waste 1/12 81,316Waste Management - Renewable Energy * Broward Landfill Gas 1/10 47,249Waste Management - Collier County Landfill * Broward Landfill Gas 5/11 25,578Tropicana Manatee Natural Gas 2/90 8,900Georgia Pacific Putnam Paper by-product 2/94 5,294Rothenbach Park (known as MMA Bee Ridge) Sarasota PV 10/07 289First Solar Miami PV 4/11 210Customer - Owned PV & Wind Various PV/Wind 9/12 1,018INEOS Bio * Indian River Wood Various 922Miami Dade Resource Recovery* Dade Solid Waste 12/13 28,759* These Non-Firm Energy Purchases are Renewable and are reflected on Schedule 11.1 row 9 column 6.
Table 1.A.3: Purchase Power Resources by Contract (as of December 31, 2013)
Florida Power & Light Company 19

Table I.B.1: FPL's Firm Purchased Power Summer MW
Summary of FPL's Firm Capacity Purchases: Summer MW (for August of Year Shown)
I. Purchases from QF's:Cogeneration Small Power Contract Contract Production Facilities Start Date End Date 2014 2015 2016 2017 2018 2019 2020 2021 2022 2023Broward South 01/01/93 12/31/26 1.4 1.4 1.4 1.4 1.4 1.4 1.4 1.4 1.4 1.4Broward South 01/01/95 12/31/26 1.5 1.5 1.5 1.5 1.5 1.5 1.5 1.5 1.5 1.5Broward South 01/01/97 12/31/26 0.6 0.6 0.6 0.6 0.6 0.6 0.6 0.6 0.6 0.6Broward North 01/01/93 12/31/26 7 7 7 7 7 7 7 7 7 7Broward North 01/01/95 12/31/26 1.5 1.5 1.5 1.5 1.5 1.5 1.5 1.5 1.5 1.5Broward North 01/01/97 12/31/26 2.5 2.5 2.5 2.5 2.5 2.5 2.5 2.5 2.5 2.5Cedar Bay Generating Co. 01/25/94 12/31/24 250 250 250 250 250 250 250 250 250 250Indiantown Cogen., LP 12/22/95 12/01/25 330 330 330 330 330 330 330 330 330 330Palm Beach SWA -extension 1/ 01/01/12 04/01/32 40 0 0 0 0 0 0 0 0 0U.S. EcoGen - Clay 2/ 01/01/21 12/31/49 0 0 0 0 0 0 0 60 60 60U.S. EcoGen -Okeechobee 2/ 01/01/21 12/31/49 0 0 0 0 0 0 0 60 60 60U.S. EcoGen - Martin 2/ 01/01/21 12/31/49 0 0 0 0 0 0 0 60 60 60
QF Purchases Sub Total: 635 595 595 595 595 595 595 775 775 775
II. Purchases from Utilities: Contract Contract Start Date End Date 2014 2015 2016 2017 2018 2019 2020 2021 2022 2023
UPS Replacement 06/01/10 12/31/15 928 928 0 0 0 0 0 0 0 0SJRPP 3/ 04/02/82 04/01/19 375 375 375 375 375 0 0 0 0 0OUC - Stanton 1 4/ 01/01/15 12/31/17 0 21 21 21 0 0 0 0 0 0OUC - Stanton 2 4/ 01/01/15 12/31/17 0 16 16 16 0 0 0 0 0 0
Utility Purchases Sub Total: 1,303 1,340 412 412 375 0 0 0 0 0
Total of QF and Utility Purchases = 1,938 1,934 1,006 1,006 970 595 595 775 775 775
III. Other Purchases: Contract Contract Start Date End Date 2014 2015 2016 2017 2018 2019 2020 2021 2022 2023
Palm Beach SWA -extension 1/ 01/01/12 04/01/32 0 40 40 40 40 40 40 40 40 40Palm Beach SWA - additional 01/01/15 04/01/32 0 70 70 70 70 70 70 70 70 70Unspecified Purchases 5/ 01/01/20 12/31/20 0 0 0 0 0 0 129 0 0 0Unspecified Purchases 5/ 01/01/21 12/31/21 0 0 0 0 0 0 0 168 0 0
Other Purchases Sub Total: 0 110 110 110 110 110 239 278 110 110
Total "Non-QF" Purchase = 1,303 1,450 522 522 485 110 239 278 110 110
2014 2015 2016 2017 2018 2019 2020 2021 2022 2023Summer Firm Capacity Purchases Total MW: 1,938 2,044 1,116 1,116 1,080 705 834 1,053 885 885
1/ When the second unit comes into service at the Palm Beach SWA, neither unit will meet the standards to be a small power producers, and both units then will be accounted for under "Other Purchases".
2/ The EcoGen units will enter service in 2019, and initially provide non-firm energy. Firm capacity delivery will commence in 2021.3/ Contract End Date shown for the SJRPP purchase does not represent the actual contract end date. Instead, this date represents a projection of the
earliest date at which FPL's ability to receive further capacity and energy from this purchase could be suspended due to IRS regulations.4/ These units are part of the purchase of the Vero Beach Electric System.5/ These unspecified purchases are short-term purchases that are included for resource planning purposes. No decision regarding such purchases
is needed at this time.
Florida Power & Light Company 20

Table I.B.2: FPL's Firm Purchased Power Winter MW
Summary of FPL's Firm Capacity Purchases: Winter MW (for January of Year Shown)
I. Purchases from QF's:Cogeneration Small Contract Contract Power Production Facilities Start Date End Date 2014 2015 2016 2017 2018 2019 2020 2021 2022 2023Broward South 01/01/93 12/31/26 1.4 1.4 1.4 1.4 1.4 1.4 1.4 1.4 1.4 1.4Broward South 01/01/95 12/31/26 1.5 1.5 1.5 1.5 1.5 1.5 1.5 1.5 1.5 1.5Broward South 01/01/97 12/31/26 0.6 0.6 0.6 0.6 0.6 0.6 0.6 0.6 0.6 0.6Broward North 01/01/93 12/31/26 7 7 7 7 7 7 7 7 7 7Broward North 01/01/95 12/31/26 1.5 1.5 1.5 1.5 1.5 1.5 1.5 1.5 1.5 1.5Broward North 01/01/97 12/31/26 2.5 2.5 2.5 2.5 2.5 2.5 2.5 2.5 2.5 2.5Cedar Bay Generating Co. 01/25/94 12/31/24 250 250 250 250 250 250 250 250 250 250Indiantown Cogen., LP 12/22/95 12/01/25 330 330 330 330 330 330 330 330 330 330Palm Beach SWA -extension 1/ 01/01/12 04/01/32 40 0 0 0 0 0 0 0 0 0U.S. EcoGen - Clay 2/ 01/01/21 12/31/49 0 0 0 0 0 0 0 60 60 60U.S. EcoGen -Okeechobee 2/ 01/01/21 12/31/49 0 0 0 0 0 0 0 60 60 60U.S. EcoGen - Martin 2/ 01/01/21 12/31/49 0 0 0 0 0 0 0 60 60 60
QF Purchases Sub Total: 635 595 595 595 595 595 595 775 775 775
II. Purchases from Utilities: Contract Contract Start Date End Date 2014 2015 2016 2017 2018 2019 2020 2021 2022 2023
UPS Replacement 06/01/10 12/31/15 928 928 0 0 0 0 0 0 0 0SJRPP 3/ 04/02/82 04/01/19 383 383 383 383 383 383 0 0 0 0OUC - Stanton 1 4/ 01/01/15 12/31/17 0 21 21 21 0 0 0 0 0 0OUC - Stanton 2 4/ 01/01/15 12/31/17 0 16 16 16 0 0 0 0 0 0
Utility Purchases Sub Total: 1,311 1,348 420 420 383 383 0 0 0 0
Total of QF and Utility Purchases = 1,946 1,942 1,014 1,014 978 978 595 775 775 775
III. Other Purchases: Contract Contract Start Date End Date 2014 2015 2016 2017 2018 2019 2020 2021 2022 2023
Palm Beach SWA -extension 1/ 01/01/12 04/01/32 0 40 40 40 40 40 40 40 40 40Palm Beach SWA - additional 01/01/15 04/01/32 0 70 70 70 70 70 70 70 70 70Unspecified Purchases 5/ 01/01/20 12/31/20 0 0 0 0 0 0 129 0 0 0Unspecified Purchases 5/ 01/01/21 12/31/21 0 0 0 0 0 0 0 168 0 0
Other Purchases Sub Total: 0 110 110 110 110 110 239 278 110 110
"Non-QF" Purchase = 1,311 1,458 530 530 493 493 239 278 110 110
2014 2015 2016 2017 2018 2019 2020 2021 2022 2023Winter Firm Capacity Purchases Total MW: 1,946 2,052 1,124 1,124 1,088 1,088 834 1,053 885 885
1/ When the second unit comes into service at the Palm Beach SWA, neither unit will meet the standards to be a small power producers, and both units then will be accounted for under "Other Purchases".
2/ The EcoGen units will enter service in 2019, and initially provide non-firm energy. Firm capacity delivery will commence in 2021.3/ Contract End Date shown for the SJRPP purchase does not represent the actual contract end date. Instead, this date represents a projection of the
earliest date at which FPL's ability to receive further capacity and energy from this purchase could be suspended due to IRS regulations.4/ These units are part of the purchase of the Vero Beach Electric System.5/ These unspecified purchases are short-term purchases that are included for resource planning purposes. No decision regarding such purchases
is needed at this time.
Florida Power & Light Company 21

I.C Demand Side Management (DSM) FPL has sought out and implemented cost-effective DSM programs since 1978. These programs
include a number of conservation/energy efficiency and load management initiatives. FPL’s DSM
efforts through 2013 have resulted in a cumulative Summer peak reduction of approximately 4,753
MW at the generator and an estimated cumulative energy saving of approximately 66,782
Gigawatt-hour (GWh) at the generator. After accounting for reserve margin requirements, FPL’s
DSM efforts through 2013 have eliminated the need to construct the equivalent of approximately
14 new 400 MW generating units. New DSM Goals for FPL for the 2015 through 2024 time period
will be set by the FPSC in the second half of 2014. DSM is discussed further in Chapter III.
Florida Power & Light Company 22

Page 1 of 2
(1) (2) (3) (4) (5) (6) (7) (8) (9) (10) (11) (12) (13) (14)Alt. Actual/
Fuel Fuel Commercial Expected Gen.Max.Unit Unit Fuel Transport. Days In-Service Retirement Nameplate Winter Summer
Plant Name No. Location Type Pri. Alt. Pri. Alt. Use Month/Year Month/Year KW MW MW
Cape Modernization Brevard County19/24S/36F 1,295,400 1,355 1,210
1 CC NG FO2 PL TK Unknown Apr-13 Unknown 1,295,400 1,355 1,210
DeSoto 2/ DeSoto County27/36S/25E 27,000 25 25
1 PV Solar Solar N/A N/A Unknown Oct-09 Unknown 27,000 25 25
Fort Myers Lee County35/43S/25E 2,841,990 2,552 2,396
2 CC NG No PL No Unknown Jun-02 Unknown 1,721,490 1,490 1,4323A CT NG FO2 PL TK Unknown Jun-03 Unknown 188,190 176 1583B CT NG FO2 PL TK Unknown Jun-03 Unknown 188,190 176 158
1-12 GT FO2 No TK No Unknown May-74 Unknown 744,120 710 648
Lauderdale Broward County30/50S/42E 1,873,968 1,884 1,724
4 CC NG FO2 PL PL Unknown May-93 Unknown 526,250 483 4425 CC NG FO2 PL PL Unknown Jun-93 Unknown 526,250 483 442
1-12 GT NG FO2 PL PL Unknown Aug-70 Unknown 410,734 459 42013-24 GT NG FO2 PL PL Unknown Aug-70 Unknown 410,734 459 420
Manatee Manatee County18/33S/20E 2,951,110 2,806 2,729
1 ST FO6 NG WA PL Unknown Oct-76 Unknown 863,300 819 8092 ST FO6 NG WA PL Unknown Dec-77 Unknown 863,300 819 8093 CC NG No PL No Unknown Jun-05 Unknown 1,224,510 1,168 1,111
Martin Martin County29/29S/38E 4,317,510 3,870 3,731
1 ST FO6 NG PL PL Unknown Dec-80 Unknown 934,500 832 8262 ST FO6 NG PL PL Unknown Jun-81 Unknown 934,500 832 8263 CC NG No PL No Unknown Feb-94 Unknown 612,000 489 4694 CC NG No PL No Unknown Apr-94 Unknown 612,000 489 469
8 3/ CC NG FO2 PL TK Unknown Jun-05 Unknown 1,224,510 1,228 1,141
Port Everglades City of Hollywood23/50S/42E 410,734 459 420
1-12 GT NG FO2 PL PL Unknown Aug-71 Unknown 410,734 459 420
Putnam Putnam County16/10S/27E 580,008 530 498
1 CC NG FO2 PL TK Unknown Apr-78 Unknown 290,004 265 2492 CC NG FO2 PL TK Unknown Aug-77 Unknown 290,004 265 249
1/ These ratings are peak capability.2/ The capacity shown for the PV facility at DeSoto is considered as non-firm generating capacity and the capacity from these units has been removed from the "System Firm Generating Capacity as of December 31, 2013" row at the end of the table.3/ Martin Unit 8 is also partially fueled by a 75 MW solar thermal facility that supplies steam when adequate sunlight is available, thus reducing fossil fuel use.
Schedule 1
Existing Generating FacilitiesAs of December 31, 2013
Net Capability 1/
Florida Power & Light Company 23

Page 2 of 2
(1) (2) (3) (4) (5) (6) (7) (8) (9) (10) (11) (12) (13) (14)Alt. Actual/Fuel Commercial Expected Gen.Max.
Unit Unit Fuel Transport Days In-Service Retirement Nameplate Winter SummerPlant Name No. Location Type Pri. Alt. Pri. Alt. Use Month/Year Month/Year KW MW MW
Sanford Volusia County16/19S/30E 2,377,720 2,158 1,980
4 CC NG No PL No Unknown Oct-03 Unknown 1,188,860 1,078 9895 CC NG No PL No Unknown Jun-02 Unknown 1,188,860 1,080 991
Scherer 2/ Monroe, GA 680,368 651 6434 ST SUB No RR No Unknown Jul-89 Unknown 680,368 651 643
Space Coast 3/ Brevard County
13/23S/36E 10,000 10 101 PV Solar Solar N/A N/A Unknown Apr-10 Unknown 10,000 10 10
St. Johns River Duval CountyPower Park 4/ 12/15/28E
(RPC4) 271,836 260 2541 ST BIT Pet RR WA Unknown Mar-87 Unknown 135,918 130 1272 ST BIT Pet RR WA Unknown May-88 Unknown 135,918 130 127
St. Lucie 5/ St. Lucie County16/36S/41E 1,743,775 1,863 1,821
1 ST Nuc No TK No Unknown May-76 Unknown 1,020,000 1,003 9812 ST Nuc No TK No Unknown Jun-83 Unknown 723,775 860 840
Turkey Point Miami Dade County27/57S/40E 3,380,960 3,263 3,176
1 ST FO6 NG WA PL Unknown Apr-67 Unknown 402,050 398 3963 ST Nuc No TK No Unknown Nov-72 Unknown 877,200 839 8114 ST Nuc No TK No Unknown Jun-73 Unknown 877,200 848 8215 CC NG FO2 PL TK Unknown May-07 Unknown 1,224,510 1,178 1,148
West County Palm Beach County 29&32/43S/40E 2,733,600 4,005 3,657
1 CC NG FO2 PL TK Unknown Aug-09 Unknown 1,366,800 1,335 1,2192 CC NG FO2 PL TK Unknown Nov-09 Unknown 1,366,800 1,335 1,2193 CC NG FO2 PL TK Unknown May-11 Unknown 1,366,800 1,335 1,219
Total System Generating Capacity as of December 31, 2013 6/ = 25,691 24,274 System Firm Generating Capacity as of December 31, 2013 7/ = 25,656 24,239
1/ These ratings are peak capability.2/ These ratings represent Florida Power & Light Company's share of Scherer Unit 4, adjusted for transmission losses.3/ The capacity shown for the PV facility at Space Coast is considered as non-firm generating capacity due to the intermittent nature of the solar resource.4/ The net capability ratings represent Florida Power & Light Company's share of St. Johns River Park Units 1 and 2, excluding the Jacksonville Electric Authority (JEA) share of 80%.5/ Total capability of St. Lucie 1 is 981/1,003 MW. FPL's share of St. Lucie 2 is 840/860.FPL's ownership share of St. Lucie Units 1 and 2 is 100% and 85%, respectively, as shown above. FPL's share of the deliverable capacity from each unit is approx. 92.5% and exclude the Orlando Utilities Commission (OUC) and Florida Municipal Power Agency (FMPA) combined portion of approximately 7.44776% per unit.6/ The Total System Generating Capacity value shown includes FPL-owned firm and non-firm generating capacity.7/ The System Firm Generating Capacity value shown includes only firm generating capacity.
Fuel
Existing Generating FacilitiesAs of December 31, 2013
Net Capability 1/
Schedule 1
Florida Power & Light Company 24

CHAPTER II Forecast of Electric Power Demand
Florida Power & Light Company 25

(This page is left intentionally blank.)
Florida Power & Light Company 26

II. Forecast of Electric Power Demand
II. A. Overview of the Load Forecasting Process
Long-term forecasts of sales, net energy for load (NEL), and peak loads are typically developed
on an annual basis for resource planning work at FPL. New long-term forecasts were developed
by FPL in late 2013 that replaced the previous long-term load forecasts that were used by FPL
during 2013 in much of its resource planning work and which were presented in FPL’s 2013 Site
Plan. These new load forecasts are utilized throughout FPL’s 2014 Site Plan. These forecasts are
a key input to the models used to develop FPL’s integrated resource plan.
The following pages describe how forecasts are developed for each component of the long-term
forecast: sales, NEL, and peak loads. Consistent with past forecasts, the primary drivers to
develop these forecasts include economic conditions and weather.
The projections for the national and Florida economies are obtained from the consulting firm IHS
Global Insight. Population projections are obtained from the Florida Legislature’s Office of
Economic and Demographic Research (EDR). These projections are developed in conjunction
with the Bureau of Economic and Business Research (BEBR) of the University of Florida. These
inputs are quantified and qualified using statistical models in terms of their impact on the future
demand for electricity.
Weather is always a key factor that affects FPL’s energy sales and peak demand. Three sets of
weather variables are developed and used in FPL’s forecasting models:
1. Cooling degree-hours based on 72o F, winter heating degree-days based on 66o F, and
heating degree-days based on 45o F are used to forecast energy sales.
2. The maximum temperature on the peak day, along with the build-up of cooling degree-
hours prior to the peak, is used to forecast Summer peaks.
3. The minimum and average temperatures on the peak day, along with the build-up of
heating degree-hours based on 66o F, one and two days prior to the peak, are used to
forecast Winter peaks.
The cooling degree-hours and winter heating degree-days are used to capture the changes in the
electric usage of weather-sensitive appliances such as air conditioners and electric space heaters.
Heating degree-days based on 45o F are used to capture heating load resulting from sustained
periods of unusually cold weather not fully captured by heating degree-days based on 66o F. A
composite hourly temperature profile is derived using hourly temperatures across FPL’s service
territory. Miami, Ft. Myers, Daytona Beach, and West Palm Beach are the locations from which
Florida Power & Light Company 27
temperatures are obtained. In developing the composite hourly profile, these regional
temperatures are weighted by regional energy sales. The resulting composite temperature is used
to derive projected cooling and heating degree-hours and heating degree-days. Similarly,
composite temperature and hourly profiles of temperatures are used to calculate the weather
variables used in the Summer and Winter peak models.
II. B. Comparison of FPL’s Current and Previous Load Forecasts While reflecting some fluctuations by year, FPL’s current load forecast is generally in line with the
load forecast presented in its 2013 Site Plan. There are four primary factors that are driving the
current load forecast: projected population growth, the continued recovery of the Florida economy,
energy efficiency codes and standards, and the additional load expected as a result of the
acquisition of the City of Vero Beach electric utility.
In early 2013, FPL came to an agreement with the City of Vero Beach to purchase the City’s
electric system. This agreement was approved by the City voters on March 12, 2013. Beginning
in January 2015, NEL, customers, and peaks for Vero Beach are included in FPL’s forecasts and
are reflected in FPL’s 2014 Site Plan.
The customer forecast is based on recent population projections as well as the actual levels of
customer growth experienced historically and the additional customers expected as a result of the
acquisition of Vero Beach. Population projections are derived from the EDR’s July 2013
Demographic Estimating Conference. This forecast is generally consistent with previous forecasts
indicating a gradual rebound in Florida’s population growth. Net migration into Florida fell to a
record low in 2009 during the height of the recession. Florida has since experienced an
improvement in net migration which now accounts for a majority of the population growth.
However, population growth rates have remained modest by historical standards. Moderately
higher rates of population growth are projected from 2014 until 2018 when the projected rate of
population growth gradually begins to decelerate. Consistent with past population projections, the
rates of population growth in the later years of the forecast are below the rates historically
experienced in Florida.
Effective January 2015, FPL is expected to begin providing electric service to more than 34,000
customers formerly served by the City of Vero Beach. Reflecting this increase, the current
forecast shows an increase in customer growth in 2015. Thereafter, customer growth is expected
to mirror the overall level of population growth in the state. By 2019, the total number of
customers served by FPL is expected to exceed five million. Between 2013 and 2023 the total
Florida Power & Light Company 28
number of customers is projected to increase at an annual rate of 1.4%, the same increase
projected in the 2013 Site Plan.
The economic projections incorporated into FPL’s load forecast are provided by IHS Global
Insight, a leading economic forecasting firm. IHS Global Insight projects a continued recovery in
the Florida economy with relatively healthy increases in employment and income levels between
2014 and 2020. Particularly robust growth is projected for the tourism and healthcare industries.
Consistent with past projections, economic growth in the later years of the forecast is expected to
moderate slightly.
Estimates of savings from energy efficiency codes and standards are developed by ITRON, a
leading expert in this area. Included in these estimates are savings from federal and state energy
efficiency codes and standards, including the 2005 National Energy Policy Act, the 2007 Energy
Independence and Security Act, and the savings occurring from the use of compact fluorescent
bulbs2. The impact of these savings began in 2005 and their cumulative impact on the Summer
peak is expected to reach 3,477 MW by 2023, the equivalent of approximately a 12% reduction in
what the forecasted Summer peak load for 2023 would have been without these codes and
standards. The cumulative impact from these savings on NEL is expected to reach 9,991 GWH
over the same period while the cumulative impact on the Winter peak is expected to be 1,689 MW
by 2023. This represents a decrease of approximately 7% in the forecasted NEL for 2023 and a
4% reduction in forecasted Winter peak load for 2023.
Consistent with the forecast presented in FPL’s 2013 Site Plan, the total growth projected for the
ten-year reporting period of this document is significant. The Summer peak is projected to
increase to 26,528 MW by 2023, an increase of 4,952 MW over the 2013 actual Summer peak.
Likewise, NEL is projected to reach 132,357 GWH in 2023, an increase of 20,702 GWH from the
actual 2013 value.
II.C. Long-Term Sales Forecasts Long-term forecasts of electricity sales were developed for the major revenue classes and are
adjusted to match the NEL forecast. The results of these sales forecasts for the years 2014 - 2023
are presented in Schedules 2.1 - 2.3 which appear at the end of this chapter. Econometric models
are developed for each revenue class using the statistical software package MetrixND. The
methodologies used to develop energy sales forecasts for each jurisdictional revenue class and
NEL forecast are outlined below.
2 Note that in addition to the fact that these energy efficiency codes and standards lower the forecasted load (as described later in this chapter), these standards also lower the potential for efficiency gains that would otherwise be available through utility DSM programs.
Florida Power & Light Company 29

1. Residential Sales
Residential electric usage per customer is estimated by using an econometric model.
Residential sales are a function of the following variables: cooling degree-hours, winter
heating degree-days, lagged cooling degree-hours, lagged winter heating degree-days, retail
gasoline prices, and Florida real per capita income weighted by the percent of the population
employed. The impact of weather is captured by the cooling degree-hours, heating degree-
days, and the one month lag of these variables. The impact energy prices have on electricity
consumption is captured through retail gasoline prices. As energy prices rise, less disposable
income is available for all goods and services, electricity included. To capture economic
conditions, the model includes a composite variable based on Florida real per capita income
and the percent of the state’s population that is employed. Residential energy sales are
forecasted by multiplying the forecasted residential use per customer by the number of
residential customers forecasted.
2. Commercial Sales
The commercial sales forecast is also developed using an econometric model. Commercial
sales are a function of the following variables: Florida real per capita income weighted by the
percent of the population employed, cooling degree-hours, heating degree-hours, lagged
cooling degree-hours, a variable designed to reflect the impact of empty homes, dummy
variables for the month of December and for the specific months of January 2007, November
2005, and March 2013, and an autoregressive term. Cooling degree-hours, heating degree-
hours, and the one month lag of cooling degree-hours are used to capture weather-sensitive
load in the commercial sector.
3. Industrial Sales The industrial class is comprised of three distinct groups: very small accounts (those with less
than 20 kW of demand), medium accounts (those with 21 kW to 499 kW of demand), and
large accounts (those with demands of 500 kW or higher). As such, the forecast is developed
using a separate econometric model for each group of industrial customers. The small
industrial sales model utilizes the following variables: cooling degree-hours, heating degree-
hours, dummy variables for the specific months of November 2005 and August 2004, and two
autoregressive terms. The medium industrial sales model utilizes the following variables:
cooling degree-hours, Florida real per capita income weighted by the percent of the population
employed, dummy variables for the specific months of February 2005 and 2006 and
November 2005, and three autoregressive terms,. The large industrial sales model utilizes the
following variables: cooling degree-hours, Florida real per capita income weighted by the
percent of the population employed, the Consumer Price Index, and dummy variables for the
specific months of October 2004 and 2005, November 2004, and September 2005.
Florida Power & Light Company 30

4. Railroad and Railways Sales and Street and Highway Sales
This class consists solely of Miami-Dade County’s Metrorail system. The projections for
railroad and railways sales are based on a historical moving average.
The forecast for street and highway sales is developed by first developing a trended use per
customer value, then multiplying this value by the number of forecasted customers.
5. Other Public Authority Sales This class consists of a sports field rate schedule, which is closed to new customers, and one
government account. The forecast for this class is based on its historical usage
characteristics.
6. Total Sales to Ultimate Customer
Sales forecasts by revenue class are summed to produce a total sales forecast.
7. Sales for Resale
Sales for resale (wholesale) customers are composed of municipalities and/or electric co-
operatives. These customers differ from jurisdictional customers in that they are not the
ultimate users of the electricity they buy. Instead, they resell this electricity to their own
customers. Currently there are five customers in this class: the Florida Keys Electric
Cooperative; Lee County Electric Cooperative; Wauchula; Winter Park; and Blountstown. In
addition, FPL will begin making sales to Seminole Electric Cooperative in June 2014 under a
long term agreement3.
Beginning in May 2011, FPL began providing service to the Florida Keys Electric Cooperative
under a long-term full requirements contract. Previously FPL was serving the Florida Keys
under a partial requirements contract. The sales to Florida Keys Electric Cooperative are
based on customer-supplied information and historical coincidence factors.
Lee County has contracted with FPL for FPL to supply a portion of their load through 2013,
then to begin serving their entire load beginning in 2014. This contract began in January 2010.
Lee County provides a forecast of their sales by delivery point which is used to derive their
sales forecast.
FPL’s sales to Wauchula began in October 2011 and will continue through December 2016.
3 FPL continues to evaluate the possibility of serving the electrical loads of other entities at the time the 2014 Site Plan is being prepared. Because these possibilities are still being evaluated, the load forecast presented in this Site Plan does not include these potential loads.
Florida Power & Light Company 31

Sales to Winter Park began in January 2014 and will continue through December 2016.
Blountstown became an FPL wholesale customer in May 2012. FPL’s contract with
Blountstown expires in April 2017.
A new contract with Seminole Electric Cooperative is included in the forecast which includes
delivery of 200 MW beginning in June 2014 and continuing through May 2021.
II.D. Net Energy for Load (NEL) An econometric model is developed to produce a NEL per customer forecast. The inputs to the
model include Florida real per capita income weighted by the percent of the population employed,
and a proxy for energy prices. The model also includes several weather variables including
cooling degree-hours and heating degree-days by calendar month, and heating degree-days
based on 45o F. In addition, the model also includes variables for energy efficiency codes and
standards and a variable designed to capture the impact of empty homes. Dummy variables are
included for the specific months of May 2004, and November 2005. There is also an
autoregressive term in the model.
The energy efficiency variable is included to capture the impacts from major codes and standards,
including those associated with the 2005 National Energy Policy Act, the 2007 Energy
Independence and Security Act, and the savings occurring from the use of compact fluorescent
bulbs. The estimated impact from these codes and standards is inclusive of engineering
estimates and any resulting behavioral changes. The impact of these savings began in 2005 and
their cumulative impact on NEL is expected to reach 9,991 GWH by 2023. This represents a 7.0%
reduction in what the forecasted NEL for 2023 would have been absence these codes and
standards. On an incremental basis, net of the reduction already experienced through 2013, the
reduction in 2023 is expected to reach 6,075 GWH.
The decline in the number of empty homes resulting from the current housing recovery has
affected use per customer and is captured in a separate variable. The forecast was also adjusted
for additional load estimated from hybrid vehicles, beginning in 2013, which resulted in an
increase of approximately 1,587 GWH by the end of the ten-year reporting period. The forecast
was also adjusted for the incremental load resulting from FPL’s economic development riders
which began in 2013, and this incremental load is projected to grow to 537 GWH before leveling
off in 2018. An additional adjustment to the NEL forecast was made to reflect the acquisition of
the Vero Beach electric system. The Vero Beach acquisition is projected to add 793 GWH by
2023.
Florida Power & Light Company 32

The NEL forecast is developed by first multiplying the NEL per customer forecast by the total
number of customers forecasted (excluding the customers formerly served by Vero Beach) and
then adjusting the forecasted results for the expected incremental load resulting from hybrid
vehicles, new wholesale contracts, the Vero Beach acquisition, and FPL’s economic development
riders. Once the NEL forecast is obtained, total billed sales are computed using a historical ratio of
sales to NEL. The sales by class forecasts previously discussed are then adjusted to match the
total billed sales. The forecasted NEL values for 2014 - 2023 are presented in Schedule 3.3 that
appears at the end of this chapter.
II.E. System Peak Forecasts The rate of absolute growth in FPL system peak load has been a function of the size of the
customer base, varying weather conditions, projected economic conditions, changing patterns of
customer behavior, and more efficient appliances and lighting. FPL developed the peak forecast
models to capture these behavioral relationships. In addition, FPL’s peak forecast also reflects
changes in load expected as a result of the acquisition of Vero Beach, changes in wholesale
contracts, and the expected number of hybrid vehicles.
The savings from energy efficiency codes and standards incorporated into the peak forecast
include the impacts from the 2005 National Energy Policy Act, the 2007 Energy Independence and
Security Act, and the use of compact fluorescent light bulbs. The impact from these energy
efficiency standards began in 2005 and their cumulative impact on the Summer peak is expected
to reach 3,477 MW by 2023. This reduction is inclusive of engineering estimates and any resulting
behavioral changes. The cumulative 2023 impact from these energy efficiency codes and
standards effectively reduces FPL’s Summer peak for that year by 11.6%. On an incremental
basis, net of the reduction already experienced through 2013, the impact on the Summer peak
from these energy efficiency codes and standards is expected to reach 1,997 MW in 2023. By
2023, the Winter peak is expected to be reduced by 1,689 MW as result of the cumulative impact
from these energy efficiency standards since 2005. On an incremental basis, net of the reduction
already experienced through 2013, the impact on the Winter peak from these energy efficiency
standards is expected to reach 1,065 MW in 2023.
The forecast was also adjusted for additional load estimated from hybrid vehicles which results in
an expected increase of approximately 443 MW in the Summer and 221 MW in the Winter by the
end of the ten-year reporting period and for the acquisition of the Vero Beach electric system. The
Vero Beach acquisition will add 169 MW to the Summer peak, and 179 MW to the Winter peak,
forecast by the end of the ten-year reporting period.
Florida Power & Light Company 33

The forecasting methodology of Summer, Winter, and monthly system peaks is discussed below.
The forecasted values for Summer and Winter peak loads for the years 2014 – 2023 are
presented at the end of this chapter in Schedules 3.1 and 3.2, and in Chapter III in Schedules 7.1
and 7.2.
1. System Summer Peak The Summer peak forecast is developed using an econometric model. The variables included
in the model are the price of gasoline, lagged one month, Florida real household disposable
income, cooling degree-hours two days prior to the peak day, the maximum temperature on
the day of the peak, a variable for energy efficiency standards, and a moving average term.
The model is based on the Summer peak contribution per customer which is multiplied by total
customers (excluding the customers that have been served by Vero Beach), and adjusted to
account for incremental loads resulting from hybrid vehicles, new wholesale contracts, the
Vero Beach acquisition, and FPL’s economic development riders to derive FPL’s system
Summer peak.
2. System Winter Peak
Like the system Summer peak model, this model is also an econometric model. The model
consists of three weather-related variables: the average temperature on the peak day, heating
degree-hours for the prior day squared, and heating degree-hours two days prior to the peak
day. The model also includes two dummy variables; one for Winter peaks occurring on
weekends and one for winter peaks with minimum temperature below 40.5 degrees. Also
included in the model are a variable for housing starts per capita, and an autoregressive term.
The forecasted results are adjusted for the impact of energy efficiency standards. The model
is based on the Winter peak contribution per customer which is multiplied by total customers
(excluding the customers that have been served by Vero Beach), and then adjusted for the
expected incremental loads resulting from hybrid vehicles, new wholesale contracts, the Vero
Beach acquisition, and FPL’s economic development riders.
3. Monthly Peak Forecasts
The forecasting process for monthly peaks consists of the following steps:
a. The forecasted annual summer peak is assumed to occur in the month of August. The
month of August has historically accounted for more annual summer peaks than any other
month.
Florida Power & Light Company 34

b. The forecasted annual winter peak is assumed to occur in the month of January. The
month of January has historically accounted for more annual winter peaks than any other
month.
c. The remaining monthly peaks are forecasted based on the historical relationship between
the monthly peaks and the annual summer peak.
II.F. The Hourly Load Forecast Forecasted values for system hourly load for the period 2014 - 2023 are produced using a System
Load Forecasting “shaper” program. This model uses years of historical FPL hourly system load
data to develop load shapes for weekdays, weekend days, and holidays. The model generates a
projection of hourly load values based on these load shapes and the forecast of monthly peaks
and energy.
II.G. Uncertainty In order to address uncertainty in the forecasts of aggregate peak demand and NEL, FPL first
evaluates the assumptions underlying the forecasts. FPL takes a series of steps in evaluating the
input variables, including comparing projections from different sources, identifying outliers in the
series, and assessing the series’ consistency with past forecasts. As needed, FPL reviews
additional factors which may affect the input variables.
Uncertainty is also addressed in the modeling process. Generally, econometric models are used
to forecast the aggregate peak demand and NEL. During the modeling process, the relevant
statistics (goodness of fit, F-statistic, P-values, mean absolute deviation (MAD), mean absolute
percentage error (MAPE), etc.) are scrutinized to ensure that the models adequately explain
historical variation. Once a forecast is developed, it is compared with past forecasts. Deviations
from past forecasts are examined in light of changes in input assumptions to ensure that the
drivers underlying the forecast are well understood. Finally, forecasts of aggregate peak demand
and NEL are compared with the actual values as these become available. An ongoing process of
variance analyses is performed. To the extent that the variance analysis identifies large
unexplained deviations between the forecast and actual values, revisions to the econometric
model may be considered.
The inherent uncertainty in load forecasting is addressed in different ways in regard to FPL’s
overall resource planning and operational planning work. In regard to FPL’s resource planning
work, FPL’s utilization of a 20% total reserve margin criterion, and a 10% generation-only reserve
Florida Power & Light Company 35

margin criterion, are designed to maintain reliable electric service to FPL’s customers in light of
forecasting (and other) uncertainty. In addition, banded forecasts of the projected Summer peak
and net energy for load are produced based on an analysis of past forecasting variances. In
regard to operational planning, a banded forecast for the projected Summer and Winter peak days
is developed based on the historical weather variations. These bands are then used to develop
similar bands for the monthly peaks.
II.H. DSM The effects of FPL’s DSM energy efficiency programs implementation through August 2013 are
assumed to be imbedded in the actual usage data for forecasting purposes. The impacts of
incremental energy efficiency that FPL plans to implement in the future, plus the cumulative and
projected incremental impacts of FPL’s load management programs, are accounted for as “line
item reductions” to the forecasts as part of the IRP process as shown in Chapter III in Schedules
7.1 and 7.2. After making these adjustments to the load forecasts, the resulting “firm” load
forecast is then used in FPL’s IRP work.
Florida Power & Light Company 36

(1) (2) (3) (4) (5) (6) (7) (8) (9)
Members Average Average kWh Average Average kWhper No. of Consumption No. of Consumption
Year Population Household GWh Customers Per Customer GWh Customers Per Customer
2004 8,247,442 2.20 52,502 3,744,915 14,020 42,064 458,053 91,8322005 8,469,602 2.21 54,348 3,828,374 14,196 43,468 469,973 92,4902006 8,620,855 2.21 54,570 3,906,267 13,970 44,487 478,867 92,9012007 8,729,806 2.19 55,138 3,981,451 13,849 45,921 493,130 93,1212008 8,771,694 2.20 53,229 3,992,257 13,333 45,561 500,748 90,9872009 8,732,591 2.19 53,950 3,984,490 13,540 45,025 501,055 89,8602010 8,762,399 2.19 56,343 4,004,366 14,070 44,544 503,529 88,4642011 8,860,158 2.20 54,642 4,026,760 13,570 45,052 508,005 88,6852012 8,948,850 2.21 53,434 4,052,174 13,187 45,220 511,887 88,3402013 9,025,275 2.20 53,930 4,097,172 13,163 45,341 516,500 87,786
Historical Values (2004 - 2013):
Col. (2) represents population only in the area served by FPL.
Col. (4) and Col. (7) represent actual energy sales including the impacts of existing conservation. These values are at the meter.
Col. (5) and Col. (8) represent the annual average of the twelve monthly values.
(1) (2) (3) (4) (5) (6) (7) (8) (9)
Members Average Average kWh Average Average kWhper No. of Consumption No. of Consumption
Year Population Household GWh Customers Per Customer GWh Customers Per Customer2014 9,111,384 2.20 55,739 4,141,538 13,458 47,155 524,494 89,9052015 9,302,665 2.20 57,047 4,228,484 13,491 48,634 538,771 90,2672016 9,437,042 2.20 58,097 4,289,564 13,544 49,793 547,360 90,9692017 9,571,922 2.20 58,693 4,350,874 13,490 50,418 555,714 90,7262018 9,705,104 2.20 59,404 4,411,411 13,466 51,110 563,753 90,6612019 9,835,541 2.20 60,036 4,470,700 13,429 51,667 571,672 90,3792020 9,961,263 2.20 60,791 4,527,847 13,426 52,337 579,453 90,3222021 10,079,425 2.20 61,219 4,581,557 13,362 52,675 587,147 89,7132022 10,198,087 2.20 61,929 4,635,494 13,360 53,264 594,908 89,5342023 10,318,293 2.20 62,870 4,690,133 13,405 54,043 602,612 89,681
Projected Values (2014 - 2023):
Col. (2) represents population only in the area served by FPL.
Col. (4) and Col. (7) represent forecasted energy sales that do not include the impact of incremental conservation. These values are at the meter.
Col. (5) and Col. (8) represent the annual average of the twelve monthly values.
Forecast of Energy ConsumptionSchedule 2.1
Rural & Residential Commercial
And Number of Customers by Customer Class
CommercialRural & Residential
Schedule 2.1History of Energy Consumption
And Number of Customers by Customer Class
Florida Power & Light Company 37

(1) (10) (11) (12) (13) (14) (15) (16)Railroads Street & Sales to Sales to
Average Average kWh & Highway Public UltimateNo. of Consumption Railways Lighting Authorities Consumers
Year GWh Customers Per Customer GWh GWh GWh GWh
2004 3,964 18,512 214,139 93 413 58 99,0952005 3,913 20,392 191,873 95 424 49 102,2962006 4,036 21,211 190,277 94 422 49 103,6592007 3,774 18,732 201,499 91 437 53 105,4152008 3,587 13,377 268,168 81 423 37 102,9192009 3,245 10,084 321,796 80 422 34 102,7552010 3,130 8,910 351,318 81 431 28 104,5572011 3,086 8,691 355,104 82 437 27 103,3272012 3,024 8,743 345,871 81 441 25 102,2262013 2,956 9,541 309,772 88 442 28 102,784
Historical Values (2004 - 2013):
Col. (10) and Col.(15) represent actual energy sales including the impacts of existing conservation. These values are at the meter.
Col. (11) represents the annual average of the twelve monthly values.
Col. (16) = Col. (4) + Col. (7) + Col. (10) + Col. (13) + Col. (14) + Col. (15).
(1) (10) (11) (12) (13) (14) (15) (16)Industrial Railroads Street & Sales to Sales toAverage Average kWh & Highway Public UltimateNo. of Consumption Railways Lighting Authorities Consumers
Year GWh Customers Per Customer GWh GWh GWh GWh 2014 2,990 10,242 291,973 82 442 24 106,4322015 3,009 10,890 276,263 83 453 23 109,2482016 3,008 11,520 261,101 82 460 23 111,4632017 3,001 11,893 252,369 83 466 23 112,6842018 2,970 12,003 247,426 83 473 23 114,0632019 2,931 12,030 243,618 83 478 23 115,2182020 2,875 12,017 239,256 83 484 23 116,5932021 2,814 11,991 234,676 83 489 23 117,3032022 2,754 11,971 230,057 83 494 23 118,5482023 2,692 11,907 226,087 83 499 23 120,210
Projected Values (2014 - 2023):
Col. (10) and Col.(15) represent forecasted energy sales that do not include the impact of incremental conservation. These values are at the meter.
Col. (11) represents the annual average of the twelve monthly values.
Col. (16) = Col. (4) + Col. (7) + Col. (10) + Col. (13) + Col. (14) + Col. (15).
And Number of Customers by Customer ClassForecast of Energy Consumption
Schedule 2.2
Industrial
Schedule 2.2History of Energy Consumption
And Number of Customers by Customer Class
Florida Power & Light Company 38

(1) (17) (18) (19) (20) (21)Utility Net Average
Sales for Use & Energy No. of Total Average Resale Losses For Load Other Number of
Year GWh GWh GWh Customers Customers
2004 1,531 7,467 108,093 3,029 4,224,5092005 1,506 7,498 111,301 3,156 4,321,8952006 1,569 7,909 113,137 3,218 4,409,5632007 1,499 7,401 114,315 3,276 4,496,5892008 993 7,092 111,004 3,348 4,509,7302009 1,155 7,394 111,303 3,439 4,499,0672010 2,049 7,870 114,475 3,523 4,520,3282011 2,176 6,950 112,454 3,596 4,547,0512012 2,237 6,403 110,866 3,645 4,576,4492013 2,158 6,713 111,655 3,722 4,626,934
Historical Values (2004 - 2013):
Col. (19) represents actual energy sales including the impacts of existing conservation.
Col. (19) = Col. (16) + Col. (17) + Col. (18). Historical NEL includes the impacts of existing conservation and agrees to Col. (5) on schedule 3.3. Historical GWH, prior to 2011, are based on a fiscal year beginning 12/29 and ending 12/28. The 2011 value is based on12/29/10 to 12/31/11. The 2012-2013 values are based on calendar year.
Col. (20) represents the annual average of the twelve monthly values.
Col. (21) = Col. (5) + Col. (8) + Col. (11) + Col. (20).
(1) (17) (18) (19) (20) (21)Utility Net Average
Sales for Use & Energy No. of Total AverageResale Losses For Load Other Number of
Year GWh GWh GWh Customers Customers2014 4,907 6,662 118,001 3,780 4,680,0542015 5,654 6,703 121,606 4,323 4,782,4692016 5,706 6,775 123,943 4,383 4,852,8272017 5,419 6,811 124,914 4,437 4,922,9182018 5,440 6,896 126,399 4,491 4,991,6592019 5,496 6,959 127,673 4,543 5,058,9452020 5,559 7,035 129,187 4,592 5,123,9092021 5,133 7,018 129,454 4,638 5,185,3332022 4,846 7,124 130,517 4,681 5,247,0542023 4,908 7,239 132,357 4,724 5,309,376
Projected Values (2014 - 2023):
Col. (19) represents forecasted energy sales that do not include the impact of incremental conservation and agrees to Col. (2) on Schedule 3.3.
Col. (19) = Col. (16) + Col. (17) + Col. (18). These values are based on calendar year.
Col. (20) represents the annual average of the twelve monthly values.
Col. (21) = Col. (5) + Col. (8) + Col. (11) + Col. (20).
Schedule 2.3Forecast of Energy Consumption
And Number of Customers by Customer Class
Schedule 2.3History of Energy Consumption
And Number of Customers by Customer Class
Florida Power & Light Company 39

(1) (2) (3) (4) (5) (6) (7) (8) (9) (10)
Res. Load Residential C/I Load C/I Net FirmYear Total Wholesale Retail Interruptible Management Conservation Management Conservation Demand
2004 20,545 258 20,287 0 894 846 588 577 19,0632005 22,361 264 22,097 0 902 895 600 611 20,8582006 21,819 256 21,563 0 928 948 635 640 20,2562007 21,962 261 21,701 0 952 982 716 683 20,2952008 21,060 181 20,879 0 966 1,042 760 706 19,3342009 22,351 249 22,102 0 981 1,097 811 732 20,5582010 22,256 419 21,837 0 990 1,181 815 758 20,4512011 21,619 427 21,192 0 1,000 1,281 821 781 19,7982012 21,440 431 21,009 0 1,013 1,351 833 810 19,5942013 21,576 396 21,180 0 1,025 1,394 833 827 19,718
Historical Values (2004 - 2013):
Col. (2) - Col. (4) are actual values for historical Summer peaks. As such, they incorporate the effects of conservation (Col. 7 & Col. 9), and mayincorporate the effects of load control if load control was operated on these peak days. Therefore, Col. (2) represents the actual Net Firm Demand.
Col. (5) - Col. (9) represent actual DSM capabilities starting from January 1988 and are annual (12-month) values except for 2013 values which are through August.
Col. (10) represents a HYPOTHETICAL "Net Firm Demand" as if the load control values had definitely been exercised on the peak. Col. (10) is derived by the formula: Col. (10) = Col.(2) - Col.(6) - Col.(8).
(1) (2) (3) (4) (5) (6) (7) (8) (9) (10)
August of Res. Load Residential C/I Load C/I Net FirmYear Total Wholesale Retail Interruptible Management* Conservation Management* Conservation Demand
2014 22,768 1,173 21,595 0 1,077 65 816 33 20,7772015 23,356 1,206 22,149 0 1,093 88 830 46 21,2982016 23,778 1,212 22,565 0 1,103 89 841 49 21,6952017 24,190 1,159 23,031 0 1,113 91 853 52 22,0812018 24,544 1,166 23,378 0 1,124 92 865 56 22,4072019 24,896 1,172 23,723 0 1,134 94 877 62 22,7292020 25,239 1,179 24,061 0 1,144 97 889 67 23,0422021 25,439 985 24,454 0 1,154 100 901 73 23,2112022 25,908 992 24,916 0 1,165 104 912 79 23,6482023 26,528 998 25,530 0 1,175 109 924 85 24,235
Projected Values (2014 - 2023):
Col. (2) - Col. (4) represent FPL's forecasted peak and does not include incremental conservation, cumulative load management, or incremental load management.
Col. (5) - Col. (9) represent cumulative load management, and incremental conservation and load management. All values are projected August values.
Col. (8) represents FPL's Business On Call, CDR, CILC, and Curtailable programs/rates.
Col. (10) represents a 'Net Firm Demand" which accounts for all of the incremental conservation and assumes all of the load control is implemented on the peak. Col. (10) is derived by using the formula: Col. (10) = Col. (2) - Col. (5) - Col. (6) - Col. (7) - Col. (8) - Col. (9).
* Res. Load Management and C/I Load Management include MW values of load management from Lee County and FKEC.
Schedule 3.1Forecast of Summer Peak Demand (MW)
Schedule 3.1History of Summer Peak Demand (MW)
Florida Power & Light Company 40
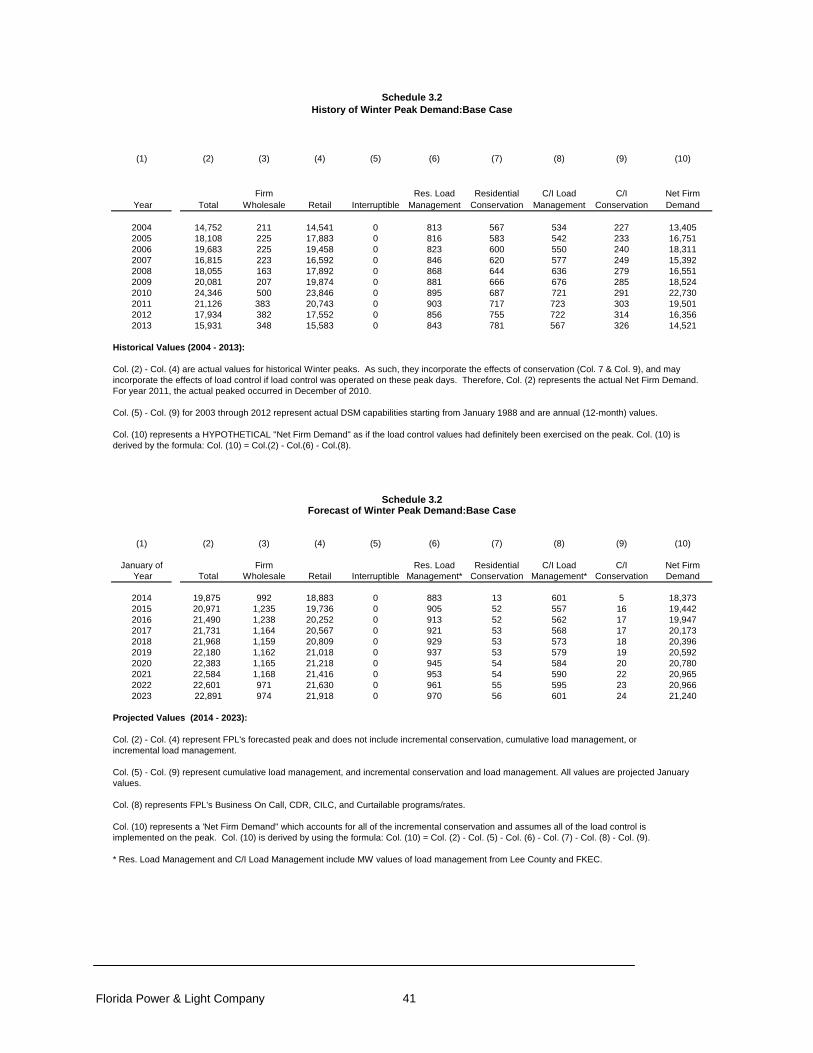
(1) (2) (3) (4) (5) (6) (7) (8) (9) (10)
Firm Res. Load Residential C/I Load C/I Net Firm Year Total Wholesale Retail Interruptible Management Conservation Management Conservation Demand
2004 14,752 211 14,541 0 813 567 534 227 13,4052005 18,108 225 17,883 0 816 583 542 233 16,7512006 19,683 225 19,458 0 823 600 550 240 18,3112007 16,815 223 16,592 0 846 620 577 249 15,3922008 18,055 163 17,892 0 868 644 636 279 16,5512009 20,081 207 19,874 0 881 666 676 285 18,5242010 24,346 500 23,846 0 895 687 721 291 22,7302011 21,126 383 20,743 0 903 717 723 303 19,5012012 17,934 382 17,552 0 856 755 722 314 16,3562013 15,931 348 15,583 0 843 781 567 326 14,521
Historical Values (2004 - 2013):
Col. (2) - Col. (4) are actual values for historical Winter peaks. As such, they incorporate the effects of conservation (Col. 7 & Col. 9), and mayincorporate the effects of load control if load control was operated on these peak days. Therefore, Col. (2) represents the actual Net Firm Demand.For year 2011, the actual peaked occurred in December of 2010.
Col. (5) - Col. (9) for 2003 through 2012 represent actual DSM capabilities starting from January 1988 and are annual (12-month) values.
Col. (10) represents a HYPOTHETICAL "Net Firm Demand" as if the load control values had definitely been exercised on the peak. Col. (10) is derived by the formula: Col. (10) = Col.(2) - Col.(6) - Col.(8).
(1) (2) (3) (4) (5) (6) (7) (8) (9) (10)
January of Firm Res. Load Residential C/I Load C/I Net Firm Year Total Wholesale Retail Interruptible Management* Conservation Management* Conservation Demand
2014 19,875 992 18,883 0 883 13 601 5 18,3732015 20,971 1,235 19,736 0 905 52 557 16 19,4422016 21,490 1,238 20,252 0 913 52 562 17 19,9472017 21,731 1,164 20,567 0 921 53 568 17 20,1732018 21,968 1,159 20,809 0 929 53 573 18 20,3962019 22,180 1,162 21,018 0 937 53 579 19 20,5922020 22,383 1,165 21,218 0 945 54 584 20 20,7802021 22,584 1,168 21,416 0 953 54 590 22 20,9652022 22,601 971 21,630 0 961 55 595 23 20,9662023 22,891 974 21,918 0 970 56 601 24 21,240
Projected Values (2014 - 2023):
Col. (2) - Col. (4) represent FPL's forecasted peak and does not include incremental conservation, cumulative load management, or incremental load management.
Col. (5) - Col. (9) represent cumulative load management, and incremental conservation and load management. All values are projected Januaryvalues.
Col. (8) represents FPL's Business On Call, CDR, CILC, and Curtailable programs/rates.
Col. (10) represents a 'Net Firm Demand" which accounts for all of the incremental conservation and assumes all of the load control is implemented on the peak. Col. (10) is derived by using the formula: Col. (10) = Col. (2) - Col. (5) - Col. (6) - Col. (7) - Col. (8) - Col. (9).
* Res. Load Management and C/I Load Management include MW values of load management from Lee County and FKEC.
Forecast of Winter Peak Demand:Base CaseSchedule 3.2
Schedule 3.2History of Winter Peak Demand:Base Case
Florida Power & Light Company 41

(1) (2) (3) (4) (5) (6) (7) (8) (9)
Net Energy ActualFor Load Residential C/I Net Energy Sales for Utility Use Total Billed
without DSM Conservation Conservation For Load Resale & Losses Retail Energy LoadYear GWh GWh GWh GWh GWh GWh Sales (GWh) Factor(%)
2004 111,659 1,872 1,693 108,093 1,531 7,467 99,095 59.9%2005 115,065 1,970 1,793 111,301 1,506 7,498 102,296 56.8%2006 117,116 2,078 1,901 113,137 1,569 7,909 103,659 59.2%2007 118,518 2,138 2,066 114,315 1,499 7,401 105,415 59.4%2008 115,379 2,249 2,126 111,004 993 7,092 102,919 60.0%2009 115,844 2,345 2,196 111,303 1,155 7,394 102,755 56.8%2010 119,220 2,487 2,259 114,475 2,049 7,870 104,557 58.7%2011 117,460 2,683 2,324 112,454 2,176 6,950 103,327 59.4%2012 116,083 2,823 2,394 110,866 2,237 6,403 102,226 58.9%2013 117,087 2,962 2,469 111,655 2,158 6,713 102,784 59.1%
Historical Values (2004 - 2013):
Col. (2) represents derived "Total Net Energy For Load w/o DSM". The values are calculated using the formula: Col. (2) = Col. (3) + Col. (4) + Col. (5).
Col. (3) & Col. (4) are DSM values starting in January 1988 and are annual (12-month) values. Col. (3) and Col. (4) for 2013are "estimated actuals" and are also annual (12-month) values. The values represent the total GWh reductions experienced each year .
Col. (5) is the actual Net Energy for Load (NEL) for years 2003 - 2013.
Col. (8) is the Total Retail Billed Sales. The values are calculated using the formula: Col. (8) = Col. (5) - Col. (6) - Col. (7). These values are at the meter.
Col. (9) is calculated using Col. (5) from this page and Col. (2), "Total", from Schedule 3.1 using the formula: Col. (9) = ((Col. (5)*1000) / ((Col. (2) * 8760)Adjustments are made for leap years.
(1) (2) (3) (4) (5) (6) (7) (8) (9)
Forecasted Net Energy ForecastedNet Energy For Load Total BilledFor Load Residential C/I Adjusted for Sales for Utility Use Retail Energy
without DSM Conservation Conservation DSM Resale & Losses Sales w/o DSM LoadYear GWh GWh GWh GWh GWh GWh GWh Factor(%)
2014 118,001 91 53 117,858 4,907 6,662 106,432 59.2%2015 121,606 142 80 121,383 5,654 6,703 109,248 59.4%2016 123,943 144 81 123,718 5,706 6,775 111,463 59.3%2017 124,914 147 81 124,686 5,419 6,811 112,684 58.9%2018 126,399 150 81 126,168 5,440 6,896 114,063 58.8%2019 127,673 155 80 127,438 5,496 6,959 115,218 58.5%2020 129,187 159 81 128,948 5,559 7,035 116,593 58.3%2021 129,454 164 82 129,208 5,133 7,018 117,303 58.1%2022 130,517 170 82 130,264 4,846 7,124 118,548 57.5%2023 132,357 179 83 132,095 4,908 7,239 120,210 57.0%
Projected Values (2014 - 2023):
Col. (2) represents Forecasted Net Energy for Load and does not include incremental DSM from 2013 - on. The Col. (2) values are extracted from Schedule 2.3, Col(19). The effects of conservation implemented prior to September 2012 are incorporated into the load forecast values in Col. (2).
Col. (3) & Col. (4) are forecasted values of the reduction on sales from incremental conservation from Jan 2014 - on and are mid-year (6-month) values reflecting DSM signups occurring evenly thoughout each year.
Col. (5) is the forecasted Net Energy for Load (NEL) after adjusting for impacts of incremental DSM for years 2014 - 2023 using the formula: Col. (5) = Col. (2) - Col. (3) - Col. (4)
Col. (8) is the Total Retail Billed Sales. The values are calculated using the formula: Col. (8) = Col. (2) - Col. (6) - Col. (7). These values are at the meter.
Col. (9) is calculated using Col. (2) from this page and Col. (2), "Total", from Schedule 3.1. Col. (9) = ((Col. (2)*1000) / ((Col. (2) * 8760)Adjustments are made for leap years.
Forecast of Annual Net Energy for Load (GWh)(All values are "at the generator"values except for Col (8))
Schedule 3.3
(All values are "at the generator" values except for Col (8))
Schedule 3.3History of Annual Net Energy for Load (GWh)
Florida Power & Light Company 42

(1) (2) (3) (4) (5) (6) (7)
Total Total TotalPeak Demand NEL Peak Demand NEL Peak Demand NEL
Month MW GWh MW GWh MW GWh
JAN 15,135 8,089 19,875 8,719 20,971 9,093
FEB 15,627 7,468 17,441 7,781 18,050 8,126
MAR 15,931 7,936 17,273 8,753 17,875 9,103
APR 18,419 8,967 18,149 9,047 18,782 9,386
MAY 19,579 9,494 20,331 10,369 21,040 10,701
JUN 21,147 10,460 21,852 10,865 22,416 11,127
JUL 20,261 10,649 22,413 11,625 22,991 11,884
AUG 21,576 11,392 22,768 11,840 23,356 12,096
SEP 20,297 10,229 21,959 10,997 22,525 11,256
OCT 19,313 9,969 20,458 10,354 20,986 10,617
NOV 18,028 8,506 17,994 8,686 18,458 8,960
DEC 16,161 8,497 17,563 8,965 18,016 9,257
Annual Values: 111,655 118,001 121,606
Col. (3) annual value shown is consistent with value shown in Col.(5) of Schedule 3.3.
Cols. (4) - (7) do not include the impacts of cumulative load management, incremental conservation, and incremental load management.
Cols. (5) and Col. (7) annual values shown are consistent with values shown in Col.(2) of Schedule 3.3.
FORECAST
Schedule 4Previous Year Actual and Two-Year Forecast of
Retail Peak Demand and Net Energy for Load (NEL) by Month
2013 2014Actual FORECAST
2015
Florida Power & Light Company 43

(This page is left intentionally blank.)
Florida Power & Light Company 44

CHAPTER III Projection of Incremental Resource Additions
Florida Power & Light Company 45

(This page is left intentionally blank.)
Florida Power & Light Company 46

III. Projection of Incremental Resource Additions III.A FPL’s Resource Planning:
FPL utilizes its well established integrated resource planning (IRP) process in whole or in part as
analysis needs are warranted, to determine when new resources are needed, what the magnitude
of the needed resources are, and what type of resources should be added. The timing and type of
new power plants, the primary subjects of this document, are determined as part of the IRP
process work.
This section describes FPL’s basic IRP process. Some of the key assumptions, in addition to a
new load forecast, that were used in developing the resource plan presented in this Site Plan are
also discussed.
Four Fundamental Steps of FPL’s Resource Planning: There are 4 fundamental steps to FPL’s resource planning. These steps can be generally
described as follows:
Step 1: Determine the magnitude and timing of FPL’s new resource needs;
Step 2: Identify which resource options and resource plans can meet the determined
magnitude and timing of FPL’s resource needs (i.e., identify competing options
and resource plans);
Step 3: Evaluate the competing options and resource plans in regard to system
economics and non-economic factors; and,
Step 4: Select a resource plan and commit, as needed, to near-term options.
Figure III.A.1 graphically outlines the 4 steps.
Florida Power & Light Company 47

Overview of FPL's IRP Process
Figure III.A.1: Overview of FPL’s IRP Process
FundamentalIRP Steps
(1) Determine the magnitude and timing of FPL's new resource needs
(2) Identify DSM and generationresource options, perform preliminary analyses, and develop resource plans which can meet the determined magnitude andtiming of FPL's resource needs
(3) Evaluate the competing resource plans in regard to system economics and non-economic factors
Load forecast update
Updating of other forecasts,
data, and assumptions
System reliabilityanalyses
Preliminary analyses of individual DSM options
Packaging of DSM options
Develop resource plans for system analyses
System economic and non-economic analyses of competing resource
plans
Finalize FPL'sIntegrated Resource
Plan
(4) Finalize FPL's Integrated Resource Plan & commit to near-term options
FPL Commitmentto near-term
options
Preliminary analyses of generation options
Florida Power & Light Company 48

Step 1: Determine the Magnitude and Timing of FPL’s New Resource Needs: The first of the four resource planning steps, determining the magnitude and timing of FPL’s
resource needs, is essentially a determination of the amount of capacity or megawatts (MW) of
load reduction, new capacity additions, or a combination of both load reduction and new capacity
additions that are needed to maintain system reliability. Also determined in this step is when the
MW additions are needed to meet FPL’s reliability criteria. This step is often referred to as a
reliability assessment, or resource adequacy, analysis for the utility system.
Step 1 typically starts with an updated load forecast. Several databases are also updated in this
first fundamental step, not only with the new information regarding forecasted loads, but also with
other information that is used in many of the fundamental steps in resource planning. Examples of
this new information include, but are not limited to: delivered fuel price projections, current
financial and economic assumptions, and power plant capability and operating assumptions. FPL
also includes key sets of assumptions regarding three specific types of resources: (1) FPL unit
capacity changes, (2) firm capacity power purchases, and (3) demand side management (DSM)
implementation.
Key Assumptions Regarding the Three Types of Resources:
The first set of assumptions, FPL unit capacity changes, is based on the current projection of new
generating capacity additions and planned retirements of existing generating units. In FPL’s 2014
Site Plan, there are five such projected capacity changes. These are listed below in chronological
order:
1) Planned retirement of existing Putnam Units 1 & 2:
Analyses conducted during 2013 and early 2014 showed that it would be cost-effective to
retire the two existing units, Putnam Units 1 & 2, and replace the capacity with new
combined cycle (CC) capacity at a later date and at a site to be determined. The new CC
capacity would have a significantly better heat rate, thus reducing FPL’s system fuel
usage and system emissions. Consequently, FPL currently projects that the two existing
units will be retired by the end of 2014.
2) CT upgrades at existing CC plant sites:
In the fourth quarter of 2011, FPL started upgrading the 7FA combustion turbines (CT)
that are components at a number of its existing CC units. These upgrades will
economically benefit FPL’s customers by increasing the MW output of these CC units by
approximately 209 MW (Summer peak value) in total. As reflected in Schedule 1 in
Chapter I, 133 MW of the increased capacity from these CT upgrades is already in
Florida Power & Light Company 49

service. The work for the remaining upgrades is continuing and the project is projected to
be completed in 2015.
3) Modernization of the Port Everglades plant site:
The work to modernize the existing Port Everglades site by adding new combined cycle
(CC) capacity continues. The new generating unit, called the Port Everglades Next
Generation Clean Energy Center (PEEC), is projected to be in-service in mid-2016 and is
projected to have a peak Summer output of 1,237 MW. The FPSC issued the final need
order for this modernization project in April 2012 in Order No. PSC-12-0187-FOF-EI. The
site certification order for the project, DOAH Case No. 12-0422EPP, was received for the
Port Everglades project in October 2012. (Note that a similar modernization of the FPL’s
existing Riviera Beach plant site is scheduled to be completed on/near the April 1, 2014
filing date of this 2014 Site Plan.)
4) Retirement of existing gas turbines (GTs) in Broward County and partial capacity
replacement with new combustion turbines (CTs) at FPL’s Lauderdale plant site:
Due to new nitrogen dioxide (NO2) environmental regulations, FPL filed in June 2013 for
FPSC approval to recover costs for removing all of its existing GTs and replacing a portion
of the GT capacity with new CTs. In December 2013, FPL withdrew this request pending
additional environmental monitoring and analyses. Computer modeling of the emissions
from the GTs projected that the GTs would exceed the new NO2 limit. FPL believes this
monitoring and analyses will confirm that the operation of its existing GTs in Broward
County will not comply with the new NO2 regulations. Therefore, for planning purposes,
FPL has assumed that all of its existing Broward County GTs will be removed (a loss of
1,260 MW Summer) and that this capacity will be partially replaced by 5 new CTs that
would be sited in Broward County (an increase of 1,005 MW Summer). This GT removal
and CT partial replacement is assumed to occur by the end of 2018.
5) Turkey Point Nuclear Units 6 & 7:
FPL is continuing its work to obtain all of the licenses, permits, and approvals that will be
necessary to construct and operate two new nuclear units at its Turkey Point site. These
licenses, permits, and approvals will provide FPL with the opportunity to construct these
nuclear units at Turkey Point for a time expected to be up to 20 years from the time the
licenses and permits are granted, and then to operate the units for at least 40 years
thereafter. FPL received need determination approval from the FPSC for the two nuclear
units in April 2008 in Order No. PSC-08-0237-FOF-EI. The earliest deployment dates for
these two new units, Turkey Point Units 6 & 7, remain 2022 and 2023, respectively. Each
new nuclear unit is projected to have a peak Summer output of 1,100 MW.
Florida Power & Light Company 50

Also in regard to FPL unit capacity changes, as part of FPL’s planned acquisition of Vero Beach’s
electric utility system, FPL is projected to take ownership of Vero Beach’s five existing generating
units starting January 2015. The current plan, based on the units’ poor economics, is to
immediately retire three of these older generating units and operate the remaining two, which
supply approximately 46 MW (Summer) of combined cycle capacity, for a maximum of three
years.
The second set of assumptions involves firm capacity power purchases. FPL’s current projection
of firm capacity purchases has changed from the projection in the 2013 Site Plan in regard to only
two purchases. As part of the projected agreement that FPL will begin serving Vero Beach’s
electrical needs beginning in January 2015, FPL has acquired two existing power purchase
agreements totaling approximately 37 MW of coal-fired capacity. These agreements are now
projected to run through the end of 2017 instead of 2016 as projected in FPL’s 2013 Site Plan. In
addition, FPL now projects that Internal Revenue Service (IRS) regulations regarding the amount
of energy that FPL can receive under its purchase agreement with Jacksonville Electric Authority
(JEA) for St. Johns Regional Power Park (SJRPP)-based capacity and energy will not result in the
suspension of the delivery of capacity and energy receipts to FPL until April 2019. 4
None of the other purchase projections has changed from those in the 2013 Site Plan. FPL’s
current projection includes an additional 70 MW from the Palm Beach Solid Waste Authority
(SWA) starting in year 2015. In addition, FPL projects that it will begin receiving a total of 180 MW
of firm capacity in 2021 from biomass-based power purchase agreements with EcoGen.
In total, the projected firm capacity purchases are from a combination of utility and independent
power producers. Details, including the annual total capacity values for these purchases, are
presented in Chapter I in Tables I.B.1 and I.B.2. These purchased capacity amounts were
incorporated in FPL’s resource planning work.
The third set of assumptions involves a projection of the amount of additional DSM that is
anticipated to be implemented annually over the ten-year period. A key aspect of FPL’s IRP
process is the evaluation of DSM resources. Since 1994, FPL’s resource planning work has
assumed that, at a minimum, the DSM MW called for in FPL’s FPSC-approved DSM Plan will be
achieved. In 2014, FPL is required to propose new DSM Goals for the 2015 through 2024 time
period. Those proposed goals will be filed with the FPSC on April 2, 2014; i.e., one day after this
2014 Site Plan is filed with the FPSC. FPL’s filing to support its proposed DSM goals provides
extensive detail regarding how DSM resources were evaluated in FPL’s most current IRP planning
4 FPL’s projected suspension date for the SJRPP purchase is based on a system reliability perspective and represents the earliest projected date at which the suspension of capacity and energy could occur.
Florida Power & Light Company 51

analyses. The DSM assumptions presented in this 2014 Site Plan, and which are assumed in the
analyses whose results are reflected in the Site Plan, are consistent with FPL’s proposed goals.
The FPSC is expected to make a decision regarding FPL’s 2015 – 2024 DSM Goals later in 2014.
The Three Reliability Criteria Used to Determine FPL’s Projected Resource Needs:
These key assumptions, plus the other updated information described above, are then applied in
the first fundamental step: the determination of the magnitude and the timing of FPL’s future
resource needs. This determination is accomplished by system reliability analyses which for FPL
have traditionally been based on dual planning criteria of a minimum peak period reserve margin
of 20% (FPL applies this to both Summer and Winter peaks) and a maximum loss-of-load
probability (LOLP) of 0.1 day per year. Both of these criteria are commonly used throughout the
utility industry. Beginning this year, FPL is also using a third reliability criterion: a 10% generation-
only reserve margin (GRM) criterion.
Historically, two types of methodologies, deterministic and probabilistic, have been utilized in
system reliability analysis. The calculation of excess firm capacity at the annual system peaks
(reserve margin) is the most common method, and this relatively simple deterministic calculation
can be performed on a spreadsheet. It provides an indication of the adequacy of a generating
system’s capacity resources compared to its load during peak periods. However, deterministic
methods do not take into account probabilistic-related elements such as the impact of individual
unit failures. For example: two 50 MW units which can be counted on to run 90% of the time are
more valuable in regard to utility system reliability than is one 100 MW unit which can also be
counted on to run 90% of the time. Probabilistic methods also recognize the value of being part of
an interconnected system with access to multiple capacity sources.
For this reason, probabilistic methodologies have been used to provide an additional perspective
on the reliability of a generating system. There are a number of probabilistic methods that are
being used to perform system reliability analyses. Among the most widely used is loss-of-load
probability (LOLP) which FPL utilizes. Simply stated, LOLP is an index of how well a generating
system may be able to meet its firm demand (i.e., a measure of how often load may exceed
available resources). In contrast to reserve margin, the calculation of LOLP looks at the daily peak
demands for each year, while taking into consideration such probabilistic events as the
unavailability of individual generators due to scheduled maintenance or forced outages.
LOLP is expressed in terms of the projected probability that a utility will be unable to meet its
entire firm load at some point during a year. The probability of not being able to meet the entire
firm load is calculated for each day of the year using the daily peak hourly load. These daily
probabilities are then summed to develop an annual probability value. This annual probability
Florida Power & Light Company 52

value is commonly expressed as “the number of days per year” that the entire system firm load
could not be met. FPL’s standard for LOLP, commonly accepted throughout the industry, is a
maximum of 0.1 day per year. This analysis requires a more complicated calculation methodology
than does the reserve margin analysis. LOLP analyses are typically carried out using computer
software models such as the Tie Line Assistance and Generation Reliability (TIGER) program
used by FPL.
FPL’s recent integrated resource planning work has resulted in FPL’s resource plans showing a
significant shift in the mix of generation and DSM resources over the next 10 years in regard to the
relative contribution of these resources to system reliability. In order to gauge the extent of this
shift and its potential implications for FPL’s system reliability, FPL developed a new metric: a
generation-only reserve margin (GRM). This GRM metric reflects reserves that would be provided
only by actual generating resources. The GRM value is calculated by setting to zero all
incremental energy efficiency (EE) and load management (LM), plus all existing LM, in a reserve
margin calculation. The resulting GRM value provides an indication of how large a role generation
is projected to play in each year as FPL maintains its 20% Summer and Winter “total” reserve
margins (which account for both generation and DSM resources).
FPL has been reporting the GRM metric in its Site Plans since 2011 when it presented projections
of its Summer GRM for the years 2011-2020. The 2011 projection showed a steady decrease in
GRM values from a “balanced” 11.5% in 2011 to much reduced 7.2% by 2020. In its 2012 Site
Plan, FPL’s projected GRM values steadily decreased over the 10-year period from 16.2% in 2012
to 5.5% in 2021. The projected pattern in the 2013 Site Plan was similar: a steady decrease from
16.3% in 2013 to 6.9% in 2021. (The projected GRM value for 2022 presented in the 2013 Site
Plan increased to 8.9% due to the planned addition of the new Turkey Point 6 nuclear unit in
2022.) Thus FPL’s resource planning projections over the last 3 years have each shown a general
downwards trend in projected GRM in the latter portion of this decade. This indicates increasing
reliance on DSM resources, particularly EE resource additions, and decreasing reliance on
generation resources, to maintain system reliability. As a result, FPL has analyzed what impact(s)
this trend could have on system reliability. Two types of evaluations were conducted. One of these
evaluations is from the perspective of FPL’s system operators who are responsible for operating
the bulk electric system. The other evaluation is from a resource planning perspective.
The first evaluation examined what impact an increasing reliance on EE resource additions was
projected to have on the amount and type of reserves that operators would have at their disposal
to meet load on a system peak hour. FPL first used a “looking back” perspective at a recent actual
peak load day of January 11, 2010 to see how the system actually operated. Then, assuming a
“what if” situation in which the system was assumed to have been designed to have an identical
Florida Power & Light Company 53

total reserve margin, but higher and lower GRM respectively, FPL analyzed what the impact would
have been on FPL’s ability to serve its customers on that peak day with these alternative assumed
systems.
FPL also performed analyses taking a “looking forward” perspective at the projected year of 2021.
Three scenarios were analyzed: (i) the system with its projected GRM and total reserve margin
values consistent with the 2013 Site Plan; (ii) a system with an identical total reserve margin, but a
higher GRM; and (iii) a system with an identical total reserve margin, but a lower GRM.
Recognizing that the impacts from EE resource additions will already have been accounted for in
the peak load that system operators must react to on an actual peak day, the analyses assumed
an adverse peak day situation which consisted of significantly higher load and significantly less
available generation than projected. The results from both the “looking back” and “looking forward”
analyses were similar. For resource plans with identical total reserve margins, but different GRM
levels, system operators were projected to have significantly higher levels (MW) of reserves, either
generation and/or load management reserves, available on the peak days with a resource plan
that had a higher GRM level than with a resource plan that had a lower GRM level. Thus a
resource plan with a higher GRM, compared with a lower GRM, results in better system reliability
for customers due to a greater likelihood of meeting customers’ firm demand on peak load days,
despite unexpected conditions or events. Better system reliability to customers translates to a
reduced risk of shedding firm load.
The second evaluation was from the resource planning perspective of loss-of-load-probability
(LOLP). For this evaluation, FPL also analyzed resource plans with identical total reserve margins,
but higher and lower GRM levels. The results of these analyses for the FPL system showed that a
resource plan with a higher GRM resulted in a projection of lower LOLP values than a resource
plan with a lower GRM.
Based on these operational and resource planning evaluations, FPL has concluded that resource
plans for its system with identical total reserve margins, but different GRM values, are not equal in
regard to system reliability. A resource plan with a higher GRM value is projected to result in more
MW being available to system operators on adverse peak load days, and in lower LOLP values,
than a resource plan with a lower GRM value, even though both resource plans have an identical
total reserve margin. Therefore, FPL has applied a minimum GRM criterion as a third reliability
criterion in its resource planning process.
Based on the expertise and experience of FPL’s system operators regarding the amount of
generation MW needed for reliable operations, the GRM criterion is set at a minimum of 10% for
Summer and Winter. From an operational perspective, FPL believes it is necessary to have
Florida Power & Light Company 54

approximately 2,650 MW of generation reserves. These reserves will allow FPL to address a
variety of operational considerations including: (i) unplanned generation unavailability; (ii) the
deployment of real-time operating reserves to meet its 15-minute obligations as part of the Florida
Reserve Sharing Group; (iii) the requirement pursuant to NERC Reliability Standards to replace
with other resources within 30 minutes following the unplanned loss of a large generation unit; and
(iv) higher-than-forecasted loads. The sum of the operational reserves to cover for these
requirements and considerations is approximately 2,650 MW. This MW value is consistent with a
10% GRM for the foreseeable future. FPL is planning its system so that the minimum 10% GRM
criterion is met beginning in the Summer of 2019.
The 10% minimum Summer and Winter GRM criterion augments the two existing reliability criteria
used by FPL: a 20% total reserve margin criterion for Summer and Winter, and a 0.1 day/year
LOLP criterion. The total reserve margin and LOLP criteria continue to identify the timing and
magnitude of FPL’s future resource needs. The GRM criterion provides direction regarding the mix
of generation and DSM resources that should be added to maintain and enhance FPL’s system
reliability.
Step 2: Identify Resource Options and Plans That Can Meet the Determined Magnitude and Timing of FPL’s Resource Needs:
The initial activities associated with this second fundamental step of resource planning generally
proceed concurrently with the activities associated with Step 1. During Step 2, preliminary
economic screening analyses of new capacity options that are identical, or virtually identical, in
regard to certain key characteristics may be conducted to determine which new capacity options
appear to be the most competitive on FPL’s system. This preliminary analysis work can also help
identify capacity size (MW) values, projected construction/permitting schedules, and operating
parameters and costs. Similarly, preliminary economic screening analyses of new DSM options
and/or evaluation of existing DSM options are often conducted in this second fundamental IRP
step.
FPL typically utilizes the P-MArea production cost model and a Fixed Cost Spreadsheet, and/or an
optimization models and spreadsheet analyses, to perform the preliminary economic screening of
generation resource options. For the preliminary economic screening analyses of DSM resource
options, FPL typically uses its DSM CPF model which is an FPL spreadsheet model utilizing the
FPSC’s approved methodology for performing preliminary economic screening of individual DSM
measures and programs. In addition, a years-to-payback screening test based on a two-year
criterion is also used in the preliminary economic screening of individual DSM measures and
programs. Then, as the focus of DSM analyses progresses from analysis of individual DSM
Florida Power & Light Company 55

measures to the development of DSM portfolios, FPL uses two additional models. One of these
models is FPL’s non-linear programming model that is used for analyzing the potential for lowering
system peak loads through additional load management/demand response capability. The other
model that FPL typically utilizes is its linear programming model with which FPL develops DSM
portfolios.
The individual new resource options, both Supply options and DSM portfolios, emerging from
these preliminary economic screening analyses are then typically “packaged” into different
resource plans which are designed to meet the system reliability criteria. In other words, resource
plans are created by combining individual resource options so that the timing and magnitude of
FPL’s projected new resource needs are met. The creation of these competing resource plans is
typically carried out using spreadsheet and/or dynamic programming techniques.
At the conclusion of the second fundamental resource planning step, a number of different
combinations of new resource options (i.e., resource plans) of a magnitude and timing necessary
to meet FPL’s resource needs are identified.
Step 3: Evaluate the Competing Options and Resource Plans in Regard to System Economics and Non-Economic Factors:
At the completion of fundamental steps 1 & 2, the most viable new resource options have been
identified, and these resource options have been combined into a number of resource plans which
meet the magnitude and timing of FPL’s resource needs. The stage is set for evaluating these
resource options and resource plans in system economic analyses that aim to account for all of
the impacts to the FPL system from the competing resource options/resource plans. In FPL’s 2013
and early 2014 resource planning work, once the resource plans were developed, FPL utilized the
P-MArea production cost model and a Fixed Cost Spreadsheet, and/or the Strategist model, to
perform the system economic analyses. Other spreadsheet models may also be used to further
analyze the resource plans.
The basic economic analyses of the competing resource plans focus on total system economics.
The standard basis for comparing the economics of competing resource plans is their relative
impact on FPL’s electricity rate levels, with the objective generally being to minimize FPL’s
projected levelized system average electric rate (i.e., a Rate Impact Measure or RIM
methodology). In analyses in which the DSM contribution has already been determined through
the same IRP process and FPSC approval, and therefore the only competing options were new
generating units and/or purchase options, comparisons of competing resource plans’ impacts on
electricity rates and on system revenue requirements will yield identical outcomes in regard to the
Florida Power & Light Company 56

relative rankings of the resource options being evaluated. Consequently, the competing options
and resource plans in such cases can be evaluated on a system cumulative present value
revenue requirement (CPVRR) basis.
Other factors are also included in FPL’s evaluation of resource options and resource plans. While
these factors may have an economic component or impact, they are often discussed in
quantitative, but non-economic, terms such as percentages, tons, etc. rather than in terms of
dollars. These factors are often referred to by FPL as “system concerns” that include (but are not
limited to) maintaining/enhancing fuel diversity in the FPL system, system emission levels, and
maintaining a regional balance between load and generating capacity, particularly in the
Southeastern Florida counties of Miami-Dade and Broward. In conducting the evaluations needed
to determine which resource options and resource plans are best for FPL’s system, the non-
economic evaluations are conducted with an eye to whether the system concern is positively or
negatively impacted by a given resource option or resource plan. These, and other, factors are
discussed later in this chapter in section III.C.
Step 4: Finalizing FPL’s Current Resource Plan The results of the previous three fundamental steps are typically used to develop FPL’s current
resource plan. The current resource plan is presented in the following section.
III.B Projected Incremental Resource Additions/Changes in the Resource Plan
FPL’s projected incremental generation capacity additions/changes for 2014 through 2023 are
depicted in Table III.B.1. These capacity additions/changes include the 5 generation
additions/changes previously discussed. The table shows three more generation changes: a CC
unit being added in 2019, a short-term PPA of 129 MW being added in 2020, and a short-term
PPA of 168 MW being added in 2021. The CC unit is added in 2019 to meet the Summer total
reserve margin criterion and the two PPAs are added in 2020 and 2021 to meet the GRM criterion.
Although FPL’s projected DSM additions that are developed in the IRP process are not explicitly
presented in this table, these DSM additions have been fully accounted for in all of FPL’s resource
planning work reflected in this document. The projected MW reductions from these DSM additions
are also reflected in the projected total reserve margin values shown in the table below and in
Schedules 7.1 and 7.2 presented later in this chapter. DSM is further addressed later in this
chapter in section III.D.
Florida Power & Light Company 57

III.C Discussion of the Projected Resource Plan and Issues Impacting FPL’s Resource Planning Work
As indicated in the Executive Summary, FPL’s resource planning efforts in 2013 and early 2014
were influenced by a number of factors. These factors are expected to continue to influence FPL’s
resource planning work for the foreseeable future. In addition, other factors may also influence
FPL’s on-going resource planning work in the future and may result in changes to the resource
plan discussed in this document. Eight (8) of these factors are discussed below (in no particular
order of importance).
1) Maintaining/enhancing fuel diversity in the FPL system;
2) Maintaining a balance between load and generating capacity in Southeastern Florida,
particularly in Miami-Dade and Broward Counties;
3) Updated projections of Federal and state energy efficiency codes and standards;
4) Decline in the projected cost-effectiveness of utility DSM measures and programs;
5) FPL‘s growing dependence upon DSM resources to maintain system reliability;
6) The schedule for the new Turkey Point Nuclear Units 6 & 7;
7) Environmental regulation and/or legislation; and,
8) Possible establishment of a Florida standard for renewable energy or clean energy.
These 8 factors, and their various impacts on FPL’s resource planning efforts including the current
resource plan that is presented in this Site Plan, are briefly discussed below.
1. Maintaining/Enhancing System Fuel Diversity:
FPL currently uses natural gas to generate approximately 2/3 of the total electricity it delivers
to its customers. In the future, the percentage of FPL’s electricity that is generated by natural
gas is projected to remain at a high level. For this reason, and due to evolving environmental
regulations, FPL is continually seeking opportunities to economically maintain and enhance
the fuel diversity of its system.
In 2007, following express direction by the FPSC to do so, FPL sought approval from the
FPSC to add two new advanced technology coal units to its system. These two new units
would have been placed in-service in 2013 and 2014. However, in part due to concerns over
potential greenhouse gas emission legislation/regulation, FPL was unable to obtain approval
for these units. Several other factors are currently unfavorable to new coal units compared to
new CC units. The first of these factors is a significant reduction in the fuel cost difference
between coal and natural gas compared to the fuel cost difference projected in 2007 that
Florida Power & Light Company 58

favored coal; i.e., the projected fuel cost advantage of coal versus natural gas has been
significantly reduced. Second is the continuation of significantly higher capital costs for coal
units compared to capital costs for CC units. Third is the increased fuel efficiency of new CC
units compared to projected CC unit efficiencies in 2007. Fourth are existing and proposed
environmental regulations, including those that address greenhouse gas emissions, that are
unfavorable to new coal units when compared to new CC units. Consequently, FPL does not
believe that new advanced technology coal units are currently economically, politically, or
environmentally viable fuel diversity enhancement options in Florida.
Therefore, FPL has turned its attention to nuclear energy and renewable energy to enhance
its fuel diversity, to diversifying the sources of natural gas, to diversifying the gas
transportation paths used to deliver natural gas to FPL’s generating units, and to using natural
gas more efficiently. In regard to nuclear energy, in 2008 the FPSC approved the need to
increase capacity at FPL’s four existing nuclear units and authorized FPL to recover project-
related expenditures that are approved as a result of annual nuclear cost recovery filings. FPL
has now successfully completed the nuclear capacity uprate project. Approximately 520 MW
of additional nuclear capacity were delivered by the project which represents an increase of
approximately 30% more capacity than was originally forecasted when the project began.
FPL’s customers are already benefitting from lower fuel costs and reduced system emissions
provided by this additional nuclear capacity.
FPL is continuing its work to obtain all of the licenses, permits, and approvals that would be
necessary to construct and operate two new nuclear units at its Turkey Point site in the future.
These licenses, permits, and approvals will provide FPL with the opportunity to construct
these nuclear units at Turkey Point for a time expected to be up to 20 years from the time the
licenses and permits are granted, and then to operate the units for at least 40 years thereafter.
The earliest deployment dates for the two new nuclear units, Turkey Point Units 6 & 7, remain
2022 and 2023, respectively.
FPL also has been involved in activities to investigate adding or maintaining renewable
resources as a part of its generation supply. One of these activities is a variety of discussions
with the owners of existing facilities aimed at maintaining or extending current agreements. In
addition, FPL considers new cost-effective renewable energy projects such as the power
purchase agreements with EcoGen that will result in FPL receiving 180 MW of firm capacity
from biomass facilities beginning in 2021.
FPL also sought and received approval from the FPSC in 2008 to add 110 MW through three
new FPL-owned solar facilities: one solar thermal facility and two photovoltaic (PV) facilities.
Florida Power & Light Company 59

One 25 MW PV facility began commercial operation in 2009. The remaining two solar
facilities, a 10 MW PV facility and a 75 MW solar thermal steam generating facility, began
commercial operation in 2010. The addition of these renewable energy facilities was made
possible due to enabling legislation from the Florida Legislature in 2008. FPL remains strongly
supportive of federal and/or state legislation that enables electric utilities to add renewable
energy resources and authorize the utilities to recover appropriate costs for these resources.
FPL is planning to introduce two new PV-based solar programs in 2014. These are discussed
further in section III.F.4 of this chapter.
In regard to using natural gas more efficiently, FPL received approvals in 2008 from the FPSC
to modernize the existing Cape Canaveral and Riviera Beach plant sites with new, highly
efficient CC units that replace the former steam generating units on each of those sites. The
Cape Canaveral modernization was commissioned on April 24, 2013 and the Riviera Beach
modernization is projected to go in-service on/near the April 1, 2014 date this 2014 Site Plan
is filed with the FPSC. On April 9th, 2012, FPL received FPSC approval to proceed with a
similar modernization project at the Port Everglades site which is scheduled for completion in
mid-2016. The modernization of the Port Everglades site will retain the capability of receiving
water-borne delivery of oil as a backup fuel.
In regard to diversity in natural gas sourcing and delivery, in 2013 FPL was granted approval
from the FPSC to build a new 3rd natural gas pipeline into Florida and FPL’s service territory.
The process to obtain approval for the new pipeline from the Federal Energy Regulatory
Commission (FERC) is underway. The new pipeline will utilize a new route that will result in a
more reliable, more economic, and more diverse natural gas supply for FPL’s customers and
the state of Florida.
In the future, FPL will continue to identify and evaluate alternatives that may maintain or
enhance system fuel diversity. In this regard, FPL is maintaining the ability to utilize fuel oil at
existing units that have that capability. For this purpose, FPL has installed electrostatic
precipitators (ESPs) at its two 800 MW steam generating units at the Manatee site and at one
of its two 800 MW steam generating units at the Martin site. FPL is in the process of installing
ESPs on its remaining 800 MW steam generating unit at the Martin site. These installations
will enable FPL to retain the ability to burn oil, as needed, at these sites while retaining the
flexibility to use natural gas when economically attractive.
2. Maintaining a Balance Between Load and Generation in Southeastern Florida:
An imbalance has existed between regionally installed generation and regional peak load in
Southeastern Florida. As a result of that imbalance, a significant amount of energy required in
Florida Power & Light Company 60

the Southeastern Florida region during peak periods is provided by operating less efficient
generating units located in Southeastern Florida out of economic dispatch, by importing the
energy through the transmission system from plants located outside the region, or by a
combination of the two. FPL’s prior planning work concluded that, as load inside the region
grows, either additional installed generating capacity in this region, or additional installed
transmission capacity capable of delivering more electricity from outside the region, would be
required to address this imbalance.
Partly because of the lower transmission-related costs resulting from their location, four recent
capacity addition decisions (Turkey Point Unit 5 and WCEC Units 1, 2, & 3) were determined
to be the most cost-effective options to meet FPL’s capacity needs in the near-term. In
addition, FPL has added increased capacity at FPL’s existing two nuclear units at Turkey
Point as part of the previously mentioned nuclear capacity uprates project. The Port
Everglades modernization project scheduled for completion in 2016 will also assist in
addressing this imbalance. Adding the additional generation capacity through the projects
mentioned above contributes to addressing the imbalance between generation, transmission
capacity, and load in Southeastern Florida for approximately the remainder of this decade.
The planned addition of two new nuclear units at FPL’s Turkey Point site, Turkey Point Unit 6
in 2022 and Turkey Point Unit 7 in 2023, will also address the imbalance issue for an
additional period of time beginning in the next decade. Due to forecasted steadily increasing
load in the Southeastern region, the Southeastern Florida imbalance issue will remain an
important consideration in FPL’s on-going resource planning work in future years.
3. Projections of Federal and State Energy Efficiency Codes and Standards: As discussed in Chapter II, FPL’s load forecast includes projected impacts from federal and
state energy efficiency codes and standards. The magnitude of energy efficiency that is now
projected to be delivered to FPL’s customers through these codes and standards is significant.
In FPL’s 2013 Site Plan, the projected cumulative Summer peak impact for the year 2022 from
the codes and standards since 2005 was 2,898 MW compared to what the projected load
would have been without the codes and standards. The current projection of cumulative
Summer peak impact for the year 2023 from the codes and standards since 2005 is 3,477
MW.
In addition to lowering FPL’s load forecast from what it otherwise would have been, and thus
serving to lower FPL’s projected resource needs, this projection of efficiency from the codes
and standards also affects FPL’s resource planning in another way. The projected impacts
Florida Power & Light Company 61
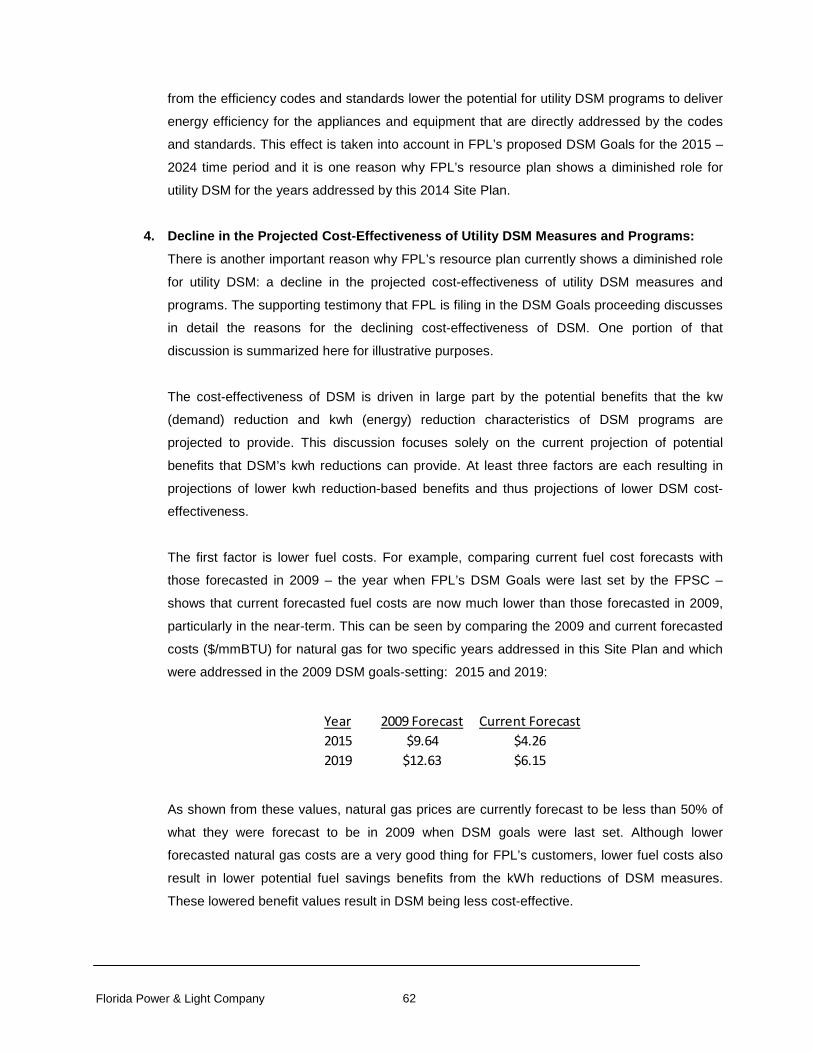
from the efficiency codes and standards lower the potential for utility DSM programs to deliver
energy efficiency for the appliances and equipment that are directly addressed by the codes
and standards. This effect is taken into account in FPL’s proposed DSM Goals for the 2015 –
2024 time period and it is one reason why FPL’s resource plan shows a diminished role for
utility DSM for the years addressed by this 2014 Site Plan.
4. Decline in the Projected Cost-Effectiveness of Utility DSM Measures and Programs:
There is another important reason why FPL’s resource plan currently shows a diminished role
for utility DSM: a decline in the projected cost-effectiveness of utility DSM measures and
programs. The supporting testimony that FPL is filing in the DSM Goals proceeding discusses
in detail the reasons for the declining cost-effectiveness of DSM. One portion of that
discussion is summarized here for illustrative purposes.
The cost-effectiveness of DSM is driven in large part by the potential benefits that the kw
(demand) reduction and kwh (energy) reduction characteristics of DSM programs are
projected to provide. This discussion focuses solely on the current projection of potential
benefits that DSM’s kwh reductions can provide. At least three factors are each resulting in
projections of lower kwh reduction-based benefits and thus projections of lower DSM cost-
effectiveness.
The first factor is lower fuel costs. For example, comparing current fuel cost forecasts with
those forecasted in 2009 – the year when FPL’s DSM Goals were last set by the FPSC –
shows that current forecasted fuel costs are now much lower than those forecasted in 2009,
particularly in the near-term. This can be seen by comparing the 2009 and current forecasted
costs ($/mmBTU) for natural gas for two specific years addressed in this Site Plan and which
were addressed in the 2009 DSM goals-setting: 2015 and 2019:
Year 2009 Forecast Current Forecast2015 $9.64 $4.262019 $12.63 $6.15
As shown from these values, natural gas prices are currently forecast to be less than 50% of
what they were forecast to be in 2009 when DSM goals were last set. Although lower
forecasted natural gas costs are a very good thing for FPL’s customers, lower fuel costs also
result in lower potential fuel savings benefits from the kWh reductions of DSM measures.
These lowered benefit values result in DSM being less cost-effective.
Florida Power & Light Company 62

A second factor contributing to the decline in the cost-effectiveness of utility DSM is the
steadily increasing efficiency with which FPL generates electricity. FPL’s generating system
has steadily gotten more efficient in regard to its ability to generate electricity using less fossil
fuel. For example, FPL used 20% less fossil fuel to generate the same number of kwh in 2012
than it did in 2001. This is a very good thing for FPL’s customers because it helps to
significantly lower fuel costs.
The improvements in generating system efficiency affect DSM cost-effectiveness in much the
same way that lower forecasted fuel costs do: both lower the fuel costs of energy delivered to
FPL’s customers. Therefore, the improvements in generating system efficiency further reduce
the potential fuel savings benefits from the kWh reduction impacts of DSM, thus lowering
potential DSM benefits and DSM cost-effectiveness.
A third factor for declining cost-effectiveness of utility DSM is due to significant changes in
projected carbon dioxide (CO2) compliance costs. For example, comparing CO2 compliance
forecasts with those forecasted in 2009 – the year when FPL’s DSM Goals were last set by
the FPSC – shows that current forecasted compliance costs are much lower than those
forecasted in 2009, particularly in the near-term. This can be seen by comparing the 2009 and
current forecasted costs ($/ton) for two specific years addressed in this Site Plan and which
were addressed in the 2009 DSM goals-setting: 2015 and 2019:
Year 2009 Forecast Current Forecast2015 $17.00 $0.002019 $25.00 $0.00
(FPL’s current forecast does not project non-zero CO2 compliance costs until the year 2023.)
While lower forecasted CO2 compliance costs are again a good thing for FPL’s customers,
lower compliance costs also result in lower compliance cost savings benefits from the kWh
reductions of DSM measures. These lower potential DSM benefits again result in lowering
DSM cost-effectiveness.
Each of these three factors discussed above – lower forecasted fuel costs, greater efficiency
in FPL’s electricity generation, and lower forecasted CO2 compliance costs – are good for
FPL’s customers because they will result in lower electric rates. Although good for FPL’s
customers, these factors also contribute to lowering the cost-effectiveness of utility DSM
programs. Therefore, these factors (and other factors not discussed above), plus the growing
impacts of energy efficiency codes and standards, lead to FPL’s resource plan showing a
diminished role for utility DSM.
Florida Power & Light Company 63

5. FPL’s Increasing Dependence On DSM Resources to Maintain System Reliability:
As discussed earlier in section III.A of this chapter, FPL’s 2011, 2012, and 2013 Site Plans
each projected that FPL’s system was becoming increasingly dependent upon DSM resources
to maintain system reliability. FPL’s analyses of this projected trend showed that, from an
operational perspective, there can be significant differences between resources plans on the
peak day even though the resource plans have identical total reserve margins. For this
reason, FPL has begun using a 10% minimum generation-only reserve margin (GRM) in its
resource planning work to complement its existing 20% total reserve margin and 0.1 day/year
LOLP reliability criteria. FPL will begin applying the GRM criterion in the year 2019.
6. The Schedule for the New Turkey Point Nuclear Units 6 & 7:
At the time the 2014 Site Plan is being finalized, the schedule for the project is under review.
Several items will be considered that potentially influence the project schedule, including the
Nuclear Regulatory Commission’s (NRC’s) schedule for reviewing the Combined Operating
License Application (COLA), the impacts of the recently amended nuclear cost recovery
clause (NCRC) statute, and the ongoing feasibility analyses that are part of the NCRC
process.
7. Environmental Regulation and/or Legislation:
The seventh factor is environmental regulation. As developments occur in regard to either new
environmental regulations, and/or in how environmental regulations are interpreted and
applied, the potential exists for such developments to affect FPL’s resource plan that is
presented in this document. For example, FPL is aware of potential impacts to generating
units of recent EPA changes to the National Ambient Air Quality Standards that include
shorter duration 1-hour standards for nitrogen dioxide (NO2) and sulfur dioxide (SO2). As a
consequence, FPL filed in mid-2013 for FPSC approval to recover costs through the
environmental cost recovery clause for removing all of its existing gas turbines (GTs) and
partially replacing that peaking unit capacity with new combustion turbines (CTs). Although
FPL withdrew its filing in December 2014 pending further analyses including on-site
monitoring, FPL believes that the results of the monitoring and analyses will require that the
Broward GTs be replaced. Therefore, FPL is currently projecting the retirement of all GTs in
Broward County; i.e., at its existing Lauderdale and Port Everglades plant sites (a decrease in
generating capacity of 1,260 MW Summer), and the installation of 5 new 201 MW CTs at its
existing Lauderdale plant site (an increase of 1,005 MW Summer), both by the end of 2018.
Florida Power & Light Company 64

8. Possible establishment of a Florida standard for renewable energy or clean energy:
Although no such legislation has been enacted to-date, Renewable Portfolio Standards (RPS)
or Clean Energy Portfolio Standard (CPS) legislation, or other legislative initiatives regarding
renewable or clean energy contributions, may occur in the future at either the state or national
level. If such legislation is enacted, FPL would then determine what steps need to be taken to
address the legislation.
Each of these 8 factors will continue to be examined in FPL’s on-going resource planning work
during the rest of 2014 and in future years.
III.D Demand Side Management (DSM) FPL has sought out and implemented cost-effective DSM programs since 1978 and DSM has
been a key focus of FPL’s IRP process for decades. During that time FPL’s DSM programs have
included numerous energy efficiency and load management initiatives. FPL’s DSM efforts through
2013 have resulted in a cumulative Summer peak reduction of approximately 4,753 MW (Summer)
at the generator and an estimated cumulative energy saving of approximately 66,782 Gigawatt
Hour (GWh) at the generator. After accounting for the 20% total reserve margin requirement,
FPL’s DSM efforts through 2013 have eliminated the need to construct the equivalent of
approximately 14 new 400 MW power plants.
FPL has consistently been among the leading utilities nationally in DSM achievement. For
example, according to the U.S. Department of Energy’s 2012 data (the last year for which the
DOE data was available at the time this Site Plan is being developed), FPL ranked # 2 nationally
in cumulative DSM demand reduction. And, importantly, FPL has achieved these significant DSM
accomplishments while minimizing the DSM-based impact on electric rates for all of its customers.
In 2014, new DSM Goals for the years 2015 through 2024 will be set for FPL by the FPSC. As part
of this goals-setting process, FPL must propose new DSM Goals for this time period based on its
most recent resource planning analyses. The results of those analyses are reflected in this 2014
Site Plan and FPL is filing its proposed new DSM Goals on April 2, 2014 (i.e., one day after the
2014 Site Plan is filed). As discussed in the previous section of this chapter, two factors have
influenced the analyses that led to the amount of DSM that FPL is proposing as its new DSM
Goals: (i) increased energy efficiency that will be delivered to FPL’s customers through Federal
and state energy efficiency codes and standards; and (ii) a decline in the projected cost-
effectiveness of DSM measures.
Based on these factors and FPL’s most recent resource planning analyses, FPL is proposing that
its DSM Goals be set at 337 MW of Summer MW reduction. After accounting for the 20% total
Florida Power & Light Company 65

reserve margin requirements, this represents the elimination of the need to construct the
equivalent of another 400 MW power plant. The resource plan presented in this 2014 Site Plan
accounts for the proposed amount of annual DSM implementation through the year 2023 and the
DSM contribution is shown in Schedules 7.1 and 7.2 that appear later in this chapter. The FPSC is
expected to make its decision regarding what FPL’s DSM Goals will be for 2015 through 2024
later this year.
III.E Transmission Plan
The transmission plan will allow for the reliable delivery of the required capacity and energy to
FPL’s retail and wholesale customers. The following table presents FPL’s proposed future
additions of 230 kV bulk transmission lines that must be certified under the Transmission Line
Siting Act.
Table III.E.1: List of Proposed Power Lines
(1)
Line Ownership
(2)
Terminals (To)
(3)
Terminals (From)
(4) Line
Length CKT. Miles
(5) Commercial In-Service
Date (Mo/Yr)
(6) Nominal Voltage
(KV)
(7)
Capacity (MVA)
FPL St. Johns 1/ Pringle 25 Dec – 18 230 759
FPL Manatee 2/ Bob White 30 Dec – 14 230 1195
1/ Final order certifying the corridor was issued on April 21, 2006. This project is to be completed in two phases. Phase I
consisted of 4 miles of new 230 kV line (Pringle to Pellicer) and was completed in May-2009. Phase II consists of 21 miles
of new 230 kV line (St. Johns to Pellicer) and is scheduled to be completed by Dec-2018.
2/ Final order certifying the corridor was issued on November 6, 2008. This project consists of 30 miles of new 230 kV line
(Manatee to Bob White) and is scheduled to be completed by Dec-2014
In addition, there will be transmission facilities needed to connect several of FPL’s projected
generating capacity additions to the system transmission grid. These transmission facilities
(described on the following pages) are for the Port Everglades modernization, the planned
Lauderdale gas turbine replacements, and the planned new nuclear capacity addition at the
Turkey Point site from Turkey Point Units 6 & 7.5 Please see discussion in the Turkey Point
Preferred Site section, subsection r, of the possibility of a transmission corridor/land swap
between FPL and the National Park Service. At the time the 2014 Site Plan is being prepared, no
5 Please see discussion in the Turkey Point Preferred Site section, subsection r of the possibility of a transmission corridor/land sway between FPL and National Park Service.
Florida Power & Light Company 66

site has been selected for the planned addition of a CC unit in 2019. Therefore, no transmission
information for this new unit is presented.
II.E.1 Transmission Facilities for Port Everglades Next Generation Clean Energy Center (Modernization) The work required to connect the Port Everglades Next Generation Clean Energy Center in 2016
to the FPL grid is projected to be:
I. Substation:
1. Construct two string busses to connect two combustion turbines (CT) to the Port Everglades
138 kV Substation.
2. Construct two string busses to connect one CT, and one steam turbine (ST) to the Port
Everglades 230 kV Substation.
3. Add four main step-up transformers (3-450 MVA, 1- 580 MVA), one for each CT, and one for
the ST.
4. Replace ten (10) 138 kV breakers.
5. Replace eight (8) 230 kV breakers.
6. At Port Everglades Switchyard replace twenty-two 138 kV disconnect switches. Also upgrade
associated jumpers, bus work, and equipment connections.
7. Expand switchyard relay vault and add relays and other protective equipment.
II. Transmission: 1. Upgrade of existing transmission facilities:
• An ampacity upgrade up to 1905 amps on the Port Everglades-Port Everglades Tap
138kV line section.
• An ampacity upgrade up to 1905 amps on the Port Everglades Tap-Port Everglades Tap 2
138 kV line section.
• An ampacity upgrade up to 1695 amps on the Port Everglades Tap 1-Dania 138 kV line
section.
• An ampacity upgrade up to 1695 amps on the Dania-Hollywood 138 kV line section.
Florida Power & Light Company 67

III.E.2 Transmission Facilities for the Lauderdale GT Replacement Project The work required to connect the five Lauderdale combustion turbines (CT) in 2018 to the FPL
grid is projected to be:
I. Substation:
1. Construct a collector switchyard for the five (5) CTs at Lauderdale Plant.
2. Install five (5) main step-up transformers (5 - 320 MVA), one for each CT.
3. Construct one 230 kV collector buss to connect two (2) CT step-up transformers to collector
switchyard.
4. Construct one 138 kV collector buss to connect two (2) CT step-up transformers to collector
switchyard.
5. Construct Cable Termination Structures (CTS) in the collector switchyard and the Lauderdale
138 kV Substation to connect the 138 kV collector buss for the two CTs to the Lauderdale 138
kV Substation Outside Bus.
6. Construct CTS in the collector switchyard and the Lauderdale 138 kV Substation to connect
the fifth CT to the Lauderdale 138 kV Substation Inside Bus.
7. Add relays and other protective equipment.
II. Transmission: 1. Construct overhead 230 kV string bus to connect the 230 kV collector buss to the Lauderdale
230 kV Substation Inside Bus.
2. Construct two (2) underground 138 kV cables connecting the collector switchyard to the
Lauderdale Substation Inside and Outside Busses.
Florida Power & Light Company 68

III.E.3 Transmission Facilities for Turkey Point Nuclear Unit 6
The work required to connect the Turkey Point Nuclear Unit 6 by Summer 2022 to the FPL grid is
projected to be:
I. Substation:
1. Build new Clear Sky 500/230kV Switchyard with six (6) bays on the 230 kV section for
generator main step-up transformer connection, reserve auxiliary transformer connections,
four (4) 230 kV line terminals, two (2) autotransformers and two (2) 500 kV line terminals.
2. At Turkey Point Switchyard add a new bay to accommodate the Turkey Point-Clear Sky 230
kV line terminal.
3. At Pennsuco Substation install a fourth line terminal to accommodate the Pennsuco-Clear Sky
230 kV line by converting the ring bus to a breaker and a half scheme and adding four (4) 230
kV breakers.
4. At Davis Substation construct two (2) new 230kV line terminals for the Clear Sky-Davis 230 kV
line and the Davis-Miami 230 kV line.
5. At Levee Substation expand 500 kV section to accommodate the two (2) Levee-Clear Sky 500
kV lines.
6. At Andytown Substation install two (2) 5-Ohm inductors combined with external shunt
capacitors on the 230kV side of the 500/230 autotransformers (one per auto).
7. At Miami Substation expand the 230kV section to a double bus configuration and add a new
230kV line terminal for Davis line and replace one (1) autotransformer.
8. Breaker replacements:
Flagami Substation – Replace five (5) 230 kV breakers and three (3) 138 kV breakers
Miami Substation – Replace one (1) 230 kV breaker and four (4) 138 kV breakers
Davis Substation - Replace two (2) 230 kV breakers
II. Transmission: 1. FPL will design and construct two (2) 500kV transmission lines from the new Clear Sky
Substation to the existing FPL Levee 500kV Substation switchyard. The lines will be
approximately 43 miles long.
2. Construct a new Clear Sky-Davis 230kV line (approximately 19 miles) with a rating of 2990
Amperes.
3. Construct a new Clear Sky-Pennsuco 230kV line (approximately 52 miles) with a rating of
2990 Amperes.
4. Construct a new Davis-Miami 230kV line (approximately 18 miles) with a rating of 2297
Amperes.
5. Construct a new Clear Sky-Turkey Point 230kV line (approximately 0.5 miles) with a rating of
2990 Amperes.
Florida Power & Light Company 69

III.E.4 Transmission Facilities for Turkey Point Nuclear Unit 7
The work required to connect the Turkey Point Nuclear Unit 7 by Summer 2023 to the FPL grid is
projected to be:
I. Substation:
1. At Gratigny Substation install a second 230/138 kV autotransformer with one (1) 230 kV
breaker and one (1) 138 kV breaker.
2. At Davis Substation construct a switch-able inductor to be installed on the Davis-Miami 230 kV
line.
3. At Flagami Substation install a small inductor on one end of the Flagami-Miami 230kV #2
circuit.
4. Breaker replacements:
Dade Substation - Replace seven (7) 230 kV breakers
Court Substation – Replace one (1) 138 kV breaker.
II. Transmission: 1. The transmission line facilities required for Turkey Point Unit 7 will be constructed with the
transmission line facilities needed for Turkey Point Unit 6, as described above in section III.
E.3.
Florida Power & Light Company 70

III.F. Renewable Resources
FPL has been the leading Florida utility in examining ways to effectively utilize renewable energy
technologies to serve its customers. FPL has been involved since 1976 in renewable energy
research and development and in facilitating the implementation of various renewable energy
technologies. For purposes of discussing FPL’s renewable energy efforts in this document, those
efforts will be placed into five categories.
Two of these categories are Supply-Side Efforts – Power Purchases, and Supply-Side Efforts –
FPL Facilities. Since 2011, the energy (MWh) total output from these renewable energy sources
has been greater than the energy produced from oil-fired generation. The renewable energy
information is presented in Schedule 11.1, and the oil-based energy information is presented in
Schedule 6.1 and in Schedule 11.1. Both of these schedules are presented at the end of this
chapter.
1) Early Research & Development Efforts:
FPL assisted the Florida Solar Energy Center (FSEC) in the late 1970s in demonstrating the
first residential photovoltaic (PV) system east of the Mississippi. This PV installation at FSEC’s
Brevard County location was in operation for over 15 years and provided valuable information
about PV performance capabilities in Florida on both a daily and annual basis. FPL later
installed a second PV system at the FPL Flagami substation in Miami. This 10-kilowatt (kW)
system was placed into operation in 1984. (The system was removed in 1990 at the
conclusion of the PV testing to make room for substation expansion.)
For a number of years, FPL maintained a thin-film PV test facility located at the FPL Martin
Plant Site. This FPL PV test facility was used to test new thin-film PV technologies and to
identify design, equipment, or procedure changes necessary to accommodate direct current
electricity from PV facilities into the FPL system. Although this testing has ended, the site
became the home for PV capacity which was installed as a result of other FPL renewable
energy initiatives.
2) Demand Side & Customer Efforts:
In terms of utilizing renewable energy sources to meet its customers’ needs, FPL initiated the
first utility-sponsored conservation program in Florida designed to facilitate the implementation
of solar technologies by its customers. FPL’s Conservation Water Heating Program, first
implemented in 1982, offered incentive payments to customers who chose solar water
heaters. Before the program ended (due to the fact that it was no longer projected to be cost-
Florida Power & Light Company 71

effective), FPL paid incentives to approximately 48,000 customers who installed solar water
heaters.
In the mid-1980s, FPL introduced another renewable energy program, FPL’s Passive Home
Program. This program was created in order to broadly disseminate information about passive
solar building design techniques which are most applicable in Florida’s climate. As part of this
program, three Florida architectural firms created complete construction blueprints for six
passive home designs with the assistance of the FSEC and FPL. These designs and
blueprints were available to customers at a low cost. During its existence, this program was
popular and received a U.S. Department of Energy award for innovation. The program was
eventually phased out due to a revision of the Florida Model Energy Building Code (Code).
This revision was brought about in part by FPL’s Passive Home Program. The revision
incorporated into the Code was one of the most significant passive design techniques
highlighted in the program: radiant barrier insulation.
In early 1991, FPL received approval from the FPSC to conduct a research project to evaluate
the feasibility of using small PV systems to directly power residential swimming pool pumps.
This research project was completed with mixed results. Some of the performance problems
identified in the test were deemed to be solvable, particularly when new pools are constructed.
However, challenges included the significant percentage of sites with unacceptable shading
and various customer satisfaction issues.
FPL has since continued to analyze and promote the utilization of PV. These efforts have
included PV research, development, and education, as well as development and
implementation of the FPL Next Generation Solar Station Program. This initiative also
delivers teacher training and curriculum that is tied to the Sunshine Teacher Standards in
Florida. The program provides teacher grants to promote and fund projects in the classrooms.
In addition, FPL assists customers who are interested in installing PV equipment at their
facilities. Consistent with Florida Administrative Code Rule 25-6.065, Interconnection and Net
Metering of Customer-Owned Renewable Generation, FPL works with customers to
interconnect these customer-owned PV systems. Through December 2013, approximately
2,565 customer systems (predominantly residential) have been interconnected.
As part of its 2009 DSM Goals decision, the FPSC imposed a requirement for Florida’s
investor-owned utilities to spend up to a set, not-to-exceed amount of money annually to
facilitate demand side solar water heater and PV applications. FPL’s not-to-exceed amount of
money for these applications is approximately $15.5 million per year through 2014. In regard
Florida Power & Light Company 72

to this direction, FPL received approval from the FPSC in 2011 to initiate a solar pilot portfolio
that consists of three PV-based programs and three solar water heating-based programs, plus
Conservation Research and Development. These programs are currently projected to be
offered through 2014. FPL’s analyses of the results to-date from these programs shows that
none of these programs are projected to be cost-effective using any of the three cost-
effectiveness screening tests used by the State of Florida. The fate of these solar programs,
including their potential replacement with new solar initiatives, will be determined later in 2014
as part of the FPSC’s 2014 DSM Goals docket.
FPL has also been investigating fuel cell technologies through monitoring of industry trends,
discussions with manufacturers, and direct field trials. From 2002 through the end of 2005,
FPL conducted field trials and demonstration projects of Proton Exchange Membrane (PEM)
fuel cells with the objectives of serving customer end-uses while evaluating the technical
performance, reliability, economics, and relative readiness of the PEM technology. The
demonstration projects were conducted in partnership with customers and included five
locations. The research projects were useful to FPL in identifying specific issues that can
occur in field applications and the current commercial viability of this technology. FPL will
continue to monitor the progress of these technologies and conduct additional field
evaluations as significant developments in fuel cell technologies occur.
3) Supply Side Efforts – Power Purchases: FPL has also facilitated renewable energy projects (facilities which burn bagasse, waste
wood, municipal waste, etc.). Firm capacity and energy, and as-available energy, have been
purchased by FPL from these types of facilities. (Please refer to Tables I.B.1, I.B.2, and I.C.1
in Chapter I).
FPL issued Renewable Requests for Proposals (RFPs) in 2007 and 2008 soliciting proposals
to provide firm capacity and energy, and energy only, at or below avoided costs, from
renewable generators. FPL also promptly responds to inquiries for information from
prospective renewable energy suppliers either by e-mail or phone.
On April 22, 2013 in Order No. PSC-13-1064-PAA-EQ, the FPSC approved three 60 MW
power purchase agreements with affiliates of U.S. EcoGen for biomass-fired renewable
energy facilities. These facilities are expected to begin service in 2019, and to begin providing
firm renewable energy and capacity to FPL’s customers in 2021.
With regard to existing contracts that have recently ended, FPL and the Solid Waste Authority
of Palm Beach (SWA) agreed to extend their contract that expired March 31, 2010 for a 20-
Florida Power & Light Company 73

year term beginning in April 1, 2012 through April 1, 2032. However, the SWA refurbished
their generating unit ahead of schedule and, as of January 2012, this unit began delivering
firm capacity to FPL. In 2011, the FPSC approved a contract for an additional 70 MW between
FPL and SWA for a new unit to be constructed and to begin delivering firm capacity and
energy beginning on January 1, 2015. At the end of December 2011, the contract between
FPL and Okeelanta (New Hope) expired. However, Okeelanta continues to deliver energy to
FPL as an as-available, non-firm supplier of renewable energy.
4) Supply Side Efforts – FPL Facilities:
With regard to solar generating facilities, FPL has three such facilities: (i) a 75 MW steam
generation solar thermal facility in Martin County (the Martin Next Generation Solar Energy
Center); (ii) a 25 MW PV electric generation facility in DeSoto County (the DeSoto Next
Generation Solar Energy Center); and (iii) a 10 MW PV electric generation facility in Brevard
County at NASA’s Kennedy Space Center (the Space Coast Next Generation Solar Energy
Center). The DeSoto County project was completed in 2009 and the other two projects were
completed in 2010. These three solar facilities were constructed in response to the Florida
Legislature’s House Bill 7135 which was signed into law by the Governor in June 2008.
House Bill 7135 was enacted to enable the development of clean, zero greenhouse gas
emitting renewable generation in the State of Florida. Specifically, the bill authorized cost
recovery for the first 110 MW of eligible renewable projects that had the proper land, zoning,
and transmission rights in place. FPL’s three solar projects met the specified criteria, and were
granted approval for cost recovery in 2008. Each of the three solar facilities is discussed
below.
a. The Martin Next Generation Solar Energy Center:
This facility began commercial operation in 2010 and provides 75 MW of solar thermal
capacity in an innovative way that directly displaces fossil fuel usage on the FPL system.
This facility consists of solar thermal technology which generates steam that is integrated
into the existing steam cycle for the Martin Unit 8 natural gas-fired CC plant. This project
is the first “hybrid” solar plant in the world, and, at the time the facility came in-service,
was the second largest solar facility in the world and the largest solar plant of any kind in
the U.S. outside of California.
b. The DeSoto Next Generation Solar Energy Center:
This PV facility began commercial operation in 2009 and provides 25 MW of non-firm
capacity and energy, making it one of the largest PV facilities in the U.S. The facility
Florida Power & Light Company 74

utilizes a tracking PV array that is designed to follow the sun as it traverses across the
sky.
c. The Space Coast Next Generation Solar Energy Center:
Located at the Kennedy Space Center, this facility is part of an innovative public/private
partnership with NASA. This non-tracking PV facility began commercial operation in 2010
and provides 10 MW of non-firm capacity and energy.
At the time the 2014 Site Plan is being prepared, FPL considers the output from these
renewable facilities to be “as available,” non-firm energy only. This is due to several factors.
First, the Martin solar thermal facility is a “fuel-substitute” facility, not a facility that provides
additional capacity and energy. The solar thermal facility displaces the use of fossil fuel to
produce steam on the FPL system when the solar thermal facility is operating. Second, in
regard to the two PV facilities, the intermittent nature of the solar resource has made it difficult
to-date to accurately determine what contribution the PV facilities at these specific locations
can consistently make at FPL’s late Summer afternoon and early Winter morning peak load
hours. This is, in part, due to the fact that at least several years worth of Summer and Winter
peak load periods are needed to accurately gauge the actual output of these PV facilities
during system peak hours. FPL is now evaluating what portion, if any, of the PV facilities’
output can be projected as firm capacity at the projected peak hours in FPL’s resource
planning work.
In addition to these three solar facilities, FPL is currently in the process of identifying other
potential sites in the state for central station PV facilities. FPL is evaluating existing FPL
generation sites along with potential Greenfield sites within FPL’s service territory. These
sites are discussed further in Chapter IV.
In regard to PV distributed generation (DG), FPL is planning to implement two PV DG solar
programs in 2014. The first program is a voluntary customer participation program that will be
pursued on a pilot basis. FPL will file for FPSC approval of this program near the April filing
date of the 2014 Site Plan. The second program is designed to research the effects of
increasing PV DG on the FPL system. This program will be introduced later in 2014. A brief
description of the two programs follows.
d. Voluntary, Community-based Solar Partnership Pilot Program
FPL will be filing for FPSC approval of a tariff that provides customers an opportunity to
make voluntary contributions toward the construction of PV facilities on a local level
throughout FPL’s service territory. The pilot program will provide all customers the
Florida Power & Light Company 75

opportunity to support the use of solar energy at a community scale, and is designed to be
especially attractive for customers who do not wish, or are not able, to place solar
equipment on their roof.
d. C&I Solar Partnership Program:
This is also a PV-focused research program that will be conducted in partnership with
interested commercial and industrial (C&I) customers. Limited investments will be made in
rooftop PV facilities in selected geographic areas in order to examine the effect of PV DG
on FPL’s distribution system. FPL will attempt to site these PV facilities in areas where PV
DG already exists to better study feeder loading impacts. The PV facilities will be located
on C&I customer property near the targeted feeders. The objective of the program is to
gather data that will result in a better understanding of the effects of high PV DG
penetrations on FPL’s system.
5) Ongoing Research & Development Efforts:
FPL has developed alliances with several Florida universities to promote development of
emerging technologies. For example, FPL has an alliance has been established with the
newly formed Southeast National Marine Renewable Energy Center (SNMREC) at Florida
Atlantic University (FAU), which will focus on the commercialization of ocean current, ocean
thermal (i.e., energy conversion as well as cold water air conditioning), and hydrogen
technologies. FPL has been supporting FAU with the discussions being held with the U.S.
Department of the Interior’s Minerals Bureau of Ocean Energy Management Regulation and
Enforcement (BOEMRE). BOEMRE is working to establish the permitting process for ocean
energy development on the outer continental shelf.
FPL has also developed a “Living Lab” to demonstrate FPL’s solar energy commitment to
employees and visitors at its Juno Beach office facility. To-date, FPL has installed five
different PV arrays (different technologies) of rooftop PV totaling 24 kW at the Living Lab. In
addition, two PV-covered parking structures with a total of approximately 90 kW of PV are in
use at the FPL Juno office parking lot. Through these Living Lab projects, FPL is able to
evaluate multiple solar technologies and applications for the purpose of developing a
renewable business model resulting in the most cost-effective and reliable uses of solar
energy for FPL’s customers. FPL plans to continue to expand the Living Lab as new solar
products come to market.
FPL has also been in discussions with several private companies on multiple emerging
technology initiatives including ocean current, ocean thermal, hydrogen, fuel cell technology,
biomass, biofuels, and energy storage
Florida Power & Light Company 76

III.G FPL’s Fuel Mix and Fuel Price Forecasts
1. FPL’s Fuel Mix
Until the mid-1980s, FPL relied primarily on a combination of fuel oil, natural gas, and nuclear
energy to generate electricity with significant reliance on oil–fired generation. In the early
1980s, FPL began to purchase “coal-by-wire.” In 1987, coal was first added to the fuel mix
through FPL’s partial ownership (20%) and additional purchases (30%) from the St. Johns
River Power Park (SJRPP). This allowed FPL to meet its customers’ energy needs with a
more diversified mix of energy sources. Additional coal resources were added with the partial
acquisition (76%) of Scherer Unit 4 which began serving FPL’s customers in 1991.
The trend since the early 1990s has been a steady increase in the amount of natural gas that
is used by FPL to provide electricity due, in part, to the introduction of highly efficient and cost-
effective CC generating units and the ready availability of natural gas. Most recently, FPL
placed into commercial operation two new gas-fired CC units at the West County Energy
Center (WCEC) site in 2009. A third new CC unit was added to the WCEC site in 2011. In
addition, FPL finished modernization of its Cape Canaveral and Riviera Beach plant sites and
is currently modernizing its existing Port Everglades plant site by removing the steam
generating units previously on the site and replacing them with one highly efficient new CC
unit. The new CC units at each of these three sites will provide highly efficient generation that
will dramatically improve the efficiency of FPL’s generation system in general and, more
specifically, the efficiency at which natural gas is utilized.
In addition, FPL increased its utilization of nuclear energy through capacity uprates of its four
existing nuclear units. With these uprates, more than 520 MW of additional nuclear capacity
have been added to the FPL system. FPL is also pursuing plans to obtain licenses, permits,
and approvals to construct and operate two new nuclear units at its existing Turkey Point site
that, in total, would add approximately 2,200 MW of new nuclear generating capacity. The
earliest dates by which these two new nuclear units could practically be deployed remain 2022
and 2023, respectively.
In regard to utilizing renewable energy, FPL has a 110 MW of solar generating capacity
through a 75 MW solar thermal steam generating facility at FPL’s existing Martin site, a 25
MW PV facility in DeSoto County, and a 10 MW PV facility in Brevard County. The DeSoto
facility was placed into commercial operation in 2009. The other two solar facilities were
placed into commercial operation in 2010.
Florida Power & Light Company 77

FPL’s future resource planning work will continue to focus on identifying and evaluating
alternatives that would most cost-effectively maintain and/or enhance FPL’s long-term fuel
diversity. These fuel diverse alternatives may include: the purchase of power from renewable
energy facilities, additional FPL-owned renewable energy facilities, obtaining additional access
to diversified sources of natural gas such as liquefied natural gas (LNG) and natural gas from
the Mid-Continent unconventional reserves, preserving FPL’s ability to utilize fuel oil at its
existing units, and increased utilization of nuclear energy. (As previously discussed, new
advanced technology coal generating units are not currently considered as viable options in
Florida in the ten-year reporting period of this document due, in part, to current projections of
relatively small differences in fuel costs between coal and natural gas, significantly higher
capital costs for coal units compared to CC units, greater efficiencies of CC units, and
concerns over environmental regulations that would impact coal units more negatively than
CC units.) The evaluation of the feasibility and cost-effectiveness of these, and other possible
fuel diversity alternatives, will be part of FPL’s on-going resource planning efforts.
FPL’s current use of various fuels to supply energy to customers, plus a projection of this “fuel
mix” through 2023 based on the resource plan presented in this document, is presented in
Schedules 5, 6.1, and 6.2 later in this chapter.
FPL’s Fossil Fuel Cost Forecasts
Fossil fuel price forecasts, and the resulting projected price differentials between fuels, are
major drivers used in evaluating alternatives for meeting future resource needs. FPL’s
forecasts are generally consistent with other published contemporary forecasts. An October
2013 fuel cost forecast was used in the analyses whose results led to the resource plan
presented in this 2014 Site Plan.
Future oil and natural gas prices, and to a lesser extent, coal and petroleum coke prices, are
inherently uncertain due to a significant number of unpredictable and uncontrollable drivers
that influence the short- and long-term price of oil, natural gas, coal, and petroleum coke.
These drivers include U.S. and worldwide demand, production capacity, economic growth,
environmental legislation, and politics.
The inherent uncertainty and unpredictability in these factors today and tomorrow clearly
underscores the need to develop a set of plausible oil, natural gas, and solid fuel (coal and
petroleum coke) price scenarios that will bound a reasonable set of long-term price outcomes.
In this light, FPL developed and utilized Low, Medium, and High price forecasts for fossil fuels
in some of its 2013 and early 2014 resource planning work, particularly in regard to analyses
conducted as part of the nuclear cost recovery filing work.
Florida Power & Light Company 78

FPL’s Medium price forecast methodology is consistent for oil and natural gas. For oil and
natural gas commodity prices, FPL’s Medium price forecast applies the following
methodology:
a. For 2014 through 2015, the methodology used the October 7, 2013 forward curve for
New York Harbor 1% sulfur heavy oil, U. S. Gulf Coast 1% sulfur heavy oil, ultra low
sulfur diesel fuel oil, and Henry Hub natural gas commodity prices;
b. For the next two years (2016 and 2017), FPL used a 50/50 blend of the October 7,
2013 forward curve and the most current projections at the time from The PIRA
Energy Group;
c. For the 2018 through 2030 period, FPL used the annual projections from The PIRA
Energy Group; and,
d. For the period beyond 2030, FPL used the real rate of escalation from the Energy
Information Administration (EIA). In addition to the development of oil and natural gas
commodity prices, nominal price forecasts also were prepared for oil and natural gas
transportation costs. The addition of commodity and transportation forecasts resulted
in delivered price forecasts.
FPL’s Medium price forecast methodology is also consistent for coal and petroleum coke
prices. Coal and petroleum coke prices were based upon the following approach:
a. Delivered price forecasts for Central Appalachian (CAPP), Illinois Basin (IB), Powder
River Basin (PRB), and South American coal and petroleum coke were provided by
JD Energy; and,
b. The coal price forecast for SJRPP and Plant Scherer assume the continuation of the
existing mine-mouth and transportation contracts until expiration, along with the
purchase of spot coal, to meet generation requirements.
The development of FPL’s Low and High price forecasts for oil, natural gas, coal, and
petroleum coke prices were based on the historical volatility of the 12-month forward price,
one year ahead. FPL developed these forecasts to account for the uncertainty which exists
within each commodity as well as across commodities. These forecasts reflect a range of
reasonable forecast outcomes.
3. Natural Gas Storage
FPL was under contract through March 2013 for 2 billion cubic feet (Bcf) of firm natural gas
storage capacity in the Bay Gas storage facility located in Alabama. The Bay Gas storage
Florida Power & Light Company 79

facility is interconnected with the Florida Gas Transmission (FGT) pipeline. Starting on April 1,
2013, FPL entered into a new deal with Bay Gas Storage for one year for 2.5 billion cubic feet
(Bcf) of firm natural gas storage capacity. In December 2013, FPL elected to extend this
transaction for an additional three years which resulted in a lower annual cost for Bay Gas.
FPL has predominately utilized natural gas storage to help mitigate gas supply problems
caused by severe weather and/or infrastructure problems. Over the past several years, FPL
has acquired upstream transportation capacity on several pipelines to help mitigate the risk of
off-shore supply problems caused by severe weather in the Gulf of Mexico. While this
transportation capacity has reduced FPL’s off-shore exposure, a portion of FPL’s supply
portfolio remains tied to off-shore natural gas sources. Therefore, natural gas storage remains
an important tool to help mitigate the risk of supply disruptions. For these reasons, FPL has
typically maintained nearly full natural gas inventory during normal operations from June
through November (hurricane season). From December through March, FPL typically
maintains lower levels of natural gas inventory compared to Summer peak months.
As FPL’s reliance on natural gas has increased, its ability to manage the daily “swings” that
can occur on its system due to weather and unit availability changes has become more
challenging, particularly from oversupply situations. Natural gas storage is a valuable tool to
help manage the daily balancing of supply and demand. From a balancing perspective,
injection and withdrawal rights associated with gas storage have become an increasingly
important part of the evaluation of overall gas storage requirements.
As FPL’s system grows to meet customer needs, it must maintain adequate gas storage
capacity to continue to help mitigate supply and/or infrastructure problems and to provide FPL
the ability to manage its supply and demand on a daily basis. FPL continues to evaluate its
gas storage portfolio and is likely to subscribe for additional gas storage capacity to help
increase reliability, provide the necessary flexibility to respond to demand changes, and
diversify the overall portfolio. 4. Securing Additional Natural Gas:
The recent trend of increasing reliance upon natural gas to produce electricity for FPL’s
customers is projected to continue due to FPL’s growing load. The addition of highly fuel-
efficient CC units at Cape Canaveral and Riviera Beach due to completed modernization
projects, and the on-going Port Everglades modernization project, will serve to reduce the
growth in natural gas use from what it otherwise might have been due to the high fuel-
efficiency levels of these new CC units. However, these efficiency gains do not fully offset the
effects of FPL’s growing load. Therefore, FPL will need to secure more natural gas supply and
more firm gas transportation capacity in the future as fuel requirements dictate. The issue is
Florida Power & Light Company 80

how to secure these additional natural gas resources in a manner that is economical for FPL’s
customers and which maintains and/or enhances the reliability of natural gas supply and
deliverability to FPL’s generating units.
FPL has historically purchased the gas transportation capacity required for new natural gas
supply from two existing natural gas pipeline companies. As more natural gas is delivered
through these two pipelines, the impact of a supply disruption on either pipeline becomes
more problematic. Therefore, FPL issued a Request for Proposals (RFP) in December 2012
for gas transportation capacity to meet FPL’s system natural gas requirements beginning in
2017. The RFP encouraged bidders to propose new gas transportation infrastructure to meet
Florida’s growing need for natural gas. A third pipeline would have benefits for FPL and its
customers by increasing the diversity of FPL’s fuel supply sources, increasing the physical
reliability of the pipeline delivery system, and enhancing competition among pipelines. The
RFP process was completed in June 2013 and the winning bidders, Sabal Trail Transmission,
LLC (Sabal Trail) and Florida Southeast Connection, LLC (FSC), have begun the Federal
Energy Regulatory Commission approval process with a planned in-service date of May 2017.
The contracts with Sabal Trail and FSC were reviewed by the FPSC and were approved for
cost recovery in late 2013. The order approving this cost recovery became final in January
2014. 5. Nuclear Fuel Cost Forecast
This section reviews the various steps needed to fabricate nuclear fuel for delivery to the
nuclear power plants, the method used to forecast the price for each step, and other
comments regarding FPL’s nuclear fuel cost forecast.
a) Steps Required for Nuclear Fuel to be delivered to FPL’s Plants
Four separate steps are required before nuclear fuel can be used in a commercial nuclear
power reactor. These steps are summarized below.
(1) Mining: Uranium is produced in many countries such as Canada, Australia,
Kazakhstan, and the United States. During the first step, uranium is mined from the
ground using techniques such as open pit mining, underground mining, in-situ leaching
operations, or production as a by-product from other mining operations, such as gold,
copper, or phosphate rocks. The product from this first step is the raw uranium delivered
as an oxide, U3O8 (sometimes referred to as yellowcake).
(2) Conversion: During the second step, the U3O8 is chemically converted into UF6
which, when heated, changes into a gaseous state. This second step further removes any
Florida Power & Light Company 81

chemical impurities and serves as preparation for the third step, which requires uranium to
be in a gaseous state.
(3) Enrichment: The third step is called enrichment. Natural uranium contains 0.711% of
uranium at an atomic mass of 235 (U-235) and 99.289% of uranium at an atomic mass of
238 (U-238). FPL’s nuclear reactors use uranium with a higher percentage of up to
almost five percent (5%) of U-235 atoms. Because natural uranium does not contain a
sufficient amount of U-235, the third step increases the percentage amount of U-235 from
0.711% to a level specified when designing the reactor core (typically in a range from
approximately 2.2% to as high as 4.95%). The output of this enrichment process is
enriched uranium in the form of UF6.
(4) Fabrication: During the last step, fuel fabrication, the enriched UF6 is changed to a
UO2 powder, pressed into pellets, and fed into tubes, which are sealed and bundled
together into fuel assemblies. These fuel assemblies are then delivered to the plant site
for insertion in a reactor.
Like other utilities, FPL has purchased raw uranium and the other components of the nuclear
fuel cycle separately from numerous suppliers from different countries.
b) Price Forecasts for Each Step
(1) Mining: The impact of the earthquake and tsunami that struck the Fukushima nuclear
complex in Japan in March 2011 is still being felt in the uranium market. Current demand
has declined and several of the production facilities have announced delays. Factors of
importance are:
• Hedge funds are still very active in the market. This causes more speculative
demand that is not tied to market fundamentals and causes the market price to
move up or down just based on news that might affect future demand.
• Some of the uranium inventory from the U.S. Department of Energy (DOE) is
finding its way into the market periodically to fund cleanup of certain Department
of Energy facilities.
• Although a limited number of new nuclear units are scheduled to start production
in the U.S. during the next 5 to 10 years, other countries, more specifically China,
have announced an increase in construction of new units which may cause
uranium prices to trend up in the near future.
Florida Power & Light Company 82
Over a 10-year horizon, FPL expects the market to be more consistent with market
fundamentals. The supply picture is more stable, with laws enacted to resolve the import
of Russian-enriched uranium, by allowing some imports of Russian-enriched uranium to
meet about 20-25% of needs for currently operating units, but with no restriction on the
first core for new units and no restrictions after 2020. New and current uranium production
facilities continue to add capacity to meet demands. Actual demand tends to grow over
time because of the long lead time to build nuclear units. However, FPL cannot discount
the possibility of future periodic sharp increase in prices, but believes such occurrences
will likely be temporary in nature.
(2) Conversion: The conversion market is also in a state of flux due to the Fukushima
events. Planned production after 2016 is currently forecasted to be insufficient to meet
the higher demand scenario, but it is projected to be sufficient to meet most reference
case scenarios. As with additional raw uranium production, supply will expand beyond
current level once more firm commitments are made including commitments to build new
nuclear units. FPL expects long term price stability for conversion services to support
world demand.
(3) Enrichment: As a result of the Fukushima events in March 2011, the near-term price
of enrichment services has been declining for the last three years. However, plans for
construction of several new facilities that were expected to come on-line in the next few
years have been delayed. Also, some of the existing high operating cost diffusion plants
have shut down. As with supply for the other steps of the nuclear fuel cycle, expansion of
future capacity is feasible within the lead time for constructing new nuclear units and any
other projected increase in demand. Meanwhile, world supply and demand will continue
to be balanced such that FPL expects adequate supply of enrichment services. The
current supply/demand profile will most likely result in the price of enrichment services
remaining stable or declining for the next few years before starting to increase.
(4) Fabrication: Because the nuclear fuel fabrication process is highly regulated by the
Nuclear Regulatory Commission (NRC), not all production facilities can qualify as
suppliers to nuclear reactors in the U.S. Although world supply and demand is expected to
show significant excess capacity for the foreseeable future, the gap is not as wide for U.S.
supply and demand. The supply for the U.S. market is expected to be sufficient to meet
U.S. demand for the foreseeable future.
Florida Power & Light Company 83

c) Other Comments Regarding FPL’s Nuclear Fuel Cost Forecast
FPL’s nuclear fuel price forecasts are the result of FPL’s analysis based on inputs from
various nuclear fuel market expert reports and studies. The calculations for the nuclear
fuel cost forecasts used in FPL’s 2013 and early 2014 resource planning work were
performed consistent with the method then used for FPL’s Fuel Clause filings, including
the assumption of refueling outages every 18 months and plant operation at power uprate
levels. The costs for each step to fabricate the nuclear fuels were added to come up with
the total costs of the fresh fuel to be loaded at each refueling (acquisition costs). The
acquisition cost for each group of fresh fuel assemblies were then amortized over the
energy produced by each group of fuel assemblies. FPL also added 1 mill per kilowatt
hour net to reflect payment to DOE for spent fuel disposal.
Florida Power & Light Company 84

Fuel Requirements Units 2012 2013 2014 2015 2016 2017 2018 2019 2020 2021 2022 2023
(1) Nuclear Trillion BTU 188 273 298 300 306 303 300 306 302 300 357 455
(2) Coal 1,000 TON 2,692 3,540 3,414 3,778 2,124 3,076 3,574 3,791 3,835 3,803 3,756 3,756
(3) Residual (FO6) - Total 1,000 BBL 459 150 715 1,130 1,139 561 546 164 176 188 111 52 (4) Steam 1,000 BBL 459 150 715 1,130 1,139 561 546 164 176 188 111 52
(5) Distillate (FO2) - Total 1,000 BBL 23 152 37 35 226 61 293 247 284 282 184 126 (6) Steam 1,000 BBL 4 0 0 0 0 0 0 0 0 0 0 0 (7) CC 1,000 BBL 15 140 7 30 88 6 186 144 160 153 100 76 (8) CT 1,000 BBL 4 12 30 6 139 56 107 104 124 129 84 51
(9) Natural Gas - Total 1,000 MCF 595,396 550,350 550,782 544,663 584,056 578,902 581,638 580,361 596,131 600,152 570,533 518,693 (10) Steam 1,000 MCF 46,112 30,348 4,413 8,395 10,562 9,343 8,967 2,912 3,104 3,280 2,021 1,001 (11) CC 1,000 MCF 546,386 514,793 544,967 534,847 571,277 567,674 568,822 575,025 590,083 593,852 566,719 516,379 (12) CT 1,000 MCF 2,899 5,208 1,403 1,421 2,216 1,884 3,849 2,424 2,944 3,020 1,793 1,313
1/ Source: A Schedules.Note: Solar contributions are provided on Schedules 6.1 and 6.2.
Actual 1/ Forecasted
Schedule 5Fuel Requirements
(for FPL only)
Florida Power & Light Company 85

Energy Sources Units 2012 2013 2014 2015 2016 2017 2018 2019 2020 2021 2022 2023
(1) Annual Energy GWH 5,186 4,445 3,539 3,876 2,165 2,316 2,640 962 0 0 0 0Interchange 2/
(2) Nuclear GWH 16,916 25,243 27,792 27,981 28,593 28,279 27,959 28,550 28,177 27,971 33,464 42,915
(3) Coal GWH 4,745 5,981 6,020 6,662 3,827 5,486 6,488 6,850 6,923 6,867 6,778 6,779
(4) Residual(FO6) -Total GWH 378 75 437 722 684 333 327 104 111 118 69 32 (5) Steam GWH 378 75 437 722 684 333 327 104 111 118 69 32
(6) Distillate(FO2) -Total GWH 54 120 13 26 104 17 208 177 203 200 131 91 (7) Steam GWH 2 2 0 0 0 0 0 0 0 0 0 0 (8) CC GWH 49 114 6 25 72 5 148 115 128 122 80 60 (9) CT GWH 4 5 7 1 32 12 60 63 75 78 51 31
(10) Natural Gas -Total GWH 80,505 75,208 78,228 77,979 84,154 83,812 84,144 84,899 87,546 88,092 83,914 76,379 (11) Steam GWH 5,543 2,472 381 724 932 817 789 249 267 283 172 84 (12) CC GWH 74,668 72,308 77,722 77,131 83,029 82,833 82,978 84,412 86,994 87,519 83,567 76,167 (13) CT GWH 295 428 125 124 194 163 377 238 285 291 176 129
(14) Solar 3/ GWH 159 155 191 176 195 194 194 194 194 188 192 192 (15) PV GWH 71 68 72 71 71 70 70 69 69 68 68 67 (16) Solar Thermal GWH 89 87 119 104 125 124 124 124 125 119 124 124
(17) Other 4/ GWH 2,922 428 1,782 4,185 4,220 4,475 4,435 5,936 6,032 6,015 5,967 5,968------------------------------------------ --------- --------- --------- --------- --------- --------- --------- --------- --------- --------- --------- ---------Net Energy For Load 5/ GWH 110,866 111,656 118,002 121,606 123,942 124,914 126,395 127,670 129,184 129,451 130,515 132,356
1/ Source: A Schedules and Actual Data for Next Generation Solar Centers Report2/ The projected figures are based on estimated energy purchases from SJRPP, the Southern Companies (UPS contract), and other utilities.3/ Represents output from FPL's PV and solar thermal facilities.4/ Represents a forecast of energy expected to be purchased from Qualifying Facilities, Independent Power Producers, net of
Economy and other Power Sales.5/ Net Energy For Load values for the years 2014- 2023 are also shown in Col. (19) on Schedule 2.3.
Actual 1/ Forecasted
Schedule 6.1Energy Sources
Florida Power & Light Company 86

Energy Source Units 2012 2013 2014 2015 2016 2017 2018 2019 2020 2021 2022 2023
(1) Annual Energy % 4.7 4.0 3.0 3.2 1.7 1.9 2.1 0.8 0.0 0.0 0.0 0.0Interchange 2/
(2) Nuclear % 15.3 22.6 23.6 23.0 23.1 22.6 22.1 22.4 21.8 21.6 25.6 32.4
(3) Coal % 4.3 5.4 5.1 5.5 3.1 4.4 5.1 5.4 5.4 5.3 5.2 5.1
(4) Residual (FO6) -Total % 0.3 0.1 0.4 0.6 0.6 0.3 0.3 0.1 0.1 0.1 0.1 0.0 (5) Steam % 0.3 0.1 0.4 0.6 0.6 0.3 0.3 0.1 0.1 0.1 0.1 0.0
(6) Distillate (FO2) -Total % 0.0 0.1 0.0 0.0 0.1 0.0 0.2 0.1 0.2 0.2 0.1 0.1 (7) Steam % 0.0 0.0 0.0 0.0 0.0 0.0 0.0 0.0 0.0 0.0 0.0 0.0 (8) CC % 0.0 0.1 0.0 0.0 0.1 0.0 0.1 0.1 0.1 0.1 0.1 0.0 (9) CT % 0.0 0.0 0.0 0.0 0.0 0.0 0.0 0.0 0.1 0.1 0.0 0.0
(10) Natural Gas -Total % 72.6 67.4 66.3 64.1 67.9 67.1 66.6 66.5 67.8 68.1 64.3 57.7 (11) Steam % 5.0 2.2 0.3 0.6 0.8 0.7 0.6 0.2 0.2 0.2 0.1 0.1 (12) CC % 67.3 64.8 65.9 63.4 67.0 66.3 65.7 66.1 67.3 67.6 64.0 57.5 (13) CT % 0.3 0.4 0.1 0.1 0.2 0.1 0.3 0.2 0.2 0.2 0.1 0.1
(14) Solar 3/ % 0.1 0.1 0.2 0.1 0.2 0.2 0.2 0.2 0.1 0.1 0.1 0.1 (15) PV % 0.1 0.1 0.1 0.1 0.1 0.1 0.1 0.1 0.1 0.1 0.1 0.1 (16) Solar Thermal % 0.1 0.1 0.1 0.1 0.1 0.1 0.1 0.1 0.1 0.1 0.1 0.1
(17) Other 4/ % 2.6 0.4 1.5 3.4 3.4 3.6 3.5 4.6 4.7 4.6 4.6 4.5100 100 100 100 100 100 100 100 100 100 100 100
1/ Source: A Schedules and Actual Data for Next Generation Solar Centers Report2/ The projected figures are based on estimated energy purchases from SJRPP, the Southern Companies (UPS contract), and other utilities.3/ Represents output from FPL's PV and solar thermal facilities.4/ Represents a forecast of energy expected to be purchased from Qualifying Facilities, Independent Power Producers, net of
Economy and other Power Sales.
Actual 1/ Forecasted
Schedule 6.2Energy Sources % by Fuel Type
Florida Power & Light Company 87

(1) (2) (3) (4) (5) (6) (7) (8) (9) (10) (11) (12) (13) (14) (15) (16)
Total FirmFirm Firm Firm Firm Total Summer
Installed Capacity Capacity Firm Capacity Peak Peak Scheduled
August of Capacity Import Export QF Available Demand DSM Demand MaintenanceYear MW MW MW MW MW MW MW MW MW % of Peak MW MW % of Peak MW % of Peak
2014 25,488 1,303 0 635 27,426 22,768 1,992 20,777 6,649 32.0 826 5,823 28.0 3,831 16.82015 25,121 1,450 0 595 27,165 23,356 2,057 21,298 5,867 27.5 0 5,867 27.5 3,810 16.32016 26,358 522 0 595 27,474 23,778 2,082 21,696 5,779 26.6 0 5,779 26.6 3,697 15.52017 25,962 522 0 595 27,078 24,190 2,108 22,082 4,996 22.6 0 4,996 22.6 2,888 11.92018 25,916 485 0 595 26,996 24,544 2,136 22,408 4,587 20.5 0 4,587 20.5 2,452 10.02019 26,930 110 0 595 27,635 24,896 2,165 22,731 4,904 21.6 0 4,904 21.6 2,739 11.02020 26,930 239 0 595 27,764 25,239 2,195 23,044 4,720 20.5 0 4,720 20.5 2,524 10.02021 26,930 278 0 775 27,983 25,439 2,227 23,212 4,770 20.6 0 4,770 20.6 2,544 10.02022 28,117 110 0 775 29,002 25,908 2,259 23,649 5,353 22.6 0 5,353 22.6 3,094 11.92023 29,272 110 0 775 30,157 26,528 2,292 24,236 5,921 24.4 0 5,921 24.4 3,628 13.7
Reserve
Margin After
Schedule 7.1Forecast of Capacity, Demand, and Scheduled
Maintenance At Time Of Summer Peak
TotalReserve
Maintenance
Generation Reserve
MarginMaintenance
Margin Before
Col. (2) represents capacity additions and changes projected to be in-service by June 1st. These MW are generally considered to be available to meet Summer peak loads which are forecasted to occur during August of the year indicated.Col. (6) = Col.(2) + Col.(3) - Col.(4) + Col.(5).Col. (7) reflects the 2013 load forecast without incremental DSM or cumulative load management. Col. (8) represents cumulative load management capability, plus incremental conservation,and load management, from 9/2013-on intended for use with the 2013 load forecast.Col. (10) = Col. (6) - Col. (9)Col. (11) = Col.(10) / Col.(9)Col. (12) indicates the capacity of units projected to be out-of-service for planned maintenance during the Summer peak period; i.e., Martin Unit 2's planned outage in Summer 2014 for the installation of electrostatic precipitators.Col. (13) = Col. (10) - Col. (12)Col. (14) = Col.(13) / Col.(9)Col. (15) =Col. (6) - Col. (7)Col. (16) = Col.(15) / Col.(7)
Florida Power & Light Company 88

(1) (2) (3) (4) (5) (6) (7) (8) (9) (10) (11) (12) (13) (14) (15) (16)
Total FirmFirm Firm Firm Firm Total Winter
Installed Capacity Capacity Firm Capacity Peak Peak ScheduledJanuary of Capability Import Export QF Available Demand DSM Demand Maintenance
Year MW MW MW MW MW MW MW MW MW % of Peak MW MW % of Peak MW % of Peak
2014 25,671 1,311 0 635 27,617 19,875 1,502 18,373 9,243 50.3 832 8,411 45.8 6,910 34.82015 26,597 1,458 0 595 28,649 20,971 1,530 19,442 9,208 47.4 0 9,208 47.4 7,678 36.62016 26,653 530 0 595 27,777 21,490 1,543 19,947 7,831 39.3 0 7,831 39.3 6,287 29.32017 27,601 530 0 595 28,725 21,731 1,558 20,173 8,552 42.4 0 8,552 42.4 6,994 32.22018 27,557 493 0 595 28,645 21,968 1,573 20,396 8,249 40.4 0 8,249 40.4 6,676 30.42019 27,295 493 0 595 28,383 22,180 1,588 20,592 7,790 37.8 0 7,790 37.8 6,203 28.02020 28,724 239 0 595 29,558 22,383 1,603 20,780 8,777 42.2 0 8,777 42.2 7,174 32.12021 28,724 278 0 775 29,777 22,584 1,619 20,966 8,811 42.0 0 8,811 42.0 7,192 31.82022 28,724 110 0 775 29,609 22,601 1,634 20,967 8,642 41.2 0 8,642 41.2 7,007 31.02023 29,910 110 0 775 30,795 22,891 1,651 21,241 9,554 45.0 0 9,554 45.0 7,903 34.5
Total
Maintenance Generation Reserve
Margin
Schedule 7.2Forecast of Capacity , Demand, and Scheduled
Maintenance At Time of Winter Peak
MaintenanceMargin Before
Reserve ReserveMargin After
Col. (2) represents capacity additions and changes projected to be in-service by January 1st. These MW are generally considered to be available to meet winter peak loads which are forecasted to occur during January of the year indicated.Col. (6) = Col.(2) + Col.(3) - Col.(4) + Col.(5).Col. (7) reflects the 2013 load forecast without incremental DSM or cumulative load management. 2013 load is an actual load value.Col. (8) represents cumulative load management capability, plus incremental conservation and load management,, from 9/2013-on intended for use with the 2013 load forecast.Col. (10) = Col. (6) - Col. (9)Col. (11) = Col.(10) / Col.(9)Col. (12) indicates the capacity of units projected to be out-of-service for planned maintenance during the Winter peak period; i.e., Martin Unit 1's planned outage during the Winter of 2014 for the installation of electrostatic precipitators.Col. (13) = Col. (10) - Col. (12)Col. (14) = Col.(13) / Col.(9)Col. (15) =Col. (6) - Col. (7)Col. (16) = Col.(15) / Col.(7)
Florida Power & Light Company 89

Page 1 of 2
(2) (3) (4) (5) (5) (7) (8) (9) (10) (11) (12) (13) (14) (15)
Const. Comm. Expected Gen. Max.Unit Unit Start In-Service Retirement Nameplate Winter Summer
Plant Name No. Location Type Pri. Alt. Pri. Alt. Mo./Yr. Mo./Yr. Mo./Yr. KW MW MW StatusADDITIONS/ CHANGES
2014Sanford CT Upgrade 5B Volusia County CC NG No PL No Aug-13 Sep-13 Unknown 188,190 10 9 OT
Turkey Point CT Upgrade 5A Miami Dade County CC NG FO2 PL TK --- Mar-14 Unknown 188,190 --- 7 OTTurkey Point CT Upgrade 5B Miami Dade County CC NG FO2 PL TK --- Mar-14 Unknown 188,190 --- 7 OTTurkey Point CT Upgrade 5C Miami Dade County CC NG FO2 PL TK --- Mar-14 Unknown 188,190 --- 7 OTTurkey Point CT Upgrade 5D Miami Dade County CC NG FO2 PL TK --- Mar-14 Unknown 188,190 --- 7 OT
Martin (3) 1 Martin County ST FO6 NG PL PL Jun-13 Mar-14 Unknown 934,500 (832) 823 ESPRiviera Beach Next Generation Clean Energy Center 1 City of Riviera Beach CC NG FO2 TK WA Jun-12 Apr-14 Unknown 1,295,400 --- 1,212 U
Martin (3) 2 Martin County ST FO6 NG PL PL Mar-14 Dec-14 Unknown 934,500 --- (826) OT2014 Changes/Additions Total: (822) 1,247
2015Turkey Point CT Upgrade 5A Miami Dade County CC NG FO2 PL TK --- Mar-14 Unknown 188,190 8 --- OTTurkey Point CT Upgrade 5B Miami Dade County CC NG FO2 PL TK --- Mar-14 Unknown 188,190 8 --- OTTurkey Point CT Upgrade 5C Miami Dade County CC NG FO2 PL TK --- Mar-14 Unknown 188,190 8 --- OTTurkey Point CT Upgrade 5D Miami Dade County CC NG FO2 PL TK --- Mar-14 Unknown 188,190 8 --- OT
Martin (3) 1 Martin County ST FO6 NG PL PL Jun-13 Mar-14 Unknown 934,500 832 --- ESPManatee CT Upgrade 3A Manatee County CC NG No PL No Aug-14 Oct-14 Unknown 188,190 9 8 OTManatee CT Upgrade 3B Manatee County CC NG No PL No Aug-14 Oct-14 Unknown 188,190 9 8 OTManatee CT Upgrade 3C Manatee County CC NG No PL No Apr-14 Oct-14 Unknown 188,190 9 8 OT
Manatee CT Upgrade 3D Manatee County CC NG No PL No Apr-14 Oct-14 Unknown 188,190 9 8 OTRiviera Beach Next Generation Clean Energy Center 1 City of Riviera Beach CC NG FO2 TK WA Jun-12 Jun-14 Unknown 188,190 1,344 --- U
Vero Beach Combined Cycle 1 Indian River CC NG DFO PL TK --- Jan-15 Unknown --- 44 46 OTMartin (3) 2 Martin County ST FO6 NG PL PL Mar-14 Dec-14 Unknown 934,500 --- 823 ESP
Putnam 1 Putnam County CC NG FO2 PL TK --- --- Jun-15 290,004 (265) (249)Putnam 2 Putnam County CC NG FO2 PL TK --- --- Jun-15 290,004 (265) (249)
Ft. Myers CT Upgrade 2A Lee County CC NG No PL No --- Jun-15 Unknown 188,190 --- 9 OTFt. Myers CT Upgrade 2B Lee County CC NG No PL No --- Mar-15 Unknown 188,190 --- 9 OTFt. Myers CT Upgrade 2C Lee County CC NG No PL No --- Jun-15 Unknown 188,190 --- 9 OTFt. Myers CT Upgrade 2D Lee County CC NG No PL No --- May-15 Unknown 188,190 --- 9 OTFt. Myers CT Upgrade 2E Lee County CC NG No PL No --- May-15 Unknown 188,190 --- 9 OTFt. Myers CT Upgrade 2F Lee County CC NG No PL No --- Mar-15 Unknown 188,190 --- 9 OT
2015 Changes/Additions Total: 1,758 456
2016Ft. Myers CT Upgrade 2B Lee County CC NG No PL No Feb-15 Mar-15 Unknown 188,190 9 --- OTFt. Myers CT Upgrade 2F Lee County CC NG No PL No Feb-15 Mar-15 Unknown 188,190 9 --- OTFt. Myers CT Upgrade 2D Lee County CC NG No PL No May-15 Jun-15 Unknown 188,190 9 --- OTFt. Myers CT Upgrade 2E Lee County CC NG No PL No May-15 Jun-15 Unknown 188,190 9 --- OTFt. Myers CT Upgrade 2A Lee County CC NG No PL No Jun-15 Jul-15 Unknown 188,190 9 --- OTFt. Myers CT Upgrade 2C Lee County CC NG No PL No Jul-15 Aug-15 Unknown 188,190 9 --- OT
Port Everglades Next Generation Clean Energy Center 1 City of Hollywood CC NG FO2 TK WA Jun-14 Jun-16 Unknown Unknown --- 1,237 U2016 Changes/Additions Total: 55 1,237
(1) Schedule 8 shows only planned and prospective changes to generating facilities and does not reflect changes to existing purchases. Those changes are reflected on Tables ES-1, I.B.1 and I.B.2.The Winter Total MW value consists of all generation additions and changes achieved by January. The Summer Total MW value consists of all generation additions and changes achieved by June. All MW additions/changes occuring after August each year will be picked up for reserve margin calculation purposes in the following year.
(2) This generating unit is currently serving as a synchronous condenser and is not included in reserve margin calculation.(3) Outages for ESP work.
Fuel Transport Net Capability (2)
Schedule 8 Planned And Prospective Generating Facility Additions And Changes (1)
Fuel Firm
Florida Power & Light Company 90

Page 2 of 2
(2) (3) (4) (5) (5) (7) (8) (9) (10) (11) (12) (13) (14) (15)
Const. Comm. Expected Gen. Max.Unit Unit Start In-Service Retirement Nameplate Winter Summer
Plant Name No. Location Type Pri. Alt. Pri. Alt. Mo./Yr. Mo./Yr. Mo./Yr. KW MW MW StatusADDITIONS/ CHANGES
2017Port Everglades Next Generation Clean Energy Center 1 City of Hollywood CC NG FO2 TK WA Jun-14 Jun-16 Unknown Unknown 1,346 --- U
Turkey Point Synchronous Condenser 1 Miami Dade County ST FO6 NG WA PL --- --- Jun-17 402,050 (398) (396) OT2017 Changes/Additions Total: 948 (396)
2018Vero Beach Combined Cycle 1 Indian River CC NG DFO PL TK --- --- Jan-18 --- (44) (46) OT
2018 Changes/Additions Total: (44) (46)
2019Lauderdale GT 1-12 Broward County GT NG FO2 PL PL --- --- Dec-18 410,734 (459) (420) PLauderdale GT 12-24 Broward County GT NG FO2 PL PL --- --- Dec-18 410,734 (459) (420) P
Port Everglades GT 1-12 Broward County GT NG FO2 PL PL --- --- Dec-18 410,734 (459) (420) PLauderdale CT 1-5 Broward County CT NG FO3 PL PL --- Jan-19 Unknown Unknown 1,115 1,005 P
Unsited 3x1 CC unit 1 --- CC NG FO2 TK WA Jun-17 Jun-19 Unknown Unknown --- 1,269 P2019 Changes/Additions Total: (262) 1,014
2020Unsited 3x1 CC unit CC NG FO2 TK WA Jun-17 Jun-19 Unknown Unknown 1,429 --- P
2020 Changes/Additions Total: 1,429 0
2021 --- ---
2021 Changes/Additions Total: 0 0
2022Cape Canaveral Next Generation Clean Energy Center 1 Brevard County CC NG FO2 PL TK --- Jun-22 Unknown 1,295,400 --- 87 P
Turkey Point 6 Miami Dade County ST NP No TK No 2014 Jun-22 Unknown Unknown --- 1,100 T2022 Changes/Additions Total: 0 1,187
2023Cape Canaveral Next Generation Clean Energy Center 1 Brevard County CC NG FO2 PL TK --- Jun-22 Unknown 1,295,400 87 --- P
Riviera Beach Next Generation Clean Energy Center 1 City of Riviera Beach CC NG FO2 TK WA Jun-12 Apr-14 Unknown 1,295,400 --- 55 PTurkey Point 6 Miami Dade County ST NP No TK No 2014 Jun-22 Unknown Unknown 1,100 --- LTurkey Point 7 Miami Dade County ST NP No TK No 2015 Jun-23 Unknown Unknown --- 1,100 L
2022 Changes/Additions Total: 1,187 1,155(1) Schedule 8 shows only planned and prospective changes to generating facilities and does not reflect changes to existing purchases. Those changes are reflected on Tables ES-1, I.B.1 and I.B.2.(2) The Winter Total MW value consists of all generation additions and changes achieved by January. The Summer Total MW value consists of all generation additions and changes
achieved by June. All MW additions/changes occuring after August each year will be picked up for reserve margin calculation purposes in the following year.
Fuel Transport Net Capability (2)
Schedule 8 Planned And Prospective Generating Facility Additions And Changes (1)
Fuel Firm
Florida Power & Light Company 91

Page 1 of 6Schedule 9
Status Report and Specifications of Proposed Generating Facilities
(1) Plant Name and Unit Number: Vero Beach Combined Cycle Capacity
(2) Capacitya. Summer 46 MWb. Winter 44 MW
(3) Technology Type: Combined Cycle
(4) Anticipated Construction Timinga. Field construction start-date: Not Applicable - See Note 1 below.b. Commercial In-service date: 2015
(5) Fuela. Primary Fuel Gasb. Alternate Fuel Oil
(6) Air Pollution and Control Strategy: N/A
(7) Cooling Method: Once-through cooling water
(8) Total Site Area: 16 Acres
(9) Construction Status: See note 1 below
(10) Certification Status: See note 1 below
(11) Status with Federal Agencies: See note 1 below
(12) Projected Unit Performance Data:Planned Outage Factor (POF): 20.5%Forced Outage Factor (FOF): 0.0%Equivalent Availability Factor (EAF): 72.5%Resulting Capacity Factor (%): 3.88%Average Net Operating Heat Rate (ANOHR): 9,397 Btu/kWhBase Operation 75F,100%
(13) Projected Unit Financial Data Book Life (Years): TBD yearsTotal Installed Cost ( $/kW): Not Applicable Direct Construction Cost ($/kW): Not ApplicableAFUDC Amount ($/kW): Not ApplicableEscalation ($/kW): Not Applicable Fixed O&M ($/kW-Yr): ( $) Not ApplicableVariable O&M ($/MWH):( $) Not ApplicableK Factor: Not Applicable
NOTE 1: The combined cycle capacity consists of two existing units. This existing unit is being acquired by FPL as part of the arrangement for FPL to serve Vero Beach's load beginning in January 2015. FPL is also taking ownership of three steam units.The three steam units will be retired as soon as they aquired.FPL plans to retire the CC unit at the end of 2017.
Florida Power & Light Company 92

Page 2 of 6Schedule 9
Status Report and Specifications of Proposed Generating Facilities
(1) Plant Name and Unit Number: Port Everglades Next Generation Clean Energy Center
(2) Capacitya. Summer 1,237 MWb. Winter 1,429 MW
(3) Technology Type: Combined Cycle
(4) Anticipated Construction Timinga. Field construction start-date: 2014b. Commercial In-service date: 2016
(5) Fuela. Primary Fuel Natural Gasb. Alternate Fuel Ultra-low sulfur distillate
(6) Air Pollution and Control Strategy: Dry Low Nox Burners, SCR, Natural Gas, 0.0015% S. Distillate and Water Injection on Distillate
(7) Cooling Method: Once-through cooling water
(8) Total Site Area: Existing Site Acres
(9) Construction Status: U (Under construction, less than or equal to 50% complete)
(10) Certification Status: ---
(11) Status with Federal Agencies: ---
(12) Projected Unit Performance Data:Planned Outage Factor (POF): 3.5%Forced Outage Factor (FOF): 1.1%Equivalent Availability Factor (EAF): 95.4%Resulting Capacity Factor (%): Approx. 90% (First Full Year Base Operation) Average Net Operating Heat Rate (ANOHR): 6,330 Btu/kWhBase Operation 75F,100%
(13) Projected Unit Financial Data *,**Book Life (Years): 30 yearsTotal Installed Cost (2016 $/kW): 928 Direct Construction Cost ($/kW):AFUDC Amount ($/kW): 87Escalation ($/kW): Fixed O&M ($/kW-Yr): (2016 $) 30.00Variable O&M ($/MWH): (2016 $) 0.10K Factor: 1.51
* $/kW values are based on Summer capacity.** Fixed O&M cost includes capital replacement.
NOTE: Total installed cost includes gas expansion, transmission interconnection and integration, escalation, and AFUDC. Demolition costs of existing plant are not included.
Florida Power & Light Company 93

Page 3 of 6Schedule 9
Status Report and Specifications of Proposed Generating Facilities
(1) Plant Name and Unit Number: Lauderdale CT's (5 CTs will be added)
(2) Capacity (for each CT)
a. Summer 201 MWb. Winter 223 MW
(3) Technology Type: Combustion Turbine
(4) Anticipated Construction Timinga. Field construction start-date: 2017b. Commercial In-service date: 2018
(5) Fuela. Primary Fuel Natural Gasb. Alternate Fuel Ultra-low sulfur distillate
(6) Air Pollution and Control Strategy: Dry Low NOx Burners, SCR, Natural Gas, 0.0015% S. Distillate and Water Injection on Distillate
(7) Cooling Method: Water to Air Heat Exchangers
(8) Total Site Area: Existing Site Acres
(9) Construction Status: P (Planned Unit)
(10) Certification Status: ---
(11) Status with Federal Agencies: ---
(12) Projected Unit Performance Data:Planned Outage Factor (POF): 1.6%Forced Outage Factor (FOF): 1.0%Equivalent Availability Factor (EAF): 97.4%Resulting Capacity Factor (%): 3% (First Full Year Base Operation) Average Net Operating Heat Rate (ANOHR): 10,057 Btu/kWhBase Operation 75F,100%
(13) Projected Unit Financial Data *,**Book Life (Years): 30 yearsTotal Installed Cost (2018 $/kW): 547 Direct Construction Cost ($/kW):AFUDC Amount ($/kW): 56Escalation ($/kW): Fixed O&M ($/kW-Yr): (2018 $) 17.63Variable O&M ($/MWH): (2018 $) 0.07K Factor: 1.59
* $/kW values are based on Summer capacity.** Fixed O&M cost includes capital replacement.
NOTE: Total installed cost includes transmission interconnection and integration, escalation, and AFUDC. Demolition costs of existing GTs are not included.
Florida Power & Light Company 94

Page 4 of 6Schedule 9
Status Report and Specifications of Proposed Generating Facilities
(1) Plant Name and Unit Number: Unsited 3x1 CC
(2) Capacity
a. Summer 1,269 MW
b. Winter 1,429 MW
(3) Technology Type: Combined Cycle
(4) Anticipated Construction Timinga. Field construction start-date: 2017b. Commercial In-service date: 2019
(5) Fuela. Primary Fuel Natural Gasb. Alternate Fuel Ultra-low sulfur distillate
(6) Air Pollution and Control Strategy: Dry Low NOx Burners, SCR, Natural Gas, 0.0015% S. Distillate and Water Injection on Distillate
(7) Cooling Method: Once-through cooling water
(8) Total Site Area: TBD Acres
(9) Construction Status: P (Planned Unit)
(10) Certification Status: ---
(11) Status with Federal Agencies: ---
(12) Projected Unit Performance Data:Planned Outage Factor (POF): 3.5%Forced Outage Factor (FOF): 1.1%Equivalent Availability Factor (EAF): 95.4%Resulting Capacity Factor (%): Approx. 90% (First Full Year Base Operation) Average Net Operating Heat Rate (ANOHR): 6,334 Btu/kWhBase Operation 75F,100%
(13) Projected Unit Financial Data *,**Book Life (Years): 30 yearsTotal Installed Cost (2019 $/kW): 968 Direct Construction Cost ($/kW):AFUDC Amount ($/kW): 95Escalation ($/kW): 872.79 Fixed O&M ($/kW-Yr): (2019 $) 22.25Variable O&M ($/MWH): (2019 $) 0.72K Factor: 1.51
* $/kW values are based on Summer capacity.** Fixed O&M cost includes capital replacement.
NOTE: Total installed cost includes gas lateral, transmission interconnection and integration, escalation, and AFUDC.
Florida Power & Light Company 95

Page 5of 6Schedule 9
Status Report and Specifications of Proposed Generating Facilities
(1) Plant Name and Unit Number: Turkey Point Nuclear Unit 6
(2) Capacitya. Summer 1,100 MWb. Winter 1,100 MW
(3) Technology Type: Nuclear
(4) Anticipated Construction Timinga. Field construction start-date: 2015b. Commercial In-service date: 2022
(5) Fuela. Primary Fuel Uranium Dioxideb. Alternate Fuel N/A
(6) Air Pollution and Control Strategy: N/A
(7) Cooling Method: Mechanical Draft Cooling Towers
(8) Total Site Area: 211 Acres
(9) Construction Status: L (Regulatory approval pending.Not under construction)
(10) Certification Status: L (Regulatory approval pending.Not under construction)
(11) Status with Federal Agencies: L (Regulatory approval pending.Not under construction)
(12) Projected Unit Performance Data:Planned Outage Factor (POF): TBDForced Outage Factor (FOF): TBDEquivalent Availability Factor (EAF): TBDResulting Capacity Factor (%): Approx. 90% (First Full Year Base Operation) Average Net Operating Heat Rate (ANOHR): TBD Btu/kWhBase Operation 75F,100%
(13) Projected Unit Financial Data *,**Book Life (Years): TBD yearsTotal Installed Cost ( $/kW): TBD Direct Construction Cost ($/kW): TBDAFUDC Amount ($/kW): TBDEscalation ($/kW): TBD Fixed O&M ($/kW-Yr): ( $) TBDVariable O&M ($/MWH):( $) TBDK Factor: TBD
* $/kW values are based on Summer capacity.** Fixed O&M cost includes capital replacement.
Florida Power & Light Company 96

Page 6 of 6Schedule 9
Status Report and Specifications of Proposed Generating Facilities
(1) Plant Name and Unit Number: Turkey Point Nuclear Unit 7
(2) Capacitya. Summer 1,100 MWb. Winter 1,100 MW
(3) Technology Type: Nuclear
(4) Anticipated Construction Timinga. Field construction start-date: 2015b. Commercial In-service date: 2023
(5) Fuela. Primary Fuel Uranium Dioxideb. Alternate Fuel N/A
(6) Air Pollution and Control Strategy: N/A
(7) Cooling Method: Mechanical Draft Cooling Towers
(8) Total Site Area: 211 Acres
(9) Construction Status: L (Regulatory approval pending.Not under construction)
(10) Certification Status: L (Regulatory approval pending.Not under construction)
(11) Status with Federal Agencies: L (Regulatory approval pending.Not under construction)
(12) Projected Unit Performance Data:Planned Outage Factor (POF): TBDForced Outage Factor (FOF): TBDEquivalent Availability Factor (EAF): TBDResulting Capacity Factor (%): Approx. 90% (First Full Year Base Operation) Average Net Operating Heat Rate (ANOHR): TBD Btu/kWhBase Operation 75F,100%
(13) Projected Unit Financial Data *,**Book Life (Years): TBD yearsTotal Installed Cost ( $/kW): TBD Direct Construction Cost ($/kW): TBDAFUDC Amount ($/kW): TBDEscalation ($/kW): TBD Fixed O&M ($/kW-Yr): ( $) TBDVariable O&M ($/MWH):( $) TBDK Factor: TBD
* $/kW values are based on Summer capacity.** Fixed O&M cost includes capital replacement.
Florida Power & Light Company 97

Schedule 10
Status Report and Specifications of Proposed Transmission Lines
Vero Beach Existing Combined Cycle Capacity
The Vero Beach existing combined cycle capacity that FPL is projected to take ownership of starting January 1, 2015 does not require any “new” transmission lines.
Florida Power & Light Company 98

Schedule 10 Status Report and Specifications of Proposed Transmission Lines
Port Everglades Next Generation Clean Energy Center
The Port Everglades Next Generation Clean Energy Center which will result from the modernization of the Port Everglades power plant site does not require any “new” transmission lines.
Florida Power & Light Company 99

Schedule 10
Status Report and Specifications of Proposed Transmission Lines
Lauderdale Combustion Turbine Project
The Lauderdale Combustion Turbine (CT) project, which will result in the retirement of 36 aero-derivative combustion gas turbines at the Lauderdale and Port Everglades plant sites, and their replacement with 5 simple-cycle combustion turbines at the Lauderdale site, does not require any “new” transmission lines.
Florida Power & Light Company 100

Schedule 10 Status Report and Specifications of Proposed Transmission Lines
Unsited Combined Cycle in 2019
No projection of a new transmission line(s) can be made until a site is selected for this unit.
Florida Power & Light Company 101

Schedule 10 Status Report and Specifications of Proposed Transmission Lines
Turkey Point Nuclear Unit 6 The Turkey Point New Nuclear Project starting with the addition of Turkey Point Unit 6 will require a new substation and five new transmission lines terminating at existing substations. (1) Point of Origin and Termination: New Clear Sky Substation – Levee Substation (2) Number of Lines: 2 (3) Right-of-way FPL Owned (4) Line Length: 43 miles (5) Voltage: 500 kV (6) Anticipated Construction Timing: Start date: TBD End date: TBD (7) Anticipated Capital Investment: $ TBD (Trans.and Sub.) (8) Substations: New Clear Sky Substation and Levee Substation (9) Participation with Other Utilities: None
(1) Point of Origin and Termination: New Clear Sky Substation – Pennsuco Substation (2) Number of Lines: 1 (3) Right-of-way FPL Owned (4) Line Length: 52 miles (5) Voltage: 230 kV (6) Anticipated Construction Timing: Start date: TBD End date: TBD (7) Anticipated Capital Investment: $ TBD (Trans.and Sub.) (8) Substations: New Clear Sky Substation and Pennsuco Substation (9) Participation with Other Utilities: None
Florida Power & Light Company 102
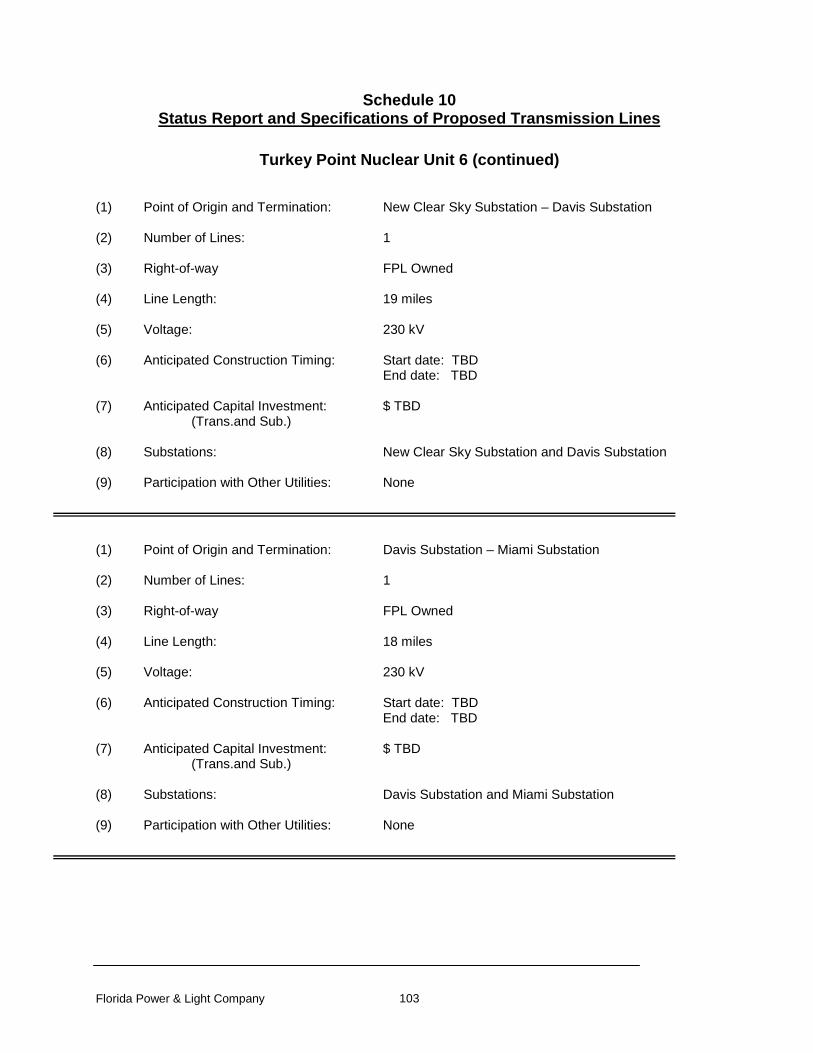
Schedule 10 Status Report and Specifications of Proposed Transmission Lines
Turkey Point Nuclear Unit 6 (continued) (1) Point of Origin and Termination: New Clear Sky Substation – Davis Substation (2) Number of Lines: 1 (3) Right-of-way FPL Owned (4) Line Length: 19 miles (5) Voltage: 230 kV (6) Anticipated Construction Timing: Start date: TBD End date: TBD (7) Anticipated Capital Investment: $ TBD (Trans.and Sub.) (8) Substations: New Clear Sky Substation and Davis Substation (9) Participation with Other Utilities: None
(1) Point of Origin and Termination: Davis Substation – Miami Substation (2) Number of Lines: 1 (3) Right-of-way FPL Owned (4) Line Length: 18 miles (5) Voltage: 230 kV (6) Anticipated Construction Timing: Start date: TBD End date: TBD (7) Anticipated Capital Investment: $ TBD (Trans.and Sub.) (8) Substations: Davis Substation and Miami Substation (9) Participation with Other Utilities: None
Florida Power & Light Company 103

Schedule 10 Status Report and Specifications of Proposed Transmission Lines
Turkey Point Nuclear Unit 6 (continued) (1) Point of Origin and Termination: New Clear Sky Substation – Turkey Point Substation (2) Number of Lines: 1 (3) Right-of-way FPL Owned (4) Line Length: 0.5 miles (5) Voltage: 230 kV (6) Anticipated Construction Timing: Start date: TBD End date: TBD (7) Anticipated Capital Investment: $ TBD (Trans.and Sub.) (8) Substations: New Clear Sky Substation and Turkey Point Substation (9) Participation with Other Utilities: None
Florida Power & Light Company 104

Schedule 10 Status Report and Specifications of Proposed Transmission Lines
Turkey Point Nuclear Unit 7 The transmission lines required for Turkey Point Unit 7 will be constructed with Turkey Point Unit 6 and are listed in the Schedule 10 for Turkey Point Nuclear Unit 6.
Florida Power & Light Company 105

(1) (2) (3) (4) (5) (6) (7)NEL Fuel Mix
Generation by Primary Fuel Summer (MW) Summer (%) Winter (MW) Winter (%) GWh (2) %(1) Coal 897 3.4% 911 3.3% 5,981 5.4%(2) Nuclear 3,453 13.2% 3,550 12.8% 25,243 22.6%(3) Residual 3,666 14.0% 3,700 13.4% 75 0.1%(4) Distillate 648 2.5% 710 2.6% 120 0.1%(5) Natural Gas 15,575 59.4% 16,785 60.6% 75,208 67.4%(6) Solar (Non-Firm) 35 0.1% 35 0.1% 155 0.1%(7) FPL Existing Units Total (1) : 24,274 92.6% 25,691 92.8% 106,782 95.6%(8) Renewables (Purchases)- Firm 61.0 0.2% 112.0 0.4% 43 0.0%(9) Renewables (Purchases)- Non-Firm Not Applicable --- Not Applicable --- 362 0.3%(10) Renewable Total: 61.0 0.2% 112.0 0.4% 405 0.36%(11) Purchases Other : 1,883.0 7.2% 1,891.0 6.8% 4,468 4.0%(12) Total : 26,218.0 100.0% 27,694.0 100.0% 111,655 100.0%
Note:(1) FPL Existing Units Total values on row (7), columns (2) and (4), match the System Firm Generating Capacity values found on
Schedule 1 for Summer and Winter.(2) Net Energy for Load GWh values on row (12), column (6), matches Schedule 6.1 value for 2013.
Schedule 11.1
Actuals for the Year 2013Existing FIRM and NON-FIRM Capacity and Energy by Primary Fuel Type
Net (MW) Capability
Existing NON-FIRM Self-Service Renewable Generation FacilitiesActuals for the Year 2013
(1) (2) (3) (4) (5) (6) = (3)+(4)-(5)
Type of Facility Installed Capacity DC (MW)Renewable Projected Annual Output (MWh)
Annual Energy Purchased from FPL
(MWh)Annual Energy Sold
to FPL (MWh)
Projected Annual Energy Used by
CustomersCustomer-Owned
Renewable Generation (0 kW to 10 kW) 12.86 16,142 111,831 465 127,508Customer-Owned
Renewable Generation (> 10 kW to 100 kW) 6.69 8,758 197,171 376 205,553
Customer-Owned Renewable Generation
(> 100 kW - 2 MW) 7.94 10,475 62,050 177 72,34827.49 35,375 371,052 1,018 405,409
Notes:
(1) There were 2,565 customers with renewable generation facilities interconnected with FPL on December 31, 2013.(2) The Installed Capacity value is the sum of the nameplate ratings (DC MW) for all of the customer-owned renewable generation facilities connected as of Dec. 31,2013. One system does not have a DC rating. The AC valued of 0.75 MW was included in the ( > 100 - 2 MW) row.(3) The Projected Annual Output value is based on NREL's PV Watts 1 program and the Installed Capacity value in column (2), adjusted for the date when each facility was installed and assuming each facility operated as planned.(4) The Annual Energy Purchased from FPL is an actual value from FPL's metered data for 2013.(5) The Annual Energy Sold to FPL is an actual value from FPL's metered data for 2013.(6) The Projected Annual Energy Used by Customers is a projected value that equals: (Renewable Projected Annual output + Annual Energy Purchased ) minus the Annual Energy Sold to FPL.
Schedule 11.2
Florida Power & Light Company 106

CHAPTER IV Environmental and Land Use Information
Florida Power & Light Company 107

(This page is left intentionally blank.)
Florida Power & Light Company 108

IV. Environmental and Land Use Information
IV.A Protection of the Environment Florida is a sensitive, temperate/sub-tropical environment containing a number of distinct
ecosystems with many endangered or threatened plant and animal species. Florida’s residents,
wildlife, and ecosystems require the same air, land, and water resources that are necessary to
meet the demand for the generation, transmission, and distribution of electricity. The general
public has an expectation that a large corporation, such as FPL, will conduct their business in an
environmentally responsible manner that minimizes impacts to the natural environment.
FPL has been recognized for many years as one of the leaders among electric utilities for its
commitment to the environment. Being responsible stewards of the environment is ingrained in
FPL’s corporate culture. FPL has one of the lowest emissions profiles among U.S. utilities and in
2013 its carbon dioxide (CO2) emission rate was 35% lower (better) than the industry average.
FPL’s environmental leadership and that of its parent company, NextEra Energy, Inc., has been
heralded by many outside organizations as demonstrated by a few recent examples.
FPL’s responsible tree care practices across its 35-county service area have been recognized for
almost a decade. FPL has been the recipient of the Tree Line USA award annually from 2003 -
2013. This award is sponsored by the Arbor Day Foundation in cooperation with the National
Association of State Foresters. The recognition is given to utilities that demonstrate quality tree
care practices, annual worker training, and public education programs.
In 2013, FPL continued to support the Loggerhead Marinelife Center with a $21,500 donation
toward the acquisition of a larger tank to assist in sea turtle rehabilitation. Two FPL employees
serve as members of the Loggerhead Marinelife Center and are committed to its success. In
addition, through a “Power to Care” charity event an additional $500 was collected by FPL staff
and given to the Center. In past years, FPL has won the Loggerhead Marinelife Center's "Blue
Business of the Year" award, which is given to those who are leading the way in raising
awareness about, and have made significant contributions to improve and protect, South Florida's
oceans, beaches, and wildlife. The award recognized FPL's protection and conservation of the
endangered Florida manatee and the fostering of public and employee education and support.
FPL employees serve as board members for many organizations that focus on environmental
restoration, preservation, and stewardship. A partial list of these organizations includes: Audubon
Florida, the Everglades Foundation, the Arthur R. Marshall Foundation, The Nature Conservancy,
and the Palm Beach Zoo.
Florida Power & Light Company 109
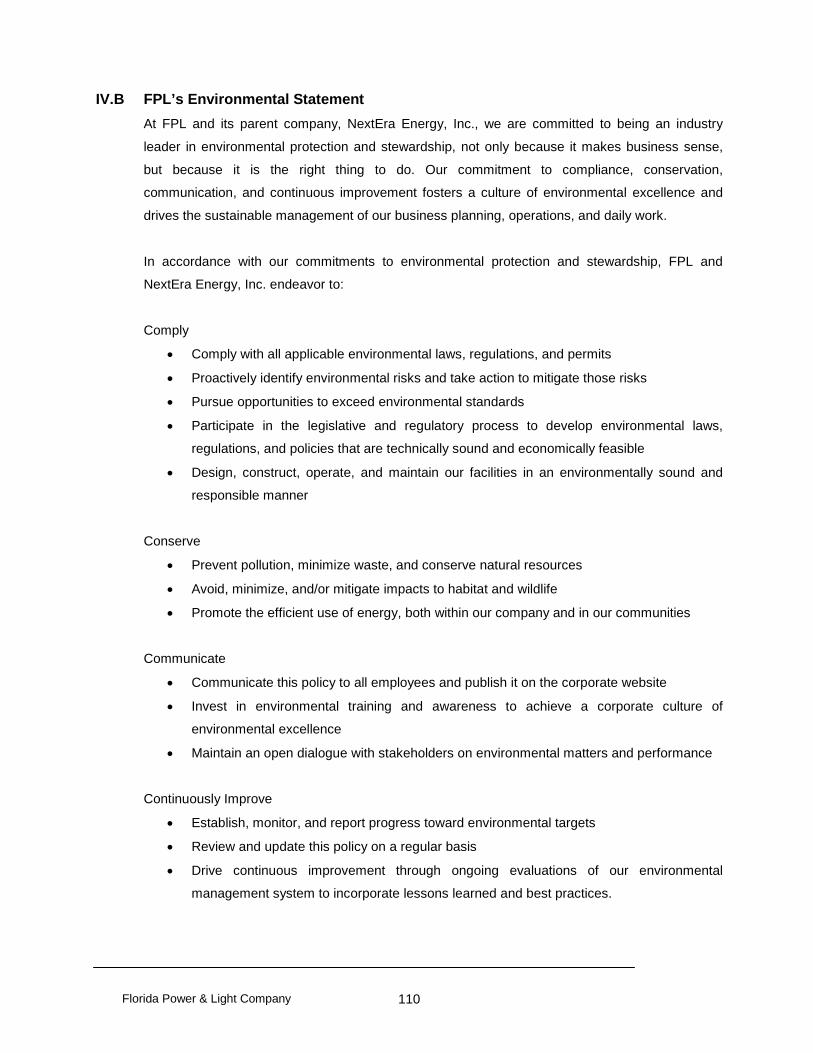
IV.B FPL’s Environmental Statement At FPL and its parent company, NextEra Energy, Inc., we are committed to being an industry
leader in environmental protection and stewardship, not only because it makes business sense,
but because it is the right thing to do. Our commitment to compliance, conservation,
communication, and continuous improvement fosters a culture of environmental excellence and
drives the sustainable management of our business planning, operations, and daily work.
In accordance with our commitments to environmental protection and stewardship, FPL and
NextEra Energy, Inc. endeavor to:
Comply
• Comply with all applicable environmental laws, regulations, and permits
• Proactively identify environmental risks and take action to mitigate those risks
• Pursue opportunities to exceed environmental standards
• Participate in the legislative and regulatory process to develop environmental laws,
regulations, and policies that are technically sound and economically feasible
• Design, construct, operate, and maintain our facilities in an environmentally sound and
responsible manner
Conserve
• Prevent pollution, minimize waste, and conserve natural resources
• Avoid, minimize, and/or mitigate impacts to habitat and wildlife
• Promote the efficient use of energy, both within our company and in our communities
Communicate
• Communicate this policy to all employees and publish it on the corporate website
• Invest in environmental training and awareness to achieve a corporate culture of
environmental excellence
• Maintain an open dialogue with stakeholders on environmental matters and performance
Continuously Improve
• Establish, monitor, and report progress toward environmental targets
• Review and update this policy on a regular basis
• Drive continuous improvement through ongoing evaluations of our environmental
management system to incorporate lessons learned and best practices.
Florida Power & Light Company 110

This statement was updated in 2013 by FPL’s parent company, NextEra Energy, Inc. to reflect
changing expectations and ensure that employees are doing the utmost to protect the
environment. FPL complies with all environmental laws, regulations, and permit requirements. FPL
designs, constructs, and operates its facilities in an environmentally sound and responsible
manner. It also responds immediately and effectively to any known environmental hazards or non-
compliance situations. FPL’s commitment to the environment does not end there. It proactively
pursue opportunities to exceed current environmental standards, including reducing waste and
emission of pollutants, recycling materials, and conserving natural resources throughout its
operations and day-to-day work activities. FPL also encourages the efficient use of energy, both
within the Company and in communities served by FPL. These actions are just a few examples of
how FPL is committed to the environment.
To ensure that FPL is adhering to its environmental commitment, it has developed rigorous
environmental governance procedures and programs. These include its Environmental Assurance
Program and Corporate Environmental Governance Council. Through these programs, FPL
conducts periodic environmental self-evaluations to verify that its operations are in compliance
with environmental laws, regulations, and permit requirements. Regular evaluations also help
identify best practices and opportunities for improvement.
IV.C Environmental Management In order to successfully implement the Environmental Statement, FPL has developed a robust
Environmental Management System program to direct and control the fulfillment of the
organization’s environmental responsibilities. A key component of the system is an Environmental
Assurance Program. Other components of the system include: executive management support
and commitment, a dedicated environmental corporate governance program, written
environmental policies and procedures, delineation of organizational responsibilities and individual
accountabilities, allocation of appropriate resources for environmental compliance management
(which includes reporting and corrective action when non-compliance occurs), environmental
incident and/or emergency response, environmental risk assessment/management, environmental
regulatory development and tracking, and environmental management information systems.
As part of its commitment to excellence and continuous improvement, FPL began implementing
an enhanced environmental data management information system (EDMIS) in 2013.
Environmental data management software systems are increasingly viewed as an industry best-
management practice to ensure environmental compliance. FPL’s top goals for this project are to:
1) improve the flow of environmental data between site operations and corporate services to
ensure compliance, and 2) improve operating efficiencies. In addition, the EDMIS will help
standardize environmental data collection, thus improving external reporting to the public.
Florida Power & Light Company 111

IV.D Environmental Assurance Program FPL’s Environmental Assurance Program consists of activities that are designed to evaluate
environmental performance, verify compliance with corporate policy as well as legal and
regulatory requirements, and communicate results to corporate management. The principal
mechanism for pursuing environmental assurance is the environmental audit. An environmental
audit may be defined as a management tool comprising a systematic, documented, periodic, and
objective evaluation of the performance of the organization and of the specific management
systems and equipment designed to protect the environment. The environmental audit’s primary
objectives are to facilitate management control of environmental practices and assess compliance
with existing environmental regulatory requirements and FPL policies. In addition to FPL facility
audits, the Environmental Assurance Program performs audits of third-party vendors used for
recycling and/or disposal of waste generated by FPL operations. Vendor audits provide
information used for selecting candidates or incumbent vendors for disposal and recycling needs.
FPL has also implemented a Corporate Environmental Governance System, in which quarterly
reviews are performed by each business unit deemed to have significant environmental
exposures. Quarterly reviews evaluate operations for potential environmental risks and
consistency with the company’s Environmental Policy. Items tracked during the quarterly reviews
include processes for the identification and management of environmental risks, metrics, and
indicators and progress / changes since the most recent review.
IV.E Environmental Communication and Facilitation FPL is involved in many efforts to enhance environmental protection through the facilitation of
environmental awareness and in public education. Some of FPL’s 2013 environmental outreach
activities are summarized in Table IV.E.1.
Florida Power & Light Company 112

Table IV.E.1: 2013 FPL Environmental Outreach Activities
Activity Count (#)
Visitors to FPL’s Energy Encounter at St. Lucie 2,900 Visitors to Manatee Park, Ft. Myers >210,000
Number of website visits to FPL’s Environmental & Corporate Responsibility Websites 245,630
Visitors to Barley Barber Swamp (Treasured Lands Partnership) 1,492
Martin Energy Center Solar Tours ~850
Solar Schools Program (# of schools actively generating)
24 schools 5 demo sites
An additional 67 schools will come online by the end of 2014
IV.F Preferred and Potential Sites Based upon its projection of future resource needs, FPL has identified six (6) Preferred Sites and
four (4) Potential Sites for future generation additions. Preferred Sites are those locations where
FPL has conducted significant reviews and has either taken action, is currently committed to take
action, or is likely to take action, to site new generating capacity. Potential Sites are those sites
that have attributes that support the siting of generation and are under consideration as a location
for future generation. Some of these sites are currently in use as existing generation sites and
some are not. The identification of a Potential Site does not indicate that FPL has made a
definitive decision to pursue generation (or generation expansion or modernization in the case of
an existing generation site) at that location, nor does this designation indicate that the size or
technology of a generator has been determined. Analyses of any modernization candidates would
include evaluation of numerous factors including: fuel delivery, transmission, permitting, etc. The
Preferred Sites and Potential Sites are discussed in separate sections below.
IV.F.1 Preferred Sites The modernization of FPL’s Riviera Beach site was scheduled to be completed on/near April 1,
2014 (the filing date for this 2014 Site Plan). Therefore, the Riviera Beach modernization is not
discussed further in this chapter. FPL currently has identified six (6) Preferred Sites. Four of these
are existing plant sites: Port Everglades, Lauderdale, Putnam and Turkey Point; two of these
would be new plant sites: Hendry County and Northeast (NE) Okeechobee County.
The Port Everglades site is a location where modernization work, to replace the former steam
generating units with new combined cycle (CC) technology, is in progress. The modernization
work is scheduled to be completed in mid-2016. The existing gas turbines (GTs) at the Port
Everglades and the Lauderdale sites are projected to be removed by the end of 2018. Five new
Florida Power & Light Company 113

combustion turbines (CTs) are projected to be added at the Lauderdale site by the end of 2018 to
partially replace the capacity from existing GTs at Port Everglades and at the Lauderdale sites.
These actions will aid in addressing compliance with new air emissions standards. The Hendry
County, NE Okeechobee County, and Putnam sites are the likely next locations for new CC units
after the Port Everglades and Lauderdale projects mentioned above have been completed. In
addition, the Hendry County and Okeechobee County sites are also likely sites for new
photovoltaic (PV) facilities.
In regard to the Turkey Point site, the nuclear capacity uprate project was successfully completed
in 2013. The new Turkey Point nuclear Units 6 & 7 are currently projected to come in-service in
2022 and 2023, respectively.
The first two Preferred Sites discussed below are in general chronological order with respect to
when the capacity additions are projected to occur. The remaining four Preferred Sites are
discussed in alphabetical order.
Preferred Site # 1: Port Everglades Plant, Broward County
This site is located on the existing FPL Port Everglades Plant property within the City of
Hollywood, Broward County. The site is surrounded by the Port of Port Everglades. The site has
barge access via the Port of Port Everglades. A rail line is located near the plant.
The previous site generating capacity was made up of two 200 MW (approximate) steam
generating units (Units 1 & 2) and two 400 MW (approximate) steam generating units (Units 3 &
4). The four units have been taken out of service and dismantled as part of the modernization of
the plant site.
The Port Everglades Plant site has been listed as a Preferred or Potential Site in previous FPL
Site Plans for both CC and CT generation options. On April 9, 2012, the FPSC issued the final
need order for the modernization of the existing Port Everglades Plant. As a result of the
modernization of the site, the new generating unit - to be renamed the Port Everglades Next
Generation Clean Energy Center (PEEC) – will replace the existing steam generating units with
modern, highly efficient, lower-emission next-generation advanced CC technology. The existing
four steam units have been removed from the site and will be replaced by a single new CC unit.
a. U.S. Geological Survey (USGS) Map A USGS map of the PEEC site is found at the end of this chapter.
Florida Power & Light Company 114

b. Proposed Facilities Layout
A general layout of the PEEC generating facilities is found at the end of this chapter.
c. Map of Site and Adjacent Areas
An overview map of the site and adjacent areas is also found at the end of this chapter.
d. Existing Land Uses of Site and Adjacent Areas
The existing Port Everglades Plant formerly consisted of two 200 MW (approximate) and two
400 MW (approximate) generating units with conventional dual-fuel fired steam boilers and
steam turbine units. These generating units have now been removed as part of the
modernization project. The plant site includes minimal vegetation. Adjacent land uses include
port facilities and associated industrial activities, as well as light commercial and residential
development.
e. General Environment Features On and In the Site Vicinity
1. Natural Environment
The majority of the site is comprised of facilities related to electric power generation for
the former Port Everglades Plant generating units. The site is located adjacent to the
Intracoastal Waterway. The site provides warm water as required for manatees pursuant
to the facility’s Manatee Protection Plan.
2. Listed Species
No adverse impacts to federally or state-listed terrestrial plants and animals are expected
in association with construction at the site, due to the existing developed nature of the site
and lack of suitable onsite habitat for listed species. The warm water discharges from the
plant attract manatees, an endangered species. FPL continues to work closely with state
and federal wildlife agencies to ensure protection of the manatees during the
modernization process and upon operation of the new plant. FPL plans to install a
temporary heating system to provide warm water for manatees as required pursuant to
the facility’s Manatee Protection Plan. FPL also anticipates complying with other manatee-
related conditions of certification to ensure the protection of the manatees during the
modernization work and during future operations of PEEC.
3. Natural Resources of Regional Significance Status
The construction and operation of a natural gas-fired CC generating facility at this location
is consistent with the existing use at the site and is not expected to have any adverse
impacts on parks, recreation areas, or environmentally sensitive lands.
Florida Power & Light Company 115

4. Other Significant Features
FPL is not aware of any other significant features of the site.
f. Design Features and Mitigation Options
The design option is to replace the former units (Units 1 through 4) with one new
approximately 1,237 MW (Summer) unit consisting of three new CTs, three new heat recovery
steam generators (HRSG), and a new steam turbine. The new CC unit is projected to be in
service in mid-2016. Natural gas delivered via an existing pipeline is the primary fuel type for
the unit with ultra-low sulfur light fuel oil serving as a backup fuel.
In addition, all of the existing GTs at the Port Everglades site are projected to be removed by
the end of 2018.
g. Local Government Future Land Use Designations
Local government future land use designation for the site is a combination of “Electrical
Generating Facility” and “Utilities Use”. A land use map of the site and adjacent areas is also
found at the end of this chapter.
h. Site Selection Criteria Process
The Port Everglades site has been selected for modernization due to consideration of various
factors including system load, ability to provide generation in the Miami-Dade/Broward region
to help balance load and generation in the region, and economics. Environmental issues were
not a deciding factor since this site does not exhibit significant environmental sensitivity or
other environmental issues. However, there are environmental benefits of replacing the
former steam units with a new CC unit including a significant reduction in system air
emissions, improved aesthetics at the site, and continued warm water discharge for the
manatees as required pursuant to the facility’s Manatee Protection Plan. Further, modernizing
this existing facility reduces the impact on natural resources by not requiring new land or new
water resources.
i. Water Resources
Water from the Intracoastal Waterway via the Port of Port Everglades Slip No. 3 is currently
used for once-through cooling water supply. The new plant will utilize portions of the existing
once-through cooling water intake and discharge structures. Process and potable water for the
modernized plant will come from the existing City of Ft. Lauderdale potable water supply.
Florida Power & Light Company 116

j. Geological Features of Site and Adjacent Areas
FPL’s Port Everglades Plant site is underlain by the surficial aquifer system. The surficial
aquifer system in eastern Broward County is primarily composed of sand, sandstone, shell,
silt, calcareous clay (marl), and limestone deposited during the Pleistocene and Pliocene
ages. The sediments forming the aquifer system are the Pamlico Sand, Miami Oolite,
Anastasia Formation, Key Largo Formation, and Fort Thompson Formation (Pleistocene) and
the Tamiami Formation (Pliocene). The sediments in the eastern portion of the county are
appreciably more permeable than in the west.
The surficial aquifer is underlain by at least 600 feet of the Hawthorn formation (confining unit).
The Floridan Aquifer System underlies the Hawthorn formation.
k. Projected Water Quantities for Various Uses
The estimated quantity of water required for processing is approximately 0.24 million gallons
per day (mgd) for uses such as process water and service water. Approximately 600 mgd of
cooling water would be cycled through the once-through cooling water system which is a
reduction of more than 51% from the previous fossil steam unit’s capability. Potable water
demand is expected to average .001 mgd.
l. Water Supply Sources by Type
The modernized plant will continue to use the Intracoastal Waterway as the source of once-
through cooling water. Process and potable water for the new plant will come from the existing
City of Ft. Lauderdale potable water supply.
m. Water Conservation Strategies Under Consideration
No additional water resources will be required as a result of the modernization project. CC
technology uses less water by design than traditional steam generation units.
n. Water Discharges and Pollution Control
The modernized plant will utilize portions of the existing once-through cooling water system for
heat dissipation. The heat recovery steam generator blowdown will be reused to the maximum
extent practicable or mixed with the cooling water flow before discharge. Reverse osmosis
(R/O) reject will be mixed with the plant’s once-through cooling water system prior to
discharge. Stormwater runoff will be collected and routed to stormwater ponds. The facility
will employ a Best Management Practices (BMP) plan and Spill Prevention, Control, and
Countermeasure (SPCC) plan to prevent and control the inadvertent release of pollutants.
Florida Power & Light Company 117

o. Fuel Delivery, Storage, Waste Disposal, and Pollution Control
Natural gas for the new unit would be transported to the site via an existing natural gas
pipeline to the site. New gas compressors to raise the gas pressure of the pipeline to the
appropriate level for the new unit will be installed either at the existing site or off-site. Ultra-low
sulfur light fuel oil would be received by truck, pipeline, or barge and stored in a new above-
ground storage tank.
p. Air Emissions and Control Systems
The regulated air emission rates at the new plant would be approximately 90 percent lower
than the previous Port Everglades Plant’s emission rates, resulting in significant annual
emissions reductions and air quality benefits per unit of energy produced. The use of natural
gas, ultra-low sulfur light fuel oil, and combustion controls would minimize air emissions from
the unit and ensure compliance with applicable emission limiting standards. Using these fuels
minimizes emissions of sulfur dioxide (SO2), particulate matter, and other fuel-bound
contaminates. Combustion controls similarly minimize the formation of nitrogen oxides (NOx)
and the combustor design will limit the formation of carbon monoxide and volatile organic
compounds. When firing natural gas, NOx emissions will be controlled using dry-low NOx
combustion technology and selective catalytic reduction (SCR). Water injection and SCR will
be used to reduce NOx emissions during operations when using ultra-low sulfur light fuel oil as
backup fuel. CC facility emissions of greenhouse gas emissions (GHGs) from combustion of
natural gas achieve an emission rate substantially lower than the EPA proposed new source
performance standards for GHGs. These design alternatives are equivalent to the Best
Available Control Technology for air emissions, and minimize such emissions while balancing
economic, environmental, and energy impacts. Taken together, the design of PEEC would
incorporate features that will make it among the most efficient and cleanest power plants in
the State of Florida.
q. Noise Emissions and Control Systems
Noise expected to be caused by unit construction at the site is expected to be below current
noise levels for the residents nearest the site.
r. Status of Applications
FPL filed a need determination with the FPSC on November 21, 2011. The FPSC’s final need
order was issued on April 9, 2012. The Site Certification Application (SCA) was submitted
January 24, 2012 resulting in the issuance of Final Order PA 12-57 on October 9, 2012.
Concurrent with the SCA filing, FPL submitted applications for a Greenhouse Gas (GHG)
permit, a Prevention of Significant Deterioration (PSD) permit, and an Industrial Wastewater
Facility permit revision. The revised Industrial Wastewater Facility permit was issued
Florida Power & Light Company 118

December 16, 2012. The GHG permit was issued December 26, 2013 and the PSD permit
was issued May 1, 2012.
Preferred Site # 2: Lauderdale Plant, Broward County This site is located at and situated within the existing FPL Lauderdale Plant p roper t y,
approx im ate l y 392 ac res , within the Cities of Dania Beach and Hollywood in Broward
County, Florida. The jurisdiction for the City of Hollywood is a small area south of SW 42nd Street
in the eastern portion of the property. The remainder of the Plant property is located in the City of
Dania Beach. The Plant property is located east of U.S. Highway 441, north of Griffin Road, west
of SW 30th Avenue, and south of Interstate 595. The existing a c c e s s e s t o t h e Plant a r e
from SW 24th Avenue and SW 42nd Street. The adjacent properties include residential
properties to the south, the South Broward County Resource Recovery Facility to the west, Pond
Apple Slough to the north and commercial properties to the east.
The Lauderdale Plant includes two banks of 12 simple cycle gas turbines (GTs) that began
operation in t h e e a r l y 1970s. These GTs are first generation GTs that are used to serve
peak and emergency demands in a quick-start manner. Each bank of GTs has a net capacity
of 420 (Summer) megawatts (MWs), and are authorized to operate on natural gas and distillate
oil. Due to new nitrogen dioxide (NO2) environmental regulations, FPL filed in June 2013 for
FPSC approval to recover costs for removing all of its existing GTs and replacing a portion of the
GT capacity with new CTs. In December 2013, FPL withdrew this request pending additional
environmental monitoring and analyses. Computer modeling of the emissions from the GTs
projected that the GTs would exceed the new NO2 limit. FPL believes this monitoring and
analyses will confirm that the operation of its existing GTs in Broward County will not comply with
the new NO2 regulations. Therefore, for planning purposes, FPL has assumed that all of its
existing Broward County GTs will be removed (a loss of 1,260 MW Summer) and that this capacity
will be partially replaced by 5 new CTs that would be sited in Broward County (an increase of
1,005 MW Summer). This GT removal and CT partial replacement is assumed to occur by the end
of 2018.
a. U.S. Geological Survey (USGS) Map A USGS map of the Lauderdale site is found at the end of this chapter.
b. Proposed Facilities Layout A general layout of the Lauderdale generating facilities is found at the end of this chapter.
c. Map of Site and Adjacent Areas
An overview map of the site and adjacent areas is also found at the end of this chapter.
Florida Power & Light Company 119

d. Existing Land Uses of Site and Adjacent Areas The existing Lauderdale Plant includes two combined cycle units (Units 4 and 5) and two
banks of 12 simple cycle gas turbines (GT1 through GT12 and GT13 through GT24). Units 4
and 5 have net capacity of 442 (Summer) MW each. Each bank of GTs has a net capacity of
420 (Summer) MW. The northern portion of the property is comprised of a forested wetland
area adjacent to the Pond Apple Slough.
The adjacent properties to the Lauderdale Site include residential properties to the south, the
South Broward County Resource Recovery Facility to the west, Pond Apple Slough to the
north and commercial properties to the east. The Dania Cut-off Canal is located along the
southern boundary and the South New River Canal is located along the western and northern
boundaries.
e. General Environment Features On and In the Site Vicinity
1. Natural Environment
FPL Lauderdale Plant property consists of approximately 392 acres, within the Cities of
Dania Beach and Hollywood in Broward County, Florida. The Project area comprises
approximately 20 acres in the northern portion of the existing Plant site, and includes the
approximately 6-acre north gas turbine site containing 12 gas turbines as well as
approximately 14 acres of surrounding forested wetlands and upland spoil piles.
2. Listed Species
No negative impacts to threatened or endangered species are anticipated as a result of
the CT Project.
Based upon the field assessment conducted in 2013, review of United States Fish and
Wildlife (USFWS) and Florida Fish and Wildlife Conservation Commission (FWC)
literature and databases, the Florida Natural Areas Inventory (FNAI) database of
documented listed species occurrences, and the lack of suitable habitat, federally listed
species are not anticipated to utilize the CT Project area. The potential occurrence of
listed flora and fauna within the CT Project area is limited due to the surrounding land
uses (industrial, commercial, and residential areas, as well as Ft. Lauderdale-Hollywood
International Airport), and lack of suitable habitat within and surrounding the CT Project
area to support partial or full life-cycle requirements of federally listed species known to
occur within Broward County.
Florida Power & Light Company 120

3. Natural Resources of Regional Significance Status The construction and operation of the CT Project at this location is consistent with the
existing use at the site and is not expected to have any adverse impacts on parks,
recreation areas, or environmentally sensitive lands. No named wetlands, named
surface waters, Outstanding Florida Waters, or Aquatic Preserves would be impacted by
the proposed Project.
4. Other Significant Features
FPL is not aware of any other significant features of the site.
f. Design Features and Mitigation Options
In the event monitoring confirms that emissions from operation of the existing GTs would not
comply with the NO2 regulations, the design option is to remove 24 gas turbines (GTs) at the
existing Lauderdale Plant, and an additional 12 simple cycle GTs at their nearby Port
Everglades Plant, and replace them with five new highly efficient simple cycle combustion
turbines (CTs). The CTs operate in simple cycle mode with associated stacks and produce
electrical energy by direct connection to an electric generator. The CTs will operate using
natural gas and ultra-low sulfur distillate (ULSD) oil as fuel.
g. Local Government Future Land Use Designations
The site is zoned General Industrial by the City of Dania Beach, a designation intended to
provide for light and medium intensity industrial, research, and assembly fabrication uses.
Electrical power plants are permitted within a General Industrial zoning designation as a
special exception use only. A land use map of the site and adjacent areas is also found at the end of this chapter.
h. Site Selection Criteria Process
The Lauderdale Plant site has been selected as a “Preferred” for the location of peaking unit
facilities due to consideration of various factors including maximizing opportunities to utilize
existing utility infrastructure, system load, transmission interconnection, and economics.
i. Water Resources
The Project will require a marginal increase in demineralized water that will be obtained from
the existing Lauderdale Plant’s water treatment system.
Florida Power & Light Company 121

j. Geological Features of Site and Adjacent Areas According to the Natural Resource Conservation Service ( NRCS) Soil Survey of Broward
County, the Project area is dominated by Okeelanta muck, with Udorthents, shaped as a
minor association. The Okeelanta series consists of very deep, very poorly drained, rapidly permeable soils in
large fresh water marshes and small depressional areas. They formed in decomposed
hydrophytic non-woody organic material overlying sand. Slopes range from zero to two
percent. In un-drained areas the water table is at depths of less than ten inches below the
surface or the soil is covered by water 6 to 12 months during most years. Areas of
Okeelanta muck within the Project area support a mixed native and exotic hardwood
wetland community.
k. Projected Water Quantities for Various Uses The CT Project consists of CTs that are operated in simple cycle mode and do not require a
heat dissipation system. As a result, there are no associated cooling water uses, cooling water
discharges, or other heat dissipation impacts.
l. Water Supply Sources by Type
The CT Project would continue to acquire water from existing water contracts with Broward
County. Therefore, the Project will have no adverse impact to groundwater. The CT Project
would not use onsite groundwater or a new groundwater source for any purpose. The CT
Project would have no adverse impact to surface water.
The CT Project would continue to use municipal potable water from the City of Hollywood to
provide drinking water for employees. There is no projected increase in employment at the
Lauderdale Plant as a result of the CT Project and no associated potable water use increase
for that purpose. Therefore, there would be no impact to drinking water sources from the CT
Project.
m. Water Conservation Strategies Under Consideration
No additional water resources would be required as a result of the CTs project.
n. Water Discharges and Pollution Control
There would be no surface water discharges required for the operation of the CT Project, other
than storm water discharges from non-contact areas. Operation of the CT Project would not
generate leachate and the stormwater management system has been designed to prevent
Florida Power & Light Company 122

direct discharge to surface waters. Therefore, there would be no adverse impact to water
supplies due to runoff or leachate from the CT Project.
The facility will employ a Best Management Practices (BMP) plan and Spill Prevention,
Control, and Countermeasure (SPCC) plan to prevent and control the inadvertent release of
pollutants.
o. Fuel Delivery, Storage, Waste Disposal, and Pollution Control
The fuel to be used in the CTs is natural gas and ULSD oil. Natural gas will be transported to
the facility via existing pipeline. No onsite storage is provided for natural gas. ULSD oil would
be trucked or piped to the facility and stored in double walled ULSD oil tanks.
p. Air Emissions and Control Systems
Air emission rates for NOx with the CT Project would be approximately 90 percent lower than
the existing GT emission rates, resulting in significantly lower air quality impacts. In addition
to lower air emissions, the maximum total air quality impacts for the CT Project are predicted
to be well below and in compliance with the National Ambient Air Quality Standards
(NAAQS). For pollutants such as NO2, the CT Project’s total air quality impacts are predicted
to be significantly reduced by 40 percent or more compared to the existing GTs.
The use of clean fuels (natural gas and ULSD oil) and combustion controls would minimize air
emissions of SO2, sulfuric acid mist (SAM), particulates (PM/PM10/PM2.5), and other fuel-
bound contaminants and ensure compliance with applicable emission-limiting standards.
Combustion controls will minimize the formation of NOx and the formation of CO and VOCs by
combustor design. Further NOx reduction will be achieved by water injection during oil firing.
q. Noise Emissions and Control Systems
It is not expected that noise from the CT Project would exceed the maximum
permissible sound levels in Section 17-86 of the City of Dania Beach noise ordinance. The
operation of the CTs is not expected to exceed the City of Dania Beach maximum permissible
sound levels in residential areas.
The design of the CT Project includes components that mitigate noise from being
emitted to the surrounding environment. The majority of the noise sources, such as the CTs,
are located within enclosures that mitigate sounds emitted by equipment.
Noise expected to be caused by unit construction at the site is expected to be below current
noise levels for the residents nearest the site.
Florida Power & Light Company 123

r. Status of Applications
No licenses or permits have been issued for the CT Project. FPL has submitted applications
to: the Florida Department of Environmental Protection (FDEP) for the Prevention of
Significant Deterioration (PSD) air permit; U.S. Environmental Protection Agency (EPA) for the
Greenhouse Gas air permit; and to the U. S. Army Corps of Engineers (USACE) for the 404
dredge and fill permit. These applications are currently in review with the respective agencies.
Preferred Site # 3: Hendry County, Hendry County FPL has acquired an approximately 3,120-acre site in southeast Hendry County, off CR 833. The
Hendry County site has been listed as a Preferred or Potential Site in previous FPL Site Plans as
a possibility for a future PV facility and/or natural gas-fired CC generation. FPL currently views the
Hendry site as one of the most likely sites to be used for future large-scale generation.
a. Geological Survey (USGS) Map
A USGS map of the site is found at the end of this chapter.
b. Proposed Facilities Layout
A map of the property owned by FPL is found at the end of this chapter.
c. Map of Site and Adjacent Areas
An overview map of the site and adjacent areas is also found at the end of this chapter.
d. Existing Land Uses of Site and Adjacent Areas The existing and future land uses on the site are zoned Planned Unit Development (PUD).
The PUD is currently being challenged. The existing land uses that are adjacent to the site are
predominately agricultural. The property to the south is the Seminole Big Cypress
Reservation.
e. General Environment Features On and In the Site Vicinity
1. Natural Environment
The natural environment adjacent to the north, east, and west of the site are used
predominately for agricultural activities such as improved, unimproved, and woodland
pasture. The majority of the pasture lands includes upland scrub, pine, and hardwoods.
The Seminole Big Cypress Reservation lies to the south.
2. Listed Species
FPL strives to have no adverse impacts on federal- or state-listed terrestrial plants and
animals. Much of southwest Florida is considered habitat for the endangered Florida
Florida Power & Light Company 124

Panther. Although few or no impacts are expected in association with future construction
at the site, FPL anticipates minimizing or mitigating for unavoidable wildlife or wetland
impacts.
3. Natural Resources of Regional Significance Status
Future construction and operation of a solar and/or a natural gas-fired CC generating
facility at this location is not expected to have any adverse impacts on parks, recreation
areas, or environmentally sensitive lands.
4. Other Significant Features
FPL is not aware of any other significant features of the site.
f. Design Features and Mitigation Options
Options include construction of CC and/or solar power generation technologies. Mitigation for
unavoidable impacts may occur through a combination of on- and off-site mitigation.
g. Local Government Future Land Use Designations
Local government future land use designation for the site is Utility. A land use map of the site
and adjacent areas is also found at the end of this chapter.
h. Site Selection Criteria Process
The Hendry County site has been selected as “Preferred” due to consideration of various
factors including system load, transmission interconnection, and economics.
i. Water Resources
Groundwater is anticipated to supply water to the Hendry County site.
j. Geological Features of Site and Adjacent Areas
The site is at an approximate elevation of 10 to 12 feet above mean sea level (msl) and is
located on the Immokalee Rise and the Big Cypress Spur considered terraces created by high
sea level events. The terraces are composed of fine quartz sands that lie discontinuously
upon the surficial aquifer system whose sediments are the Fort Thompson (Pleistocene),
Caloosahatchee Marl (Pleistocene and Pliocene), and Tamiami Formations (Pliocene). Other
soil types in the area include limestone rock, calcareous muds, sands, organic materials, and
mixed solids.
The surficial aquifer is underlain by the Hawthorn formation (confining unit). The Floridan
Aquifer System underlies the Hawthorn formation.
Florida Power & Light Company 125

k. Projected Water Quantities for Various Uses
The estimated quantity of water required for processing at a CC unit is approximately 0.24
million gallons per day (mgd) for uses such as process water and service water. Potable water
demand is expected to average .001 mgd. Minimal amounts of water would be required for a
PV facility. Approximately 7.5 mgd of cooling water would be used in cooling towers for one
CC unit.
l. Water Supply Sources by Type
Potential water supply source is groundwater. Additional evaluations are necessary to
determine the exact source. Process and potable water for the new plant will come from the
existing potable water supply.
m. Water Conservation Strategies Under Consideration
CC and cooling tower technologies utilize less water by design than traditional steam
generation units. PV facilities have minimal water demands. Specific water conservation
strategies will be evaluated and selected during the detailed design phase of any development
project.
n. Water Discharges and Pollution Control
A CC unit at the site would utilize a closed cycle cooling (towers) system for heat dissipation.
The heat recovery steam generator blowdown will be reused to the maximum extent
practicable or mixed with the cooling water flow before discharge. Reverse osmosis (R/O)
reject will be mixed with the plant’s cooling water flow prior to discharge. Wastewater disposal
is anticipated via discharge to an Underground Injection Control well system. Stormwater
runoff would be collected and routed to stormwater ponds. The facility will employ a Best
Management Practices (BMP) plan and Spill Prevention, Control, and Countermeasure
(SPCC) plan to prevent and control the inadvertent release of pollutants.
o. Fuel Delivery, Storage, Waste Disposal, and Pollution Control
Natural gas for a new CC unit will be transported to the site via a new natural gas pipeline
lateral to the site. New gas compressors to raise the gas pressure of the pipeline to the
appropriate level for the new unit may be necessary Ultra-low sulfur light fuel oil will be
received by truck or pipeline and stored in an above-ground storage tank.
p. Air Emissions and Control Systems
The use of natural gas, ultra-low sulfur light fuel oil, and combustion controls would minimize
regulated air emissions from a CC unit and ensure compliance with applicable emission
Florida Power & Light Company 126
limiting standards. Using these clean fuels minimizes emissions of SO2, PM, and other fuel-
bound contaminates. Combustion controls similarly minimize the formation of NOx and the
combustor design will limit the formation of CO and VOCs. When firing natural gas, NOx
emissions will be controlled using dry-low NOx combustion technology and selective catalytic
reduction (SCR). Water injection and SCR will be used to reduce NOx emissions during
operations when using ultra low sulfur fuel oil as backup fuel. CC facility emissions of GHGs
from combustion of natural gas achieve an emission rate substantially lower than the EPA’s
proposed new source performance standards for GHGs. These design alternatives are
equivalent to the Best Available Control Technology for air emissions, and minimize such
emissions while balancing economic, environmental, and energy impacts. Taken together, the
design of a CC unit would incorporate features that would make it among the most efficient
and cleanest power plants in the State of Florida. PV generation does not produce air
emissions.
q. Noise Emissions and Control Systems
Noise anticipated to be caused by unit construction at the site is expected to be minimal.
r. Status of Applications FPL has not submitted any application associated with the Hendry County site.
Preferred Site # 4: NE Okeechobee County, Okeechobee County
FPL has purchased a site of approximately 2,800 acres in Northeast Okeechobee County. The
site is in an unincorporated, rural area and is predominantly used for agricultural production.
FPL’s transmission lines intersect the property. The Northeast Okeechobee County site has been
listed as a Preferred or Potential Site in previous FPL Site Plans as a possibility for a natural gas-
fired CC generation and/or future PV facility. Natural gas-fired CC generation will be made
possible by the May,2017 projected commercial operating date of the Florida Southeast
Connection (FSC) natural gas pipeline. FSC is within 3 miles of the NE Okeechobee County site.
FPL currently views the Okeechobee site as one of the most likely sites to be used for future
large-scale generation.
a. U.S. Geological Survey (USGS) Map A USGS map of the Northeast Okeechobee site is found at the end of this chapter.
b. Proposed Facilities Layout
A map of the property owned by FPL is found at the end of this chapter.
Florida Power & Light Company 127

c. Map of Site and Adjacent Areas
An overview map of the site and adjacent areas is also found at the end of this chapter.
d. Existing Land Uses of Site and Adjacent Areas
The Northeast Okeechobee County site is predominantly used for agricultural production
(cattle and citrus). Adjacent land uses include primarily agriculture and conservation.
e. General Environment Features On and In the Site Vicinity 1. Natural Environment
The majority of the site is comprised of lands dedicated to agricultural production.
2. Listed Species
Minimal impacts to federal- or state-listed terrestrial plants and animals are
expected in association with construction at the site, due to the existing developed
nature of the site and lack of suitable onsite habitat for listed species.
3. Natural Resources of Regional Significance Status
The construction and operation of a power generating facility at this location is not
expected to have any adverse impacts on parks, recreation areas, or environmentally
sensitive lands.
4. Other Significant Features
FPL is not aware of any other significant features of the site.
f. Design Features and Mitigation Options Options include construction of PV or CC technologies. Mitigation for unavoidable impacts
may occur through a combination of on- and off-site mitigation.
g. Local Government Future Land Use Designations
Local government future land use designation for the site is predominantly unimproved
pasture. A land use map of the site and adjacent areas is also found at the end of this chapter.
h. Site Selection Criteria Process
The Northeast Okeechobee County site has been selected as a Preferred Site due to
consideration of various factors including system load, transmission interconnection, the
proximity of the proposed FSC natural gas pipeline, and economics. Environmental issues
were not a deciding factor since this site does not exhibit significant environmental sensitivity.
Florida Power & Light Company 128
i. Water Resources
Groundwater is anticipated to supply water to the Northeast Okeechobee County site.
j. Geological Features of Site and Adjacent Areas
The hydrostratigraphy of the Northeast Okeechobee County site is similar to that of most of
South Florida. In general, the groundwater system underlying Okeechobee County consists of
the Surficial Aquifer System (SAS), the Intermediate Confining Unit (ICU), and the Floridan
Aquifer System (FAS). The SAS consists of approximately 100 to 250 feet of undifferentiated
deposits of sand, shell, clay and silt. The ICU consists of approximately 200 feet of carbonate
rocks interbedded with sandy and silty clay. The multiple layers of the FAS extend thousands
of feet below the ICU.
k. Projected Water Quantities for Various Uses Potable water demand is expected to average .001 mgd. The estimated quantity of water
required for processing at a CC unit is approximately 0.24 million gallons per day (mgd) for
uses such as process water and service water. Approximately 7.5 mgd of cooling water would
be used in cooling towers for a CC unit. Minimal amounts of water would be required for a PV
facility.
l. Water Supply Sources by Type Potential water supply source is groundwater. Additional evaluations are necessary to
determine the exact source. Process and potable water for the new plant will come from the
existing a potable water supply.
m. Water Conservation Strategies Under Consideration
CC technology utilizes less water by design than traditional steam generation units. PV
facilities have minimal water demands. Specific water conservation strategies will be
evaluated and selected during the detailed design phase of any development project.
n. Water Discharges and Pollution Control
A CC plant is anticipated to utilize a closed cycle cooling (towers) system for heat dissipation.
The heat recovery steam generator blowdown will be reused to the maximum extent
practicable or mixed with the cooling water flow before discharge. Reverse osmosis (R/O)
reject will be mixed with the plant’s cooling water flow prior to discharge. Wastewater disposal
is anticipated via discharge to an Underground Injection Control well system. Stormwater
runoff would be collected and routed to stormwater ponds. The facility will employ Best
Florida Power & Light Company 129

Management Practices (BMP) and Spill Prevention, Control, and Countermeasure (SPCC)
plans to prevent and control the inadvertent release of pollutants.
o. Fuel Delivery, Storage, Waste Disposal, and Pollution Control
Natural gas for a new CC unit will be transported to the site via a new natural gas pipeline
lateral. New gas compressors to raise the gas pressure of the pipeline to the appropriate level
for the new unit may be necessary. Back-up fuel supplies of ultra-low sulfur light fuel oil will
be received by truck or pipeline and stored in an above-ground storage tank to ensure
reliability of operations.
p. Air Emissions and Control Systems
The use of natural gas, ultra-low sulfur light fuel oil, and combustion controls would minimize
regulated air emissions from a CC unit and ensure compliance with applicable emission
limiting standards. Using these clean fuels minimizes emissions of SO2, PM, and other fuel-
bound contaminates. Combustion controls similarly minimize the formation of NOx and the
combustor design will limit the formation of CO and VOCs. When firing natural gas, NOx
emissions will be controlled using dry-low NOx combustion technology and selective catalytic
reduction (SCR). Water injection and SCR will be used to reduce NOx emissions during
operations when using ultra-low sulfur light fuel oil as backup fuel. CC facility emissions of
GHGs from combustion of natural gas achieve an emission rate substantially lower than the
EPA’s proposed new source performance standards for GHGs. These design alternatives are
equivalent to the Best Available Control Technology for air emissions, and minimize such
emissions while balancing economic, environmental, and energy impacts. Taken together, the
design of a CC unit would incorporate features that would make it among the most efficient
and cleanest power plants in the State of Florida. PV generation does not produce air
emissions.
q. Noise Emissions and Control Systems
Noise anticipated to be caused by unit construction at the site is expected to be minimal.
r. Status of Applications
FPL has not filed any applications associated with the Northeast Okeechobee County site.
Preferred Site # 5: Putnam Site, Putnam County
FPL is currently evaluating the existing Putnam Plant site for future natural gas-fired generation as
part of a potential modernization project. This 66 acre site is located on the east side of Highway
100 opposite the former FPL Palatka Plant in East Palatka. The Putnam site has been listed as a
Potential Site in previous FPL Site Plans as a possibility for future natural gas-fired CC generation.
Florida Power & Light Company 130

FPL currently views the Putnam site as one of the most likely sites to be used for future large-
scale generation.
a. U.S. Geological Survey (USGS) Map
A USGS map of the Putnam site is found at the end of this chapter.
b. Proposed Facilities Layout A map of the property owned by FPL is found at the end of this chapter.
c. Map of Site and Adjacent Areas
An overview map of the site and adjacent areas is also found at the end of this chapter.
d. Existing Land Uses of Site and Adjacent Areas
The Putnam site is designated as Industrial land use. Adjacent land uses include power
generation and associated facilities (the former Palatka Plant) as well as Mixed Wetland
Hardwoods, Residential, and Hardwood-Coniferous Mixed.
e. General Environment Features On and In the Site Vicinity
1. Natural Environment The majority of the site is developed and has facilities necessary for power plant
operations. No significant environmental features have been identified at this time.
2. Listed Species
Minimal impacts to federal- or state-listed terrestrial plants and animals are
expected in association with construction at the site, due to the existing developed
nature of the site and lack of suitable onsite habitat for listed species.
3. Natural Resources of Regional Significance Status
The construction and operation of a power generating facility at this location is not
expected to have any adverse impacts on parks, recreation areas, or environmentally
sensitive lands.
4. Other Significant Features
FPL is not aware of any other significant features of the site.
f. Design Features and Mitigation Options
Options include construction of CC technology. Mitigation for unavoidable impacts may occur
through a combination of on- and off-site mitigation.
Florida Power & Light Company 131

g. Local Government Future Land Use Designations
Local government future land use designation for the site is Industrial. A land use map of the
site and adjacent areas is also found at the end of this chapter.
h. Site Selection Criteria Process
The Putnam site has been selected as a Preferred Site due to consideration of various factors
including system load, transmission interconnection, and economics.
i. Water Resources
The St John’s River and/or regional water supply initiatives are potential water sources.
j. Geological Features of Site and Adjacent Areas The hydrostratigraphy of the Putnam site is similar to that of most of North Florida. In general,
the groundwater system underlying Putnam consists of the Surficial Aquifer System (SAS),
and the Floridan Aquifer System (FAS).
k. Projected Water Quantities for Various Uses
Potable water demand is expected to average .001 million gallons per day (mgd). The
estimated quantity of water required at a CC unit is approximately 0.24 mgd for uses such as
process water and service water. Approximately 7.5 mgd of cooling water would be used in
cooling towers for a CC unit.
l. Water Supply Sources by Type Potential water supply source is the St. John’s River. Additional evaluations are necessary to
determine the exact source. Process and potable water for the new plant will come from the
existing a potable water supply.
m. Water Conservation Strategies Under Consideration
CC and cooling tower technologies utilize less water by design than traditional steam
generation units. Specific water conservation strategies will be evaluated and selected during
the detailed design phase of the project development.
n. Water Discharges and Pollution Control
A CC plant is anticipated to utilize a closed cycle cooling (towers) system for heat dissipation.
The heat recovery steam generator blowdown will be reused to the maximum extent
practicable or mixed with the cooling water flow before discharge. Reverse osmosis (R/O)
Florida Power & Light Company 132

reject will be mixed with the plant’s cooling water flow prior to discharge. Wastewater disposal
is anticipated via discharge to surface and/or ground water as is the case with the existing
Putnam Plant. Stormwater runoff would be collected and routed to stormwater ponds. The
facility will employ Best Management Practices (BMP) and Spill Prevention, Control, and
Countermeasure (SPCC) plans to prevent and control the inadvertent release of pollutants.
o. Fuel Delivery, Storage, Waste Disposal, and Pollution Control
Natural gas for a new CC unit will be transported to the site via a new natural gas pipeline
lateral. New gas compressors to raise the gas pressure of the pipeline to the appropriate level
for the new unit may be necessary. Back-up fuel supplies of ultra-low sulfur light fuel oil will
be received by water-borne delivery, truck, or pipeline and stored in an above-ground storage
tank to ensure reliability of operations.
p. Air Emissions and Control Systems
The use of natural gas, ultra-low sulfur light fuel oil, and combustion controls would minimize
regulated air emissions from a CC unit and ensure compliance with applicable emission
limiting standards. Using these clean fuels minimizes emissions of SO2, PM, and other fuel-
bound contaminates. Combustion controls similarly minimize the formation of NOx and the
combustor design will limit the formation of CO and VOCs. When firing natural gas, NOx
emissions will be controlled using dry-low NOx combustion technology and selective catalytic
reduction (SCR). Water injection and SCR will be used to reduce NOx emissions during
operations when using ultra- low sulfur light fuel oil as backup fuel. CC facility emissions of
GHGs from combustion of natural gas achieve an emission rate substantially lower than the
EPA’s proposed new source performance standards for GHGs. These design alternatives are
equivalent to the Best Available Control Technology for air emissions and minimize such
emissions while balancing economic, environmental, and energy impacts. Taken together, the
design of a CC unit would incorporate features that would make it among the most efficient
and cleanest power plants in the State of Florida.
q. Noise Emissions and Control Systems
Noise anticipated to be caused by unit construction at the site is expected to be minimal.
r. Status of Applications FPL has not submitted any applications associated with the Putnam site.
Preferred Site # 6: Turkey Point Plant, Miami-Dade County The Turkey Point Plant (Turkey Point) is located on the west side of Biscayne Bay, 25 miles south
of Miami. Turkey Point is directly on the shoreline of Biscayne Bay and is geographically located
Florida Power & Light Company 133

approximately 9 miles east of Florida City on Palm Drive. The land surrounding Turkey Point is
owned by FPL and acts as a buffer zone. Turkey Point is comprised of two natural gas/oil
conventional steam units (Units 1 & 2), two nuclear units (Units 3 & 4), one combined cycle natural
gas unit (Unit 5), nine small diesel generators, and the cooling canals. A capacity uprate project
for the two nuclear units was successfully completed in 2013. The Everglades Mitigation Bank
(EMB), an approximately 13,000 acre, FPL-maintained natural wildlife and wetlands area that has
been set aside, is located to the south and west of the site.
In regard to Turkey Point Units 6 & 7, FPL is pursuing licensing for two new nuclear units at
Turkey Point. Each of these two units would provide 1,100 MW of capacity. The current
projections for the earliest in-service dates for the two new units remain 2022 (for Turkey Point
Unit 6) and 2023 (for Turkey Point Unit 7). In addition to the two generating units, supporting
buildings, facilities, and equipment will be located on the Turkey Point Units 6 & 7 site, along with
a construction laydown area. Proposed associated facilities include: a nuclear administration
building, a training building, a parking area, an FPL reclaimed water treatment facility and
reclaimed water pipelines, radial collector wells and delivery pipelines, an equipment barge
unloading area, transmission lines (and transmission system improvements elsewhere within
Miami-Dade County), access roads and bridges, and potable water pipelines.
a. U.S. Geological Survey (USGS) Map
USGS maps of the Turkey Point area, with the proposed location of Turkey Point Units 6 & 7
identified, are found at the end of this chapter.
b. Proposed Facilities Layout
Maps of the general layout of Turkey Point Units 6 &7 are found at the end of this chapter.
c. Map of Site and Adjacent Areas
Land Use / Land Cover overview maps of the Turkey Point Units 6 & 7 site and adjacent areas
are also found at the end of this chapter.
d. Existing Land Uses of Site and Adjacent Areas
Turkey Point Plant is currently home to five generating units and support facilities that occupy
approximately 150 acres of the approximately 9,400-acre Turkey Point property. Prominent
features beyond the power block area include the intake system, cooling canal system,
switchyard, spent fuel storage facilities, and technical and administrative support facilities The
cooling canal system occupies approximately 5,900 acres.
Florida Power & Light Company 134

The two 400-megawatt (MW) (nominal) fossil fuel-fired steam electric generation units at
Turkey Point have been in service since 1967 (Unit 1) and 1968 (Unit 2). These units have
historically burned residual fuel oil and/or natural gas with a maximum equivalent sulfur
content of one percent. Unit 2 is currently serving, not as a power generating unit, but as a
synchronous condenser to provide voltage support to the southeastern end of FPL’s
transmission system. The two original 700-MW (nominal) nuclear units have been in service
since 1972 (Unit 3) and 1973 (Unit 4) and were uprated to a total of approximately 1,632
(Summer) MW’s in 2013. Turkey Point Units 3 and 4 are pressurized water reactor (PWR)
units. Turkey Point Unit 5 is a net 1,148 (Summer) MW natural gas-fired combined cycle unit
that began operation in 2007. The site for the new Units 6 & 7 is south of existing Units 3 and
4 and occupies approximately 300 acres within the existing cooling canal system.
Properties adjacent to Turkey Point property are almost exclusively undeveloped land. The
FPL-owned EMB is adjacent to most of the western and southern boundaries of Turkey Point
property. The South Florida Water Management District (SFWMD) Canal L-31E is also
situated to the west of Turkey Point property. The eastern portions of Turkey Point property
are adjacent to Biscayne Bay, the Biscayne National Park (BNP), and Biscayne Bay Aquatic
Preserve. The southeastern portion of Turkey Point property is bounded by state-owned land
located on Card Sound. The Homestead Bayfront Park, owned and operated by Miami-Dade
County, is situated to the north of the Turkey Point property.
e. General Environment Features On and In the Site Vicinity
1. Natural Environment
Turkey Point is located directly on the northwest, west, and southwest shoreline of
Biscayne Bay and the Biscayne National Park, 25 miles south of Miami. Biscayne National
Park was first established in 1968 as a National Monument and was expanded in 1980 to
approximately 173,000 acres of water, coastal lands, and 42 keys. A portion of Biscayne
Bay Aquatic Preserve, a state-owned preserve, is adjacent to the eastern boundary of the
Turkey Point plant property. The Biscayne Bay Aquatic Preserve is a shallow, subtropical
lagoon consisting of approximately 69,000 acres of submerged State land that has been
designated as an Outstanding Florida Water.
The approximately 300-acre Turkey Point Units 6 & 7 site consists of the plant area and
adjacent areas designated for laydown and ancillary facilities. The site includes
hypersaline mud flats, man-made active cooling canals, man-made remnant canals,
previously filled areas/roadways, mangrove heads associated with historical tidal
channels, dwarf mangroves, open water /discharge canal associated with the cooling
Florida Power & Light Company 135

canals on the western portion of the site, wet spoil berms associated with remnant canals,
and upland spoil areas.
2. Listed Species
Threatened, endangered, and/or animal species of special concern known to occur at the
site, transmission line corridors, or in the nearby Biscayne National Park, include the
peregrine falcon (Falco peregrinus), wood stork (Mycteria americana), American crocodile
(Crocodylus acutus), roseate spoonbill (Ajaja ajaja), little blue heron (Egretta caerulea),
snowy egret (Egretta thula), American oystercatcher (Haematopus palliates), least tern
(Sterna antillarum), the white ibis (Eudocimus albus), Florida manatee (Trichechus
manatus latirostris), eastern indigo snake (Drymarchon couperi), snail kite (Rostrhamus
sociabilis plumbeus), white-crowned pigeon (Patagioenas leucocephala), and bald eagle
(Haliaeetus leucocephalus). No bald eagle nests are known to exist in the vicinity of the
site. The federally listed, threatened American crocodile thrives at Turkey Point, primarily
in and around the southern end of the cooling canals which lie south of the Turkey Point
Unit 6 & 7 area. The majority of Turkey Point is considered American crocodile habitat
due to the mobility of the species and use of the site for foraging, traversing, and basking.
FPL manages a program for the conservation and enhancement of the American
Crocodile and the program is credited with survival improvement and contributing to the
downlisting of the American Crocodile from endangered to threatened.
Some listed flora species likely to occur at the site or vicinity include pinepink (Bletia
purpurea), Florida brickell-bush (Brickellia mosieri), Florida lantana (Lantana depressa
var. depressa), mullien nightshade (Solanum donianum), and lamarck's trema (Trema
lamarckianum).
The construction, and operation after construction, of Turkey Point Unit 6 & 7 project is not
expected to adversely affect any rare, endangered, or threatened species.
3. Natural Resources of Regional Significance Status
Significant features within the vicinity of the site include Biscayne National Park, the
Biscayne Bay Aquatic Preserve, Miami-Dade County Homestead Bayfront Park, and
Everglades National Park. The portion of Biscayne Bay adjacent to the site is included
within the Biscayne National Park. Biscayne National Park contains 180,000 acres,
approximately 95 percent of which is open water interspersed with more than 40 keys.
The Biscayne National Park headquarters is located approximately two miles north of
Turkey Point and is adjacent to the Miami-Dade County Homestead Bayfront Park, which
contains a marina and day-use recreational facilities.
Florida Power & Light Company 136

4. Other Significant Features
FPL is not aware of any other significant features of the site.
f. Design Features and Mitigation Options
For Turkey Point Units 6 & 7, the technology proposed is the Westinghouse AP1000
pressurized water reactor (PWR). This design is certified by the Nuclear Regulatory
Commission (NRC) under 10 CFR 52 and incorporates the latest technology and more
advanced safety features than today’s nuclear plants that have already achieved record safety
levels. The Westinghouse AP1000 unit consists of the reactor, steam generators, pressurizer,
and steam turbine/electric generator. Condenser cooling for the Units 6 & 7 steam turbines will
be accomplished using six circulating water cooling towers. The makeup water reservoir is the
reinforced concrete structure beneath the circulating water system cooling towers that will
contain reserve reclaimed water capacity to be used for the circulating water system. The
structures for the Westinghouse AP1000 are the nuclear island (containment building, shield
building, and auxiliary building), turbine building, annex building, diesel generator building, and
radwaste building. The plant area will also contain the Clear Sky substation (switchyard) that
will connect Units 6 & 7 to FPL’s transmission system.
g. Local Government future Land Use Designations
The Turkey Point Plant site is designated by the Miami-Dade County Comprehensive
Development Management Plan as an IU-3 (Industrial, Utilities, and Communications)
Unlimited Manufacturing District that carries a dual designation of MPA (Mangrove Protection
Area) in portions of the property. There are also areas designated GU – “Interim District.”
Designations for the surrounding area are primarily GU – “Interim District.”
h. Site Selection Criteria Process
For Turkey Point Units 6 & 7, FPL conducted an extensive site selection analysis leading to
the selection of the Turkey Point site as the site that, on balance, provided the most favorable
location for developing new nuclear generation to serve FPL’s customers. The Site Selection
Study employed the principles of the Electric Power Research Institute (EPRI) siting
guidelines and is modeled upon applicable NRC site suitability and National Environmental
Policy Act (NEPA) criteria regarding the consideration of alternative sites. The study
convened a group of industry and FPL subject matter experts to develop and assign weighting
factors to a broad range of site selection criteria. Twenty-three candidate sites were then
ranked using the siting criteria. This review allowed the list of candidates to be reduced until
the best site emerged. Key factors contributing to the selection of the Turkey Point site
include the existing transmission and transportation infrastructure to support new generation,
the large size and seclusion of the site while being relatively close to the load center, and the
Florida Power & Light Company 137

long-standing record of safe and secure operation of nuclear generation at the site since the
early 1970s.
i. Water Resources
In regard to Turkey Point Units 6 & 7, the primary source of cooling water makeup will be
reclaimed water from the Miami-Dade County Water and Sewer Department (MDWASD), with
potable water also from MDWASD. When reclaimed water is not available in sufficient quantity
and quality of water needed for cooling, makeup water will be saltwater supplied by radial
collector wells that are recharged from the marine environment of Biscayne Bay. Horizontal
collector wells (radial collector wells) have become widely used for the purpose of inducing
infiltration from surface water bodies into hydraulically-connected aquifer systems in order to
develop moderate to high capacity water supplies. Turkey Point Units 6 & 7 wastewater will be
discharged via on-site deep injection wells.
j. Geological Features of Site and Adjacent Areas
Turkey Point lies upon the Floridian Plateau, a partly-submerged peninsula of the continental
shelf. The peninsula is underlain by approximately 4,000 to 15,000 feet of sedimentary rocks
consisting of limestone and associated formations that range in age from Paleozoic to Recent.
Little is known about the basement complex of Paleozoic igneous and metamorphic rocks due
to their great depth.
Generally in Miami-Dade County, the surficial aquifer (Biscayne Aquifer) consists of a wedge-
shaped system of porous clastic and carbonate sedimentary materials, primarily limestone
and sand deposits of the Miocene to late Quaternary age. The Biscayne Aquifer is thickest
along the eastern coast and varies in thickness from 80 to 200 feet thick. The surficial aquifer
is typically composed of Pamlico Sand, Miami Limestone (Oolite), the Fort Thompson and
Anastasia Formations (lateral equivalents), Caloosahatchee Marl, and the Tamiami formation.
The lower confining layers below the surficial aquifer range in thickness from 350 to 600 feet
and are composed of the Hawthorn Group. Beneath the Hawthorn Group, the Floridan Aquifer
System ranges from 2,800 to 3,400 feet thick and consists of Suwannee Limestone, Avon
Park Limestone, and the Oldsmar Formations.
k. Projected Water Quantities for Various Uses
The estimated quantity of water required for the new Turkey Point Units 6 & 7 for industrial
processing is approximately 936 gallons per minute (gpm) for uses such as process water and
service water. Approximately 55.3 million gallons per day (mgd) of cooling water would be
cycled through the cooling towers. Water quantities needed for other uses such as potable
water are estimated to be approximately 50,400 gallons per day (gpd) for Units 6 & 7.
Florida Power & Light Company 138

l. Water Supply Sources and Type
The water for the various water needs of Turkey Point 6 & 7 will be obtained from a reclaimed
water supply, a saltwater supply, and a potable water supply. Reclaimed water will be used as
makeup water to the cooling water system with saltwater from radial collector wells as a back-
up water source to be used when reclaimed water is not available in sufficient quantity or
quality.
Potable water will be used as makeup water for the service water system. The potable water
supply will also provide water to the fire protection system, demineralized water treatment
system, and other miscellaneous uses.
m. Water Conservation Strategies
Use of reclaimed water from MDWASD Turkey Point Units 6 & 7 is a beneficial and cost-
effective means of increasing the use of reclaimed water. This use of reclaimed water helps
Miami-Dade County meet approximately half of its wastewater reuse goals and will provide
environmental benefits by reducing the volume of wastewater discharged by the County. In
the absence of reuse opportunities, this treated domestic wastewater would likely continue to
be discharged to the ocean or into deep injection wells.
Miami-Dade County is required to eliminate ocean outfalls and increase the amount of water
that is reclaimed for environmental benefit and other beneficial uses. Turkey Point Units 6 & 7
will use reclaimed water 24 hours per day, 365 days per year when operating and when the
reclaimed water is available in sufficient quantity and quality.
n. Water Discharges and Pollution Control Turkey Point Units 6 & 7 will dissipate heat from the power generation process using cooling
towers. Blowdown water or discharge from the cooling towers, along with other wastestreams,
will be injected into the boulder zone of the Floridan Aquifer. Non-point source discharges are
not an issue since there will be none at this facility. Storm water runoff will be released to the
closed-loop cooling canal system.
Turkey Point Units 6 & 7 will employ Best Management Practices (BMP) plans and Spill
Prevention, Control, and Countermeasure (SPCC) plans to prevent and control the inadvertent
release of pollutants.
o. Fuel Delivery, Storage, Waste Disposal, and Pollution Control
The Turkey Point Units 6 & 7, reactors will contain enriched uranium fuel assemblies. A fuel
assembly consists of 264 fuel rods, 24 guide thimbles, and 1 instrumentation tube in a 17-by-
Florida Power & Light Company 139

17 square array. The fuel rods consist of enriched uranium, in the form of cylindrical pellets of
sintered uranium dioxide contained in ZIRLO™ tubing.
New fuel assemblies will be transported to Turkey Point for use in Units 6 & 7 by truck from a
fuel fabrication facility in accordance with U.S. Department of Transportation (DOT) and NRC
regulations. Spent fuel assemblies being discharged will remain in the spent fuel pool while
short half-life isotopes decay.
After a sufficient decay period, the fuel would be transferred to an on-site independent spent
fuel storage installation facility or an off-site disposal facility. Packaging of the fuel for off-site
shipment will comply with the applicable DOT and NRC regulations for transportation of
radioactive material.
The U.S. Department of Energy (DOE) is responsible for spent fuel transportation from reactor
sites to a repository under the Nuclear Waste Policy Act of 1982, as amended. FPL has
executed a standard spent nuclear fuel disposal contract with DOE for fuel used in Units 6 &
7.
p. Air Emissions and Control Systems
Turkey Point Units 1, 2, and 5, and the emergency diesel generators associated with Units 3
and 4, are classified as a major source of air pollution. FDEP has issued a separate Title V Air
Operating Permit for the fossil units at Turkey Point and for the emergency diesel generators
associated with the nuclear units. There are no operating limits for the emergency generators
or diesel engines. Emergency diesel generators are limited to use ultra-low sulfur diesel fuel
(0.0015% sulfur). NOx emissions are regulated under Reasonably Available Control
Technology (RACT) requirements in Rule 62-296.570(4) (b) 7 F.A.C., which limit NOx
emissions to 4.75 lb/MMBtu. The use of 0.05 percent sulfur diesel fuel and good combustion
practices serve to keep NOx emissions under this limit.
Regarding Turkey Point Units 6 & 7, the units will also minimize FPL system air pollutant
emissions by using nuclear fuel to generate electric power. This includes avoiding emissions
of particulate matter (PM), sulfur dioxide (SO2), nitrogen oxides (NOx), carbon monoxide
(CO), carbon dioxide (CO2), and volatile organic compounds (VOC). The circulating water
cooling towers will be equipped with high-efficiency drift or mist eliminators to minimize
emissions of PM to 0.0005 percent of the circulating water; which represents 99.99-percent
control of potential drift emissions based on the circulating water flow.
Florida Power & Light Company 140

The diesel engines necessary to support Turkey Point Units 6 & 7 and fire pump engines will
be purchased from manufacturers whose engines meet the EPA’s New Source Performance
Standards (NSPS) Subpart IIII emission limits.
q. Noise Emissions and Control Systems
Field surveys and impact assessments of noise expected to be caused by activities
associated with the Turkey Point Units 6 & 7 project were conducted. Predicted noise levels
associated with these projects are not expected to result in adverse noise impacts in the
vicinity of the site.
r. Status of Applications
The Turkey Point Units 6 & 7 Site Certification Application (SCA), under the Florida Electrical
Power Plant Siting Act, was filed in June 2009 and a final order is anticipated in mid-2014.
The FPSC issued the final order approving the need for this additional nuclear capacity in April
2008.
A Combined License Application for Units 6 & 7 was submitted to the NRC in June 2009.
There are two components to that application; one is the Environmental Assessment (EA) and
the other is the Safety component. The Application is still in process.
Besides the certification and the license, additional approvals have been issued for Turkey
Point Units 6 & 7 including Miami-Dade County Unusual Use approvals that were issued in
2007 and 2013 and a Land Use Consistency Determination that was issued in 2013. The
Prevention of Significant Deterioration (Air permit) was issued in 2009. In addition, a permit to
construct an exploratory well and a dual zone monitoring well, under the Underground
Injection Control Program, was issued in 2010, and a permit to convert the exploratory well, to
an injection well and to operationally test the system, was issued in 2013. Permits from the
Federal Aviation Administration (FAA) for the containment structure were originally issued in
2009 and renewed in 2012.
The western transmission lines associated with Units 6 & 7 (2 500 kV New Clear Sky
Substation – Levee Substation and 1 230 kV New Clear Sky Substation – Pennsuco
Substation) will utilize the existing approximately 40-mile-long transmission line right-of-way
acquired by FPL in the 1960s and early 1970s between the Turkey Point plant property and
Levee Substation. A 7.4 mile long segment of that existing right-of-way became surrounded by
the Everglades National Park in 1989 when the East Everglades Expansion Area south of
Tamiami Trail (US-41) was added to the Park. The National Park Service and several other
federal, state and local agencies entered into contingent agreements in 2008 to exchange
Florida Power & Light Company 141

FPL’s fee-owned property within the Park for an alternative right-of-way along the Park’s
eastern boundary (the Exchange Right-of-Way). That land exchanges was authorized by the
U.S. Congress in the 2009 Omnibus Public Lands Management Act, and the National Park
Service is currently engaged in a National Environmental Policy Act (NEPA) review of the
proposed exchange. The Recommended Order to be considered by the Siting Board in 2014
recommends for approval FPL’s West Preferred Corridor, which includes the Exchange Right-
of-Way, as a back-up western transmission line corridor to another corridor. The primary
western corridor recommended for approval is the West Consensus Corridor (comprising an
alternate corridor proposed by the Miami-Dade Limestone Products Association and a portion
of FPL’s West Preferred Corridor). Both of those western transmission line corridors
recommended for certification use the Exchange Right-of-Way. In the event the pending land
exchange with the National Park Service and other agencies is not consummated on a timely
basis, FPL will need to evaluate other potential western corridors for the western transmission
lines associated with Units 6 & 7, including its existing fee-owned right-of-way in the Park, and
seek necessary approvals for construction of the required transmission facilities.
IV.F.2 Potential Sites for Generating Options
Four (4) sites are currently identified as Potential Sites for future generation additions to meet
FPL’s projected capacity and energy needs.6 These sites have been identified as Potential Sites
due to considerations of location to FPL load centers, space, infrastructure, and/or accessibility to
fuel and transmission facilities. These sites are suitable for different capacity levels and
technologies, including both renewable energy and non-renewable energy technologies for
various sites.
Each of these Potential Sites offer a range of considerations relative to engineering and/or costs
associated with the construction and operation of feasible technologies. In addition, each Potential
Site has different characteristics that will require further definition and attention.
Permits are presently considered to be obtainable for each of these sites. No significant
environmental constraints are currently known for any of these sites. The Potential Sites briefly
discussed below are presented in alphabetical order. At this time, FPL considers each site to be
equally viable.
6 As has been described in previous FPL Site Plans, FPL also considers a number of other sites as possible sites for future generation additions. These include the remainder of FPL’s existing generation sites and other Greenfield sites. Greenfield sites that FPL currently does not own, or for which FPL has not currently secured the necessary rights to, are not specifically identified as Potential Sites in order to protect the economic interests of FPL and its customers.
Florida Power & Light Company 142

Potential Site # 1: Babcock Ranch, Charlotte County This site is located within the proposed Babcock Ranch Community on the north side of Tuckers
Grade, approximately 10.5 miles north of the intersection of SR-80 and SR-31 and 1.1 miles east
of SR-31. The project is bordered on the north by the Babcock Ranch Preserve owned by the
State of Florida. This site is a possibility for an FPL PV facility. FPL has received all permits
necessary to construct a 74 MW PV facility at this location.
a. U.S. Geological Survey (USGS) Map A map of this site is found at the end of this chapter.
b. Land Uses
Existing land use on the site is the Babcock Ranch Overlay District, and it is zoned as the
Babcock Ranch Overlay Zoning District. This land use and zoning allows for solar facilities.
c. Environmental Features FPL anticipates mitigating for unavoidable wildlife and/or wetland impacts as needed as a
result of a PV project constructed at this site.
d. Water Quantities Minimal amounts of water, if any, would be required for a PV facility.
e. Supply Sources
Minimal water would be required for a PV facility. A small amount may be needed to
occasionally clean the solar panels in the absence of sufficient rainfall. Any such water may be
brought to the site by truck.
Potential Site # 2: DeSoto Solar Expansion, DeSoto County
The DeSoto site is located at 4051 Northeast Karson Street which is approximately 0.3 miles east
of U.S. Highway 17 and immediately north of Bobay Road in Arcadia, Florida. The site is located
in Sections 26, 27, & 35, Township 36 South, and Range 25 East. FPL owns an approximate
13,000 acre parcel in DeSoto County. FPL has designated approximately 5,177 acres for
development of a PV facility.
The DeSoto site is home to a 25 MW PV facility that has been operational since 2009. Up to an
additional 275 MW of PV generation could be constructed in phases on the remaining
undeveloped land. FPL has initiated permitting for the additional PV facilities.
Florida Power & Light Company 143

a. U.S. Geological Survey (USGS) Map
A map of this site is found at the end of this chapter.
b. Land Uses
Existing land use on the site is agricultural. The future land use is Electric Generating Facility.
c. Environmental Features
There are no significant environmental features on the site.
d. Water Quantities Minimal amounts of water would be required for a future expansion of the existing PV facility.
e. Supply Sources
Minimal water would be required for an expanded PV facility. A small amount may be needed
to occasionally clean the PV panels in the absence of sufficient rainfall. Potable water will be
required in the administration building and maintenance building. FPL would propose to utilize
existing wells onsite to accommodate water needs.
Potential Site # 3: Manatee Plant Site, Manatee County
The existing FPL Manatee Plant 9,500-acre site is located in unincorporated north-central
Manatee County. The existing power generating facilities are located in all or portions of Sections
18 and 19 of Township 33S, Range 20-E. The plant site lies approximately 5 miles east of Parrish,
Florida. It is approximately 5 miles east of U.S. Highway 301 and 9.5 miles east of Interstate
Highway 75 (I-75). The existing plant is approximately 2.5 miles south of the Hillsborough-
Manatee County line. A portion of the north property boundary of the plant site abuts the county
line. State Road 62 (SR 62) is about 0.7 mile south of the plant, with the plant entrance road going
north from that highway. This site is a possible location for an FPL PV facility. FPL has received
the federal and state permits required to construct approximately 50 MW of PV at this location.
a. U.S. Geological Survey (USGS) Map
A map of the site is found at the end of this chapter.
b. Land Uses Existing land use on the site is agricultural. The property is zoned Planned Development /
Public Interest (PD-PI), which will allow for electrical generation.
Florida Power & Light Company 144

c. Environmental Features
FPL anticipates mitigating for unavoidable wildlife and/or wetland impacts as needed as a
result of a PV project constructed at this site.
d. Water Quantities
Minimal amounts of water would be required for a PV facility.
e. Supply Sources
Minimal water would be required for a PV facility. A small amount may be needed to
occasionally clean the PV panels in the absence of sufficient rainfall. Panel cleaning water
source may be existing potable water or water tank trucked to the site.
Potential Site # 4: Martin County, Martin County FPL is currently evaluating potential sites in Martin County for a future PV facility. No specific
locations have been selected at this time.
a. U.S. Geological Survey (USGS) Map
A USGS map of the county has been included at the end of this chapter.
b. Land Uses
This information is not available because a specific site has not been selected at this time.
c. Environmental Features
This information is not available because a specific site has not been selected at this time.
d. Water Quantities
Minimal amounts of water would be required for a PV facility.
e. Supply Sources
Minimal water would be required for a PV facility. A small amount may be needed to
occasionally clean the PV panels in the absence of sufficient rainfall.
Florida Power & Light Company 145

(This page is left intentionally blank.)
Florida Power & Light Company 146

CHAPTER V
Other Planning Assumptions & Information
Florida Power & Light Company
193

(This page is left intentionally blank.)
Florida Power & Light Company
194

Introduction
The Florida Public Service Commission (FPSC), in Docket No. 960111-EU, specified certain information
that was to be included in an electric utility’s Ten Year Power Plant Site Plan filing. Among this specified
information was a group of 12 items listed under a heading entitled “Other Planning Assumptions and
Information.” These 12 items basically concern specific aspects of a utility’s resource planning work. The
FPSC requested a discussion or a description of each of these items.
These 12 items are addressed individually below as separate “Discussion Items”.
Discussion Item # 1: Describe how any transmission constraints were modeled and explain the
impacts on the plan. Discuss any plans for alleviating any transmission constraints.
FPL’s resource planning work considers two types of transmission limitations/constraints: external
limitations and internal limitations. External limitations deal with FPL’s ties to its neighboring systems.
Internal limitations deal with the flow of electricity within the FPL system.
The external limitations are important since they affect the development of assumptions for the amount of
external assistance that is available to the FPL system as well as the amount and price of economy energy
purchases. Therefore, these external limitations are incorporated both in the reliability analysis and
economic analysis aspects of resource planning. The amount of external assistance which is assumed to
be available is based on the projected transfer capability to FPL from outside its system as well as
historical levels of available assistance. In the loss of load probability (LOLP) portion of its reliability
analyses, FPL models this amount of external assistance as an additional generator within FPL’s system
which provides capacity in all but the peak load months. The assumed amount and price of economy
energy are based on historical values and projections from production costing models.
Internal transmission limitations are addressed by identifying potential geographic locations for potential
new generating units that minimize adverse impacts to the flow of electricity within FPL’s system. The
internal transmission limitations are also addressed by developing the direct costs for siting new units at
different locations, by evaluating the cost impacts created by the new unit/unit location combination on the
operation of existing units in the FPL system, and/or by evaluating the costs of transmission additions that
may be needed to address regional concerns regarding an imbalance between load and generation in a
given region. Both of these site- and system-related transmission costs are developed for each different
unit/unit location option or groups of options. When analyzing DSM portfolios, such as in a DSM Goals
docket, FPL also examines the potential of utility DSM energy efficiency programs to avoid/defer regional
transmission expenditures that would otherwise be needed to import power into that region by lowering
electrical load in Southeastern Florida. In addition, transfer limits for capacity and energy that can be
Florida Power & Light Company
195

imported into the Southeastern Florida region (Miami-Dade and Broward Counties) of FPL’s system are
also developed for use in FPL’s production costing analyses. (A further discussion of the Southeastern
Florida region of FPL’s system, and the need to maintain a regional balance between generation and
transmission contributions to meet regional load, is found in Chapter III.)
FPL’s annual transmission planning work determines transmission additions needed to address limitations
and to maintain/enhance system reliability. FPL’s planned transmission facilities to interconnect and
integrate generating units in FPL’s resource plans, including those transmission facilities that must be
certified under the Transmission Line Siting Act, are presented in Chapter III.
Discussion Item # 2: Discuss the extent to which the overall economics of the plan were
analyzed. Discuss how the plan is determined to be cost-effective. Discuss any changes in the
generation expansion plan as a result of sensitivity tests to the base case load forecast.
FPL typically performs economic analyses of competing resource plans using as an economic criterion
FPL’s levelized system average electric rates (i.e., a Rate Impact Measure or RIM approach). In addition,
for analyses in which DSM levels are not changed, FPL uses the equivalent criterion of the cumulative
present value of revenue requirements for the FPL system.7
The load forecast that is presented in FPL’s 2014 Site Plan was developed in October 2014. The only load
forecast sensitivities analyzed during 2013/early 2014 were high load forecast sensitivities developed to
analyze FPL’s potential future natural gas needs and to analyze the quality of FPL’s future reserves.
7 FPL’s basic approach in its resource planning work is to base decisions on a lowest electric rate basis. However, when DSM levels are considered a “given” in the analysis (i.e., when only new generating options are considered), the lowest electric rate basis approach and the lowest system cumulative present value of revenue requirements basis approach yield identical results in terms of which resource options are more economic. In such cases FPL evaluates resource options on the simpler-to-calculate (but equivalent) lowest cumulative present value system revenue requirements basis.
Florida Power & Light Company
196

Discussion Item # 3: Explain and discuss the assumptions used to derive the base case fuel
forecast. Explain the extent to which the utility tested the sensitivity of the base case plan to high
and low fuel price scenarios. If high and low fuel price sensitivities were performed, explain the
changes made to the base case fuel price forecast to generate the sensitivities. If high and low fuel
price scenarios were performed as part of the planning process, discuss the resulting changes, if
any, in the generation expansion plan under the high and low fuel price scenario. If high and low
fuel price sensitivities were not evaluated, describe how the base case plan is tested for sensitivity
to varying fuel prices.
The basic assumptions FPL used in deriving its fuel price forecasts are discussed in Chapter III of this
document. FPL used three fuel cost, and three environmental compliance cost, forecasts in analyses
supporting its 2013 nuclear cost recovery filing. Also, in response to a request from the FPSC Staff, FPL
used three fuel cost forecasts in sensitivity case analyses for the 2014 DSM Goals docket.
A Medium fuel cost forecast is developed first. Then the Medium fuel cost forecast is adjusted upwards (for
the High fuel cost forecast), or downwards (for the Low fuel cost forecast), by multiplying the annual cost
values from the Medium fuel cost forecast by a factor of (1 + the historical volatility in the 12-month
forward price, one year ahead) for the High fuel cost forecast, or by a factor of (1 – the historical volatility of
the 12-month forward price, one year ahead) for the Low fuel cost forecast.
The resource plan presented in this Site Plan is based, in part, on those prior analyses. For that reason,
this resource plan has not been further tested for different fuel cost forecasts.
Discussion Item # 4: Describe how the sensitivity of the plan was tested with respect to holding
the differential between oil/gas and coal constant over the planning horizon.
As described above in the answer to Discussion Item # 3, FPL used up to three fuel cost forecasts in its
2013/early 2014 resource planning analyses. While these forecasts did not represent a constant cost
differential between oil/gas and coal, a variety of fuel cost differentials were represented in these forecasts.
Discussion Item # 5: Describe how generating unit performance was modeled in the planning
process.
The performance of existing generating units on FPL’s system was modeled using current projections for
scheduled outages, unplanned outages, capacity output ratings, and heat rate information. Schedule 1 in
Chapter I and Schedule 8 in Chapter III present the current and projected capacity output ratings of FPL’s
Florida Power & Light Company
197

existing units. The values used for outages and heat rates are generally consistent with the values FPL has
used in planning studies in recent years.
In regard to new unit performance, FPL utilized current projections for the capital costs, fixed and variable
operating & maintenance costs, capital replacement costs, construction schedules, heat rates, and
capacity ratings for all construction options in its resource planning work. A summary of this information for
the new capacity options FPL currently projects to add over the reporting horizon for this document is
presented on the Schedule 9 forms in Chapter III.
Discussion Item # 6: Describe and discuss the financial assumptions used in the planning
process. Discuss how the sensitivity of the plan was tested with respect to varying financial
assumptions.
During 2013, FPL used the following financial assumptions: i) a capital structure of 40.38% debt and
59.62% equity; (ii) a 4.79% cost of debt; (iii) a 10.5% return on equity; and (iv) an after-tax discount rate of
7.45%. In early 2014, the cost of debt and the after-tax discount rate changed slightly to 5.14% and 7.54%,
respectively. The other assumptions did not change. No sensitivities of these financial assumptions were
used in FPL’s 2013/early 2014 resource planning work.
Discussion Item # 7: Describe in detail the electric utility’s Integrated Resource Planning
process. Discuss whether the optimization was based on revenue requirements, rates, or total
resource cost.
FPL’s integrated resource planning (IRP) process is described in detail in Chapter III of this document.
The standard basis for comparing the economics of competing resource plans in FPL’s basic IRP process
is the impact of the plans on FPL’s electricity rate levels with the objective generally being to minimize
FPL’s projected levelized system average electric rate (i.e., a Rate Impact Measure or RIM approach). As
discussed in response to Discussion Item # 2, both the electricity rate perspective and the cumulative
present value of system revenue requirement perspective yield identical results in terms of which resource
options are more economic when DSM levels are unchanged between competing resource plans.
Therefore, in planning work in which DSM levels were unchanged, the equivalent, but simpler-to-calculate,
cumulative present value of revenue requirements perspective was utilized.
Florida Power & Light Company
198

Discussion Item # 8: Define and discuss the electric utility’s generation and transmission
reliability criteria.
FPL uses three system reliability criteria in its resource planning work that addresses generation, purchase,
and DSM options. One criterion is a minimum 20% Summer and Winter reserve margin. Another reliability
criterion is a maximum of 0.1 days per year loss-of-load-probability (LOLP). The third criterion is a
minimum 10% generation-only reserve margin (GRM) criterion. These three reliability criteria are discussed
in Chapter III of this document.
In regard to transmission reliability analysis work, FPL has adopted transmission planning criteria that are
consistent with the planning criteria established by the Florida Reliability Coordinating Council (FRCC). The
FRCC has adopted transmission planning criteria that are consistent with the Reliability Standards established
by the North American Electric Reliability Council (NERC). The NERC Reliability Standards are available on
the internet site (http://www.nerc.com/).
In addition, FPL has developed a Facility Connection Requirements (FCR) document as well as a Facility
Rating Methodology document that are also available on the internet under the Interconnection Request
Information, and FPL Facility Ratings Methodologies, directories respectively
at https://www.oatioasis.com/FPL/index.html.
Generally, FPL limits its transmission facilities to 100% of the applicable thermal rating. The normal and
contingency voltage criteria for FPL stations are provided below:
Normal/Contingency
Voltage Level (kV) Vmin (p.u.) Vmax (p.u.)
69, 115, 138 0.95/0.95 1.05/1.07
230 0.95/0.95 1.06/1.07
500 0.95/0.95 1.07/1.09
Turkey Point (*) 1.01/1.01 1.06/1.06
St. Lucie (*) 1.00/1.00 1.06/1.06
(*) Voltage range criteria for FPL’s Nuclear Power Plants
There may be isolated cases for which FPL may have determined that it is acceptable to deviate from the
general criteria stated above. There are several factors that could influence these criteria, such as the overall
number of potential customers that may be impacted, the probability of an outage actually occurring, or
transmission system performance, as well as others.
Florida Power & Light Company
199

Discussion Item # 9: Discuss how the electric utility verifies the durability of energy savings for
its DSM programs.
The projected impacts of FPL’s DSM programs on demand and energy consumption are revised
periodically. Engineering models, calibrated with current field-metered data, are updated at regular
intervals. Participation trends are tracked for all of FPL’s DSM programs in order to adjust impacts each
year for changes in the mix of efficiency measures being installed by program participants. For its load
management programs, FPL conducts periodic tests of the load control equipment to ensure that the
equipment is functioning correctly. These tests, plus actual, non-test load management events, also allows
FPL to gauge the MW reduction capabilities of its load management programs on an on-going basis.
Discussion Item # 10: Discuss how strategic concerns are incorporated in the planning process.
The Executive Summary and Chapter III provide a discussion of a variety of system concerns/issues that
influence FPL’s resource planning process. Please see those chapters for a discussion of those
concerns/issues.
In addition to these system concerns/issues, there are other strategic factors FPL typically considers when
choosing between resource options. These include the following: (1) technology risk; (2) environmental
risk, and (3) site feasibility. The consideration of these factors may include both economic and non-
economic aspects.
Technology risk is an assessment of the relative maturity of competing technologies. For example, a
prototype technology, which has not achieved general commercial acceptance, has a higher risk than a
technology in wide use and, therefore, assuming all else equal, is less desirable.
Environmental risk is an assessment of the relative environmental acceptability of different generating
technologies and their associated environmental impacts on the FPL system, including environmental
compliance costs. Technologies regarded as more acceptable from an environmental perspective for
FPL’s resource plan are those which minimize environmental impacts for the FPL system as a whole
through highly efficient fuel use, state of the art environmental controls, generating technologies that do not
utilize fossil fuels (such as nuclear and solar), etc.
Site feasibility assesses a wide range of economic, regulatory, and environmental factors related to
successfully developing and operating the specified technology at the site in question. Projects that are
more acceptable have sites with few barriers to successful development.
Florida Power & Light Company
200

All of these factors play a part in FPL’s planning and decision-making, including its decisions to construct
capacity or to purchase power.
Discussion Item # 11: Describe the procurement process the electric utility intends to utilize to
acquire the additional supply-side resources identified in the electric utility’s ten-year site plan.
As shown in this 2014 Site Plan, FPL’s resource plan currently reflects the following major supply-side
resource additions: the on-going modernization at Port Everglades, on-going upgrading of CTs in several
CCs throughout FPL’s system, the projected addition of CTs at FPL’s Lauderdale plant site, the
implementation of the previously executed EcoGen PPA, a projected new CC unit (at a site that has not yet
been selected), and the projected Turkey Point Units 6 & 7.
In regard to the above capacity additions for which a need determination has already been granted, Turkey
Point Units 6 & 7, did not lend themselves to a request for proposal (RFP) approach involving bids from
third parties who would build new nuclear generation capacity. In addition, nuclear capacity additions are
exempted from the Commission’s Bid Rule by section 403.519 (4) (c). For nuclear projects, FPL’s
procurement activities are conducted to ensure the best combination of quality and cost for the delivered
products. In regard to the modernization project at Port Everglades, the project received a Commission
waiver from the Bid Rule due to attributes specific to the Port Everglades site and to modernization projects
in general (such as use of existing land, water, transmission, etc.) plus other economic benefits to FPL’s
customers. This waiver from the Bid Rule was granted in Order No. PSC-11-0360-PAA-EI for Port
Everglades.
CT upgrades are currently taking place at several CC units throughout the FPL system. FPL was
approached by the original equipment manufacturer (OEM) of the CTs regarding the possibility of
upgrading these units. Following negotiations with the OEM, and economic analyses that showed that
upgrading was cost-effective for FPL’s customers, the decision was made to proceed with the CT
upgrades. That process is underway and is scheduled to be completed in 2015.
In regard to the addition of five new CTs at FPL’s Lauderdale plant site, FPL anticipates selecting the CTs
through negotiations with, and/or competitive solicitation of, CT manufacturers. The EcoGen PPA, which
was approved by the Commission in Order No. PSC-13-0205-CO-EQ dated 5/21/13, was the result of
negotiations between EcoGen and FPL.
Identification of projected self-build options, beyond those units already approved by the FPSC and
Governor and Siting Board or units, such as the 2019 CC unit presented in this Site Plan, is required of
FPL in its Site Plan filings and represents FPL’s current view of alternatives that appear to be FPL’s best,
most cost-effective self-build options at present. FPL reserves the right to refine its planning analyses and
Florida Power & Light Company
201

to identify and evaluate other options before making decisions regarding future capacity additions. Such
refined analyses have the potential to yield a variety of self-build options, some of which might not require
an RFP. If an RFP is issued for Supply options, FPL reserves the right to choose the best alternative for its
customers, even if that option is not an FPL self-build option.
Discussion Item # 12: Provide the transmission construction and upgrade plans for electric
utility system lines that must be certified under the Transmission Line Siting Act (403.52 – 403.536,
F. S.) during the planning horizon. Also, provide the rationale for any new or upgraded line.
(1) FPL has identified the need for a new 230 kV transmission line that required certification under the
Transmission Line Siting Act which was issued in April 2006. The new line is to be completed in
two phases connecting FPL’s St. Johns Substation to FPL’s Pringle Substation (shown on Table
III.E.1 in Chapter III). Phase 1 was completed in May 2009 and consisted of a new line connecting
Pringle to a new Pellicer Substation. Phase 2 is planned to connect St. Johns to Pellicer and is
scheduled to be completed by December 2018. The construction of this line is necessary to serve
existing and future customers in the Flagler and St. Johns areas in a reliable and effective
manner.
(2) FPL has identified the need for a new 230 kV transmission line (by December 2014) that required
certification under the Transmission Line Siting Act which was issued on November 2008. The
new line will connect FPL’s Manatee Substation to FPL’s proposed Bob White Substation (also
shown on Table III.E.1 in Chapter III). The construction of this line, scheduled to be completed in
2014, is necessary to serve existing and future customers in the Manatee and Sarasota areas in a
reliable and effective manner.
Florida Power & Light Company
202