ten year forecast of fault levels … · transpower last published the ten year forecast of fault...
TRANSCRIPT

TEN YEAR FORECAST OF FAULT LEVELS SEPTEMBER 2016
Introduction This publication presents an update to the ten year forecast fault levels report. The Connection Code contained in Schedule 8 to the Benchmark Agreement requires Transpower to publish a ten year forecast of the expected fault levels at each customer point of service annually.1 Transpower last published the Ten Year Forecast of Fault Levels in September 2015.
1 Connection Code clause 4.2(g): to publish annually a 10 year forecast of the expected minimum and maximum fault level at each customer point of service.

Index
INTRODUCTION ........................................................................................................................ 2
INDEX ........................................................................................................................................ 3
FORECAST FAULT LEVELS CALCULATION ASSUMPTIONS ............................................. 4
TEN YEAR FORECAST OF MAXIMUM THREE-PHASE FAULT LEVELS ............................ 6
NORTHLAND ............................................................................................................................................... 6
AUCKLAND .................................................................................................................................................. 6
WAIKATO ..................................................................................................................................................... 7
BAY OF PLENTY .......................................................................................................................................... 8
CENTRAL NORTH ISLAND .......................................................................................................................... 9
TARANAKI .................................................................................................................................................. 10
HAWKE’S BAY ........................................................................................................................................... 11
WELLINGTON ............................................................................................................................................ 11
NELSON-MARLBOROUGH ........................................................................................................................ 12
WEST COAST ............................................................................................................................................ 12
CANTERBURY ........................................................................................................................................... 13
SOUTH CANTERBURY .............................................................................................................................. 14
OTAGO-SOUTHLAND ................................................................................................................................ 14
TEN YEAR FORECAST OF MAXIMUM SINGLE-PHASE TO GROUND FAULT LEVELS .. 16
NORTHLAND ............................................................................................................................................. 16
AUCKLAND ................................................................................................................................................ 16
WAIKATO ................................................................................................................................................... 17
BAY OF PLENTY ........................................................................................................................................ 18
CENTRAL NORTH ISLAND ........................................................................................................................ 19
TARANAKI .................................................................................................................................................. 20
HAWKE’S BAY ........................................................................................................................................... 21
WELLINGTON ............................................................................................................................................ 21
NELSON-MARLBOROUGH ........................................................................................................................ 22
WEST COAST ............................................................................................................................................ 22
CANTERBURY ........................................................................................................................................... 23
SOUTH CANTERBURY .............................................................................................................................. 24
OTAGO-SOUTHLAND ................................................................................................................................ 24

Ten year forecast fault Levels
© Transpower New Zealand Limited 2016.All rights reserved. 4
Forecast fault levels calculation assumptions
Calculated fault levels are very dependent on the assumptions used in, and method of, the calculation.
Minimum fault level calculations depend on generation and grid asset dispatch assumptions, and are generally used for ensuring the coordination of protection relays between asset owners. Protection coordination has very important consequences for power system security and safety of people and assets. Accordingly, we are not going to publish minimum fault levels which may be misunderstood and used in a way that threatens security and safety. We encourage connected parties to talk with us directly on matters concerning protection coordination.
Table 3 and Table 4 list the maximum three-phase fault current and maximum single-phase to ground fault current respectively for all Transpower’s transmission buses. Both tables list the 10 year forecast of fault current for existing grid configuration. The listed value is the initial RMS symmetrical short-circuit current (𝐼𝑘
′′) as defined by IEC 60909 2001.
The 10 year forecast of maximum fault levels is based on information currently known to Transpower. The values in the tables should be regarded as indicative only. We have modelled committed future transmission upgrades and generation projects using the best information we have at this time. We know that towards the end of the 10 year period, there may be additional transmission upgrades and additional generation required to meet the power and energy requirements of New Zealand. We do not know exactly the nature or location of these future transmission upgrades and new generation. The maximum fault level at a transmission bus2 may also change where the number of supply transformers increase or get replaced as part of a Service Change to meet load growth or provide supply security.
Therefore the maximum short-circuit currents listed should not be relied upon for specifying short-circuit requirements for new substation equipment. The forecast fault levels provide an early warning of when plant capability may be exceeded. Accordingly, while Transpower endeavours to forecast fault levels accurately, the levels may change for a number of reasons and Transpower does not accept liability for other parties reliance on the fault values contained in the forecast. We encourage asset owners to consult with us for detailed information on maximum fault levels at specific sites relating to new equipment connection.
The Connection Code (5.1(h)) puts an obligation on Transpower and the customer to ensure equipment connected to the grid does not cause the maximum short-circuit power and current limits in Appendix B Table B2 of the Connection Code to be exceeded on or nearby to the grid. Table 1 shows the short-circuit power and limits in Table B2 of Appendix B of the Connection Code. Note that the fault levels at some buses are already near or exceed these values.
Table 1: Maximum short-circuit power and current limits
Nominal voltage (kV)
Maximum short-circuit power and current limits (MVA) (kA)
220 12,000 31.5
110 6,000 31.5
66 1,800 16
50 1,350 16
33 1,400 25
22 950 25
11 475 25
2 This report includes the maximum fault level for all Transpower’s transmission buses, which
encompasses customer point of service.

Ten year forecast fault Levels
© Transpower New Zealand Limited 2016.All rights reserved. 5
We have calculated maximum fault levels in Table 3 and Table 4 using the 2001 IEC 60909 method. The values are the initial RMS symmetrical short-circuit levels.
The fault levels have been calculated on the following basis:
All generating units and all transmission assets are assumed to be in service.
A full representation of the existing transmission grid, directly connected generation and embedded generation above 1 MW known to us is assumed. The existing wind farms are assumed to provide only full load current into a fault.
Motor loads are not modelled.
The breaker time is 0.1 seconds and the fault clearing time is 1 second.
The fault impedance is zero ohms.
Future committed changes to the power system including transmission upgrades and new generation detailed in the 2015 Transmission Planning Report. We represented new transmission lines in the model with electrical parameters estimated from the best matches with existing lines of the same conductor type. We have represented committed generation in our power system model with their electrical parameters scaled from the latest example which their type is known to us. We based the timing of these connections on open discussion with the asset owner, and from the generator’s website. The actual commissioning date may vary.
See Table 2 the assumption of fault current contributions from future generation
Table 2: Fault current contributions from future generation
Category Technology / application Fault current contribution (per unit of capacity)
Thermal Coal, diesel, combined cycle gas turbine, open cycle gas turbine, gas-fired peaker, cogeneration
2.87
Thermal Geothermal 3.60
Hydro Peak hydro, stored hydro, run of river 3.67
Wind Wind 0.0
Solar Photovoltaic 0.0
Load Interruptible load, demand side response 0.0

Ten year forecast fault Levels
© Transpower New Zealand Limited 2016.All rights reserved. 6
Ten year forecast of maximum three-phase fault levels
Table 3: Ten year forecast of maximum three-phase fault levels (kA)
Grid exit point Transmission bus 2016 2017 2018 2019 2020 2021 2022 2023 2024 2025 2026
NORTHLAND
Bream Bay 33 kV 10.3 10.3 10.3 10.3 10.3 10.3 10.3 10.3 10.3 10.3 10.3
Bream Bay 220 kV 5.1 5.1 5.1 5.1 5.1 5.1 5.1 5.1 5.1 5.1 5.1
Marsden 110 kV 7.1 7.1 7.1 7.1 7.1 7.1 7.1 7.1 7.1 7.1 7.1
Marsden 220 kV 5.1 5.1 5.1 5.1 5.1 5.1 5.1 5.1 5.1 5.1 5.1
Maungatapere 110 kV 6.1 6.1 6.1 6.1 6.1 6.1 6.1 6.1 6.1 6.1 6.1
Maungaturoto 33 kV 4.4 4.4 4.4 4.4 4.4 4.4 4.4 4.4 4.4 4.4 4.4
Maungaturoto 110 kV (T1) 3.9 3.9 3.9 3.9 3.9 3.9 3.9 3.9 3.9 3.9 3.9
Maungaturoto 110 kV (T2) 3.9 3.9 3.9 3.9 3.9 3.9 3.9 3.9 3.9 3.9 3.9
Wellsford 33 kV 7.2 7.2 7.2 7.2 7.2 7.2 7.2 7.2 7.2 7.2 7.2
Wellsford 110 kV (T1) 3.9 3.9 3.9 3.9 3.9 3.9 3.9 3.9 3.9 3.9 3.9
Wellsford 110 kV (T2) 3.9 3.9 3.9 3.9 3.9 3.9 3.9 3.9 3.9 3.9 3.9
AUCKLAND
Albany 33 kV 20.4 20.4 20.4 20.4 20.4 20.4 20.4 20.4 20.4 20.4 20.4
Albany 110 kV 16.0 16.0 16.0 16.0 16.0 16.0 16.0 16.0 16.0 16.0 16.0
Albany 220 kV 12.5 12.5 12.5 12.5 12.5 12.5 12.5 12.5 12.5 12.5 12.5
Bombay 33 kV 9.0 9.0 9.0 9.0 9.0 9.0 9.0 9.0 9.0 9.0 9.0
Bombay 110 kV 10.7 10.7 10.7 10.7 10.7 10.7 10.7 10.7 10.7 10.7 10.7
Drury 220 kV 12.6 12.6 12.6 12.6 12.6 12.6 12.6 12.6 12.6 12.6 12.6
Glenbrook 33 kV (T4/T5) 15.6 15.6 15.6 15.6 15.6 15.6 15.6 15.6 15.6 15.6 15.6
Glenbrook 33 kV (T6) 16.8 16.8 16.8 16.8 16.8 16.8 16.8 16.8 16.8 16.8 16.8
Glenbrook 220 kV 10.0 10.0 10.0 10.0 10.0 10.0 10.0 10.0 10.0 10.0 10.0
Henderson 33 kV 18.5 18.6 18.6 18.6 18.6 18.6 18.6 18.6 18.6 18.6 18.6
Henderson 110 kV 19.8 19.8 19.8 19.8 19.8 19.8 19.8 19.8 19.8 19.8 19.8
Henderson 220 kV 12.6 12.6 12.6 12.6 12.6 12.6 12.6 12.6 12.6 12.6 12.6
Hepburn Road 33 kV 20.9 20.9 20.9 20.9 20.9 20.9 20.9 20.9 20.9 20.9 20.9
Hepburn Road 110 kV 18.1 18.1 18.1 18.2 18.2 18.2 18.2 18.2 18.2 18.2 18.2
Hobson Street 110 kV 18.8 18.8 18.8 18.8 18.8 18.8 18.8 18.8 18.8 18.8 18.8
Hobson Street 220 kV 14.1 14.1 14.1 14.1 14.1 14.1 14.1 14.1 14.1 14.1 14.1
Huapai 220 kV 11.3 11.3 11.3 11.4 11.4 11.4 11.4 11.4 11.4 11.4 11.4
Mangere 33 kV 14.6 14.6 14.6 14.6 14.6 14.6 14.6 14.6 14.6 14.6 14.6
Mangere 110 kV 16.0 16.0 16.0 16.1 16.1 16.1 16.1 16.1 16.1 16.1 16.1
Mount Roskill 22 kV 21.6 21.6 21.6 21.6 21.6 21.6 21.6 21.6 21.6 21.6 21.6
Mount Roskill 110 kV 17.1 17.1 17.1 17.1 17.1 17.1 17.1 17.1 17.1 17.1 17.1
Otahuhu 22 kV 26.0 26.0 26.0 26.0 26.0 26.0 26.0 26.0 26.0 26.0 26.0
Otahuhu 110 kV (T2/T4) 21.8 21.8 21.8 21.8 21.8 21.8 21.8 21.8 21.8 21.8 21.8
Otahuhu 110 kV (T3/T5) 16.9 16.9 16.9 16.9 16.9 16.9 16.9 16.9 16.9 16.9 16.9

Ten year forecast fault Levels
© Transpower New Zealand Limited 2016.All rights reserved. 7
Otahuhu 220 kV 16.5 16.5 16.5 16.5 16.5 16.5 16.5 16.5 16.5 16.5 16.5
Pakuranga 33 kV 23.8 23.8 23.8 23.8 23.8 23.8 23.8 23.8 23.8 23.8 23.8
Pakuranga 220 kV 15.9 15.9 15.9 15.9 15.9 15.9 15.9 15.9 15.9 15.9 15.9
Penrose 22 kV 19.1 19.1 19.1 19.1 19.1 19.1 19.1 19.1 19.1 19.1 19.1
Penrose 33 kV 25.9 25.9 25.9 25.9 25.9 25.9 25.9 25.9 25.9 25.9 25.9
Penrose 110 kV 21.1 21.1 21.1 21.1 21.1 21.1 21.1 21.1 21.1 21.1 21.1
Penrose 220 kV 15.3 15.3 15.3 15.4 15.4 15.4 15.4 15.4 15.4 15.4 15.4
Silverdale 33 kV 18.0 18.0 18.0 18.0 18.0 18.0 18.0 18.0 18.0 18.0 18.0
Silverdale 220 kV (T1) 8.5 8.5 8.5 8.5 8.5 8.5 8.5 8.5 8.5 8.5 8.5
Silverdale 220 kV (T2) 8.5 8.5 8.5 8.5 8.5 8.5 8.5 8.5 8.5 8.5 8.5
Southdown 220 kV 14.0 14.0 14.0 14.0 14.0 14.0 14.0 14.0 14.0 14.0 14.0
Takanini 33 kV 17.1 17.1 17.1 17.1 17.1 17.1 17.1 17.1 17.1 17.1 17.1
Takanini 220 kV (T5) 13.6 13.6 13.6 13.6 13.6 13.6 13.6 13.6 13.6 13.6 13.6
Takanini 220 kV (T8) 13.4 13.4 13.4 13.4 13.4 13.4 13.4 13.4 13.4 13.4 13.4
Wairau Road 33 kV 20.1 20.1 20.1 20.1 20.1 20.1 20.1 20.1 20.1 20.1 20.1
Wairau Road 220 kV 13.0 13.0 13.0 13.0 13.0 13.0 13.0 13.0 13.0 13.0 13.0
Wiri 33 kV 16.9 16.9 16.9 16.9 16.9 16.9 16.9 16.9 16.9 16.9 16.9
Wiri 110 kV (T1) 15.0 15.0 15.0 15.0 15.0 15.0 15.0 15.0 15.0 15.0 15.0
Wiri 110 kV (T2) 14.9 15.0 15.0 15.0 15.0 15.0 15.0 15.0 15.0 15.0 15.0
WAIKATO
Arapuni 110 kV (North Bus) 12.6 12.7 12.7 12.7 12.7 12.7 12.7 12.7 12.7 12.7 12.7
Arapuni 110 kV (South Bus) 12.6 12.7 12.7 12.7 12.7 12.7 12.7 12.7 12.7 12.7 12.7
Atiamuri 220 kV 17.5 17.5 17.5 17.5 17.5 17.5 17.5 17.5 17.5 17.5 17.5
Cambridge 11 kV 22.8 22.9 22.9 22.9 22.9 22.9 22.9 22.9 22.9 22.9 22.9
Cambridge 110 kV (T3) 8.4 8.5 8.5 8.5 8.5 8.5 8.5 8.5 8.5 8.5 8.5
Cambridge 110 kV (T4) 8.4 8.5 8.5 8.5 8.5 8.5 8.5 8.5 8.5 8.5 8.5
Hamilton 11 kV 13.4 13.4 13.4 13.4 13.4 13.4 13.4 13.4 13.4 13.4 13.4
Hamilton 33 kV 20.9 20.9 20.9 21.0 21.0 21.0 21.0 21.0 21.0 21.0 21.0
Hamilton 110 kV 14.9 15.2 15.2 15.2 15.2 15.2 15.2 15.2 15.2 15.2 15.2
Hamilton 220 kV 12.5 12.6 12.6 12.6 12.6 12.6 12.6 12.6 12.6 12.6 12.6
Hangatiki 33 kV 5.5 5.5 5.5 5.5 5.5 5.5 5.5 5.5 5.5 5.5 5.5
Hangatiki 110 kV 5.9 5.9 5.9 5.9 5.9 5.9 5.9 5.9 5.9 5.9 5.9
Hinuera 33 kV 7.2 7.2 7.2 7.2 7.2 7.2 7.2 7.2 7.2 7.2 7.2
Hinuera 110 kV 4.0 4.1 4.1 4.1 4.1 4.1 4.1 4.1 4.1 4.1 4.1
Huntly 11 kV 16.2 16.2 16.2 16.2 16.2 16.2 16.2 16.2 16.2 16.2 16.2
Huntly 33 kV 14.6 14.6 14.6 14.6 14.6 14.6 14.6 14.6 14.6 14.6 14.6
Huntly 220 kV 20.9 21.0 21.0 21.0 21.0 21.0 21.0 21.0 21.0 21.0 21.0
Karapiro 110 kV 8.9 9.0 9.0 9.0 9.0 9.0 9.0 9.0 9.0 9.0 9.0
Kinleith 11 kV (T1A) 14.2 14.3 14.3 14.3 14.3 14.3 14.3 14.3 14.3 14.3 14.3
Kinleith 11 kV (T2) 14.0 14.0 14.0 14.0 14.0 14.0 14.0 14.0 14.0 14.0 14.0
Kinleith 11 kV (T3A and T3B) 14.7 14.8 14.8 14.8 14.8 14.8 14.8 14.8 14.8 14.8 14.8
Kinleith 11 kV (T5) 35.5 35.5 35.5 35.5 35.5 35.5 35.5 35.5 35.5 35.5 35.5
Kinleith 33 kV 5.0 5.0 5.0 5.0 5.0 5.0 5.0 5.0 5.0 5.0 5.0
Kinleith 110 kV 8.7 8.8 8.8 8.8 8.8 8.8 8.8 8.8 8.8 8.8 8.8

Ten year forecast fault Levels
© Transpower New Zealand Limited 2016.All rights reserved. 8
Kopu 66 kV 2.7 2.7 2.7 2.7 2.7 2.7 2.7 2.7 2.7 2.7 2.7
Kopu 110 kV (T3) 2.5 2.5 2.5 2.5 2.5 2.5 2.5 2.5 2.5 2.5 2.5
Kopu 110 kV (T4) 2.5 2.5 2.5 2.5 2.5 2.5 2.5 2.5 2.5 2.5 2.5
Lichfield 110 kV (T1) 6.4 6.4 6.4 6.4 6.4 6.4 6.4 6.4 6.4 6.4 6.4
Lichfield 110 kV (T2) 6.2 6.2 6.2 6.2 6.2 6.2 6.2 6.2 6.2 6.2 6.2
Maraetai 220 kV 21.8 21.8 21.8 21.8 21.8 21.8 21.8 21.8 21.8 21.8 21.8
Ohakuri 220 kV 17.0 17.0 17.0 17.0 17.0 17.0 17.0 17.0 17.0 17.0 17.0
Ohinewai 220 kV 19.3 19.3 19.3 19.3 19.3 19.3 19.3 19.3 19.3 19.3 19.3
Piako 110 kV 5.8 5.9 5.9 5.9 5.9 5.9 5.9 5.9 5.9 5.9 5.9
Te Awamutu 11 kV 20.5 20.6 20.6 20.6 20.6 20.6 20.6 20.6 20.6 20.6 20.6
Te Awamutu 110 kV 5.6 5.6 5.6 5.6 5.6 5.6 5.6 5.6 5.6 5.6 5.6
Te Kowhai 33 kV 20.8 20.8 20.8 20.8 20.8 20.8 20.8 20.8 20.8 20.8 20.8
Te Kowhai 220 kV 8.7 8.7 8.7 8.8 8.8 8.8 8.8 8.8 8.8 8.8 8.8
Waihou 33 kV 6.9 7.0 7.0 7.0 7.0 7.0 7.0 7.0 7.0 7.0 7.0
Waihou 110 kV 5.4 5.4 5.4 5.4 5.4 5.4 5.4 5.4 5.4 5.4 5.4
Waikino 33 kV 6.2 6.2 6.2 6.2 6.2 6.2 6.2 6.2 6.2 6.2 6.2
Waikino 110 kV 4.1 4.2 4.2 4.2 4.2 4.2 4.2 4.2 4.2 4.2 4.2
Waipapa 220 kV 13.4 13.4 13.4 13.4 13.4 13.4 13.4 13.4 13.4 13.4 13.4
Whakamaru 220 kV 27.9 27.9 27.9 28.0 28.0 28.0 28.0 28.0 28.0 28.0 28.0
BAY OF PLENTY
Aniwhenua 110 kV 4.7 4.7 4.7 4.7 4.7 4.7 4.7 4.7 4.7 4.7 4.7
Edgecumbe 33 kV 14.6 14.6 14.6 14.6 14.6 14.6 14.6 14.6 14.6 14.6 14.6
Edgecumbe 110 kV 8.5 8.5 8.5 8.5 8.5 8.5 8.5 8.5 8.5 8.5 8.5
Edgecumbe 220 kV 7.7 7.7 7.7 7.7 7.7 7.7 7.7 7.7 7.7 7.7 7.7
Kaitimako 33 kV 7.5 7.5 7.5 7.5 7.5 7.5 7.5 7.5 7.5 7.5 7.5
Kaitimako 110 kV 8.7 8.7 8.7 8.7 8.7 8.7 8.7 8.7 8.7 8.7 8.7
Kaitimako 220 kV 7.1 7.1 7.1 7.1 7.1 7.1 7.1 7.1 7.1 7.1 7.1
Kawerau 11 kV (T1/T2) 19.8 19.8 19.8 19.8 19.8 19.8 19.8 19.8 19.8 19.8 19.8
Kawerau 11 kV (T6) 17.2 17.2 17.2 17.2 17.2 17.2 17.2 17.2 17.2 17.2 17.2
Kawerau 11 kV (T7) 17.2 17.2 17.2 17.2 17.2 17.2 17.2 17.2 17.2 17.2 17.2
Kawerau 11 kV (T8) 16.1 16.1 16.1 16.1 16.1 16.1 16.1 16.1 16.1 16.1 16.1
Kawerau 11 kV (T9) 16.4 16.4 16.4 16.4 16.4 16.4 16.4 16.4 16.4 16.4 16.4
Kawerau 11 kV (T11/T14) 35.0 35.0 35.0 35.0 35.0 35.0 35.0 35.0 35.0 35.0 35.0
Kawerau 110 kV 12.1 12.1 12.1 12.1 12.1 12.1 12.1 12.1 12.1 12.1 12.1
Kawerau 220 kV 7.7 7.7 7.7 7.7 7.7 7.7 7.7 7.7 7.7 7.7 7.7
Matahina 110 kV 10.1 10.1 10.1 10.1 10.1 10.1 10.1 10.1 10.1 10.1 10.1
Mt Maunganui 33 kV 10.9 10.9 10.9 10.9 10.9 10.9 10.9 10.9 10.9 10.9 10.9
Mt Maunganui 110 kV 7.0 7.0 7.0 7.0 7.0 7.0 7.0 7.0 7.0 7.0 7.0
Okere 110 kV 7.4 7.4 7.4 7.4 7.4 7.4 7.4 7.4 7.4 7.4 7.4
Owhata 11 kV 9.9 9.9 9.9 9.9 9.9 9.9 9.9 9.9 9.9 9.9 9.9
Owhata 110 kV 5.7 5.7 5.7 5.7 5.7 5.7 5.7 5.7 5.7 5.7 5.7
Rotorua 11 kV 15.1 15.1 15.1 15.1 15.1 15.1 15.1 15.1 15.1 15.1 15.1
Rotorua 33 kV 8.8 8.8 8.8 8.8 8.8 8.8 8.8 8.8 8.8 8.8 8.8
Rotorua 110 kV (Tarukenga 1) 6.4 6.4 6.4 6.4 6.4 6.4 6.4 6.4 6.4 6.4 6.4

Ten year forecast fault Levels
© Transpower New Zealand Limited 2016.All rights reserved. 9
Rotorua 110 kV (Tarukenga 2) 6.7 6.7 6.7 6.7 6.7 6.7 6.7 6.7 6.7 6.7 6.7
Tarukenga 11 kV 10.5 10.5 10.5 10.5 10.5 10.5 10.5 10.5 10.5 10.5 10.5
Tarukenga 110 kV 11.1 11.2 11.2 11.2 11.2 11.2 11.2 11.2 11.2 11.2 11.2
Tarukenga 220 kV 10.9 10.9 10.9 10.9 10.9 10.9 10.9 10.9 10.9 10.9 10.9
Tauranga 11 kV 14.2 14.2 14.2 14.2 14.2 14.2 14.2 14.2 14.2 14.2 14.2
Tauranga 33 kV 13.1 13.1 13.1 13.1 13.1 13.1 13.1 13.1 13.1 13.1 13.1
Tauranga 110 kV 8.1 8.1 8.1 8.1 8.1 8.1 8.1 8.1 8.1 8.1 8.1
Te Kaha 11 kV 1.1 1.1 1.1 1.1 1.1 1.1 1.1 1.1 1.1 1.1 1.1
Te Kaha 50 kV 0.3 0.3 0.3 0.3 0.3 0.3 0.3 0.3 0.3 0.3 0.3
Te Matai 33 kV 7.5 7.5 7.5 7.5 7.5 7.5 7.5 7.5 7.5 7.5 7.5
Te Matai 110 kV 6.3 6.3 6.3 6.3 6.3 6.3 6.3 6.3 6.3 6.3 6.3
Waiotahi 11 kV 8.5 8.5 8.5 8.5 8.5 8.5 8.5 8.5 8.5 8.5 8.5
Waiotahi 50 kV 0.4 0.4 0.4 0.4 0.4 0.4 0.4 0.4 0.4 0.4 0.4
Waiotahi 110 kV 2.7 2.7 2.7 2.7 2.7 2.7 2.7 2.7 2.7 2.7 2.7
CENTRAL NORTH ISLAND
Aratiatia 220 kV 20.5 20.5 20.5 20.5 20.5 20.5 20.5 20.5 20.5 20.5 20.5
Bunnythorpe 33 kV 15.8 15.8 15.8 15.9 15.9 15.9 15.9 15.9 15.9 15.9 15.9
Bunnythorpe 110 kV 12.8 12.8 12.0 12.1 12.1 12.1 12.1 12.1 12.1 12.1 12.1
Bunnythorpe 220 kV 12.5 12.5 12.6 12.7 12.7 12.7 12.7 12.7 12.7 12.7 12.7
Dannevirke 11 kV 16.3 16.3 16.2 16.2 16.2 16.2 16.2 16.2 16.2 16.2 16.2
Dannevirke 110 kV (T1) 3.9 3.9 3.8 3.8 3.8 3.8 3.8 3.8 3.8 3.8 3.8
Dannevirke 110 kV (T2) 3.9 3.9 3.9 3.9 3.9 3.9 3.9 3.9 3.9 3.9 3.9
Linton 33 kV 15.9 15.9 16.0 16.0 16.0 16.0 16.0 16.0 16.0 16.0 16.0
Linton 220 kV (T2) 8.9 8.9 9.0 9.0 9.0 9.0 9.0 9.0 9.0 9.0 9.0
Linton 220 kV (T3) 9.2 9.2 9.2 9.3 9.3 9.3 9.3 9.3 9.3 9.3 9.3
Mangahao 33 kV 9.3 9.3 9.2 9.2 9.2 9.2 9.2 9.2 9.2 9.2 9.2
Mangahao 110 kV (T3) 3.4 3.4 3.4 3.4 3.4 3.4 3.4 3.4 3.4 3.4 3.4
Mangahao 110 kV (T4) 3.4 3.4 3.3 3.4 3.4 3.4 3.4 3.4 3.4 3.4 3.4
Mangamaire 33 kV 4.6 4.6 4.6 4.6 4.6 4.6 4.6 4.6 4.6 4.6 4.6
Mangamaire 110 kV 4.8 4.8 4.8 4.8 4.8 4.8 4.8 4.8 4.8 4.8 4.8
Marton 33 kV 6.6 6.6 6.6 6.6 6.6 6.6 6.6 6.6 6.6 6.6 6.6
Marton 110 kV (T1) 5.3 5.3 5.2 5.2 5.2 5.2 5.2 5.2 5.2 5.2 5.2
Marton 110 kV (T2) 5.3 5.3 5.2 5.2 5.2 5.2 5.2 5.2 5.2 5.2 5.2
Mataroa 33 kV 3.6 3.6 3.6 3.6 3.6 3.6 3.6 3.6 3.6 3.6 3.6
Mataroa 110 kV 2.5 2.6 2.5 2.5 2.5 2.5 2.5 2.5 2.5 2.5 2.5
National Park 33 kV 2.0 2.0 2.0 2.0 2.0 2.0 2.0 2.0 2.0 2.0 2.0
National Park 110 kV 1.8 1.8 1.8 1.8 1.8 1.8 1.8 1.8 1.8 1.8 1.8
Nga Awa Purua 220 kV 19.7 19.7 19.7 19.7 19.7 19.7 19.7 19.7 19.7 19.7 19.7
Ngatamariki 220 kV 14.2 14.2 14.2 14.2 14.2 14.2 14.2 14.2 14.2 14.2 14.2
Ohaaki 220 kV 15.9 15.9 15.9 15.9 15.9 15.9 15.9 15.9 15.9 15.9 15.9
Ohakune 11 kV 7.7 7.7 7.7 7.7 7.7 7.7 7.7 7.7 7.7 7.7 7.7
Ohakune 110 kV 2.2 2.2 2.1 2.2 2.2 2.2 2.2 2.2 2.2 2.2 2.2
Ongarue 33 kV 2.6 2.6 2.6 2.6 2.6 2.6 2.6 2.6 2.6 2.6 2.6
Ongarue 110 kV 2.6 2.6 2.6 2.6 2.6 2.6 2.6 2.6 2.6 2.6 2.6

Ten year forecast fault Levels
© Transpower New Zealand Limited 2016.All rights reserved. 10
Poihipi 220 kV 19.0 19.0 19.0 19.0 19.0 19.0 19.0 19.0 19.0 19.0 19.0
Rangipo 220 kV 6.9 6.9 6.9 6.9 6.9 6.9 6.9 6.9 6.9 6.9 6.9
Tangiwai 11 kV 19.8 19.8 19.8 19.8 19.8 19.8 19.8 19.8 19.8 19.8 19.8
Tangiwai 220 kV 5.0 5.0 5.0 5.0 5.0 5.0 5.0 5.0 5.0 5.0 5.0
Tararua Central 220 kV 8.7 8.7 8.7 8.8 8.8 8.8 8.8 8.8 8.8 8.8 8.8
Te Mihi 220 kV 23.8 23.8 23.8 23.8 23.8 23.8 23.8 23.8 23.8 23.8 23.8
Tokaanu 33 kV 3.8 3.8 3.8 3.8 3.8 3.8 3.8 3.8 3.8 3.8 3.8
Tokaanu 220 kV 12.1 12.1 12.1 12.1 12.1 12.1 12.1 12.1 12.1 12.1 12.1
Waipawa 11 kV 4.2 4.2 4.2 4.2 4.2 4.2 4.2 4.2 4.2 4.2 4.2
Waipawa 33 kV 4.8 4.8 4.8 4.8 4.8 4.8 4.8 4.8 4.8 4.8 4.8
Waipawa 110 kV (T1) 2.0 2.0 2.0 2.0 2.0 2.0 2.0 2.0 2.0 2.0 2.0
Waipawa 110 kV (T2) 2.0 2.0 2.0 2.0 2.0 2.0 2.0 2.0 2.0 2.0 2.0
Wairakei 33 kV 22.0 22.0 22.0 22.0 22.0 22.0 22.0 22.0 22.0 22.0 22.0
Wairakei 220 kV 26.7 26.7 26.7 26.7 26.7 26.7 26.7 26.7 26.7 26.7 26.7
Woodville 11 kV 10.1 10.1 10.0 10.0 10.0 10.0 10.0 10.0 10.0 10.0 10.0
Woodville 110 kV 7.6 7.6 7.4 7.4 7.4 7.4 7.4 7.4 7.4 7.4 7.4
TARANAKI
Brunswick 33 kV 8.9 8.9 8.9 9.0 9.0 9.0 9.0 9.0 9.0 9.0 9.0
Brunswick 220 kV 10.2 10.2 10.2 10.4 10.4 10.4 10.4 10.4 10.4 10.4 10.4
Carrington St 33 kV 13.2 13.2 13.4 13.8 13.8 13.8 13.8 13.8 13.8 13.8 13.8
Carrington St 110 kV 11.4 11.4 11.8 12.9 12.9 12.9 12.9 12.9 12.9 12.9 12.9
Hawera 33 kV (T1/T2) 8.1 8.1 8.1 8.2 8.2 8.2 8.2 8.2 8.2 8.2 8.2
Hawera 33 kV (T3) 4.7 4.7 4.7 4.7 4.7 4.7 4.7 4.7 4.7 4.7 4.7
Hawera 110 kV 7.6 7.6 7.6 7.7 7.7 7.7 7.7 7.7 7.7 7.7 7.7
Huirangi 33 kV 12.8 12.8 13.0 13.3 13.3 13.3 13.3 13.3 13.3 13.3 13.3
Huirangi 110 kV 8.9 8.9 9.1 9.7 9.7 9.7 9.7 9.7 9.7 9.7 9.7
Junction Road Tee 110 kV - - 8.2 8.6 8.6 8.6 8.6 8.6 8.6 8.6 8.6
Kapuni Tee 110 kV 5.9 5.9 5.9 6.0 6.0 6.0 6.0 6.0 6.0 6.0 6.0
McKee Tee 110 kV 6.8 6.8 6.9 7.1 7.1 7.1 7.1 7.1 7.1 7.1 7.1
Motunui 11 kV (T3) 15.9 15.9 15.9 16.1 16.1 16.1 16.1 16.1 16.1 16.1 16.1
Motunui 11 kV (T4) 16.0 16.0 16.1 16.2 16.2 16.2 16.2 16.2 16.2 16.2 16.2
Motunui 110 kV 8.6 8.6 8.8 9.3 9.3 9.3 9.3 9.3 9.3 9.3 9.3
New Plymouth 33 kV 10.4 10.4 10.4 10.6 10.6 10.6 10.6 10.6 10.6 10.6 10.6
New Plymouth 110 kV 12.3 12.3 12.3 13.6 13.6 13.6 13.6 13.6 13.6 13.6 13.6
New Plymouth 220 kV 9.0 9.0 9.0 9.5 9.6 9.6 9.6 9.6 9.6 9.6 9.6
Opunake 33 kV 4.4 4.4 4.4 4.4 4.4 4.4 4.4 4.4 4.4 4.4 4.4
Opunake 110 kV (T4) 3.5 3.5 3.5 3.5 3.5 3.5 3.5 3.5 3.5 3.5 3.5
Opunake 110 kV (T5) 3.3 3.3 3.3 3.3 3.3 3.3 3.3 3.3 3.3 3.3 3.3
Stratford 33 kV 11.3 11.3 11.3 11.4 11.4 11.4 11.4 11.4 11.4 11.4 11.4
Stratford 110 kV 12.6 12.6 12.6 13.2 13.2 13.2 13.2 13.2 13.2 13.2 13.2
Stratford 220 kV 12.8 12.8 12.8 13.4 13.4 13.4 13.4 13.4 13.4 13.4 13.4
Taumarunui 220 kV 4.2 4.2 4.2 4.2 4.2 4.2 4.2 4.2 4.2 4.2 4.2
Wanganui 33 kV 6.4 6.4 6.4 6.4 6.4 6.4 6.4 6.4 6.4 6.4 6.4
Wanganui 110 kV 5.2 5.2 5.1 5.1 5.1 5.1 5.1 5.1 5.1 5.1 5.1

Ten year forecast fault Levels
© Transpower New Zealand Limited 2016.All rights reserved. 11
Waverley 11 kV 5.2 5.2 5.2 5.2 5.2 5.2 5.2 5.2 5.2 5.2 5.2
Waverley 110 kV 4.4 4.4 4.4 4.4 4.4 4.4 4.4 4.4 4.4 4.4 4.4
HAWKE’S BAY
Fernhill 33 kV 9.6 9.6 9.6 9.6 9.6 9.6 9.6 9.6 9.6 9.6 9.6
Fernhill 110 kV 7.5 7.5 7.5 7.5 7.5 7.5 7.5 7.5 7.5 7.5 7.5
Redclyffe 33 kV 12.2 12.2 12.2 12.2 12.2 12.2 12.2 12.2 12.2 12.2 12.2
Redclyffe 110 kV 8.6 8.6 8.6 8.6 8.6 8.6 8.6 8.6 8.6 8.6 8.6
Redclyffe 220 kV 8.0 8.0 8.0 8.0 8.0 8.0 8.0 8.0 8.0 8.0 8.0
Tuai 110 kV 6.5 6.5 6.5 6.5 6.5 6.5 6.5 6.5 6.5 6.5 6.5
Whakatu 33 kV 13.2 13.2 13.2 13.2 13.2 13.2 13.2 13.2 13.2 13.2 13.2
Whakatu 220 kV (T3) 6.6 6.6 6.6 6.6 6.6 6.6 6.6 6.6 6.6 6.6 6.6
Whakatu 220 kV (T4) 6.6 6.6 6.6 6.6 6.6 6.6 6.6 6.6 6.6 6.6 6.6
Whirinaki 11 kV (T1) 16.8 16.8 16.8 16.8 16.8 16.8 16.8 16.8 16.8 16.8 16.8
Whirinaki 11 kV (T2) 21.1 21.1 21.1 21.1 21.1 21.1 21.1 21.1 21.1 21.1 21.1
Whirinaki 11 kV (T3) 21.6 21.6 21.6 21.6 21.6 21.6 21.6 21.6 21.6 21.6 21.6
Whirinaki 220 kV 8.6 8.6 8.6 8.6 8.6 8.6 8.6 8.6 8.6 8.6 8.6
WELLINGTON
Central Park 11 kV (T11) 7.2 7.2 7.2 7.2 7.2 7.2 7.2 7.2 7.2 7.2 7.2
Central Park 11 kV (T12) 7.2 7.2 7.2 7.2 7.2 7.2 7.2 7.2 7.2 7.2 7.2
Central Park 33 kV 18.6 18.6 18.6 18.6 18.6 18.6 18.6 18.6 18.6 18.6 18.6
Central Park 110 kV (T3) 8.0 8.0 8.0 8.0 8.0 8.0 8.0 8.0 8.0 8.0 8.0
Central Park 110 kV (T4) 8.0 8.0 8.0 8.0 8.0 8.0 8.0 8.0 8.0 8.0 8.0
Central Park 110 kV (T5) 10.5 10.5 10.5 10.5 10.5 10.5 10.5 10.5 10.5 10.5 10.5
Gracefield 33 kV 13.4 13.4 13.4 13.4 13.4 13.4 13.4 13.4 13.4 13.4 13.4
Gracefield 110 kV (T5) 9.2 9.2 9.2 9.3 9.3 9.3 9.3 9.3 9.3 9.3 9.3
Gracefield 110 kV (T6) 9.3 9.3 9.3 9.3 9.3 9.3 9.3 9.3 9.3 9.3 9.3
Greytown 33 kV 3.8 3.8 3.8 3.8 3.8 3.8 3.8 3.8 3.8 3.8 3.8
Greytown 110 kV (T2) 5.5 5.5 5.5 5.5 5.5 5.5 5.5 5.5 5.5 5.5 5.5
Greytown 110 kV (T3) 5.5 5.5 5.5 5.5 5.5 5.5 5.5 5.5 5.5 5.5 5.5
Haywards 11 kV 12.6 12.6 12.6 12.6 12.6 12.6 12.6 12.6 12.6 12.6 12.6
Haywards 33 kV 4.0 4.0 4.0 4.0 4.0 4.0 4.0 4.0 4.0 4.0 4.0
Haywards 110 kV 18.5 18.5 18.5 18.5 18.5 18.5 18.5 18.5 18.5 18.5 18.5
Haywards 220 kV 10.9 10.9 10.9 10.9 11.0 11.0 11.0 11.0 11.0 11.0 11.0
Kaiwharawhara 11 kV (T1) 8.0 8.0 8.0 8.0 8.0 8.0 8.0 8.0 8.0 8.0 8.0
Kaiwharawhara 11 kV (T3) 8.0 8.0 8.0 8.0 8.0 8.0 8.0 8.0 8.0 8.0 8.0
Kaiwharawhara 110 kV (T1) 10.4 10.4 10.5 10.5 10.5 10.5 10.5 10.5 10.5 10.5 10.5
Kaiwharawhara 110 kV (T3) 10.4 10.4 10.5 10.5 10.5 10.5 10.5 10.5 10.5 10.5 10.5
Masterton 33 kV 8.7 8.7 8.7 8.7 8.7 8.7 8.7 8.7 8.7 8.7 8.7
Masterton 110 kV 5.5 5.5 5.5 5.5 5.5 5.5 5.5 5.5 5.5 5.5 5.5
Melling 11 kV 13.6 13.6 13.6 13.6 13.6 13.6 13.6 13.6 13.6 13.6 13.6
Melling 33 kV 9.4 9.4 9.4 9.4 9.4 9.4 9.4 9.4 9.4 9.4 9.4

Ten year forecast fault Levels
© Transpower New Zealand Limited 2016.All rights reserved. 12
Melling 110 kV (T1/T3) 9.6 9.6 9.6 9.6 9.6 9.6 9.6 9.6 9.6 9.6 9.6
Melling 110 kV (T2/T4) 9.5 9.5 9.5 9.5 9.5 9.5 9.5 9.5 9.5 9.5 9.5
Paraparaumu 33 kV 20.5 20.5 20.6 20.6 20.8 20.8 20.8 20.8 20.8 20.8 20.8
Paraparaumu 220 kV (T1) 7.2 7.2 7.2 7.4 7.6 7.6 7.6 7.6 7.6 7.6 7.6
Paraparaumu 220 kV (T2) 7.2 7.2 7.2 7.4 7.6 7.6 7.6 7.6 7.6 7.6 7.6
Pauatahanui 33 kV 6.3 6.3 6.3 6.3 6.3 6.3 6.3 6.3 6.3 6.3 6.3
Pauatahanui 110 kV (T1) 9.5 9.5 9.6 9.6 9.6 9.6 9.6 9.6 9.6 9.6 9.6
Pauatahanui 110 kV (T2) 9.5 9.5 9.5 9.6 9.6 9.6 9.6 9.6 9.6 9.6 9.6
Takapu Road 33 kV 14.5 14.5 14.5 14.5 14.5 14.5 14.5 14.5 14.5 14.5 14.5
Takapu Road 110 kV 15.2 15.2 15.2 15.2 15.2 15.2 15.2 15.2 15.2 15.2 15.2
Upper Hutt 33 kV 9.6 9.6 9.6 9.6 9.6 9.6 9.6 9.6 9.6 9.6 9.6
Upper Hutt 110 kV 13.6 13.6 13.6 13.6 13.6 13.6 13.6 13.6 13.6 13.6 13.6
West Wind 110 kV (Circuit–2) 8.4 8.4 8.4 8.4 8.4 8.4 8.4 8.4 8.4 8.4 8.4
West Wind 110 kV (Circuit–3) 8.4 8.4 8.4 8.5 8.5 8.5 8.5 8.5 8.5 8.5 8.5
Wilton 33 kV 13.2 13.2 13.2 13.2 13.2 13.2 13.2 13.2 13.2 13.2 13.2
Wilton 110 kV 12.8 12.8 12.8 12.8 12.8 12.8 12.8 12.8 12.8 12.8 12.8
Wilton 220 kV 8.0 8.0 8.0 8.0 8.0 8.0 8.0 8.0 8.0 8.0 8.0
NELSON-MARLBOROUGH
Argyle 110 kV 2.6 2.6 2.6 2.6 2.6 2.6 2.6 2.6 2.6 2.6 2.6
Blenheim 33 kV 6.7 6.7 6.7 6.7 6.7 6.7 6.7 6.7 6.7 6.7 6.7
Blenheim 110 kV 2.6 2.6 2.6 2.6 2.6 2.6 2.6 2.6 2.6 2.6 2.6
Stoke 33 kV 11.4 11.4 11.4 11.4 11.4 11.4 11.4 11.4 11.4 11.4 11.4
Stoke 66 kV 4.4 4.4 4.4 4.4 4.4 4.4 4.4 4.4 4.4 4.4 4.4
Stoke 110 kV 3.9 3.9 3.9 3.9 3.9 3.9 3.9 3.9 3.9 3.9 3.9
Stoke 220 kV 2.6 2.6 2.6 2.6 2.6 2.6 2.6 2.6 2.6 2.6 2.6
WEST COAST
Arthurs Pass 11 kV 2.2 2.2 2.2 2.2 2.2 2.2 2.2 2.2 2.2 2.2 2.2
Arthurs Pass 66 kV 2.0 2.0 2.0 2.0 2.0 2.0 2.0 2.0 2.0 2.0 2.0
Atarau 110 kV 1.5 1.5 1.5 1.5 1.5 1.5 1.5 1.5 1.5 1.5 1.5
Castle Hill 11 kV 2.7 2.7 2.7 2.7 2.7 2.7 2.7 2.7 2.7 2.7 2.7
Castle Hill 66 kV 2.3 2.3 2.3 2.3 2.3 2.3 2.3 2.3 2.3 2.3 2.3
Dobson 33 kV 3.0 3.0 3.0 3.0 3.0 3.0 3.0 3.0 3.0 3.0 3.0
Dobson 66 kV 2.6 2.6 2.6 2.6 2.6 2.6 2.6 2.6 2.6 2.6 2.6
Dobson T11 (110 kV) 1.5 1.5 1.5 1.5 1.5 1.5 1.5 1.5 1.5 1.5 1.5
Dobson T12 (110 kV) 1.5 1.5 1.5 1.5 1.5 1.5 1.5 1.5 1.5 1.5 1.5
Greymouth 66 kV 2.4 2.4 2.4 2.4 2.4 2.4 2.4 2.4 2.4 2.4 2.4
Hokitika 66 kV 1.6 1.6 1.6 1.6 1.6 1.6 1.6 1.6 1.6 1.6 1.6
Inangahua 110 kV 2.2 2.2 2.2 2.2 2.2 2.2 2.2 2.2 2.2 2.2 2.2
Kikiwa 11 kV 2.9 2.9 2.9 2.9 2.9 2.9 2.9 2.9 2.9 2.9 2.9
Kikiwa 110 kV 4.2 4.2 4.2 4.2 4.2 4.2 4.2 4.2 4.2 4.2 4.2
Kikiwa 220 kV 3.1 3.1 3.1 3.1 3.1 3.1 3.1 3.1 3.1 3.1 3.1

Ten year forecast fault Levels
© Transpower New Zealand Limited 2016.All rights reserved. 13
Kumara 66 kV 2.3 2.3 2.3 2.3 2.3 2.3 2.3 2.3 2.3 2.3 2.3
Murchison 11 kV 2.6 2.6 4.7 4.7 4.7 4.7 4.7 4.7 4.7 4.7 4.7
Murchison 110 kV 2.2 2.2 2.2 2.2 2.2 2.2 2.2 2.2 2.2 2.2 2.2
Orowaiti 110 kV (Circuit–1) 1.5 1.5 1.5 1.5 1.5 1.5 1.5 1.5 1.5 1.5 1.5
Orowaiti 110 kV (Circuit–2) 1.5 1.5 1.5 1.5 1.5 1.5 1.5 1.5 1.5 1.5 1.5
Otira 11 kV 1.6 1.6 1.6 1.6 1.6 1.6 1.6 1.6 1.6 1.6 1.6
Otira 66 kV 2.2 2.2 2.2 2.2 2.2 2.2 2.2 2.2 2.2 2.2 2.2
Reefton 110 kV (Circuit–1) 1.7 1.7 1.7 1.7 1.7 1.7 1.7 1.7 1.7 1.7 1.7
Reefton 110 kV (Circuit–2) 1.7 1.7 1.7 1.7 1.7 1.7 1.7 1.7 1.7 1.7 1.7
Waimangaroa 110 kV (Circuit–1) 1.6 1.6 1.6 1.6 1.6 1.6 1.6 1.6 1.6 1.6 1.6
Waimangaroa 110 kV (Circuit–2) 1.7 1.7 1.7 1.7 1.7 1.7 1.7 1.7 1.7 1.7 1.7
Westport 11 kV 8.6 8.6 8.6 8.6 8.6 8.6 8.6 8.6 8.6 8.6 8.6
Westport 110 kV (T1) 1.4 1.4 1.4 1.4 1.4 1.4 1.4 1.4 1.4 1.4 1.4
Westport 110 kV (T2) 1.4 1.4 1.4 1.4 1.4 1.4 1.4 1.4 1.4 1.4 1.4
CANTERBURY
Ashburton 33 kV 9.7 9.7 9.7 9.7 9.7 9.7 9.7 9.7 9.7 9.7 9.7
Ashburton 66 kV 10.2 10.2 10.2 10.2 10.2 10.2 10.2 10.2 10.2 10.2 10.2
Ashburton 220 kV 7.2 7.2 7.2 7.2 7.3 7.3 7.3 7.3 7.3 7.3 7.3
Ashley 11 kV (T5) 7.7 7.7 7.7 7.7 7.7 7.7 7.7 7.7 7.7 7.7 7.7
Ashley 11 kV (T3) 7.7 7.7 7.7 7.7 7.7 7.7 7.7 7.7 7.7 7.7 7.7
Ashley 66 kV 5.0 5.0 5.0 5.0 5.0 5.0 5.0 5.0 5.0 5.0 5.0
Bromley 66 kV 12.1 12.1 9.7 9.7 9.7 9.7 9.7 9.7 9.7 9.7 9.7
Bromley 220 kV 5.6 5.6 5.6 5.6 5.6 5.6 5.6 5.6 5.6 5.6 5.6
Coleridge 11 kV 1.6 1.6 1.6 1.6 1.6 1.6 1.6 1.6 1.6 1.6 1.6
Coleridge 66 kV 4.3 4.3 4.3 4.3 4.3 4.3 4.3 4.3 4.3 4.3 4.3
Culverden 33 kV 7.1 7.1 7.1 7.1 7.1 7.1 7.1 7.1 7.1 7.1 7.1
Culverden 66 kV 1.0 1.0 1.0 1.0 1.0 1.0 1.0 1.0 1.0 1.0 1.0
Culverden 220 kV (T22) 3.1 3.1 3.1 3.1 3.1 3.1 3.1 3.1 3.1 3.1 3.1
Culverden 220 kV (T23) 3.1 3.1 3.1 3.1 3.1 3.1 3.1 3.1 3.1 3.1 3.1
Hororata 33 kV 2.8 2.8 2.8 2.8 2.8 2.8 2.8 2.8 2.8 2.8 2.8
Hororata 66 kV 4.5 4.5 4.5 4.5 4.5 4.5 4.5 4.5 4.5 4.5 4.5
Islington 33 kV 14.6 14.6 14.6 14.6 14.6 14.6 14.6 14.6 14.6 14.6 14.6
Islington 66 kV 15.1 15.1 15.1 15.1 15.1 15.1 15.1 15.1 15.1 15.1 15.1
Islington 220 kV 6.6 6.6 6.6 6.6 6.6 6.6 6.6 6.6 6.6 6.6 6.6
Kaiapoi 11 kV 12.9 12.9 12.9 12.9 12.9 12.9 12.9 12.9 12.9 12.9 12.9
Kaiapoi 66 kV 5.6 5.6 5.6 5.6 5.6 5.6 5.6 5.6 5.6 5.6 5.6
Kimberley 66 kV (T1) 4.1 4.1 4.1 4.1 4.1 4.1 4.1 4.1 4.1 4.1 4.1
Kimberley 66 kV (T2) 4.1 4.1 4.1 4.1 4.1 4.1 4.1 4.1 4.1 4.1 4.1
Southbrook 33 kV 6.0 6.0 6.0 6.0 6.0 6.0 6.0 6.0 6.0 6.0 6.0
Southbrook 66 kV 7.0 7.0 7.0 7.0 7.0 7.0 7.0 7.0 7.0 7.0 7.0
Waipara 33 kV 1.8 1.8 1.8 1.8 1.8 1.8 1.8 1.8 1.8 1.8 1.8
Waipara 66 kV 8.2 8.2 8.2 8.2 8.2 8.2 8.2 8.2 8.2 8.2 8.2
Waipara 220 kV (T12) 3.8 3.8 3.8 3.8 3.8 3.8 3.8 3.8 3.8 3.8 3.8
Waipara 220 kV (T13) 3.8 3.8 3.8 3.8 3.8 3.8 3.8 3.8 3.8 3.8 3.8

Ten year forecast fault Levels
© Transpower New Zealand Limited 2016.All rights reserved. 14
SOUTH CANTERBURY
Albury 11 kV 3.6 8.3 8.3 8.3 8.6 8.6 8.6 8.6 8.6 8.6 8.6
Albury 110 kV 2.8 2.8 2.8 2.8 3.1 3.1 3.1 3.1 3.1 3.1 3.1
Aviemore 220 kV 16.1 16.1 16.1 16.1 16.1 16.1 16.1 16.1 16.1 16.1 16.1
Bells Pond 110 kV 3.9 3.9 3.9 3.9 4.0 4.0 4.0 4.0 4.0 4.0 4.0
Benmore 220 kV 19.8 19.8 19.8 19.8 19.8 19.8 19.8 19.8 19.8 19.8 19.8
Black Point 110 kV 3.2 3.2 3.2 3.2 3.3 3.3 3.3 3.3 3.3 3.3 3.3
Livingstone 220 kV 9.1 9.1 9.1 9.1 9.1 9.1 9.1 9.1 9.1 9.1 9.1
Oamaru 33 kV 6.0 6.0 6.0 6.0 6.1 6.1 6.1 6.1 6.1 6.1 6.1
Oamaru 110 kV (T1) 2.1 2.1 2.1 2.1 2.1 2.1 2.1 2.1 2.1 2.1 2.1
Oamaru 110 kV (T2) 2.6 2.6 2.6 2.6 2.6 2.6 2.6 2.6 2.6 2.6 2.6
Ohau A 220 kV 17.8 17.8 17.8 17.8 17.8 17.8 17.8 17.8 17.8 17.8 17.8
Ohau B 220 kV 19.3 19.3 19.3 19.3 19.3 19.3 19.3 19.3 19.3 19.3 19.3
Ohau C 220 kV 17.2 17.2 17.2 17.2 17.2 17.2 17.2 17.2 17.2 17.2 17.2
Studholme 11 kV 9.2 9.2 9.2 9.2 9.4 9.4 9.4 9.4 9.4 9.4 9.4
Studholme 110 kV 3.7 3.7 3.7 3.7 3.9 3.9 3.9 3.9 3.9 3.9 3.9
Tekapo A 11 kV 16.4 16.4 16.4 16.4 16.7 16.7 16.7 16.7 16.7 16.7 16.7
Tekapo A 33 kV 1.7 1.7 1.7 1.7 1.7 1.7 1.7 1.7 1.7 1.7 1.7
Tekapo A 110 kV 2.0 2.0 2.0 2.0 2.1 2.1 2.1 2.1 2.1 2.1 2.1
Tekapo B 220 kV 11.9 11.9 11.9 11.9 11.9 11.9 11.9 11.9 11.9 11.9 11.9
Temuka 33 kV 7.0 7.0 7.0 7.0 7.7 7.7 7.7 7.7 7.7 7.7 7.7
Temuka 110 kV (T1) 3.7 3.7 3.7 3.7 4.4 4.4 4.4 4.4 4.4 4.4 4.4
Temuka 110 kV (T2) 3.7 3.7 3.7 3.7 4.4 4.4 4.4 4.4 4.4 4.4 4.4
Timaru 11 kV 15.5 15.5 15.5 15.5 16.6 16.6 16.6 16.6 16.6 16.6 16.6
Timaru 110 kV 6.0 6.0 6.0 6.0 8.2 8.2 8.2 8.2 8.2 8.2 8.2
Timaru 220 kV (T5) 4.8 4.8 4.8 4.8 7.0 7.0 7.0 7.0 7.0 7.0 7.0
Timaru 220 kV (T8) 4.8 4.8 4.8 4.8 7.0 7.0 7.0 7.0 7.0 7.0 7.0
Twizel 33 kV (T18) 4.7 4.7 4.7 4.7 4.7 4.7 4.7 4.7 4.7 4.7 4.7
Twizel 33 kV (T19) 4.7 4.7 4.7 4.7 4.7 4.7 4.7 4.7 4.7 4.7 4.7
Twizel 220 kV 20.8 20.8 20.8 20.8 20.8 20.8 20.8 20.8 20.8 20.8 20.8
Waitaki 11 kV (T28) 36.3 36.3 36.3 36.3 36.3 36.3 36.3 36.3 36.3 36.3 36.3
Waitaki 33 kV (T28) 0.7 0.7 0.7 0.7 0.7 0.7 0.7 0.7 0.7 0.7 0.7
Waitaki 220 kV 13.7 13.7 13.7 13.7 13.7 13.7 13.7 13.7 13.7 13.7 13.7
OTAGO-SOUTHLAND
Balclutha 33 kV 3.8 3.6 3.6 3.6 3.6 3.6 3.6 3.6 3.6 3.6 3.6
Balclutha 110 kV 2.8 2.5 2.5 2.4 2.4 2.4 2.4 2.4 2.4 2.4 2.4
Berwick 110 kV 5.0 4.9 4.9 4.4 4.4 4.4 4.4 4.4 4.4 4.4 4.4
Brydone 11 kV 12.4 13.8 13.8 13.8 13.8 13.8 13.8 13.8 13.8 13.8 13.8
Brydone 110 kV 3.5 4.8 4.8 4.8 4.8 4.8 4.8 4.8 4.8 4.8 4.8
Clyde 33 kV 10.4 10.4 10.4 10.4 10.4 10.4 10.4 10.4 10.4 10.4 10.4
Clyde 220 kV 15.7 15.7 15.7 15.7 15.7 15.7 15.7 15.7 15.7 15.7 15.7
Cromwell 33 kV 10.5 10.5 10.5 10.5 10.5 10.5 10.5 10.5 10.5 10.5 10.5

Ten year forecast fault Levels
© Transpower New Zealand Limited 2016.All rights reserved. 15
Cromwell 110 kV (T5A/B) 4.9 4.9 4.9 4.9 4.9 4.9 4.9 4.9 4.9 4.9 4.9
Cromwell 110 kV (T8) 5.2 5.2 5.2 5.2 5.2 5.2 5.2 5.2 5.2 5.2 5.2
Cromwell 220 kV (T5A/B) 10.1 10.1 10.1 10.1 10.1 10.1 10.1 10.1 10.1 10.1 10.1
Cromwell 220 kV (T8) 10.1 10.1 10.1 10.1 10.1 10.1 10.1 10.1 10.1 10.1 10.1
Edendale 33 kV 5.9 6.5 6.5 6.5 6.5 6.5 6.5 6.5 6.5 6.5 6.5
Edendale 110 kV 3.5 4.3 4.3 4.3 4.3 4.3 4.3 4.3 4.3 4.3 4.3
Frankton 33 kV 7.6 7.6 7.6 7.6 7.6 7.6 7.6 7.6 7.6 7.6 7.6
Frankton 110 kV (T2) 2.8 2.8 2.8 2.8 2.8 2.8 2.8 2.8 2.8 2.8 2.8
Frankton 110 kV (T4) 2.8 2.8 2.8 2.8 2.8 2.8 2.8 2.8 2.8 2.8 2.8
Gore 33 kV 6.1 7.8 7.8 7.8 7.8 7.8 7.8 7.8 7.8 7.8 7.8
Gore 110 kV (T2/T3) 3.7 6.9 6.9 6.9 6.9 6.9 6.9 6.9 6.9 6.9 6.9
Gore 110 kV 3.7 2.4 2.4 2.4 2.4 2.4 2.4 2.4 2.4 2.4 2.4
Gore 220 kV (T11) - 5.5 5.5 5.5 5.5 5.5 5.5 5.5 5.5 5.5 5.5
Gore 220 kV (T12) - 5.5 5.5 5.5 5.5 5.5 5.5 5.5 5.5 5.5 5.5
Halfway Bush 33 kV (T1/T2) 17.0 17.0 21.5 21.5 21.5 21.5 21.5 21.5 21.5 21.5 21.5
Halfway Bush 33 kV (T5) 14.0 14.0 21.5 21.5 21.5 21.5 21.5 21.5 21.5 21.5 21.5
Halfway Bush 110 kV 10.4 10.4 10.4 6.8 6.8 6.8 6.8 6.8 6.8 6.8 6.8
Halfway Bush 220 kV 8.1 8.1 8.1 7.9 7.9 7.9 7.9 7.9 7.9 7.9 7.9
Invercargill 33 kV 17.5 17.4 17.4 17.4 17.4 17.4 17.4 17.4 17.4 17.4 17.4
Invercargill 110 kV 4.5 4.7 4.7 4.7 4.7 4.7 4.7 4.7 4.7 4.7 4.7
Invercargill 220 kV 9.8 9.6 9.6 9.6 9.6 9.6 9.6 9.6 9.6 9.6 9.6
Manapouri 220 kV 11.9 11.8 11.8 11.8 11.8 11.8 11.8 11.8 11.8 11.8 11.8
North Makarewa 33 kV 10.5 10.5 10.5 10.5 10.5 10.5 10.5 10.5 10.5 10.5 10.5
North Makarewa 220 kV 9.9 9.7 9.7 9.7 9.7 9.7 9.7 9.7 9.7 9.7 9.7
Naseby 33 kV 7.8 7.8 7.8 7.8 7.8 7.8 7.8 7.8 7.8 7.8 7.8
Naseby 220 kV 6.3 6.3 6.3 6.3 6.3 6.3 6.3 6.3 6.3 6.3 6.3
Roxburgh 110 kV 10.4 10.0 10.0 9.8 9.8 9.8 9.8 9.8 9.8 9.8 9.8
Roxburgh 220 kV 16.0 16.0 16.0 16.0 16.0 16.0 16.0 16.0 16.0 16.0 16.0
South Dunedin 33 kV 17.4 17.4 17.4 17.3 17.3 17.3 17.3 17.3 17.3 17.3 17.3
South Dunedin 220 kV 7.5 7.5 7.5 7.4 7.4 7.4 7.4 7.4 7.4 7.4 7.4
Three Mile Hill 220 kV 8.5 8.5 8.5 8.3 8.3 8.3 8.3 8.3 8.3 8.3 8.3
Tiwai 220 kV 8.8 8.6 8.6 8.6 8.6 8.6 8.6 8.6 8.6 8.6 8.6
Ten year forecast fault Levels
© Transpower New Zealand Limited 2016.All rights reserved. 16
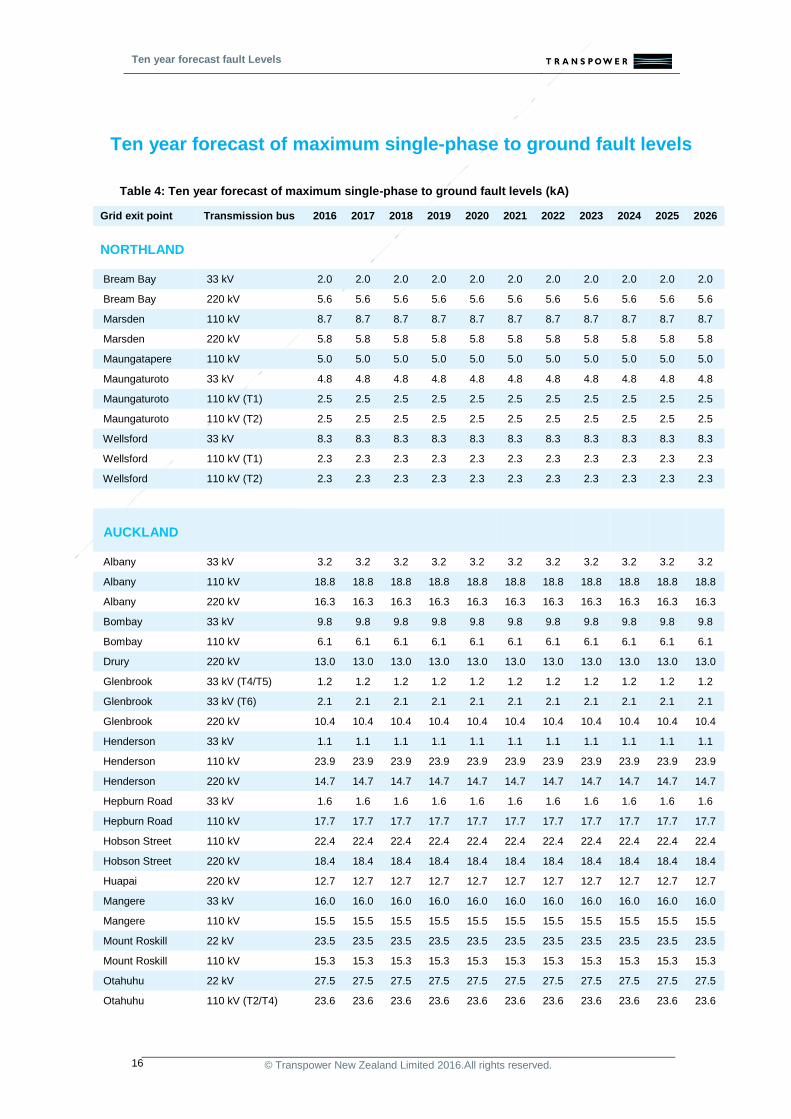
Ten year forecast of maximum single-phase to ground fault levels
Table 4: Ten year forecast of maximum single-phase to ground fault levels (kA)
Grid exit point Transmission bus 2016 2017 2018 2019 2020 2021 2022 2023 2024 2025 2026
NORTHLAND
Bream Bay 33 kV 2.0 2.0 2.0 2.0 2.0 2.0 2.0 2.0 2.0 2.0 2.0
Bream Bay 220 kV 5.6 5.6 5.6 5.6 5.6 5.6 5.6 5.6 5.6 5.6 5.6
Marsden 110 kV 8.7 8.7 8.7 8.7 8.7 8.7 8.7 8.7 8.7 8.7 8.7
Marsden 220 kV 5.8 5.8 5.8 5.8 5.8 5.8 5.8 5.8 5.8 5.8 5.8
Maungatapere 110 kV 5.0 5.0 5.0 5.0 5.0 5.0 5.0 5.0 5.0 5.0 5.0
Maungaturoto 33 kV 4.8 4.8 4.8 4.8 4.8 4.8 4.8 4.8 4.8 4.8 4.8
Maungaturoto 110 kV (T1) 2.5 2.5 2.5 2.5 2.5 2.5 2.5 2.5 2.5 2.5 2.5
Maungaturoto 110 kV (T2) 2.5 2.5 2.5 2.5 2.5 2.5 2.5 2.5 2.5 2.5 2.5
Wellsford 33 kV 8.3 8.3 8.3 8.3 8.3 8.3 8.3 8.3 8.3 8.3 8.3
Wellsford 110 kV (T1) 2.3 2.3 2.3 2.3 2.3 2.3 2.3 2.3 2.3 2.3 2.3
Wellsford 110 kV (T2) 2.3 2.3 2.3 2.3 2.3 2.3 2.3 2.3 2.3 2.3 2.3
AUCKLAND
Albany 33 kV 3.2 3.2 3.2 3.2 3.2 3.2 3.2 3.2 3.2 3.2 3.2
Albany 110 kV 18.8 18.8 18.8 18.8 18.8 18.8 18.8 18.8 18.8 18.8 18.8
Albany 220 kV 16.3 16.3 16.3 16.3 16.3 16.3 16.3 16.3 16.3 16.3 16.3
Bombay 33 kV 9.8 9.8 9.8 9.8 9.8 9.8 9.8 9.8 9.8 9.8 9.8
Bombay 110 kV 6.1 6.1 6.1 6.1 6.1 6.1 6.1 6.1 6.1 6.1 6.1
Drury 220 kV 13.0 13.0 13.0 13.0 13.0 13.0 13.0 13.0 13.0 13.0 13.0
Glenbrook 33 kV (T4/T5) 1.2 1.2 1.2 1.2 1.2 1.2 1.2 1.2 1.2 1.2 1.2
Glenbrook 33 kV (T6) 2.1 2.1 2.1 2.1 2.1 2.1 2.1 2.1 2.1 2.1 2.1
Glenbrook 220 kV 10.4 10.4 10.4 10.4 10.4 10.4 10.4 10.4 10.4 10.4 10.4
Henderson 33 kV 1.1 1.1 1.1 1.1 1.1 1.1 1.1 1.1 1.1 1.1 1.1
Henderson 110 kV 23.9 23.9 23.9 23.9 23.9 23.9 23.9 23.9 23.9 23.9 23.9
Henderson 220 kV 14.7 14.7 14.7 14.7 14.7 14.7 14.7 14.7 14.7 14.7 14.7
Hepburn Road 33 kV 1.6 1.6 1.6 1.6 1.6 1.6 1.6 1.6 1.6 1.6 1.6
Hepburn Road 110 kV 17.7 17.7 17.7 17.7 17.7 17.7 17.7 17.7 17.7 17.7 17.7
Hobson Street 110 kV 22.4 22.4 22.4 22.4 22.4 22.4 22.4 22.4 22.4 22.4 22.4
Hobson Street 220 kV 18.4 18.4 18.4 18.4 18.4 18.4 18.4 18.4 18.4 18.4 18.4
Huapai 220 kV 12.7 12.7 12.7 12.7 12.7 12.7 12.7 12.7 12.7 12.7 12.7
Mangere 33 kV 16.0 16.0 16.0 16.0 16.0 16.0 16.0 16.0 16.0 16.0 16.0
Mangere 110 kV 15.5 15.5 15.5 15.5 15.5 15.5 15.5 15.5 15.5 15.5 15.5
Mount Roskill 22 kV 23.5 23.5 23.5 23.5 23.5 23.5 23.5 23.5 23.5 23.5 23.5
Mount Roskill 110 kV 15.3 15.3 15.3 15.3 15.3 15.3 15.3 15.3 15.3 15.3 15.3
Otahuhu 22 kV 27.5 27.5 27.5 27.5 27.5 27.5 27.5 27.5 27.5 27.5 27.5
Otahuhu 110 kV (T2/T4) 23.6 23.6 23.6 23.6 23.6 23.6 23.6 23.6 23.6 23.6 23.6

Ten year forecast fault Levels
© Transpower New Zealand Limited 2016.All rights reserved. 17
Otahuhu 110 kV (T3/T5) 19.2 19.2 19.2 19.2 19.2 19.2 19.2 19.2 19.2 19.2 19.2
Otahuhu 220 kV 20.8 20.8 20.8 20.8 20.8 20.8 20.8 20.8 20.8 20.8 20.8
Pakuranga 33 kV 3.6 3.6 3.6 3.6 3.6 3.6 3.6 3.6 3.6 3.6 3.6
Pakuranga 220 kV 20.6 20.7 20.7 20.7 20.7 20.7 20.7 20.7 20.7 20.7 20.7
Penrose 22 kV 19.0 19.1 19.1 19.1 19.1 19.1 19.1 19.1 19.1 19.1 19.1
Penrose 33 kV 20.9 20.9 20.9 20.9 20.9 20.9 20.9 20.9 20.9 20.9 20.9
Penrose 110 kV 25.2 25.2 25.2 25.3 25.3 25.3 25.3 25.3 25.3 25.3 25.3
Penrose 220 kV 20.0 20.0 20.0 20.0 20.0 20.0 20.0 20.0 20.0 20.0 20.0
Silverdale 33 kV 1.0 1.0 1.0 1.0 1.0 1.0 1.0 1.0 1.0 1.0 1.0
Silverdale 220 kV (T1) 9.0 9.0 9.0 9.0 9.0 9.0 9.0 9.0 9.0 9.0 9.0
Silverdale 220 kV (T2) 9.0 9.0 9.0 9.0 9.0 9.0 9.0 9.0 9.0 9.0 9.0
Southdown 220 kV 15.4 15.4 15.4 15.4 15.4 15.4 15.4 15.4 15.4 15.4 15.4
Takanini 33 kV 1.1 1.1 1.1 1.1 1.1 1.1 1.1 1.1 1.1 1.1 1.1
Takanini 220 kV (T5) 14.7 14.7 14.7 14.7 14.7 14.7 14.7 14.7 14.7 14.7 14.7
Takanini 220 kV (T8) 14.2 14.2 14.2 14.2 14.2 14.2 14.2 14.2 14.2 14.2 14.2
Wairau Road 33 kV 19.8 19.8 19.8 19.8 19.8 19.8 19.8 19.8 19.8 19.8 19.8
Wairau Road 220 kV 17.0 17.0 17.0 17.0 17.0 17.0 17.0 17.0 17.0 17.0 17.0
Wiri 33 kV 2.3 2.3 2.3 2.3 2.3 2.3 2.3 2.3 2.3 2.3 2.3
Wiri 110 kV (T1) 12.5 12.5 12.5 12.5 12.5 12.5 12.5 12.5 12.5 12.5 12.5
Wiri 110 kV (T2) 12.4 12.4 12.4 12.4 12.4 12.4 12.4 12.4 12.4 12.4 12.4
WAIKATO
Arapuni 110 kV (North Bus) 12.9 12.9 12.9 12.9 12.9 12.9 12.9 12.9 12.9 12.9 12.9
Arapuni 110 kV (South Bus)
12.9 12.9 12.9 12.9 12.9 12.9 12.9 12.9 12.9 12.9 12.9
Atiamuri 220 kV 16.7 16.7 16.7 16.7 16.7 16.7 16.7 16.7 16.7 16.7 16.7
Cambridge 11 kV 24.8 24.8 24.8 24.8 24.8 24.8 24.8 24.8 24.8 24.8 24.8
Cambridge 110 kV (T3) 7.6 7.7 7.7 7.7 7.7 7.7 7.7 7.7 7.7 7.7 7.7
Cambridge 110 kV (T4) 7.6 7.7 7.7 7.7 7.7 7.7 7.7 7.7 7.7 7.7 7.7
Hamilton 11 kV 13.8 13.8 13.8 13.8 13.8 13.8 13.8 13.8 13.8 13.8 13.8
Hamilton 33 kV 1.1 1.1 1.1 1.1 1.1 1.1 1.1 1.1 1.1 1.1 1.1
Hamilton 110 kV 13.8 14.0 14.0 14.0 14.0 14.0 14.0 14.0 14.0 14.0 14.0
Hamilton 220 kV 11.3 11.4 11.4 11.4 11.4 11.4 11.4 11.4 11.4 11.4 11.4
Hangatiki 33 kV 6.1 6.1 6.1 6.1 6.1 6.1 6.1 6.1 6.1 6.1 6.1
Hangatiki 110 kV 4.1 4.1 4.1 4.1 4.1 4.1 4.1 4.1 4.1 4.1 4.1
Hinuera 33 kV 8.8 8.8 8.8 8.8 8.8 8.8 8.8 8.8 8.8 8.8 8.8
Hinuera 110 kV 3.1 3.1 3.1 3.1 3.1 3.1 3.1 3.1 3.1 3.1 3.1
Huntly 11 kV 17.0 17.0 17.0 17.0 17.0 17.0 17.0 17.0 17.0 17.0 17.0
Huntly 33 kV 1.1 1.1 1.1 1.1 1.1 1.1 1.1 1.1 1.1 1.1 1.1
Huntly 220 kV 23.9 24.0 24.0 24.0 24.0 24.0 24.0 24.0 24.0 24.0 24.0
Karapiro 110 kV 9.7 9.8 9.8 9.8 9.8 9.8 9.8 9.8 9.8 9.8 9.8
Kinleith 11 kV (T1A) 15.0 15.0 15.0 15.0 15.0 15.0 15.0 15.0 15.0 15.0 15.0
Kinleith 11 kV (T2) 14.8 14.8 14.8 14.8 14.8 14.8 14.8 14.8 14.8 14.8 14.8
Kinleith 11 kV (T3A and T3B)
15.6 15.6 15.6 15.6 15.6 15.6 15.6 15.6 15.6 15.6 15.6
Kinleith 11 kV (T5) 0.03 0.03 0.03 0.03 0.03 0.03 0.03 0.03 0.03 0.03 0.03

Ten year forecast fault Levels
© Transpower New Zealand Limited 2016.All rights reserved. 18
Kinleith 33 kV 5.3 5.3 5.3 5.3 5.3 5.3 5.3 5.3 5.3 5.3 5.3
Kinleith 110 kV 8.1 8.1 8.1 8.1 8.1 8.1 8.1 8.1 8.1 8.1 8.1
Kopu 66 kV 3.3 3.3 3.3 3.3 3.3 3.3 3.3 3.3 3.3 3.3 3.3
Kopu 110 kV (T3) 1.2 1.2 1.2 1.2 1.2 1.2 1.2 1.2 1.2 1.2 1.2
Kopu 110 kV (T4) 1.2 1.2 1.2 1.2 1.2 1.2 1.2 1.2 1.2 1.2 1.2
Lichfield 110 kV (T1) 5.5 5.5 5.5 5.5 5.5 5.5 5.5 5.5 5.5 5.5 5.5
Lichfield 110 kV (T2) 5.3 5.3 5.3 5.3 5.3 5.3 5.3 5.3 5.3 5.3 5.3
Maraetai 220 kV 20.6 20.6 20.6 20.7 20.7 20.7 20.7 20.7 20.7 20.7 20.7
Ohakuri 220 kV 15.8 15.8 15.8 15.8 15.8 15.8 15.8 15.8 15.8 15.8 15.8
Ohinewai 220 kV 16.7 16.7 16.7 16.7 16.7 16.7 16.7 16.7 16.7 16.7 16.7
Piako 110 kV 3.3 3.3 3.3 3.3 3.3 3.3 3.3 3.3 3.3 3.3 3.3
Te Awamutu 11 kV 23.4 23.4 23.4 23.4 23.4 23.4 23.4 23.4 23.4 23.4 23.4
Te Awamutu 110 kV 4.2 4.3 4.3 4.3 4.3 4.3 4.3 4.3 4.3 4.3 4.3
Te Kowhai 33 kV 1.1 1.1 1.1 1.1 1.1 1.1 1.1 1.1 1.1 1.1 1.1
Te Kowhai 220 kV 8.3 8.3 8.3 8.3 8.3 8.3 8.3 8.3 8.3 8.3 8.3
Waihou 33 kV 8.0 8.0 8.0 8.0 8.0 8.0 8.0 8.0 8.0 8.0 8.0
Waihou 110 kV 2.7 2.7 2.7 2.7 2.7 2.7 2.7 2.7 2.7 2.7 2.7
Waikino 33 kV 7.3 7.3 7.3 7.3 7.3 7.3 7.3 7.3 7.3 7.3 7.3
Waikino 110 kV 2.0 2.0 2.0 2.0 2.0 2.0 2.0 2.0 2.0 2.0 2.0
Waipapa 220 kV 11.6 11.6 11.6 11.6 11.6 11.6 11.6 11.6 11.6 11.6 11.6
Whakamaru 220 kV 27.0 27.0 27.0 27.0 27.0 27.0 27.0 27.0 27.0 27.0 27.0
BAY OF PLENTY
Aniwhenua 110 kV 3.5 3.5 3.5 3.5 3.5 3.5 3.5 3.5 3.5 3.5 3.5
Edgecumbe 33 kV 6.2 6.2 6.2 6.2 6.2 6.2 6.2 6.2 6.2 6.2 6.2
Edgecumbe 110 kV 7.8 7.8 7.8 7.8 7.8 7.8 7.8 7.8 7.8 7.8 7.8
Edgecumbe 220 kV 7.9 7.9 7.9 7.9 7.9 7.9 7.9 7.9 7.9 7.9 7.9
Kaitimako 33 kV 0.6 0.6 0.6 0.6 0.6 0.6 0.6 0.6 0.6 0.6 0.6
Kaitimako 110 kV 10.7 10.7 10.7 10.7 10.7 10.7 10.7 10.7 10.7 10.7 10.7
Kaitimako 220 kV 7.0 7.0 7.0 7.0 7.0 7.0 7.0 7.0 7.0 7.0 7.0
Kawerau 11 kV (T1/T2) 20.8 20.8 20.8 20.8 20.8 20.8 20.8 20.8 20.8 20.8 20.8
Kawerau 11 kV (T6) 0.9 0.9 0.9 0.9 0.9 0.9 0.9 0.9 0.9 0.9 0.9
Kawerau 11 kV (T7) 0.9 0.9 0.9 0.9 0.9 0.9 0.9 0.9 0.9 0.9 0.9
Kawerau 11 kV (T8) 1.7 1.7 1.7 1.7 1.7 1.7 1.7 1.7 1.7 1.7 1.7
Kawerau 11 kV (T9) 0.5 0.5 0.5 0.5 0.5 0.5 0.5 0.5 0.5 0.5 0.5
Kawerau 11 kV (T11/T14) 5.7 5.7 5.7 5.7 5.7 5.7 5.7 5.7 5.7 5.7 5.7
Kawerau 110 kV 14.9 14.9 14.9 14.9 14.9 14.9 14.9 14.9 14.9 14.9 14.9
Kawerau 220 kV 8.6 8.6 8.6 8.6 8.6 8.6 8.6 8.6 8.6 8.6 8.6
Matahina 110 kV 10.1 10.1 10.1 10.1 10.1 10.1 10.1 10.1 10.1 10.1 10.1
Mt Maunganui 33 kV 1.2 1.2 1.2 1.2 1.2 1.2 1.2 1.2 1.2 1.2 1.2
Mt Maunganui 110 kV 7.1 7.1 7.1 7.1 7.1 7.1 7.1 7.1 7.1 7.1 7.1
Okere 110 kV 5.8 5.8 5.8 5.8 5.8 5.8 5.8 5.8 5.8 5.8 5.8
Owhata 11 kV 10.5 10.5 10.5 10.5 10.5 10.5 10.5 10.5 10.5 10.5 10.5
Owhata 110 kV 4.0 4.0 4.0 4.0 4.0 4.0 4.0 4.0 4.0 4.0 4.0
Rotorua 11 kV 2.2 2.2 2.2 2.2 2.2 2.2 2.2 2.2 2.2 2.2 2.2

Ten year forecast fault Levels
© Transpower New Zealand Limited 2016.All rights reserved. 19
Rotorua 33 kV 2.0 2.0 2.0 2.0 2.0 2.0 2.0 2.0 2.0 2.0 2.0
Rotorua 110 kV (Tarukenga 1)
5.3 5.3 5.3 5.3 5.3 5.3 5.3 5.3 5.3 5.3 5.3
Rotorua 110 kV (Tarukenga 2)
5.6 5.6 5.6 5.6 5.6 5.6 5.6 5.6 5.6 5.6 5.6
Tarukenga 11 kV 10.8 10.9 10.9 10.9 10.9 10.9 10.9 10.9 10.9 10.9 10.9
Tarukenga 110 kV 13.0 13.0 13.0 13.0 13.0 13.0 13.0 13.0 13.0 13.0 13.0
Tarukenga 220 kV 10.2 10.2 10.2 10.2 10.2 10.2 10.2 10.2 10.2 10.2 10.2
Tauranga 11 kV 15.1 15.1 15.1 15.1 15.1 15.1 15.1 15.1 15.1 15.1 15.1
Tauranga 33 kV 1.5 1.5 1.5 1.5 1.5 1.5 1.5 1.5 1.5 1.5 1.5
Tauranga 110 kV 9.4 9.4 9.4 9.5 9.5 9.5 9.5 9.5 9.5 9.5 9.5
Te Kaha 11 kV 1.4 1.4 1.4 1.4 1.4 1.4 1.4 1.4 1.4 1.4 1.4
Te Kaha 50 kV 0.3 0.3 0.3 0.3 0.3 0.3 0.3 0.3 0.3 0.3 0.3
Te Matai 33 kV 1.2 1.2 1.2 1.2 1.2 1.2 1.2 1.2 1.2 1.2 1.2
Te Matai 110 kV 5.1 5.1 5.1 5.1 5.1 5.1 5.1 5.1 5.1 5.1 5.1
Waiotahi 11 kV 9.5 9.5 9.5 9.5 9.5 9.5 9.5 9.5 9.5 9.5 9.5
Waiotahi 50 kV 0.5 0.5 0.5 0.5 0.5 0.5 0.5 0.5 0.5 0.5 0.5
Waiotahi 110 kV 1.9 1.9 1.9 1.9 1.9 1.9 1.9 1.9 1.9 1.9 1.9
CENTRAL NORTH ISLAND
Aratiatia 220 kV 19.7 19.7 19.7 19.7 19.7 19.7 19.7 19.7 19.7 19.7 19.7
Bunnythorpe 33 kV 2.0 2.0 2.0 2.0 2.0 2.0 2.0 2.0 2.0 2.0 2.0
Bunnythorpe 110 kV 13.1 13.3 13.6 13.6 13.7 13.7 13.7 13.7 13.7 13.7 13.7
Bunnythorpe 220 kV 12.4 12.4 12.0 12.1 12.3 12.3 12.3 12.3 12.3 12.3 12.3
Dannevirke 11 kV 18.2 18.2 18.1 18.1 18.1 18.1 18.1 18.1 18.1 18.1 18.1
Dannevirke 110 kV (T1) 2.3 2.3 2.3 2.3 2.3 2.3 2.3 2.3 2.3 2.3 2.3
Dannevirke 110 kV (T2) 2.3 2.3 2.3 2.3 2.3 2.3 2.3 2.3 2.3 2.3 2.3
Linton 33 kV 1.3 1.3 1.3 1.3 1.3 1.3 1.3 1.3 1.3 1.3 1.3
Linton 220 kV (T2) 7.5 7.5 7.4 7.4 7.4 7.4 7.4 7.4 7.4 7.4 7.4
Linton 220 kV (T3) 6.3 6.3 6.3 6.3 6.3 6.3 6.3 6.3 6.3 6.3 6.3
Mangahao 33 kV 11.3 11.3 11.3 11.3 11.3 11.3 11.3 11.3 11.3 11.3 11.3
Mangahao 110 kV (T3) 2.0 2.0 2.0 2.0 2.0 2.0 2.0 2.0 2.0 2.0 2.0
Mangahao 110 kV (T4) 2.0 2.0 2.0 2.0 2.0 2.0 2.0 2.0 2.0 2.0 2.0
Mangamaire 33 kV 5.1 5.1 5.1 5.1 5.1 5.1 5.1 5.1 5.1 5.1 5.1
Mangamaire 110 kV 2.9 2.9 2.9 2.9 2.9 2.9 2.9 2.9 2.9 2.9 2.9
Marton 33 kV 7.3 7.3 7.3 7.3 7.3 7.3 7.3 7.3 7.3 7.3 7.3
Marton 110 kV (T1) 3.4 3.4 3.4 3.4 3.4 3.4 3.4 3.4 3.4 3.4 3.4
Marton 110 kV (T2) 3.4 3.4 3.4 3.4 3.4 3.4 3.4 3.4 3.4 3.4 3.4
Mataroa 33 kV 4.1 4.2 4.1 4.1 4.1 4.1 4.1 4.1 4.1 4.1 4.1
Mataroa 110 kV 1.6 1.6 1.6 1.6 1.6 1.6 1.6 1.6 1.6 1.6 1.6
National Park 33 kV 2.3 2.3 2.3 2.3 2.3 2.3 2.3 2.3 2.3 2.3 2.3
National Park 110 kV 1.2 1.2 1.2 1.2 1.2 1.2 1.2 1.2 1.2 1.2 1.2
Nga Awa Purua 220 kV 18.8 18.8 18.8 18.8 18.8 18.8 18.8 18.8 18.8 18.8 18.8
Ngatamariki 220 kV 12.9 12.9 12.9 12.9 12.9 12.9 12.9 12.9 12.9 12.9 12.9
Ohaaki 220 kV 12.8 12.8 12.8 12.8 12.8 12.8 12.8 12.8 12.8 12.8 12.8
Ohakune 11 kV 8.7 8.7 8.7 8.7 8.7 8.7 8.7 8.7 8.7 8.7 8.7

Ten year forecast fault Levels
© Transpower New Zealand Limited 2016.All rights reserved. 20
Ohakune 110 kV 1.4 1.4 1.4 1.4 1.4 1.4 1.4 1.4 1.4 1.4 1.4
Ongarue 33 kV 2.9 2.9 2.9 2.9 2.9 2.9 2.9 2.9 2.9 2.9 2.9
Ongarue 110 kV 1.7 1.7 1.7 1.7 1.7 1.7 1.7 1.7 1.7 1.7 1.7
Poihipi 220 kV 17.5 17.5 17.5 17.6 17.6 17.6 17.6 17.6 17.6 17.6 17.6
Rangipo 220 kV 6.7 6.7 6.7 6.7 6.7 6.7 6.7 6.7 6.7 6.7 6.7
Tangiwai 11 kV 21.2 21.2 21.2 21.2 21.2 21.2 21.2 21.2 21.2 21.2 21.2
Tangiwai 220 kV 3.6 3.6 3.6 3.6 3.6 3.6 3.6 3.6 3.6 3.6 3.6
Tararua Central 220 kV 7.8 7.8 7.7 7.7 7.8 7.8 7.8 7.8 7.8 7.8 7.8
Te Mihi 220 kV 23.9 23.9 23.9 23.9 23.9 23.9 23.9 23.9 23.9 23.9 23.9
Tokaanu 33 kV 3.9 3.9 3.9 3.9 3.9 3.9 3.9 3.9 3.9 3.9 3.9
Tokaanu 220 kV 11.9 11.9 11.9 12.0 12.0 12.0 12.0 12.0 12.0 12.0 12.0
Waipawa 11 kV 4.7 4.7 4.7 4.7 4.7 4.7 4.7 4.7 4.7 4.7 4.7
Waipawa 33 kV 5.9 5.9 5.8 5.8 5.8 5.8 5.8 5.8 5.8 5.8 5.8
Waipawa 110 kV (T1) 1.1 1.1 1.1 1.1 1.1 1.1 1.1 1.1 1.1 1.1 1.1
Waipawa 110 kV (T2) 1.1 1.1 1.1 1.1 1.1 1.1 1.1 1.1 1.1 1.1 1.1
Wairakei 33 kV 22.6 22.6 22.6 22.6 22.6 22.6 22.6 22.6 22.6 22.6 22.6
Wairakei 220 kV 28.0 28.0 28.0 28.0 28.0 28.0 28.0 28.0 28.0 28.0 28.0
Woodville 11 kV 1.3 1.3 1.3 1.3 1.3 1.3 1.3 1.3 1.3 1.3 1.3
Woodville 110 kV 4.8 4.8 4.8 4.8 4.9 4.9 4.9 4.9 4.9 4.9 4.9
TARANAKI
Brunswick 33 kV 9.3 9.3 9.3 9.4 9.4 9.4 9.4 9.4 9.4 9.4 9.4
Brunswick 220 kV 6.9 6.9 6.9 6.9 6.9 6.9 6.9 6.9 6.9 6.9 6.9
Carrington St 33 kV 1.2 1.2 1.2 1.2 1.2 1.2 1.2 1.2 1.2 1.2 1.2
Carrington St 110 kV 11.0 11.0 12.2 13.0 13.0 13.0 13.0 13.0 13.0 13.0 13.0
Hawera 33 kV (T1/T2) 9.0 9.0 9.0 9.1 9.1 9.1 9.1 9.1 9.1 9.1 9.1
Hawera 33 kV (T3) 5.0 5.0 5.0 5.0 5.0 5.0 5.0 5.0 5.0 5.0 5.0
Hawera 110 kV 8.1 8.1 8.1 8.2 8.2 8.2 8.2 8.2 8.2 8.2 8.2
Huirangi 33 kV 0.5 0.5 0.5 0.5 0.5 0.5 0.5 0.5 0.5 0.5 0.5
Huirangi 110 kV 8.1 8.1 8.4 8.8 8.8 8.8 8.8 8.8 8.8 8.8 8.8
Junction Road Tee
110 kV - - 9.2 9.5 9.5 9.5 9.5 9.5 9.5 9.5 9.5
Kapuni Tee 110 kV 5.1 5.1 5.1 5.2 5.2 5.2 5.2 5.2 5.2 5.2 5.2
McKee Tee 110 kV 8.0 8.0 8.1 8.3 8.3 8.3 8.3 8.3 8.3 8.3 8.3
Motunui 11 kV (T3) 0.5 0.5 0.5 0.5 0.5 0.5 0.5 0.5 0.5 0.5 0.5
Motunui 11 kV (T4) 0.5 0.5 0.5 0.5 0.5 0.5 0.5 0.5 0.5 0.5 0.5
Motunui 110 kV 9.0 9.0 9.3 9.6 9.6 9.6 9.6 9.6 9.6 9.6 9.6
New Plymouth 33 kV 11.3 11.3 11.3 11.5 11.5 11.5 11.5 11.5 11.5 11.5 11.5
New Plymouth 110 kV 13.7 13.7 14.0 15.1 15.1 15.1 15.1 15.1 15.1 15.1 15.1
New Plymouth 220 kV 8.1 8.1 8.1 8.5 8.5 8.5 8.5 8.5 8.5 8.5 8.5
Opunake 33 kV 4.8 4.8 4.8 4.8 4.8 4.8 4.8 4.8 4.8 4.8 4.8
Opunake 110 kV (T4) 2.4 2.4 2.4 2.4 2.4 2.4 2.4 2.4 2.4 2.4 2.4
Opunake 110 kV (T5) 2.1 2.1 2.1 2.1 2.1 2.1 2.1 2.1 2.1 2.1 2.1
Stratford 33 kV 1.1 1.1 1.1 1.1 1.1 1.1 1.1 1.1 1.1 1.1 1.1
Stratford 110 kV 13.1 13.1 13.1 13.6 13.6 13.6 13.6 13.6 13.6 13.6 13.6

Ten year forecast fault Levels
© Transpower New Zealand Limited 2016.All rights reserved. 21
Stratford 220 kV 14.1 14.1 14.1 14.7 14.7 14.7 14.7 14.7 14.7 14.7 14.7
Taumarunui 220 kV 2.8 2.8 2.8 2.8 2.8 2.8 2.8 2.8 2.8 2.8 2.8
Wanganui 33 kV 1.1 1.1 1.1 1.1 1.1 1.1 1.1 1.1 1.1 1.1 1.1
Wanganui 110 kV 3.0 3.0 3.0 3.0 3.0 3.0 3.0 3.0 3.0 3.0 3.0
Waverley 11 kV 5.3 5.3 5.3 5.3 5.3 5.3 5.3 5.3 5.3 5.3 5.3
Waverley 110 kV 3.1 3.1 3.1 3.1 3.1 3.1 3.1 3.1 3.1 3.1 3.1
HAWKE’S BAY
Fernhill 33 kV 11.0 11.0 11.0 11.0 11.0 11.0 11.0 11.0 11.0 11.0 11.0
Fernhill 110 kV 7.2 7.2 7.2 7.2 7.2 7.2 7.2 7.2 7.2 7.2 7.2
Redclyffe 33 kV 1.0 1.0 1.0 1.0 1.0 1.0 1.0 1.0 1.0 1.0 1.0
Redclyffe 110 kV 9.5 9.5 9.5 9.5 9.5 9.5 9.5 9.5 9.5 9.5 9.5
Redclyffe 220 kV 7.2 7.2 7.2 7.2 7.2 7.2 7.2 7.2 7.2 7.2 7.2
Tuai 110 kV 8.2 8.2 8.2 8.2 8.2 8.2 8.2 8.2 8.2 8.2 8.2
Whakatu 33 kV 1.2 1.2 1.2 1.2 1.2 1.2 1.2 1.2 1.2 1.2 1.2
Whakatu 220 kV (T3) 5.6 5.6 5.6 5.6 5.6 5.6 5.6 5.6 5.6 5.6 5.6
Whakatu 220 kV (T4) 5.6 5.6 5.6 5.6 5.6 5.6 5.6 5.6 5.6 5.6 5.6
Whirinaki 11 kV (T1) 1.5 1.5 1.5 1.5 1.5 1.5 1.5 1.5 1.5 1.5 1.5
Whirinaki 11 kV (T2) 2.9 2.9 2.9 2.9 2.9 2.9 2.9 2.9 2.9 2.9 2.9
Whirinaki 11 kV (T3) 2.9 2.9 2.9 2.9 2.9 2.9 2.9 2.9 2.9 2.9 2.9
Whirinaki 220 kV 9.3 9.3 9.3 9.3 9.3 9.3 9.3 9.3 9.3 9.3 9.3
WELLINGTON
Central Park 11 kV (T11) 5.7 5.7 5.7 5.7 5.7 5.7 5.7 5.7 5.7 5.7 5.7
Central Park 11 kV (T12) 5.7 5.7 5.7 5.7 5.7 5.7 5.7 5.7 5.7 5.7 5.7
Central Park 33 kV 10.6 10.6 10.6 10.6 10.6 10.6 10.6 10.6 10.6 10.6 10.6
Central Park 110 kV (T3) 5.9 5.9 5.9 6.0 6.0 6.0 6.0 6.0 6.0 6.0 6.0
Central Park 110 kV (T4) 5.9 5.9 5.9 6.0 6.0 6.0 6.0 6.0 6.0 6.0 6.0
Central Park 110 kV (T5) 9.3 9.3 9.3 9.3 9.3 9.3 9.3 9.3 9.3 9.3 9.3
Gracefield 33 kV 14.8 14.8 14.8 14.8 14.8 14.8 14.8 14.8 14.8 14.8 14.8
Gracefield 110 kV (T5) 6.0 6.0 6.0 6.0 6.0 6.0 6.0 6.0 6.0 6.0 6.0
Gracefield 110 kV (T6) 6.0 6.0 6.0 6.0 6.0 6.0 6.0 6.0 6.0 6.0 6.0
Greytown 33 kV 4.0 4.0 4.0 4.0 4.0 4.0 4.0 4.0 4.0 4.0 4.0
Greytown 110 kV (T2) 3.3 3.3 3.3 3.3 3.3 3.3 3.3 3.3 3.3 3.3 3.3
Greytown 110 kV (T3) 3.3 3.3 3.3 3.3 3.3 3.3 3.3 3.3 3.3 3.3 3.3
Haywards 11 kV 13.0 13.0 13.0 13.0 13.0 13.0 13.0 13.0 13.0 13.0 13.0
Haywards 33 kV 3.9 3.9 3.9 3.9 3.9 3.9 3.9 3.9 3.9 3.9 3.9
Haywards 110 kV 20.7 20.7 20.7 20.7 20.8 20.8 20.8 20.8 20.8 20.8 20.8
Haywards 220 kV 13.0 13.0 13.0 13.0 13.1 13.1 13.1 13.1 13.1 13.1 13.1
Kaiwharawhara 11 kV (T1) 1.3 1.3 1.3 1.3 1.3 1.3 1.3 1.3 1.3 1.3 1.3
Kaiwharawhara 11 kV (T3) 1.3 1.3 1.3 1.3 1.3 1.3 1.3 1.3 1.3 1.3 1.3
Kaiwharawhara 110 kV (T1) 10.2 10.2 10.2 10.2 10.2 10.2 10.2 10.2 10.2 10.2 10.2
Kaiwharawhara 110 kV (T3) 10.2 10.2 10.2 10.2 10.2 10.2 10.2 10.2 10.2 10.2 10.2

Ten year forecast fault Levels
© Transpower New Zealand Limited 2016.All rights reserved. 22
Masterton 33 kV 1.1 1.1 1.1 1.1 1.1 1.1 1.1 1.1 1.1 1.1 1.1
Masterton 110 kV 3.0 3.0 3.0 3.0 3.0 3.0 3.0 3.0 3.0 3.0 3.0
Melling 11 kV 14.1 14.1 14.1 14.1 14.1 14.1 14.1 14.1 14.1 14.1 14.1
Melling 33 kV 10.1 10.1 10.1 10.1 10.1 10.1 10.1 10.1 10.1 10.1 10.1
Melling 110 kV (T1/T3) 7.1 7.1 7.1 7.2 7.2 7.2 7.2 7.2 7.2 7.2 7.2
Melling 110 kV (T2/T4) 6.9 6.9 6.9 6.9 7.0 7.0 7.0 7.0 7.0 7.0 7.0
Paraparaumu 33 kV 1.1 1.1 1.1 1.1 1.1 1.1 1.1 1.1 1.1 1.1 1.1
Paraparaumu 220 kV (T1) 6.9 6.9 6.9 6.9 6.3 6.3 6.3 6.3 6.3 6.3 6.3
Paraparaumu 220 kV (T2) 6.9 6.9 6.9 6.9 6.3 6.3 6.3 6.3 6.3 6.3 6.3
Pauatahanui 33 kV 6.6 6.6 6.6 6.6 6.6 6.6 6.6 6.6 6.6 6.6 6.6
Pauatahanui 110 kV (T1) 6.8 6.8 6.8 6.8 6.8 6.8 6.8 6.8 6.8 6.8 6.8
Pauatahanui 110 kV (T2) 6.8 6.8 6.8 6.8 6.8 6.8 6.8 6.8 6.8 6.8 6.8
Takapu Road 33 kV 1.1 1.1 1.1 1.1 1.1 1.1 1.1 1.1 1.1 1.1 1.1
Takapu Road 110 kV 13.0 13.0 13.0 13.0 13.0 13.0 13.0 13.0 13.0 13.0 13.0
Upper Hutt 33 kV 10.2 10.2 10.2 10.2 10.2 10.2 10.2 10.2 10.2 10.2 10.2
Upper Hutt 110 kV 10.8 10.8 10.8 10.8 10.8 10.8 10.8 10.8 10.8 10.8 10.8
West Wind 110 kV (Circuit–2) 6.9 6.9 6.9 6.9 6.9 6.9 6.9 6.9 6.9 6.9 6.9
West Wind 110 kV (Circuit–3) 6.9 6.9 6.9 6.9 6.9 6.9 6.9 6.9 6.9 6.9 6.9
Wilton 33 kV 1.1 1.1 1.1 1.1 1.1 1.1 1.1 1.1 1.1 1.1 1.1
Wilton 110 kV 13.6 13.6 13.6 13.6 13.6 13.6 13.6 13.6 13.6 13.6 13.6
Wilton 220 kV 7.7 7.7 7.7 7.7 7.7 7.7 7.7 7.7 7.7 7.7 7.7
NELSON-MARLBOROUGH
Argyle 110 kV 2.6 2.6 2.6 2.6 2.6 2.6 2.6 2.6 2.6 2.6 2.6
Blenheim 33 kV 1.7 1.7 1.7 1.7 1.7 1.7 1.7 1.7 1.7 1.7 1.7
Blenheim 110 kV 2.4 2.4 2.4 2.4 2.4 2.4 2.4 2.4 2.4 2.4 2.4
Stoke 33 kV 1.1 1.1 1.1 1.1 1.1 1.1 1.1 1.1 1.1 1.1 1.1
Stoke 66 kV 5.2 5.2 5.2 5.2 5.3 5.3 5.3 5.3 5.3 5.3 5.3
Stoke 110 kV 5.1 5.1 5.1 5.1 5.1 5.1 5.1 5.1 5.1 5.1 5.1
Stoke 220 kV 3.4 3.4 3.4 3.4 3.4 3.4 3.4 3.4 3.4 3.4 3.4
WEST COAST
Arthurs Pass 11 kV 2.4 2.4 2.4 2.4 2.4 2.4 2.4 2.4 2.4 2.4 2.4
Arthurs Pass 66 kV 1.3 1.3 1.3 1.3 1.3 1.3 1.3 1.3 1.3 1.3 1.3
Atarau 110 kV 1.5 1.5 1.5 1.5 1.5 1.5 1.5 1.5 1.5 1.5 1.5
Castle Hill 11 kV - - - - - - - - - - -
Castle Hill 66 kV 1.7 1.7 1.7 1.7 1.7 1.7 1.7 1.7 1.7 1.7 1.7
Dobson 33 kV 3.6 3.6 3.6 3.6 3.6 3.6 3.6 3.6 3.6 3.6 3.6
Dobson 66 kV 3.4 3.4 3.4 3.4 3.4 3.4 3.4 3.4 3.4 3.4 3.4
Dobson T11 (110 kV) 1.8 1.8 1.8 1.8 1.8 1.8 1.8 1.8 1.8 1.8 1.8
Dobson T12 (110 kV) 1.8 1.8 1.8 1.8 1.8 1.8 1.8 1.8 1.8 1.8 1.8
Greymouth 66 kV 2.6 2.6 2.6 2.6 2.6 2.6 2.6 2.6 2.6 2.6 2.6
Hokitika 66 kV 1.2 1.2 1.2 1.2 1.2 1.2 1.2 1.2 1.2 1.2 1.2

Ten year forecast fault Levels
© Transpower New Zealand Limited 2016.All rights reserved. 23
Inangahua 110 kV 2.1 2.1 2.1 2.1 2.1 2.1 2.1 2.1 2.1 2.1 2.1
Kikiwa 11 kV - - - - - - - - - - -
Kikiwa 110 kV 5.3 5.3 5.3 5.3 5.3 5.3 5.3 5.3 5.3 5.3 5.3
Kikiwa 220 kV 3.8 3.8 3.8 3.8 3.8 3.8 3.8 3.8 3.8 3.8 3.8
Kumara 66 kV 2.3 2.3 2.3 2.3 2.3 2.3 2.3 2.3 2.3 2.3 2.3
Murchison 11 kV 2.7 2.7 5.2 5.2 5.2 5.2 5.2 5.2 5.2 5.2 5.2
Murchison 110 kV 1.9 1.9 1.9 1.9 1.9 1.9 1.9 1.9 1.9 1.9 1.9
Orowaiti 110 kV (Circuit–1) 1.2 1.2 1.2 1.2 1.2 1.2 1.2 1.2 1.2 1.2 1.2
Orowaiti 110 kV (Circuit–2) 1.2 1.2 1.2 1.2 1.2 1.2 1.2 1.2 1.2 1.2 1.2
Otira 11 kV 1.7 1.7 1.7 1.7 1.7 1.7 1.7 1.7 1.7 1.7 1.7
Otira 66 kV 1.4 1.4 1.4 1.4 1.4 1.4 1.4 1.4 1.4 1.4 1.4
Reefton 110 kV (Circuit–1) 1.6 1.6 1.6 1.6 1.6 1.6 1.6 1.6 1.6 1.6 1.6
Reefton 110 kV (Circuit–2) 1.5 1.5 1.5 1.5 1.5 1.5 1.5 1.5 1.5 1.5 1.5
Waimangaroa 110 kV (Circuit–1) 1.4 1.4 1.4 1.4 1.4 1.4 1.4 1.4 1.4 1.4 1.4
Waimangaroa 110 kV (Circuit–2) 1.4 1.4 1.4 1.4 1.4 1.4 1.4 1.4 1.4 1.4 1.4
Westport 11 kV 10.4 10.4 10.4 10.4 10.4 10.4 10.4 10.4 10.4 10.4 10.4
Westport 110 kV (T1) 1.1 1.1 1.1 1.1 1.1 1.1 1.1 1.1 1.1 1.1 1.1
Westport 110 kV (T2) 1.1 1.1 1.1 1.1 1.1 1.1 1.1 1.1 1.1 1.1 1.1
CANTERBURY
Ashburton 33 kV 1.1 1.1 1.1 1.1 1.1 1.1 1.1 1.1 1.1 1.1 1.1
Ashburton 66 kV 0.9 0.9 0.9 0.9 0.9 0.9 0.9 0.9 0.9 0.9 0.9
Ashburton 220 kV 8.1 8.1 8.1 8.1 8.1 8.1 8.1 8.1 8.1 8.1 8.1
Ashley 11 kV (T5) 8.5 8.5 8.5 8.5 8.5 8.5 8.5 8.5 8.5 8.5 8.5
Ashley 11 kV (T3) 0.5 0.5 0.5 0.5 0.5 0.5 0.5 0.5 0.5 0.5 0.5
Ashley 66 kV 3.1 3.1 3.1 3.1 3.1 3.1 3.1 3.1 3.1 3.1 3.1
Bromley 66 kV 15.4 15.4 13.0 13.0 13.0 13.0 13.0 13.0 13.0 13.0 13.0
Bromley 220 kV 6.8 6.8 6.1 6.1 6.1 6.1 6.1 6.1 6.1 6.1 6.1
Coleridge 11 kV 1.7 1.7 1.7 1.7 1.7 1.7 1.7 1.7 1.7 1.7 1.7
Coleridge 66 kV 4.7 4.7 4.7 4.7 4.7 4.7 4.7 4.7 4.7 4.7 4.7
Culverden 33 kV 1.1 1.1 1.1 1.1 1.1 1.1 1.1 1.1 1.1 1.1 1.1
Culverden 66 kV 0.5 0.5 0.5 0.5 0.5 0.5 0.5 0.5 0.5 0.5 0.5
Culverden 220 kV (T22) 2.7 2.7 2.7 2.7 2.7 2.7 2.7 2.7 2.7 2.7 2.7
Culverden 220 kV (T23) 2.7 2.7 2.7 2.7 2.7 2.7 2.7 2.7 2.7 2.7 2.7
Hororata 33 kV 3.1 3.1 3.1 3.1 3.1 3.1 3.1 3.1 3.1 3.1 3.1
Hororata 66 kV 2.6 2.6 2.6 2.6 2.6 2.6 2.6 2.6 2.6 2.6 2.6
Islington 33 kV 0.6 0.6 0.6 0.6 0.6 0.6 0.6 0.6 0.6 0.6 0.6
Islington 66 kV 20.6 20.6 20.6 20.6 20.6 20.6 20.6 20.6 20.6 20.6 20.6
Islington 220 kV 8.2 8.2 8.2 8.2 8.2 8.2 8.2 8.2 8.2 8.2 8.2
Kaiapoi 11 kV 1.2 1.2 1.2 1.2 1.2 1.2 1.2 1.2 1.2 1.2 1.2
Kaiapoi 66 kV 3.1 3.1 3.1 3.1 3.1 3.1 3.1 3.1 3.1 3.1 3.1
Kimberley 66 kV (T1) 2.5 2.5 2.5 2.5 2.5 2.5 2.5 2.5 2.5 2.5 2.5
Kimberley 66 kV (T2) 2.5 2.5 2.5 2.5 2.5 2.5 2.5 2.5 2.5 2.5 2.5
Southbrook 33 kV 0.5 0.5 0.5 0.5 0.5 0.5 0.5 0.5 0.5 0.5 0.5
Southbrook 66 kV 4.2 4.2 4.2 4.2 4.2 4.2 4.2 4.2 4.2 4.2 4.2

Ten year forecast fault Levels
© Transpower New Zealand Limited 2016.All rights reserved. 24
Waipara 33 kV 1.9 1.9 1.9 1.9 1.9 1.9 1.9 1.9 1.9 1.9 1.9
Waipara 66 kV 7.5 7.5 7.5 7.5 7.5 7.5 7.5 7.5 7.5 7.5 7.5
Waipara 220 kV (T12) 3.4 3.4 3.4 3.4 3.4 3.4 3.4 3.4 3.4 3.4 3.4
Waipara 220 kV (T13) 3.4 3.4 3.4 3.4 3.4 3.4 3.4 3.4 3.4 3.4 3.4
SOUTH CANTERBURY
Albury 11 kV 3.7 3.7 0.5 0.5 0.5 0.5 0.5 0.5 0.5 0.5 0.5
Albury 110 kV 2.4 2.4 2.4 2.4 2.6 2.6 2.6 2.6 2.6 2.6 2.6
Aviemore 220 kV 17.5 17.5 17.5 17.5 17.5 17.5 17.5 17.5 17.5 17.5 17.5
Bells Pond 110 kV 2.6 2.6 2.6 2.6 2.6 2.6 2.6 2.6 2.6 2.6 2.6
Benmore 220 kV 24.4 24.4 24.4 24.4 24.4 24.4 24.4 24.4 24.4 24.4 24.4
Black Point 110 kV 2.2 2.2 2.2 2.2 2.2 2.2 2.2 2.2 2.2 2.2 2.2
Livingstone 220 kV 7.1 7.1 7.1 7.1 7.1 7.1 7.1 7.1 7.1 7.1 7.1
Oamaru 33 kV 7.3 7.3 7.3 7.3 7.3 7.3 7.3 7.3 7.3 7.3 7.3
Oamaru 110 kV (T1) 1.1 1.1 1.1 1.1 1.2 1.2 1.2 1.2 1.2 1.2 1.2
Oamaru 110 kV (T2) 1.5 1.5 1.5 1.5 1.5 1.5 1.5 1.5 1.5 1.5 1.5
Ohau A 220 kV 18.1 18.1 18.1 18.1 18.2 18.2 18.2 18.2 18.2 18.2 18.2
Ohau B 220 kV 20.8 20.8 20.8 20.8 20.8 20.8 20.8 20.8 20.8 20.8 20.8
Ohau C 220 kV 18.2 18.2 18.2 18.2 18.2 18.2 18.2 18.2 18.2 18.2 18.2
Studholme 11 kV 10.1 10.1 10.1 10.1 10.2 10.2 10.2 10.2 10.2 10.2 10.2
Studholme 110 kV 2.5 2.5 2.5 2.5 2.6 2.6 2.6 2.6 2.6 2.6 2.6
Tekapo A 11 kV - - - - - - - - - - -
Tekapo A 33 kV 1.8 1.8 1.8 1.8 1.8 1.8 1.8 1.8 1.8 1.8 1.8
Tekapo A 110 kV 2.1 2.1 2.1 2.1 2.2 2.2 2.2 2.2 2.2 2.2 2.2
Tekapo B 220 kV 11.6 11.6 11.6 11.6 11.6 11.6 11.6 11.6 11.6 11.6 11.6
Temuka 33 kV 0.8 0.8 0.8 0.8 0.8 0.8 0.8 0.8 0.8 0.8 0.8
Temuka 110 kV (T1) 3.0 3.0 3.0 3.0 3.4 3.4 3.4 3.4 3.4 3.4 3.4
Temuka 110 kV (T2) 3.0 3.0 3.0 3.0 3.4 3.4 3.4 3.4 3.4 3.4 3.4
Timaru 11 kV 1.1 1.1 1.1 1.1 1.1 1.1 1.1 1.1 1.1 1.1 1.1
Timaru 110 kV 6.9 6.9 6.9 6.9 9.7 9.7 9.7 9.7 9.7 9.7 9.7
Timaru 220 kV (T5) 4.1 4.1 4.1 4.1 6.7 6.7 6.7 6.7 6.7 6.7 6.7
Timaru 220 kV (T8) 4.1 4.1 4.1 4.1 6.7 6.7 6.7 6.7 6.7 6.7 6.7
Twizel 33 kV (T18) 4.7 4.7 4.7 4.7 4.7 4.7 4.7 4.7 4.7 4.7 4.7
Twizel 33 kV (T19) 4.7 4.7 4.7 4.7 4.7 4.7 4.7 4.7 4.7 4.7 4.7
Twizel 220 kV 22.4 22.4 22.4 22.4 22.4 22.4 22.4 22.4 22.4 22.4 22.4
Waitaki 11 kV (T28) 0.0 0.0 0.0 0.0 0.0 0.0 0.0 0.0 0.0 0.0 0.0
Waitaki 33 kV (T28) 0.8 0.8 0.8 0.8 0.8 0.8 0.8 0.8 0.8 0.8 0.8
Waitaki 220 kV 14.5 14.5 14.5 14.5 14.5 14.5 14.5 14.5 14.5 14.5 14.5
OTAGO-SOUTHLAND
Balclutha 33 kV 1.0 1.0 1.0 1.0 1.0 1.0 1.0 1.0 1.0 1.0 1.0
Balclutha 110 kV 1.6 1.5 1.5 1.4 1.4 1.4 1.4 1.4 1.4 1.4 1.4
Berwick 110 kV 2.9 2.8 2.8 2.6 2.6 2.6 2.6 2.6 2.6 2.6 2.6
Brydone 11 kV 13.8 14.9 14.9 14.9 14.9 14.9 14.9 14.9 14.9 14.9 14.9

Ten year forecast fault Levels
© Transpower New Zealand Limited 2016.All rights reserved. 25
Brydone 110 kV 2.5 4.2 4.2 4.2 4.2 4.2 4.2 4.2 4.2 4.2 4.2
Clyde 33 kV 1.1 1.1 1.1 1.1 1.1 1.1 1.1 1.1 1.1 1.1 1.1
Clyde 220 kV 16.0 16.0 16.0 16.0 16.0 16.0 16.0 16.0 16.0 16.0 16.0
Cromwell 33 kV 1.0 1.0 1.0 1.0 1.0 1.0 1.0 1.0 1.0 1.0 1.0
Cromwell 110 kV (T5A/B) 5.2 5.2 5.2 5.2 5.2 5.2 5.2 5.2 5.2 5.2 5.2
Cromwell 110 kV (T8) 4.7 4.7 4.7 4.7 4.7 4.7 4.7 4.7 4.7 4.7 4.7
Cromwell 220 kV (T5A/B) 8.8 8.8 8.8 8.8 8.8 8.8 8.8 8.8 8.8 8.8 8.8
Cromwell 220 kV (T8) 9.3 9.3 9.3 9.3 9.3 9.3 9.3 9.3 9.3 9.3 9.3
Edendale 33 kV 7.1 7.6 7.6 7.6 7.6 7.6 7.6 7.6 7.6 7.6 7.6
Edendale 110 kV 2.7 3.7 3.7 3.7 3.7 3.7 3.7 3.7 3.7 3.7 3.7
Frankton 33 kV 1.2 1.2 1.2 1.2 1.2 1.2 1.2 1.2 1.2 1.2 1.2
Frankton 110 kV (T2) 1.8 1.8 1.8 1.8 1.8 1.8 1.8 1.8 1.8 1.8 1.8
Frankton 110 kV (T4) 1.7 1.7 1.7 1.7 1.7 1.7 1.7 1.7 1.7 1.7 1.7
Gore 33 kV 7.3 8.8 8.8 8.8 8.8 8.8 8.8 8.8 8.8 8.8 8.8
Gore 110 kV (T2/T3) 2.6 8.2 8.2 8.2 8.2 8.2 8.2 8.2 8.2 8.2 8.2
Gore 110 kV 2.6 1.5 1.5 1.5 1.5 1.5 1.5 1.5 1.5 1.5 1.5
Gore 220 kV (T11) - 5.3 5.3 5.3 5.3 5.3 5.3 5.3 5.3 5.3 5.3
Gore 220 kV (T12) - 5.3 5.3 5.3 5.3 5.3 5.3 5.3 5.3 5.3 5.3
Halfway Bush 33 kV (T1/T2) 20.2 20.1 20.1 2.5 2.5 2.5 2.5 2.5 2.5 2.5 2.5
Halfway Bush 33 kV (T5) 14.5 14.5 14.5 2.5 2.5 2.5 2.5 2.5 2.5 2.5 2.5
Halfway Bush 110 kV 11.6 11.6 11.6 7.2 7.2 7.2 7.2 7.2 7.2 7.2 7.2
Halfway Bush 220 kV 8.2 8.2 8.2 7.7 7.7 7.7 7.7 7.7 7.7 7.7 7.7
Invercargill 33 kV 1.0 1.0 1.0 1.0 1.0 1.0 1.0 1.0 1.0 1.0 1.0
Invercargill 110 kV 5.1 5.4 5.4 5.4 5.4 5.4 5.4 5.4 5.4 5.4 5.4
Invercargill 220 kV 10.3 10.3 10.3 10.3 10.3 10.3 10.3 10.3 10.3 10.3 10.3
Manapouri 220 kV 14.5 14.4 14.4 14.4 14.4 14.4 14.4 14.4 14.4 14.4 14.4
North Makarewa 33 kV 1.3 1.3 1.3 1.3 1.3 1.3 1.3 1.3 1.3 1.3 1.3
North Makarewa 220 kV 10.1 10.2 10.2 10.2 10.2 10.2 10.2 10.2 10.2 10.2 10.2
Naseby 33 kV 8.1 8.1 8.1 8.1 8.1 8.1 8.1 8.1 8.1 8.1 8.1
Naseby 220 kV 4.3 4.3 4.3 4.3 4.3 4.3 4.3 4.3 4.3 4.3 4.3
Roxburgh 110 kV 9.9 9.7 9.7 9.5 9.5 9.5 9.5 9.5 9.5 9.5 9.5
Roxburgh 220 kV 15.8 15.8 15.8 15.7 15.7 15.7 15.7 15.7 15.7 15.7 15.7
South Dunedin 33 kV 3.1 3.1 3.1 3.1 3.1 3.1 3.1 3.1 3.1 3.1 3.1
South Dunedin 220 kV 7.1 7.2 7.2 6.8 6.8 6.8 6.8 6.8 6.8 6.8 6.8
Three Mile Hill 220 kV 8.3 8.3 8.3 7.9 7.9 7.9 7.9 7.9 7.9 7.9 7.9
Tiwai 220 kV 8.2 8.2 8.2 8.2 8.2 8.2 8.2 8.2 8.2 8.2 8.2