temporal changes of microbial assemblages in the ice and snow cover of a high mountain lake
TRANSCRIPT
Temporal Changes of Microbial Assemblages in the Ice and Snow Cover of a High MountainLakeAuthor(s): Marisol Felip, Lluis Camarero and Jordi CatalanSource: Limnology and Oceanography, Vol. 44, No. 4 (Jun., 1999), pp. 973-987Published by: American Society of Limnology and OceanographyStable URL: http://www.jstor.org/stable/2670753 .
Accessed: 13/06/2014 21:22
Your use of the JSTOR archive indicates your acceptance of the Terms & Conditions of Use, available at .http://www.jstor.org/page/info/about/policies/terms.jsp
.JSTOR is a not-for-profit service that helps scholars, researchers, and students discover, use, and build upon a wide range ofcontent in a trusted digital archive. We use information technology and tools to increase productivity and facilitate new formsof scholarship. For more information about JSTOR, please contact [email protected].
.
American Society of Limnology and Oceanography is collaborating with JSTOR to digitize, preserve andextend access to Limnology and Oceanography.
http://www.jstor.org
This content downloaded from 91.229.229.44 on Fri, 13 Jun 2014 21:22:31 PMAll use subject to JSTOR Terms and Conditions

LIMNOLOGY AND June 1999
Volume 44 OCEANOGRAPHY~~~~~~~ I Number 4
Li,nn?iol. Oceanog., 44(4), 1999, 973-987 C) 1999, by the American Society of Limnology and Oceanography, Inc.
Temporal changes of microbial assemblages in the ice and snow cover of a high mountain lake
Marisol Felip, Lluis Camarero, and Jordi Catalan Departament d'Ecologia i Centre de Recerca d'Alta Muntanya, Universitat de Barcelona, Avg. Diagonal 645, 08028 Barcelona, Spain
Abstract It has recently been shown that a rich community of microorganisms inhabits the slush layers of the winter cover
of high mountain lakes. In this study, temporal changes in species assemblages and environmental conditions in the ice and snow cover of Lake Redo in the Pyrenees (Spain) are presented. The winter cover was a highly dynamic environment, in which major changes occurred in physical structure and chemical characteristics. The biomass and species composition of the microbial groups present (autotrophic and heterotrophic flagellates, ciliates, and bacteria) reflected these physicochemical alterations. After an initial phase, during which the ice sheet formed and the first snows accumulated with little or no development of slush layers, there were two stages of microbial assemblages, which coincided with the two main phases in the physical change of the cover: the growth period (from January to mid-April) and the ablation period (from mid-April to ice-out in June). Initially, microbial biomass originated from inputs of phytoplankton-rich (5.9 ,ug chlorophyll a liter-1) surface lake water that flooded the cover as a result of the hydrostatic adjustment induced by the progressive accumulation of snow on top of the ice sheet. This was followed by a differential growth of mixotrophic or heterotrophic flagellated species, such as Ochromonas sp., Cryptomonas spp., Monosiga ovata and Oikomonas termo, which peaked at different times. Species depended primarily on bacterivory for their growth, since during this period, light did not reach the slush layers. By April, the transition from cover growth to ablation was marked by a reduction in biomass and in the number of species. During the ablation period, the rate of change of the cover was greater, and microbial assemblages were characterized by the vertical segregation and by the appearance of new species, some of which were typically nonplanktonic. During that time, the cover was highly influenced by the large amount of water from the melting of the snowpack within the catchment. This water likely provided chemicals and organisms, while increased light availability allowed for the growth of algae (Pteromonas sp. and other volvocales) and of the associated food web in the upper slush. In deeper layers, however, a bacteria-based food web provided prey for large ciliates (Urosoma sp., Dileptus sp., and Lacrymaria sp.), probably carried from littoral or watershed soils.
High mountain lakes are covered by ice and snow for several months of the year. Such covers are complex phys- ical structures (Adams and Allan 1987). When the lake freezes, a sheet of clear ice, so-called "black ice" forms at the lake surface, and salts are efficiently exsolved, which, in turn, increases salt concentration in the water beneath the ice. Snow subsequently accumulates on top of the ice, and the stress produced causes the lake water to rise and to flood
Acknowledgments We thank S. Pla and B. Weitzmann for fieldwork support and M.
Ventura and M. Krb/3bacher for assistance in computer and image analysis, respectively. This study has been supported by the Com- ision Interministerial de Ciencia y Tecnologia, project NAT89-943, of the Spanish Government and MOLAR (Measuring and Modeling the Dynamic Response of Remote Mountain Lake Ecosystems to Environmental Change) ENV4-CT95-0007 of the Environmental and Climate Program of the European Commission.
the snowpack until a hydrostatic equilibrium is reached. The mixing of snow and water gives rise to slush layers, which, under certain circumstances, can freeze to produce white ice, which is much more opaque than black ice. Subsequent snowfalls with varying chemical compositions add layers with varying properties. Episodic flooding, melting, and freezing convert the cover into a complex stratigraphical structure (Catalan 1989). During spring, the snow cover is enriched by the dry deposition of particles, including pollen, small insects, organic debris, and dust (Barrie 1985). Tem- porally, there are two well-defined phases in temperate lat- itudes: (1) growth in the thickness of covers from the time the lake freezes to the end of April and (2) an ablation pe- riod, which lasts a few weeks and which consists of a pro- gressive top-down melting of the different layers (Catalan 1989). During this period, melting of the snow in the wa- tershed causes a large amount of water to circulate through
973
This content downloaded from 91.229.229.44 on Fri, 13 Jun 2014 21:22:31 PMAll use subject to JSTOR Terms and Conditions
974 Felip et al.
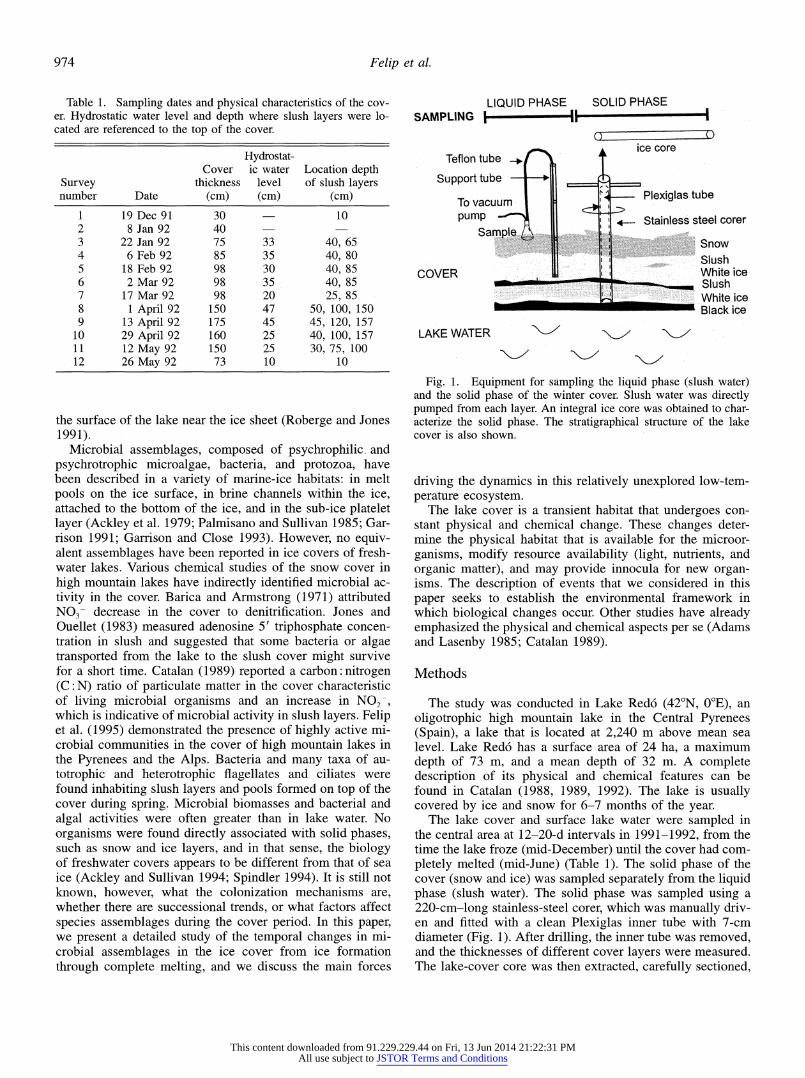
Table 1. Sampling dates and physical characteristics of the cov- er. Hydrostatic water level and depth where slush layers were lo- cated are referenced to the top of the cover.
Hydrostat- Cover ic water Location depth
Survey thickness level of slush layers number Date (cm) (cm) (cm)
1 19 Dec 91 30 10 2 8 Jan 92 40 3 22 Jan 92 75 33 40, 65 4 6 Feb 92 85 35 40, 80 5 18 Feb 92 98 30 40, 85 6 2Mar92 98 35 40,85 7 17 Mar 92 98 20 25, 85 8 1 April 92 150 47 50, 100, 150 9 13 April 92 175 45 45, 120, 157
10 29 April 92 160 25 40, 100, 157 11 12 May 92 150 25 30, 75, 100 12 26 May 92 73 10 10
the surface of the lake near the ice sheet (Roberge and Jones 1991).
Microbial assemblages, composed of psychrophilic, and psychrotrophic microalgae, bacteria, and protozoa, have been described in a variety of marine-ice habitats: in melt pools on the ice surface, in brine channels within the ice, attached to the bottom of the ice, and in the sub-ice platelet layer (Ackley et al. 1979; Palmisano and Sullivan 1985; Gar- rison 1991; Garrison and Close 1993). However, no equiv- alent assemblages have been reported in ice covers of fresh- water lakes. Various chemical studies of the snow cover in high mountain lakes have indirectly identified microbial ac- tivity in the cover. Barica and Armstrong (1971) attributed NO3- decrease in the cover to denitrification. Jones and Ouellet (1983) measured adenosine 5' triphosphate concen- tration in slush and suggested that some bacteria or algae transported from the lake to the slush cover might survive for a short time. Catalan (1989) reported a carbon: nitrogen (C: N) ratio of particulate matter in the cover characteristic of living microbial organisms and an increase in NO2-, which is indicative of microbial activity in slush layers. Felip et al. (1995) demonstrated the presence of highly active mi- crobial communities in the cover of high mountain lakes in the Pyrenees and the Alps. Bacteria and many taxa of au- totrophic and heterotrophic flagellates and ciliates were found inhabiting slush layers and pools formed on top of the cover during spring. Microbial biomasses and bacterial and algal activities were often greater than in lake water. No organisms were found directly associated with solid phases, such as snow and ice layers, and in that sense, the biology of freshwater covers appears to be different from that of sea ice (Ackley and Sullivan 1994; Spindler 1994). It is still not known, however, what the colonization mechanisms are, whether there are successional trends, or what factors affect species assemblages during the cover period. In this paper, we present a detailed study of the temporal changes in mi- crobial assemblages in the ice cover from ice formation through complete melting, and we discuss the main forces
LIQUID PHASE SOLID PHASE SAMPLING _
ice core Teflon tube .
Support tube
To vacuum, Plexiglas tube pump _ Stainless steel corer
Sample. now
Slush COVER , i - 0 : White ice COVER ~~~~~~~~~~Slush
White ice Black ice
LAKE WATER / xY 7
Fig. 1. Equipment for sampling the liquid phase (slush water) and the solid phase of the winter cover. Slush water was directly pumped from each layer. An integral ice core was obtained to char- acterize the solid phase. The stratigraphical structure of the lake cover is also shown.
driving the dynamics in this relatively unexplored low-tem- perature ecosystem.
The lake cover is a transient habitat that undergoes con- stant physical and chemical change. These changes deter- mine the physical habitat that is available for the microor- ganisms, modify resource availability (light, nutrients, and organic matter), and may provide innocula for new organ- isms. The description of events that we considered in this paper seeks to establish the environmental framework in which biological changes occur. Other studies have already emphasized the physical and chemical aspects per se (Adams and Lasenby 1985; Catalan 1989).
Methods
The study was conducted in Lake Redo (420N, 0?E), an oligotrophic high mountain lake in the Central Pyrenees (Spain), a lake that is located at 2,240 m above mean sea level. Lake Redo has a surface area of 24 ha, a maximum depth of 73 m, and a mean depth of 32 m. A complete description of its physical and chemical features can be found in Catalan (1988, 1989, 1992). The lake is usually covered by ice and snow for 6-7 months of the year.
The lake cover and surface lake water were sampled in the central area at 12-20-d intervals in 1991-1992, from the time the lake froze (mid-December) until the cover had com- pletely melted (mid-June) (Table 1). The solid phase of the cover (snow and ice) was sampled separately from the liquid phase (slush water). The solid phase was sampled using a 220-cm-long stainless-steel corer, which was manually driv- en and fitted with a clean Plexiglas inner tube with 7-cm diameter (Fig. 1). After drilling, the inner tube was removed, and the thicknesses of different cover layers were measured. The lake-cover core was then extracted, carefully sectioned,
This content downloaded from 91.229.229.44 on Fri, 13 Jun 2014 21:22:31 PMAll use subject to JSTOR Terms and Conditions

Microbial assemblages on lake cover 975
and stored in clean polyethylene bags. In the laboratory, ice and snow samples were melted and stored in polyethylene bottles at -20?C until chemical analysis. Water from the slush layers was pumped through small holes drilled in the lake cover, as shown in Fig. 1, and progressively deeper slush layers were sampled until lake water was reached. Im- mediately after sampling, a polyethylene bottle was filled with a subsample for chemical analysis (stored at -20?C); in order to determine microbial abundance, subsamples were fixed, while those collected for particulate and pigment an- alyses were filtered and then stored frozen. On the basis of mean density (calculated using a buoyancy equation; Adams 1976) and the volume of the cover, the water equivalent mass was estimated. A stratigraphical sampling of the watershed snowpack was carried out at the same time (Camarero 1994a). Precipitation was estimated with data obtained from the Baserca Reservoir station, located in the same valley, 4 km from Lake Redo. Flooding water was calculated by dif- ference between cover-water equivalent and precipitation. The percentage of incident light transmitted through the lake cover was estimated with reflection and extinction coeffi- cients found in the literature for different types of snow, ice, and slush (Catalan 1988) and based on the thickness of the layers.
All samples (solid and liquid phase of the cover and lake water) were analyzed for chemical composition (standard ac- curacy of the method is indicated between brackets). Con- ductivity (+ 0.2 ,S cm-') was measured with an InstranlO conductimeter with automatic temperature correction, and pH (+ 0.02) was measured using electrodes for low-ionic- strength solutions. Na+ and K+ (+ 1 ,uatg liter-') were de- termined by atomic absorption spectrometry. Ca2+ and Mg2+ (+ 0.5 gatg liter-') were quantified by inductively coupled plasma spectrometry. Cl- (+ 1 ,uatg liter-') and S042 (? 0.5 gatg S liter-') were measured by ion chromatography. NO3- (? 1 ,uatg N liter-') was determined by ultraviolet spectrophotometry. NOK- (+ 0.01 gatg N liter-'), NH4+ (? 0.1 gatg N liter-'), and total phosphorus (TP) (? 0.01 gatg P liter-') were quantified by colorimetric methods (Grasshoff et al. 1983). Soluble reactive phosphorus (SRP) (+ 0.003 gatg P liter-') was determined by the malachite-green meth- od in concentrated samples (Camarero 1994b). NRP (non- reactive phosphorus) was calculated as TP-SRP Dissolved organic carbon (DOC) was measured with a Shimadzu TOC- 5000 analyzer (+ 1 ,uatg C liter-'). Subsamples (500-1,500 ml) of the liquid phase of the cover and lake water were filtered on previously ignited Whatman GF/F glass-fiber fil- ters, and particulate carbon (PC) and particulate nitrogen (PN) were measured in a Carlo-Erba Nitrogen Analyzer 1500 (+ 1 ,uatg liter-'). Subsamples were also processed to determine microbial abundance and biomass.
Bacterial numbers were determined by epifluorescence rnicroscopy using 4',6-diamidino-2-phenylindole (DAPI) staining on black Nucleopore filters (pore size 0.2 gm) fol- lowing Porter and Feig (1980). We followed the recommen- dations of Kirchman (1993) in order to minimize the error of the count. Bacterial biomass, size, and shape were deter- mined by automated image analysis, as described in Felip et al. (1995). Six length classes were considered (0.2-0.4 gm, 0.4-0.8 um, 0.8-2 um, 2-10 um, 10-20 um, and >20 um).
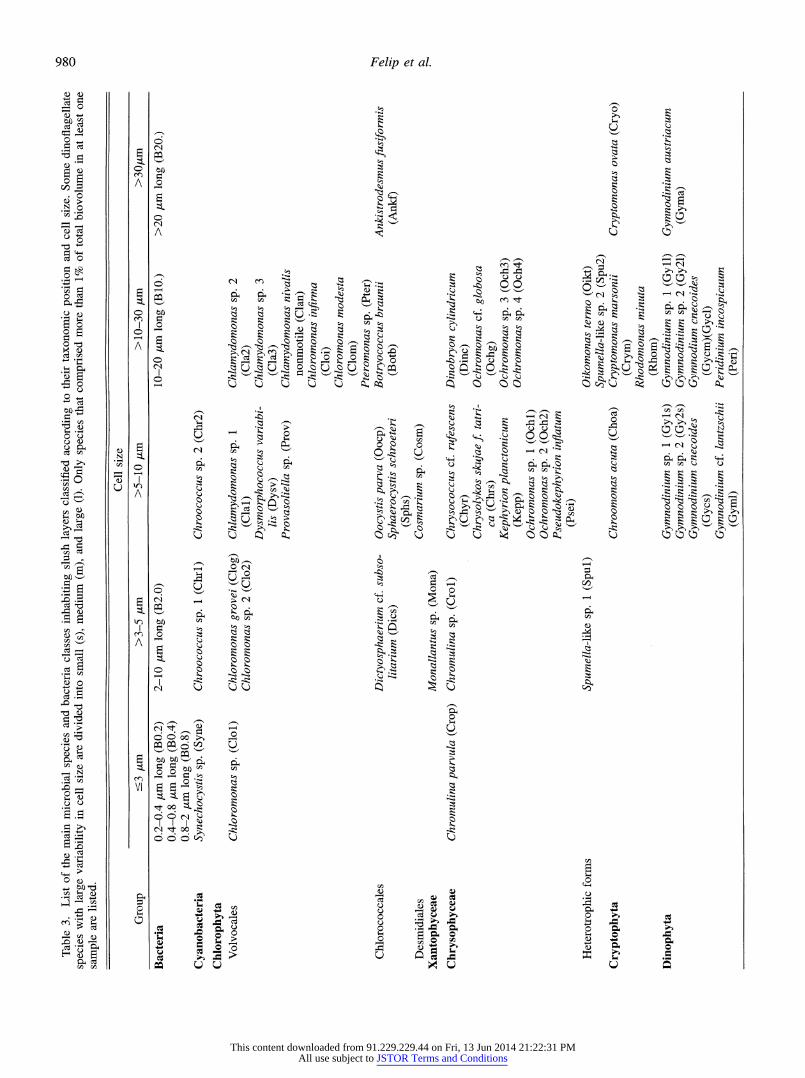
Abundance of algae, heterotrophic flagellates, and ciliates was estimated following the Utermohl method after fixation with Lugols solution (Sournia 1978). The error associated with abundance calculations was ?10%. Biovolume was es- timated by shape approximation to known geometric forms and from direct measurement of the main cell dimensions. In many cases, especially for soft flagellates and for some ciliates, genus assignment was not possible. If size differ- ences were observed within a species, the individuals of that species were divided into several cell classes so that we could better estimate biovolume and in order to take into account the ecological significance of size (Rodriguez and Li 1994). Only those species that constituted more than 1% of the total biovolume in at least one sample were used in the statistical analysis.
Absorbance spectra of photosynthetic pigment extracts in 90% acetone were used for chlorophyll (Chl) determinations (Jeffrey and Humphrey 1975). The ratio between absorban- cas at 430- and 410-nm wavelengths (A430: A410) was used as pheopigment indicator (Moss 1967). The A480: A665 ra- tio was used as an indicator of the relative abundance of carotenoids (Strickland and Parsons 1968).
In order to explore species-environment relationships, we performed a canonical correspondence analysis (CCA) (ter Braak 1986). We included in the analysis environmental var- iables that define the chemical setting (i.e., pH and conduc- tivity), those that are potential growth resources (i.e., light, SRP, NO3-, NO,-, NH4', NRP, and DOC), and, given that many of the species found inhabiting the cover are poten- tially bacteriovores, we also included bacterial biovolume, distinguishing size classes. Species biovolumes and all en- vironmental variables except pH and light were log trans- formed because of their skewed nature. The CCA extracts the axes of main variability of the species assemblages, but with the constriction that this axis must be a linear combi- nation of environmental variables measured, and assuming a unimodal distribution of the species along the environ- mental gradients (ter Braak 1995). The resulting diagrams provide a simultaneous ordination of species, sites, and en- vironmental variables. The statistical significance of each en- vironmental variable was tested by a Monte Carlo permu- tation test with 999 unrestricted permutations (Besag and Clifford 1989).
Results
Physical and chemical chanqes in the lake cover-For the sake of simplicity, the temporal sequence of physical chang- es in the lake cover can be divided into three main periods, following conventional snowpack descriptions (Loth et al. 1993): formation, from December to January; growth, from February to mid-April; and ablation, from mid-April to May. The lake froze during the second week of December, and a 10-cm ice sheet quickly formed. Episodic snowfalls and con- current flooding as a result of hydrostatic adjustment in- creased cover thickness until mid-April (Table 1), when melting started. During May, pools up to 40-cm deep ex- tended across most of the cover surface. Different layers of slush were identified from January to mid-May, all of which
This content downloaded from 91.229.229.44 on Fri, 13 Jun 2014 21:22:31 PMAll use subject to JSTOR Terms and Conditions

976 Felip et al.
15001 I I I ~~~~~~~~~~~~~~~~~~~~~~~~~~~CD e~~~~~~~~~~~~~~~~~~~~ -X -W
50
E 1250
100010
750
D J F M A M
Fig. 2. Changes in the cover water-equivalent content during the sampling period. Water origin is indicated for the growth period. Vertical black bars indicate the amount of snow deposited between surveys. Note the low precipitation from mid-January to mid- March. In May, some precipitation events were rainfalls that con- tributed to the cover melting.
were located below the hydrostatic water level; thus, they were susceptible to the influence of lake water. At the be- ginning of June, the cover consisted of only a thin layer of melting ice, which occupied one-half of the lake surface and which finally broke up into many floes.
Most of the water equivalent volume (average of 78%) of the cover was accounted for by flooding water (Fig. 2) dur- ing the growth phase. Detailed analysis of the sequence of events showed that snow fell heavily during a few episodes but that hydrostatic adjustment and the consequent flooding of the snow cover occurred progressively after these events.
From December to April, the amount of light reaching the most shallow slush layer was low (<1 ,utE m-2 s l). Only from May onward did higher light levels reach some of the slush layers. In such cases, more than 10 ,utE m-2 51l were available for several hours. By this time of the year, surface pools were exposed to high radiation (1,500-2,000 ,utE m-2 sil).
The chemical composition of the deposition varied tem- porally (Table 2). Some snowfalls presented a high content of dissolved salts, whereas others were highly diluted. A general feature of the snow was its high NH4+ (10 times greater than in lake water) and SRP and NRP content (about three times greater than in lake water). A clear seasonal trend was evident in the chemical composition of the slush layers. During the formation period, slush was enriched, with higher conductivity and a concomitant increase in all substances except SRP and NRP (Table 2). During the whole growth phase, the chemical composition of the slush was similar to that of lake water. At the end of April, the slush composition started to change, becoming chemically more similar to that of snow and melting water. The main trends at this time were a general dilution, a fall in pH, and higher NH4+ content.
Changes in microbial biomass-The Chl concentration in the slush layers decreased from 5 to 0.2 gg Chl a liter-1 (Fig. 3) between January (well-developed slush layers) and the end of April (cover ablation and onset of the watershed thaw). The initial high values were concomitant with those in lake surface water (5.9 ,tg Chl a liter-'). The decrease in Chl during the growth phase was accompanied by an in- crease in the proportion of pheopigments. The A430: A410 ratio decreased to values of 0.77 in mid-April, indicating that about 70% of the total Chl could be present in degraded forms, according to a high-performance liquid chromatog- raphy calibration carried out in a previous study of plankton during winter in Lake Redo (Catalan 1992). During the ab- lation phase, there was a slight increase in Chl levels (Fig. 3). This increase was accompanied by a rise in the A480 A665 ratio, from typical lake values of 1-1.5 up to 6.3 in the cover surface pools.
Slush layers were generally richer in PC and PN than was the lake water (Table 2). In about one-half of the slush sam- ples, the proportion of PC to Chl was similar to lake water proportions, yet the remainder of the samples were signifi- cantly enriched in PC. Microscopic observations revealed that this enrichment was due to a large amount of organic debris, mainly from atmospheric deposition, and was not the result of a higher proportion of nonpigmented microorgan- isms. Only mid-April slush layers showed a large proportion of damaged cryptophytes and chlorophytes instead of debris, which was consistent with the results given by the pheopig- ment indicator.
The various microbial groups present exhibited different temporal patterns from that of Chl. Biomass maxima oc- curred at distinct times and at different depths within the cover (Fig. 4). Nonflagellated phytoplanktonic groups, such as desmids and chlorococcales, were found at the beginning of cover formation but quickly disappeared. Moreover, other groups, such as volvocales, chrysophytes, cryptophytes, and heterotrophic flagellates, showed higher densities in the cov- er than in the lake water. A discontinuity in April in all major groups clearly marked the boundary between sequences. Cryptophytes, chrysophytes, and heterotrophic flagellates dominated the microbial biomass during the growth phase, whereas volvocales, dinoflagellates, and ciliates were more abundant during the cover formation (which is most likely due to their abundance in lake water) and during the ablation period. Some planktonic rotifers, such as Kellicottia longis- pina, Polyarthra sp., and Asplanchna priodonta, were scarce, appearing only sporadically during the cover growth phase.
Bacterial abundance ranged between 0.5 X 10⁵ and 1.5 X 10⁶ bacteria ml I and was highly correlated with bacterial biomass (r = 0.86, P < 0.001), which ranged from 5,200 to 300,000 ,um3 ml-'. Bacteria were a significant part of total microbial biovolume during the whole cover period (32% on average). In mid-April, bacteria even became the dominant group in the slush layers (88% of total biomass).
Microbial assemblage diversity Bacteria in the slush layers were morphologically diverse; short rods and cocci between 0.4-0.8-,tm long were the most abundant forms, constituting up to 76% of the total number of bacteria in
This content downloaded from 91.229.229.44 on Fri, 13 Jun 2014 21:22:31 PMAll use subject to JSTOR Terms and Conditions

Microbial assemblages on lake cover 977
Table 2. Chemical composition for the different periods sampled. Units are ,uatg liter-', except pH and conductivity (,uS cm-l).*
Conduc- pH tivity Na+ K+ Ca2+ Mg2+ Cl- NOQ- NO3- NH44 S042- DOC SRP NRP PC PN
Fresh Snow Mean 5.4 7.8 6 1 11 4 8 0.1 9 10.8 18 84 0.096 0.541 - SD 0.4 7.4 5 1 11 5 7 0.1 13 11.8 21 65 0.083 0.689 - Minimum 4.3 1.5 0 0 0 0 0 0.0 0 0.8 0 26 0.012 0.003 - Maximum 6.1 52.1 26 7 43 19 29 0.9 93 80.4 100 360 0.401 3.440 -
Lake Water Formation
Mean 6.6 13.5 10 2 93 17 12 0.4 17 1.4 30 100 0.049 0.350 17 2 SD 0.06 1.2 <1 <1 9 2 10 0.3 <1 0.5 8 12 0.015 0.116 2 <1 Minimum 6.6 12.1 10 2 85 15 5 0.2 17 0.9 22 91 0.034 0.219 16 2 Maximum 6.7 14.3 11 3 104 18 24 0.7 17 2.0 38 114 0.064 0.440 18 3
Growth Mean 6.6 11.7 8 2 66 10 5 0.1 13 2.4 27 92 0.039 0.257 9 1 SD 0.04 0.9 <1 <1 24 5 4 0.02 2 0.8 10 49 0.039 0.129 4 <1 Minimum 6.6 10.3 7 1 18 1 0 0.10 10 1.7 12 42 0.016 0.107 5 2 Maximum 6.7 12.6 9 2 81 15 9 0.15 15 3.4 38 167 0.117 0.463 13 1
Ablation Mean 6.5 12.4 6 1 51 4 6 0.08 15 3.4 25 72 0.044 0.221 5 1 SD 0.3 6.0 2 <1 25 3 3 0.003 4 1.3 4 5 0.027 0.178 <0 <1 Minimum 6.3 8.8 5 1 23 0 4 0.08 11 2.1 22 67 0.013 0.110 5 1 Maximum 6.8 19.3 8 2 72 6 10 0.09 19 4.7 29 76 0.062 0.426 6 1
Slush layers Formation
Mean 6.6 34.1 27 7 209 44 21 0.6 53 12.1 123 177 0.053 0.358 21 2 SD 0.2 23.1 20 6 114 33 18 0.3 44 16.5 118 64 0.016 0.104 2 <1 Minimum 6.5 13.6 11 2 101 19 8 0.2 20 1.4 30 127 0.035 0.295 19 2 Maximum 6.9 59.2 49 14 328 82 42 0.9 103 31.2 255 250 0.063 0.478 23 3
Growth Mean 6.6 12.3 9 2 66 10 5 0.1 14 3.8 30 95 0.059 0.283 17 2 SD 0.1 2.7 4 2 30 6 5 0.03 6 2.8 14 38 0.028 0.123 8 <1 Minimum 6.5 6.7 3 1 14 0 0 0.08 4 1.9 0 46 0.027 0.132 3 1 Maximum 6.9 16.6 19 9 94 18 14 0.2 28 13.3 53 185 0.128 0.507 30 3
Ablation Mean 5.8 6.5 4 1 26 3 8 0.07 13 10.2 20 70 0.028 0.302 15 2 SD 0.5 4.3 4 <1 31 3 5 0.07 9 6.3 11 15 0.022 0.340 18 2 Minimum 5.3 1.6 0 0 2 0 2 0.01 3 2.1 3 52 0.009 0.100 4 1 Maximum 6.6 13.6 11 3 81 9 17 0.2 26 19.1 35 102 0.077 1.098 57 7
* PC, particulate carbon; PN, particulate nitrogen.
some samples. Long (up to 95-,um), thin (-I -,um) filaments were found mostly in slush layers in March and especially during the end of the ablation phase. Although cell size var- iability was considerable and changed with depth, no clear direct relationship was established between the size distri- bution of bacteria and eukaryotic groups.
About 100 different eukaryotic species were counted, al- though the abundance and frequency of most of these species was low. Table 3 lists those species that constituted more than 1% of the total biovolume in at least one sample. Figure 5 illustrates the distribution of the most abundant species over time and at different cover depths. All these species were flagellated forms capable of bacterivory, although they were quite diverse in phylogenetic origin and included some pigmented species. Some of these species showed clear pat-
terns. For instance, the choanoflagellate Monosiga ovata de- veloped exclusively during the growth phase of the cover, peaking in the middle of the period. However, the temporal patterns of most species were not so apparent, and changes in assemblages could not be identified. Nevertheless, it was clear that the rate of change was not constant throughout the winter and that the assemblages differed considerably in samples collected a few months apart.
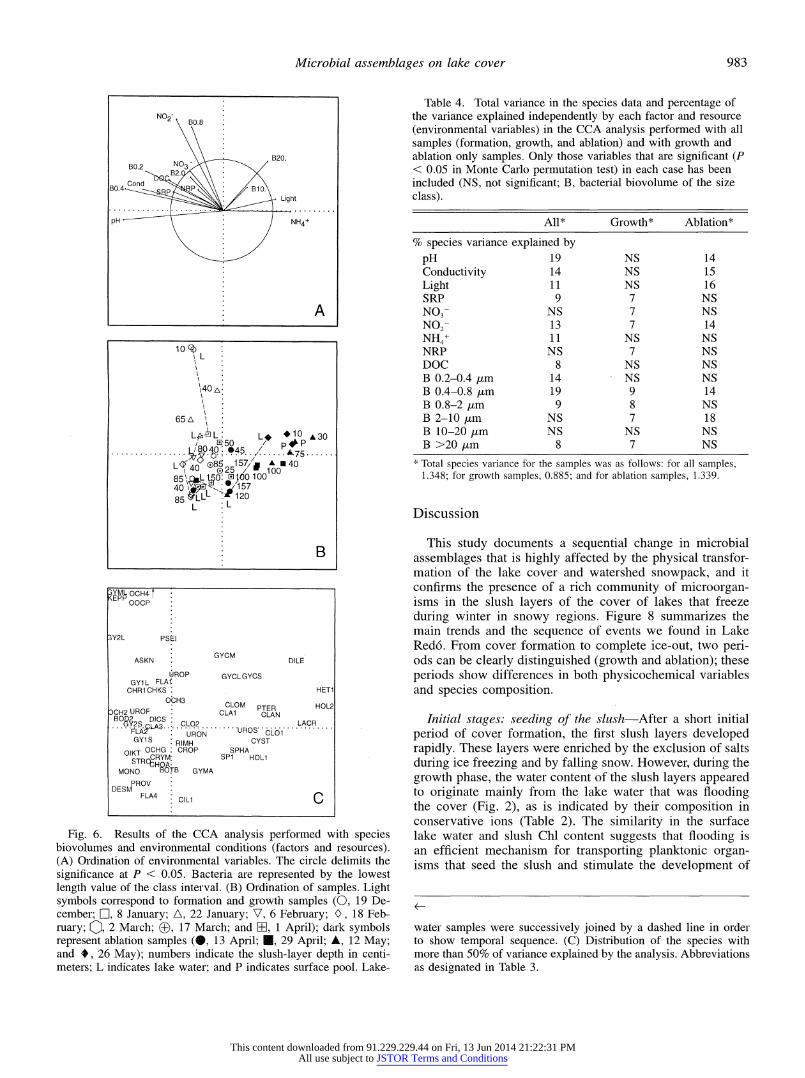
Environmental variables and species distribution Figure 6 illustrates the ordination results of the analysis performed with the whole data set. The axis 1 eigenvalue is 0.242, and it explains 17.9% of species variability, while the axis 2 eigenvalue is 0.126, and it explains 9.6% of species vari- ability. The main gradient (axis 1) was defined by pH, con-
This content downloaded from 91.229.229.44 on Fri, 13 Jun 2014 21:22:31 PMAll use subject to JSTOR Terms and Conditions

978 Felip et al
Chlorophyll a (pg L1) I 2 CL
2 Pheopigment indicator (430:410) D J F M A M 1992
Fig. 3. Temporal changes of chlorophyll a concentration and pheopigment indicator in the slush layers of the lake cover and surface lake water. Snow and ice cover is represented by the base map, which shows thickness progress throughout the period. 0-m depth corresponds to the hydrostatic water level; all slush layers were located below that level, which conforms to the painted border. The sampling points, several slush layers, and surface lake water are indicated by small crosses.
ductivity, DOC, and SRP on one edge and by light and NH,+ on the other, reflecting the seasonal changes in the chemical composition of the cover (Fig. 6A). The partition of samples between those with negative and those with positive values on this axis generally coincided with the initial samples (cover formation and growth) and-the ablation samples, re- spectively (Fig. 6B). If we compare Figs. 3, 4, and 5, it appears that the main partition was related to a general de- cline in biomass in most of the groups and main species. Furthermore, bacteria were segregated according to size, with smaller classes (0.2-0.4 and 0.4-0.8 gm) associated with environmental variables that were higher during the growth phase and large classes (10-20 and >20 um) asso- ciated with light and NH4+. Bacteria smaller than 0.8 Am accounted for a high percentage of the species matrix vari- ability, similar to the variability explained by some of the chemical factors (Table 4). A second axis, defined by N02- and bacteria (0.8-2 ,um, and secondarily, >20 ,um), reflected the initial conditions in the lake according to the sample scores (Fig. 6B). The lake samples' seasonal trajectory moved along axis 2, from the time at which the lake froze to the beginning of March, and then showed little change until the beginning of May, when it displaced along axis 1. During the growth and most of the ablation phase, lake samples appeared as a boundary for slush samples on the ordination axes, indicating a departure inside the cover from lake com- munities. Only the last lake-water sample mixed with the cover samples, indicating that there was a higher influence of the melting of the cover on the surface lake water. Figure 6C shows the species associated with this trajectory. Growth assemblages were more diverse than the formation or abla- tion assemblages. The ablation phase was characterized by the appearance of new species, some of them typical non- planktonic species, such as the large ciliates Urosoma sp., Lacrymaria sp., and Dileptus sp., and algae known to grow on snow beds (for instance, Chlamydomonas nivalis). Over- all, the distribution of species reflected the tremendous phys- icochemical modifications of the lake cover rather than dif-
ferential resource use or bacterivory effects. Because the relationships between the species and the potential growth resources may have been obscured, we applied CCA sepa- rately to the growth and ablation samples. In this way, we reduced the strong influence of the drastic changes in the physicochemical environment.
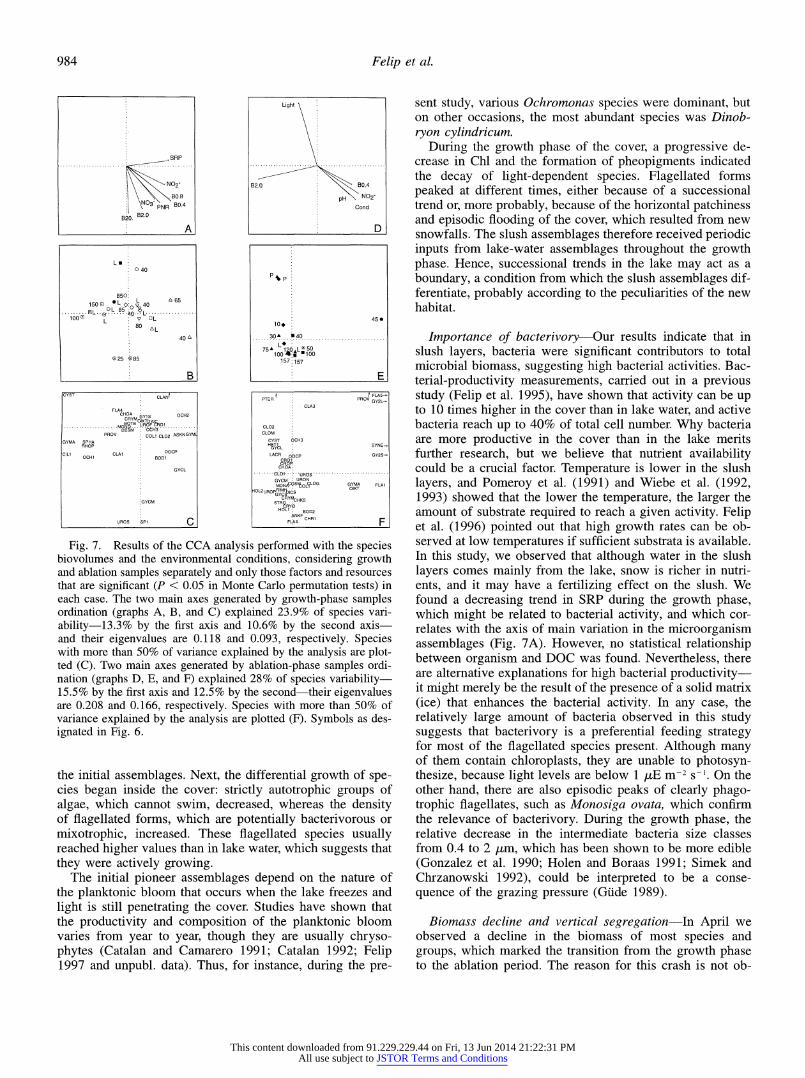
In considering the growth phase, total species variability decreased, and variables defining the main gradients changed radically (Table 4, Fig. 7A): bacteria and, to a lesser extent, nutrients, became more relevant than environmental factors, such as pH and conductivity. Light also lost its importance because during this period, all slush layers received low lev- els. Many variables had significant loadings on both main axes, with the exception of SRP, which was associated with the first axis, and the longest bacteria (>20 p,m), which were associated with the second axis. The first axis discriminated between the initial part of the period until mid-February, and the rest of the growth phase (Fig. 7B), showing a gradient of decreasing SRP and total bacteria, particularly of the small ones. The second axis indicated the high proportion of very long bacteria in the slush layers on 17 March. The loadings of the various bacterial size classes on the axis de- fined a partition of the ordination space according to bac- terial abundance and size distribution. The negative values on the first axis indicated low bacterial numbers, accompa- nied by a large proportion of long filaments, in the case of concomitance with negative values on the second axis. These samples were depleted in bacteria in the more edible size classes, which is consistent with the higher proportion of bacterivore species (ciliates and colorless flagellates, Fig. 7C) present.
The total species variance in the ablation period samples was almost as high as the variance in all the samples (for- mation, growth, and ablation) collected (Table 4). This in- dicates that changes were more significant during the abla- tion period than during the formation and growth phases. The first axis still reflected the temporal variability in pH and water dilution (Fig. 7D), while the second axis reflected
This content downloaded from 91.229.229.44 on Fri, 13 Jun 2014 21:22:31 PMAll use subject to JSTOR Terms and Conditions

Microbial assemblages on lake cover 979
BIOVOLU-ME (103 PM3L M )
VOLVOCALES* . 2_
o
_ _ ; - _ _ < ...~~~~~~~~~~~~~~~~~~~~. .. . . .. .. .. . .
2_CHRYSOPHYTES. -
*E
o
~~~~~~~~~~~~~~~~~~~~~~~~~~~~~~~~~~~~~~~~~~~~~~~~~~~~~... ..... .. C R P O P Y E ... .. ...
....................... y_
a 2 DINOFLAGELLATES _i!
-HETEROTROPHIC FL-AGELLATES t
2~~~~~~~~~~~~~ -- ---- :---
D . FMAM. 19 Fig 4Teprlcagofbooueodiesmirbagrusithslslaesadak
water. Ma inepeain_si i.3
the vertical light gradient within the cover, particularly dif- ferentiating the samples from the surface pools (Fig. 7E). It also shows the vertical distribution of species that appear for the first time (Fig. 7F). The abundance of rather large bac- teria (2-10 ,um) and light availability explained a high per- centage of the species variability (Table 4). Species associ- ated with the upper layers included Pteromonas sp., which
dominates pool assemblages, and other volvocales (Chla- mydomonas and Chloromonas), whereas deeper slush layers were mainly characterized by the presence of ciliates (Figs. 4, 7F). Subtle relationships between species and resources did not emerge from the analysis, perhaps because of the speed and magnitude of changes in the physical and chem- ical characteristics of the cover during this period.
This content downloaded from 91.229.229.44 on Fri, 13 Jun 2014 21:22:31 PMAll use subject to JSTOR Terms and Conditions
980 Felip et al.
o~~~~~~~~~~~~~~~~~~~~~~~~~~t sw m~~~~~~~~~~~~~~~~~~~~~~~~~~~~~~~~~~~~+
=g O V A - i - 0 ': 5; S ;$ g; 8 S i X ~~~~~~~~~~~~~(Z cnC-
c S t . K>o S ;~~~~~~~~~~~~~~~~~~~~~~~~~~~~~~~~~~~~~~~~~~~~~~~~~~~~~~~~~~c l
. _ A E o E t E , ,~~~~~~~~~~~~~~~~~~~~~~~~~~~~~~~~~~~~~~~~~~~~~~~~~~~~~~~Z
;, e m< > 0 e~~~~~~~~~~~~~~~~~~~~~~~~~~~~~~~~~~~~~~~~~~~~~~~~~~~~~~~~~~~~~~~~~~~~~~4E
3 , w ,
<~~~~~~~~~~~~~~~~~~~~~~~~~~~~~~~~ u t
, ? E O X e : j ; C e su
This content downloaded from 91.229.229.44 on Fri, 13 Jun 2014 21:22:31 PMAll use subject to JSTOR Terms and Conditions

Microbial assemblages on lake cover 981
7 lz t (z)
(Z ,:)
z U z U
i5 i
0 0 0 z z z z u u
Q z
0-4 cn
cl 0 Q 0 0 0
Z z
VI
This content downloaded from 91.229.229.44 on Fri, 13 Jun 2014 21:22:31 PMAll use subject to JSTOR Terms and Conditions

982 Felip et al.
BIOVOLUME (pm3mLA)
P~~~~~~~~~~~
2 Chromulina sp
0
2 Ochromonas cf. globosa
Op t
2 Cr tomonas marsonD
0
-- 1, _
. 2 Cryptomonas ovata
CL LU O - ------.......
2 0y rnodiniurn S.1I
2 J G mnodinium cnecoides " 0
1 r
2 Monosiga ovata
0
2 Olkomonas termo D J F - ---r- M T A M 1992
Fig. 5. Temporal change of biovolume of diverse species in the slush layers and lake water. Map interpretation as in Fig. 3.
This content downloaded from 91.229.229.44 on Fri, 13 Jun 2014 21:22:31 PMAll use subject to JSTOR Terms and Conditions
Microbial assemblages on lake cover 983
B 0 . 4 . \_ Light.
BO.2 PNB3
1-.. .
-- -. -- --.. .. .. . . .
pH
A
10 L
65 A
Lp-~ L L *10A30 ED 150 / pP
....4........... &/ ......... ... . * 475
Lo%40 @8525157/ 1 A
4O40
85 \ L150* J0 100
85~ 120 L5 L
B
E pp OCH4t
Y2L PSEI
GYCM ASKN ' DILE
UROP GYCLGYCS GYlL FLAI
CHR1CHKS: HET1 OtH3 CLM TR
BOGDv D2 CLOM PTLEAR HOL2 CH2 UROF CLAl CLAN BOR2
CS 2LACR
FLA ;URON. UROS. GYlS RIMH CYST
OIKT OCHG CROP SPHA OTCRYM: SPi HOLl STR% EHOA
MONO TOB GYMA PROV
DESM FLA4 C CiLlC
Fig. 6. Results of the CCA analysis performed with species biovolumes and environmental conditions (factors and resources). (A) Ordination of environmental variables. The circle delimits the significance at P < 0.05. Bacteria are represented by the lowest length value of the class interval. (B) Ordination of samples. Light symbols correspond to folmation and growth samples (0, 19 De- cember; Fn, 8 January; A, 22 January; V, 6 Febluary; 0, 18 Feb- ruary; 0, 2 March; ?, 17 March; and El, 1 April); dark symbols represent ablation samples (@, 13 April; U, 29 April; A, 12 May; and *, 26 May); numbers indicate the slush-layer depth in centi- meters; L indicates lake water; and P indicates surface pool. Lake-
Table 4. Total variance in the species data and percentage of the variance explained independently by each factor and resource (environmental variables) in the CCA analysis performed with all samples (formation, growth, and ablation) and with growth and ablation only samples. Only those variables that are significant (P < 0.05 in Monte Carlo permutation test) in each case has been included (NS, not significant; B, bacterial biovolume of the size class).
All* Growth* Ablation*
% species variance explained by pH 19 NS 14 Conductivity 14 NS 15 Light 1 1 NS 16 SRP 9 7 NS NO3- NS 7 NS NO2- 13 7 14 NH4+ 11 NS NS NRP NS 7 NS DOC 8 NS NS B 0.2-0.4 tm 14 NS NS B 0.4-0.8 jum 19 9 14 B 0.8-2 jum 9 8 NS B 2-10 jum NS 7 18 B 10-20 pim NS NS NS B>20,um 8 7 NS
1 Total species variance for the samples was as follows: for all samples, 1.348; for growth samples, 0.885; and for ablation samples, 1.339.
Discussion
This study documents a sequential change in microbial assemblages that is highly affected by the physical transfor- mation of the lake cover and watershed snowpack, and it confirms the presence of a rich community of microorgan- isms in the slush layers of the cover of lakes that freeze during winter in snowy regions. Figure 8 summarizes the main trends and the sequence of events we found in Lake Redo. From cover formation to complete ice-out, two peri- ods can be clearly distinguished (growth and ablation); these periods show differences in both physicochemical variables and species composition.
Initial stages: seeding of the slush-After a short initial period of cover formation, the first slush layers developed rapidly. These layers were enriched by the exclusion of salts during ice freezing and by falling snow. However, during the growth phase, the water content of the slush layers appeared to originate mainly from the lake water that was flooding the cover (Fig. 2), as is indicated by their composition in conservative ions (Table 2). The similarity in the surface lake water and slush Chl content suggests that flooding is an efficient mechanism for transporting planktonic organ- isms that seed the slush and stimulate the development of
water samples were successively joined by a dashed line in order to show temporal sequence. (C) Distribution of the species with more than 50% of variance explained by the analysis. Abbreviations as designated in Table 3.
This content downloaded from 91.229.229.44 on Fri, 13 Jun 2014 21:22:31 PMAll use subject to JSTOR Terms and Conditions
984 Felip et al.
Light
.SRP
N02- B2.0 BOA4
808 pH N02- PNO R Cond
B20 B2
L _ _ _ _ ~~ 4 A _ _ _ _ . D.3. .40
0 40
850: 15 D 0L -L t65
[C40TL. 05-
.~~ ~~~ ~~~ ....................CL0
GYM SPH CYST LOCH3L45
80 lo 1S*
75A1 Qlj 0D25 085 157: 157
B __E
CLAN' PTER PROV GY2L-
CHOA *y*s OCH2
CRY 9M , ,
DESM OCH3 CO PROV COLI CLO2 ASKNGYM e CLOM
GYMA SPHA ~~~~~ ~~~~~~~~~~~~~~~CYST OCH3 GYA SHAP H~b SYNE--
RHOP OOCigiicn P <6 0.5i ot al emtto et)i
CILl CLAl OOCP LACR ODCP GY2S-
GYCL C OA:
each~~~~~~~~~~~~~~~~~~~~~.... case. .............................hphae saple
Gycm URON M0NACOS ~L~LOG GYMA FLAl
q0L2UROpRIMtJIc OIKT
*GYCM CTRRYCHKS
UROS SPi ~~~~~~~~~~~~ANFCHRi URO 'Si cFLA4 F
Fig. 7. Results of the CCA analysis performed with the species biovolumes and the environmental conditions, considering growth and ablation samples separately and only those factors and resources that are significant (P < 0.05 in Monte Carlo permutation tests) in each case. The two main axes generated by growth-phase samples ordination (graphs A, B, and C) explained 23.9% of species vari- ability-13.3% by the first axis and 10.6% by the second axis- and their eigenvalues are 0.118 and 0.093, respectively. Species with more than 50% of variance explained by the analysis are plot- ted (C). Two main axes generated by ablation-phase samples ordi- nation (graphs D, E, and F) explained 28% of species variability- 15.5% by the first axis and 12.5% by the second-their eigenvalues are 0.208 and 0.166, respectively. Species with more than 50% of variance explained by the analysis are plotted (F). Symbols as des- ignated in Fig. 6.
the initial assemblages. Next, the differential growth of spe- cies began inside the cover: strictly autotrophic groups of algae, which cannot swim, decreased, whereas the density of flagellated forms, which are potentially bacterivorous or mixotrophic, increased. These flagellated species usually reached higher values than in lake water, which suggests that they were actively growing.
The initial pioneer assemblages depend on the nature of the planktonic bloom that occurs when the lake freezes and light is still penetrating the cover. Studies have shown that the productivity and composition of the planktonic bloom varies from year to year, though they are usually chryso- phytes (Catalan and Camarero 1991; Catalan 1992; Felip 1997 and unpubl. data). Thus, for instance, during the pre-
sent study, various Ochromonas species were dominant, but on other occasions, the most abundant species was Dinob- ryon cylindricum.
During the growth phase of the cover, a progressive de- crease in Chl and the formation of pheopigments indicated the decay of light-dependent species. Flagellated forms peaked at different times, either because of a successional trend or, more probably, because of the horizontal patchiness and episodic flooding of the cover, which resulted from new snowfalls. The slush assemblages therefore received periodic inputs from lake-water assemblages throughout the growth phase. Hence, successional trends in the lake may act as a boundary, a condition from which the slush assemblages dif- ferentiate, probably according to the peculiarities of the new habitat.
Importance of bacterivory-Our results indicate that in slush layers, bacteria were significant contributors to total microbial biomass, suggesting high bacterial activities. Bac- terial-productivity measurements, carried out in a previous study (Felip et al. 1995), have shown that activity can be up to 10 times higher in the cover than in lake water, and active bacteria reach up to 40% of total cell number. Why bacteria are more productive in the cover than in the lake merits further research, but we believe that nutrient availability could be a crucial factor. Temperature is lower in the slush layers, and Pomeroy et al. (1991) and Wiebe et al. (1992, 1993) showed that the lower the temperature, the larger the amount of substrate required to reach a given activity. Felip et al. (1996) pointed out that high growth rates can be ob- served at low temperatures if sufficient substrata is available. In this study, we observed that although water in the slush layers comes mainly from the lake, snow is richer in nutri- ents, and it may have a fertilizing effect on the slush. We found a decreasing trend in SRP during the growth phase, which might be related to bacterial activity, and which cor- relates with the axis of main variation in the microorganism assemblages (Fig. 7A). However, no statistical relationship between organism and DOC was found. Nevertheless, there are alternative explanations for high bacterial productivity- it might merely be the result of the presence of a solid matrix (ice) that enhances the bacterial activity. In any case, the relatively large amount of bacteria observed in this study suggests that bacterivory is a preferential feeding strategy for most of the flagellated species present. Although many of them contain chloroplasts, they are unable to photosyn- thesize, because light levels are below 1 ,uE m-2 s-'. On the other hand, there are also episodic peaks of clearly phago- trophic flagellates, such as Monosiga ovata, which confirm the relevance of bacterivory. During the growth phase, the relative decrease in the intermediate bacteria size classes from 0.4 to 2 ,um, which has been shown to be more edible (Gonzalez et al. 1990; Holen and Boraas 1991; Simek and Chrzanowski 1992), could be interpreted to be a conse- quence of the grazing pressure (Guide 1989).
Biomass decline and vertical segregation-In April we observed a decline in the biomass of most species and groups, which marked the transition from the growth phase to the ablation period. The reason for this crash is not ob-
This content downloaded from 91.229.229.44 on Fri, 13 Jun 2014 21:22:31 PMAll use subject to JSTOR Terms and Conditions

Microbial assemblages on lake cover 985
DOC SRP S042- NO- / Ca2+ Mg+
9 9 9. ~~~~PC @0 0 9 @~~~~~~~~~~~~~0 0
* . . . . /1 ~~~~~~~~T NH4+ I pH _ Cond
COVER ~~~~~~~~~~~~~~~~~~~~~~~~NOW ALGAE COVER -_
NON FLAELT v
LAKE Chi T
+ +~~~~~~~~
D J F M A M
FORMATION - GROTH ABLATION Fig. 8. Summary of the temporal change of the ice and snow cover of Lake Red6 in winter 1991-1992.
vious, but the consistent appearance of the decline during several sampling dates suggests it was not a random event but rather the result of a collapse within the microbial com- munity as a result of some general limitation. Macroscopi- cally, snowfalls do not compensate for melting, and, hence, there is no growth in cover thickness. Meanwhile, the flood- ing of the cover with lake water probably stops. Subsequent to biomass decline, new assemblages appeared, while some species recovered with the increased flow of water from the watershed, which modified the chemistry of the cover. The water apparently brings with it new organisms, including various volvocales (Chlamydomonas, Chloromonas, and Pteromonas), as well as other species that do not appear in the lake assemblage, such as the large ciliates Urosoma, Di- leptus, and Lacrymaria (predaceous species typical of ben- thic environments). These species may come from the snow- pack or from littoral or watershed soil water. During ablation, the rate of change of microbial assemblages is high and is caused by rapid variations in the physicochemical nature of the melting cover. At this time, the vertical seg- regation of assemblages was accentuated, from those receiv- ing full irradiance in surface pools (dominated by red-pig- mented algae) to deeper slush layers that were not receiving sufficient radiation to support photosynthesis and that were distinguished by the presence of large ciliates. To understand the rapid biological changes during the ablation period would require a higher sampling frequency than the one used in our study, and a parallel study of the microbial assem- blages growing in the snow and transported by the melt wa- ters running above and through the soil. A quantitative anal- ysis of these microbial assemblages would indicate whether this transport represented a colonization mechanism fol- lowed by growth in the slush or whether the cover simply
acts as a trap, retaining some of the microorganisms washed out from the snow or from the soils during the watershed thaw. Previous measurements of primary production during ablation showed values of up to 1.2 g C g-1 Chl h-1 (Felip et al. 1995), which, regardless of the colonizing mechanisms, indicates the possibility of sustaining a microbial food web based on in situ production during this phase of the cover.
The present study was carried out in a year of low snow deposition in Pyrenean lakes. It is common to find snow covers more than 3-m thick in Lake Redo during the April maximum, and in some years, we have recorded thicknesses of more than 5 m. Slush layers are isolated one from another by much thicker and, usually, harder layers of white ice than those found in the present study. In such years, the cover lasts longer, and, therefore, the patterns observed in this study may be more accentuated and more clearly defined. Evaluation of such interannual variability, spatial heteroge- neity, and common features and discrepancies between sites will provide us with a better understanding of this relatively unexplored microbial habitat. Nevertheless, we believe that the temporal patterns observed in this study will be of gen- eral application to lakes that freeze in snowy regions. Pre- liminary observations in lakes from the Alps seem to con- firm this pattern (Psenner pers. comm.)
Sorne of the assemblages described here are similar to planktonic or spring-snow surface assemblages (Kol 1968) but are different from marine-ice assemblages. Microbial communities that inhabit sea ice are highly diverse, and there are marked differences between the communities that de- velop in physically distinct ice environments. There is a strong interaction between the physical processes that form, shape, transform, and degrade the ice and the microbial as- semblages within it (Palmisano and Garrison 1993; Ackley
This content downloaded from 91.229.229.44 on Fri, 13 Jun 2014 21:22:31 PMAll use subject to JSTOR Terms and Conditions

986 Felip et al.
and Sullivan 1994). Our study is consistent with these ma- rine studies in that we also demonstrate the importance of the physical transformation of the lake cover in shaping mi- crobial assemblages. Yet, on the other hand, our study con- firms the lack of microbial assemblages directly associated with the solid phase of the ice as it occurs in sea ice. Perhaps the specific properties of freshwater ice (for instance, a smooth face) or the ephemeral nature of the lake cover pre- vent ice microbial community development. Nevertheless, the reason why no benthic life develops directly on fresh- water ice is still in need of a convincing explanation.
References
ACKLEY, S. E, K. R. BUCK, AND S. TAGUCHI. 1979. Standing crop of algae in the sea ice of the Weddell Sea region. Deep-Sea Res. 26: 269-281.
, AND C. W. SULLIVAN. 1994. Physical controls on the de- velopment and characteristics of Antarctic sea ice biological communities-a review and synthesis. Deep-Sea Res. 41: 1583-1604.
ADAMS, W. P 1976. Field determination of the densities of lake ice sheets. Limnol. Oceanogr. 21: 602-608.
, AND C. ALLAN. 1987. Aspects of the chemistry of ice, notably snow, on lakes, p. 393-466. In H. G. Jones and W. J. Orville-Thomas [eds.], Seasonal snowcovers: Physics, chem- istry, hydrology. Reidel.
, AND D. C. LASENBY. 1985. The roles of snow, lake ice and lake water in the distribution of major ions in the ice cover of a lake. Ann. Glaciol. 7: 202-207.
BARICA, J., AND F A. J. ARMSTRONG. 1971. Contributions by snow to the nutrient budget of some small northwest Ontario Lakes. Limnol. Oceanogr. 16: 891-899.
BARRIE, L. A. 1985. Atmospheric particles: Their physical and chemical characteristics, and deposition processes relevant to the chemical composition of glaciers. Ann. Glaciol. 7: 100- 108.
BESAG, J., AND P. CLIFFORD. 1989. Generalized Monte Carlo sig- nificance tests. Biometrika 76: 633-642.
CAMARERO, L. 1994a. Regional chemistry of the Pyrenean lakes: Bases for the use of mountain lakes as monitoring systems of global acidification. Ph.D. Thesis. University of Barcelona.
. 1994b. Assay of soluble reactive phosphorus at nanomolar levels in nonsaline waters. Limnol. Oceanogi; 39: 707-711.
CATALAN, J. 1988. Physical properties of the environment relevant to the pelagic ecosystem of a deep high-mountain lake (Estany Red6, Central Pyrenees). Oecol. Aquat. 9: 89-123.
. 1989. The winter cover of a high-mountain Mediterranean lake (Estany Red6, Pyrenees). Water Resour. Res. 25: 519- 527.
. 1992. Evolution of dissolved and particulate matter during the ice-covered period in a deep, high-mountain lake. Can. J. Fish. Aquat. Sci. 49: 945-955.
, AND L. CAMARERO. 1991. Ergoclines and biological pro- cesses in high mountain lakes: Similarities between summer stratification and the ice-forming periods in Lake Red6 (Pyre- nees). Verh. Int. Ver. Limnol. 24: 1011-1015.
FELIP, M. 1997. Ecologia del microplancton d'un estany profund d'alta muntanya (Red6, Pirineus). Ph.D. Thesis. University of Barcelona.
, M. L. PACE, AND J. J. COLE. 1996. Regulation of planktonic bacterial growth rates: The effect of temperature and resources. Microb. Ecol. 31: 15-28.
, B. SATTLER, R. PSENNER, AND J. CATALAN. 1995. Highly
active microbial communities in the ice and snow cover of high mountain lakes. Appl. Environ. Microbiol. 61: 2394-2401.
GARRISON, D. L. 1991. Antarctic sea ice biota. Am. Zool. 31: 17- 33.
AND A. R. CLOSE. 1993. Winter ecology of the sea ice biota in Weddell Sea pack ice. Mar. Ecol. Prog. Ser. 96: 17- 31.
GONZALEZ, J. M., E. B. SHERR, AND B. F SHERR. 1990. Size-selec- tive grazing on bacteria by natural assemblages of estuarine flagellates and ciliates. Appl. Environ. Microbiol. 56: 583-589.
GRASSHOFF, K., M. EHRHARDT, AND K. KREMLING. 1983. Methods of sea water analysis, 2nd ed. Verlag Chemie.
GODE, H. 1989. The role of grazing on bacteria in plankton suc- cession, p. 337-364. In U. Sommer [ed.], Plankton ecology. Succession in plankton communities. Springer-Verlag.
HOLEN, D. A., AND M. E. BORAAS. 1991. The feeding behavior of Spumella sp. as a function of particle size: Implications for bacterial size in pelagic systems. Hydrobiology 220: 73-88.
JEFFREY, S. W., AND G. F HUMPHREY. 1975. New spectrophoto- metric equations for determining chlorophyll a, b, cl and c2 in higher plants, algae and natural phytoplankton. Biochem. Physiol. Pflanz. 167: 191-194.
JONES, H. G., AND M. OUELLET. 1983. Caracteristiques physico- chimiques et microbiologiques de la coverture de glace de qu- elques lacs. Eau Que. 16: 174-182.
KIRCHMAN, D. L. 1993. Statistical analysis of direct counts of mi- crobial abundance, p. 117-119. In P. E Kemp, B. E Sherr; E. B. Sherr, and J. J. Cole [eds.], Handbook of methods in aquatic microbial ecology. Lewis.
KOL, E. 1968. Kryobiologie. Biologie und limnologie des Schnees und Eises, I. Kryovegetation. E. Die Binnengewasser Band XXIV. Schweizerbartsche Verlagsbuchhandlung.
LOTH, B., H. E GRAF, AND J. M. OBERHUBER. 1993. Snow cover model for global climate simulations. J. Geophys. Res. 98: 10451-10464.
Moss, B. 1967. A spectrophotometric method for estimation of per- centage degradation of chlorophyll to phaeopigments in ex- tracts of algae. Limnol. Oceanogr. 12: 335-340.
PALMISANO, A. C., AND D. L. GARRISON. 1993. Microorganisms in Antarctic sea ice, p. 167-218. In E. I. Friedmann [ed.], Ant- arctic microbiology. Wiley-Liss.
, AND C. W. SULLIVAN. 1985. Growth, metabolism, and dark survival in sea ice microalgae, p. 132-146. In R. A. Homer [ed.], Sea ice biota. CRC.
POMEROY, L. R., W. J. WIEBE, D. DEIBEL, R. J. THOMPSON, G. T. ROWE, AND J. D. PAKULSKI. 1991. Bacterial responses to tem- perature and substrate concentration during the Newfoundland spring bloom. Mar. Ecol. Prog. Ser. 75: 143-159.
PORTER, K. G., AND Y. S. FEIG. 1980. The use of DAPI for iden- tifying and counting aquatic microflora. Limnol. Oceanogr. 25: 943-948.
ROBERGE, J., AND H. G. JONES. 1991. Subice layering and origin of acidic waters in a small boreal lake during the spring runoff. Water Resour. Res. 27: 479-492.
RODRiGUEZ, J., AND W. K. W. Li [EDS.]. 1994. The size structure and metabolism of the pelagic ecosystem. Sci. Mar. 58, 167 p.
SIMEK, K., AND T. H. CHRZANOWSKI. 1992. Direct and indirect ev- idence of size-selective grazing on pelagic bacteria by fresh- water nanoflagellates. Appl. Environ. Microbiol. 58: 3715- 3720.
SOURNIA, A. [ED.]. 1978. Phytoplankton manual. Unesco. SPINDLER, M. 1994. Notes on the biology of sea ice in the Arctic
and Antarctic. Polar Biol. 14: 319-324. STRICKLAND, J. D. H., AND T. R. PARSONS. 1968. A practical hand-
book of seawater analysis. Bull. Fish. Res. Board Can. 167, 311 p.
This content downloaded from 91.229.229.44 on Fri, 13 Jun 2014 21:22:31 PMAll use subject to JSTOR Terms and Conditions

Microbial assemblages on lake cover 987
TER BRAAK, C. J. E 1986. Canonical correspondence analysis: A new eigenvector technique for multivariate direct gradient anal- ysis. Ecology 67: 1167-1179.
. 1995. Ordination, p. 91-165. In R. H. G. Jongman, C. J. E ter Braak, and 0. F R. Van Tongeren [eds.], Data analysis in community and landscape ecology. Cambridge Univ. Press.
WIEBE, W. J., W. M. SHELDOM, AND L. R. POMEROY. 1992. Bac- terial growth in the cold: Evidence for an enhanced substrate requirement. Appl. Environ. Microbiol. 58: 359-364.
9 AND . 1993. Evidence for an enhanced sub- strate requirement by marine mesophilic bacterial isolates at minimal growth temperature. Microb. Ecol. 25: 151-159.
Received: 31 January 1997 Accepted: 5 January 1999
Amended: 19 February 1999
This content downloaded from 91.229.229.44 on Fri, 13 Jun 2014 21:22:31 PMAll use subject to JSTOR Terms and Conditions