template - drinking water quality management plan · web viewdrinking water quality management...
TRANSCRIPT

Drinking Water Quality Management
Plan
Guidance notes and template for drinking water Service Providers
September 2011

Explanatory notes
Introduction
A Drinking Water Quality Management Plan documents a risk assessment and management process and provides a basis on which to maintain (and improve) the safety of the supply of drinking water.
These guidance notes and templates have been developed to provide a structure that Drinking Water Service Providers (DWSP) may use to prepare a Drinking Water Quality Management Plan (Plan) to comply with the Water Supply (Safety and Reliability) Act 2008.
This document must be read in conjunction with the Guideline on the Preparation of Drinking Water Quality Management Plans, September 2010 (the Guideline) to ensure that all parts of each criterion have been addressed.
This document provides suggestions on how information may be presented in a plan and examples of the level of detail that may be required to demonstrate to the regulator that the criteria have been addressed. However, it does not replace the guideline and DWSPs must ensure their plan addresses all criteria detailed in the guidelines.
Layout of this document
Section heading–this document consists of six sections corresponding to each of the six requirements of the Act. Each section is further broken down into sub-sections that align with each criterion in the guidelines, as shown in the layout table on page iii.
Criteria–in each section, the criteria from the guideline that must be addressed in the plan have been copied into a grey-shaded box. Refer to the guideline for further information.
Tables and examples–where possible tables have been provided that may be used to assist in the collation of appropriate information. By populating the tables and including relevant information, the minimum requirements for approval should be met. Any example figures and entries in tables (in italics) provided in this document must be removed and replaced with information relevant to the scheme/s covered by the service.
Note: hazard identification and risk assessment have been combined into a single table because of the close linkages between these two steps in the process. DWSPs may choose to use individual tables for these sections if desired.
Some of the information required may already exist in other documents prepared by the DWSP, such as a Strategic Asset Management Plan (SAMP). Where this is the case, it is preferable that the material be copied into the Plan rather than cross-referenced.
The primary purpose of providing information on every part of each scheme is to support the hazard identification and risk assessment. This needs to be kept in mind when deciding what level of detail is necessary in the Plan.
Further assistance
The following documents contain additional explanatory information and worked examples that may be useful. These documents are referenced throughout these guidance notes.
Preparing a Drinking Water Quality Management Plan-Supporting Information Drinking Water Quality Management Plan Workshop Information Risk Management Improvement plan.
i
Table A–Example layout for plan
Act requirementsection headings
Criteria addressed in each section
Service provider (SPID & contact–Scheme operator if applicable)
Scheme details (name, communities
served, projected populations)
Schematics, source(s) and sourcing
infrastructure, treatment, disinfection,
distribution/reticulation
stakeholders
Catchment characterisation
Water quality information
Hazard identification and risk assessment team
Hazard identification
Stakeholders
Methodology (terms, process, acceptable risk level)
Risk assessment (maximum, mitigated and residual risks)
Uncertainty
Stakeholders
Existing and proposed mitigation/barriers/preventative measures
Operation and maintenance procedures
Management of incidents and emergencies
Risk management improvement program
Service wide support–information management
Operational
Verification (reportable)
ii
1.0 Registered service details
2.0 Infrastructure
3.0 Hazard identification
4.0 Risk assessment
5.0 Risk management
6.0 Monitoring
Submitting a Plan
The completed Plan should contain only the material relevant to the drinking water service to which the Plan applies.
Where existing plans or other documents are used to address all or part of any criteria, these must be included in the submission (e.g. as appendices to the Plan) and adequately referenced either in the text of the Plan, or using, for example, a table similar to Table B.
Table B – Example of how to reference existing documents, plans or information the drinking water quality management plan
Criteria/sub-criteria Document name/sectionInfrastructure Schematic Strategic Asset
Management Plan – Smallville WTP
Pages 10 and 11
Risk assessment Methodology HACCP Plan - Smallville WTP
Chapter 3, page 6
Operational monitoring Operating procedure - Smallville WTP
Appendix M
Ideally, service providers may wish to extract the relevant material from their existing Plans/documents and include this information in the drinking water quality management Plan.
Implementing a drinking water quality management plan
The success of a Plan will be proportional to the degree it is implemented as part of the day to day operation of the water supply. While the Plan should be made available to all relevant staff, operational experience suggests that there is a much greater chance of acceptance by operational staff where they are involved in the development and review of the operational aspects of the Plan and are provided succinct information from the Plan that is relevant to their particular work requirements.
Information in the following sections of a drinking water quality management plan would be relevant to an operator:
Schematic layout
Operation and maintenance
Operational monitoring and verification monitoring
Management of incidents and emergencies
Summary of water quality information
Relevant supporting documented procedures.
iii

Insert drinking water service provider logo
Insert Council nameService Provider No XXX
Drinking water quality management plan
Page 1 of 34
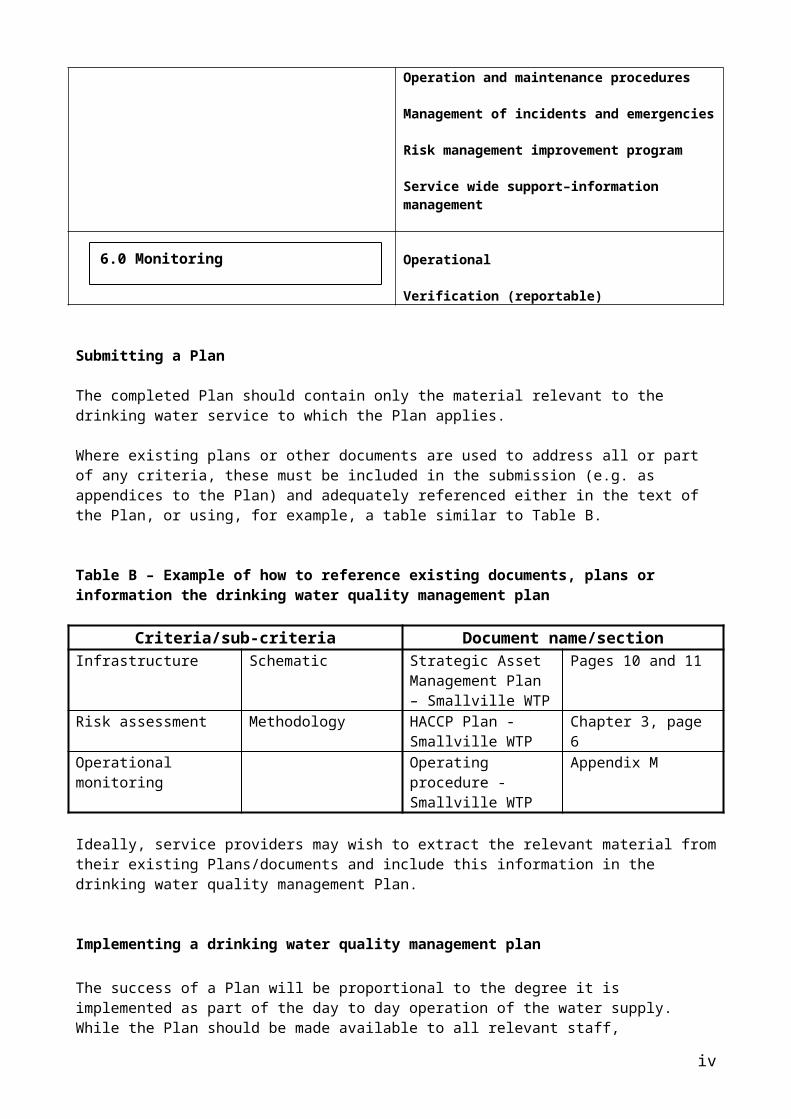
Table of Contents
Table of Contents 21.0 Registered service details 4
1.1 Application form.....................................................................................................41.2 Further information required..................................................................................4
Table 1.1 Listing of drinking water supplies..................................................................42.0 Details of Infrastructure for providing the service 5
2.1 Schematics............................................................................................................52.2 Source, treatment and distribution details..............................................................5
The workshop information bovington case Study–page 5–provides an example of a source, treatment and distribution summary that coul accompany table 2.1 below. 6
Figure 2.1 Service schematic layout.........................................................................6Figure 2.2 Treatment plant schematic......................................................................6Table 2.1 Infrastructure details....................................................................................7
2.3 Key stakeholders...................................................................................................8Table 2.2 Stakeholders.................................................................................................8
3.0. Identify hazards and hazardous events 93.1 Information gathering–water quality and catchment characteristics.......................9
3.1.1 Water quality information....................................................................................9Table 3.1 A Raw water source..................................................................................10Table 3.1 B Treated water........................................................................................11Table 3.1 C Reticulated water...................................................................................12Table 3.1 D Water quality complaints.......................................................................13Figure 3.1 Water quality information plot.....................................................................143.1.2 Catchment characteristics................................................................................15Table 3.2 Catchment characteristics........................................................................15
3.2 Hazard identification............................................................................................163.2.1 Identifying and documenting hazards and hazardous events............................16Table 3.3 Hazard Identification...................................................................................17Table 3.4 Hazard Identification, risk assessment and uncertainty............................183.2.2 Hazard identification (and risk assessment) team............................................19
4.0 Assessment of risks204.1 Methodology........................................................................................................20
Table 4.1 Defined acceptable risk levels.....................................................................214.2 Assessment of risk...............................................................................................21
4.2.1 Assessment of maximum risk...........................................................................214.2.2 Existing preventative measures/barriers..........................................................214.2.3 Residual risk.....................................................................................................224.2.4 Uncertainties....................................................................................................22
4.3 Key stakeholders and multiple providers.............................................................22Table 4.1 Stakeholders-risk assessment....................................................................23
5.0 Managing Risks 235.1 Risk management measures...............................................................................23
5.1.1 Existing preventative measures........................................................................235.1.2 Proposed preventative measures.....................................................................23Table 5.1 Existing and proposed preventative measures.........................................24
5.2 Operation and maintenance procedures..............................................................25Table 5.2 Operation and maintenance procedure documentation............................25
5.3 Management of incidents and emergencies........................................................26Table 5.3 Incident/emergency levels.........................................................................27Table 5.4 Management of incidents and emergencies..............................................27
Page 2 of 34
Table 5.5 Emergency contact details and protocols..................................................27Table 5.6 Risk management improvement program.................................................29
5.5. Service wide support–Information management..................................................30Table 5.7 Summary of water quality management information.................................30
6.0 Operational and verification monitoring programs 316.1 Operational monitoring.........................................................................................316.2 Verification monitoring.........................................................................................32
Table 6.1 Operational monitoring..............................................................................33Table 6.2 Verification Monitoring...............................................................................34
Page 3 of 34
1.0 Registered service detailsAct, Section 95(3)(b)(i)–State the registered services to which the Plan applies.
Criteria The Plan must contain information on the registered service, including the:
service provider identification number (SPID)service provider name and contact details. If the service provider is not the operator, then the operator’s name and contact details must also be providedname of each scheme to which the Plan appliesname of the communities that are supplied including the current and future (next 10 years) populations, connections and demands.
1.1 Application form
Each DWSP is required to provide its business details and basic information about the Plan when submitting it to the regulator for approval. It is a requirement under the Act that a completed approval application be submitted with the Plan. Completing and submitting this application is also the easiest way to address the majority of this criterion.
The Drinking Water Quality Management Plan, Approval Application form is available on the Department’s web site (https://www.dews.qld.gov.au/water-supply-regulations/drinking-water/forms-and-guidelines)
1.2 Further information required
Details clearly identifying ownership/operational responsibilities and the context of the supply in terms of current and future population and demand are required under this criterion. This information may be provided as follows:
Table 1.1 Listing of drinking water suppliesScheme
NameOperator
(organisation)Communities
ServedCurrent Projected in 10 years
Populationserved
Connections DemandML/d
Population served
Connections DemandML/d
Note: only list drinking water supplies. Do not include non-drinking supplies.
Page 4 of 34
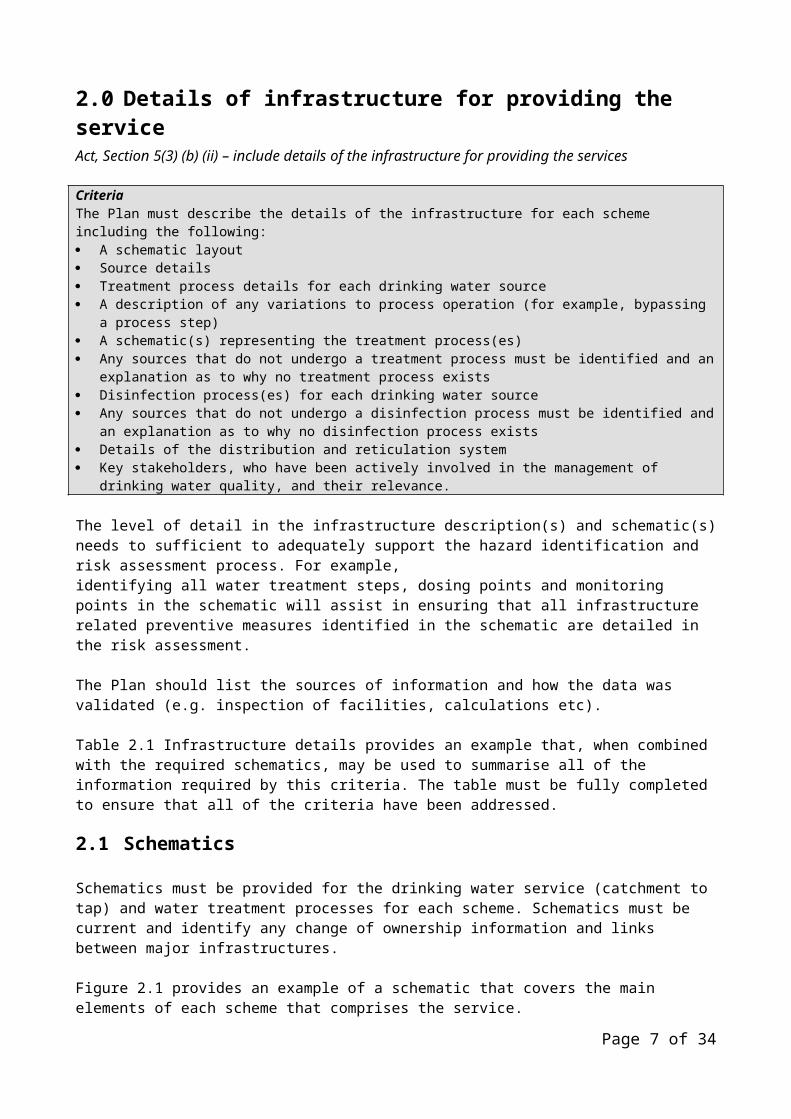
2.0 Details of infrastructure for providing the serviceAct, Section 5(3) (b) (ii) – include details of the infrastructure for providing the services
CriteriaThe Plan must describe the details of the infrastructure for each scheme including the following: A schematic layout Source details Treatment process details for each drinking water source A description of any variations to process operation (for example, bypassing a process step) A schematic(s) representing the treatment process(es) Any sources that do not undergo a treatment process must be identified and an explanation as to why no
treatment process exists Disinfection process(es) for each drinking water source Any sources that do not undergo a disinfection process must be identified and an explanation as to why
no disinfection process exists Details of the distribution and reticulation system Key stakeholders, who have been actively involved in the management of drinking water quality, and
their relevance.
The level of detail in the infrastructure description(s) and schematic(s) needs to sufficient to adequately support the hazard identification and risk assessment process. For example,identifying all water treatment steps, dosing points and monitoring points in the schematic will assist in ensuring that all infrastructure related preventive measures identified in the schematic are detailed in the risk assessment.
The Plan should list the sources of information and how the data was validated (e.g. inspection of facilities, calculations etc).
Table 2.1 Infrastructure details provides an example that, when combined with the required schematics, may be used to summarise all of the information required by this criteria. The table must be fully completed to ensure that all of the criteria have been addressed.
2.1 Schematics
Schematics must be provided for the drinking water service (catchment to tap) and water treatment processes for each scheme. Schematics must be current and identify any change of ownership information and links between major infrastructures.
Figure 2.1 provides an example of a schematic that covers the main elements of each scheme that comprises the service.
Figure 2.2 provides an example of a schematic for a treatment process.
Further examples of schematics are also provided in the Preparing a Drinking Water Quality Management Plan-Supporting Information (pages 5, 6 & 7) and the Bovington Case Study in the Drinking Water Quality Management Plan Workshop Information – Page 3 (water supply schematic) and Page 4 (treatment plant schematic).
2.2 Source, treatment and distribution details
Table 2.1 Infrastructure details provides an example that can be used to provide the information to address
Source details Treatment processes
Page 5 of 34

Disinfection processes Distribution and reticulation.
The Bovington Case Study in the Drinking Water Quality Management Plan Workshop Information on page 5 provides an example of a source, treatment and distribution summary that could accompany Table 2.1 below.
Figure 2.1 Example service schematic layout
Figure 2.2 Example treatment plant schematic
Page 6 of 34
Table 2.1 Infrastructure details Column 1
ComponentColumn 2Scheme 1
Sources Name Source 1Type Example: dam, weir, river intake, bore field% of supply
Reliability Example: does it run dry, unusable in wet weather
Water quality issues Example: blue-green algae, pesticides, fluoride
Name Source 2Type% of supplyReliabilityWater quality issues
Sourcing Infrastructure
Type (pumped/gravity/equipped bore/etc)
Description Example: intake location, bore depth, variable off-take
Are there any sources that do not undergo treatment prior to supply?
Yes NoIf yes,–list name of source and reason why it is not treated. For example, water is sourced from a deep bore and water quality information does not identify any water quality issues that require treatment.
Treatment plant A
Name
Process
Process comprises aeration, flocculation, clarification, filtration, and activated carbon. Activated carbon is only used during periods of blue-green algae outbreaks in the storage.
Design capacity (20 hour operation) ML/d Daily flow range ML/dChemicals addedStandby chemical dosing facilities (Y/N)
Water sourced from and percentage
Percentage of average day demand providedPercentage of scheme supplyDistribution area suppliedBypasses/variations
Treatment plant B(if applicable) Repeat as above
Are there any sources that do not undergo disinfection prior to supply?
Yes NoIf yes, list name of source and reason why it is not disinfected.
Disinfection LocationTypeDose rateTarget residual levelsDuty/standby
Page 7 of 34

Column 1Component
Column 2Scheme 1
Dosing arrangements Example: fixed, flow paced, residual analyserAlarms Example: failure, low/ high residual
Auto shut-off arrangements
Distribution and reticulation system
Pipe materialAge rangeApproximate percentage % of total lengthAreas where potential long detention periods could be expectedAreas where low water pressure (example < 12 m) could be expected during peak or other demand periods)
Reservoirs A Ground (No)
NameCapacity (ML)Roofed (Y/N)Vermin-proof (Y/N)Runoff directed off roof (Y/N)Elevated (No)NameCapacity (ML)Roofed (Y/N)Vermin-proof (Y/N)Runoff directed off roof (Y/N)
Water quality responsibility changes
Upstream location
Downstream location
Note: Repeat column 2 of the table for any additional schemes.
2.3 Key stakeholders
The Plan must discuss which stakeholders are involved in the management of drinking water quality, and how they have been engaged in the process of preparing the Plan. Stakeholders are any entity that could possibly increase/decrease water quality risks including catchment groups (land-holders, industries, etc), catchment land use planners/controllers, treatment chemical suppliers and providers of engineering services.
The Plan should also describe how customers and the community are involved in drinking water quality issues. This information may be provided as follows:
Table 2.2 Stakeholders
Organisation Contact name and details
Relevance to management of drinking
water quality
How the stakeholder is engaged in the drinking water quality
management plan
Page 8 of 34

3.0. Identify hazards and hazardous eventsSection 95(3) (b) (iii)–identify the hazards and hazardous events the drinking water service provider considers may affect the quality of the water to which the services relate.
A comprehensive analysis of health hazards that are likely to enter the potable water supply ensures DWSPs are aware of the types of public health impacts associated with their drinking water supply and provides a basis to ensure the subsequent risk assessment is realistic and relevant.
3.1 Information Gathering – water quality and catchment characteristics
Criteria The Plan must include a summary of the analysis and interpretation of available and relevant water
quality information. Where multiple providers are involved in providing the water supply, the above summary must to the
best of their knowledge, include relevant water quality information on the immediate upstream (for example, bulk supplier) and/or immediate downstream (for example, distributor) system(s).
3.1.1 Water quality information
Water quality information must include A summary of the information available An interpretation of the information available.
SummaryTables 3.1 A to 3.1C may be used to summarise the water quality data available. The list of parameters in the tables provides suggestions on the parameters to include. DWSPs should replace this list with a list of all the parameters that the DWSP actually monitors. DWSPs should also include summaries of historical water quality complaints, as shown in Table 3.1D, and any pre-existing water quality studies for example, catchment water quality studies).
Where the summary tables identify water quality concerns (for example, parameters that often exceed the Australian Drinking Water Guideline (ADWG) health guideline values, seasonal variations, values increasing over time), DWSPs should include simple plots of the parameters. Figure 3.1 provides an example of a simple plot.
These summaries can then be used as a basis to provide an interpretation of the water quality information. The summaries should also include information detailing responsibilities for obtaining and analysing (eg: laboratory used) water samples
InterpretationThe interpretation should build on the information from the summaries and be presented in a number of paragraphs that discuss exceedences, variations, abnormal results, low sample numbers, lack of sampling information, trends and potential water quality issues.
The Bovington Case Study in the Drinking Water Quality Management Plan Workshop Information contains an example of how to tabulate, plot and interpret water quality information on pages 6 to 14.
Where a service provider has minimal or no sampling data, the Plan should include, A summary of any known water quality characteristics
Page 9 of 34
Actions in the risk management improvement program to improve the knowledge of water quality.
Page 10 of 34

Table 3.1 A Raw water source
Source name and type (For example surface water/groundwater)
Parameter(examples) Sampling location Time
periodNo of
samples
Summary of results
Comments
Maximumvalue
Averagevalue
Minimumvalue
E.coli
Turbidity (NTU)pHIronManganeseAluminiumAlgae (by type)FluorideHeavy metalsABCArsenicCyanideSeleniumNitratesRadionuclidesPesticidesABCOther
Note: separate tables should be used for each source, however a borefield which draws water from the same aquifer can be considered as a single source.)
Page 11 of 34

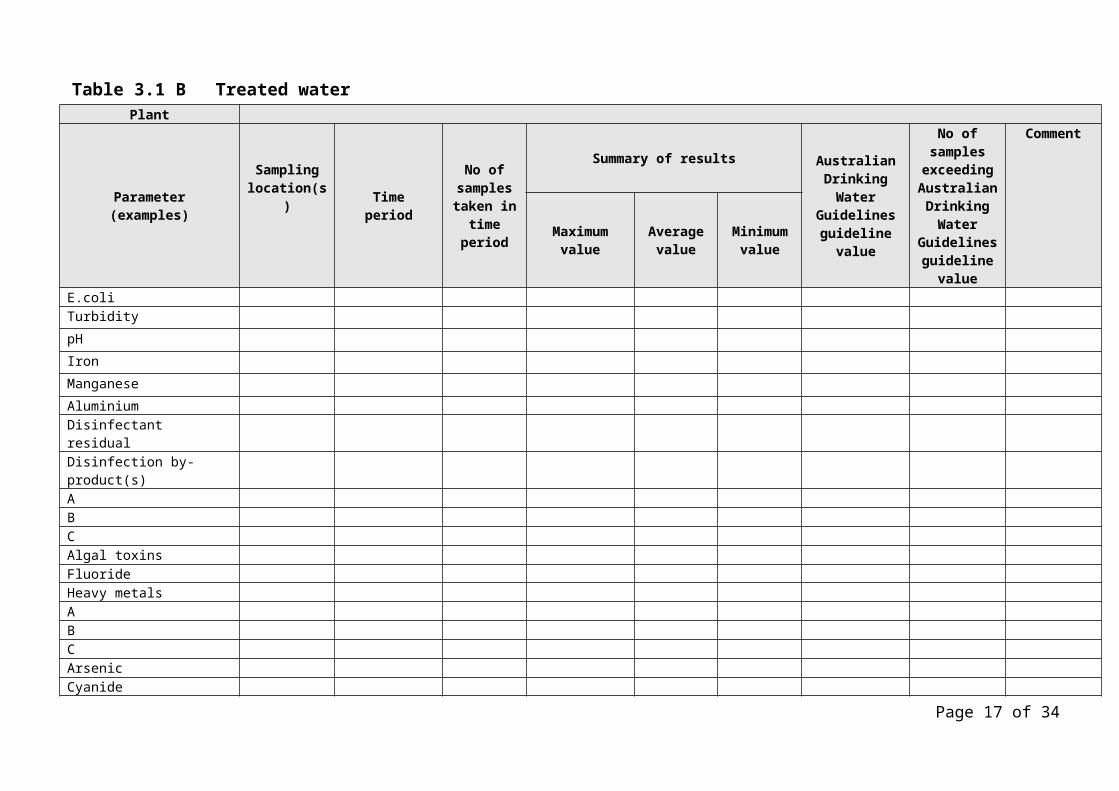
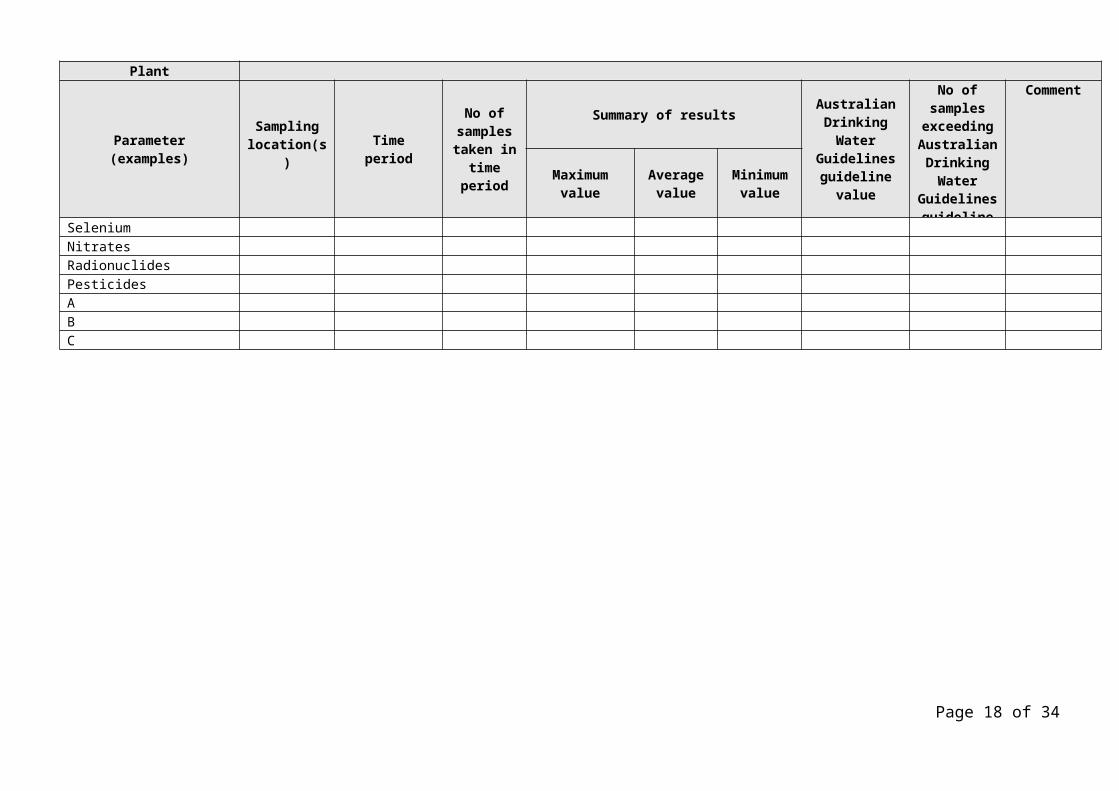
Table 3.1 B Treated waterPlant
Parameter(examples)
Sampling location(s) Time
period
No of samples taken in
time period
Summary of results Australian Drinking
Water Guidelines guideline
value
No of samples
exceeding Australian Drinking
Water Guidelines guideline
value
Comment
Maximumvalue
Averagevalue
Minimumvalue
E.coliTurbidity pHIronManganeseAluminiumDisinfectant residualDisinfection by-product(s)ABCAlgal toxinsFluorideHeavy metalsABCArsenicCyanideSeleniumNitratesRadionuclidesPesticidesABC
Page 12 of 34
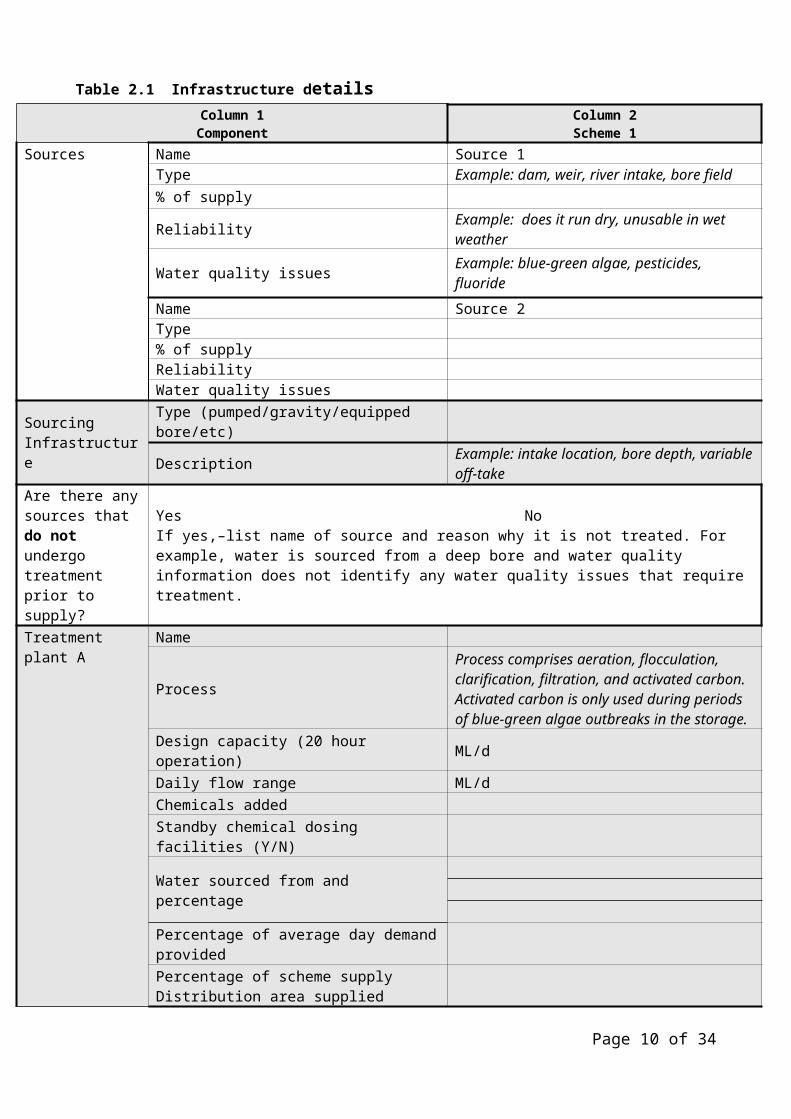
Table 3.1 C Reticulated waterScheme
Sampling Location
Parameter(examples)
TimePeriod
No of samples Summary of Results
Australian Drinking Water Guidelines guideline value
No of samples exceeding Australian Drinking Water Guidelines guideline value
Comment
Maximumvalue
Averagevalue
Minimumvalue
E.coliTurbidity pHIronManganeseAluminiumDisinfectant residualDisinfection by-products:ABCAlgal toxinsFluorideHeavy metals:ABCArsenicCyanideSeleniumNitratesRadionuclidesPesticides:ABCOther
Page 13 of 34
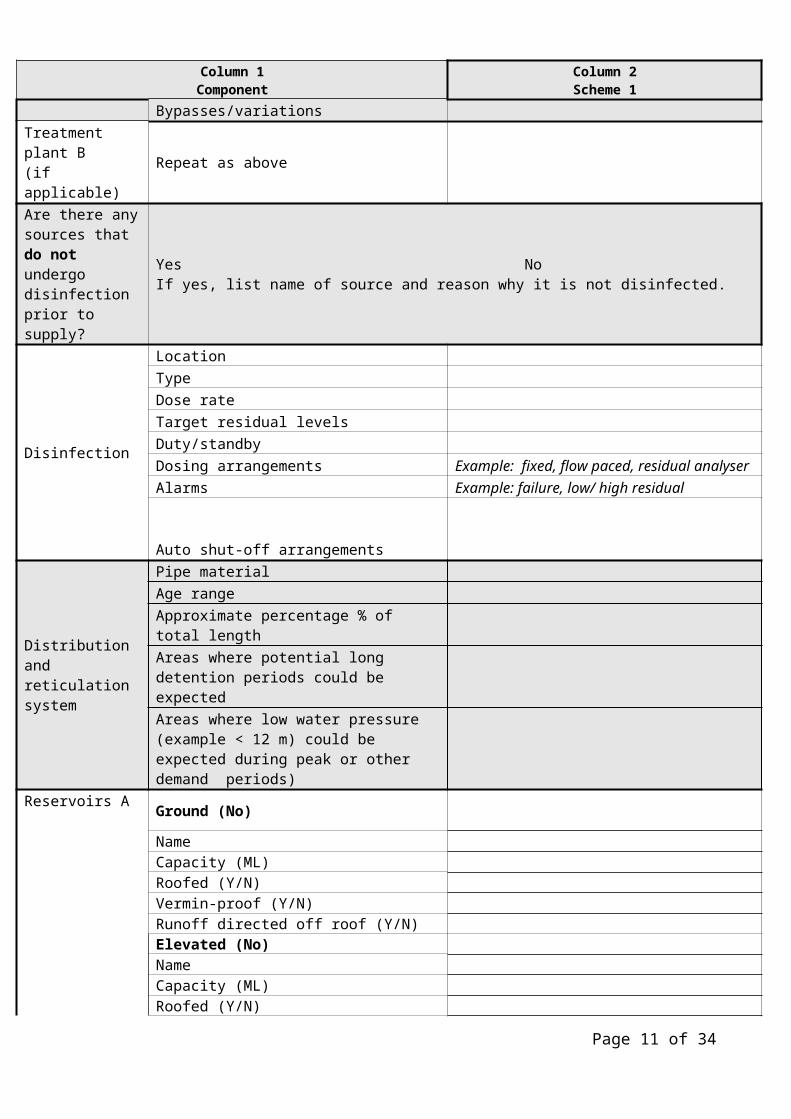
Table 3.1 D Water quality complaints
YearNumber of
water quality complaints
Water quality complaints per
1000 connections
Main reasons for complaints Likely sources/causes of problems Resolution of problem
- ………- ………..- ………- …………- ………..
- ………- ………..- ………- …………- ………..
- ………- ………..- ………- …………- ………..
Page 14 of 34
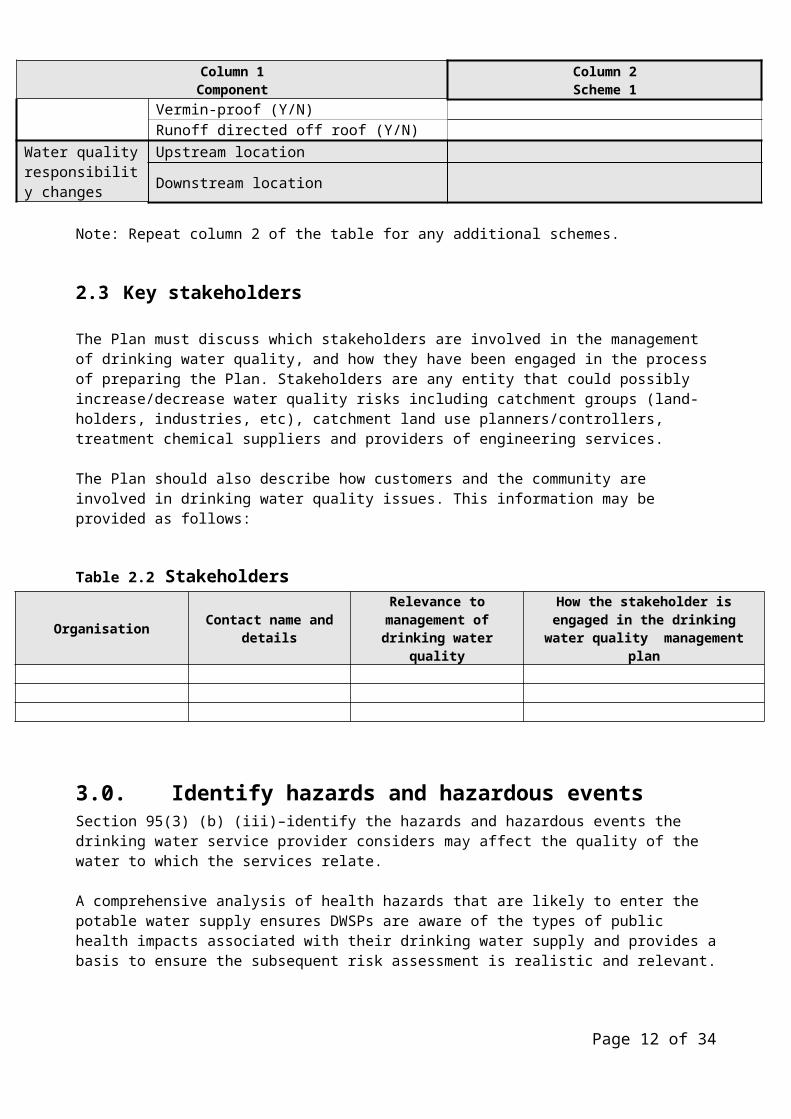
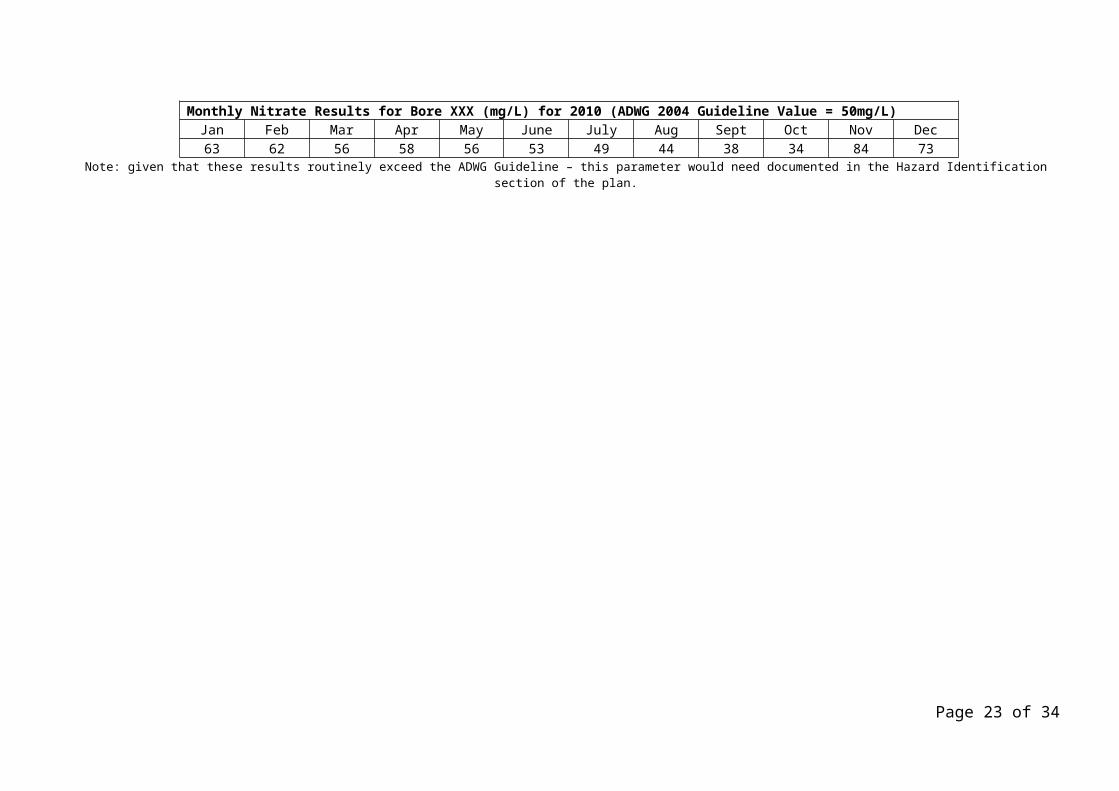
Figure 3.1 Example water quality information plot
Monthly Nitrate Results for Bore XXX (mg/L) for 2010 (ADWG 2004 Guideline Value = 50mg/L)Jan Feb Mar Apr May June July Aug Sept Oct Nov Dec63 62 56 58 56 53 49 44 38 34 84 73
Note: given that these results routinely exceed the ADWG Guideline – this parameter would need documented in the Hazard Identification section of the plan.
Page 15 of 34
Bore Raw Water Samples
0
10
20
30
40
50
60
70
80
90
Jan Feb Mar Apr May June July Aug Sept Oct Nov Dec
Month
Nitra
te -
mg/
L

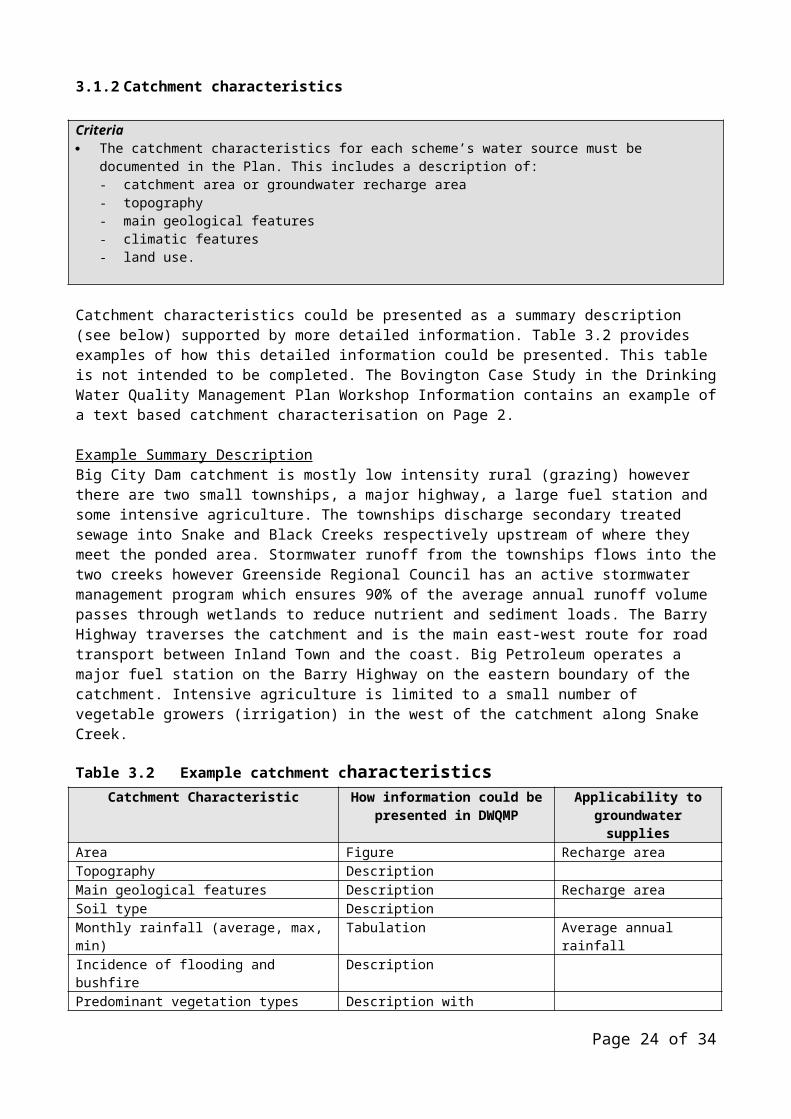
3.1.2 Catchment characteristics
Criteria The catchment characteristics for each scheme’s water source must be documented in the Plan. This
includes a description of:- catchment area or groundwater recharge area- topography- main geological features- climatic features- land use.
Catchment characteristics could be presented as a summary description (see below) supported by more detailed information. Table 3.2 provides examples of how this detailed information could be presented. This table is not intended to be completed. The Bovington Case Study in the Drinking Water Quality Management Plan Workshop Information contains an example of a text based catchment characterisation on Page 2.
Example Summary DescriptionBig City Dam catchment is mostly low intensity rural (grazing) however there are two small townships, a major highway, a large fuel station and some intensive agriculture. The townships discharge secondary treated sewage into Snake and Black Creeks respectively upstream of where they meet the ponded area. Stormwater runoff from the townships flows into the two creeks however Greenside Regional Council has an active stormwater management program which ensures 90% of the average annual runoff volume passes through wetlands to reduce nutrient and sediment loads. The Barry Highway traverses the catchment and is the main east-west route for road transport between Inland Town and the coast. Big Petroleum operates a major fuel station on the Barry Highway on the eastern boundary of the catchment. Intensive agriculture is limited to a small number of vegetable growers (irrigation) in the west of the catchment along Snake Creek.
Table 3.2 Example catchment characteristicsCatchment Characteristic How information could be
presented in DWQMPApplicability to
groundwater suppliesArea Figure Recharge areaTopography DescriptionMain geological features Description Recharge areaSoil type DescriptionMonthly rainfall (average, max, min) Tabulation Average annual rainfallIncidence of flooding and bushfire DescriptionPredominant vegetation types Description with approximate %
catchment area (if possible)Predominant land use Approximate % of total catchment
area)Yes
Urban settlements and population Tabulation Yes
Agricultural, industrial, mining and recreational activities
Description Yes
Planned future activities which may impact on water quality
Description Yes
Potential sources of microbial and chemical contamination in the catchment
Tabulation of source and likely contaminants
Yes
Include items tagged Y above in relation to the recharge area
As per above
Bore details – depth, aquifer description, aquifer depth and thickness, confined/unconfined, fast or slow response to events on surface
Tabulation
Borehead details to prevent contamination Description with a typical bore head layout arrangement
Page 16 of 34

3.2 Hazard Identification
Criteria The hazards and hazardous events and the sources of the hazards and hazardous events that could
adversely affect water quality must be documented in the Plan, including those affecting the:- catchment- sourcing infrastructure- treatment plants- disinfection process(es)- distribution system.
When multiple providers are involved, the Plan must to the best of their knowledge, include the hazards and hazardous events and the sources of the hazards and hazardous events associated with the operations and water quality management processes of the other entities’ systems which the provider considers could impact on the service.
Whole of service hazards and hazardous events and the sources of the hazards and hazardous events must be documented in the Plan.
The Plan must detail the personnel (i.e. position) responsible for the hazard identification and risk assessment process, their roles and responsibilities and how knowledge of the actual day to day operations of the scheme(s) has been included in this process.
Key stakeholders who have been actively involved in the hazard identification process, their role and rationale for inclusion must be documented in the Plan.
3.2.1 Identifying and documenting hazards and hazardous events
Hazards and hazardous events must be identified in the Plan and should be based on Information gathered in Section 2.2 - Source information Information gathered in Section 3.1.1 – Water quality information Information gathered in Section 3.1.2 – Catchment characteristics Hazards added through water treatment or reticulation such as treatment chemicals.
It is important to note that a hazard should not be excluded simply because a DWSP believes they have water treatment or other processes in place to remove this hazard as these processes are preventive measures and will be considered as part of the risk assessment.
To assist further with defining hazards and hazardous events that should be considered by all DWSPs, refer to the Preparing a Drinking Water Quality Management Plan-Supporting Information (pages 8 – 14) and Appendix A4 of the ADWG.
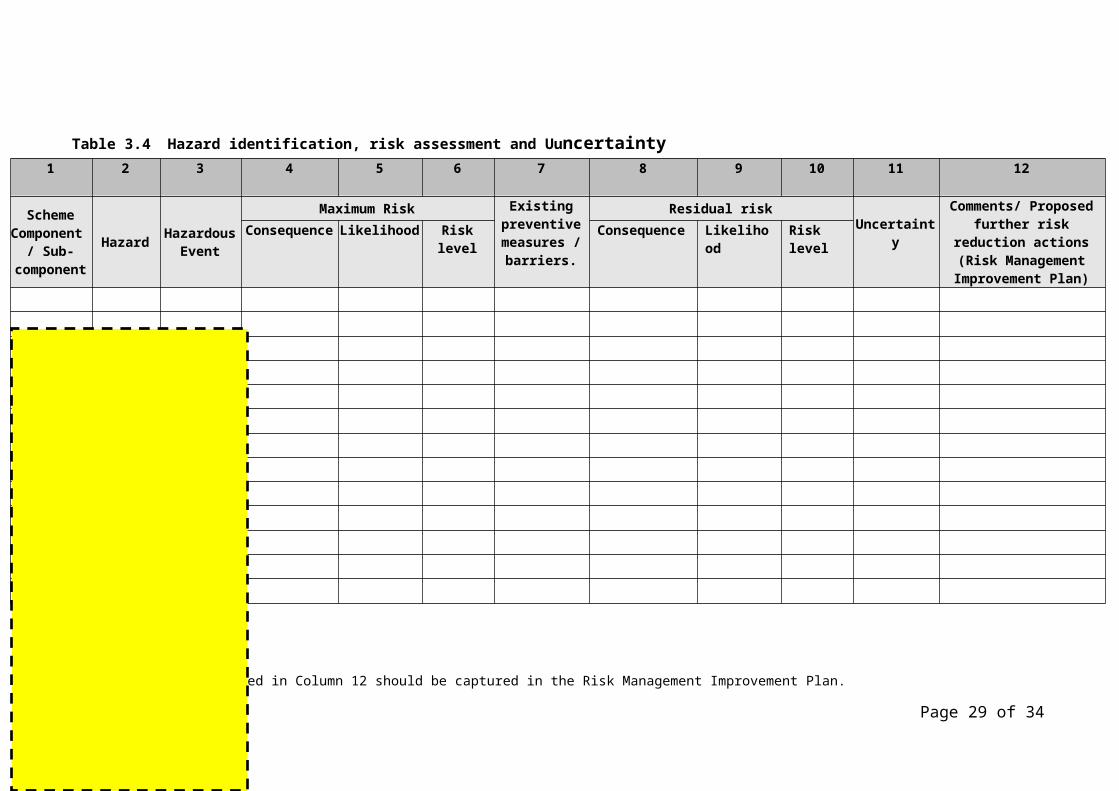
Hazards and hazardous events may be presented in a stand-alone table, (see table 3.3) or in a table that integrates hazard identification with risk assessment (see the highlighted section of Table 3.4). Table 3.4 will be used throughout the remainder of this document as an example for risk assessment and management. The Drinking Water Quality Management Plan Workshop Information Worked Examples includes two excel spreadsheets of a completed hazard and maximum risk table (hazards tab) and a completed risk assessment table (risk tab) based on Table 3.4.
Page 17 of 34

Table 3.3 Hazard identification
Note: physical hazards are generally not, in themselves, associated with impacts on health. However, they usually are an indication of the potential for one or more other classes of hazard, e.g. high turbidity is an “indicator” that microbiological hazards could persist through the treatment process if the turbidity is not adequately reduced.
Page 18 of 34
Class of hazard Hazard Hazardous EventWhat Where
Microbial
Pathogens Sewage discharge Source water
Chemical
Fluoride High levels naturally occurring
Source water - geology
Chlorine Overdose Treatment
Physical
turbidity Stormwater runoff Source waterpH
Radiological
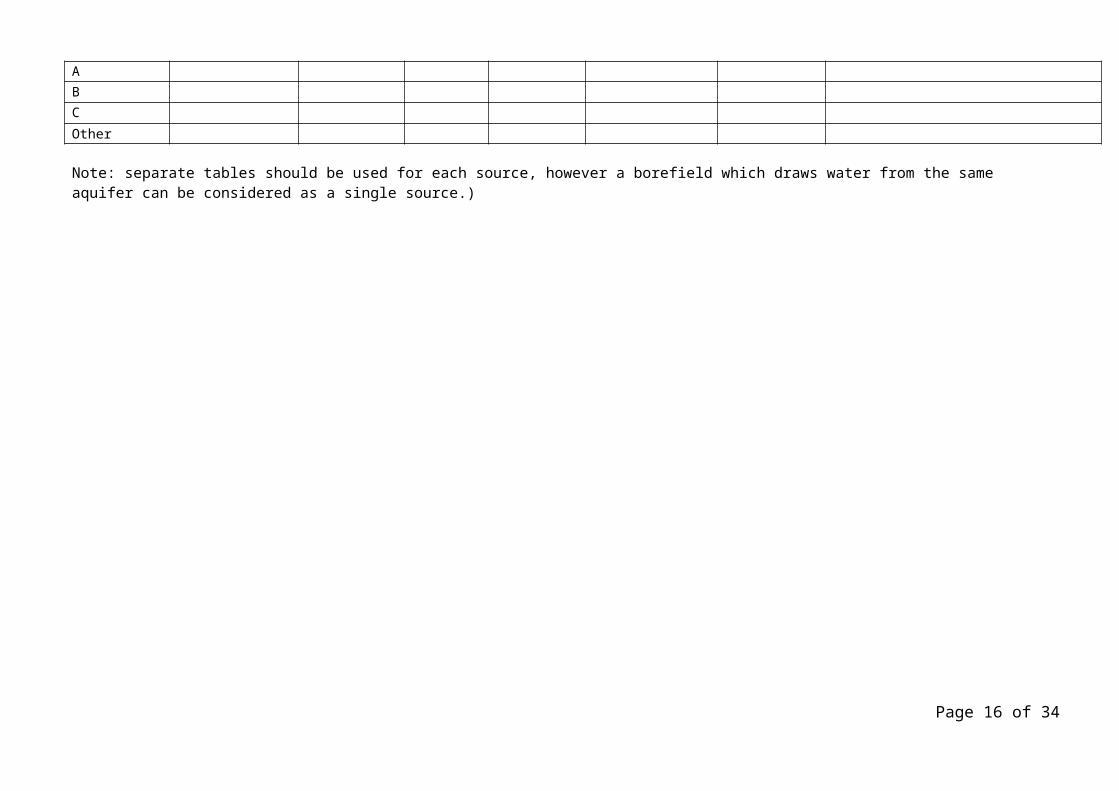
Table 3.4 Hazard identification, risk assessment and Uuncertainty1 2 3 4 5 6 7 8 9 10 11 12
Scheme Component /
Sub-component
Hazard HazardousEvent
Maximum Risk Existing preventive measures /
barriers.
Residual riskUncertainty
Comments/ Proposed further risk reduction
actions (Risk Management
Improvement Plan)
Consequence Likelihood Risk level Consequence Likelihood Risk level
Note: the actions listed in Column 12 should be captured in the Risk Management Improvement Plan.
Page 19 of 34
3.2.2 Hazard identification (and risk assessment) team
The Plan must detail the personnel responsible for the hazard identification and risk assessment process, their roles and responsibilities, and how knowledge of the actual day to day operations of the schemes has been included in the process. This information may be presented as follows:
Table 3.5 A Hazard identification and risk assessment teamParticipant (position)
Qualifications / expertise
Role in assessment
Knowledge of drinking water service
Experience in hazard
identification / risk assessment processes
Catchment
Dams and storage reservoirs
Water treatment plants
Distribution and reticulation
Alternatively, the following table could be used to provide the required information about the hazard identification and risk assessment team:
Table 3.5 B Hazard identification and risk assessment team (alternative)Typical job title for key
personnelWhat role did each person play
on the team?What expertise and system knowledge
did the person bring?
Page 20 of 34
4.0 Assessment of risksSection 95(3)(b)(iv)- include an assessment of the risks posed by the hazards and hazardous events.
Criteria The Plan must detail the risk assessment methodology used for each scheme including: Details of the risk assessment results for each scheme’s identified hazards and hazardous events must
be documented in the Plan, including: Key stakeholders who have been actively involved in the risk assessment process, their role and
rationale for inclusion must be documented in the Plan. Where multiple providers are involved, the Plan must, to the best of their knowledge, explain how the
relevant maximum and residual risk assessment results from other provider’s service(s) have been considered.
The following additional information has been provided to assist DWSPs to undertake an appropriate risk assessment.
The Preparing a Drinking Water Quality Management Plan-Supporting Information contains, on pages 15 - 18
A methodology for risk assessment including public health based consequence and likelihood descriptors
A matrix to determine risk level A list of example preventive measures Uncertainty descriptors (based on monitoring data).
The Drinking Water Quality Management Plan Workshop Information Worked Examples folder also contains;
A worked example of a complete risk assessment based on Table 3.4 from the Hazard Identification section above (Risk tab)
A complete risk assessment methodology including uncertainty descriptors based on health impacts and monitoring exceedences (Methodology tab
A risk management factsheet will also be provided separately that details ‘how to’ apply and use risk methodology.
4.1 Methodology
The methodology adopted for the risk assessment must be described. A recognised risk assessment framework or standard may be adopted (eg: AS/NZS 4360:2004; Australian Drinking Water Guidelines methodology); or the DWSP may choose to develop its own.
The description must include definitions for the (qualitative) likelihood and consequence descriptors adopted as well as a description of the approach to the overall process (for example, data collection and analysis, interviews and workshops).
The chosen methodology must be relevant to the public health risks associated with drinking water supplies. For example, a financial or environmental based risk assessment may not address specific public health impacts, however, the assessment of public health impacts may be combined into any existing risk assessments the DWSP may have, provided that it is suitable to assess and manage health based impacts. The chosen methodology should be applied consistently across the service.
Page 21 of 34

The DWSP must also indicate which level of risk it considers acceptable, and hence at which it would take no additional actions to further reduce the risk. Table 4.1 provides an example how to determine acceptable risk.Low risk (acceptable) – manage for continuous improvementModerate risk (unacceptable) - Implement short term measures, longer term risk
reduction measures may be implemented within a reasonable timeframe
High risk (unacceptable) – Implement short term measures immediately, longer term risk reduction measures need to be a priority
Very high (unacceptable) – Implement short term measures immediately, implementation of longer term risk reduction measures given top priority
Table 4.1 Defined acceptable risk levels
4.2 Assessment of risk
Details of the risk assessment results for each scheme’s identified hazards and hazardous events include:
maximum risk level or equivalent process (i.e. without existing barriers in place, eg: no treatment and/or disinfection)
existing preventive measures including multiple barriers (i.e. treatment process steps) residual risk level (i.e. with existing barriers in place for example, treatment and/or
disinfection) any uncertainties.
The following sections will discuss each of these dot points in further detail. Table 3.4 has been used as an example of how the dot points above can be addressed.
4.2.1 Assessment of maximum risk
For all hazards, maximum risk (for example, the risk from an uncontrolled hazard) must first be assessed. This helps to put into perspective the implications to the health of the population if the hazard is not removed or controlled. Where there is insufficient data or information to complete a reliable assessment, this should be highlighted as an uncertainty and discussed in the Risk Management Improvement Program.
Maximum risk assessment is assessed by completing columns 4, 5 and 6 of Table 3.4.
4.2.2 Existing preventative measures/barriers
All current preventative measures need to be listed in the risk assessment. Existing preventative measures include all actions, barriers or measures currently in place to reduce the maximum risk. They include all treatment steps, active measures that protect raw water quality prior to treatment and measures to protect treated water quality.
Existing preventive measures can be listed in Column 7 of Table 3.4. Further information regarding preventive measures will be addressed in Section 5 – Managing risks.
Note: water quality monitoring alone is not a preventative measure. Monitoring must be linked to a corresponding action (e.g. monitor for E.coli and isolate reservoir and flush mains when E.coli is detected in a sample. Undertake contamination investigation) for it to be listed as a preventative measure.
Page 22 of 34

4.2.3 Residual risk
The residual risk is determined once existing preventive measures have been applied. Residual risk is the level of risk a particular hazard is assessed as posing to the safety of the drinking water once the existing preventative measure/s have been applied.
Residual risk is determined using the same methodology for example, likelihood and consequence descriptors) as the initial maximum risk assessment, however changes to the assessed likelihood (or consequence) should result in a lower resultant risk level.
For any risks ‘deemed’ unacceptable (for example, residual risk is assessed as high and the residual risk that will be accepted by the DWSP is Medium or lower) information should be listed in column 12 of Table 3.4 that indicates what interim, short term and long term preventive actions will be taken in the future to manage and reduce these unacceptable risks. DWSP are responsible for managing any unacceptable residual risks and protecting public health. Where future preventive measures are proposed to manage an unacceptable risk, interim processes should be identified to manage the risk until a permanent management measure can be implemented. These activities are then discussed in further detail in Section 5 Managing Risks and the Risk Management Improvement Program (see Section 5.6).
Residual risk is assessed by completing columns 8, 9 and 10 of Table 3.4
4.2.4 Uncertainties
The quality of information underpinning the risk assessment can vary from very good to ‘not-so good’. Hence, whilst the risk assessment process described in this template (and the guidelines) is a ‘qualitative’ process, the confidence in the information that is used to determine each risk level is variable.
Assessing uncertainty provides an indication of the need to undertake further work or gather more data to ensure that the risk assessment is accurate and reliable. This work can be undertaken prior to the finalisation of the Plan or at a point in the future, in which case these activities should be reflected in the Risk Management Improvement Program (see Section 5.6).
Any uncertainties in the risk assessment should be detailed by completing Column 11 of Table 3.4. Uncertainty may be indicated by a descriptor or a ranking (for example, 5 = very certain; 1 = very uncertain).
4.3 Key stakeholders and multiple providers
Criteria continued(Stakeholders)
Key stakeholders, who have been actively involved in the risk assessment process, their role and rationale for inclusion must be documented in the Plan.
Where multiple providers are involved, the Plan must, to the best of their knowledge, explain how the relevant maximum and residual risk assessment results from other provider’s service(s) have been considered.
The Plan should discuss how key stakeholders were involved in assessing drinking water quality risks. This information could be incorporated into Table 2.2 or as an additional table, such as table 4.1.
Page 23 of 34

Table 4.1 Stakeholders - Risk assessment Stakeholder Contact name and details Rationale for engagement and how
engagement occurredDam owner Responsible for managing water
quality in the source water
Provided catchment water quality information for risk assessment
Treatment Plant Operator (multiple entity service)
Responsible for treating water from source
Provided copy of risk assessment table for consideration at risk workshops
5.0 Managing risksSection 95(3)(b)(v)- Demonstrate how the drinking water service provider intends to manage the risks posed by the hazards and hazardous events.
5.1 Risk management measures
Criteria The Plan must contain an overall list of all the existing and proposed preventive actions or measures
managed by the provider to achieve acceptable residual risks in the short and longer-term. Where the provider relies on an external organisation to manage a risk to their service, the Plan must
document what the preventive actions or measures are, and what arrangements are in place with the external organisation to ensure the measures remain effective.
In this section existing preventative measures detailed in Column 7 of Table 3.4 and the proposed preventive measures detailed in Column 12 of Table 3.4 should be considered in greater detail.
5.1.1 Existing preventative measures
Table 5.1 may be used to provide additional information regarding each of the existing preventive measures. Columns 1, 2, 3 and 7 of table 3.4 can be used to populate Columns 1 – 4 of table 5.1. Particular focus should be given to those preventive measures that are relied upon to manage extreme or high risks. Preventive measures undertaken by other organisations should also be included (for example, local landholders excluding cattle from source water during calving season).
5.1.2 Proposed preventative measures
The Plan should also provide a discussion on the proposed additional preventative measures necessary to reduce any unacceptable residual risks identified in the risk assessment to an acceptable level.
Column 12 of table 3.4 would already contain a summary of this information; however this should be expanded to include additional detail to support the results in the risk assessment. The expanded information should be detailed in column 8 of Table 5.1. Proposed additional preventative measures detailed in Column 8 will also need to be included in the Risk Management Improvement Program along with timeframes and responsibilities for their implementation.
Page 24 of 34

Table 5.1 Existing and proposed preventative measures
Column 1scheme
component / sub-
component
Column 2hazard
Column 3hazardous
event/s
Column 4What is/are the existing preventative measure/s?
Column 5Which risk
factor/s does the existing
preventative measure/s
impact on (i.e. likelihood &/or consequence)?
Column 6How effective is/are
the existing preventative
measure/s & on what basis has this been determined?
Column 7Is the level of residual risk accept-
able
Column 8Proposed measures
to reach an acceptable level or
residual risk
Column 9Responsible Work Unit/ Organisation (& arrangements
with external organisation if
applicable)
Solids removal
Protozoa Filter breakthrough
Filter effluent monitoring, operator attends within 30 minutes of out of spec notification, manually adjusts plant to ensure turbidity is below 0.5NTU
Likelihood Effective but reliant on manual intervention
Determined by fact that turbidity exceeds 1 NTU every few years. Operational procedure details actions and is reviewed regularly. Internal documentation details when issues have occurred and operator actions
No – high residual risk
On line instrumentation of each filter with automatic shut down - see Risk Management Improvement Plan
Page 25 of 34
5.2 Operation and maintenance procedures
Criteria The Plan must contain, for each existing preventive measure identified in the risk assessment as a
measure for achieving the documented residual risk, a list of the documented operation and maintenance (or other) procedures that are required to ensure the integrity of the measures, including:- title- date last revised- the process used for maintaining the documented procedures- the process for implementing the procedures.
Operation and maintenance procedures formalise the day to day activities necessary for the correct functioning of the water supply system and ensure that all preventive measures are effective in managing the identified risks. Whilst operation and maintenance procedures are usually developed to manage infrastructure or operational aspects of the service, these procedures may also address program areas such as stakeholder management or catchment management.
The Plan must demonstrate that the preventive measures identified in the risk assessment process and used to achieve the assessed residual risk are supported and managed by appropriate and documented operation and maintenance procedures. These procedures must be identified in the Plan, along with information about how they are managed and implemented.
The documented operation and maintenance procedures listed in the Plan should cover activities during both normal operations and abnormal events (eg: flooding). The Preparing a Drinking Water Quality Management Plan-Supporting Information contains examples of operational and maintenance procedures on pages 19 and 20.
The Plan must include Title Date of last revision The process used for maintaining the documented procedures (such as the teams involved
in the review, how the documents are accessed by relevant staff) The process for implementing the procedures.
This may be achieved through the use Table 5.2 below:
Table 5.2 Operation and maintenance procedure documentationScheme
Component / Sub-
component
Preventive measure managed
(where applicable)
Documented procedure
Version date
Position responsible
Process for implementing
the procedure
(Activity and Frequency)
Comments (including
where procedures are inadequate or
need updating)Treatment and Reticulation
Disinfection Calibration of chlorine units
June 2009
Manager Water Operations
Included in induction package – signed when read by operator and supervisor
Included in monthly job list for operators
Document needs to be updated to include reflect new chlorinator in reticulation – see Risk Management Improvement Program for details
Page 26 of 34
The Plan should also describe; How procedures were developed and the involvement of operational staff Processes to ensure that documented procedures are accepted and implemented by staff Processes for documentation review, update and distribution to relevant staff.
5.3 Management of incidents and emergencies
Criteria The process for managing drinking water incidents and emergencies must be described in the Plan,
including:incidents and emergenciesthe level of emergency (for example, green, amber, red or level 1, 2)summary of action(s) taken for each level including emergency contactsinternal and external communication processes and protocols , including those with other key stakeholders that are actively involvedresponsible positions.
When multiple providers are involved in providing drinking water, the Plan must explain how incidents and emergencies are managed between the entities.
The Plan will need to define the different levels of incidents and emergencies and how these are managed. Table 5.3 provides an example of how incident and emergency levels may be described, and how they might be interpreted while Table 5.4 provides an example of how specific incidents and emergencies are managed and who is responsible.
Consideration should be given to regulatory incident reporting and how to incorporate this into the Plan. Incident reporting will remain similar to current incident reporting requirements under the DWSP Monitoring and Reporting Notice.
The Plan must also include contact details of key people (internal and external) to be contacted in the event of an emergency and how staff is made aware of this information. This can be achieved by a listing similar to Table 5.5 which also includes communication protocols.
The Plan should also describe the following: The process for notifying the community and providing safe drinking water to customers
(particularly vulnerable customers) in the event of an emergency that results in unsafe water quality in the reticulation
The process for training employees for emergency situations The process and frequency of testing emergency response procedures How incidents and emergencies are investigated and protocols revised as necessary.
Page 27 of 34

Table 5.3 Incident / emergency levelsIncident /
Emergency level
Description of level(Possible examples follow: DWSP should include their own description of what
these levels mean)Level 5 Widespread outbreak of waterborne disease / Declared disaster / Supply unable to be maintained
/ Gross exceedences of ADWG health guideline values for a chemical parameter (e.g. more than five times the ADWG health guideline limit).
Level 4 High level of E. coli (e.g. > 5 CFU/ 100 mL) or any pathogens detected in reticulation / Failure of infrastructure (severe or emergency level supply restrictions required to ensure continuity of supply)
Level 3 Detection of 1-5 CFU/100 mL E. coli in reticulation / Failure of infrastructure (ability to supply water compromised – short term water restrictions may be required) / Minor exceedences of ADWG health guideline value for chemical parameter (determined value is close to guideline value).
Level 2 Failure of infrastructure or source supply (water quality or supply unlikely to be compromised) / alternate process available to provide drinking water / exceedences of ADWG aesthetic guideline (customer complaints possible)
Level 1 Exceedences of operational limit managed through operational and maintenance procedures
Table 5.4 Management of incidents and emergenciesLevel Incident or
emergencySummary of actions to be taken (with documented procedure listed)
Position/s responsible for Action/s
3 Detection of 1-5 CFU/100mL E.coli in reticulation
Alert Manager of Water
Determine potentially affected area, isolate if possible. Consider Boil Water alert. Escalate emergency further if situation worsens.
Report detection to OWSR by phone (Immediately by phone, written incident report – Part 1 incident form - within 24 hours)
Resample for E. coli and disinfectant residual in potentially affected infrastructure
Undertake comprehensive contamination investigation
Undertake necessary corrective actions
Upon resolution, provide written report to regulator (Part 2 incident form)
See Level 3 incident response protocol, pages 5-8 in ERP-0016
Water Quality Officer
Manager, Water Quality
Manager, Water Quality
Water Quality Officer
Treatment Plant Operator and Water Quality Officer
As appropriate
Manager, Water Quality
Table 5.5 Emergency contact details and protocolsDescription of incident/ emergency
Level Business unit / organisation
Contact person(s) details
Communication protocols
Note - Tables 5.4 and 5.5 could be combined.
Page 28 of 34

5.4 Risk management improvement program
Criteria The Plan, through the program, must describe the management measures proposed for each
unacceptable residual risk. The process for providing the relevant information to the regulator must also be described. The description must include:
measures, actions, strategies or processespriority for implementationtimeframeother factors, for example, responsibilities between the provider and third parties and/or other stakeholders.
A Risk Management Improvement Plan (RMIP) must be included in the Plan to demonstrate to the Regulator how a DWSP intends to
Manage any unacceptable residual risks identified by the hazard/risk assessment; Manage any gaps in the Plan and/or Improve those parts of the Plan where deficiencies in information (for example, catchment
characterisation or uncertainties in the risk assessment) did not allow the criteria to be completely and accurately addressed.
The RMIP may be in any form that is suitable to the DWSP but must; Outline the identified additional actions / management measures required in the interim,
short-term and long-term Indicate the priorities for each of the identified actions/measures Include the target dates for implementation.
Column 12 of Table 3.4 is likely to have identified instances where additional actions are necessary to mitigate residual risks that remain unacceptably high and Section 5.1.2 would contain further detail regarding these proposed preventive measures. These actions should be transferred to the RMIP and include further details of their proposed implementation. For example, to manage a high residual risk, a DWSP may implement interim procedures to closely monitor this risk, however, in the longer term a more permanent measure may be needed to reduce this residual risk. These procedures should be briefly discussed in Column 12 of Table 3.4 and Section 5.1.2 with the detail regarding which actions are interim, short or long term articulated in the RMIP, along with timeframes, priorities and responsibilities for their implementation.
Determining priorities for implementing aspects of the RMIP can be based on the level of risk being addressed and the historical performance of the scheme (for example, incidents, results of audits/reviews/studies/investigations, complaints, etc).
The RMIP must accompany the provider’s Plan and may include a wide range of measures or actions for improving the management of risks, such as;
Writing or updating operating procedures/protocols Skills and staff levels that need to be improved and updated Operational monitoring & process controls needing improvement or for improving the
DWQMP itself, such as:o Investigations, surveys or studies to better define risks;o Unknowns in the system description; and o Improved engagement with stakeholders.
In assessing a Plan, the Regulator will consider the DWSPs Risk Management Improvement Program and may place conditions on the approval of the Plan based on the DWSP implementing all, or key elements of the RMIP within the timeframes nominated. Table 5.6 is an example of how a Risk Management Improvement Plan could be presented.
Page 29 of 34

Table 5.6 Risk Management Improvement Program
Scheme component /
sub-component
Hazard/ hazardous
eventPriority
Action(s)Target date/s
Estimated cost(not required by
OWSR but important for DWSP)
Responsibilityinterim short-term long-term
Filters Insufficient filter capacity resulting in shorter run times during episodes of higher turbidity raw leading to break-through
Very high (Based on Existing Residual Risk Level)
More frequent backwashing and updating operational procedure to reflect change
Demand management.
Construct additional filter units
Interim – Sept 2011
Short term – Sept 2012
Long term action - Sept 2013
$550,000 Interim – operations manager
Short term –
Long term -
New Re-Chlorination point in distribution system.
Low residuals allowing re-growth in distribution
High (Based on Existing Residual Risk Level)
Flush mains on a schedule rather than ad-hoc. Schedule developed and included in operator task list
Operate town reservoir @ lower level to reduce residence times
Construct Re-Chlorination facility at town reservoir outlet
Long term action - Mar 2012
$45,000 Manager Asset Services
DWQMP N.A. Medium (Based on uncertainties in risk assessment)
N.A. N.A. Catchment Characterisation to improve accuracy of hazard identification and risk assessment
Nov 2012 $25,000
Operational & Maintenance Procedures
N.A High (based on large number of outdated / non-existent procedures
Identify outdated procedures, update and obtain approval and implement
Identify new procedures needed, develop and obtain approval and implement
Nov 2011 Staff time Manager Water Operations
Page 30 of 34

5.5. Service wide support – information Management
Criteria The Plan must describe the information management, record keeping and reporting processes relevant
to drinking water quality management, including how they address:accessibilitycurrencyrecord retention requirements.
The Plan must describe how all information related to the management of drinking water quality (for example, hardcopy and digital documents, spreadsheets and databases) is managed so that information is readily accessible, accurate, reliable, timely and up to date. Table 5.1 provides a suggested format for presenting the information.
Table 5.1 Summary of water quality management information
Information/document
Format(hardcopy / electronic)
Where stored(at WTP / on electronic
system / other)
Position responsible / business unit
Comments
Chlorine supply register
hardcopy WTP Senior operator (operations)
Chlorinator maintenance log
hardcopy WTP Senior operator (operations)
Alternatively, a DWSP may use its corporate document management system to manage drinking water quality management information, or it may have a system specifically dedicated to its water supply operations. In this case, it would be sufficient to describe in the Plan and document a reference to this system in Table B – How to reference existing documents, plans or information the DWQMP (page iii), how documents and information are managed and how these systems satisfy the need to make the information available to operational staff. For example:
Equipment operation manuals for Big City water treatment Plant are held electronically on the asset management database which is managed by Asset Services Group and is accessible by authorised users (including operators) on all networked PCs. Networked PCs are available in the WTP office and laboratory, Main St. depot and Big City Water office, Boundary St.
The Plan should also describe: The document control process to ensure that only current versions are in use Processes for routine internal and external (including regulatory) reporting Processes for incident and non-routine reporting (internally and externally.
Page 31 of 34
6.0 Operational and verification monitoring programsSection 95(3)(b)(vi) - include details of the operational and verification monitoring programs under the Plan including the parameters to be used for indicating compliance with the Plan and the water quality criteria for drinking water.
The Plan must describe the DWSPs routine operational and verification monitoring programs including the sampling process (location, transportation and analysis), parameters being monitored and frequency and management of excursions.
The Plan must also describe how the operational and verification monitoring programs are appropriate to the findings of the risk assessment (this can be achieved by clearly linking the hazards identified in the risk assessment with the chosen monitoring parameters and process step/monitoring location).
The Plan should describe how results are interpreted and communicated as well as the quality control measures and provide references to relevant documented procedures.
The Plan should also make the link between the data obtained from the monitoring programs and the information management system; as well as nominate the position(s) responsible for managing and implementing the monitoring program.
The Workshop Information Worked Examples folder contains a completed Monitoring Table that demonstrating the difference between operational and verification monitoring (Monitoring tab).
6.1 Operational Monitoring
Criteria The Plan must contain details of the operational monitoring program, including:
- a link to the process step or operational function- the parameter being tested- location of monitoring- frequency- summary of how excursions are managed and/or corrective action is taken.
The Plan must describe why the operational monitoring program is appropriate to confirm and maintain the effective operation of the existing preventive measures.
To address the above requirements, the Plan could provide a tabulation of all monitoring locations, parameters measured; target and critical levels and actions to be taken in the event that levels are exceeded (refer to Table 6.1 for a sample table). The frequency of sampling at each location and any other sample points should be tabulated including the sampling/analysis method (e.g. on-line, grab etc).
The Drinking Water Quality Management Plan Workshop Information Worked Examples folder contains a completed Operational Control Monitoring Table that provides an example of an operational monitoring program (operational control tab).
Page 32 of 34

6.2 Verification Monitoring
Criteria The Plan must contain details of the verification monitoring program including:
- the parameter being tested- location of monitoring- frequency- summary of how excursions are managed and/or corrective action is taken.
The Plan must also describe why the verification monitoring program is appropriate to confirm that the drinking water complies with the water quality criteria for drinking water (including the rationale for the choice of the parameters).
The Plan must detail the parameters to be monitored, monitoring locations, frequency to ensure compliance with drinking water quality criteria; and how excursions are managed as shown in Table 6.2.
The Plan should also explain the rational for the selection/variation of monitoring locations and describe the process for the long-term evaluation of trends in monitoring results and customer complaints.
DWSPs should be aware the verification monitoring program must be implemented and will be subject to incident reporting and any periodic (similar to quarterly reporting) reporting included in a condition of the Plan.
Page 33 of 34
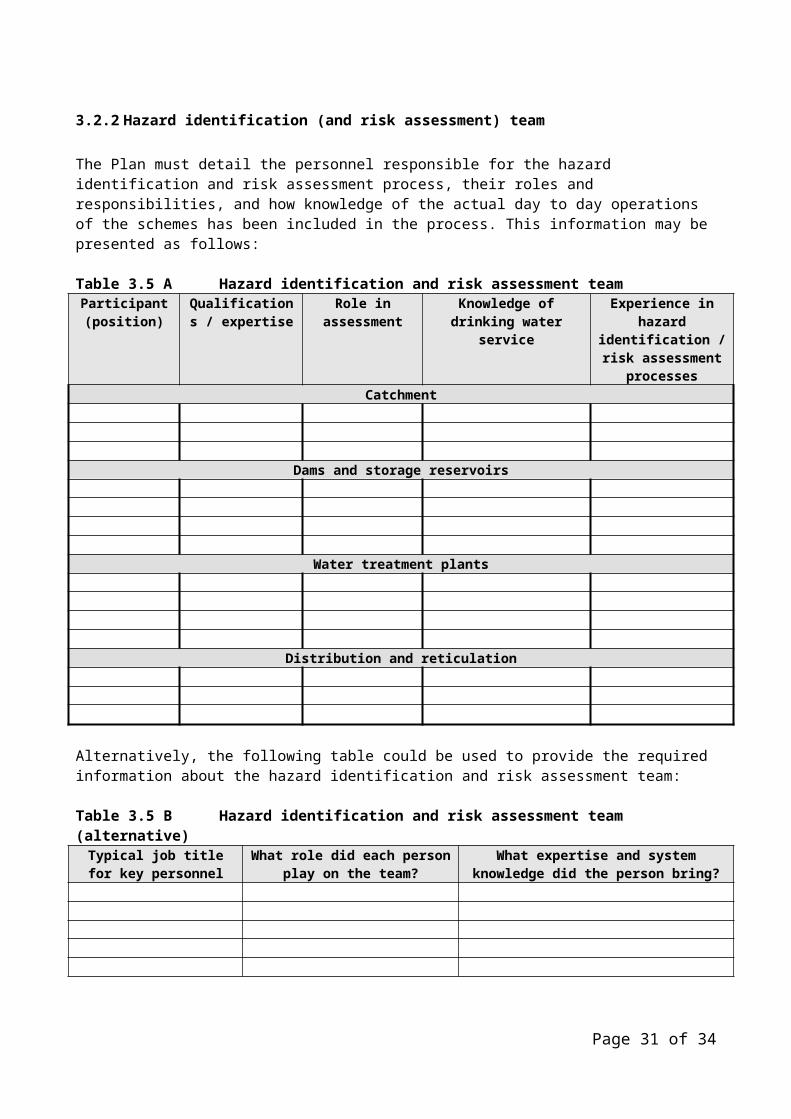
Table 6.1 Operational monitoring
Process Step / Critical Control Point / Location
in systemParameter Associated
hazard
SamplingTarget limit
Action if target limit exceeded
Critical limit Action if critical limit exceeded
Frequency Method Analysis
Page 34 of 34

Table 6.2 Verification monitoring
Parameter ADWG and/or regulation value Associated hazard
FrequencyAnalysing authority Response to exceedances
at treatment
plant outlet
In distribution
system
E.coli Nil detect Bacteria Weekly QHFSS Refer to incident management PlanNotify OWSR and complete incident reporting formsFollow operational procedure for flushing mains
Fluoride 1.5mg/L Fluoride Monthly QHFSS
Pesticides Various / No guideline value
Pesticides Six monthly QHFSS
Page 35 of 34