temperature dependence of the shock-induced reversal of martensite to austenite in an...
TRANSCRIPT
TEMPERATURE DEPENDENCE OF THE SHOCK-INDUCED REVERSAL OF
MARTENSITE TO AUSTENITE IN AN IRON-NICKEL-CARBON
ALLOY *
R. W. ROHDET
Shock compression experiments have been used to measure the temperature dependence from 25 to 390°C of the transition pressure associated with the reversal of martensite to austenite in an Fe-28.4 at. ‘A Ni-0.5 at. % C alloy. The transition pressure decreases nonlinearly from 67 kbar at 45°C to about 6 kbar a,t 390°C. Above 300°C the slope of the phase line is -0.25 kbar/“C, whereas below 250°C the slope is -0.14 kbar/“C. These data are analyzed by two thermodynamic procedures; (i) by assuming the reversal is an isothermal transformation, and (ii) by assuming that the reversal is an adiabatic trans- formation. The latter procedure provides the better fit to the data. Previous hydrostatic pressure measurements of the transition from 300” to 380°C are compared with the shock compression data. Although the temperature coefficients determined in the two separate experiments are the same, the transition pressure determined in the hydrostatic experiments is about 10 kbar lower than the tran- sition pressure determined in the shock experiments. This discrepancy is caused by a partial reversal of marten&e due to the presence of shear stresses in the shock compression experiments.
INFLUENCE DE LA TEMPERATURE SUR L’INVERSION, INDUITE PAR DES ESSAIS DE
CHOCS, DE L’AUSTENITE EN MARTEXSITE DANS L’ALLIAGE FER-NICKEL-CARBONE
Des expbriences de compression par chocs ont 6tB utilisees pour mesurer l’influence de la tempkrature, de 25 Q 39O”C, SUP la pression de transition associee B I’inversion de la martensite en austbnite dans un alliage Fe-28,4 ‘A at. Ni-0,5 oA at. C. La pression de transition diminue de fapon non linbaire depuis 67 kbar B 45°C jusqu’8 6 kbar environ B 390°C. Au-dessus de 300°C la pente de la ligne de changement de phase est, de -0,25 kbar/‘C, alors qu’au-dessous de 250°C elle est de -0,14 kbar/“C. Les auteurs analysent ces &&tats au moyen de deux processus thermodynamiques; (i) en supposant que l’inversion est une transformation isotherme et (ii) en supposant que c’est une transformation adiabatique. Le deux- i&me processus est en meilleur accord avec les r8sultats. Des mesures ant&ieures de la preasion hydroata.tique de la transition effect&es entre 300 et 380°C sont comparbes avec ces r6sultats. Bien que les coefficients de temperature d&ermines dans ces deux series d’expbriences soient les m6mes, la pression de transition dbterminee dans les experiences hydrostatiques est infbrieure de 10 kbar environ Q la pression de transition d&ermi&e dans les experiences de chocs. Ce d6s accord r&ulte d’une inversion par- tielle de la martensite due B la presence de contraintes de cisaillement apparaissant dans les experiences de compression par chocs.
DIE TEMPERATURABHbNGIGKEIT DER SCHOCK-INDUZIRTEN UMKEHR DER AUS-
TENIT-MARTENSIT-UMWANDLUNG IN EISEN-NICKEL-KOHLENSTOFF-LEGIERUNGEN
Mit Hilfe van &hock-Verformungsexperimenten wurde die Temperaturabhhngigkeit des mit der Riickwandlung von Martensit in Austenit verbundenen tfbergangsdruckes in einer Fe-28,4 At. % Ni- 0,5 At. ‘A C-Legierung zwischen 25 und 390°C gemessen. Der Ubergangsdruck nimmt van 67 kbar bei 45°C nicht-linear auf atwa 6 kbar bei 390°C ab. Die Steigung der Phasengrenze ist oberhalb 390°C -0,26 kbar/“C und unterhalb 250°C ist sie -0,14 kbar/“C. Diese Daten werden in ewei thermody- namischen Verfahren analysiert: Unter der Annahme, daB die Umkehr 1) eine isotherme Umwandlung und 2) eine adiabatische Umwandlung ist. Das zweite Verfahren liefert eine bessere Anpassung an die Daten. Friihere Messungen des tfbergangs unter Anwendung hydrostatischen Druoks zwischen 300°C und 380°C werden mit unseren &hock-Verformungsdaten verglichen. Obwohl die in den verschiedenen Messungen bestimmten Temperaturkoeffizienten gleich sind, ist der U‘bergangsdruck aus den hydro- statischen Experimenten etwa 10 kbar niedriger als der aus den &hock-Verformungsexperimenten. Diese Diskrepanz hat ihre Ursache in der teilweisen Rtickwandlung van Martensit als Folge der in den Schock-Experimenten auftretenden Scherspannungen.
1. INTRODUCTION
It is widely recognized that strain has an important
effect on martensite transformations. This effect has
been studied by a number of investigators(1-6) in
uniaxial tension, uniaxial compression and hydro-
static pressure experiments.
Shock-compression experiments have also been
utilized by a number of investigators(7-12) to study the
effects of rapidly applied stresses on phase transitions
in materials. In materials which exhibit a poly-
morphic transition under pressure a single shock wave
introduced into the specimen may separate into three
distinct waves: an elastic precursor, a plastic I or
* Received January 2, 1970. This work was supported by The U.S. Atomic Energy Commission.
t Sandia LaboratorIes, Albuquerque, New Mexico.
transition wave and a plastic II wave. The velocity
of the elastic precursor is characteristic of the dilata-
tional wave velocity of the material, and its amplitude,
the Hugoniot elastic limit (HEL), is a measure of the
shear strength of the material. Both the velocity and
the amplitude of the plastic I wave depend upon the
pressure-specific volume-temperature state associated
with the initiation of the phase transformation. The
velocity of the plastic II wave is dependent upon its
amplitude which is controlled by the input shock stress.
From measurement of the velocity and amplitude of
these various waves, considerable information about a
phase transformation may be obtained.
With shock loading techniques Loree et uZ.(~) have
determined that a phase transformation occurs in
_4CTA METALLURGICA, VOL. 18, AUGUST 1970 903

904 ACTA METALLURGICA, VOL. 18, 1970
martensitic iron-nickel alloys subjected to shock
compression. Subsequent experiments by Bowden
and Kelly (13) showed that the transformation caused
in a martensitic Fe30% Ni alloy by shock com-
pression experiments was the reversal of the b.c.c.
martensite to a f.c.c. austenite. This conclusion was
supported by experiments of Rohde et ~1.~~~) in a
similar alloy. These latter experiments also indicated
that the transformation was strongly influenced by
the shear stresses present in shock ccmpression
experiments.
We have previously reported measurements of the
effect of hydrostatic pressure from 1 bar to 20 kbar on
the reversal of martensite to austenite in an Fe;
28.4 at.% Ni; 0.5 at.?/, C allay.(6) These data were
analyzed on the basis of two different thermodynamic
hypotheses which have been advanced to explain the
effect,s of strain on martensitic transformations.(2-5)
One analysis assumes that the transformation occurs
isothermally while the other analysis assumes an
adiabatic transformation. Results of both the analyses
fit t’he data equally well so no conclusions could be
drawn as to which hypothesis was a better repre-
sentation of the transformation under hydrostatic
pressure.
In the present paper we report the results of shock
compression measurements of the reversal of mar-
tensit,e to austenite in an iron-nickel-carbon alloy
identical to the alloy used in the previous experi-
ments.(sJ4,15) The present shock compression experi-
ments were conducted over a temperature range of
25-390°C. The experiments were initiated with
two main goals: (i) to determine if the transition
pressures measured in shock compression experiments,
which introduce appreciable shear stresses into the
specimen, could be related to comparable hydrostatic
pressure data, and (ii) to determine the applicability
of the t’hermodynamic analyses over the wide tempera-
bure and pressure range available in shock com-
pression experiments.
In Section 2 the experimental procedure and method
of dat’a reduction are discussed and in Section 3 the
present shock compression data are compared with
previous hydrostatic pressure data. A brief outline of
the thermodynamic analyses is given in Section 4 and
the results of these analyses are compared to the
experimental data.
2. EXPERIMENTS
Material
Disc shaped shock compression specimens nomi-
nally 38 mm diameter and less than 7 mm thick were
fabricated from a commercially available iron-
nickel-carbon alloy.* The large diameter to thickness
ratio ensured that a state of uniaxial strain? existed
over the central area of the specimen for the duration
of the experiment (about 1 psec). The discs were
annealed at 650°C for 2 hr at a pressure of less than
1O-6 torr and furnace cooled. The specimens were
then transformed to martensite by quenching and
holding in liquid nitrogen for 168 hr. A metallograph
showing the structure of the martensitic material
has been published elsewhere.04) Previously re-
ported X-ray analysis indicated the initial material
contained 70-80 vol. o/0 martensite.04) This identical
alloy has been subjected to a number of independent
examinations(6*14*15) and shock compressibility and
thermal expansion measurements have been made for
both the austenitic and martensitic phases. These data
allow accurate computation of the volume change of
the transformation, a quantity needed in the thermo-
dynamic analyses.
Shock compression experiments
Shock loading was accomplished by impacting a
martensitic specimen disc with a disc of 304 stainless
steel mounted on the face of a projectile driven at
various velocities by means of a compressed gas gun.
A guard-ringed quartz gauge(l’n on the rear surface of
the specimen disc was utilized to observe the stress-
time profile of the waves transmitted through the
specimen. Nanosecond rise-time electronic circuitry
and oscilloscopes were used. Coaxial signal cables
using air dielectric were employed, and the signals
were displayed on Tektronix 585 oscilloscopes
equipped with fast rise time preamplifiers. The
limiting system rise time was about 7 nsec.
The experiments at room temperature were per-
formed in the conventional manner by encapsulating
the specimen and the quartz gauge in a lucite cup.05)
This assembly was then mounted on the muzzle of the
gas gun. Care was taken to keep the angular mis-
alignment between the faces of the specimen and
projectile discs at the time the impact to less than
4 >( 1O-4 rad. The time of impact of the projectile
upon the specimen was marked by the discharge of
charged coaxialized pins mounted flush with the
specimen. The transit time of the elastic wave through
the specimen was determined from the time of impact
and the time at the beginning of the quartz gauge
* Carpenter temperature compensator 30. The chemical analysis is: 28.4 et. % Ni; 0.50 at. % C; 0.45 at. % Mn; 0.20 at. 0/O Si; balance Fe.
t Uniexial strain refers to the loading condition where only the principal strain component parallel to the wave propagation direction is nonzero.

ROHDE: SHOCK-INDUCED REVERSBL OF MARTENSITE TO AUSTESITE 905
SPRING LOADED HEATING COllS CONNECTOR
SAMPLE
F = 304 STAINLESS FACING \
'QUARTZ GAUGE
3EQUALlYSPACED PORCELAIN SPACERS
FIG. 1. Schematic diagram of the elevated temperature shock compression experiments.
record. The accuracy of this wave velocity measure-
ment is about k 1.5 per cent.
A schematic of the heating fixture used in the
elevated temperature shock compression experiments
is shown in Fig. 1. Construction details of this fix-
ture have been presented elsewhere. The specimen
was heated to the desired temperature in about 6 mm
and held for about 3 min at that temperature to
reduce temperature gradients. Temperatures were
measured to f2”C and temperature deviations in the
specimen were less than 14’C from the mean. The
angular misalignments between the specimen and
the projectile discs in the elevated temperature
experiments were less than 6 x 1O-4 rad.
Since elastic wave velocities could not be determined
to better than 15 per cent in the elevated temperature
shock compression experiments, better wave velocity
data for the heated martensite was obtained by meas-
urement of the velocity of stress waves induced into
cylindrical rods from the energy deposition of a Q
switched laser. The experimental details are to be
published elsewhere.‘ls) Wave velocities measured by
the laser technique are accurate to 10.7 per cent.
For times less than the wave transit time of the
quartz disc, the instantaneous current output from
the gauge i(t), is related to instantaneous stress at the
front surface of the disc a,(t) by?@
i(t)2 a*(t) = __
k U,A (1)
where 1 is the initial thickness of the disc, A is the
area of the inner electrode, Uio is the shock velocity in
the quartz and E is the gauge piezoelectric factor,
which is slightly variable with stress. The shock
velocity and piezoelectric factor have been determined
at ambient, temperature(16) and at 300”C.(1g’ For the
experiments reported here at additional temperatures,
appropriate wave velocities and piezoelectric factors
were taken as values lying on linear extrapolations
between the 25” and 300°C data.* The elastic wave
amplitude in the specimen, onEL, was determined
from the quartz gauge record by the relation for
impedance mismatch between the quartz gauge and
the specimen
Data reductions Here Z is the shock impedance (the absolute magni- A quartz gauge record of the stress-time history at tude of the product of the wave velocity and density)
the specimen-quartz interface for an experiment at
203°C is shown in Fig. 2. Three distinct waves are * It is estimated that the maximum error introduced by
evident : the ramp-like elastic precursor, character- selecting U, and k in this manner is 1.5 per cent. For example, the zero stress piezoelectric factors determined by extrap-
istic of this material,‘14*15) the plastic I wave and the olation agree with the low signal ell/clt piezolectric coeffi-
plastic II wave. cients(e0B21) to better than 1 per cent over the entire temperature spectrum of 2%390°C.

906 ACTA METALLTTRGICA, VOL. 18, 1970
FIG. 2. Typical oscilloscope record of the quartz gauge output from an experiment at 203°C. The three wave structure is seen: with a ramp like elastic precursor, a transformation (plastic I) wave and the plastic II wave. Time increases from right to left. The sine wave at the top of the picture is a 25 MHz timing calibration. The
bottom sine wave is a voltage calibration.
and the subscripts s and q refer to the specimen and
quartz, respectively. This equation is exact while the
material behaves elastically. In order to determine
the plastic stress in the material, the stress-t’ime
profiles from the quartz gauge were approximated by a
series of small, incremental steps constructed about
the observed profile, and the impedance mismatch
equation solved by using the Hugoniot jump con-
ditions* at each step and allowing the density, the
shock velocity and the particle velocity of the material
to change at each step. The impedance of the quartz
was taken as a constant i.e. 152 kbar-pseclmm.
* The Rankine-Hugoniot jump relations expressing, respectively, the conservation of mass, momentum and energy across a shock front are:
AV u - ui -= ~__ Vi u - ui
1
where V is specific volume, gz is the stress component normal to the shock front, U is the laboratory shock velocity, u is the particle velocity and the subscript i denotes the state of the material ahead of the shock front under consideration.

ROHDE: SHOCK-INDUCED REVERSAL OF MARTENSITE TO AUSTEKITE 907
O/ TIME ljmcl
FIG. 3. The stress-time history of a specimen shock loaded at 203°C reduced from a quartz gauge record. Shown is the method of selecting the amplitudes of the elastic pre-
oursor and transition wave.
The absolute error in st.ress is estimated as 13
per cent for stresses in the quartz below 25 kbar.
For stresses in the quartz between 25 and 40 kbar the
error in stress is estimated as &5 per cent. The error
in the calculated specific volume is estimated as
A.2 per cent.
3. RESULTS
Figure 3 shows the stress-time profile of the waves
propagated through a shock-loaded specimen. The
method of defining the amplitudes of the HEL and of
the plastic I wave (the phase transition stress) is also
shown in t’his figure. The appropriate wave ampli-
tude was selected as the point of intersection of a line
drawn through the sharply rising wave front with a
line drawn through the more slowly increasing stress
region immediately following the wave front.* The
* The reliability of quartz gauges at stresses near 40 kbar in the quartz and the method of data reduction were confirmed by a shock compression experiment performed by Graham.lz2’ This experiment was conducted at room temperature on the identical martensite material. However, sapphire, which has been shown to be a reliable gauge to about 80 kbar, was used as a time resolved stress gauge.(23’ Also, the mechanical im- pedance of the sapphire is similar to the mechanical impedance of the iron-nickel alloy. Thus, the stress measured with the sapphire at the specimen sapphire interface differs only about 8 per cent from the stress in the sample. This is contrasted to the approximately 45 per cent difference encountered when using the quartz gauge. The transformation stress measured by Graham with a sapphire gauge is 65 kbar and is estimated accurate to *-5 per cent. This compares very favourably with the room temperature transformation stress of 70 kbar reported here by use of quartz gauges. The difference in the two values is well within the combined uncertainties of the two experiments.
transition stress data and other data defining the
initial conditions of each experiment are listed in
Table 1. Also shown in the table are the specific
volumes at the phase transition stress and the
dilatational wave velocities measured at room tem-
perature in the shock compression experiments and
from room temperature to 390°C by the laser tech-
nique. There is about a 2 per cent difference between
the dilatational wave velocity at room temperat)ure as
determined by the two techniques; however, this is
within the combined uncertainty of the two experi-
ments and is not considered significant. The dilata-
tional wave velocities determined here agree with the
measurements of Graham et aZ.d5) on an identical
material at ambient temperature. For consistency in
reducing the data, the dilatational wave velocities
determined by the laser technique were taken to be
the measured elastic wave velocity in the specimen.
Although there is considerable scatter in the value of
anEL determined in the various experiments this value
is clearly not dependent upon temperature. For shock-loaded iron aHEL has also been found to remain constant over the temperature range of -196°C to
3oo”c.(s5’
The time required to effect a polymorphic transition
is important if shock compression experiments are to
yield a unique measurement of the transformation
pressure. If the transformation time is long compared
to the duration of the experiment’, the transformation
stress will depart from its equilibrium value and no
unique transformation stress can be determined.(ls,‘Js)
Such behavior is characterized as being rate depend-
ent. If a transformation is rate sensitive the
measured transition stress will increase as the initial
shock compression stress increases. Rate effects also
cause the measured transition stress to decrease with
increasing wave propagation distance.(ls~ss) Two experiments were performed near 200°C to determine
if rate effects are important in the reversal of marten-
site austenite in the iron-nickel alloy. A 5.69 mm
thick specimen was initially shock loaded to 104 kbar
and a 6.36 mm specimen was shock loaded to only
70 kbar. Equal transformation stresses were deter-
mined for each of these experiments indicating that
rate effects were negligible.
The hydrostabic pressure at the start of the trans-
formation, P,, was determined from the transfor-
mation stress measured in the shock compression
experiments, eTT, by correcting for the effects of the
finite shear strength of the material. This was
accomplished by graphically solving the equation,@6)
P, = K*&, + (o,T - o,“) (3)

908 ACTA METALLURGICA, VOL. 18, 1970
TABLE 1. Initial shock compression data
Shot No. (mmT$ec) (k(Tbor) he w U.e VI+ WELg oxT"
(mm) (“C) (mm/Cc=) (cm3/gm) (kbar) (kbar)
494 0.624 115 6.388 25
495 0.606 110 6.370 25
502 0.623 115 5.673 102 506 0.581 105 6.343 154 503 0.579 104 5.690 203 507 0.365 70 6.358 202 5of, 0.425 75 6.360 251 504 0.360 68 6.366 300 544 0.432 77 5.900 322 543 0.464 84 5.901 345 542 0.460 82 5.950 390
5.15j 5.23k 5.16j 5.23s 5.26k 5.27’ 5.28s 5.28’L 5.27s 5.27k 5.24k 5.23s 5.22k
0.1245 11.0 70 0.1194
0.1245 11.9 71 0.1195
0.1247 9.5 59 0.1204 0.1250 11.0 53 0.1212 0.1252 11.5 41 0.1220 0.1252 8.9 47 0.1218 0.1254 12.2 39 0.1226 0.1257 11.0 30 0.1236 0.1258 8.0 26 0.1240 0.1259 10.5 20 0.1244 0.1260 10.0 < 101 0.1263
a-l?rojectile impact velocity. b-Impact stress. Estimated from the Hugoniot of the martensitic material as determined here and the Hugoniot (Ref. 24)
for 304 strainless. o,, is estimated accurate to 10 per cent. c-Specimen thickness at 26°C. d-Initial temperature. e-Dilational velocity. f-Initial specific volume. Measured directly at 25°C. Computed from thermal expansion measurements at all other tem-
peratures. g-Hugoniot elastic limit. h-Uniaxial strain transition stress. i-specific volume at beginning of transition. j-Dilational velocity measured in shook compression experiments. k-Dilational velocity measured in laser experiments. l-No wave was present between the elastic precursor and the final plastic wave. Therefore the transition began below the
10 kbar HEL. -
on the stress-strain curve of each experiment. Here
eA and a,” are the strain and stress at an arbitrary
point, -4, on the stress-strain curve where eHEL <
&A < &T* &EEL and eT are the strains at aHEL and
b,* respectively. The term K, is the shock com-
The temperature at the start of the transformation,
pression bulk modulus, the inverse of the shock
I3 I’, was calculated on the assumption of isentropic
compressibility, at point A. K, is assumed constant
compression by using the approximation,
between onEI, and P,.
6r = 8, exp{l?+} (4)
where 8, is the initial temperature and r is the zero
pressure Gruneisen coefficient.*
The transition pressure and temperature calculated
from equations (3) and (4) are reported for each
experiment in Table 2. Also shown in the table are
various shock compressibilities for the material
determined from slopes on the stress strain curves.
The compressibility of the martensitic phase before
onset of the transformation, PI, is independent of
temperature and has a measured value of 6.0 x lo-*
* The Gruneisen coefficient was calculated from the relation r = (V,u/KC,,) where B. is the initial specific volume, tc is the volume thermal expansion coefficient, K is the bulk modulus and C, is the specific heat. Values for V,, and K are reported in this paper, C,, values were taken from Ref. 27. Values for a are reported in Ref. 6.
kbar-l. This value agrees with previous shock
compression(r5) and low signal ultrasoni@) measure-
ments. The compressibility of the material measured
immediately after the onset of the transition, PM, is
pressure is shown in Fig. 4. Also shown in the figure
are the transition temperatures, determined in
also shown in Table 2. In those experiments where
previously reported hydrostatic experiments.@)
the final shock state was outside the mixed phase
region the value for FM is marked with an asterisk.?
The effect of temperature upon the transition
Between 50” and 250°C P, measured in the shock
compression experiments decreases linearly with
increasing temperature with a slope of -0.14 kbar
“C-l. Between 300” and 380°C the rate of decrease of
P, with temperature becomes 0.25 kbar “C-l. This
latter value is the same as the value for the tempera-
ture coefficient reported in the previous hydrostatic
pressure measurements over this temperature range.(s)
However, the absolutevalues of the transition pressures measured in the shock compression and hydrostatic
pressure experiments differ markedly. For example,
at 335°C the hydrostatic pressure experiments gave a
P, of 10 kbar while the P, from the shock experi-
ments was 23 kbar.
t A 6nal state outside the mixed phase region was assumed when the volume change calculated from the stress strain curve between the plastic I and plastic II waves exceeded the oaloulated volume change for the transformation.

ROHDE: SHOCK-INDUCED REVERSAL OF MARTENSITE TO Al-STENITE 909
__~ -___
Shot No.
TABLE 2. Shock compression transition pressure data
- Boa pTc BP (“C) (kber) (IO-’ kbar-i) (IO-%ar-1)
494 25 45 67 6.1 9.3 6.0’
495 25 45 67 ::; 8.9
502 100 122 56 506 154 171 :: t::
8.5* 9.3*
503 203 219 6.1 9.3* 507 202 218 45 6.0 8.9 505 251 268 37 504 300 316
f:
:.A 8.9 8.9
544 322 338 6:0 8.0* 543 345 353 3::: 6.1 8.1* 542 392 395 6.1 7.9*
a-Initial temperature. b-Temperature at initiation of transition computed by assuming isentropic shock heating. c-Hydrostatic pressure at initiation of transition. d-Adiabatic compressibility of martensitic phase determined from shock compression experiments. e-Adiabatic compressibility determined from the slope of the stress strain curve immediately behind the trans-
ition wave front. Values designated by an asterisk are likely for a final shock compression state outside the mixed phase region. This is indicated when the volume change between the transition wave and the final plastic wave exceeds the calculated volume change of the transformation.
f-As given in Ref. 15.
3wJ -
o SHOCK LOADING DATA
_ D HYDROSTATIC LOADING DATA
V HYDROSTATIC DATA 18% TRANSFORMATION
100
-I
I
\ -J
experiments by the occurrence of a three wave
structure as is shown in Fig. 2. In that case the
transition pressure is inferred from the amplitude of
the plastic I wave, with the assumption that the
transformation begins at the pressure associated with
that wave. At ambient temperature in this alloy
the transition stress obtained in the above manner is
about ‘70 kbar. However, it has been previously
shown that appreciable quantities of martensite
reverse to austenite even when this material is shock
loaded to a final state as low as 18 kbar.04) X-ray
analysis showed that as much as 18 per cent of the
martensite initially in the material transformed to
austenite at stresses below the 70 kbar “bulk”
transition stress. This partial reversal at stresses less
than 70 kbar did not occur in hydrostatic pressure
experiments and hence was attributed to shear stress
present in the shock compression experiments. Since
this partial reversal occurs below the pressure of the
transformation wave, the transition affected by t’he
plastic I wave is not characteristic of the initial
material but is characteristic of a material already
18 per cent transformed. Rightfully then, the shock
compression data should not be compared to hydro-
static data on a fully martensitic material but rather
to hydrostatic data on a material in the same partially
transformed state as is induced in the shock experi-
ments by the presence of shear stresses. Such a
comparison can be accomplished with hydrostatic
data by taking as the transition temperature t,he
temperature corresponding to an 18 per cent trans-
formation.@) These new data have been plotted in
PRESSURE P+kbar)
FIQ. 4. A comparison between the transition pressures determined in the shook compression experiments and transition pressures determined in previous hydrostatic pressure experiments. Also shown are the hydrostatic pressure data normalized to a material initially 18 per
cent transformed.
4. ANALYSIS
The difference in the transition pressures measured in
the shock compression experiments and the hydro-
static pressure experiments can be resolved by con-
sidering the effect of shear stresses which are present
in the shock compression experiments. In general a
phase transition is observed in shock compression

910 ACTA METALLURGICA, VOL. 18, 1970
Fig. 4, and am seen to agree with the shock cumpr~ssion data.
As mentioned previously, the effect of stress upon martensitic transformations has been treated by two different t,h~rmod~amic processes. In one process the transforn~ation is considered to be isothermal, while in the other the transformation is considered to be s.diabatic. In eit.her analysis, however, it is necessary to compute the work done by t’he applied stress on the transfo~ation strains. In the ease of previous hydrostatic measurements an adequate representation of this work term was obtained by considering the interaction of the gross volume change of the transit,ion with the applied pressure, assuming that the pressure remains constant during the transformation.‘“) It was not necessary to deter- mine t,he microscopic stress and deformation fields involvrkd in the transformation of a single martensite plate. Thus, considering only this macroscopic behavior, the work term, wI can be written:
w = P,AV”-;’ f W, (5)
here cc denotes the martensitic phase, y the austenitic phase, P&V”-’ is the gross work performed by the hydrostatic pressure, P,, on the volume change of the transformation A V"-'. The term w, represents the work performed by the shear stress on the macroscopic shear transformation strain where the shear stress is determined by the dnEL value. In the experiments reported here 6nEL and thus the shear stress is constant. By assuming that the shear strain is also constant, the term, w,, containing the work performed by the shear stress upon the shear strain is also a constant and need not be independently calculated. Since the degree of coupling between applied shear stresses and transformation shear strains is un- known(*s5) it is desirable to avoid an independent calculation of ~0,.
The volume change resulting from the reversal of martensite to austenite can be calculated if the initial specific-volumes, the thermal expansion coefficients, and the shock ~ompressibilities of both the martensitic and austenitic phases are known. Thermal expansion coefficients, initial densities and shock compressibility measurements at ambient conditions have been reported elsewhere for both the austenitic and martensitic phases.@=15) Furthermore, shock com- pressibility measurements have been determined in this work for martensite from 25 to 390°C. These latter measurements indicate that the compressibility of martensite is independent of temperature. Assum- ing that the shock compressibility of austenite is similarly independent of temperature and that the
thermal expansion of both phases is independent of pressure, allows calculations of the gross volume
change of the transformation over the temperature- pressure region of the experiments. As a first approxi- mation the specific volume of a shock compressed material, V(P, 6,) as a function of pressure and initial temperature can be written as.
where V,, is the initial specific volume of the material at ambient conditions and -- V~-~(~V~~P)~ = #?I and
V,_l( a V/8), = dt are respectively the shock com- pressibility and the volume thermal expansion coeffi- cient of the material. Values for V,,, PI and cc for martensite are given in Table 3.
TABLE 3. Volumetric constants of the martensitic and austenitic phases of the iron-nickel-carbon alloy used to calculete the effect pressure and temperature on the specific
volume
Volume thermal Shock Specific volume
V0 c( _=~~~~~~~~~~~~~~~~~,
(cm”/gm) (IO-w-‘) ( 1O-4 kba&) -.-
Martensits 0.12480 40.0 6.10 Austenite* 0.12235* 51.1* 6.71*
* Only applicable to the pressure temperature region above the Curie point of the austenite.
Calculation of the effect of initial temperature and pressure on the volume of the austenite is complicated somewhat by the presence of a second order ferro- magnetic to paramagnetic transition. However, the Curie temperat,ure decreases from 150°C at 1 bar to 25°C at 25 kbar, which simplifies the calculation. Since the martensitic transition always occurs when the austenite is above the Curie point (i.e. at 1 bar the transformation commences at about 385°C while at 25°C the transformation begins at, about 70 kbar), the only volume calculation necessary for the austenite is above the Curie point. This is easily accomplished by normalizing the compressibility and thermal expansion data above the Curie point to a specific volume characteristic of “param~netic” austenite at 1 bar and 25°C. This volume was selected by a linear extrapolation of the thermal expansion and com- pressibility data above the Curie point to room temperature and pressure conditions. Thus, above the Curie point, the specific volume of au&e&e may be given by an equation similar to equation (6). Values

ROHDE: SHOCK-IR’DCCED REVERSAL OF MARTENSITE TO AUSTESITE 911
for the normalized initial specific volume, the thermal expansion coefficient and the shock compressibility for austenite are given in Table 3. With the values in Table 3 the calculated volumes of the austenite and martensite fit the experimental data in both the 6(V) and P(V) planes to better than 1 per cent. Knowing V” and 1” allows calculation of the gross volume change associated with the transformation, AV’-y-
(PT, 6,) which can be written:
AV’-j’(P,, 0,) = -2.45 x lop3
- (5.96 x 10⁻⁶)PT (7)
+ (1.248 x 10⁻⁶)0,
where AVaTY(PT, 0,) is in cm3/gm, P, is in kbars and 8, is “C.
Isothermal considerations
Calculations of the effect of stress on martensitic transformations which assume that the reaction proceeds isothermally have found some success in predicting quasi-static strain rate and hydrostatic pressure data.(2s3*6) In these calculations it is assumed that (i) some fixed value of a thermodynamic driving energy, AF,, is required to initiate the transfor- mation, and (ii) this driving energy may be comprised of both the difference in chemical free energy between the austenite and martensite phases, AFa-Y, and the work performed by the applied stress on the trans- format,ion strains, W. Thus
AF, = AFa-? + w (8)
where w is given by equation (5). Since wT is a con- stant, equation (8) may be written:
AF,’ zz AF, - W, = AFa-Y + P,AV”-y (9)
APa-’ is obtained from the recent thermodynamic data of Rao et aZ.t2’) and AVaeY is calculated from
equation (7). Equation (9) may then be solved
graphically for the phase line in the manner given by
Kaufman.(2”) The best fit to the present data is found
when AF,’ = -233 Cal/mole. This value differs by
10 Cal/mole from the driving energy that was found
necessary to initiate the transformation under hydro-
static pressure conditions.@) A comparison of the
isothermal calculation with the experimental data is
given in Fig. 5. While the calculation is in quali-
tative agree:ment with the data, the calculated phase
line has less curvature than is necessary. In some
instances the predictions of the isothermal analysis have
‘\ ‘0
-\ --- CALCULATED PHASE LINE 'x0
\ 0 SHOCK LOADING DATA '\
V HYDROSTATIC DATA 18% TRANSFORMATION \
OL ’ I I / I I , I
0 10 20 30 40 50 60 70
PRESSURE PT Ikbar)
FIG. 5. Comparison of the transition pressure data as a function of temperature and a thermodynamic caloula- tion based on the assumption that the martensite reversal
is an isothermal process.
been made to more closely approximate the experi-
mental data by allowing AF,’ to vary monotonically with temperature. (3*2g) However, in the present case the data cannot be fit by selecting any monotonic
function for AF,‘.
Adiabatic considerations
Because of the very rapid rates in which marten-
sitic reactions have been observed to occur, the heat
generated by the transformation may have insufficient
time to escape, and some authors have suggested that
a martensitic transformation is more closely approxi-
mated as an adiabatic process than an isothermal
process.(4*5*30) For our considerations the transfor-
mation is assumed to occur adiabatically at constant
pressure. In this case the entropy and temperature
changes of the transformation are given by.(4*5JC’)
AS = ALP-y + C,Y In ‘AO/!
(10)
(wi + wJ - PTAV”-Y - AHz--y 1
where ALP-Y and AHa-? are respectively the chemical
entropy and enthalpy of the transformation, and CPY
is the constant pressure specific heat of the austenite.
The quantities ALP-Y, AH’-7 and CyP as functions of
temperature were obtained from the data of Rao et
aZ.(27) The term (wi + w7), analogous to AF,’ in the
912 ACTA METALLURGICA, X-CL. 18, 1970
E -\ \
0 \
: ‘\\ z '0 B LL 2cK
--- CALCULATED PHASE LINE '\
P 0 SHOCK LOADING DATA '\
\
V HYDROSTATIC DATA 18Z O\
TRANSFORMATION \ \ .
I 1 I I I I 1
0 10 20 30 40 50 60 70
PRESSURE PT (kbarl
FIG. 6. Comparison of the transition pressure date 8s 8 function of tempereture and the thermodynamic calcule- tion based on the essumption that the martensite reversal
is 8n adiabatic process.
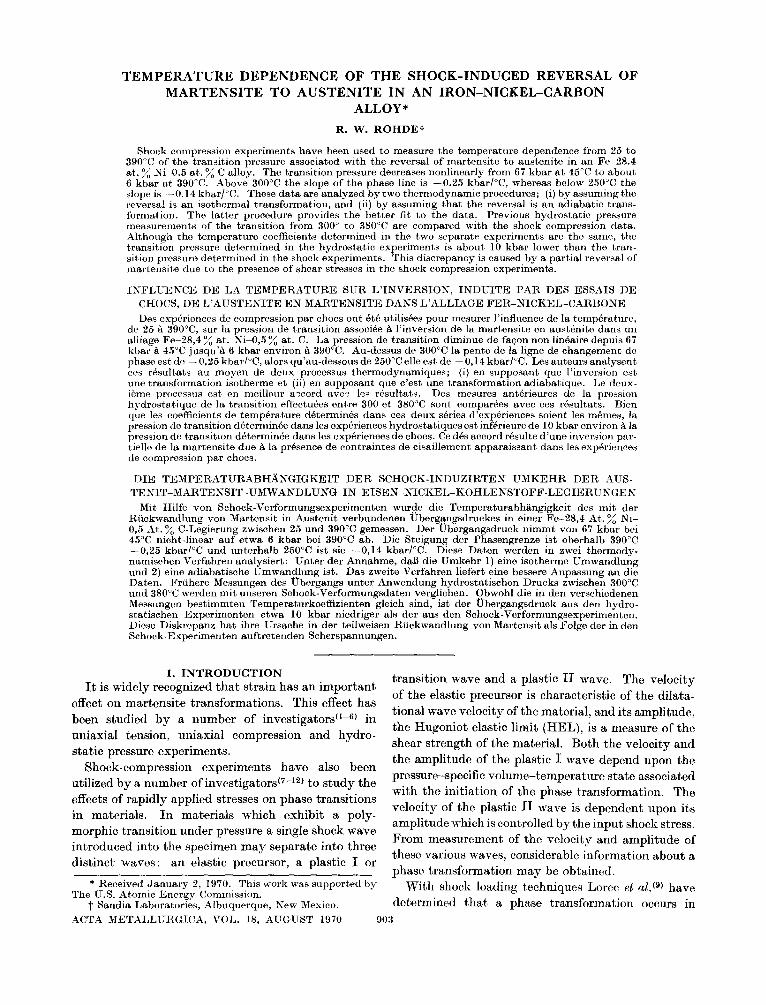
isothermal analysis, is the work required to initiate the transformation and is assumed to be constant. The process is assumed to be reversible so AS = 0 and equation (10) can be solved for initial tempera- tures, 8, and pressures, P,, which yield a zero entropy change. The phase line using AV-Y from equation (7) and (wp + 20,) as -215 Cal/mole is shownin comparison with the experimental data in Fig. 6.* This adiabatic calculation is in good agreement with the data, fitting all the data to within experimental error, and provides a significantly better description of the shock com- pression data than does the isothermal analysis. It is therefore concluded that the martensitic transfor- mation is best described by a reversible, adiabatic process.
5. SUMMARY
The transition pressure for the reversal of martensite to austenite in an iron-nickel alloy has been determined over the temperature range of 2%390°C by shock compression experiments. The transition pressure decreases nonlinearly from a 45°C value of 67 kbar to about 6 kbar at 390°C. Above 300°C the slope of the
* In these C8lCUl8tiO~ the volume chctnge of the trans- formation, A va- Y, was computed from the temperature 8t the initiation of the transformetion, 0~. This c8lCLd8ted volume chenge w8s not corrected for the isentropic change in tempere- ture associated with the transformation. Neglect of this temper8tUre COrreCtiOn results in about 8 3 per cent error in AV~-V which affects the calculeted pressure-temperature phase line by less than 1 per cent.
phase line is about -0.25 kbar/“C, while below 250°C the slope is -0.14 kbar/“C.
The shock compression measurements are compared with previous hydrostatic pressure measurements. Although the slopes of the phase lines determined by the two different techniques agree, at any given temperature the transition pressure measured in the hydrostatic experiments is about 10 kbar lower than the transition pressure measured in the shock com- pression experiments. This discrepancy is explained by noting that the elastic shear stresses in the shock compression experiments cause about 18 per cent of the martensite to reverse to austenite before arrival of the plastic I, transition wave.
Thermodynamic calculations of the temperature- pressure phase line were made first by assuming that the reversal proceeds as an isothermal transformation, and secondly by assuming that the reversal is an adiabatic reversible transformation. The adiabatic process provides a significantly better fit to the experi- mental data than does the isothermal process. It is therefore concluded that t,his martensitic reversal occurs adiabatically and thermodynamically revers- ible
6. ACKNOWLEDGMENTS
The author expresses his appreciation to R. A. Graham of Sandia Laboratories for many stimulating discussions and to T. L. Towne for his able assistance in performing the experiments.
1.
2. 3.
4.
5.
6.
7.
8.
9.
10.
11. 12. 13.
14.
15.
16.
REFERENCES
S. A. KULIN, M. COHEN and B. L. AVERBACH, J. Metals 4. 661 (19521. --- \----I
J. R. PATEL and M. COHEN, Acta Met. 1, 531 (1953). L. KAUFMAN, A. LEYENAAR and J. S. HARVEY, Progressin Very High Pressure Research, p. 90, Ed. by F. P. BUNDY, W. R. HIBBARD, JR. and H. M. STRONG. John Wiley (1960). R. J. RUSSELL snd P. G. WINCHELL, J. Net& 3, 22A (1968). R. J. RUSSELL. Ph.D. Thesis. Strain Induced Reversrti of Mitrtensite to’ Austenite ii Fe-Ni-C Alloys, Purdue University (1967). R. W. ROHDE snd R. A. GRAHAM, Trans. metaZ1. Sot. A.I.M.E. 245, 2441 (1969). D. BANCROFT, E. L. PETERSOS and F. S. MINSHALL, J. appl. Phys. 27, 291 (1956). T. R. LOREE, C. M. FOU~LER, E. G. ZUKAS and F. S. MINSEALL, J. appl. Phys. 37, 1918 (1966). T. R. LOREE, R. H. WARNES, E. G. ZUKAS and C. M. FOWLER, Science 153, 1277 (1966). R. E. DUFF and F. S. MINSHALL, Phys. Rev. 108, 1207 (1957). D. B. LARSON, J. appl. Phys. 38, 1541 (1967). R. H. WARNES, J. appl. Phys. 38, 4629 (1967). H. G. BOWDEN and P. M. KELLY, Acta Met. 15, 1489 (1967). R. W. ROHDE, J. R. HOLLAND and R. A. GRAHAM, Tram. metaZZ.Soc. A.I.M.E. 242, 2017 (1968). R. A. GRAHAM, D. H. ANDERSON and J. R. HOLLAND, J. appl. Phys. 38, 223 (1967). R. A. GRAHAM, F. W. NEILSON and W. B. BENEDICR, J. appl. Phys. 36, 1775 (1965).

17. T. L. TOWNE, Sandia Laboratories Report, SC-RR-68-831 (1968); and Rev. scient. Instrum 41, 290 (1970).
18. J. 4. BRAMMER and C. M. PERCIVAL, Exp. Mech. to be published.
ROHDE: SHOCK-INDUCED REVERSAL OF MARTESSITE TO AUSTENITE 913
19. R. W. ROHDE and 0. E. JONES, Rev. Scient. Instrum. 39, 313 (1968).
20. J. V. ATANASOFF and P. J. HART, Phys. Rev. 59,85 (1941). 21. R. K. COOK and P. G. WEISSLER, Phys. Rev.80.712 (1950). 22. R. A. GRAHAM, private communication. 23. R. A. GRAHAM and G. E. INQRAM, Behavior of Dense
Media Under High Dynamic Pressures, p. 469. Gordon and Breach (1968).
24. Los Alamos Scientific Laboratory Report LA-4167-MS
25. R. W. ROHDE, Acta Met. 17, 353 (1969). 26. 0. E. JONES and R. A. GRAHAM, NBS Symposium in the
Accurate Characterization of the High Pressure Environ- ment, Washington, D.C., October 14-18 (1968).
27. M. M. RAO, R. J. RUSSELL and P. G. WINCHELL, Trans. metaZZ.Soc. A.I.M.E. 239, 634 (1967).
28. E. P. PAPADAKAS and E. L. REED, J. appl. Phys. 32,682 (1961).
29. L. KAUFMAN, E. V. CLOUGHERTY and R. J. WEISS, Acta Met. 11, 323 (1963).
30. M. HILLERT, Acta Met. 6, 122 (1958).
- _ (1969).