temperature analyses of concrete frame bridges with …721068/fulltext01.pdf · temperature...
TRANSCRIPT

,DEGREE PROJECT, IN DEPARTMENT OF CIVIL AND ARCHITECTURAL ENGINEERING SECOND LEVELSTOCKHOLM, SWEDEN 2014
Temperature analyses of Concrete Frame Bridges with Finite Elements
SIAMAK ROUHANI
KTH ROYAL INSTITUTE OF TECHNOLOGY
DIVISION OF STRUCTURAL ENGINEERING AND BRIDGES


ROYAL INSTITUTE OF TECHNOLOGY / ÅF-INFRASTRUCTURE AB
Temperature analyses of Concrete Frame Bridges
with Finite Elements
Siamak Rouhani
May 2014
Supervisors The Royal Institute of Technology: Prof. Raid Karoumi ÅF-Infrastructure AB: Bertil Beck
Mahmoud Haghanipour

© Siamak Rouhani, 2014
Royal Institute of Technology (KTH)
School of Architecture and the Built Environment
Department of Civil and Architectural Engineering
Division of Structural Engineering and Bridges
Stockholm, Sweden, 2014

Abstract
FE-modeling is a rapidly spreading method to analyze structures nowadays. With this the
understanding of the outcome is of very high importance and potential inaccuracies are
important to find so that faulty and over dimensioning of the structure does not occur which
leads to unnecessary costs. One of these inaccuracies is the unrealistic sectional forces that occur
due to thermal effects in the transversal direction for concrete frame bridges which leads to an
excessive amount much reinforcement in the structure than actually needed. This has been
studied with several cases by using two approaches on how to apply the temperature in the frame
bridge, only in the superstructure and in the whole structure, but also by analyzing several
boundary conditions. By examining the results for the sectional forces and stresses one of the
temperature approaches could be disregarded because of the extreme values in the transition
between superstructure and support. But the other approach was much more useful because of
its better compliance with reality. With these results and by calculating the reinforcement needed
for the worst case, one model has been found to be the most favorable and can be used when
modeling concrete frame bridges with acceptable outcome. The study resulted in a model where
one applies a varying temperature on the whole structure, with spring boundary conditions over a
surface that represents the bottom slab.
Keywords: Finite Element, modeling, thermal effects, concrete, frame bridge, sectional forces,
reinforcement.

i

ii
Preface This master thesis is a final result of my master studies in Civil and Architectural Engineering at
the Royal Institute of Technology in Stockholm, Sweden. Alongside my final year I have been
working at ÅF-Infrastructure AB in their bridge division, more known as Konfem, with FE-
modeling and the dimensioning of reinforcement for mainly concrete frame bridges. The idea for
this thesis has been proposed by my colleagues Bertil Beck and Mahmoud Haghanipour.
A special thanks to them for their valuable input and advice but also to Prof. Raid Karoumi for
his guidance and Abbas Zangeneh Kamali for reviewing the master thesis.
Stockholm, May 2014
Siamak Rouhani

iii

iv
Table of contents
PREFACE ...................................................................................................................................... II
1 INTRODUCTION ................................................................................................................. 1-1
BACKGROUND ............................................................................................................................................ 1-1 1.1
OBJECTIVES AND LIMITATIONS ....................................................................................................................... 1-2 1.2
DISPOSITION OF THE REPORT ......................................................................................................................... 1-3 1.3
REVIEW OF PREVIOUS STUDIES ....................................................................................................................... 1-3 1.4
2 THEORETICAL BACKGROUND ............................................................................................. 2-5
THERMAL PROPERTIES BASED ON EC2 ............................................................................................................. 2-5 2.1
REINFORCEMENT BASED ON MAXIMUM ALLOWED CRACK WIDTH .......................................................................... 2-5 2.2
MINIMUM REQUIREMENT OF REINFORCEMENT ................................................................................................. 2-6 2.3
3 METHOD ........................................................................................................................... 3-7
BACKGROUND ............................................................................................................................................ 3-7 3.1
APPROACH ................................................................................................................................................ 3-7 3.2
3.2.1 Convergence study ....................................................................................................................... 3-9
4 STUDIED CASES ............................................................................................................... 4-11
STRIP STEP 2 ............................................................................................................................................ 4-14 4.1
BRIGADE/PLUS ...................................................................................................................................... 4-14 4.2
4.2.1 ConTeSt Pro ................................................................................................................................ 4-16
4.2.2 Observed sections ....................................................................................................................... 4-19
5 RESULTS .......................................................................................................................... 5-21
SECTIONAL FORCES .................................................................................................................................... 5-21 5.1
STRESSES ................................................................................................................................................. 5-25 5.2
REINFORCEMENT ...................................................................................................................................... 5-27 5.3
6 DISCUSSION AND CONCLUSIONS ...................................................................................... 6-29
GENERAL ................................................................................................................................................. 6-29 6.1
DISCUSSION ............................................................................................................................................. 6-29 6.2
CONCLUSIONS .......................................................................................................................................... 6-30 6.3
SUGGESTIONS FOR FUTURE WORK ................................................................................................................ 6-30 6.4
7 REFERENCES .................................................................................................................... 7-33
APPENDIX A - CALCULATIONS .................................................................................................... A-1
A.1 SPRING STIFFNESS ........................................................................................................................................... A-1
A.2 CONTEST PRO ............................................................................................................................................... A-2
APPENDIX B - FORCES AND STRESSES ......................................................................................... B-1
B.1 HIGH TEMPERATURE ....................................................................................................................................... B-2
B.1.1 Endsection ......................................................................................................................................... B-2
B.1.2 Quarter section (L/4) ......................................................................................................................... B-6
B.2 LOW TEMPERATURE ...................................................................................................................................... B-10
B.2.1 Endsection ....................................................................................................................................... B-10
B.2.2 Quarter section (L/4) ....................................................................................................................... B-14
B.3 TEMPERATURE GRADIENT PLUS ....................................................................................................................... B-18
B.3.1 Endsection ....................................................................................................................................... B-18
B.3.2 Quarter section (L/4) ....................................................................................................................... B-22
B.4 TEMPERATURE GRADIENT MINUS .................................................................................................................... B-26

v
B.4.1 Endsection ....................................................................................................................................... B-26
B.4.2 Quarter section (L/4) ....................................................................................................................... B-30
APPENDIX C - REINFORCEMENT ................................................................................................. C-1

vi
List of abbreviations
2D = Two-dimensional
3D = Three-dimensional
EC = Eurocode
FE = Finite Element
FEM = Finite Element Methods
TRVFS Bro = The Swedish Transport administrations Statutes for Bridges
TRVK Bro = The Swedish Transport administrations Technical Requirements for Bridges
TRVR Bro = The Swedish Transport administrations Technical Advice for Bridges
SLS = Serviceability Limit State
ULS = Ultimate Limit State

vii

viii
List of notations
Area [m2]
Cross sectional area of concrete in the tensile zone [m2]
Minimum area of steel reinforcement [m2]
Width of the casting during one stage [m]
Mean width of the tension zone [m]
Concrete content [kg/m3]
Cover to the longitudinal reinforcement [m]
Effective depth of a cross-section [m]
Modulus of elasticity for reinforced steel [Pa]
Mean value of the concrete tensile strength effective when the cracks may first be expected to occur
[Pa]
Mean value of axial tensile strength of concrete [Pa]
Characteristic yield strength of reinforcement [Pa]
Height of the bridge in BRIGADE/Plus [m]
Height lower edge of superstructure [m]
Height lower edge of bottom slab [m]
Constant depending on the material used [-]
Constant [-]
Constant [-]
Constant [-]
Constant [-]
Factor dependent on the duration of the load [-]
Length of the casting during one stage [m]
Moment [Nm]
Normal force [N]
Maximum crack spacing [m]

ix
Bridge initial temperature [°C] High temperature component [°C]
Low temperature component [°C]
Thickness of bottom slab [m]
Thickness of superstructure [m]
Internal lever arm [m]
Crack width [m]
Ratio of modulus of elasticity between steel and concrete [-]
Mean strain in the concrete between cracks [-]
Mean strain in the reinforcement under the relevant combination of loads
[-]
Diameter of reinforced steel [m]
Characteristic maximum value for temperature giving expansion [°C]
Characteristic maximum value for temperature giving contraction [°C]
Ratio for reinforcement content over the cross-sectional area [-]
Effective reinforcement ratio [-]
Stress [Pa]
Stress in reinforced steel [Pa]

x
List of explanations
High Temperature = Maximum “temperature component” as referred to in EC1-1-5.
Low Temperature = Minimum “temperature component” as referred to in EC1-1-5.
Temperature Gradient Plus = Maximum “temperature difference” as referred to in EC1-1-5. Top
surface (exterior side) warmer than bottom surface (interior side).
Temperature Gradient Minus = Minimum “temperature difference” as referred to in EC1-1-5.
Top surface (exterior side) colder than bottom surface (interior side).
Direction 1 = Transversal direction
Direction 2 = Longitudinal direction
Normal force in Direction 1 = Direct membrane force per unit width in Local 1-direction.
Normal force in Direction 2 = Direct membrane force per unit width in Local 2-direction.
Moment in Direction 1 = Bending moment force per unit width about Local 2-axis.
Moment in Direction 2 = Bending moment force per unit width about Local 1-axis.
Moment in Direction 3 = Twisting moment force per unit width in Local 1-2 plane.
Mesh0.3_SM1L = Mesh size 0.3m, Sectional Moment in Direction 1, Linear element type
Mesh0.3_SM1Q = Mesh size 0.3m, Sectional Moment in Direction 1, Quadratic element type
Support = The word support in this master thesis includes both bottom slab and side wall.
Surface – Superstructure = Springs on a surface with temperature applied on the superstructure
(Analogously for the other applications of boundary conditions).
Surface – Whole structure = Springs on a surface with temperature in the whole structure
(Analogously for the other applications of boundary conditions).

xi
1-1
1 Introduction FE-modeling is used more and more by designers in all areas of engineering. Today the Swedish
Transport administration requires that all bridges in their projects are analyzed with their full
mode of action which they advise is made with FE-modeling (Trafikverket, 2011). With this
extensive usage of FE-modeling the understandings of the software is very important due to the
interpretations of the results which are not always obvious. Not understanding the software can
lead to faulty designs which can lead to catastrophic consequences, especially when dealing with
large structures such as bridges. Today there is no guidance in EC2, which is the Eurocode for
concrete bridges, of how to cope with the FE issues that are considered in this master thesis
(EC2-1-1, 2005).
In bridge engineering there are several issues when modeling in FE-software but one very big
issue is how to deal with the temperature in a concrete frame bridge. When modeling the
temperature the normal forces in the superstructure and its connection to the support becomes
unreasonable and extremely high which is not the actual reaction of a concrete frame bridge. In
reality the normal forces are not as high as they seem in the software due to cracking in the
concrete which releases most of the tension and thereby decreases the normal forces (Ansell, et
al., 2012). So in this study the results that will be observed are moments, normal forces and
stresses for important sections of the bridge. These are observed because these outputs from the
FE-model are used when dimensioning bridges and is directly associated with the needed amount
of reinforcement which the designers want to keep at a minimum. The approach for this will be
to study three different cases where the first case is to model a 2D-model to compare the results
from the 3D-model with. The second case is when the temperature load is applied only in the
superstructure of the bridge and the third case is with the temperature load applied on the whole
structure where the temperature distribution over the supports is calculated with a FE-software
called ConTeSt Pro. The two latter cases will also be studied with four different kinds of
boundary conditions and then an analysis of the needed reinforcement will also be made for
comparison.
A FE-software that is used very often in bridge engineering is BRIGADE (Plus or Standard)
which is based on the FE-software Abaqus which is why BRIGADE, the Plus version, will be
used in this exploratory study. As mentioned this is an exploratory study but with the hope that
the result will lead to a model that can be used generally for all types of frame bridges with this
issue. This means that this study will try to lock down the issue and by trying several models with
varying conditions hopefully the issue will be solved with one optimal model when the study is
presented.
Background 1.1The most realistic way to apply the temperature load on a model is to apply it on the whole
structure because the temperature will affect the whole structure. With this being said the
temperature will often not be the same at all locations of the model but it should still be loaded
with some temperature. The temperature components that are applied when modeling are high
temperature component, low temperature component and temperature gradients. Today
engineers usually make a qualified decision on how the temperature should be applied by running
the model several times with different application of the temperature and evaluating the results

1-2
(Beck & Haghanipour, 2014). But even this approach is not always sufficient which definitely
indicates that a study of this kind is very necessary. To understand what the issue is when
modeling the temperature in a FE-software it is important to not only focus on the issue itself
but also on the issues that may have an effect on the temperature load. So by also studying the
boundary conditions of the structure the understanding of the reactions will be increased. For
example when having a fixed boundary condition the structure will create very large normal
forces in comparison to when having springs as a boundary condition instead. One of the
important preparations for the study is therefor to understand the mechanics of the structure
before modeling it so that the basic conditions are as good as they can be. These basic conditions
have been discussed and developed with two bridge engineers with a long experience of bridge
engineering, Bertil Beck and Mahmoud Haghanipour at ÅF-Konfem.
Objectives and Limitations 1.2The aim of this master thesis is to primarily study how to apply the temperature load in a FE-
software that will give the most realistic values. The secondary aim is to create a model and an
approach that can be used for all kinds of concrete frame bridges so that the temperature load
will not be an issue when dimensioning the amount of reinforcement needed for the bridge.
This master thesis is written with the presumption that the reader is somewhat familiar with FEM
and FE-modeling which is why the theory behind FEM will not be explained thoroughly in this
master thesis. With this being a study within the area of FE-modeling and bridges it is assumed
that the reader has a basic knowledge of these two subjects. However a theoretical background of
calculating the reinforcement will be presented to give a deeper understanding of why this study
is of high importance for the bridge engineers and bridge designers of today. The FE-software
that is used in this study is BRIGADE/Plus and the result is therefore applicable on this
software. This can be seen as a limitation but it can be assumed that the method is applicable on
similar FE-software due to that similar software uses the same theory but the outcome is nothing
that can be guaranteed for other software. It is for the reader to investigate which software this
concern. BRIGADE/Plus is a very open and somewhat limitless software where one can model
in several different ways which allows the user to model the frame bridge in different ways but
here only one approach on the modeling will be made with all parts geometrically connected.
The cases that are going to be evaluated may not be the optimal cases to evaluate and it would be
more satisfactory to evaluate some other cases as well. But these have been chosen after some
discussion and consideration. But several more cases could be studied as well with larger spans,
higher supports or if there are other ideas of how to apply the loads. One other limitation is that
the results from a 3D-model are being compared to a 2D-model. The results from the 2D-model
may not be sufficient for some results.

1-3
Disposition of the report 1.3To understand why the results that has been extracted are important a short theoretical
background will be presented in Chapter 2 with a description of how the amount of
reinforcement is calculated in EC2.
The method that is used for this master thesis is presented in Chapter 3 and in Chapter 4 an
explanation is given of the cases that are evaluated and why these particular cases. The results are
presented in Chapter 5 where the figures visualize which case that has given the best values for
the different sectional forces and stresses, but also for the needed amount of reinforcement.
Then these results are discussed in Chapter 6.2 with some analyses and finally the conclusions
from the evaluations are made in Chapter 6.3 with suggestions for future work in Chapter 6.4.
Review of previous studies 1.4To understand the importance of this study an extensive literature study has been made to show
how large effects the temperature has on bridges and foremost frame bridges where the parts of
the bridge are rigidly connected.
The temperature effects in bridges can be extremely large in reality due to restraint forces when
the structure is not free to move. If a structure has no restraint the normal values for its
movements are between 0.025-0.040 percent outdoors (Ansell, et al., 2012) and if these forces
that are held back one can imagine the extreme stress that occurs in the concrete. Lots of
research has been made on thermal effects on several different kinds of bridges. The research has
been made during a long period with one example from 1984 where specific analyses were made
of the thermal effects on bridges from solar radiation (Hirst, 1984) and even as we speak more
analyses of thermal effects in various areas of expertise are made with this master thesis as an
example. It is not difficult to see the tendency of the research where one example by Wu, et al.
(2011) show that thermal effects obviously cannot be ignored and are very important in deciding
the lifetime and designing of a bridge.
Studies have been made for several purposes and not only companies are eager to find out how
to deal with this issue but also transport administrations want to be able to give requirements and
guidance in this issue. One report that has been produced is a report of the thermal strains in
transversal direction for concrete frame bridges (Zangeneh Kamali, et al., 2013) where the
conclusion is to use hand-calculations according to EC2-3 which was found to be in good
agreement with a non-linear analysis that was made of the crack width. One of their main
suggestions is to release or neglect the temperature effects in the transversal direction. This
approach however does not give guidance in how to use a linear analysis that may be sufficient.
Other similar studies have also been made in the same area as this study but with different
approaches. One of these visualizes the issue that is being studied here (Andersson & Andersson,
2010). They approached the issue with a non-linear model, due to the non-linearity of concrete as
a material, on an oblique frame bridge with comparison of the reinforcement amount to a
method called Uppenberg’s method which is used for dimensioning in the transversal direction
(Uppenberg, 1963).

1-4

2-5
2 Theoretical background
Thermal properties based on EC2 2.1There are two important conditions given in EC2-1-1 Section 2.3.1.2 (2005) where the thermal
effects in concrete structures are mentioned and these are:
1. “Thermal effects should be taken into account when checking serviceability limit states.”
2. “Thermal effects should be considered for ultimate limit states only where they are
significant (e.g. fatigue conditions, in the verification of stability where second order
effects are of importance, etc.). In other cases they need not be considered, provided that
the ductility and rotation capacity of the elements are sufficient.”
Meaning that when calculating the reinforcement the partial coefficients used should be for the
SLS which is the cracked stage and the ULS can be neglected for the thermal effects in frame
bridges.
According to EC1-1-5 Section 6.1.2 there are two thermal effects that should be considered and
these are the high and low temperature components and the temperature gradients. These should
be applied according to Section 6.1.3.3 and Section 6.1.4.1. (EC1-1-5, 2005)
For high and low temperature components the values are calculated according to Equations 2.1
and 2.2. For the gradients there are specific values in Table 6.1 depending on the type of bridge.
(2.1)
(2.2)
Reinforcement based on maximum allowed crack width 2.2According to EC2-2 Section 7.3.1 (2005) there are certain maximum allowed crack widths which
are used when calculating the reinforcement. So to fulfill this requirement Equation 2.3 is used
after making an experienced assumption for the area of the reinforcement and the result should
give a crack width near the maximum allowed crack width to have optimized the amount of
reinforcement needed. The maximum value from Equation 2.5 is used, where and
the forces from the analysis are introduced in the stress calculation that is made with Navier’s
formula, Equation 2.6.
( ) (2.3)
(2.4)
( )
(2.5)
(2.6)

2-6
Minimum requirement of reinforcement 2.3Sometimes the forces occurring in the concrete does not generate to any reinforcement but this is
not applicable and as a precaution and to control cracks in areas where these small tensile forces
occur a minimum requirement of reinforcement is demanded in the EC and from The Swedish
Transport administration. In Section 7.3.2 in EC2-1-1 (2005) an equation for crack control is
given for checking how much reinforcement is generally needed where the amount depends on
constants and the area of concrete in that part of the section which is calculated to be in tension
just before cracking (see Equation 2.7).
(2.7)
In Section 9.3.1.1 for solid slabs there is a reference to Section 9.2.1.1 where an equation is given
specifically for the minimum longitudinal reinforcement in beams where the amount depends on
the tensile zone and effective depth of a cross-section which means that the geometry of the
cross-sectional area is taken into account (see Equation 2.8).
(2.8)
Then there are formulas for calculating the requirement of minimum reinforcement in all
directions and all sides of the structure in TRVK Bro and TRVR Bro which states that the
requirements in Equations 2.9 and 2.10 should be checked as well (Trafikverket, 2011).
(2.9)
(2.10)
When it comes to the transversal reinforcement Section 9.3.1.1 in EC2-1-1 states that this
minimum reinforcement should be 20% of the principal reinforcement for one way slabs when
FE-modeling is not used (2005). Although TRVR Bro states that for the superstructure Equation
2.11 and for the support Equation 2.12 can be applied (Trafikverket, 2011). Both of these have
traditionally been used for dimensioning the transversal reinforcement for bridges in Sweden
before the implementation of EC with reference to the standard that was used before EC, BRO
2004 (Vägverket, 2004). Although these are used for the shrinkage when casting the concrete it is
a good approximation for the minimum reinforcement for the temperature induced loads. So all
of these requirements should be checked and then the maximum value from the equations is
dimensioning. In this case Equation 2.9 gave the highest value of 4.3cm2.
(2.11)
(2.12)

3-7
3 Method The method used in this study will be explained here so the reader can understand more of why
and how the issue has been approached.
Investigations for the area of this master thesis were done by extensive research to increase the
knowledge in this subject and also to gather information in general. But this was also done to see
which problems other have had during their research or studies in this area and with that taken
into account the method and the approach have been developed.
Background 3.1When bridge designers have been modeling frame bridges with 2D-models during the last couple
of years the temperature has only been applied in the superstructure and this has not led to any
issues with the temperature because of the 2D-approach where transversal directions have not
been taken into account, because of the fact that they are known to not cause any issues in reality
(Beck & Haghanipour, 2014). But with FE-modeling there is no specific guidance of how to
apply the temperature which is why it has been up to the engineer to decide. So to emphasize the
issue here, it lays mainly in the transversal direction which has only been taken into consideration
with general formulas before FE-modeling.
When modelling frame bridges the temperature is either applied in the superstructure or in the
whole structure and this approach is much exaggerated because of the existing varying
temperature in the structure. Often when designing a frame bridge there is soil on the outside of
the supports. This means that it would be wrong to model the same temperature in the supports
as in the superstructure of the bridge. When the temperature is high in the air it is cooler in the
soil and when it is low temperature in the air it is warmer in the soil. This is a result of the
different heat transfer coefficients of different materials (Sundberg, 1991).
So the issue with restraint forces comes mostly because the model is in 3D and that the
transversal forces are included but also because of the theory behind FEM with degrees of
freedom in nodes (Cook, et al., 2002) where large restraining forces occur in the connection
between two parts where one is restrained and the other is free to move. The modeling is often a
linear model because of the complexity and time-consuming nature of non-linear analysis. One
direct consequence of this is that the software does not account for the non-linear behavior of
concrete which means that when the stresses that occurs reaches the maximum stress in the
concrete, in reality the tension seizes to exist (Ansell, et al., 2012) but in a linear model the
stresses increase.
Approach 3.2The results that are observed are first of all the moment because of the relationship between the
moment and normal force, therefor the associating normal forces will be observed as well. The
stresses will also be observed to visualize the stress distribution and to see what the moment and
normal force generates. This is because the stress is the best way to show how much
reinforcement is needed more visually in the diagrams but the reinforcement will also be
calculated and shown in a table because that is what a bridge designer will be reviewing to see
how much the models differ. This calculation will be presented for those load cases that
generates the largest forces and stresses.

3-8
Values from some software that can be known as sufficient when designing bridges and that has
been used by bridge engineers is a useful tool to validate the models. Therefor the first case is a
model that has been made in a calculation software called Strip Step 2 where the software takes
one meter strip of a frame and gives the results per meter which makes this a 2D-model (ELU
Konsult AB, 1992). So the associating forces that can be given in BRIGADE/Plus (Scanscot
Technology AB, 2013) cannot be given in Strip Step 2 but most importantly it only gives results
in the longitudinal direction and the transversal direction is disregarded. Although, with this being
a software that has been used for a very long time in bridge engineering it is sufficient as a
verification of the models. Then there are two main cases for the 3D-models where the
temperature is defined differently. In each of these two cases there are four different kinds of
boundary conditions. The temperature will first be applied on the superstructure and then in the
whole structure. When using the latter application the temperature variation in the bridge will be
calculated with a FE-software named ConTeSt Pro.
Figure 3.2.1 Overview for the approach of the method.
As mentioned earlier the usual application of the temperature in 3D-models is wrong which is
why the distribution of the temperature has been studied in a software called ConTeSt Pro, a FE-
software for temperature- and stress-calculations in concrete (JEJMS Concrete AB, 1999), which
gives a better understanding of the temperature distribution in the frame bridge.
The final results of the earlier mentioned forces are visualized with plots for the separate forces
but with all the cases and their boundary conditions in each plot to see the differences from each
case and subcase. First by verifying the behavior of the models with the 2D-results and then
comparing all the models to each other final conclusions can be drawn.
To summarize, the model that has been created is a frame bridge that is geometrically connected
between the superstructure and the supports and it is important to understand that when doing
so the whole support is completely fixed to the superstructure, as it is in reality. The model will
be a linear model because as explained the issue occurs in the linear model which is what is
preferably used when modeling today.
Temperature components High temperature
Low temperature
Temperature Gradient Plus
Temperature Gradient Minus
BRIGADE/Plus (3D)
•Temperature in superstructure
•Boundary condition 1-4
•Temperature in whole structure
•Boundary condition 1-4
Strip Step 2 (2D)
•Temperature in superstructure
•Boundary condition 1
ConTeSt Pro
Calculations for
whole structure only

3-9
3.2.1 Convergence study
To decide which element size and type is best for the model a convergence study in the load case
for the dead weight was made and all the sectional forces were consistent except one which is
presented in Figure 3.2.1.1. As can be seen the difference between the linear element type for the
largest and smallest mesh size is the biggest. For the quadratic element type the two smallest
mesh sizes show exactly the same result. Therefore, the following has been chosen.
Element type: Quadratic shell
Element mesh size: 0.3m
-1.00E+04
-5.00E+03
0.00E+00
5.00E+03
1.00E+04
1.50E+04
2.00E+04
0 5 10 15 20
Forc
e [
Nm
/m]
Distance along frame [m]
Moment in Direction 1
Mesh0.2_SM1L
Mesh0.2_SM1Q
Mesh0.3_SM1L
Mesh0.3_SM1Q
Mesh0.4_SM1L
Mesh0.4_SM1Q
Figure 3.2.1.1 Comparison of mesh sizes and element types.

3-10

4-11
4 Studied cases In this chapter the prerequisites of the model will be presented and the cases with their
differences will also be shown in figures and explained as well. The input used in the case when
applying the temperature in the whole structure will also be presented in Subchapter 4.2.1.
The foremost important criteria for this study have been to model a bridge that reflects the reality
as much as possible. Therefor a bridge that has been constructed in real life by the engineers at
ÅF-Konfem has been used as a base which has rather general conditions. Some simplifications
and rounding have been made for the dimensions of the bridge to create full symmetry.
So the basic conditions for the bridge are a straight frame bridge with no curves so that the
possible restraining effect of different lengths on the supports is eliminated. Even though this
bridge does not have various lengths for the supports this condition is one that occurs often in
reality, but it is better for the outcome of the study that these kinds of possible effects are
eliminated (Beck & Haghanipour, 2014). Also the effect of long slabs is eliminated by having a
rather short length of the bridge even though this effect should not be so extensive due to that
the supports will absorb most of the forces. But to again eliminate the possible effects from the
plates in the longitudinal direction the bridge will not be too long (Jonasson, et al., 2012).
Therefor the length of the bridge will be 10 meters with a span of 8 meters which can be seen in
Figure 4.1 and Figure 4.2 and by also including the wing walls with certain dimensions given in
Figure 4.4. The height of the bridge was calculated approximately from drawings of the original
bridge. According to TRVK Bro, Section D.2.2.1.4 (2011) when the bottom slab is cast directly
on soil the lower 50mm from the bottom slab should be considered idle.
(
)
(4.1)
As mentioned some dimensions may vary for achieving symmetry and for some simplifications.
The inclinations that can be seen in the mentioned figures will neither be taken into account.

4-12
Figure 4.1 Dimensions for the bottom slab and the support and thus the length of the bridge.
Figure 4.2 Dimensions for the span of the bridge and thicknesses for the cross-section of the frame.

4-13
Figure 4.3 Dimensions for the wingwall for the real bridge that has been used as a base.
Figure 4.4 Dimensions used in BRIGADE/Plus for the wing wall.

4-14
Strip Step 2 4.1For the first case the temperature is only in the superstructure.
1. Spring in one point because of the properties of the software.
BRIGADE/Plus 4.2For cases 2 and 3 the same boundary conditions are used so that the results can be compared
without any discrepancies but with the difference of how the temperature has been applied as
mentioned in Subchapter 3.2.
So the boundary conditions used for cases 2 and 3 are as follows:
1. Spring in only one point under the bottom of the support. The spring will be defined by
its rotational spring. But the rotation in longitudinal direction has to be locked so that the
whole structure will not be rotating around one point. See Figure 4.2.1.
2. Springs to ground at the bottom of the support as a line that will represent the
foundation. Here the springs will be defined by their rotational springs. See Figure 4.2.2.
3. Springs to ground over a surface that represents the foundation. Here the springs will be
defined by their translational springs and not the rotational springs as the rotational
aspect will be absorbed by the surrounding springs. See Figure 4.2.3.
4. Springs to ground over a surface as well but with the difference from condition 3 that the
horizontal movements will be free to remove the horizontal restraints but with a fixed
node in the middle of the support (for future purposes when horizontal loads occur). See
Figure 4.2.4.
Figure 4.2.1 Boundary condition 1, springs in one node.

4-15
Figure 4.2.2 Boundary condition 2, springs on a line.
Figure 4.2.3 Boundary condition 3, springs to surface.
Figure 4.2.4 Boundary condition 4, springs to surface with no restraints in horizontal directions.

4-16
The locale directions in the model are shown in Figure 4.2.5 which should be kept in mind when
reviewing the results.
Figure 4.2.5 Local directions for the shells.
4.2.1 ConTeSt Pro
The parameters used in ConTeSt Pro can be seen in Table 4.2.1.1.
Table 4.2.1.1 Values for the parameters in ConTeSt Pro.
Concrete Soil
Density [kg/m3] 2350 2200
Heat capacitivity [J/(kg*K)] 1000 1400
Heat conductivity [W/(m*K)] 1.7 2.1
Figure 4.2.1.1 The defined blocks and the chosen mesh in ConTeSt Pro.

4-17
The varying distribution of the temperature that has been applied with a function in BRIGADE
is given by the results extracted from ConTeSt Pro and recreated with diagrams so that the
function could be given. The first objective was to see how the temperature varies over a year in
a certain location, here Stockholm is chosen simply because this thesis is written in Stockholm.
These values were given from a report of cracks due to temperature in concrete (Jonasson, et al.,
2002) and then inserted in a diagram to digitalize the variation, see Appendix A. It could be seen
that the variation followed a sinus-curve which then was used to create a curve adjusted to the
maximum and minimum temperatures for this bridge which were taken from TRVFS Bro,
Appendix 2 (Trafikverket, 2011). This gave the values that were inserted in ConTeSt Pro with a
timespan over one year with one value for each week. The distribution in the soil and the bridge
are shown in Figure 4.2.1.2. The function for the temperature distribution along the supports for
the high and low temperature and the gradients are shown in Figure 4.2.1.3 and Figure 4.2.1.4.
Figure 4.2.1.2 Temperature distribution when the temperature is at maximum (left) and minimum (right).
Table 4.2.1.2 Calculated formulas for the temperature variation over the supports.
Load case Formula
High Temperature y = -0.1891y3 + 2.2279y2 - 9.434y - 11.137
Low Temperature y = 0.1326y3 - 1.1441y2 + 3.2106y + 10.859
Temperature Gradient Plus y = -0.0148x4 + 0.1545x3 - 0.2835x2 - 0.4037x - 0.3935
Temperature Gradient Minus y = -0.0198x4 + 0.3784x3 - 2.6071x2 + 6.287x + 1.7621

4-18
0
1
2
3
4
5
6
7
-40 -30 -20 -10 0 10 20 30
Sup
po
rt h
eig
ht
[m]
Temperature [°C]
Temperature variation along supports
High temperature
Low temperature
Figure 4.2.1.3 Temperature variation along the supports for high and low temperature.
0
1
2
3
4
5
6
7
-2 0 2
Sup
po
rt h
eig
ht
[m]
Temperature [°C]
Temperature gradient
Plus
0
1
2
3
4
5
6
7
0 5 10
Sup
po
rt h
eig
ht
[m]
Temperature [°C]
Temperature gradient
Minus
Figure 4.2.1.4 The variation for the temperature gradient along the supports.

4-19
4.2.2 Observed sections
The observed sections in BRIGADE are the midsection at L/2, one quarter section at L/4 and
one end section where the distance from the edge is approximately 600mm. The latter is
calculated with advice from TRVR Bro where it says that the maximum values in the ultimate
limit state can be distributed over a width of three times the thickness of the superstructure
(Trafikverket, 2011). Therefor the values that should be used as mean values for this width are
taken from the chosen path that was created at the end section.
Figure 4.2.2.1 The observed sections with end section, quarter section and midsection in that order.

4-20

5-21
5 Results The results that give a better understanding of the phenomena that is being studied in this master
thesis are shown in this chapter. First the sectional forces with normal force and moment are
shown for one of the worst load cases to show the issue at hand. The stress distribution is also
visualized just to give an understanding of how the distribution differs in the models. Then the
needed reinforcement amount is presented for the worst load case.
As mentioned before, and it can be seen, that the longitudinal direction does not give remarkably
unrealistic values even though its results can differ some for the several approaches. It is the
transversal direction that will show more abnormal results and therefor the focus will lay there.
The calculated reinforcement is thus for the transversal direction with a minimum reinforcement
calculated according to BRO, 2004 (Vägverket, 2004) and not with Strip Step 2 because of its 2D
nature. Also to be mentioned is that even though the midsection has been observed, results from
the different sections follow the same relation but with slightly lower values when coming closer
to the midsection. Therefor the midsection will not be presented; neither in this chapter nor in
Appendix B, but comparing the end section with the quarter section will show that the results
actually do follow the same relation.
Sectional forces 5.1When examining the results for the high and low temperature components an observation was
made that when applying the temperature only on the superstructure the results tend to be very
unrealistic and therefore obvious that these can be disregarded as a good model. So modeling the
temperature in the whole structure and with a varying temperature along the supports is clearly a
better model which is very logical. So to create a better overview of the diagrams only some
results will be presented in this chapter while all the results can be seen in Appendix B.
Following legend is used for all figures in this chapter except for Subchapter 5.3 and the
interpretation of the figures is shown in Figure 5.1.1.

5-22
Support
6.515
Superstructure
10.7350
Figure 5.1.1 The figure shows how to interpret all of the diagrams for the results where they all follow
the same convention.
Ext
erio
r si
de
Inte
rio
r si
de
Lower edge
Upper edge
Bottom of support: 0 m
Middle of superstructure:
10.735 m
Transition between support
and superstructure: 6.515 m

5-23
-7.00E+06
-6.00E+06
-5.00E+06
-4.00E+06
-3.00E+06
-2.00E+06
-1.00E+06
0.00E+00
1.00E+06
2.00E+06
0 2 4 6 8 10
Forc
e [
N/m
]
Distance along frame [m]
Normal Force in Direction 1
-1.80E+06
-1.60E+06
-1.40E+06
-1.20E+06
-1.00E+06
-8.00E+05
-6.00E+05
-4.00E+05
-2.00E+05
0.00E+00
2.00E+05
0 2 4 6 8 10
Forc
e [
N/m
]
Distance along frame [m]
Normal Force in Direction 1
Figure 5.1.2 High temperature – End section, normal force in transversal direction. All the models are visualized in the upper figure and to show the extreme differences only the models that are of high relevancy in the lower figure. Observe the values.
As can be seen large restraining normal forces occur in the transversal direction in the transition
between support and superstructure when the temperature is only in the superstructure. But with
the temperature in the whole structure the problem is moved to the bottom slab and very large
restraining forces occur there instead but observe which boundary conditions have been used.
For the moment the boundary condition does not have great influence in the transversal
direction but more for the longitudinal direction. Observe the results for the 2D-model in the
longitudinal direction and its conformity with the 3D-results.

5-24
-2.50E+04
-2.00E+04
-1.50E+04
-1.00E+04
-5.00E+03
0.00E+00
5.00E+03
1.00E+04
0 2 4 6 8 10
Forc
e [
Nm
/m]
Distance along frame [m]
Moment in Direction 1
-2.00E+04
-1.50E+04
-1.00E+04
-5.00E+03
0.00E+00
5.00E+03
1.00E+04
1.50E+04
2.00E+04
2.50E+04
3.00E+04
0 2 4 6 8 10
Forc
e [
Nm
/m]
Distance along frame [m]
Moment in Direction 2
Figure 5.1.3 High temperature – End section, moments in transversal and longitudinal direction respectively.
The results for the torsional moment are not interesting due to their relatively low values in
comparison with the two principal directions. For the temperature gradients the results generally
have a very high compliance regardless of temperature application and boundary condition so
those results are not shown due to relatively small restraint forces in comparison to the high and
low temperature components. See all results in Appendix B.

5-25
Stresses 5.2
Figure 5.2.1 Contour plots of stress in transversal direction for high temperature. Boundary condition 1 (upper) and 4 (lower). Observe the numerical values, especially the maximum and minimum.
The stresses follow a similar behavior as the sectional forces, which can be seen in Figure 5.2.2,
and to visualize the difference in how the stresses are distributed between the most and least
restrained models see Figure 5.2.1.
5-26
-6.00E+03
-5.00E+03
-4.00E+03
-3.00E+03
-2.00E+03
-1.00E+03
0.00E+00
1.00E+03
2.00E+03
3.00E+03
0 2 4 6 8 10
Stre
ss [
kPa/
m]
Distance along frame [m]
Normal stress in Direction 1
-2.00E+03
-1.50E+03
-1.00E+03
-5.00E+02
0.00E+00
5.00E+02
1.00E+03
1.50E+03
2.00E+03
0 2 4 6 8 10
Stre
ss [
kPa/
m]
Distance along frame [m]
Normal stress in Direction 2
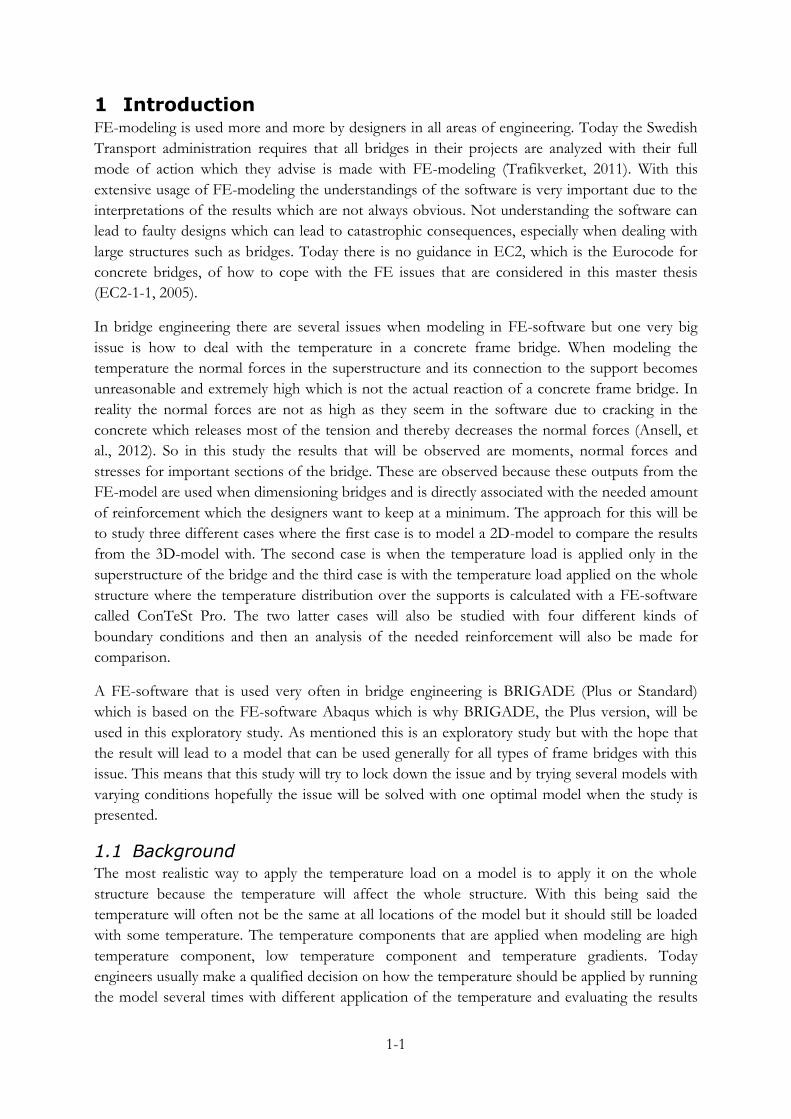
Figure 5.2.2 High temperature – End section, stresses in both principal directions.
For the longitudinal direction the stresses are somewhat realistic for all the models but as can be
seen in the transversal direction the restraints are very large in some of the models, just a for the
sectional forces.
5-27
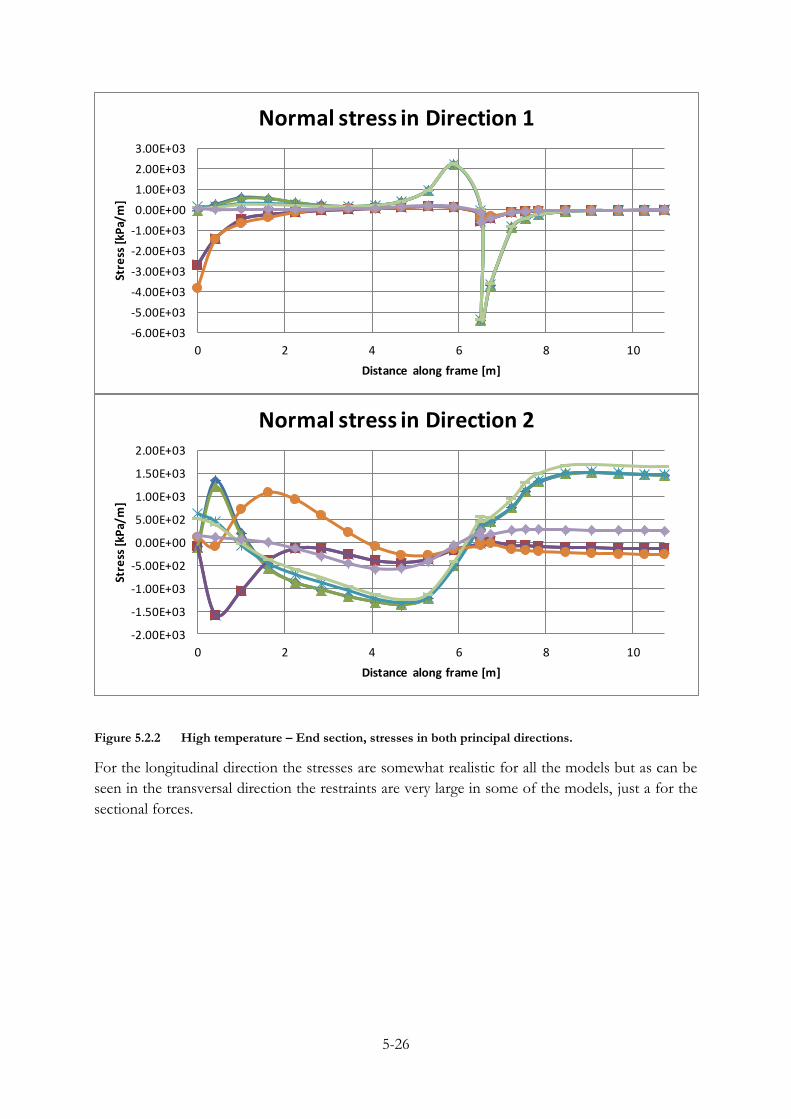
Reinforcement 5.3As mentioned in Chapter 3, it was observed that the high and low temperature were the load
cases with much larger forces and stresses. Therefor the reinforcement is only presented for these
although calculations were made for all load cases. It was observed that the High Temperature
did not result in much reinforcement because of the large compressive forces and therefor only
the Low Temperature is presented in Figure 5.3.1 and Figure 5.3.2 following the convention for
drawings of needed reinforcement amount. Following legend is used for the figures in this
subchapter which is the same as earlier with the Minimum reinforcement replacing Strip Step 2.
0.0
10.0
20.0
30.0
40.0
50.0
60.0
70.0
80.0
6.5 7.0 7.5 8.0 8.5 9.0 9.5 10.0 10.5
Re
info
rce
me
nt
are
a [c
m2/m
]
Distance along frame [m]
Superstructure - Transversal direction - Lower Edge
Figure 5.3.1 Reinforcement needed in lower edge of superstructure in the transversal direction.

5-28
0.0
1.0
2.0
3.0
4.0
5.0
6.0
0.020.040.060.080.0
Dis
tan
ce a
lon
g fr
ame
[m
]
Reinforcement area [cm2/m]
Support - Transversal direction - Exterior side
0.0
1.0
2.0
3.0
4.0
5.0
6.0
0.0 20.0 40.0 60.0 80.0
Dis
tan
ce a
lon
g fr
ame
[m
]
Reinforcement area [cm2/m]
Support - Transversal direction - Interior side
Figure 5.3.2 Reinforcement needed in exterior and interior side of the support in the transversal direction.

6-29
6 Discussion and Conclusions
General 6.1When modeling temperature loads in concrete frame bridges with FE, issues occur in the
transversal direction which leads to very large amounts of reinforcement that is not needed in real
life which makes this a large and unnecessary cost. The main focus has therefor been on how to
approach the issue with large restraining forces when modeling concrete frame bridges. In
general there are always four different temperature load cases to consider and all of these have
been studied. These four load cases have been applied in two different ways to see which one is
the optimal one. The first one was with the temperature loads applied only in the superstructure,
which is how it is done by convention, and the second one where it was applied on the whole
structure with a varying temperature along the supports, which is a developed approach. The
results presented show the difference between the models and it can be seen that one model
stands out from the others.
Discussion 6.2With the limitation of comparing the results with a 2D-model it may seem as though these results
are excessive but they give an indication that the 3D-results are logical and follow the same
relation. They also show how the traditional approach differs from the modern approach with
FE-modeling and the values they generate. It could be of value to calculate the reinforcement
needed from the 2D-model and compare it with the 3D-models but because the 2D-model only
gives results in the longitudinal direction this is not evaluated because the issue and focus lays in
the transversal direction.
One could argue that this study does not have sufficient number of cases or models to be able to
draw good conclusions but even if several more cases were to be studied where the size or the
model would differ, the result would most definitely have the same relation between the several
approaches as they do in the studied bridge in this master thesis. With that being said maybe a
larger bridge should have been used to really show how large the effects are on the needed
amount of reinforcement.
For the observed sections it is highly relevant to observe the section forces in the end section and
quarter section but not in the midsection which is why these values where only taken just to show
and verify that the relation between the models follow the same behavior as in the end section.
This makes the conclusions made for the end section valid for the whole model.
As mentioned in the beginning of Chapter 5 all the results are shown in Appendix B instead of in
the chapter itself because the goal is to present results that give a better understanding of the
issue and the solution. As explained the results when applying the temperature only in the
superstructure were disregarded. The explanation to why this type of modeling is wrong in
practice is because this causes the superstructure to move while the supports are held still which
results in the developing of very large restraining forces in the transition from superstructure to
support. When applying the temperature in the whole structure and having fixed conditions in
horizontal directions in the bottom slab causes the restraining forces to occur in this section
instead. This shows that the problem is not completely solved, but only moved elsewhere which
can be seen in e.g. Figure 5.1.2. In practice this leads to unnecessarily large amounts of

6-30
reinforcement in which ever section that has been subjected to these restraints. This makes it
obvious that it is not only how the temperature is applied but also the boundary conditions of the
model that gives extreme results.
The real comparison if these results are valuable is in the calculation of the reinforcement. In
hindsight the load case for the Low Temperature was the only one resulting in any high
reinforcement amount in the transversal direction. But it has to be mentioned that the High
Temperature did not give much reinforcement because of the very large normal forces that
causes large compression which results in no reinforcement. But this does not reflect reality
which is why any valuable results are difficult to present in this load case. Also, if the ratio
between the moment and normal force would be bigger the forces could result in large
reinforcement amounts, which is what happens when modeling a real bridge because of the
several other load cases that are considered in e.g. the SLS and the combination of these load
cases.
Conclusions 6.3The conception of the issue before doing this study was that there are two properties that are
mostly significant for the outcome of the sectional forces when dealing with temperature effects.
Throughout this study it has been even clearer that this conception is correct and the following
conclusions have been made to the modeling of concrete frame bridges.
It is not only how the load is applied that matters, but also the boundary conditions.
Only applying the temperature in the superstructure as conventionally done in 2D-models
is highly inaccurate for 3D-models.
Apply the temperature in the whole structure and let it vary in the structure in a realistic
way. It could be time-consuming to examine the exact variation for every bridge that will
be modeled so if not with the exact variation, a competent approximation would suffice
e.g. with a linear variation along the supports from the maximum/minimum temperature
to a reasonable temperature at the bottom of the bridge which depends on the soil and
depth among other things.
Use as realistic boundary conditions as possible. Try not to give them unnecessary and
unrealistic fixations. In this case with a bottom slab, model the bottom slab as a surface
and try to keep the horizontal directions free to some extent.
The mentioned conclusions give a model and results without large unnecessary
restraining forces and excessive reinforcement can be avoided.
Suggestions for future work 6.4Some assumptions and simplifications have been made and to be able to model more according
to reality a suggestion is to determine the used constants more accurately, e.g. the spring
constants for the boundary conditions where the constants in all directions would reflect reality
better. This could possibly be made with measurements for a real bridge of how much the bridge
is restrained in different directions.
As mentioned the cases that have been studied have been narrowed down to a few after
discussing the matter with two very competent and experienced bridge engineers, so the cases
and their suggested conditions can be assumed to be of very high importance and validity to have

6-31
solved this problem that occurs in FE-modeling. But it could be satisfactory to study more cases,
e.g. with different lengths and spans, to be able to make conclusions based on more extensive
research.
Some companies may not have access to software that can calculate the temperature variation in
a structure. So to be able to apply the suggested conclusion with a temperature variation along
the support one could examine different types of frame bridges with different height, thickness
etc. to be able to create figures or tables which then could be used when dimensioning a bridge to
know how the temperature varies in the support for that bridge.
The theory behind FEM is the same for all FE-software which is why an assumption that this
approach would be applicable for other FE-software as well is a highly competent assumption.
But this is nothing that can be guaranteed because of the different ways of modeling in different
FE-software so a suggestion is to investigate if this approach can be used for other software as
well so companies that do not have BRIGADE can use the same approach.

6-32

7-33
7 References Andersson, J. & Andersson, L., 2010. Restraining forces in concrete bridges, Lund: Lund University (In
Swedish).
Ansell, A. et al., 2012. Concrete Structure. 2012 ed. Stockholm: KTH Civil and Architectural
Engineering.
Banverket, 1992. Railway bridge standard BVH 541.2, Borlänge: Banverket (In Swedish).
Beck, B. & Haghanipour, M., 2014. [Interview] 2014.
Cook, R. D., Malkus, D. S., Plesha, M. E. & Witt, R. J., 2002. Concepts and applications of Finite
Element Analysis. Fourth ed. New Jersey: John Wiley & Sons. Inc..
EC1-1-5, 2005. Eurocode 1: Actions on structures Part 1-5: General actions - Thermal actions, Stockholm:
Swedish Standards Institute.
EC2-1-1, 2005. Eurocode 2: Design of concrete structures Part 1-1: General rules and rules for buildings,
Stockholm: Swedish Standards Institute.
EC2-2, 2005. Eurocode 2: Design of concrete structures - Concrete bridges - Design and detailing rules,
Stockholm: Swedish Standards Institute.
ELU Konsult AB, 1992. Strip Step 2. Danderyd: ELU Konsult AB (In Swedish).
Hirst, M. J. S., 1984. Thermal loading of concrete bridges. Adelaide, Department of Civil Engineering,
University of Adelaide.
JEJMS Concrete AB, 1999. ConTeSt Pro - User manual, Software for temperature- and stress-calculations in
concrete. Luleå: JEJMS Concrete AB (In Swedish).
Jonasson, J.-E., Nilsson, M. & Olofsson, T., 2012. Concrete Slabs - Theory and design methods. Luleå:
Luleå University of Technology.
Jonasson, J.-E.et al., 2002. Temperature cracks in concrete structures, Luleå: Luleå University of
Technology (In Swedish).
Scanscot Technology AB, 2013. BRIGADE/Plus - User's manual: Version 5.1. Lund: Scanscot
Technology AB.
Sundberg, J., 1991. Thermal properties in soil and rock. Linköping: Statens Geotekniska Institut (In
Swedish).
Trafikverket, 2011. Trafikverkets författningssamling, TRVFS 2011:12, Borlänge: Trafikverket (In
Swedish).
Trafikverket, 2011. Trafikverkets tekniska krav Bro 11, TRV publ nr 2011:085, Borlänge:
Trafikverket (In Swedish).
Trafikverket, 2011. Trafikverkets tekniska råd Bro 11, TRV publ nr 2011:086, Borlänge: Trafikverket
(In Swedish).

7-34
Uppenberg, M., 1963. Dimensioning of oblique frame bridges. Stockholm: KTH: Institution of Bridge
Construction.
Wu, J. et al., 2011. Effect analysis of temperature in the large continuous rigid frame bridge.
Applied Mechanics and Materials, Volume 71-78, pp. 1339-1343.
Vägverket, 2004. BRO 2004 - Vägverkets allmäna tekniska beskrivning för nybyggande och förbättring av
broar, Publ 2004:56, Borlänge: Vägverket (Trafikverket) (In Swedish).
Zangeneh Kamali, A., Svedholm, C. & Johansson, M., 2013. Effects of restrained thermal strains in
transversal direction of concrete slab frame bridges, Report 149, Stockholm: KTH.
A-1
Appendix A - Calculations
A.1 Spring stiffness
Calculation of spring stiffnesses:
kqk,L = Ek * B2 * L / 5 [kNm/rad] According to Appendix 107.1, TRVK Bro 11
kqk,T = Ek * L2 * B / 5 [kNm/rad]
kqk,V = 2 * E / (α * B) [kN/m3] According to BVH 541.2 Appendix 303-11
fk= 38 grader Packed filling
Ek= 40 MPa The characteristic value for the modulus of elasticity
is used
L= 9.5 m Dimensions of bottom slab
B= 2.4 m
According to BVH 541.2 Appendix 303-11, Table 332.144a
B/L 1 0.8 0.6 0.4 0.2
α 0.65 0.69 0.75 0.83 0.94
B/L= 0.25
α= 0.91
For Strip Step 2
kqk,L = 438 [(MNm/rad)/m]
1 / kq k= 2.2E-05 [rad m/kNm] Rotational weakness
because of Strip Step 2 definitions
For BRIGADE/Plus
kqk,L = 438 [(MNm/rad)/m] Rotational stiffness in the slabs weak direction
kqk,T = 1733 [(MNm/rad)/m] Rotational stiffness in the slabs stiff direction
kqk,V = 37 [(MN/m)/m] Translational stiffness in vertical direction
kqk,L = 4161 [(MNm/rad)/m] Rotational stiffness in the slabs weak direction
only for Boundary condition 1

A-2
A.2 ConTeSt Pro The temperature variation that is mentioned in Subchapter 4.2.1 is shown in the figures below.
-5
0
5
10
15
20
0 2 4 6 8 10 12 14 16 18 20 22 24 26 28 30 32 34 36 38 40 42 44 46 48 50 52
Tem
pe
ratu
re [
°C]
Week
Temperature in Stockholm during one year
Temperaturevariation
Polynomialapproximation
-40
-30
-20
-10
0
10
20
30
0 2 4 6 8 10 12 14 16 18 20 22 24 26 28 30 32 34 36 38 40 42 44 46 48 50 52
Tem
pe
ratu
re [
°C]
Week
Adjusted temperature variation during one year
Temperatureadjusted to
Tmax andTmin
Temperature adjusted to ΔTmax and
ΔTmin

B-1
Appendix B - Forces and Stresses All results shown in this appendix follow the same legend posts in the following legend.

B-2
B.1 High temperature
B.1.1 Endsection
-7.00E+06
-6.00E+06
-5.00E+06
-4.00E+06
-3.00E+06
-2.00E+06
-1.00E+06
0.00E+00
1.00E+06
2.00E+06
0 5 10 15 20
Forc
e [
N/m
]
Distance along frame [m]
Normal Force in Direction 1
-1.20E+06
-1.00E+06
-8.00E+05
-6.00E+05
-4.00E+05
-2.00E+05
0.00E+00
2.00E+05
4.00E+05
6.00E+05
8.00E+05
0 5 10 15 20
Forc
e [
N/m
]
Distance along frame [m]
Normal Force in Direction 2

B-3
-1.00E+05
-8.00E+04
-6.00E+04
-4.00E+04
-2.00E+04
0.00E+00
2.00E+04
4.00E+04
6.00E+04
0 5 10 15 20
Forc
e [
Nm
/m]
Distance along frame [m]
Moment in Direction 1
-4.00E+04
-2.00E+04
0.00E+00
2.00E+04
4.00E+04
6.00E+04
8.00E+04
1.00E+05
0 5 10 15 20
Forc
e [
Nm
/m]
Distance along frame [m]
Moment in Direction 2

B-4
-4.00E+04
-3.00E+04
-2.00E+04
-1.00E+04
0.00E+00
1.00E+04
2.00E+04
3.00E+04
4.00E+04
0 5 10 15 20
Forc
e [
Nm
/m]
Distance along frame [m]
Moment in Direction 3
-6.00E+03
-5.00E+03
-4.00E+03
-3.00E+03
-2.00E+03
-1.00E+03
0.00E+00
1.00E+03
2.00E+03
3.00E+03
0 5 10 15 20
Stre
ss [
kPa/
m]
Distance along frame [m]
Normal stress in Direction 1

B-5
-2.00E+03
-1.50E+03
-1.00E+03
-5.00E+02
0.00E+00
5.00E+02
1.00E+03
1.50E+03
2.00E+03
0 5 10 15 20
Stre
ss [
kPa/
m]
Distance along frame [m]
Normal stress in Direction 2
-4.00E+03
-3.00E+03
-2.00E+03
-1.00E+03
0.00E+00
1.00E+03
2.00E+03
3.00E+03
4.00E+03
0 5 10 15 20
Stre
ss [
kPa]
Distance along frame [m]
Shear stress in Direction 3

B-6
B.1.2 Quarter section (L/4)
-1.00E+07
-8.00E+06
-6.00E+06
-4.00E+06
-2.00E+06
0.00E+00
2.00E+06
4.00E+06
0 5 10 15 20
Forc
e [
N/m
]
Distance along frame [m]
Normal Force in Direction 1
-3.00E+05
-2.00E+05
-1.00E+05
0.00E+00
1.00E+05
2.00E+05
3.00E+05
4.00E+05
5.00E+05
6.00E+05
0 5 10 15 20
Forc
e [
N/m
]
Distance along frame [m]
Normal Force in Direction 2

B-7
-4.00E+04
-3.00E+04
-2.00E+04
-1.00E+04
0.00E+00
1.00E+04
2.00E+04
0 5 10 15 20
Forc
e [
Nm
/m]
Distance along frame [m]
Moment in Direction 1
-2.00E+04
-1.00E+04
0.00E+00
1.00E+04
2.00E+04
3.00E+04
4.00E+04
0 5 10 15 20
Forc
e [
Nm
/m]
Distance along frame [m]
Moment in Direction 2

B-8
-6.00E+04
-4.00E+04
-2.00E+04
0.00E+00
2.00E+04
4.00E+04
6.00E+04
0 5 10 15 20
Forc
e [
Nm
/m]
Distance along frame [m]
Moment in Direction 3
-6.00E+03
-5.00E+03
-4.00E+03
-3.00E+03
-2.00E+03
-1.00E+03
0.00E+00
1.00E+03
2.00E+03
3.00E+03
4.00E+03
5.00E+03
0 5 10 15 20
Stre
ss [
kPa/
m]
Distance along frame [m]
Normal stress in Direction 1

B-9
-1.00E+03
-5.00E+02
0.00E+00
5.00E+02
1.00E+03
1.50E+03
0 5 10 15 20
Stre
ss [
kPa/
m]
Distance along frame [m]
Normal stress in Direction 2
-2.00E+03
-1.50E+03
-1.00E+03
-5.00E+02
0.00E+00
5.00E+02
1.00E+03
1.50E+03
2.00E+03
0 5 10 15 20
Stre
ss [
kPa/
m]
Distance along frame [m]
Shear stress in Direction 3

B-10
B.2 Low temperature
B.2.1 Endsection
-2.00E+06
-1.00E+06
0.00E+00
1.00E+06
2.00E+06
3.00E+06
4.00E+06
5.00E+06
6.00E+06
7.00E+06
8.00E+06
9.00E+06
0 5 10 15 20
Forc
e [
N/m
]
Distance along frame [m]
Normal Force in Direction 1
-1.50E+06
-1.00E+06
-5.00E+05
0.00E+00
5.00E+05
1.00E+06
1.50E+06
2.00E+06
0 5 10 15 20
Forc
e [
N/m
]
Distance along frame [m]
Normal Force in Direction 2

B-11
-1.00E+05
-5.00E+04
0.00E+00
5.00E+04
1.00E+05
1.50E+05
0 5 10 15 20
Forc
e [
Nm
/m]
Distance along frame [m]
Moment in Direction 1
-1.40E+05
-1.20E+05
-1.00E+05
-8.00E+04
-6.00E+04
-4.00E+04
-2.00E+04
0.00E+00
2.00E+04
4.00E+04
6.00E+04
0 5 10 15 20
Forc
e [
Nm
/m]
Distance along frame [m]
Moment in Direction 2

B-12
-5.00E+04
-4.00E+04
-3.00E+04
-2.00E+04
-1.00E+04
0.00E+00
1.00E+04
2.00E+04
3.00E+04
4.00E+04
5.00E+04
0 5 10 15 20
Forc
e [
Nm
/m]
Distance along frame [m]
Moment in Direction 3
-4.00E+03
-2.00E+03
0.00E+00
2.00E+03
4.00E+03
6.00E+03
8.00E+03
0 5 10 15 20
Stre
ss [
kPa/
m]
Distance along frame [m]
Normal stress in Direction 1

B-13
-3.00E+03
-2.00E+03
-1.00E+03
0.00E+00
1.00E+03
2.00E+03
3.00E+03
4.00E+03
0 5 10 15 20
Stre
ss [
kPa/
m]
Distance along frame [m]
Normal stress in Direction 2
-6.00E+03
-4.00E+03
-2.00E+03
0.00E+00
2.00E+03
4.00E+03
6.00E+03
0 5 10 15 20
Stre
ss [
kPa/
m]
Distance along frame [m]
Shear stress in Direction 3

B-14
B.2.2 Quarter section (L/4)
-4.00E+06
-2.00E+06
0.00E+00
2.00E+06
4.00E+06
6.00E+06
8.00E+06
1.00E+07
1.20E+07
0 5 10 15 20
Forc
e [
N/m
]
Distance along frame [m]
Normal Force in Direction 1
-1.00E+06
-8.00E+05
-6.00E+05
-4.00E+05
-2.00E+05
0.00E+00
2.00E+05
4.00E+05
0 5 10 15 20
Forc
e [
N/m
]
Distance along frame [m]
Normal Force in Direction 2

B-15
-3.00E+04
-2.00E+04
-1.00E+04
0.00E+00
1.00E+04
2.00E+04
3.00E+04
4.00E+04
5.00E+04
0 5 10 15 20
Forc
e [
Nm
/m]
Distance along frame [m]
Moment in Direction 1
-5.00E+04
-4.00E+04
-3.00E+04
-2.00E+04
-1.00E+04
0.00E+00
1.00E+04
2.00E+04
3.00E+04
0 5 10 15 20
Forc
e [
Nm
/m]
Distance along frame [m]
Moment in Direction 2

B-16
-8.00E+04
-6.00E+04
-4.00E+04
-2.00E+04
0.00E+00
2.00E+04
4.00E+04
6.00E+04
8.00E+04
0 5 10 15 20
Forc
e [
Nm
/m]
Distance along frame [m]
Moment in Direction 3
-6.00E+03
-4.00E+03
-2.00E+03
0.00E+00
2.00E+03
4.00E+03
6.00E+03
8.00E+03
0 5 10 15 20
Stre
ss [
kPa/
m]
Distance along frame [m]
Normal stress in Direction 1

B-17
-2.50E+03
-2.00E+03
-1.50E+03
-1.00E+03
-5.00E+02
0.00E+00
5.00E+02
1.00E+03
1.50E+03
0 5 10 15 20
Stre
ss [
kPa/
m]
Distance along frame [m]
Normal stress in Direction 2
-3.00E+03
-2.00E+03
-1.00E+03
0.00E+00
1.00E+03
2.00E+03
3.00E+03
0 5 10 15 20
Stre
ss [
kPa/
m]
Distance along frame [m]
Shear stress in Direction 3

B-18
B.3 Temperature Gradient Plus
B.3.1 Endsection
-6.00E+04
-4.00E+04
-2.00E+04
0.00E+00
2.00E+04
4.00E+04
6.00E+04
8.00E+04
0 5 10 15 20
Forc
e [
N/m
]
Distance along frame [m]
Normal Force in Direction 1
-4.00E+04
-2.00E+04
0.00E+00
2.00E+04
4.00E+04
6.00E+04
8.00E+04
1.00E+05
0 5 10 15 20
Forc
e [
N/m
]
Distance along frame [m]
Normal Force in Direction 2

B-19
-8.00E+04
-6.00E+04
-4.00E+04
-2.00E+04
0.00E+00
2.00E+04
4.00E+04
6.00E+04
8.00E+04
1.00E+05
0 5 10 15 20
Forc
e [
Nm
/m]
Distance along frame [m]
Moment in Direction 1
-2.00E+04
-1.00E+04
0.00E+00
1.00E+04
2.00E+04
3.00E+04
4.00E+04
5.00E+04
6.00E+04
7.00E+04
0 5 10 15 20
Forc
e [
Nm
/m]
Distance along frame [m]
Moment in Direction 2

B-20
-80000
-60000
-40000
-20000
0
20000
40000
60000
80000
0 5 10 15 20
Forc
e [
Nm
/m]
Distance along frame [m]
Moment in Direction 3
-4.00E+02
-2.00E+02
0.00E+00
2.00E+02
4.00E+02
6.00E+02
8.00E+02
1.00E+03
1.20E+03
1.40E+03
1.60E+03
0 5 10 15 20
Stre
ss [
kPa/
m]
Distance along frame [m]
Normal stress in Direction 1

B-21
-5.00E+02
0.00E+00
5.00E+02
1.00E+03
1.50E+03
2.00E+03
0 5 10 15 20
Stre
ss [
kPa/
m]
Distance along frame [m]
Normal stress in Direction 2
-1.50E+03
-1.00E+03
-5.00E+02
0.00E+00
5.00E+02
1.00E+03
1.50E+03
0 5 10 15 20
Stre
ss [
kPa/
m]
Distance along frame [m]
Shear stress in Direction 3

B-22
B.3.2 Quarter section (L/4)
-3.00E+04
-2.00E+04
-1.00E+04
0.00E+00
1.00E+04
2.00E+04
3.00E+04
4.00E+04
0 5 10 15 20
Forc
e [
N/m
]
Distance along frame [m]
Normal Force in Direction 1
-5.00E+03
0.00E+00
5.00E+03
1.00E+04
1.50E+04
2.00E+04
2.50E+04
3.00E+04
3.50E+04
0 5 10 15 20
Forc
e [
N/m
]
Distance along frame [m]
Normal Force in Direction 2

B-23
-1.00E+05
-5.00E+04
0.00E+00
5.00E+04
1.00E+05
1.50E+05
0 5 10 15 20
Forc
e [
Nm
/m]
Distance along frame [m]
Moment in Direction 1
-3.00E+04
-2.00E+04
-1.00E+04
0.00E+00
1.00E+04
2.00E+04
3.00E+04
4.00E+04
5.00E+04
6.00E+04
7.00E+04
0 5 10 15 20
Forc
e [
Nm
/m]
Distance along frame [m]
Moment in Direction 2

B-24
-2.50E+04
-2.00E+04
-1.50E+04
-1.00E+04
-5.00E+03
0.00E+00
5.00E+03
1.00E+04
1.50E+04
2.00E+04
2.50E+04
0 5 10 15 20
Forc
e [
Nm
/m]
Distance along frame [m]
Moment in Direction 3
-5.00E+02
0.00E+00
5.00E+02
1.00E+03
1.50E+03
2.00E+03
2.50E+03
0 5 10 15 20
Stre
ss [
kPa/
m]
Distance along frame [m]
Normal stress in Direction 1

B-25
-1.00E+03
-5.00E+02
0.00E+00
5.00E+02
1.00E+03
1.50E+03
2.00E+03
2.50E+03
0 5 10 15 20
Stre
ss [
kPa/
m]
Distance along frame [m]
Normal stress in Direction 2
-4.00E+02
-3.00E+02
-2.00E+02
-1.00E+02
0.00E+00
1.00E+02
2.00E+02
3.00E+02
4.00E+02
0 5 10 15 20
Stre
ss [
kPa/
m]
Distance along frame [m]
Shear stress in Direction 3

B-26
B.4 Temperature Gradient Minus
B.4.1 Endsection
-1.00E+05
-5.00E+04
0.00E+00
5.00E+04
1.00E+05
1.50E+05
0 5 10 15 20
Forc
e [
N/m
]
Distance along frame [m]
Normal Force in Direction 1
-6.00E+04
-4.00E+04
-2.00E+04
0.00E+00
2.00E+04
4.00E+04
6.00E+04
8.00E+04
0 5 10 15 20
Forc
e [
N/m
]
Distance along frame [m]
Normal Force in Direction 2

B-27
-1.00E+05
-5.00E+04
0.00E+00
5.00E+04
1.00E+05
1.50E+05
2.00E+05
2.50E+05
3.00E+05
3.50E+05
0 5 10 15 20
Forc
e [
Nm
/m]
Distance along frame [m]
Moment in Direction 1
-40000
-30000
-20000
-10000
0
10000
20000
30000
40000
50000
0 5 10 15 20
Forc
e [
Nm
/m]
Distance along frame [m]
Moment in Direction 2

B-28
-200000
-150000
-100000
-50000
0
50000
100000
150000
200000
0 5 10 15 20
Forc
e [
Nm
/m]
Distance along frame [m]
Moment in Direction 3
-1.00E+03
-8.00E+02
-6.00E+02
-4.00E+02
-2.00E+02
0.00E+00
2.00E+02
4.00E+02
6.00E+02
8.00E+02
1.00E+03
0 5 10 15 20
Stre
ss [
kPa/
m]
Distance along frame [m]
Normal stress in Direction 1

B-29
-1.50E+03
-1.00E+03
-5.00E+02
0.00E+00
5.00E+02
1.00E+03
1.50E+03
0 5 10 15 20
Stre
ss [
kPa/
m]
Distance along frame [m]
Normal stress in Direction 2
-1.00E+03
-8.00E+02
-6.00E+02
-4.00E+02
-2.00E+02
0.00E+00
2.00E+02
4.00E+02
6.00E+02
8.00E+02
1.00E+03
0 5 10 15 20
Stre
ss [
kPa/
m]
Distance along frame [m]
Shear stress in Direction 3

B-30
B.4.2 Quarter section (L/4)
-5.00E+04
-4.00E+04
-3.00E+04
-2.00E+04
-1.00E+04
0.00E+00
1.00E+04
2.00E+04
3.00E+04
4.00E+04
5.00E+04
0 5 10 15 20
Forc
e [
N/m
]
Distance along frame [m]
Normal Force in Direction 1
-2.00E+04
-1.50E+04
-1.00E+04
-5.00E+03
0.00E+00
5.00E+03
1.00E+04
1.50E+04
0 5 10 15 20
Forc
e [
N/m
]
Distance along frame [m]
Normal Force in Direction 2

B-31
-1.00E+05
0.00E+00
1.00E+05
2.00E+05
3.00E+05
4.00E+05
5.00E+05
6.00E+05
0 5 10 15 20
Forc
e [
Nm
/m]
Distance along frame [m]
Moment in Direction 1
-4.00E+04
-3.00E+04
-2.00E+04
-1.00E+04
0.00E+00
1.00E+04
2.00E+04
3.00E+04
4.00E+04
5.00E+04
6.00E+04
0 5 10 15 20
Forc
e [
Nm
/m]
Distance along frame [m]
Moment in Direction 2

B-32
-4.00E+04
-3.00E+04
-2.00E+04
-1.00E+04
0.00E+00
1.00E+04
2.00E+04
3.00E+04
4.00E+04
0 5 10 15 20
Forc
e [
Nm
/m]
Distance along frame [m]
Moment in Direction 3
-1.50E+03
-1.00E+03
-5.00E+02
0.00E+00
5.00E+02
1.00E+03
1.50E+03
0 5 10 15 20
Stre
ss [
kPa/
m]
Distance along frame [m]
Normal stress in Direction 1

B-33
-1.50E+03
-1.00E+03
-5.00E+02
0.00E+00
5.00E+02
1.00E+03
1.50E+03
2.00E+03
0 5 10 15 20
Stre
ss [
kPa/
m]
Distance along frame [m]
Normal stress in Direction 2
-3.00E+02
-2.00E+02
-1.00E+02
0.00E+00
1.00E+02
2.00E+02
3.00E+02
0 5 10 15 20
Stre
ss [
kPa/
m]
Distance along frame [m]
Shear stress in Direction 3

C-1
Appendix C - Reinforcement Superstructure Support
Upper edge Lower Edge Interior side Exterior side
Safety class 2 2 2 2
Life length L50 L50 L50 L50
Exposure class XD1 XD3 XD3 XD1
C1.5 1.5 1.5 1.5
Maximum allowed crack width 0.3 0.2 0.2 0.3
Material properties and constants
Concrete
fck [MPa] 35
fctk,0.05 [MPa] 2.2
fctm [MPa] 3.2
Ecm [GPa] 34
fcd [MPa] 23.33
0.8
1
cu3 [‰] 3.5
Reinforcement
fyk [MPa] 500
Es [GPa] 200
fyd [MPa] 435
Crack width
1 0.8
2 0.5
3 7
4 0.425
5.9
RH [%] 80

C-2
Superstructure - Transversal direction - Lower Edge
X [m] Node - Superstructure
Node - Whole structure
Line - Superstructure
Line - Whole structure
Surface - Superstructure
Surface - Whole structure
Surface Vertical - Superstructure
Surface Vertical - Whole structure
Minimum reinforcement
6.5 75.1 6.9 76.1 6.9 74.2 2.7 73.8 8.6 3.5
6.7 48.3 5.8 47.8 5.8 47.6 2.9 47.5 6.7 3.5
7.2 11.8 2.9 11.8 2.9 11.6 1.8 11.5 2.6 3.5
7.5 8.0 2.4 8.0 2.4 7.8 1.4 7.7 2.0 3.5
7.8 5.7 2.1 5.7 2.0 5.6 1.3 5.5 1.6 3.5
8.5 3.1 1.8 3.1 1.7 3.0 1.4 2.9 1.3 3.5
9.1 1.5 1.6 1.2 1.6 1.4 1.5 1.2 1.1 3.5
9.7 0.0 1.6 0.0 1.6 0.0 1.6 0.0 1.1 3.5
10.3 0.0 1.6 0.0 1.5 0.0 1.7 0.0 1.1 3.5
10.7 0.0 1.5 0.0 1.5 0.0 1.7 0.0 1.1 3.5
Support - Transversal direction - Interior side
X [m] Node - Superstructure
Node - Whole structure
Line - Superstructure
Line - Whole structure
Surface - Superstructure
Surface - Whole structure
Surface Vertical - Superstructure
Surface Vertical - Whole structure
Minimum reinforcement
0.0 0.0 0.0 0.0 71.2 0.0 25.0 0.0 1.0 3.5
0.4 0.0 0.0 0.0 0.0 0.0 11.0 0.0 1.0 3.5
1.0 0.0 0.0 0.0 0.0 0.0 8.0 0.0 3.2 3.5
1.6 0.0 0.0 0.0 0.0 0.0 0.0 0.0 0.0 3.5
2.2 0.0 0.0 0.0 0.0 0.0 0.0 0.0 0.0 3.5
2.8 0.0 0.0 0.0 0.0 0.0 0.0 0.0 0.0 3.5
3.5 0.0 0.0 0.0 0.0 0.0 0.0 0.0 0.0 3.5
4.1 0.0 0.0 0.0 0.0 0.0 0.0 0.0 0.0 3.5
4.7 0.0 0.0 0.0 0.0 0.0 0.0 0.0 0.0 3.5
5.3 0.0 0.0 0.0 0.0 0.0 0.0 0.0 0.0 3.5
5.9 0.0 0.0 0.0 0.0 0.0 0.0 0.0 0.0 3.5
6.5 0.0 2.4 0.0 2.3 0.0 0.0 0.0 0.0 3.5
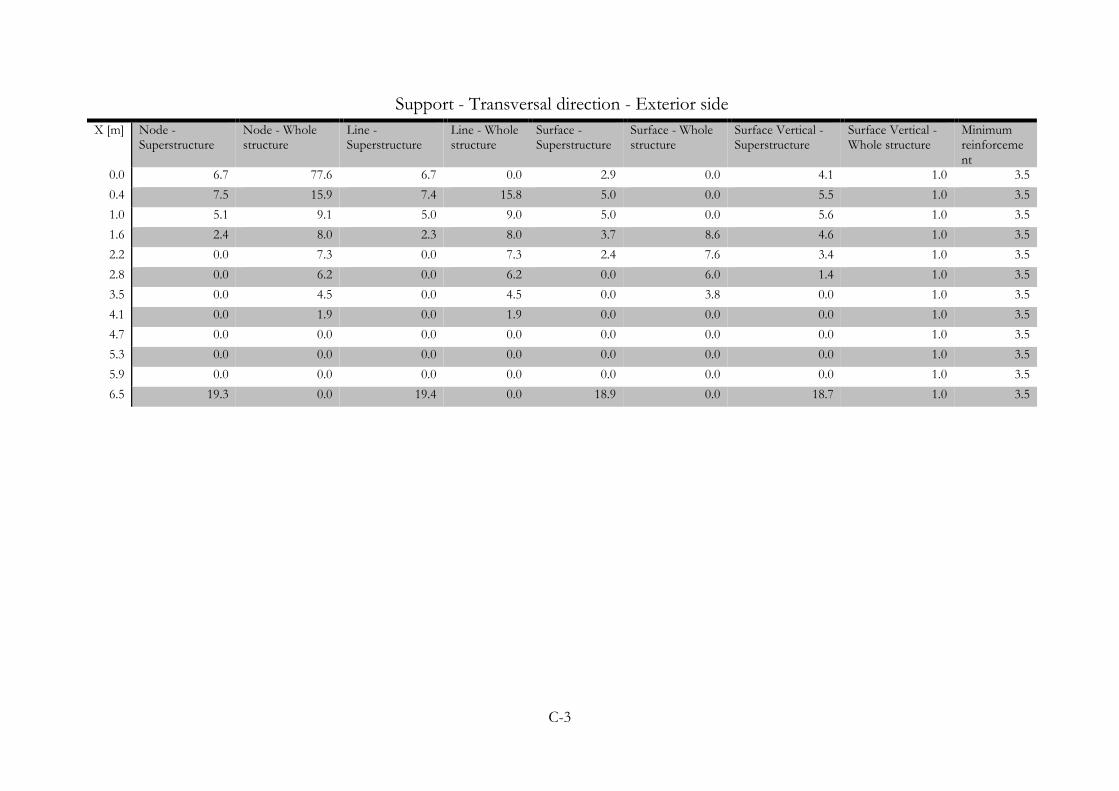
C-3
Support - Transversal direction - Exterior side
X [m] Node - Superstructure
Node - Whole structure
Line - Superstructure
Line - Whole structure
Surface - Superstructure
Surface - Whole structure
Surface Vertical - Superstructure
Surface Vertical - Whole structure
Minimum reinforcement
0.0 6.7 77.6 6.7 0.0 2.9 0.0 4.1 1.0 3.5
0.4 7.5 15.9 7.4 15.8 5.0 0.0 5.5 1.0 3.5
1.0 5.1 9.1 5.0 9.0 5.0 0.0 5.6 1.0 3.5
1.6 2.4 8.0 2.3 8.0 3.7 8.6 4.6 1.0 3.5
2.2 0.0 7.3 0.0 7.3 2.4 7.6 3.4 1.0 3.5
2.8 0.0 6.2 0.0 6.2 0.0 6.0 1.4 1.0 3.5
3.5 0.0 4.5 0.0 4.5 0.0 3.8 0.0 1.0 3.5
4.1 0.0 1.9 0.0 1.9 0.0 0.0 0.0 1.0 3.5
4.7 0.0 0.0 0.0 0.0 0.0 0.0 0.0 1.0 3.5
5.3 0.0 0.0 0.0 0.0 0.0 0.0 0.0 1.0 3.5
5.9 0.0 0.0 0.0 0.0 0.0 0.0 0.0 1.0 3.5
6.5 19.3 0.0 19.4 0.0 18.9 0.0 18.7 1.0 3.5


TRITA-BKN. Master Thesis 406 ISSN 1103-4297
ISRN KTH/BKN/EX-406-SE
www.kth.se