temperatura e mortalidade por causas samuel … · samuel osorio helena ribeiro fredi diaz...
TRANSCRIPT

Samuel OsorioHelena RibeiroFredi Diaz
TEMPERATURA E MORTALIDADE POR CAUSAS RESPIRATÓRIAS EM IDOSOS
DE SÃO PAULO 2003-2013

§ 21° 49' Sur 49° 12' Oeste§ Altitude: 760 m § Area de 1.523 km2
§ 11.821.876 habitantes para julho 2013§ > 65 anos: 1’400.000 homens (3.5 %) e
1’900.000 mulheres (4.7 %)
§ Clima subtropical úmido (Köppen Cfa)§ Ilhas de calor – diferença de
temperatura até 10 ºC
1. INTRODUÇÃO: MUNICÍPIO DE SÃO PAULO
Fonte: Atlas Ambiental do Município de São Paulo

1. INTRODUÇÃO: TEMPERATURA SÃO PAULO
• Verão: Temperatura média de 21.3o . Média de humidade relativa de 82,1 % • Inverno: Temperatura média de 15.7o C . Média de humidade relativa de 79 %
Temperaturas Município de São Paulo, 1961-‐1990
Fonte: Instituto Nacional de Meteorologia (Horto Forestal)

1. INTRODUÇÃO: POPULAÇÃO IDOSA DE SÃO PAULO
Pirâmide populacional por sexo, São Paulo 2010.
Fonte: Instituto Brasileiro de Geografia e Estatística (IBGE)
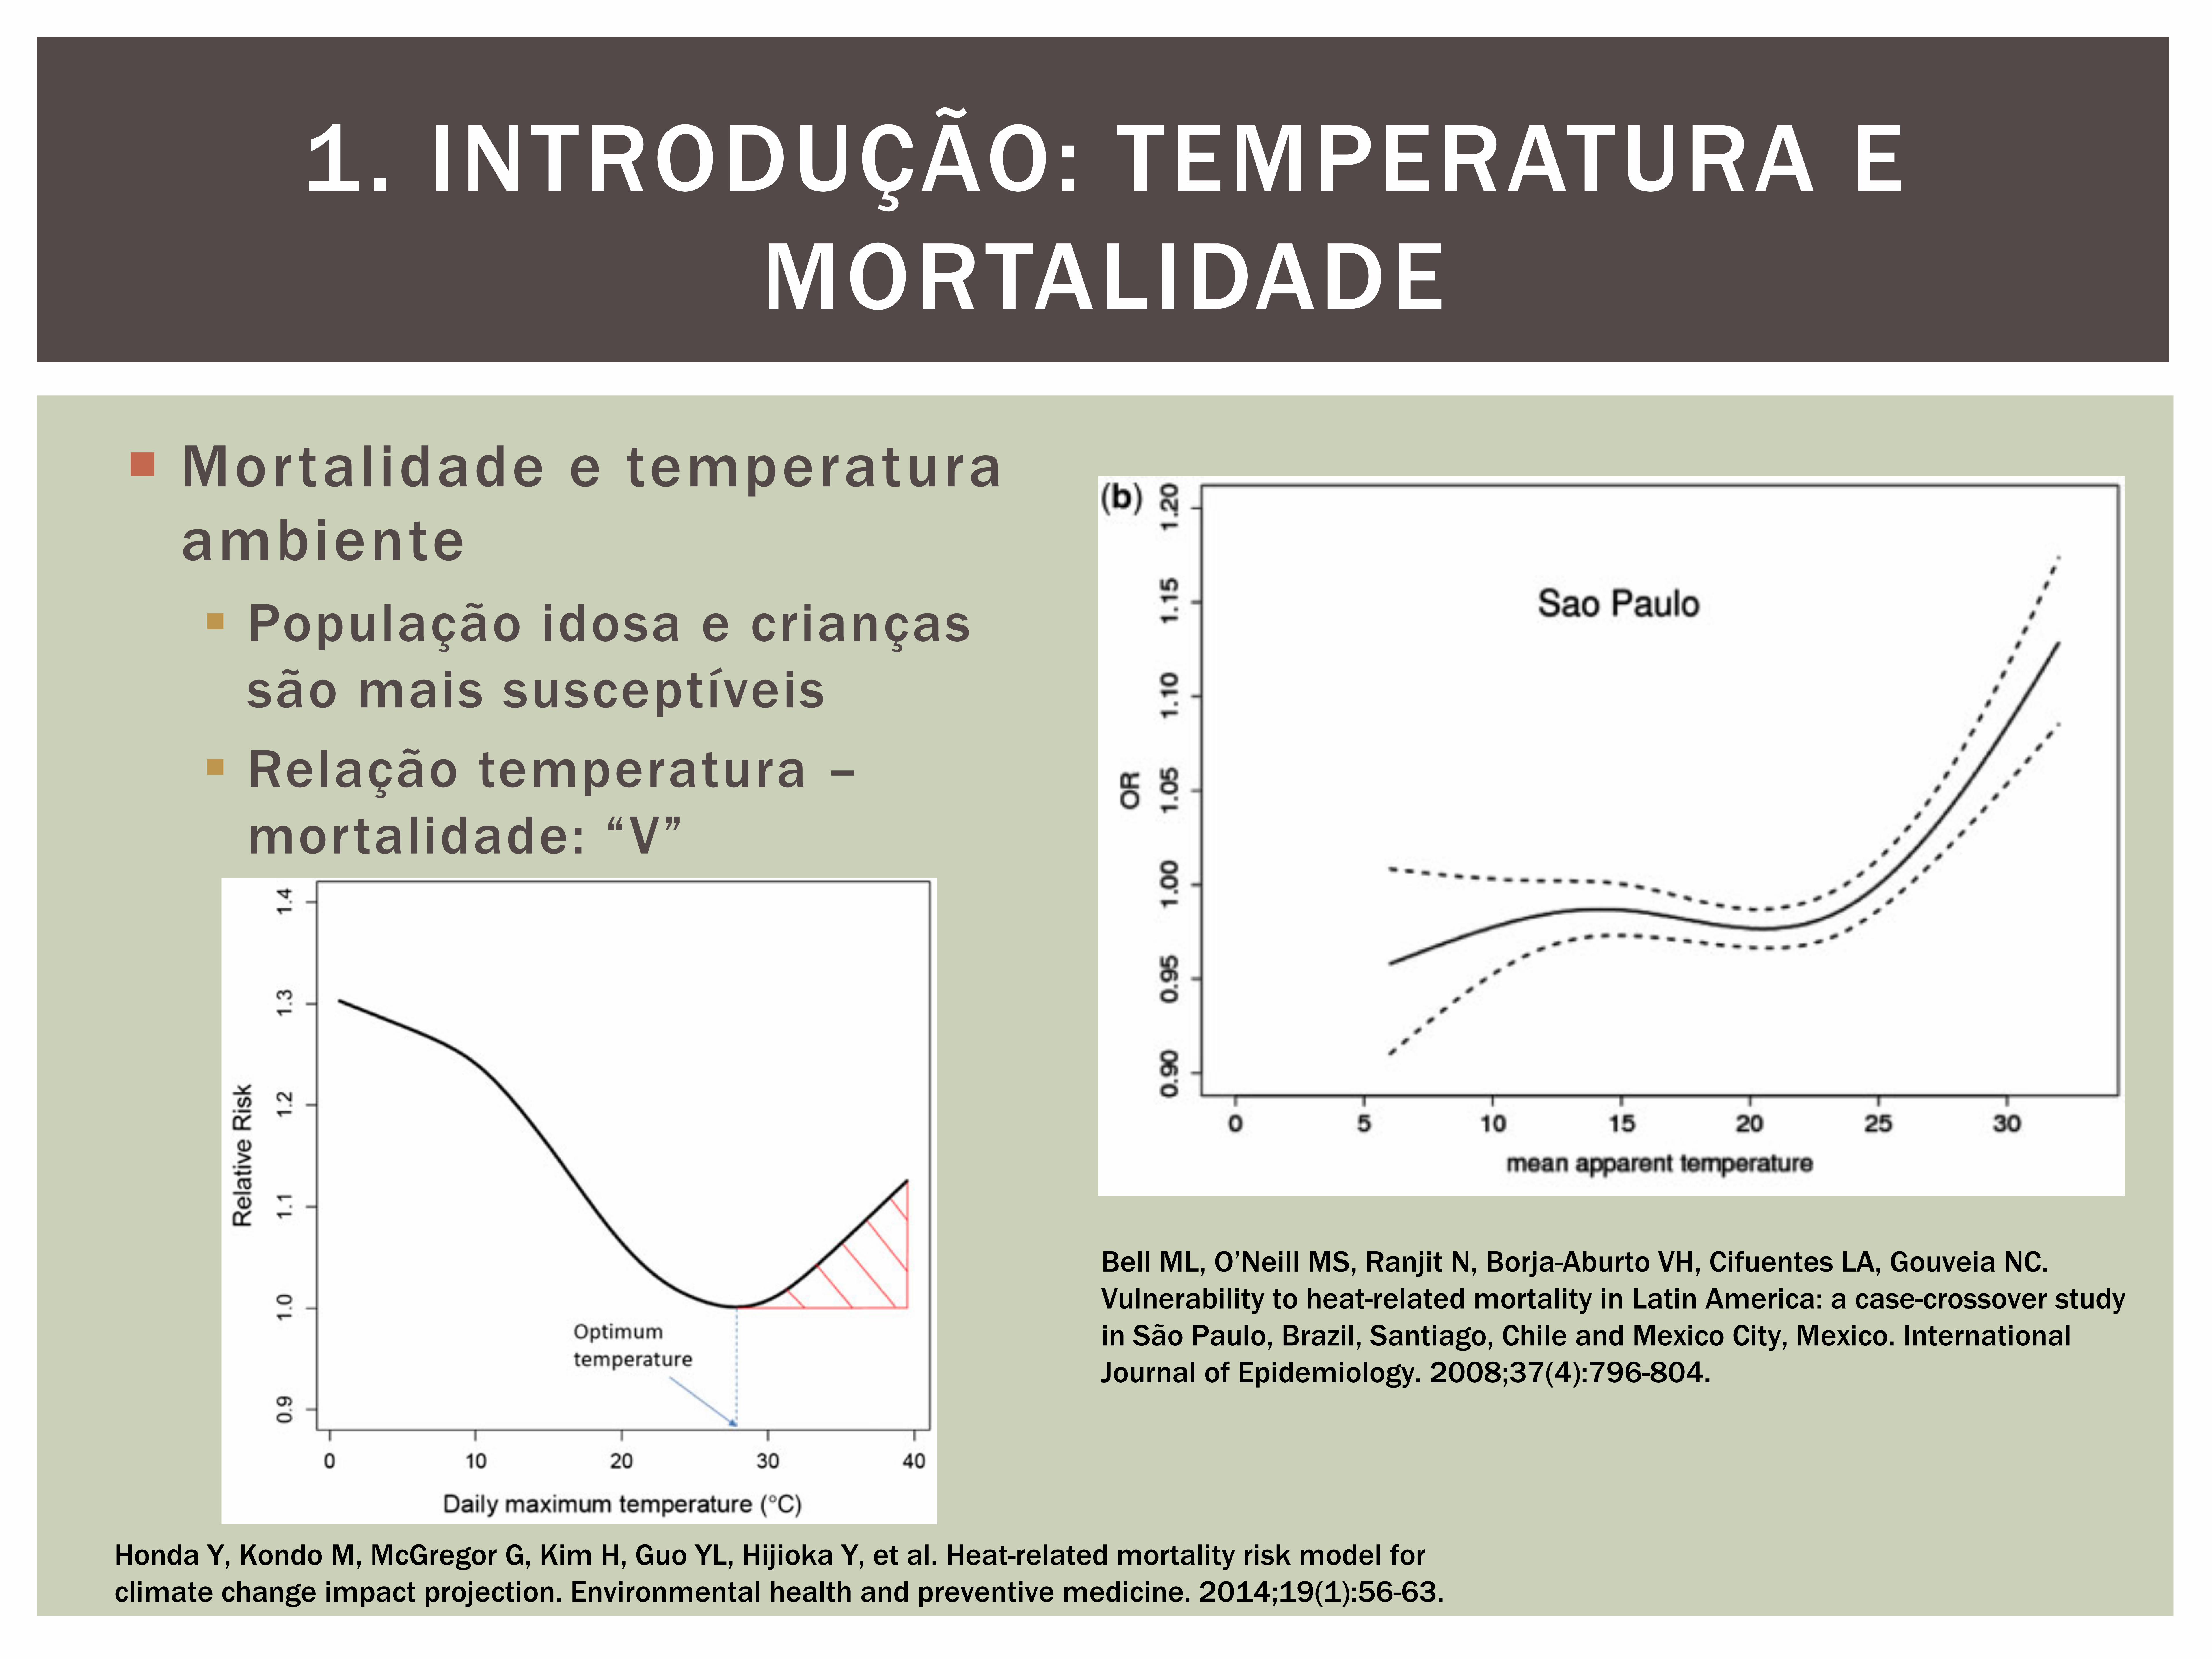
¡ Mortalidade e temperatura ambiente§ População idosa e crianças
são mais susceptíveis§ Relação temperatura –
mortalidade: “V”
1. INTRODUÇÃO: TEMPERATURA E MORTALIDADE
impact; For example, baseline temperature and 2030
mortality were used to determine the baseline excess, and
compared with the 2030 excess, for which we used 2030temperature and 2030 mortality. In terms of adaptation to
warmer climate, we assumed 0 % adaptation when the OT
as of the current climate is used and 100 % adaptationwhen the OT as of the future climate is used. The midpoint
of the OTs of the two types of adaptation was set to be the
OT for 50 % adaptation.Results We calculated heat-related excess mortality for
2030 and 2050.
Conclusions Our new model is considered to be better fit,and more precise and robust compared with the previous
model.
Keywords Heat-related mortality ! Excess deaths !Climate change ! Projection ! Adaptation
Introduction
In 2002, the World Health Organization reported for the
first time the health impact of climate change [1]. In thereport, however, heat-related impact was not included in
the final aggregate total number, because it was not easy to
model the relationship between ambient temperature andmortality for projecting future impact of climate change.
One of the reasons for not being able to construct the
model was as follows: In many places of the world, aV-shaped temperature–mortality relation was observed [2,
3]. Using this relation, heat-related excess mortality can be
defined as the shaded area in Fig. 1 (where the V-shapedrelation was constructed from data for Tokyo from 1972 to
2008). So, if we can identify the optimum temperature
(OT), at which the mortality risk becomes smallest, weshould be able to estimate the excess mortality with some
additional information (as described later). Although the
OT level was found to be higher for warmer areas [4, 5], nogood index to estimate the OT had been available.
In 2007, we found that the optimum temperature can be
estimated using the 80–85th percentile of daily maximumtemperature based on 47 prefectures in Japan [6]. Using
this estimation method and a risk function model, we
projected excess mortality due to heat [7]. The projectionmethod can be summarized as follows: The observation
period was 24 years (1972–1995), and we used males and
females with all ages combined. The OT was the 85thpercentile value of daily maximum temperature. Although
the risk function of excess mortality due to heat is non-
linear as shown in Fig. 1, we used the categorical functionshown in Fig. 2. In this projection, we do not even show a
confidence interval.
Although the above projection was one of the first
projections of climate change impact on heat-related
mortality, there were some weaknesses to the method,including (1) the applicability of the OT estimation method
to other regions of the world, and (2) that the risk function
was categorical. In this paper, we solve problem (2) byusing a nonparametric risk function. This should be a
substantial improvement, because the average of the tem-
peratures in the highest temperature category was actuallyvery close to the lower boundary of the category and huge
underestimation was expected for the risk of this category.
Regarding problem (1), we examine in this paper the
Fig. 1 Heat-related excess mortality, considered as the shaded area;the figure shows an example using data for Tokyo Prefecture for1972–2008
Fig. 2 Risk function of excess mortality due to heat used in theprevious projection
Environ Health Prev Med (2014) 19:56–63 57
123
Honda Y, Kondo M, McGregor G, Kim H, Guo YL, Hijioka Y, et al. Heat-related mortality risk model for climate change impact projection. Environmental health and preventive medicine. 2014;19(1):56-63.
Similarly, susceptibility by sex differed by community.While effect estimates for men and women werecomparable for any city, associations were higher formen in Santiago and Sao Paulo and for women inMexico City. The association between temperatureand mortality by education level differed by commu-nity. The highest effect estimates were observed forthe most educated in Mexico City and the leasteducated in Sao Paulo. Older persons were consis-tently more susceptible. Trends in increasing risk withage were observed in all communities (SupplementaryFigure S3), and effects were strongest in the oldestage category (565) in Sao Paulo and Mexico City.We also considered multiple susceptibilities,
although the sample size for such analysis is morelimited than for our general analysis. Of the factorsexamined in Table 3 (cause of death, sex, educationalattainment and age), the strongest impact on heat-related mortality consistent across cities was for age,with higher effects in the older age categories.Therefore, we further examined this age group withmultiple susceptibilities, examining whether mortalityrisk varied by cause of death, sex or educational level
for those 565 years (Supplementary Table S2). Forthis older population, the strongest effect was forrespiratory death in Sao Paulo. Effects for men andwomen were not dramatically different for any citywithin the oldest age category. However, central esti-mates of association showed higher effects for womenin Sao Paulo and men in Mexico City. For educationlevel, a strong effect for those with a primary educa-tion remained in Sao Paulo when the dataset wasrestricted to observations 565 years. However, apositive association also was observed for those withthe highest education level (university).Sao Paulo results show a gradient of associations
by educational attainment with higher estimates forlower education (Table 3). Thus, we further examinedthe association between heat and mortality risk byeducation within this city by other potential suscepti-bilities. Supplementary Table S3 provides results byeducation further stratified by sex in Sao Paulo.The strongest association remains for those with aprimary education, with indication of an associationfor women with a university degree, but with lessevidence for men with this educational training.
Figure 2 Exposure–response curves for mean apparent temperature and risk of mortality for: (a) Santiago; (b) Sao Pauloand (c) Mexico City. Note: The solid lines reflect the central estimate and the dashed lines the 95% CI. All models areadjusted for ozone at lag 0 for all cities and for PM10 at lag 1 for Santiago and lag 0 for Mexico City and Sao Paulo
800 INTERNATIONAL JOURNAL OF EPIDEMIOLOGY
by guest on July 5, 2013http://ije.oxfordjournals.org/
Dow
nloaded from
Bell ML, O’Neill MS, Ranjit N, Borja-Aburto VH, Cifuentes LA, Gouveia NC. Vulnerability to heat-related mortality in Latin America: a case-crossover study in São Paulo, Brazil, Santiago, Chile and Mexico City, Mexico. International Journal of Epidemiology. 2008;37(4):796-804.

¡ Entender o comportamento da mortalidade por causas respiratórias no tempo em relação à temperatura ambiente
¡ Geração de planos, políticas o estratégias de adaptação e mitigação dos efeitos na saúde humana por mudanças na temperatura ambiente
2. JUSTIFICATIVA

¡ Geral: caracterizar a relação entre mortalidade respiratória em idosos (> 65 anos) e temperatura mínima em São Paulo e Bogotá 2003 – 2013.
¡ Específicos:§ Descrever a tendência da mortalidade respiratória em idosos (>65
anos) em relação à temperatura ambiente no período 2003-2013§ Analisar a relação entre temperatura ambiente e mortalidade
respiratória em idosos (>65 anos).
3. OBJETIVOS

¡ Estudo tipo ecológico - análise de séries temporais
§ Modelos de regressão: § Linear, § Poisson (MLG),§ Binomial negativo,§ Praiss Winsten AR(1)§ LOESS (Locally weighted polynomial regression) - alisamento
¡ Dados:§ Meteorológicos: dados diários de temperatura e umidade relativa (IAG-
USP) § Mortalidade: dados diários de mortes por causas respiratórias em idosos
(> 65 anos) DATASUS.
¡ Software: R 3.1.1 e Stata 13.1
4. METODOLOGIA

5. RESULTADOS PARCIAIS
Contagem de mortes por causas respiratórias em idosos, São Paulo 2003-2013
Histograma Gráfico quantil - quantil para distribuição normal
Fonte: dados da pesquisa
Fonte: dados da pesquisa

5. RESULTADOS PARCIAIS
Estatísticas descritivas, São Paulo 2003-2013
No. de mortes respiratórias no período 2003-2013
No. mortes Temp mín HumidadeMin. 3 2.4 34.31 Qu. 14 12.9 75.7Mediana 17 15.5 81.2Média 17.09 15.2 80.33 Qu. 20 17.9 86.1Max 37 22.5 97.3Var 25.49 11.27 72.34
Fonte: dados da pesquisa
Fonte: dados da pesquisa

RESULTADOS PARCIAIS
Lineal Poisson Binomial negativo Praiss Winsten AR(1)Coeficiente Valor de p Coeficiente Valor de p Coeficiente Valor de p Coeficiente Valor de p
Dia-‐8.89E-‐05 0.3814 -‐1.44E-‐05 1.34e-‐05 ***
-‐1.46E-‐057.32e-‐05 *** -‐8.33E-‐05 0.498
Temp min-‐4.2261E-‐02 9.88e-‐11 *** -‐2.35E-‐02 < 2e-‐16 ***
-‐2.35E-‐02< 2e-‐16 *** -‐3.7658E-‐02 0**
Umidade-‐6.602E-‐0.3 0.0102 * -‐3.11E-‐03 2.33e-‐12 ***
-‐3.13E-‐033.24e-‐10 *** -‐6.1705E-‐03 0.024*
Limitações Sazonal Var / Med Distribuição normalAutocor. Autocor. Autocor.
VantagensFácil entender
sobredisperção da variança
Especial para dados sazonaisSoluciona autocorrelação
Fonte: dados da pesquisa
Modelos usados para análise da relação mortalidade resp – temp mín, SP 2003-2013

RESULTADOS PARCIAIS
No. de mortos do modelo binomial neg e temperatura mínima, São Paulo 2003-2013
Fonte: dados da pesquisa

RESULTADOS PARCIAIS
Tendências da temp min e taxa de mortalidade, SP 2003-2013 (LOESS)
Fonte: dados da pesquisa
¡ O método Praiss Winsten é o mais adequado, soluciona autocorrelação dos dados,
¡ Foi encontrada uma relação negativa entre mortalidade respiratória em idosos e: dia, temperatura mínima, e umidade média, a qual foi estatisticamente significativa para as últimas duas,
¡ Parece existir uma tendência negativa no tempo para a mortalidade por causas respiratórias em idosos em relação a temperatura e umidade, para o período 2003-2013,
¡ Diminuição da taxa de mortalidade por causas respiratórias em idosos e das temp mín relacionada com mudanças climáticas ?
CONCLUSÕES