temasek review 2014- our journey has just begun (media conference presentation)
TRANSCRIPT

Tuesday, 8 July 2014
Our journey has just begun
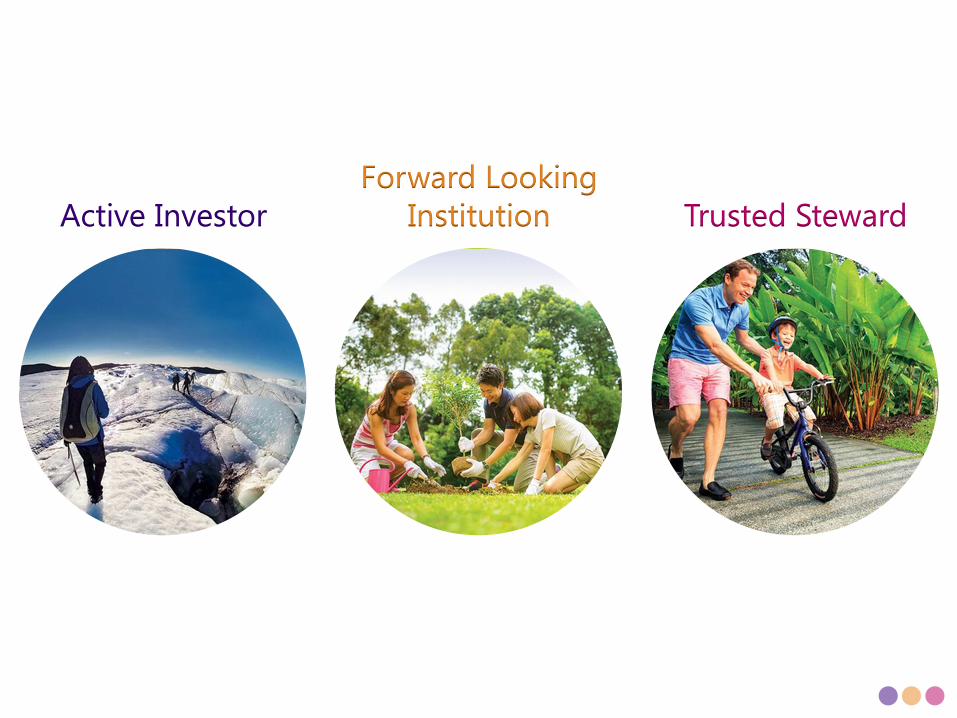
Forward Looking
Institution
Trusted Steward
Active Investor

Tuesday, 8 July 2014
Our journey has just begun

4
Portfolio Value since Inception
Resilient Portfolio
1 Incorporation of Temasek on 25 June 1974. 2 Financial year 75 began 25 June 1974 and ended 31 December 1975. 3 Financial year-end was changed from 31 December before 1993 to 31 March from 1994 onwards. 4 FRS39 Financial Instruments: Recognition and Measurement, introduced during year ended 31 March 2006, requires available-for-sale financial assets to be
measured at fair value.
223
187
172
S$b

5
Long Term Returns to Shareholder
16% Compounded Annualised S$ Return since Inception
18
16
7
12
15
4
16
14
6
9
11
4
2
TSR1 in US$ (%) TSR1 in S$ (%)
Period (in years)
Since inception
(1974)
30
20
10
5
3
1
(as at 31 March 2014) 1 Total Shareholder Return
0

6
One, 10, & 20-Year S$ Returns to Shareholder
Stable Long Term Performance
Rolling TSR (%)
20-year
10-year
One-year
18 16 18 17
13 16 15 15 14
6 5 6 8 10
6 6 9 10 13 9
16
25 27
7
(30)
43
5 1
9
2
05 06 07 08 09 10 11 12 13 14(as at 31 March)

7
16
14
6
9
11
4
2
9
9
9
9
9
8
8
TSR and Risk-Adjusted Cost of Capital
S$ Total Shareholder Return (TSR) and Risk-adjusted Hurdle Rate (%)
Since inception (1974)
TSR in S$ terms
Risk-adjusted hurdle rate
Period (in years)
20
30
1
3
5
10
(as at 31 March 2014)

8
16
14
6
9
11
2
8
6
5
9
16
(1)
4
7
12
4
9
8
6
4
15
21
TSR and MSCI Indices
N/A
N/A
20
30
1
Since inception (1974)
5
10
Temasek
MSCI Singapore
MSCI AC Asia ex-JP
MSCI World
(developed economies)
Period (in years)
(as at 31 March 2014)
S$ Total Shareholder Return (TSR) and MSCI Indices (%)
9
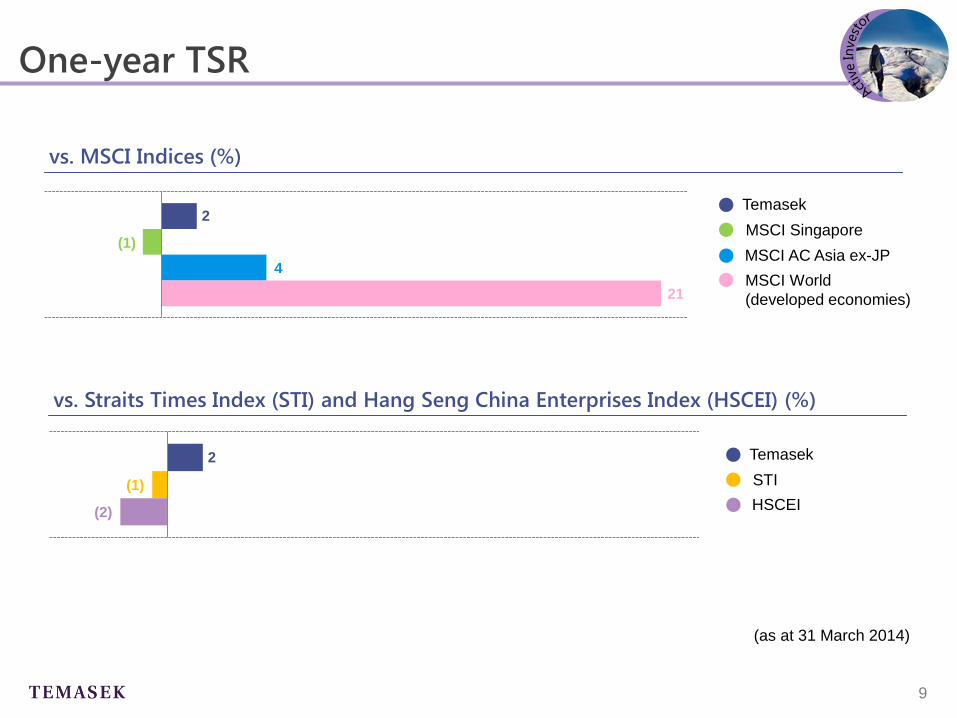
One-year TSR
vs. MSCI Indices (%)
(as at 31 March 2014)
2
(1)
4
21
2
(1)
(2)
Temasek
STI
HSCEI
Temasek
MSCI Singapore
MSCI AC Asia ex-JP
MSCI World
(developed economies)
vs. Straits Times Index (STI) and Hang Seng China Enterprises Index (HSCEI) (%)

10
Group Income Statements
Steady Group Net Profit
(S$b)
For year ended 31 Mar 2005 2006 2007 2008 2009 2010 2011 2012 2013 2014
Revenue 67.5 79.8 74.6 83.3 79.6 76.7 83.5 83.5 83.8 81.1
Profit before income tax 12.2 19.0 14.3 25.5 10.4 8.5 17.8 14.8 15.2 15.8
Profit attributable to equity
holder of the Company 7.5 12.8 9.1 18.2 6.2 4.6 12.7 10.7 10.6 10.9
8
11 13
5 6
18
9
13 11 11

11
(S$b)
As at 31 Mar 2005 2006 2007 2008 2009 2010 2011 2012 2013 2014
Total assets 199.1 213.7 242.4 295.5 247.9 284.8 297.9 302.6 317.4 319.0
Shareholder equity
before fair value
reserve
70.9 83.6 92.9 120.2 119.9 127.8 134.6 146.4 155.9 172.4
Fair value reserve1 - 7.0 21.1 23.9 (1.5) 21.9 20.9 11.8 13.2 14.9
Shareholder equity 70.9 90.6 114.0 144.1 118.4 149.7 155.5 158.2 169.1 187.3
Net debt2 26.9 16.7 23.6 33.8 22.1 17.8 9.5 16.1 13.3 3.7
Group Balance Sheets
Strong Foundation Built Over Decades
1 FRS39 Financial Instruments: Recognition and Measurement, introduced during year ended 31 March 2006, requires available-for-sale financial
assets to be measured at fair value. 2 Total debt less cash and cash equivalents.
Steady growth Group Shareholder Equity: S$187b
Up S$18b
from last year

12
(S$b)
As at 31 Mar 2005 2006 2007 2008 2009 2010 2011 2012 2013 2014
Total assets 199.1 213.7 242.4 295.5 247.9 284.8 297.9 302.6 317.4 319.0
Shareholder equity
before fair value
reserve
70.9 83.6 92.9 120.2 119.9 127.8 134.6 146.4 155.9 172.4
Fair value reserve1 - 7.0 21.1 23.9 (1.5) 21.9 20.9 11.8 13.2 14.9
Shareholder equity 70.9 90.6 114.0 144.1 118.4 149.7 155.5 158.2 169.1 187.3
Net debt2 26.9 16.7 23.6 33.8 22.1 17.8 9.5 16.1 13.3 3.7
Full financial flexibility Temasek ended the year in a net cash position
Group Balance Sheets
Strong Foundation Built Over Decades
1 FRS39 Financial Instruments: Recognition and Measurement, introduced during year ended 31 March 2006, requires available-for-sale financial
assets to be measured at fair value. 2 Total debt less cash and cash equivalents.

Modest one-year returns
Robust longer term returns
Opportunities ahead
Full flexibility with strong
balance sheet and liquidity

14
Investment Themes
Growing
Middle Income
Populations
Transforming
Economies
Deepening
Comparative
Advantages
Emerging
Champions
emphasise future
long term trends

15
Investment Themes
Strong home base, at inflexion points
Tapping potential of transforming economies
Leveraging growing consumer demands
Economies, businesses with distinctive edge
Growing
Middle Income
Populations
Transforming
Economies
Deepening
Comparative
Advantages
Emerging
Champions
16
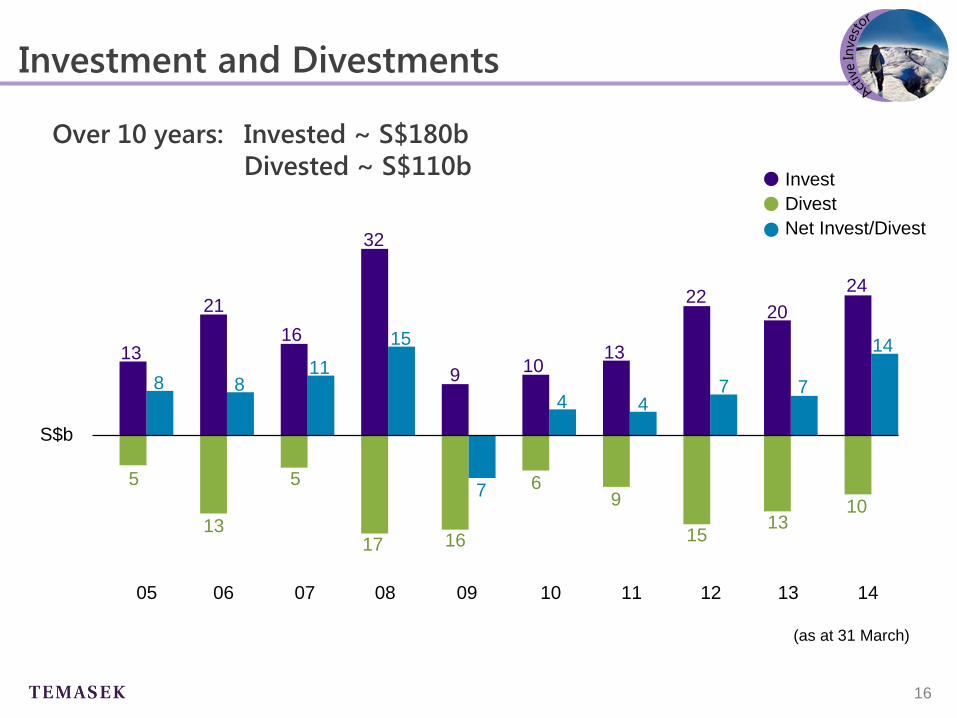
Investment and Divestments
10 11 14 13 12 09 08 07 05 06
Invest
Net Invest/Divest
Divest
5
13
5
17 16
6 9
15 13
13
21
16
32
9 10
13
22 20
S$b
(as at 31 March)
10
24
8 8 11
15
4 4 7 7
14
7
Over 10 years: Invested ~ S$180b
Divested ~ S$110b

17
Active Investor
Invested
S$24b
Divested
S$10b
Post
Mar 2014
Investments

18
41
31
14
10
2 2
Geographic Mix
Asia weighted portfolio at 72%
(%) 2014 2013
Asia ex-Singapore 41 41
Singapore 31 30
North America & Europe 14 12
Australia & New Zealand 10 13
Latin America 2 2
Africa, Central Asia
& the Middle East 2 2
Note: Distribution based on underlying assets. (as at 31 March)
S$223b 31 Mar 14

19
41
31
14
10
2 2
Geographic Mix
60:40 exposure to mature : growth
(%) 2014 2013
Asia ex-Singapore 41 41
Singapore 31 30
North America & Europe 14 12
Australia & New Zealand 10 13
Latin America 2 2
Africa, Central Asia
& the Middle East 2 2
Growth regions – 40%
Mature economies – 60%
Note: Distribution based on underlying assets. (as at 31 March)
60%
40%
20
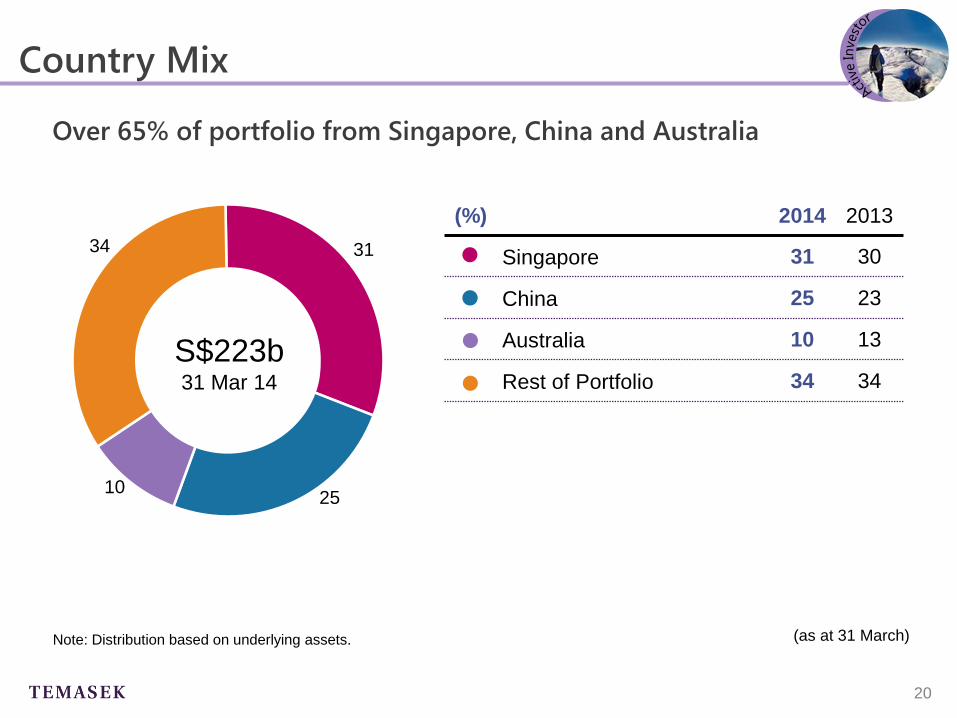
Country Mix
Over 65% of portfolio from Singapore, China and Australia
31
25 10
34
(%) 2014 2013
Singapore 31 30
China 25 23
Australia 10 13
Rest of Portfolio 34 34
S$223b 31 Mar 14
(as at 31 March) Note: Distribution based on underlying assets.

21
Sector Mix
Tracking growth opportunities
30
23
20
14
6
7 (%) 2014 2013
Financial Services 30 31
Telecommunications,
Media & Technology 23 24
Transportation & Industrials 20 20
Life Sciences, Consumer &
Real Estate 14 12
Energy & Resources 6 6
Others 7 7
Note: Distribution based on underlying assets.
S$223b 31 Mar 14
(as at 31 March)

22
Liquidity
A liquid portfolio with full flexibility
36
34
30
(%) 2014 2013
Liquid & sub-20%
listed assets 36 35
Listed large blocs
(≥ 20%share) 34 38
Unlisted assets 30 27 S$223b 31 Mar 14
(as at 31 March)

23
Currency Mix
Strong base in Singapore
61
12
12
4
3
8 (%) 2014 2013
Singapore dollars 61 65
Hong Kong dollars 12 11
US dollars 12 6
British pounds sterling 4 6
Euros 3 2
Others 8 10
Note: Distribution based on currency of denomination.
S$223b 31 Mar 14
(as at 31 March)
24
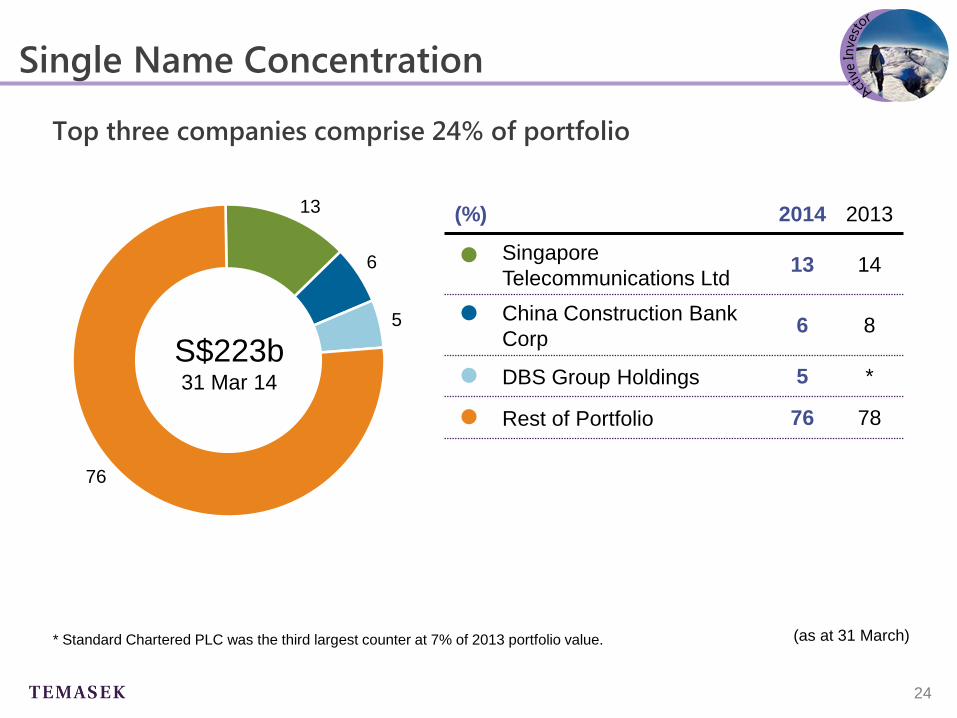
Single Name Concentration
Top three companies comprise 24% of portfolio
13
6
5
76
(%) 2014 2013
Singapore
Telecommunications Ltd 13 14
China Construction Bank
Corp 6 8
DBS Group Holdings 5 *
Rest of Portfolio 76 78
S$223b 31 Mar 14
(as at 31 March) * Standard Chartered PLC was the third largest counter at 7% of 2013 portfolio value.
25
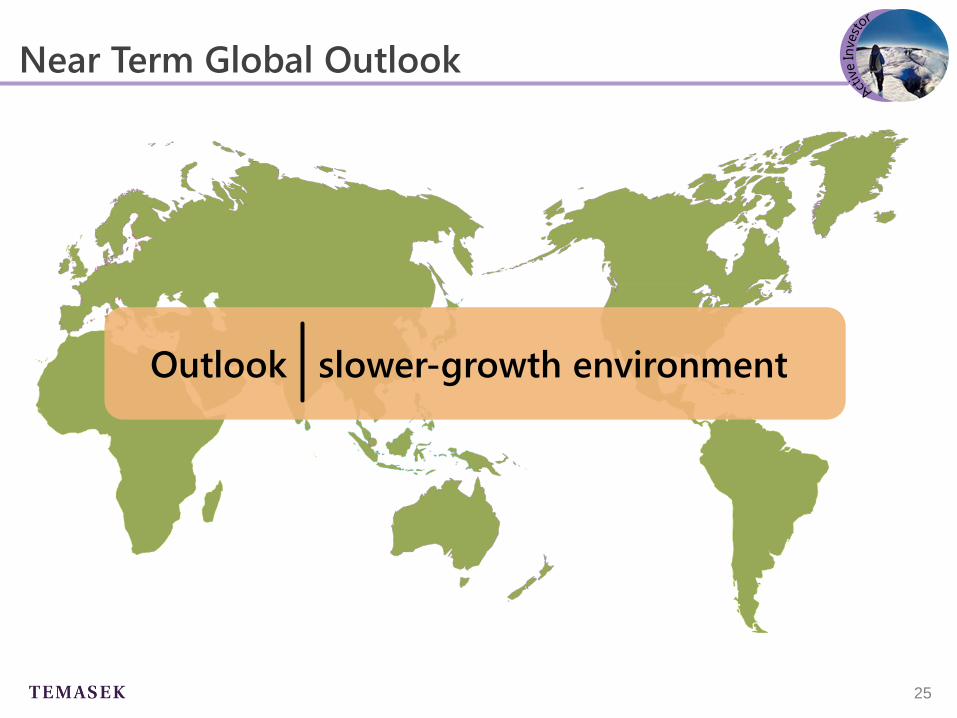
Near Term Global Outlook
Outlook slower-growth environment
26
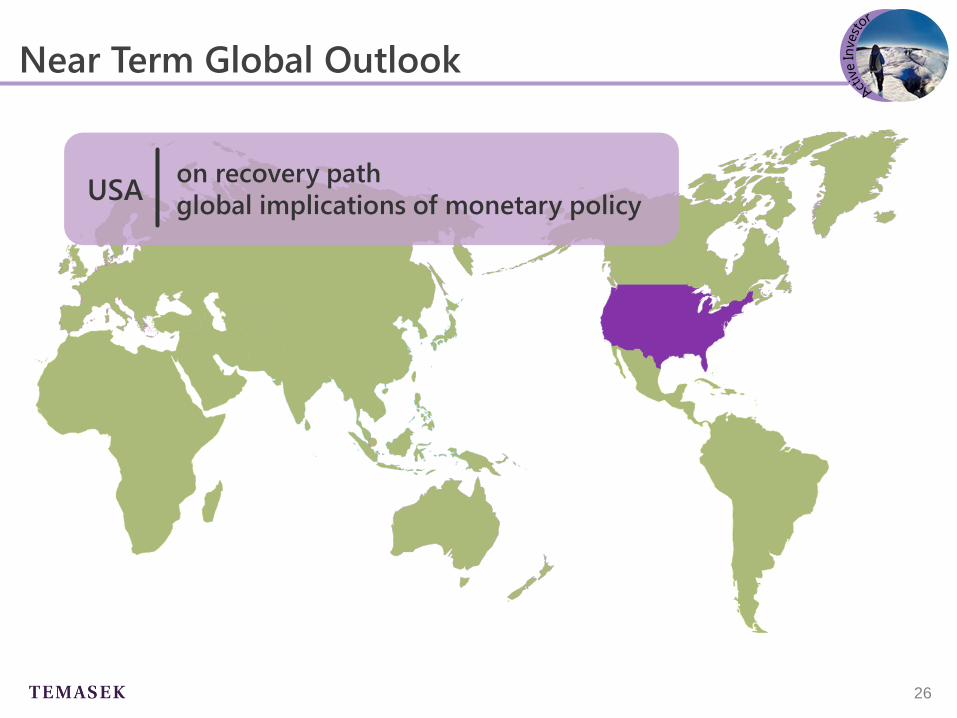
Near Term Global Outlook
USA on recovery path
global implications of monetary policy

27
Near Term Global Outlook
China slowing growth
potential financial system risks
ample policy room

28
Near Term Global Outlook
Euro zone mixed prospects
uneven reforms

29
Near Term Global Outlook
Global imbalances improving…
30
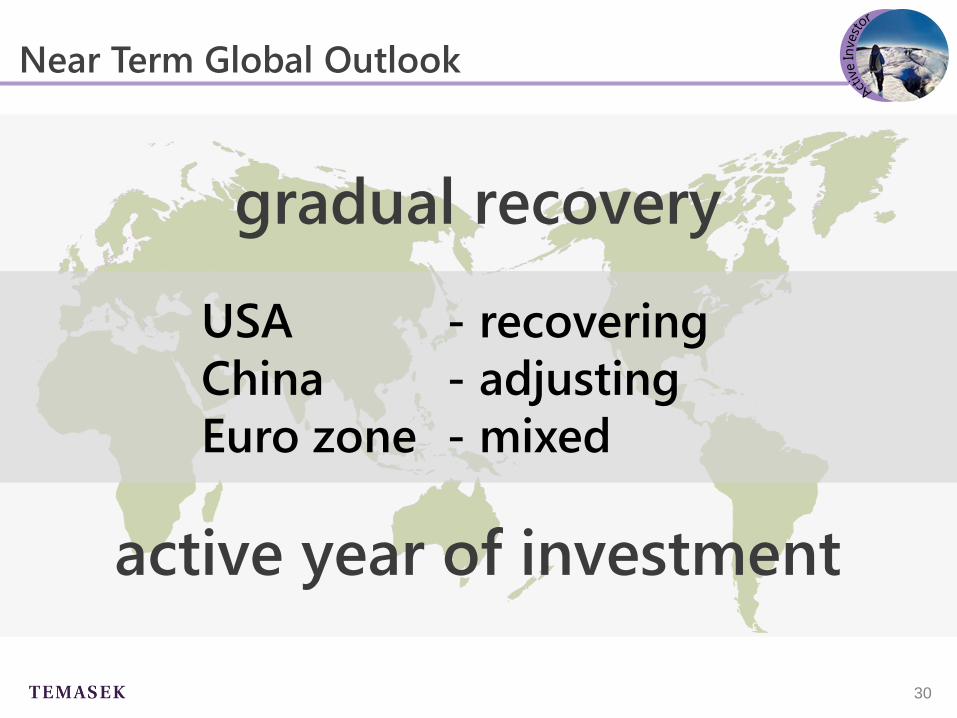
Near Term Global Outlook
gradual recovery
active year of investment
USA
China
Euro zone
- recovering
- adjusting
- mixed
31
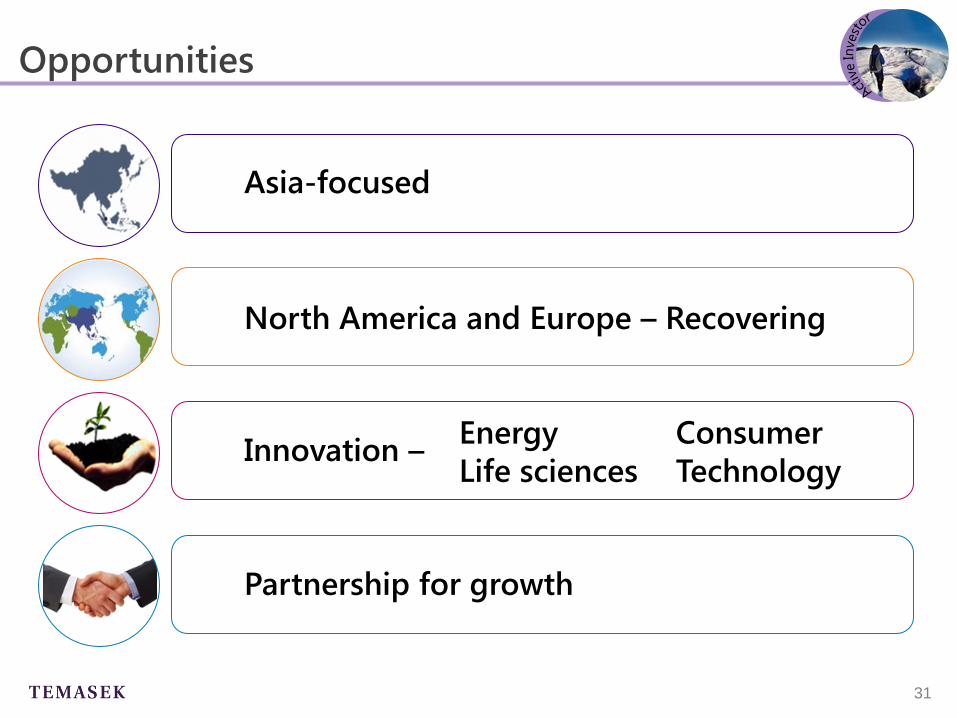
Opportunities
Asia-focused
North America and Europe – Recovering
Innovation –
Partnership for growth
Energy
Life sciences
Consumer
Technology
32
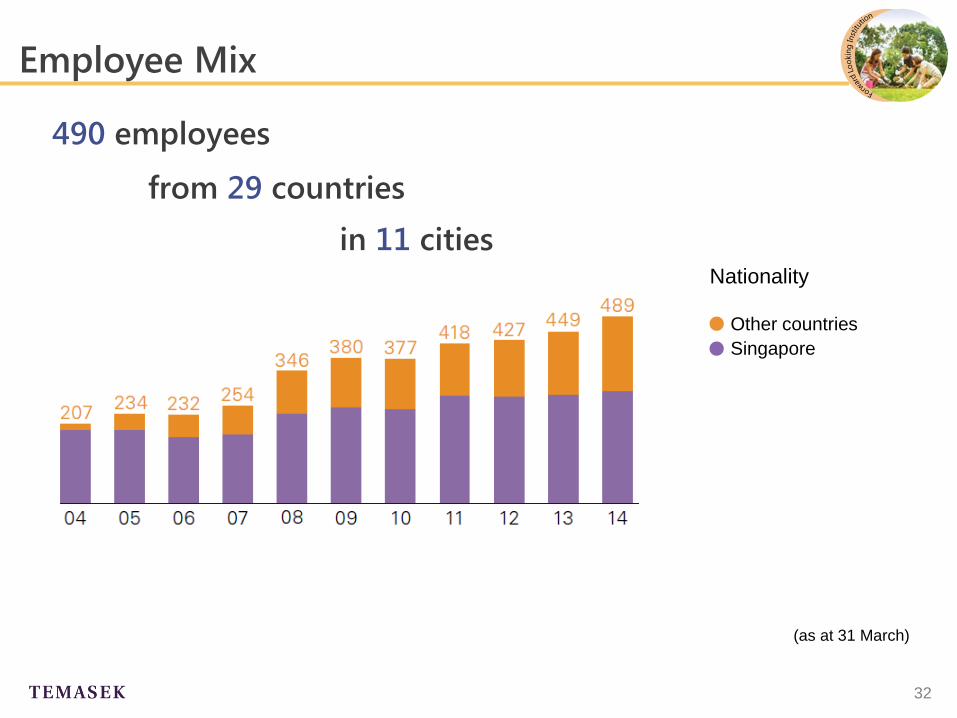
Employee Mix
(as at 31 March)
Other countries
Singapore
490 employees
from 29 countries
in 11 cities Nationality

33
Trusted steward Communities across generations
Active investor Sustainable long term value
Forward looking institution Ownership culture
The Temasek Charter

34
Our MERITT Values
Meritocracy Respect Teamwork
Excellence Integrity Trust

35
Delivering
returns over
risk-adjusted
hurdles
An Ownership Mindset
Investment Strategy
Capital Allocation
Performance Management
Incentive Framework
Delivering Sustainable Returns over the Long Term
36
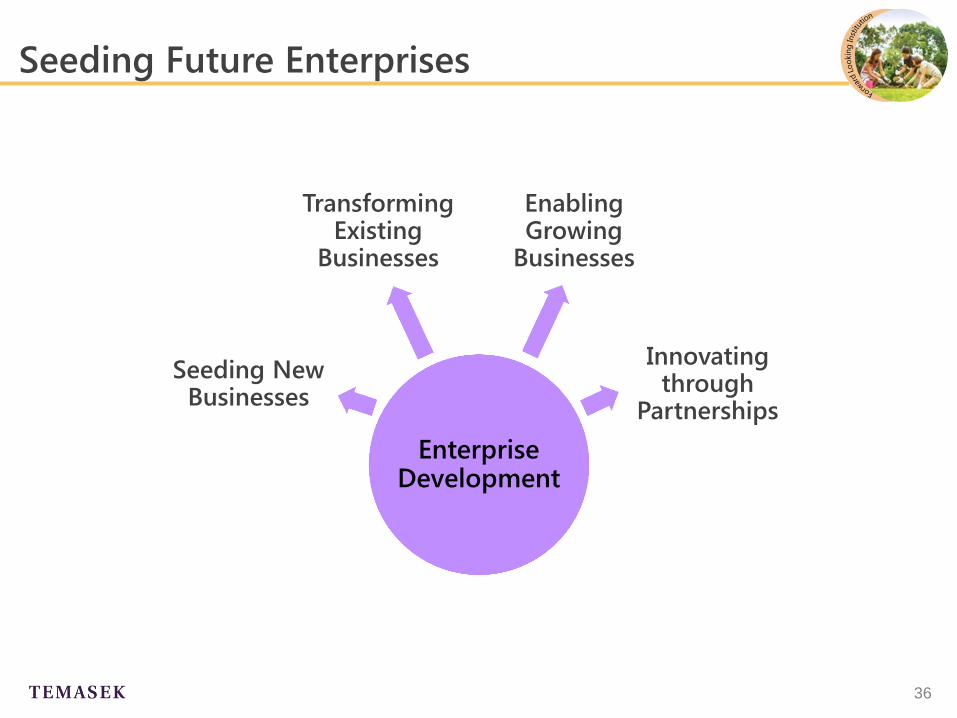
Seeding Future Enterprises
Enterprise Development
Seeding New Businesses
Enabling Growing
Businesses
Transforming Existing
Businesses
Innovating through
Partnerships

37
Seeding Future Enterprises

38
A Trusted Steward
16 endowments

39
Touched lives of
over 170,000 over past 10 years
A Trusted Steward

40
Fostering Stewardship and Governance

41
Our Temasek DNA

Tuesday, 8 July 2014
Our journey has just begun
A journey of a thousand miles, begins with a single step.
千里之行,始于足下 Lao Zi
Q&A
Tuesday, 8 July
Temasek Review 2014 Our journey has just begun

ANNEX
Tuesday, 8 July
Temasek Review 2014 Our journey has just begun

45
TSRs and MSCI Indices
18
16
7
12
15
0
10
7
6
12
20
(2)
5
10
17
3
11
10
8
7
19
20
N/A
N/A
Temasek
MSCI Singapore
MSCI AC Asia ex-JP
MSCI World
(developed economies)
Period (in years)
20
30
1
Since inception (1974)
5
10
US$ Total Shareholder Return (TSR) and MSCI Indices (%)
(as at 31 March 2014)