telecommunications sector performance review · telecommunications sector performance review market...
TRANSCRIPT

1
Telecommunications SectorPerformance Review
Market Report

Telecommunications Sector Performance Review
Market Report 2014
2
1. Introductions 03
2. Sector Overview 04
3. Financial Performance of MTC 05
4. Financial Performance of Telecom Namibia (Company) 07
5. Key Performance Indicators (KPIs) - Mobile Operators 10
5.1 MTC 10
5.2 TN Mobile 13
5.3 Outgoing Mobile Traffic 14
5.4 Mobile network infrastructure 16
6. Key Performance Indicators (KPIs) - Fixed Operator 17
7. Broadband Quality of Service 20
8. Price Benchmarking 23
8.1 Mobile Broadband 24
8.2 National Data Transmission - 34 Mbps 27
8.3 Fixed High Quality End User access - 2 Mbps leased lines 29
8.4 Mobile Prepaid Voice 29
9. Conclusion 34
Appendix 35
1. Calculations for National Data Transmission - 34 Mbps 35
2. Calculations for Fixed High Quality End User access - 2 Mbps leased lines 40
Contents

Telecommunications Sector Performance Review
Market Report 2014
3
The Telecommunications Sector Performance Review (TSPR) evaluates developments for the year 2013. An
updated version will be published annually as new data become available. The review takes into account
the following:
• The financial health and performance of Namibian operators;
• Consumer price developments;
• Changes in the competitive landscape; and
• The general trend of the year under review.
The main event that shaped the competitive telecommunications landscape in Namibia has been the
takeover of Leo by Telecom Namibia Limited. Namibia is now back to the in pre-liberalisation era of 2005
with only two telecommunications operators offering national voice services, both of which are majority
state owned or entirely state owned. A major concern is thus whether the takeover has led to reduced
competition and higher consumer prices. While it may be too early to evaluate the impact of the consumer
price and quality of service on the sector, what can be noticed is that Telecom Namibia and MTC do not act
as though they are owned by the same holding company; but seem to compete as independent entities.
This is likely the result of MTC being managed by Portugal Telecom.
1. Introduction
Telecommunications Sector Performance Review
Market Report 2014
4
2. Sector Overview
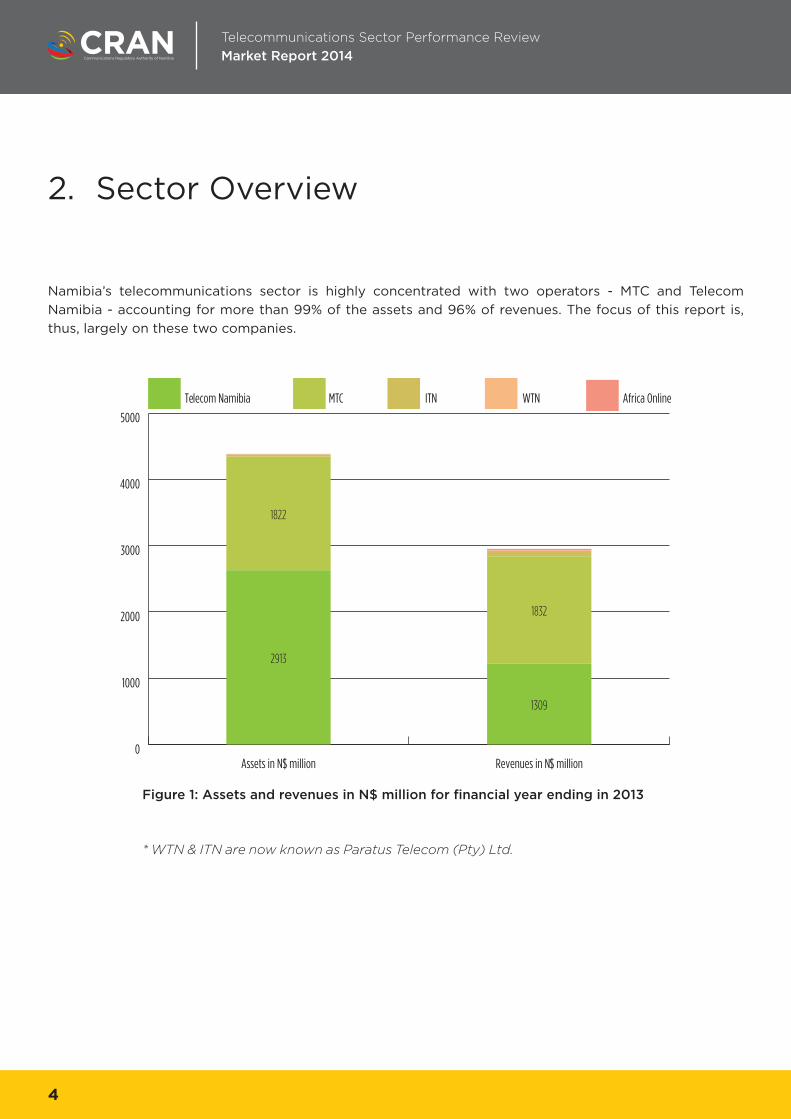
Namibia’s telecommunications sector is highly concentrated with two operators - MTC and Telecom
Namibia - accounting for more than 99% of the assets and 96% of revenues. The focus of this report is,
thus, largely on these two companies.
Figure 1: Assets and revenues in N$ million for financial year ending in 2013
* WTN & ITN are now known as Paratus Telecom (Pty) Ltd.
0
1000
2000
3000
4000
5000
Africa OnlineWTNITNMTCTelecom Namibia
Revenues in N$ millionAssets in N$ million
2913
1822
1309
1832
Telecommunications Sector Performance Review
Market Report 2014
5
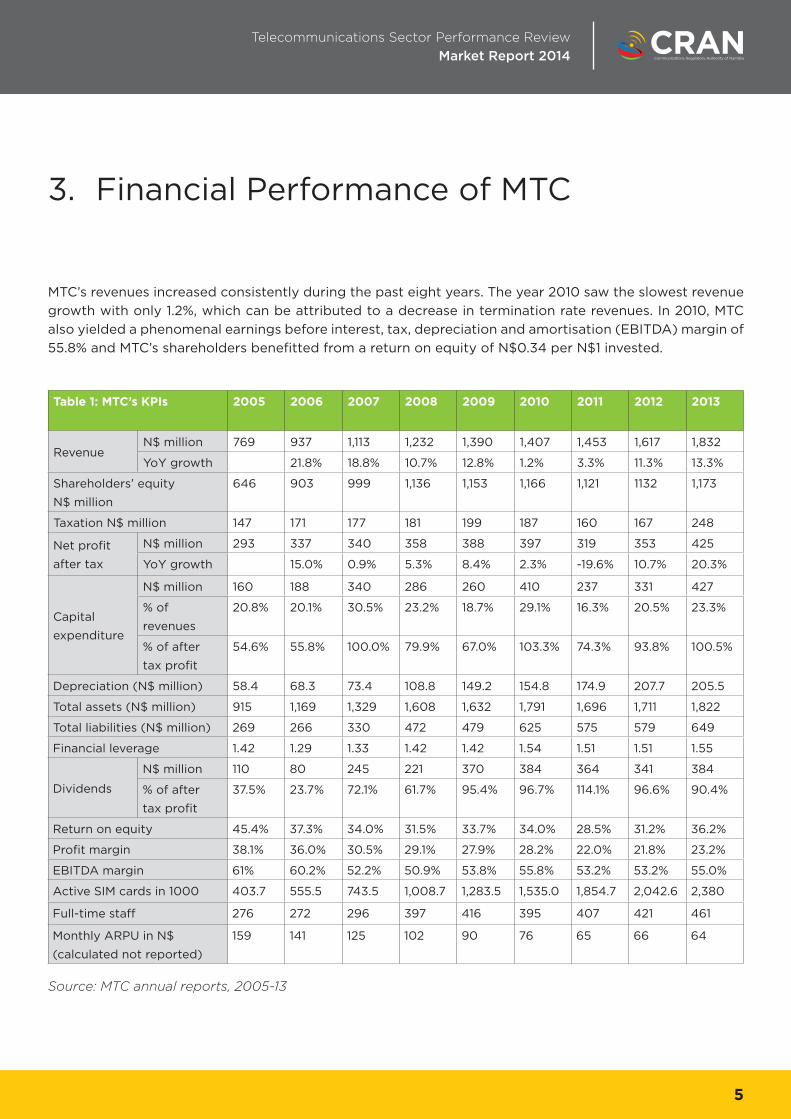
MTC’s revenues increased consistently during the past eight years. The year 2010 saw the slowest revenue
growth with only 1.2%, which can be attributed to a decrease in termination rate revenues. In 2010, MTC
also yielded a phenomenal earnings before interest, tax, depreciation and amortisation (EBITDA) margin of
55.8% and MTC’s shareholders benefitted from a return on equity of N$0.34 per N$1 invested.
3. Financial Performance of MTC
Table 1: MTC’s KPIs 2005 2006 2007 2008 2009 2010 2011 2012 2013
RevenueN$ million 769 937 1,113 1,232 1,390 1,407 1,453 1,617 1,832
YoY growth 21.8% 18.8% 10.7% 12.8% 1.2% 3.3% 11.3% 13.3%
Shareholders’ equity
N$ million
646 903 999 1,136 1,153 1,166 1,121 1132 1,173
Taxation N$ million 147 171 177 181 199 187 160 167 248
Net profit
after tax
N$ million 293 337 340 358 388 397 319 353 425
YoY growth 15.0% 0.9% 5.3% 8.4% 2.3% -19.6% 10.7% 20.3%
Capital
expenditure
N$ million 160 188 340 286 260 410 237 331 427
% of
revenues
20.8% 20.1% 30.5% 23.2% 18.7% 29.1% 16.3% 20.5% 23.3%
% of after
tax profit
54.6% 55.8% 100.0% 79.9% 67.0% 103.3% 74.3% 93.8% 100.5%
Depreciation (N$ million) 58.4 68.3 73.4 108.8 149.2 154.8 174.9 207.7 205.5
Total assets (N$ million) 915 1,169 1,329 1,608 1,632 1,791 1,696 1,711 1,822
Total liabilities (N$ million) 269 266 330 472 479 625 575 579 649
Financial leverage 1.42 1.29 1.33 1.42 1.42 1.54 1.51 1.51 1.55
Dividends
N$ million 110 80 245 221 370 384 364 341 384
% of after
tax profit
37.5% 23.7% 72.1% 61.7% 95.4% 96.7% 114.1% 96.6% 90.4%
Return on equity 45.4% 37.3% 34.0% 31.5% 33.7% 34.0% 28.5% 31.2% 36.2%
Profit margin 38.1% 36.0% 30.5% 29.1% 27.9% 28.2% 22.0% 21.8% 23.2%
EBITDA margin 61% 60.2% 52.2% 50.9% 53.8% 55.8% 53.2% 53.2% 55.0%
Active SIM cards in 1000 403.7 555.5 743.5 1,008.7 1,283.5 1,535.0 1,854.7 2,042.6 2,380
Full-time staff 276 272 296 397 416 395 407 421 461
Monthly ARPU in N$
(calculated not reported)
159 141 125 102 90 76 65 66 64
Source: MTC annual reports, 2005-13

Telecommunications Sector Performance Review
Market Report 2014
6
The shareholder’s equity nearly doubled in the past eight years, an increase from N$ 646 million to N$
1.173 million. Dividends paid by MTC increased from N$ 110 million to N$ 384 million during the past eight
years, a payout of more than triple. Most of the after-tax profits were disbursed as dividends in the past
five years, and exceeded company profits (even in 2011). This is not of concern since the profit for 2011 was
only lower due to depreciations, which are non-cash expenditures. The 2011 net profit after tax was slightly
lower than the previous year due to increased CAPEX in 2010 (N$ 410 million) and the subsequent higher
depreciations in 2011.
MTC continues to be profitable and continues to invest, which indicates that the financial performance is
of no regulatory concern. However, the increasing profit and EBITDA margin for the financial year ending
in September 2013 should be of concern since it could be an indication of a lack of effective competition
in the market.

Telecommunications Sector Performance Review
Market Report 2014
7
Telecom Namibia shows marginal growth in revenues over the past eight years with noticeably higher
increases in 2009, 2012 and 2013. The 2012 and 2013 increases were due to increases in data revenue of
about 20% in both years.
4. Financial Performance of Telecom Namibia (Company)
Table 2: Telecom Namibia’s KPIs 2006 2007 2008 2009 2010 2011 2012 2013
RevenueN$ million 1,058 1,061 1,081 1,130 1,134 1,143 1,223 1,310
YoY growth 0.3% 1.9% 4.5% 0.4% 0.8% 7.0% 7.1%
Taxation N$ million 61.8 27.9 33.1 9.2 18 40 27 -18
Net profit / loss
after tax
N$ million 112.3 23.2 80.1 25.6 69.7 50.6 56.6 -87.5
Capex (Group
additions to Plant
and equipment)
N$ million 170.0 346.1 245.9 245.9 160.9 173.2 235.1 445.4
Total assetsN$ million 1,781 2,040 2,231 2,325 2,534 2,566 2,629 2913
YoY growth 14.5% 9.4% 4.2% 9.0% 1.3% 2.4% 10.8%
Total liabilitiesN$ million 801 1,025 1,168 1,237 1,393 1,374 1,376 1,746
YoY growth 28.0% 14.0% 5.9% 12.6% -1.4% 0.2% 26.9%
Shareholders’
Equity in nominal
terms
N$ million 980 1,015 1,063 1,088 1,141 1,192 1,252 1,167
YoY growth 3.6% 4.7% 2.4% 4.9% 4.5% 5.1% -6.9%
Annual inflation rate % 5.1% 6.5% 10.3% 8.8% 4.5% 5.1% 6.5%
Dividend N$ million 17 0 0 0 0 0 0 0
Return on Equity 11.5% 2.3% 7.5% 2.4% 6.1% 4.2% 4.5% -7.5%
Financial Leverage 1.8 2.0 2.1 2.1 2.2 2.2 2.1 2.5
Profit Margin 10.6% 2.2% 7.4% 2.3% 6.1% 4.4% 4.6% -6.7%
DELs in 1000 incl. public phones 136.2 138.2 145.4 148.7 157.1 159.1 168.5 180.1
No of Public Phones 6086 4,200 3,860 3,726 2,949 2,824 2,500 1000
Full-time Staff 1,306 1,069 1,025 1093 1073 1055 1076 1090
Mobile N$ million 44.627 65.846
Fixed voice
revenues incl.
interconnection
revenues
N$ million 765.2 639.4 536 516.4 456.7
YoY growth -16.4% -16.2% -3.7% -11.6%
Data and IP
services revenues
N$ million 297 417 452 541.7 637.9
YoY growth 40.4% 8.4% 19.8% 17.8%
Source: Annual reports, 2006-13

Telecommunications Sector Performance Review
Market Report 2014
8
The shareholder’s equity increased at a rate of about 5% during the period 2007 to 2012. These increases
are in nominal terms and only in 2010 was the year-on-year growth higher than inflation, implying that the
shareholder lost value in real terms in all other years. In 2013 the shareholder’s equity declined in nominal
terms by 6.9%, due to losses in this financial year. The company’s shareholder’s equity declined by N$ 86
million, i.e. state assets are worth N$ 86 million less after the take over of Leo by Telecom Namibia.
Telecom Namibia’s net loss for the financial year ending in 2013 was N$ 87.5 million on company level and
N$ 166 million on group level. Telecom Namibia attributes this to operational losses from Leo.
Also of concern is the increase in current liabilities on group level by N$ 459 million, while current assets
only increased by N$44 million.
Revenues, profits, shareholder equity and return on equity at company level all suggest that Telecom
Namibia is stagnating. After the takeover of Leo, net losses additionally threaten the investment and
innovation capacity of Telecom Namibia. Investments in particular are needed for fixed broadband Internet
access since the future growth potential is based in data growth.
-200
-150
-100
-50
0
50
100
150CompanyGroup
20132012201120102009200820072006
Figure 2: Telecom Namibia group profit/loss after taxation in N$ million
* Source: TN annual reports, 2006-12
106.7 112.3
-30.6
23.2-24.4
80.1
-87.0
25.6
-122.2
69.7
-87.5
50.6 56.5 60.8
-166.0
-87.5

Telecommunications Sector Performance Review
Market Report 2014
9
Telecom Namibia started de-investing from its foreign ventures. The sale of Telecom Namibia’s 44% share
in Mundo Startel, announced in September 2012, is not yet complete. Telecom Namibia may also sell its
share in Neotel, pending an offer by Vodacom. Telecom Namibia Limited owns 100% of CommuniTel, a
South African registered company, which in turn owns 11.7% of Neotel (N$ 527 million in ordinary and
preference shares).
The sale of its foreign investments will allow Telecom Namibia to use domestically generated funds for
urgently needed domestic investments.
Telecommunications Sector Performance Review
Market Report 2014
10
5. Key Performance Indicators (KPIs) - Mobile Operators
5.1 MTC
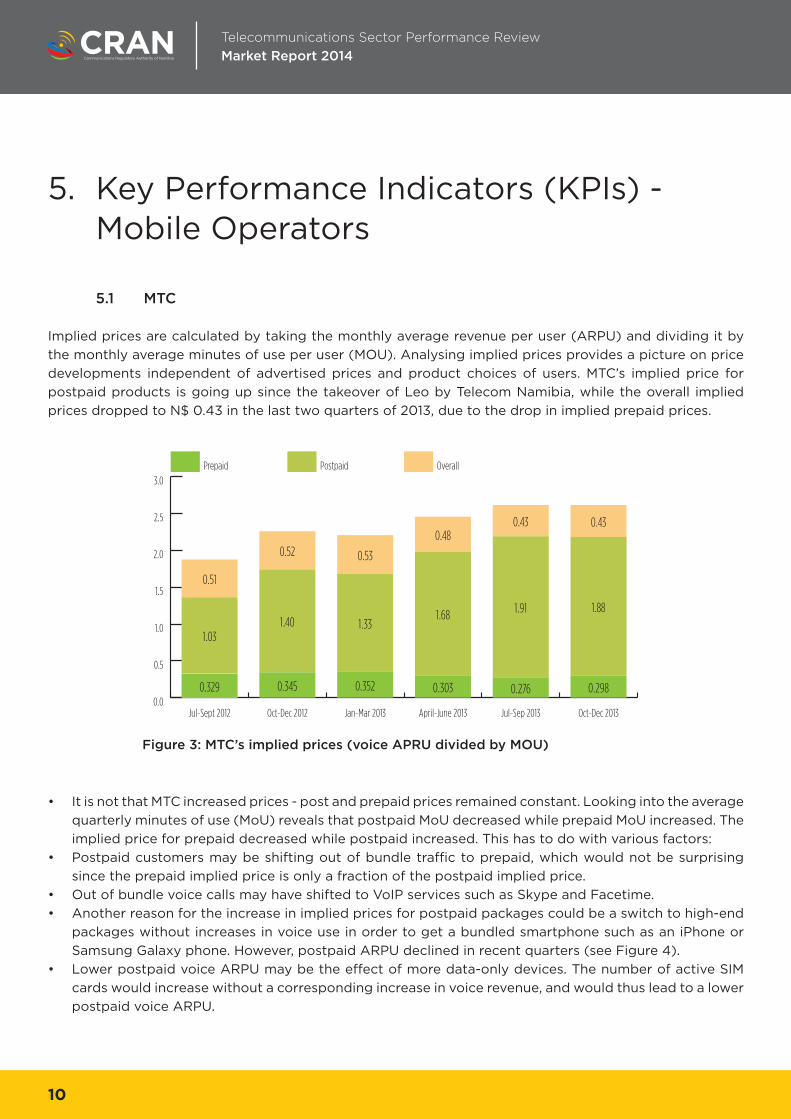
Implied prices are calculated by taking the monthly average revenue per user (ARPU) and dividing it by
the monthly average minutes of use per user (MOU). Analysing implied prices provides a picture on price
developments independent of advertised prices and product choices of users. MTC’s implied price for
postpaid products is going up since the takeover of Leo by Telecom Namibia, while the overall implied
prices dropped to N$ 0.43 in the last two quarters of 2013, due to the drop in implied prepaid prices.
• It is not that MTC increased prices - post and prepaid prices remained constant. Looking into the average
quarterly minutes of use (MoU) reveals that postpaid MoU decreased while prepaid MoU increased. The
implied price for prepaid decreased while postpaid increased. This has to do with various factors:
• Postpaid customers may be shifting out of bundle traffic to prepaid, which would not be surprising
since the prepaid implied price is only a fraction of the postpaid implied price.
• Out of bundle voice calls may have shifted to VoIP services such as Skype and Facetime.
• Another reason for the increase in implied prices for postpaid packages could be a switch to high-end
packages without increases in voice use in order to get a bundled smartphone such as an iPhone or
Samsung Galaxy phone. However, postpaid ARPU declined in recent quarters (see Figure 4).
• Lower postpaid voice ARPU may be the effect of more data-only devices. The number of active SIM
cards would increase without a corresponding increase in voice revenue, and would thus lead to a lower
postpaid voice ARPU.
0.0
0.5
1.0
1.5
2.0
2.5
3.0
OverallPostpaidPrepaid
Oct-Dec 2013Jul-Sep 2013April-June 2013Jan-Mar 2013Oct-Dec 2012Jul-Sept 2012
Figure 3: MTC’s implied prices (voice APRU divided by MOU)
0.329
1.03
0.51
0.345
1.40
0.52
0.352
1.33
0.53
0.303
1.68
0.48
0.276
1.91
0.43
0.298
1.88
0.43

Telecommunications Sector Performance Review
Market Report 2014
11
Given that the handset value has indisputably gone up with an increasing smartphone penetration, the
effect of postpaid-prepaid substitution may be more significant than apparent from the data. The postpaid
ARPU includes a handset for most contracts. One would thus expect an increasing postpaid voice ARPU.
Figure 5: MTC Voice ARPU
0
100
200
300
400
500
OverallPostpaidPrepaid
Oct-Dec 2013Jul-Sep 2013April-June 2013Jan-Mar 2013Oct-Dec 2012Jul-Sept 2012
Figure 4: MTC MOU
0
50
100
150
200
250
300
350
400
OverallPostpaidPrepaid
Oct-Dec 2013Jul-Sep 2013April-June 2013Jan-Mar 2013Oct-Dec 2012Jul-Sept 2012
90.0
276
101
94.0
211
101
82.0
210
90
96.0
168
100
116.0
147
118
113.0
144
115
30 32 29 29 32 34
286 295 279 281 281 272
52 5247 48 50 50

Telecommunications Sector Performance Review
Market Report 2014
12
At the moment, there does not seem to be any competitive pressure that would require MTC to cut its
postpaid prices dramatically in order to align them with prepaid prices. MTC is currently competing with
itself: postpaid versus prepaid. With postpaid customers typically being locked in for 24 months, one
would expect a drop in postpaid subscribers in the next few quarters. This has not happened, however,
in the previous quarters despite the price difference already being effective for the entire period under
consideration.
One of the reasons for a user to keep their postpaid number is to get the handset financed. Companies
also increasingly rely on mobile phones for in-house communication instead of using a fixed-line private
automatic branch exchange (PABX), creating a solid block of customers that would not change to prepaid
if they had the choice. MTC managed to grow both data and voice revenues continuously in the past six
quarters with the exception of a dent in voice revenues in the first quarter of 2013, which may be seasonal.
Table 3: MTC subscribers Jul-Sept
2012
Oct-Dec
2012
Jan-Mar
2013
April-
June 2013
Jul-Sep
2013
Oct-Dec
2013
Prepaid
Subscribers (active SIM
cards)
1,922,147 2,024,498 2,065,259 2,074,708 2,141,481 2,248,022
YoY 5.3% 2% 0.5% 3.2% 5%
Postpaid
Subscribers (active SIM
cards)
120,448 122,335 123,210 125,581 128,020 132,260
YoY 1.6% 0.7% 1.9% 1.9% 3.3%
0
100
200
300
400
500
Total data revenuesTotal mobile voice revenues
Oct-Dec 2013Jul-Sep 2013April-June 2013Jan-Mar 2013Oct-Dec 2012Jul-Sept 2012
Figure 6: MTC Data vs voice revenues in N$ million
314.0 326.7 307.4 314.5 334.6 345.9
3442
48 5160
76

Telecommunications Sector Performance Review
Market Report 2014
13
MTC also grew its postpaid an prepaid voice and data subscriber base in the second half of 2013.
5.2 TN Mobile
The most notable difference between the implied prices of TN Mobile and MTC is that TN Mobile charges
are triple the prepaid price of MTC and a quarter of the postpaid price.
Figure 7: TN Mobile’s implied prices (voice APRU divided by MOU)
Table 4: MTC Subscribers Jul 2012 -Dec
2012
Jan 2013 - Jun
2013
Jul 2013 -Dec
2013
Mobile
Subscribers
Prepaid 2,024,498 2,074,708 2,248,022
Postpaid 122,335 125,581 132,260
Total 2,146,833 2,200,289 2,380,282
Data
Subscribers
Active mobile-broadband
subscriptions
640,512 719,728 788,015
Standard mobile-broadband
subscriptions
570,788 656,549 721,381
Dedicated mobile-broadband
subscriptions
69,724 63,179 66,634
0.0
0.5
1.0
1.5
2.0
PostpaidPrepaid
Oct-Dec 2013Jul-Sep 2013April-June 2013Jan-Mar 2013
1.160
0.68
0.920
0.69
1.020
0.66
1.010
0.52

Telecommunications Sector Performance Review
Market Report 2014
14
TN Mobile lost 27% of its subscribers in the last quarter of 2013. Of its postpaid subscribers, it lost 32.6%
and of its prepaid subscribers, 25%. However, while subscriber numbers dwindled, total traffic peaked
among postpaid subscribers by 2 million minutes in the last quarter of 2013. Also, ARPU and MOU are
higher in the last two quarters of 2013, indicating subscribers that left TN Mobile or lower end user. Such
a dramatic loss in subscribers is a worrying sign and could reflect a serious problem in the operations of
the mobile operator. This could be due to unsuccessful customer attraction and retention strategies, billing
problems or a decline in quality of service. CRAN will monitor the situation closely over the course of 2014.
5.3 Outgoing Mobile Traffic
In the second half of 2013, TN Mobile only had an on-net traffic share of 0.1%. Eighty-one per cent (81%)
of its traffic was off-net (See Table 8). Only 5.1% of calls initiated were on-net calls. MTC’s outgoing traffic
is mostly on-net and only 0.3% of minutes dialled by MTC customers were for TN Mobile callers. This is
despite off-net price caps implying that Namibia currently only has one competitive mobile operator.
Table 5: TN Mobile KPI’s Jan-Mar 2013 April-June 2013 Jul-Sep 2013 Oct-Dec 2013
ARPU -
Monthly
Prepaid voice 43 41 43 58
Postpaid voice 175 178 164 248
MOU-
Monthly
Prepaid 37 45 42 57
Postpaid 259 260 249 478
Total 89 98 95 156
Prepaid
Subscribers (active SIM
cards)
74,899 74,089 77,549 57,966
YoY -1.1% 4.7% -25.3%
Postpaid
Subscribers (active SIM
cards)
22,918 24,148 26,376 17,786
YoY 5.4% 9.2% -32.6%
Total
Subscribers (active SIM
cards)
97,817 98,237 103,925 75,752
YoY 0.4% 5.8% -27.1%
Prepaid Minutes 2,798,215 3,318,566 3,274,359 3,326,091
Postpaid Minutes 5,926,493 6,272,379 6,570,697 8,500,330
Total minutes 8,724,708 9,590,945 9,845,056 11,826,421

Telecommunications Sector Performance Review
Market Report 2014
15
This is further enforced by the total number of outgoing minutes of Namibia’s mobile operators, where
MTC’s market share was 98.1% in the second half of 2013.
MTC currently has a factual mobile monopoly with 98% of total mobile traffic and 99.9% of total on-net
traffic
Table 6: Distribution of outgoing traffic by operator Jul 2012 -Dec
2012
Jan 2013 - Jun
2013
Jul 2013 -Dec
2013
MTC
On net 97.3% 97.3% 97.2%
Off-net mobile 0.3% 0.3% 0.3%
Off-net fixed-line 1.5% 1.5% 1.7%
International 0.9% 0.9% 0.8%
TN Mobile
On net 5.9% 5.0% 5.1%
Off-net mobile 83.7% 83.8% 81.3%
Off-net fixed-line 4.4% 5.5% 6.5%
International 6.1% 5.7% 7.1%
0.0
0.2
0.4
0.6
0.8
1.0
July 2013 - Dec 2013January 2013 - June 2013July 2012 - Dec 2012
TotalInternationalOff-net Fixed-lineOff-net mobileOn net
Figure 8: MTC’s market share of total mobile traffic
11.6% 11.6% 17.6%
99.8% 99.8% 99.9%91.9% 90.1% 93.1%
83.3% 84.1% 85.5%97.1% 97.2% 98.1%

Telecommunications Sector Performance Review
Market Report 2014
16
5.4 Mobile network infrastructure
Through their takeover of Leo, Telecom Namibia increased its number of mobile base stations in operation
from 269 to 409. There will be some duplication in coverage between the two networks (Switch and Leo)
and consolidation can be expected for 2014 since Switch will be completely phased out and TN Mobile is
switching to a NGN network. Telecom Namibia still needs to improve its network footprint by more than
double if it wants to compete with MTC’s 1,088 base stations.
Table 7: Mobile’s Infrastructure
End Dec2012 End June 2013 End Dec 2013
MTC TN Mobile MTC TN Mobile MTC TN Mobile
Total international uplink bandwidth in
Gbit/s
0.922 4.052 0.922 4.708 1.922 10.288
Total international downlink bandwidth
in Gbit/s
0.922 4.052 0.922 4.708 1.922 10.288
International Internet bandwidth
(bit/s) per internet user
1509 1343 2558
Number of base stations (Mobile ) 1,042 266 1,073 269 1,088 409
Number of points of presence (POP)s 85 395 93 5 96 5

Telecommunications Sector Performance Review
Market Report 2014
17
Telecom Namibia, Namibia’s only fixed-line operator, is faced with declining voice revenues. While revenues
from monthly rental and international voice only declined slightly, the main drop in voice revenues stems
from declining domestic voice revenue. The reasons for declining fixed voice revenues around the world are
the wider use of mobile phones and the use of VoIP applications such as Skype. Fixed-mobile and voice-
data substitutions happen on both residential and business levels. While fixed-lines are not necessarily cut
by businesses, more of its traffic has been shifted to mobile. This is an international trend and not only
specific to Namibia.
On a positive note, the revenue from ADSL subscriptions has nearly doubled in 2013 and leased-line
revenues remained constant. ADSL is now as important as leased lines in terms of revenues for Telecom
Namibia. Internationally the trend is the same, in particular for leased-line end-user connectivity based on
speeds of 2 mbps or below (sub-rate services). ADSL is a much cheaper alternative to the more advanced
very-high-bit-rate digital subscriber line (VDSL) and VDSL2, which offer much faster connections (up to
100 mbps).
6. Key Performance Indicators (KPIs) - Fixed Operator
0
20
40
60
80
100
120
Pay-phonesVoice (domestic)Voice (International)Fixed-line rental
Oct-Dec 2013Jul-Sep 2013April-June 2013Jan-Mar 2013Oct-Dec 2012
Figure 9: Telecom Namibia’s fixed voice revenues in N$ million
22.0 21.9 21.6 21.4 21.4
22.3 21.3 22.1 22.2 20.5
69.3 68.94 66.71 62.251.32
1 1.26 1.430.88
0.04

Telecommunications Sector Performance Review
Market Report 2014
18
In December 2013, Telecom Namibia had only 57 ADSL subscriptions of 10 mbps or higher. In total there
are only 34,000 ADSL subscribers in Namibia and the majority of those at speeds that are no longer
considered as broadband (below 2 mbps). MTC has doubled the number of dedicated data subscribers
(66,700).
20
30
40
50
60
Leased linesADSL
Oct-Dec 2013Jul-Sep 2013April-June 2013Jan-Mar 2013Oct-Dec 2012
Figure 10: Telecom Namibia’s ADSL and leased line revenues in N$ million
0
100
200
300
400
500
600
700
800
Data and IP servicesFixed Voice
20132012201120102009
Figure 11: Telecom Namibia’s voice vs data revenues in N$ million (source annual reports)
53.254.8
47.6 48.9 48.2
48.1
43.7
40.538.1
26.8
765.2
297
639.4
417536.0
452516.4 541.7
456.7
637.9
Telecommunications Sector Performance Review
Market Report 2014
19
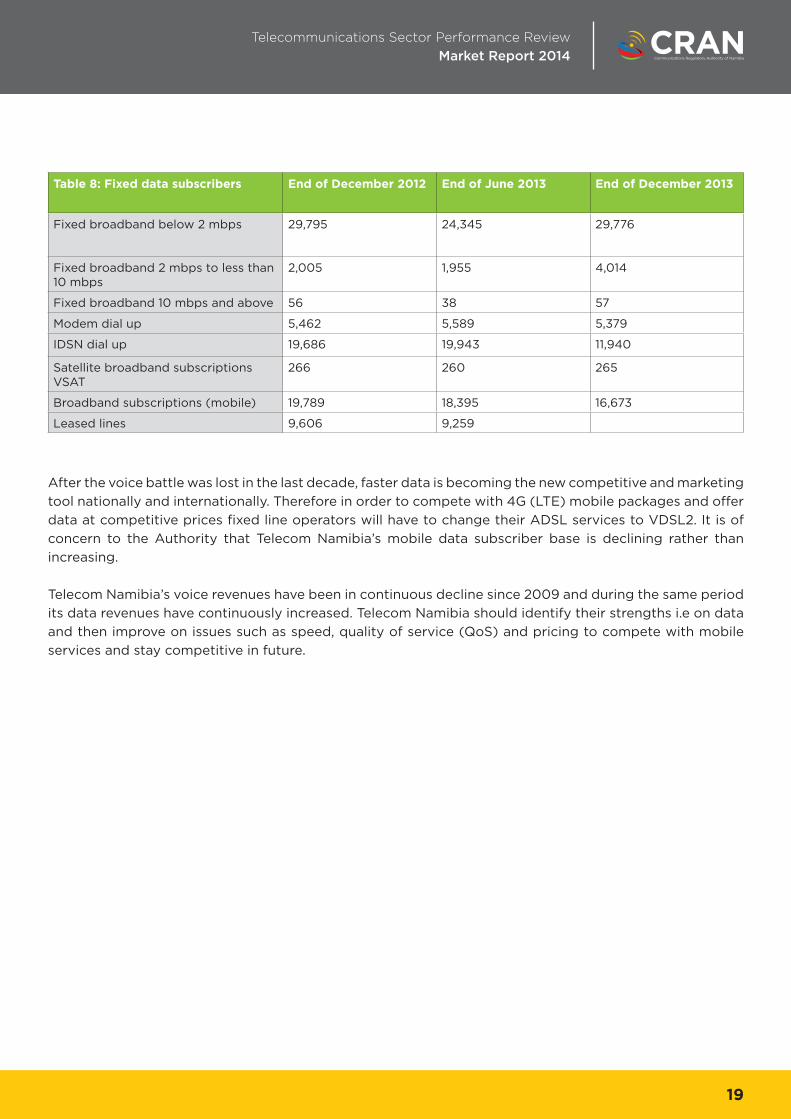
After the voice battle was lost in the last decade, faster data is becoming the new competitive and marketing
tool nationally and internationally. Therefore in order to compete with 4G (LTE) mobile packages and offer
data at competitive prices fixed line operators will have to change their ADSL services to VDSL2. It is of
concern to the Authority that Telecom Namibia’s mobile data subscriber base is declining rather than
increasing.
Telecom Namibia’s voice revenues have been in continuous decline since 2009 and during the same period
its data revenues have continuously increased. Telecom Namibia should identify their strengths i.e on data
and then improve on issues such as speed, quality of service (QoS) and pricing to compete with mobile
services and stay competitive in future.
Table 8: Fixed data subscribers End of December 2012 End of June 2013 End of December 2013
Fixed broadband below 2 mbps 29,795 24,345 29,776
Fixed broadband 2 mbps to less than 10 mbps
2,005 1,955 4,014
Fixed broadband 10 mbps and above 56 38 57
Modem dial up 5,462 5,589 5,379
IDSN dial up 19,686 19,943 11,940
Satellite broadband subscriptions VSAT
266 260 265
Broadband subscriptions (mobile) 19,789 18,395 16,673
Leased lines 9,606 9,259

Telecommunications Sector Performance Review
Market Report 2014
20
7. Broadband Quality of Service (QoS)
The Netindex collects download and upload speeds for ISPs around the world on a daily basis and the data
is publicly available.1 For MTC, the average number of daily tests in 2013 was 1,121, for Telecom Namibia 1,887
and for Leo/TN Mobile 1,388.
While MTC and Telecom Namibia had similar average download speeds in the period 2009 to 2011, the
picture changed in 2012. With MTC having access to its own international connectivity through the WACS
cable its average download speeds doubled in 2012 and in 2013 again. On average, MTC is 4 to 5 times
faster than Telecom Namibia. The Netindex data does not allow one to distinguish by technology. This
means that the data for Telecom Namibia includes ADSL and CDMA subscribers.
1 For more detail, see the speed test at: www.speedtest.net/isp-performance
Table 9: Netindex - Average number
of daily tests
MTC Telecom Namibia
(incl Iway)
Leo /TN Mobile
2009 299.94 711.6
2010 736.58 1108.95
2011 518.31 1704.47
2012 854.95 2085.17
2013 1121.31 1886.89 1387.96
2014 874.91 2018.33 947.61
Source: Ookla Netindex, 2014 (accessed 18 March)
Table 10: Netindex for Namibia - Average speeds in kbps
Download speed Upload speed
MTC Telecom
Namibia
Leo /TN
Mobile
MTC Telecom
Namibia
Leo /TN
Mobile
2009 1,278 1,516 280 806
2010 1,603 1,387 629 519
2011 1,920 1,928 647 733
2012 4,471 1,598 1,989 743
2013 10,227 2,304 28,340 5,815 1,084 11,199
2014 11,658 3,120 22,926 7,256 1,753 8,874
Source: Ookla Netindex, 2014 (accessed 18 March)

Telecommunications Sector Performance Review
Market Report 2014
21
Notably, the average value for TN Mobile’s Internet speed was 28,340 kbps in 2013. This speed has come
down on average, most likely due to higher uptake by the average customer. The situation for upload
speeds is the same as for download speeds. TN Mobile is the fastest and MTC is close on its heels while
Telecom Namibia has the slowest speeds.
What is clear from Figure 12 is that progress in terms of broadband speed is uneven across Namibia, with
Windhoek having more than five times faster access compared to Swakopmund, Walvisbay and Tsumeb,
in the first quarter of 2014.
0
2000
4000
6000
8000
10000
12000
201420132012
WindhoekWalvis BayTsumebSwakopmund
Figure 12: Average download speed by city (in kbps)
922.4 1,219 1461.11701
1733.76922.6 1267 1666.87
3604.9
9,16010017.05

Telecommunications Sector Performance Review
Market Report 2014
22
Comparing MTC and TN Mobile to other mobile operators from 12 African countries covered by Research
ICT Africa shows that both are among the top 5 operators in terms of average download and upload
speeds.
Figure 13: Internet speeds in kbps for Q1 2014
0 5000 10000 15000 20000 25000 30000 35000
Upload speed (kbps)Download speed (kbps)
Safaricom
TN Mobile
Vodacom South Africa
MTC
Smile Nigeria
Smile Tanzania
MTN Uganda
Vodacom Mozambique
MTN Nigeria
Cell C
Smile Uganda
Airtel Ghana
Orange Kenya
MTN South Africa
Vodafone Ghana
Tigo Rwanda
Orange Uganda
Mascom
Airrtel Rwanda
MTN Rwanda
Vodacom Tanzania
Orange Botswana
Airtel Uganda
Airtel Nigeria
Glo Mobile Ghana

Telecommunications Sector Performance Review
Market Report 2014
23
This chapter compares the prices of Namibian operators to prices from operators of others jurisdictions.
First, three data services will be benchmarked for mobile broadband, national data transmission and high
quality data access via leased lines. Then a comparison of prepaid mobile voice will be discussed.
8.1 Mobile Broadband
Comparing prices for 1GB prepaid user basket valid for at least 30 days data across 12 African countries
shows that Namibia’s prices are very high. The prices in Figure 14 are based on the cheapest operator in a
country.
Taking quality of service into account changes the picture. A value for money index was computed based
on the combined average of upload and download speed in kbps, which was divided by price for 1 GB
basket and then divided by 1000. The upload and download speeds were obtained from the Netindex
8. Price Benchmarking
Figure 14: Cost of 1 GB prepaid in USD Q1 2014 (lower is better)
05 10 15 20 25 30
Kenya
Ghana
Tanzania
Nigeria
Rwanda
South Africa
Uganda
Mozambique
Cameroon
Ethiopia
Botswana
Namibia 25.3
21.5
21.1
21.0
15.8
13.8
13.7
11.9
11.0
6.2
5.8
4.7

Telecommunications Sector Performance Review
Market Report 2014
24
(ookla.com) for the first quarter of 2014 by operator. The value for money index thus combines prices and
average quality of service.
0 300 600 900 1200 1500
Botswana
Rwanda
Ghana
Mozambique
Uganda
Namibia
Tanzania
Nigeria
South Africa
Kenya
Figure 15: Value for Money based on Quality of Service and price of 1GB( higher is better)
1,483.9
841.1
824.8
810.3
628.3
465.4
372.3
298.6
122.7
95.6
Namibia offers the fifth highest value for money on this comparison, significantly out performed by Kenya, South Africa, Nigeria and Tanzania. These figures are again based on the best value of any operator within a country. The value for money figure does not include all operators for each country since average upload and download speeds are not available in the Netindex for all operators, in particular for smaller operators.

Telecommunications Sector Performance Review
Market Report 2014
25
When comparing operators for the selected 12 African countries it transpires that MTC and TN Mobile are
among the most expensive operators. One GB of prepaid data costs of N$ 239.00 excluding VAT and N$
274.85 including VAT for TN Mobile and MTC respectively (US$ 25.3 based on average foreign exchange
rate (FX) for 2014 Quarter 1).
Figure 16: Cost of 1GB (USD)
02 04 06 08 01 00
Yu KenyaCliq (Expresso Telecom)
Tigo GhanaZantel
MTN GhanaOrange Kenya
Vodacom TanzaniaSmile TanzaniaAirtel Tanzania
Smile NigeriaVodafone Ghana
Airtel GhanaSafaricom
MTN RwandaVodacom South Africa
MTN South AfricaCell C
Orange UgandaAirtel Kenya
Smile UgandaMTN Uganda
Vodacom MozambiqueTelkom MobileAirtel UgandaAirtel Rwanda
Glo Moblle NigeriaAirtel Nigeria
Glo Mobile GhanaOrange Cameroon
Ethio TelecomMTN Nigeria
MascomEtisalat Nigeria
TN MobileMTC
Tigo RwandaMTN Cameroon
Orange BotswanaBeMobile 85.3
68.352.5
26.825.325.324.5
21.521.4
21.121.0
19.418.418.417.9
17.716.6
15.814.814.8
14.113.813.7
11.9
13.713.7
11.7
11.0
11.711.7
11.010.9
9.48.8
7.86.25.85.8
4.7

Telecommunications Sector Performance Review
Market Report 2014
26
Given the fast average download and upload speeds of TN Mobile and MTC compared to other operators
the ranking improves when considering value for money. TN Mobile ranks fifth and MTC 9th best value
for money out of the 25 operators’ comparison. The value for money index could not be computed for all
operators in the selected 12 African countries due to QoS data availability
0 300 600 900 1200 1500
Safaricom
Vodacom South Africa
Smile Nigeria
Smile Tanzania
TN Mobile
MTN Uganda
Cell C
Orange Kenya
MTC
Vodacom Mozambique
Smile Uganda
Airtel Ghana
Vodafone Ghana
MTN Nigeria
MTN South Africa
Orange Uganda
Vodacom Tanzania
MTN Rwanda
Airtel Rwanda
Tigo Rwanda
Mascom
Airtel Uganda
Airtel Nigeria
Glo Mobile Ghana
Orange Botswana
Figure 17: Value for Money Index (average speed/cost)

Telecommunications Sector Performance Review
Market Report 2014
27
8.2 National Data Transmission - 34 Mbps
Traditional leased lines prices based on SDH are used for the price benchmarking for national data
transmission. The main reason for that is the international availability of this type of leased line prices. It is
noted, however, that the international trend is to move away from unmanaged and uncontested connectivity
toward managed and shared connectivity in form of Ethernet. Only retail prices were available from public
sources such as the Organisation for Economic Cooperation and Development (OECD). Wholesale prices
were calculated for Botswana, Namibia and South Africa as these were available.
0 5000 10000 15000 20000 25000
Canada
Ireland
Telecom Namibia
Botswana BTC
Japan
United Kingdom
Korea
Mexico
France
Italy
Portugal
Telkom South Africa
United States
Australia
Austria
Belgium
Greece
Germany
Turkey
Luxembourg
Norway
Denmark
Iceland
Figure 18: 34 Mbps OECD retail basket in USD
1,423
1,851
3,079
3,920
4,203
5,330
7,075
7,383
7,480
7,773
8,373
10,197
10,564
10,972
12,087
14,803
16,345
16,554
17,441
17,594
18,360
20,384
23,091

Telecommunications Sector Performance Review
Market Report 2014
28
Figure 18 compares the retail leased lines prices of Botswana, South Africa and Botswana with OECD
countries. The 34Mbps basket is more expensive for Telecom Namibia than for Telkom South Africa and
BTC from Botswana. Namibia is the 3rd most expensive country in the comparison. Telkom South Africa
costs nearly half compared to Telecom Namibia.
Namibia’s wholesale prices are even higher when compared to Botswana and South Africa and the margin
between retail and wholesale prices are the lowest, giving resellers only a mark up of 30% compared to
50% in South African and 80% in Botswana.
Figure 19: Wholesale cost of 34 Mbps OECD basket in USD and implied PPP conversion rate
0
5000
10000
15000
20000Telecom NamibiaBTCTelkom
USDUSD PPP
0.0
0.1
0.2
0.3
0.4
0.5
0.6
0.7
0.8Telecom NamibiaBTCTelkom
Wholesale discount
Figure 20: Wholesale discounts for 34 Mbps OECD basket
8,798 7,966
17,630
4,373 3,519
12,852
51.7%
80.0%
30.0%

Telecommunications Sector Performance Review
Market Report 2014
29
8.3 Fixed High Quality End User access - 2 Mbps leased lines
Metro-Ethernet prices were not publicly available for any of the countries considered for benchmarking.
Leased lines prices for sub-rate services are being used as a proxy. Sub-rate services and Metro-Ethernet
are substitutes and similarly priced by Telkom South Africa, for example. The benchmarks are based on
the highest capacity available for sub-rate services, i.e. 2Mbps to approximate Metro-Ethernet prices. Only
retail prices are available from sources such as the OECD. Wholesale prices were additionally calculated for
Botswana, Namibia and South Africa.
Figure 21. OECD retail basket 2 Mbps USD
01 000 2000 3000 4000 5000 6000
Slovak Republic
Japan
Australia
Czech Republic
Canada
Korea
United Kingdom
France
Mexico
Ireland
Italy
United States
Telecom Namibia
Netherlands
Belgium
Portugal
Germany
Austria
BTC Botswana
Greece
Luxembourg
Norway
Poland
Turkey
Telkom South Africa
Denmark
Sweden
Iceland 448
586
590
658
668
693
902
929
952
994
1103
1231
1329
1424
1444
1474
1659
1720
1723
1862
1942
2753
3007
3602
3755
4365
4845
5433

Telecommunications Sector Performance Review
Market Report 2014
30
South Africa compares favourably internationally. Only Iceland, Sweden and Denmark have lower prices
for a 2Mbps leased line access. Telecom Namibia is considerable more expensive than South Africa and
Botswana, at about double the price.
The price differences to Botswana and South Africa are even more pronounced when comparing wholesale
prices. South Africa and Botswana wholesale prices are only about 20%, a fifth, of those of Namibia.
Telkom SA grants a 62% discount and BTC a 80% discount compared to the meagre 30% of Telecom
Namibia.
Figure 22: Wholesale cost of 2 Mbps OECD basket in USD and implied PPP conversion rate
0
300
600
900
1200
1500Telecom NamibiaBTCTelkom
USDUSD PPP
0.0
0.1
0.2
0.3
0.4
0.5
0.6
0.7
0.8Telecom NamibiaBTCTelkom
Wholesale discount
Figure 23: Wholesale discounts for 2 Mbps OECD basket
401 421
1,415
251 199
1,032
62%
80%
30%

Telecommunications Sector Performance Review
Market Report 2014
31
8.4 Mobile Prepaid Voice
Namibia ranks 13th among African dominant operators and 17th in terms of cheapest product in a country.
Prices have not increased in Namibia but have fallen quicker in other countries with effective competition.
Figure 24 below compares the cost in United States Dollar (USD) of the cheapest prepaid mobile product
available in Namibia, and in all of Africa, for the OECD1 40 calls/60 SMSs basket between Quarter 4 for
2010 and Quarter 1 for 2014.
Namibia’s cheapest product rank improved from 20th in Q4 2010 to 17th in Q1 2014. While the ranking has
not much improved, prices nevertheless have steadily been coming down in USD. The price benchmarking
uses quarterly average exchange rates and some fluctuation in price is caused not by price but by exchange
rate fluctuations. The detailed ranking for all countries for the first quarter of 2014 is displayed in Table 11
below.
2 OECD (2010), Revision of the Methodology for Constructing Telecommunication Price Baskets, OECD
Working Party on Communication Infrastructures and Services Policy.
Figure 24: Ranking and cost of cheapest prepaid mobile product
available in South Africa and Africa for OECD 40 calls/60 SMSs basket
0
5
10
15
20
25
Namibia's RankCheapest in NamibiaCheapest in Africa
Q1 2014Q4 2013Q3 2013Q2 2013Q1 2013Q4 2012Q3 2012Q2 2012Q1 2012Q4 2011Q3 2011Q2 2011Q1 2011Q4 2010
20 21
23 23
20
23
20 20 20 19
17
19 19
1715.6 15.2 15.6 15.0
12.5 13.0 12.5 12.3 11.7 11.210.6 10.0 9.9
8.1
3.5 3.4 2.82.4 2.5 2.3 2.3 1.4 1.4 1.21.4 1.4 1.4 1.1

Telecommunications Sector Performance Review
Market Report 2014
32
Table 11: OECD mobile baskets, 2010 definition, 40 calls. Monthly call distribution, minutes and SMS
Country name
Cheapest product
% cheaper than dominantdominant operator cheapest in country
USD Rank USD Rank
Egypt 2.77 1 2.77 4 Dominant is the cheaper
Sudan 2.83 2 1.06 1 62.5%
Ghana 3.38 3 2.64 3 21.9%
Mauritius 3.69 4 3.69 5 Dominant is the cheaper
Ethiopia 3.98 5 3.98 6 Dominant is the cheaper
Kenya 4.27 6 1.47 2 66%
Rwanda 5.06 7 5.06 9 Dominant is the cheaper
Tunisia 6.30 8 6.10 11 3.2%
Algeria 6.43 9 6.43 14 Dominant is the cheaper
Libya 6.91 10 6.91 15 Dominant is the cheaper
Nigeria 7.11 11 4.49 7 37%
Uganda 8.53 12 7.10 16 17%
Namibia 9.21 13 8.05 17 13%
Sierra Leone 9.33 14 9.33 20 Dominant is the cheaper
Tanzania 9.60 15 6.40 13 33.3%
Mozambique 10.01 16 10.01 22 Dominant is the cheaper
Botswana 10.99 17 10.01 21 8.9%
South Africa 11.26 18 4.85 8 56.9%
Benin 11.59 19 11.59 23 Dominant is the cheaper
Cameroon 11.94 20 8.40 18 29.7%
Liberia 13.19 21 13.19 26 Dominant is the cheaper
Mauritania 13.20 22 13.20 27 Dominant is the cheaper
Central African Republic 13.91 23 13.91 28 Dominant is the cheaper
Malawi 14.15 24 14.01 30 Dominant is the cheaper
Sao Tome and Principe 14.56 25 14.56 31 Dominant is the cheaper
Congo Brazzaville 15.49 26 14.68 32 5%
Niger 15.70 27 15.70 35 Dominant is the cheaper
Burkina Faso 15.80 28 15.56 34 2%
Cote d'Ivoire 15.90 29 15.90 36 Dominant is the cheaper

Telecommunications Sector Performance Review
Market Report 2014
33
Figure 25 compares the cost of the cheapest prepaid mobile products for each mobile operator in Namibia
according to the OECD 40 calls/60 SMSs basket. MTC was the cheapest operator until Q1 2014 where TN
mobile finally launched competitive products.
The basket methodology does not take into account the vast amounts of free minutes and SMS that are
bundled with some of MTC’s prepaid products. It is based on advertised prices for a fairly low use per
month of 30 calls and 60 SMS. These results need thus to be read together with the implied prices from
earlier sections.
Table 11: OECD mobile baskets, 2010 definition, 40 calls. Monthly call distribution, minutes and SMS
Country name
Cheapest product
% cheaper than dominantdominant operator cheapest in country
USD Rank USD Rank
Senegal 16.27 31 16.27 38 Dominant is the cheaper
Togo 16.37 32 16.37 39 Dominant is the cheaper
Lesotho 16.93 33 16.93 40 Dominant is the cheaper
Zambia 16.98 34 15.11 33 11%
D.R. Congo 17.10 35 12.18 24 29%
Chad 17.76 36 17.76 42 Dominant is the cheaper
Swaziland 18.54 37 18.54 43 Dominant is the cheaper
Seychelles 20.61 38 20.61 45 Dominant is the cheaper
Madagascar 21.28 39 8.64 19 59%
Angola 22.04 40 19.84 44 10%
Zimbabwe 22.70 41 21.78 46 4%
Cape Verde 31.57 42 31.57 47 Dominant is the cheaper
Morocco 47.20 43 12.40 25 74%
50
100
150
200TN MobileMTC
Q1 2014Q4 2013Q3 2013Q2 2013Q1 2013Q4 2012Q3 2012Q2 2012Q1 2012Q4 2011Q3 2011Q2 2011Q1 2011Q4 2010
Figure 25: Cost of cheapest prepaid mobile product for OECD 40
calls/60 SMSs basket by operators in N$

Telecommunications Sector Performance Review
Market Report 2014
34
9. Conclusion
The Namibian telecommunications sector declined from three national mobile operators to just two. One
of these has insignificant revenues and traffic, leaving Namibia with a quasi-mobile and an actual fixed-line
monopoly, both majority state owned. The takeover of the only fully privately owned mobile operator, Leo,
by a 100% state-owned Telecom Namibia crowded out private investment in favour of public investment.
Due to the declining business model of Telecom Namibia and inadequate fixed broadband offerings,
Telecom Namibia is loosing voice and data revenue to MTC and, as a consequence, lacks the capital to
build a mobile network that could compete with MTC.
Fixed broadband cannot compete with mobile broadband neither on speed, quality nor on price, and only
has a slim niche of uncapped Internet. This niche becomes increasingly smaller with MTC’s broadband
partially replicating (subject to fair use policy) Telecom Namibia’s uncapped products but at much higher
upload and download speeds.
Telecom Namibia needs substantial funds to invest into mobile and fixed broadband in order to compete
in the short to medium term.
Comparing Namibia internationally for mobile broadband, mobile prepaid voice and leased line prices
shows that Namibia falls behind in terms of affordability. The lack of competitive pressure in Namibia will
let the country fall further behind. This after Namibia was leading in Africa in 2009 and 2010.
It was competition from a privately owned operator (Leo) that brought 3G services to Namibia in 2006
and lower voice and data prices subsequently. CRAN will monitor developments in 2014 and look into
pro-competitive regulatory strategies as it develops its 2015 and beyond Strategic and Operational Plans,
given this TSPR, as part of its evidence based regulatory approach. This will be undertaken to ensure the
regulatory objectives of competition, affordability and universal access and usage, innovation and quality
of service.
In the next report the Authority aims to incorporate the impact other operators may have had on the
market, i.e. Paratus Telecom (Pty) Ltd, Mwireless (Pty) Ltd t/a Africa Online, Schoemans (Pty) Ltd, MTN
and others.
Telecommunications Sector Performance Review
Market Report 2014
35
Appendix
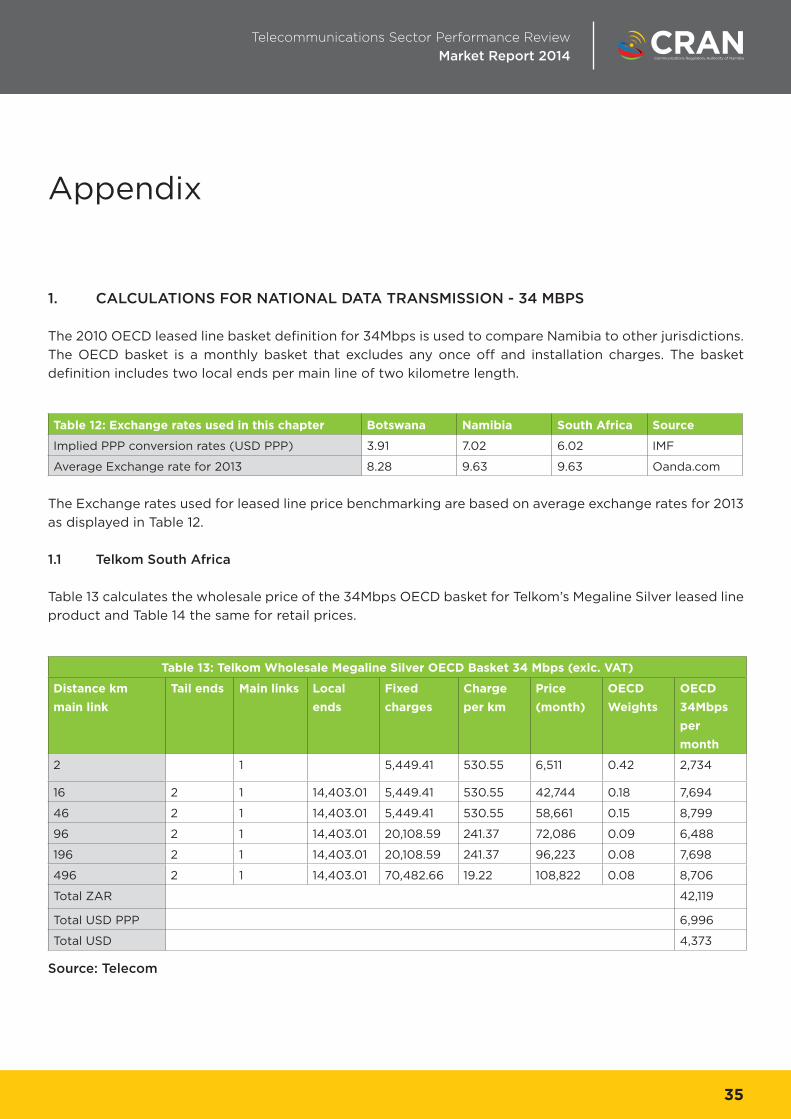
1. CALCULATIONS FOR NATIONAL DATA TRANSMISSION - 34 MBPS
The 2010 OECD leased line basket definition for 34Mbps is used to compare Namibia to other jurisdictions.
The OECD basket is a monthly basket that excludes any once off and installation charges. The basket
definition includes two local ends per main line of two kilometre length.
The Exchange rates used for leased line price benchmarking are based on average exchange rates for 2013
as displayed in Table 12.
1.1 Telkom South Africa
Table 13 calculates the wholesale price of the 34Mbps OECD basket for Telkom’s Megaline Silver leased line
product and Table 14 the same for retail prices.
Table 12: Exchange rates used in this chapter Botswana Namibia South Africa Source
Implied PPP conversion rates (USD PPP) 3.91 7.02 6.02 IMF
Average Exchange rate for 2013 8.28 9.63 9.63 Oanda.com
Table 13: Telkom Wholesale Megaline Silver OECD Basket 34 Mbps (exlc. VAT)
Distance km
main link
Tail ends Main links Local
ends
Fixed
charges
Charge
per km
Price
(month)
OECD
Weights
OECD
34Mbps
per
month
2 1 5,449.41 530.55 6,511 0.42 2,734
16 2 1 14,403.01 5,449.41 530.55 42,744 0.18 7,694
46 2 1 14,403.01 5,449.41 530.55 58,661 0.15 8,799
96 2 1 14,403.01 20,108.59 241.37 72,086 0.09 6,488
196 2 1 14,403.01 20,108.59 241.37 96,223 0.08 7,698
496 2 1 14,403.01 70,482.66 19.22 108,822 0.08 8,706
Total ZAR 42,119
Total USD PPP 6,996
Total USD 4,373
Source: Telecom

Telecommunications Sector Performance Review
Market Report 2014
36
Wholesale prices are discounted by 52% compared to retail prices, providing a healthy margin for any
reseller.
1.2 Botswana 2013 prices
BTC’s prices include local ends but require a minimum distance of 15 km for the main line. The OECD
basket was thus changed from 2 to 16 km in Table 15. The retail prices are taken from the BTC website.1 The
regulator of Botswana, BTA, prescribed volume-based discounts for E1s on the same route for distance as
well as a fixed monthly charge (BTA, 2011, p 7). The highest discount (80%) applies to 16 E1s on the same
route. The 80% discount is being applied for the 34Mbps basket since 17 E1s would be required to establish
a 34Mbps connection.
3 http://www.btc.bw/index.php?page=tariffs/leased
Table 14: Telkom Retail Megaline Silver OECD Basket 34 Mbps (exlc. VAT)
Distance km
main link
Tail
ends
Main
links
Port
Charges
Local
ends
Fixed
charges
Charge
per km
Price
(month)
OECD
Weights
OECD
34Mbps
per
month
2 1 15,032.82 1,555.09 18,143 0.42 7,620
16 2 1 3,586.00 14,403.01 15,032.82 1,555.09 75,892 0.18 13,661
46 2 1 3,586.00 14,403.01 15,032.82 1,555.09 122,545 0.15 18,382
96 2 1 3,586.00 14,403.01 65,017.36 653.14 163,697 0.09 14,733
196 2 1 3,586.00 14,403.01 65,017.36 653.14 229,011 0.08 18,321
496 2 1 3,586.00 14,403.01 229,517.97 107.12 318,628 0.08 25,490
Total ZAR 98,206
Total USD PPP 16,313
Total USD 10,197
Source: http://www.telkom.co.za/general/pricelist/downloads/tarifflist_Aug.pdf

Telecommunications Sector Performance Review
Market Report 2014
37
The 80% discount is being applied for the 34 Mbps basket since 17 E1s would be required to establish a
34Mbps connection.
1.3 Namibia
Tables 16 and 17 display the prices of the 34Mbps basket for 2011. No new prices have come into effect since
then. However, the practice has changed and prices are set on a project, case-to-case basis, which means
that the retail prices in the tables below are the upper boundaries of available prices. Wholesale prices only
exist in the form of discounts given to resellers and large telecommunications companies such as MTC. As
a guide a 30% discount was used for the wholesale benchmarking.
Table 15: OECD Basket 34 Mbps for Botswana -retail and wholesale (exlc. VAT)
km Main link Fixed
charges
Charge
per km
Distance
charge
Access
charge
Modem
rental
Total
Monthly
OECD
Weights
Retail Wholesale
80%
2 798 144 288 1,330 710 3,126 0.42 1,313
16 798 144 2,307 1,330 710 5,145 0.18 926
46 798 144 6,633 1,330 710 9,471 0.15 1,421
96 4,868 64 6,182 1,330 710 13,090 0.09 1,178
196 4,868 64 12,622 1,330 710 19,530 0.08 1,562
496 17,396 15 7,638 1,330 710 27,075 0.08 2,166
Total Pula 145,629 29,126
Total USD PPP 37,245 7,449
Total USD 17,594 3,519
Note: BTC minimum distance is 15 km but 2 km was still used.
Table 16: Monthly cost of 2km local ends
(excl. installation cost and excl. VAT)
Monthly cost in N$ for 34 Mbps
Port Monthly 5,550
NTU monthly 714
Network access via local leads (2km) monthly rental (for copper 2 pairs) 18,700
Distance Node to Node in km 2
Node to Node Distance Charge monthly per km 2,580
Node to Node Distance Charge fixed 17,825
Total Monthly 47,948

Telecommunications Sector Performance Review
Market Report 2014
38
Table 16 calculates the price of a fibre-based 2 km local lead and Table 17 the price for the 34Mbps OECD
basket.
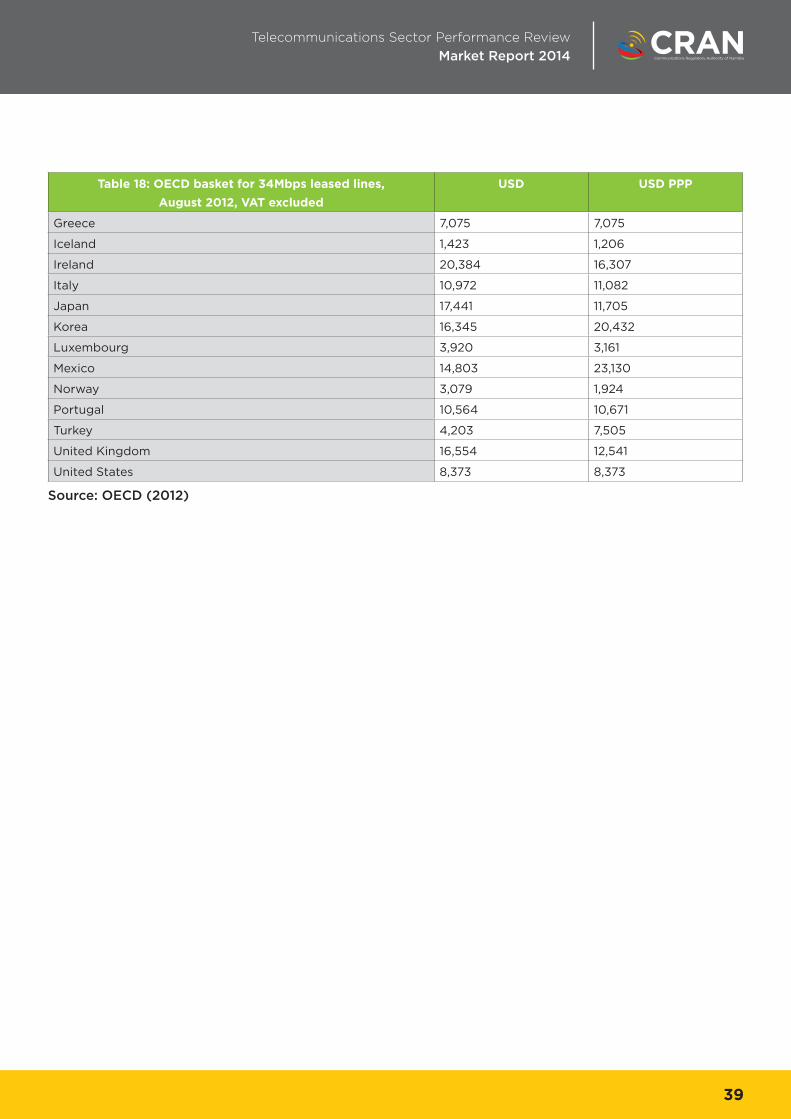
1.4 International Comparison
Table 18 reflect the national retail prices for selected OECD countries for the 34Mbps OECD basket for
August 2012.
Table 17: Telecom Namibia (2011 prices ) for OECD Basket 34 Mbps with local ends
(excl. VAT) based on 17 E1s
Distance km
main link
1 local
end
Fixed
charges
Charge
per km
Price
(month)
OECD
Weights
Retail per
month
Wholesale per
month (30%
discount)
2 17,825 2,580 22,985 0.42 9,654
16 47,948.26 17,825 2,580 155,004 0.18 27,901
46 47,948.26 17,825 2,580 232,410 0.15 34,862
96 47,948.26 82,808 1,273 300,960 0.09 27,086
196 47,948.26 82,808 1,273 428,309 0.08 34,265
496 47,948.26 324,459 237 538,012 0.08 43,041
Total N$ 176,808 123,766
Total USD PPP 25,186 17,630
Total USD 18,360 12,852
Source: Prices submitted to CRAN
Table 18: OECD basket for 34Mbps leased lines,
August 2012, VAT excluded
USD USD PPP
Australia 7,773 4,951
Austria 7,480 6,738
Belgium 7,384 6,311
Canada 23,091 18,182
Denmark 1,851 1,242
France 12,087 10,510
Telecommunications Sector Performance Review
Market Report 2014
39
Source: OECD (2012)
Table 18: OECD basket for 34Mbps leased lines,
August 2012, VAT excluded
USD USD PPP
Greece 7,075 7,075
Iceland 1,423 1,206
Ireland 20,384 16,307
Italy 10,972 11,082
Japan 17,441 11,705
Korea 16,345 20,432
Luxembourg 3,920 3,161
Mexico 14,803 23,130
Norway 3,079 1,924
Portugal 10,564 10,671
Turkey 4,203 7,505
United Kingdom 16,554 12,541
United States 8,373 8,373

Telecommunications Sector Performance Review
Market Report 2014
40
2. CALCULATIONS FOR FIXED HIGH QUALITY END USER ACCESS - 2 MBPS LEASED LINES
2.1 Wholesale Prices -Telkom
The prices for Telkom South Africa are based on Megaline Silver and are wholesale prices, not including
any discounts.
The prices for Telkom South Africa are based on Megaline Silver and are wholesale prices not including any
discounts.
Table 19: Telkom Wholesale Megaline Silver OECD Basket 2 Mbps (exlc. VAT)
Distance km
main link
Tail ends Main links Local
ends
Fixed
charges
Charge
per km
Price
(month)
OECD
Weights
OECD
2Mbps
per month
2 1 373.96 36.24 446 0.50 223
16 2 1 764.12 373.96 36.24 2,482 0.18 447
46 2 1 764.12 373.96 36.24 3,569 0.06 214
96 2 1 764.12 1,355.49 16.61 4,478 0.08 358
196 2 1 764.12 1,355.49 16.61 6,139 0.10 614
496 2 1 764.12 4,865.29 1.21 6,994 0.08 559
Total ZAR 2,416
Total USD PPP 401
Total USD 251
Sources: Prices submitted to ICASA by Telkom

Telecommunications Sector Performance Review
Market Report 2014
41
2.2 Namibia
Table 21 displays the price for local ends and Table 22 the prices for the 2Mbps OECD basket based on
approved prices of 2011.
New prices have not yet been approved by CRAN.
Source: http://www.telkom.co.za/general/pricelist/downloads/tarifflist_Aug.pdf
Table 20: Telkom Retail Megaline Silver OECD Basket 2 Mbps (exlc. VAT)
Distance km
main link
Tail
ends
Main
links
Port
Charges
Local
ends
Fixed
charges
Charge
per km
Price
(month)
OECD
Weights
OECD
34Mbps
per
month
2 1 829.14 102.95 1,035 0.50 518
16 2 1 825.00 764.12 829.14 102.95 5,655 0.18 1,018
46 2 1 825.00 764.12 829.14 102.95 8,743 0.06 525
96 2 1 825.00 764.12 4,304.09 43.24 11,633 0.08 931
196 2 1 825.00 764.12 4,304.09 43.24 15,957 0.10 1,596
496 2 1 825.00 764.12 15,193.00 7.09 21,888 0.08 1,751
Total ZAR 6,337
Total USD PPP 1,053
Total USD 658
Table 21: Monthly cost of 2km local ends at 2 Mbps excl. installation cost
and excl. VAT)
Monthly cost in N$ for 2 Mbps
Port Monthly 1,577
NTU monthly 844
Network access via local leads (2km) monthly rental (for copper 2 pairs) 146
Distance Node to Node in km 2
Node to Node Distance Charge monthly per km 222
Node to Node Distance Charge fixed 1,535
Total Monthly 4,547

Telecommunications Sector Performance Review
Market Report 2014
42
2.3 Botswana 2013 prices
For the international comparison the 2Mbps basket with 2 km local ends is being used, which in the case
of Namibia is the one without distance charges.
Table 22: Telecom Namibia (2011 prices) for OECD Basket 2 Mbps with local ends (excl. VAT)
Distance km
main link
1 local
end
Fixed
charges
Charge
per km
Price
(month)
OECD
Weights
Retail per
month
Wholesale per
month (30%
discount)
2 1,535 222 1,980 0.50 990
16 4,546.81 1,535 222 14,184 0.18 2,553
46 4,546.81 1,535 222 20,851 0.06 1,251
96 4,546.81 7,163 110 26,786 0.08 2,143
196 4,546.81 7,163 110 37,754 0.10 3,775
496 4,546.81 24,299 20 43,526 0.08 3,482
Total N$ 14,194 9,936
Total USD PPP 2,022.0 1,415.4
Total USD 1,474 1,032
Source: Price data submitted to CRAN
Table 23: OECD Basket 2 Mbps for Botswana -retail and wholesale (exlc. VAT)
km Main link Fixed
charges
Charge
per km
Distance
charge
Access
charge
Modem
rental
Total
Monthly
OECD
Weights
Retail Wholesale
30% 80%
2 798 144 288 1,330 710 3,126 0.50 1,563
16 798 144 2,307 1,330 710 5,145 0.18 926
46 798 144 6,633 1,330 710 9,471 0.06 568
96 4,868 64 6,182 1,330 710 13,090 0.08 1,047
196 4,868 64 12,622 1,330 710 19,530 0.10 1,953
496 17,396 15 7,638 1,330 710 27,075 0.08 2,166
Total Pula 8,224 5,428 1,645
Total USD PPP 2,103 1,388 421
Total USD 994 656 199
Note: the basket was modified for the 2km length since BTC minimum distance is 15 km

Telecommunications Sector Performance Review
Market Report 2014
43
2.3 International Comparison
For the international comparison the 2Mbps basket with 2 km local ends is being used.
Source: OECD (2012)
Table 24. OECD monthly 2 Mbps basket, August 2012, VAT excluded 2 Mbps
USD USD PPP
Australia 4365 2780
Austria 1103 994
Belgium 1424 1217
Canada 3602 2836
Czech Republic 3755 4694
Denmark 590 396
France 1942 1688
Germany 1231 1150
Greece 952 952
Iceland 448 380
Ireland 1723 1378
Italy 1720 1737
Japan 4845 3251
Korea 3007 3759
Luxembourg 929 749
Mexico 1862 2909
Netherlands 1444 1301
Norway 902 564
Poland 693 1174
Portugal 1329 1342
Slovak Republic 5433 7149
Sweden 586 458
Turkey 668 1192
United Kingdom 2753 2086
United States 1659 1659
44
Physical Address: Communications House, No.56 Robert Mugabe Avenue, Windhoek, Namibia
Postal Address: Private Bag 13309, Windhoek, Namibia Tel: +264 61 222 666 Fax: +264 61 222 790
Email: [email protected] Fax2Email: +264 088 642 748 Website: www.cran.na