telecommunication services and networks: territorial ... · pdf filefor further information...
TRANSCRIPT

Telecommunication Services and Networks: Territorial Trends and Basic Supply of Infrastructure
for Territorial Cohesion
ESPON 1.2.2
Third Interim Report
August 2003
The views expressed in this report do
not necessarily reflect the opinion of
the ESPON Monitoring Committee

For further information regarding this report, please contact:
Ranald Richardson (Project Coordinator)
Centre for Urban and Regional Development Studies (CURDS)
University of Newcastle Upon Tyne
NE1 7RU, UK
Tel. +44(0)191 222 8004
Fax. +44 (0)191 232 9259
Email – [email protected]
Web: http://www.ncl.ac.uk/curds
ESPON 1.2.2 project partners:
CURDS, University of Newcastle, UK
Ranald Richardson
Andy Gillespie
Jonathan Rutherford
Simon Raybould
Ann Rooke
Amanda Stonehouse
Sue Robson
Centro de Estudios em Inovçao e Dinâmicas Empresariais e Territoriais (CEIDET),
University of Aveiro, Portugal
Eduardo Anselmo de Castro
Artur da Rosa Pires
Gonçalo de Sousa Santinha
Rui Fernandes Simão
Carla Cristina Santos
Maria José Marques
Raquel Sofia Santos
Degol Mendes
Karelian Institute, University of Joensuu, Finland

Sarolta Nemeth
Timo Hirvonen
Heikki Eskelinen
Lauri Frank
School of the Built Environment, Heriot Watt University, UK
Karryn Kirk
Cliff Hague

Acknowledgements
Additional list of National Experts that contributed to ESPON Project 1.2.2 TIR:
Name Country Institution
Martin Sokol Ireland University College, Dublin
Carlos Gonzáles
de Herrero
Spain Telefónica I+D – Investigación y Desarrollo S.A.
Unipersonal
Daniel Perez
Uriol
Spain Telefónica I+D – Investigación y Desarrollo S.A.
Unipersonal
Georg Aichholzer Austria ITA – Institute of Technology Assessment
Johann Cas Austria ITA – Institute of Technology Assessment
Julian Aichholzer Austria Worked for ITA – Institute of Technology
Assessment (Austrian Academy of Sciences) on a
project basis
Karsten Gareis Germany Empirica Gesellschaft für Kommunikations- und
Technologieforschung mbH
George Samaras Cyprus Computer Science Department of the University of
Cyprus
Dimitris Karaferis Grece Cyclotron Ltd, Consulting Engineers
Dimitris Katsianis Grece Department of Informatics and
Telecommunications, National and Kapodistrian
University of Athens
Marina Moula Grece Cyclotron Ltd, Consulting Engineers
Jaroslav Patka Czech
Republic
Czech University of Agriculture in Prague, Faculty
of Economics and Management
George Samaras Cyprus Computer Science Department, University of
Cyprus

Contents
Chapter 1 Part 1 of ESPON 1.2.2 Third Interim Report 1
1.1 Introduction 1
1.2 Summary of main findings 2
1.3 Short presentation of concepts, methodologies and typologies
used/developed
16
1.4 List of indicators developed/provided 19
1.5 List of Figures and Tables in the Report 21
1.6 Short report on Common Platform and Crete Guidance Paper 21
1.7 Integration of points raised in Response to Interim Report from March
2003
22
1.8 Progress made at Lead Partner meeting on 16 June 2003 23
1.9 Networking 23
1.10 Revised SWOT analysis 24
Chapter 2 Introduction to Part 2 of ESPON 1.2.2 Third Interim Report 26
Chapter 3 Regional variations in ICT availability and use: the case of ‘mature’
technologies
32
3.1 Note on the organization of Chapters 3 and 4 32
3.2 Introduction 32
3.3 Fixed Telephony 34
3.4 The Digitisation of the Basic Network 39
3.5 Mobile Telephony 42
3.6 The Internet 46
3.7 Territorial variations in the business use of ICT 55
3.8 Summary 59
Chapter 4 Regional variations in ICT availability and use: the case of new
‘broadband’ technologies
62
4.1 The growing importance of broadband 62
4.2 Defining broadband 64

4.3 Territorial differences in broadband penetration in Europe 71
4.4 Alternative broadband technologies 87
4.5 Summary 91
Chapter 5 The territoriality of pan-European telecommunications network
provision
95
5.1 The importance of pan-European networks 95
5.2 Methodology for collecting and analysing data on pan-European
network coverage
97
5.3 A territorial analysis of network extensiveness and inter-urban
connections
98
5.4 A territorial analysis of network capacities between cities and regions
in Europe
117
5.5 The territorial implications of pan-European networks for economic
development
122
5.6 Conclusions 127
Chapter 6 Summary of findings from an ESPON perspective 129
6.1 The territorial dynamics of nodal, network technologies 129
6.2 Explaining sub-national telecommunications territoriality trends:
regulation, geography, culture and institutions
133
6.3 Polycentric development and telecommunications territoriality trends 134
6.4 Typologies of telecommunications territoriality trends 142
Chapter 7 Policy issues 158
7.1 Introduction 158
7.2 The competitive and regulatory environment 159
7.3 Aggregation of telecommunications procurement by public (regional)
bodies
164
7.4 Examples of forms of intervention of by regional and local authorities
in creating broadband networks and services
167
7.5 Establishing greater symmetry of knowledge between public
authorities and telecommunications providers
172
7.6 Development and common indicators and improved and standardised 174

collection data with a regional focus
List of Figures
3.1 Main telephone lines per 100 inhabitants 37
3.2 Comparison of ‘Teledensity’ between largest cities and rest of country in
European countries (Euro 27 plus 2)
39
3.3 Proportion of main lines connected to digital exchanges 40
3.4 Distribution of ISDN lines in Hungary (ISDN Lines as % of total main
lines, 2001 at NUTS 3 level
41
3.5 Mobile telephone penetration at regional level (% of households – EU
15) in 1999
43
3.6 Cellular subscribers per 100 inhabitants 2001 (and compound annual
growth rate (CAGR) 1995-2001)
44
3.7 Estimated PCs per 100 inhabitants 2001 46
3.8 Internet users per 10,000 inhabitants 2001 47
3.9 The limited availability of sub-national data: internet users per 100
inhabitants
48
3.10 Estimated number of Internet users per 100 inhabitants 50
3.11 Level of household access to Internet by degree of urbanisation 52
3.12 Intensity of use of Internet: Growth in daily use by degree of
urbanisation
53
3.13 Proportion of households with Internet access in the Slovak Regions (by
region and by degree of urbaness)
55
3.14 Estimated proportion of firms with their own web site 58
4.1 Data rates for main broadband technologies 66
4.2 ADSL roll-out in North East England 69
4.3 Proportion of population subscribing to broadband (DSL and Cable
Modem) in European countries, 2002
72
4.4 Number of broadband subscribers (DSL and cable modem) per 100 of
population
73
4.5 Proportion of broadband subscribers in European countries, divided by
cable modem subscribers and DSL subscribers
74

4.6 Broadband availability in Finland – mapped by NUTS levels 2-5 81
4.7 Broadband availability in Finland (November 2001) mapped at NUTS 4 82
4.8 Population density in Finland at NUTS 4 84
4.9 ADSL coverage in Hungary 84
4.10 Population distribution in Hungary 84
4.11 ADSL coverage, population density and GDP per capita in France, Italy
and the UK
85
4.12 The number of broadband technologies available across the UK 87
4.13 ADSL coverage and uptake in UK regions 93
5.1 Comparing the population of FUAs with how many of ten of the main
pan-European network operators are present
100
5.2 Comparing the population of FUAs with the ranking of the top 60 cities
for telecommunications by Telegeography Inc.
101
5.3 KMI’s map of pan-European backbone infrastructures 102
5.4 Pan-European networks in South East Europe 103
5.5 Pan-European networks in Southern Italy and Greece 104
5.6 Pan-European networks in Germany 104
5.7 Pan-European networks in Sweden 106
5.8 Copenhagen as a pan-European infrastructure ‘gateway’ 107
5.9 The ‘local’ national loop of Energis in Poland 108
5.10 Comparing the number of pan-European networks present in FUAs with
the number of inter-city connections from FUAs
109
5.11 The number of pan-European networks ‘noded’ in NUTS 2 regions 113
5.12 The number of inter-regional connections via pan-European networks
between ‘noded’ NUTS 2 regions
116
5.13 European terrestrial networks in 2002 – ‘core’ area detail 118
5.14 Relatively limited backbone network capacities in eastern Europe 120
5.15 The number of headquarters of the top 1500 European companies present
in NUTS2 regions
122
5.16 Comparing pan-European network presence and top company
headquarter locations
124
5.17 A classification of NUTS 2 regions by top 1500 company headquarters
and pan-European network presence
126
6.1 The evolution of a technology’s population coverage 131
6.2 Different roll-out curves 132
6.3 Categorisation of EU27+2 according to their levels of mobile telephony
and Internet penetration
143
6.4 A typology of broadband penetration 145
6.5 A typology of the introduction of competitive provision 147
6.6 A typology of broadband penetration/introduction of competitive
provision
149
6.7 A typology of telecoms supply and demand characteristics based on
core/periphery, urban/rural, rich/poor (NUTS 2)
151
6.8 A classification of NUTS 2 regions by top 1500 company headquarters
and pan-European network presence
156

List of Tables
3.1 Countries experiencing an increase or decrease in fixed telephony
penetration (lines per 100 inhabitants) between 2000 and 2001
38
3.2 Comparison of penetration and growth rates of key IS technologies in
EU15 and CC
60
4.1 The territorialities of DSL network deployment across Europe 75
5.1 Inter-city connections with most networks along them 111
5.2 Major bandwidth routes (4.75-6.5 Gbps) 121
6.1 Polycentric development and telecommunications territoriality trends 135
6.2 Expected telecommunications supply and demand characteristics for
NUTS 2 regions
152
Preface
We see this report as having two inter-related purposes. First, to contribute to the
Third Cohesion Report, through the provision of information, analysis and policy
ideas. Second, to help in the process of building towards the ESPON Common
Platform.
Although this is an Interim Report we have written it as though it were a Final Report
in the sense that we draw together findings from our First and Second Interim Reports,
as well as introducing new information from our recent work, in an attempt to provide
as comprehensive a picture on the territoriality of telecommunications networks and
services as we can, given the extreme data limitations which we reported on in our
Second Interim Report.
The report is two parts. Part 1 is contained in a single concise chapter (chapter 1),
structured as requested by ESPON CU in its Response to 1.2.2 SIR, date 12th June
2003.
Part 2 draws together work from our previous reports with the results of new research
carried out under WP3. In Chapters 3 and 4 we consider regional variations in the
availability and use of telecommunications networks and services. In Chapter 3 we
consider ‘mature’ technologies: fixed line telephony and digitisation of those
networks, mobile telephony and the Internet. In Chapter 4 we consider the new
broadband technologies. In Chapter 5 we concentrate on pan-European fibre-optic
networks, carrying out further analysis of the data presented in the SIR. In this report
we are able to draw on the typology of over 1500 FUAs developed by TPG 1.1.1, thus
not only standardising the varying network data which we have uncovered from
different sources, but also building a crucial link with other ESPON projects and
offering further validation of these new data sets. In chapter 6 we summarize our
findings from chapters 3, 4 and 5 from an ESPON perspective. We present a model,
or typology, which describes the rollout of technologies from a territorial perspective.
We then go on to explore in detail how our findings regarding telecommunications
networks and services relate to ESDP and ESPON concepts, particularly the concept

of polycentricity. In the final chapter, chapter 7, we turn to explore a number of policy
issues which emerge from our analysis of the territoriality of telecommunications
networks and services. We then present a ‘menu’ of policy options for consideration
by policymakers.

PART 1

1
Chapter 1: Part 1 of ESPON 1.2.2 Third Interim Report
1.1 Introduction
Part 1 of this Third Interim Report (TIR) follows the structure set out in the ESPON
CU Response to our Second Interim Report (SIR), dated the 12th June 2003 (section 3)
in terms of the Framework and Structure used. It is organised in a series of (mainly)
short sections. In turn these are:
• Summary of main findings
• Short presentation on concepts, methodologies and typologies used/developed
• A list of indicators developed/provided
• A list of maps and tables in the report
• Short reports on:
• Application of Common Platform and the Crete Guidance Paper
• On the Integration of the points raised in response to the Interim Report from
March
• Benefits of networking with other ESPON projects
• Revised SWOT analysis
1.2 Summary of main findings
1.2.1 Context of territorial developments
The combination of liberalisation of telecommunications markets in the 1980s and
1990s (a process which is continuing) and the development and deployment of new
technologies has created a highly dynamic telecommunications environment in
Europe. This remains true notwithstanding the downturn of the telecommunications
market over the past couple of years. This dynamism means that the situation in
respect of territorial patterns of investment and uptake are constantly changing. The
patterns which we have uncovered in our study, therefore, to some extent represent a
‘snapshot’ of the current (or rather recent) situation. We have also, however,

2
attempted to identify trends, both those which appear to point towards a more even
spread of technology and those which point to continuing disparities. In this section
we draw out the key findings from our work to date as described in part 2 of this
report. Where appropriate we refer the reader to the particular section (or figure or
table) in the report to which the key finding relates.
Our study suggests that it is important to consider a range of network technologies
and services when exploring the complex patterns of telecommunications territoriality.
This is necessary in order both to understand the different territorialities (and potential
territorialities) of these technologies, but also to understand the close relationships and
synergies between these technologies. The ‘new’ technologies often depend on
previous rounds of investment for their cost effectiveness; commercially viable ADSL
broadband, for example, may depend on the pre-existence of digitally enabled
exchanges. Similarly, more ‘revolutionary’ technologies, such as wireless and satellite,
often depend on previous investments in fixed backbone networks. These
technologies, at least from a developmental point of view should, therefore, be seen as
complementary rather than competitive technologies. This means that we need to
explore both mature technologies, such as basic fixed voice telephony and more
advanced technologies such as broadband. It also means exploring backbone networks
and those which link the backbone to businesses and consumers. In terms of thinking
about policy, it also means considering those technologies that have not yet been fully
commercially developed, such as Wi-Fi and Satellite. In this section we pull out the
main findings in respect to these technologies from an ESPON perspective before
going on to outline some of key policy issues which emerge from our study.
The overall message emerging from our report is that the shape of supply and demand
for telecommunications in Europe is complex. This should not be surprising.
• First, the number of countries we attempt to cover is bound to create
complexity, notwithstanding attempts to create a single market for
telecommunications, a common regulatory framework and a common basis for
developing the information society across Europe (i.e., successive eEurope
Action Plans).

3
• Second the wide range of socio-economic circumstances of these countries
and of regions within these countries makes for complexity.
• Third, historical differences in patterns and trends in telecommunications
development between different countries also lead to complexity. Examples of
these different historical patterns include: different network ownership
patterns, for example, prior to liberalisation the UK had a single national
incumbent, whereas Finland had a set of small regional incumbents; different
start points, rates of, and attitudes towards liberalisation, some EU15 states
began the liberalisation process in the 1980s, by contrast some EUCCs are
only now coming to terms with this process, for example, Romania only
liberalised its telecommunications market in January 2003 and some EUCC
telecom markets remain only partially liberalised.
• Fourth, different technologies exhibit different geographical patterns and rates
of rollout.
• Finally, individual countries have their own particular attitudes to intervention
in the market.
Telecommunications networks have some distinctive characteristics which influence
strongly their territorial dynamics. Firstly, they are invariably nodal (except for
satellite communications, which is very much a special case in telecommunications),
in that they rely on (usually expensive) fixed pieces of equipment (switches,
exchanges, masts, etc) in order to provide service to a particular area –
telecommunications are never ubiquitously available, therefore, but are based on
particular nodal technologies, which can then connect up customers through wires or
wireless links.1 Secondly, and equally importantly, these nodes are parts of networks,
with their network characteristics applying at different levels; the node has to have a
local access network in order to connect individual users to the node, and the node has
to be connected to other nodes (usually in complex hierarchies involving inter-
connection with other networks) to meet the communications requirements of users.
1 In terms of transport analogies, this nodality of telecommunications networks makes them more like railways than roads, in that they require fixed points of access to the network to be provided, equivalent in this analogy to the station or freight yard.

4
Unlike other network technologies, such as the road or rail system, or energy
distribution networks, all of which are relatively stable and change only slowly and
incrementally, either growing or shrinking over time, telecommunications networks
are considerably more dynamic, fuelled by the rapid pace of technological innovation.
The key dynamic of telecommunications networks, therefore, concerns the roll-out of
new technologies, both within existing networks and in order to launch new networks.
Importantly from an ESPON perspective, network roll-out is an inherently territorial
process, in which new network technologies are deployed over time in a spatially
uneven manner, some areas being early in the ‘roll-out queue’, and others late.
Despite these complexities a number of general patterns emerge and a number of
dimensions of territorial disparity across the European space can be identified in
respect of TN&Ss. The main such general disparities are between cities (and countries)
across Europe in respect of pan-European Internet backbone infrastructure networks,
depending on size, but also on functions of particular cities and their location. So the
major global cities of London and Paris which have always been privileged in terms
of telecommunications infrastructure investment remain so. Some smaller centres
such as Hamburg, Dusseldorf and Amsterdam, however, are more or less equals in
terms of backbone networks and bandwidth provision. There are also a number of
‘regional capitals’ emerging in these networks, such as Madrid, Copenhagen and
Vienna, and cities which are acting as ‘gateways’ between national territories (such as
Lyon with respect to France, Italy and Switzerland). Further, the evidence suggests
that although there are ‘tunnel effects’ with respect to these backbone networks, there
are many instances of smaller cities along major routes being connected.
A ‘north-south divide’ exists across existing member states in relation to most
technologies. This can also be interpreted as a divide between cohesion countries and
non-cohesion countries (and the former east German Länder). It is notable, however,
that this pattern does not hold for mobile telephony, the adoption of which is much
more evenly spread. In the case of new broadband services (ADSL and cable modem)
the situation is complex. Again the north leads the way, with a group of 5 northern
member states, plus Austria and Switzerland, being the most advanced countries.
However, by contrast to the situation in respect of more mature technologies the

5
southern countries Spain and Portugal have higher take up than do the UK and France
(see figure presented below, figure 4.2 in report; for further discussion see section 4.3
of the report).

Proportion of population subscribing to broadband (DSL and Cable Modem) in European
Countries, 2002
Source: F
In the cas
apparent
territories
have sign
emerges i
commerce
commerce
Spain are
case in th
Copyright project 1.2.2 CURDS 20036
igures provided by ITU, mapped by CURDS
e of use of ICT by business (section 3.7) the north-south divide is again
in Europe. There is evidence of a pronounced ‘digital divide’ between
in Europe, in terms of their business usage of the Internet, which is likely to
ificant implications for regional development disparities. The pattern that
s remarkably consistent across the different categories and usages of e-
; the Nordic countries and Germany are making the fullest use of e-
as a tool of business competitiveness, while firms in Greece, Italy and
making very limited use of the new opportunities. Portugal is an unusual
at although many of its firms are connected to the Internet, often by DSL or
7
broadband connection, they appear to be making little commercial use of these
connections.
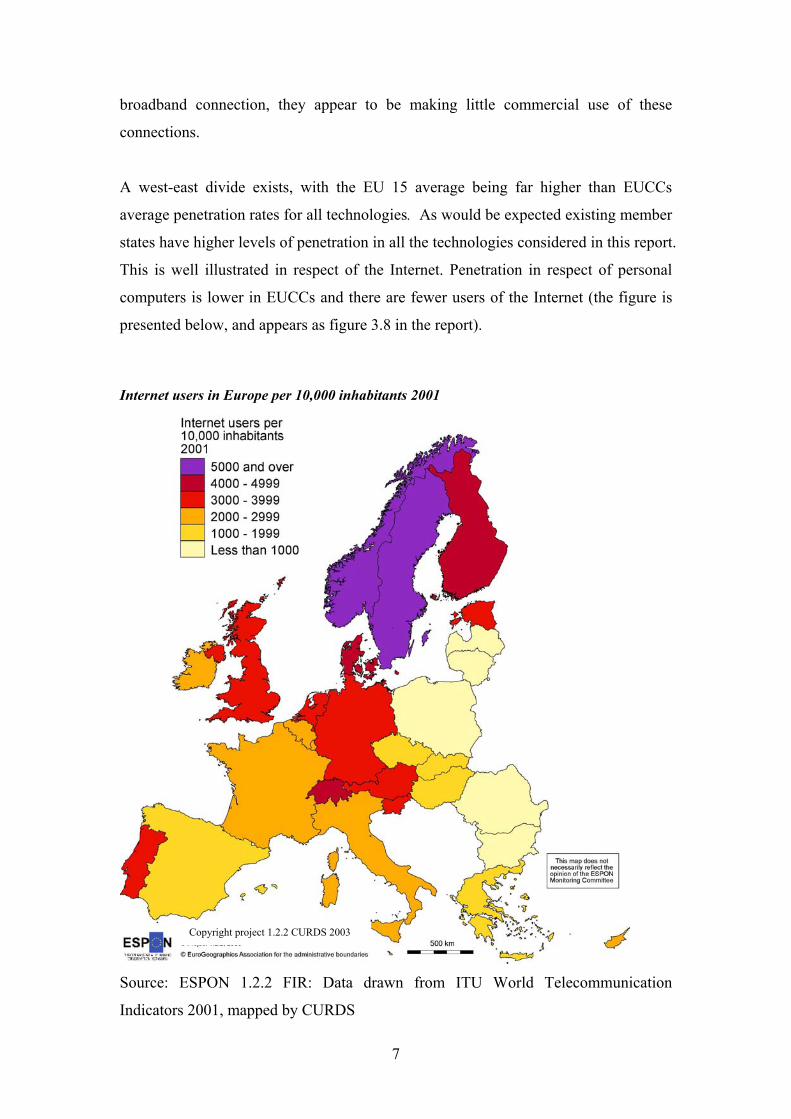
A west-east divide exists, with the EU 15 average being far higher than EUCCs
average penetration rates for all technologies. As would be expected existing member
states have higher levels of penetration in all the technologies considered in this report.
This is well illustrated in respect of the Internet. Penetration in respect of personal
computers is lower in EUCCs and there are fewer users of the Internet (the figure is
presented below, and appears as figure 3.8 in the report).
Internet users in Europe per 10,000 inhabitants 2001
Source: ESPON 1.2.2 FIR: Data drawn from ITU World Telecommunication
Indicators 2001, mapped by CURDS
Copyright project 1.2.2 CURDS 2003

8
As can be seen, five candidate countries fall within the lowest category of Internet
users. Two countries, however, Slovenia and Estonia exhibit higher than anticipated
Internet users.
There is some evidence, however, that the ‘gap’ between EU15 and EUCCs is closing.
The demand for several key technologies, such as mobile telephony, is growing more
rapidly in the EUCCs than in EU 15. Table 3.1 (presented below, for fuller discussion
see section 3.8 of the report) illustrates this point clearly in relation to PCs, the
Internet and mobile telephony. Mobile telephony has been particularly successful in
EUCCs and several countries are now experiencing a more rapid growth of mobile
than fixed telephony (see figure 3.2). As was shown in our SIR the fastest growth in
cellular telephony was in the EUCCs (data reproduced in the TIR report as Figure 3.6).
This ‘catch-up’ process is partly a result of EU15 markets opening up earlier and, as a
result, reaching a demand plateau sooner. It is encouraging that EUCCs seem to be
exhibiting significant growth in respect of several technologies, but it is not clear
whether economic constraints in at least some countries will mean that growth will
stall at a lower plateau.

9
Comparison of penetration and growth rates of key IS technologies in EU15 and CC
% Growth 2000/2001
CC EU-15 CC EU-15
Number of PCs
- per 100
inhabitants
Dec
2001
7 31 13.1 8.5
Internet hosts–
per 100
inhabitants
Jan
2002
1 4 38.2 19.5
Internet users –
per 100
inhabitants
Dec
2001
8 32 38.9 32.7
Mobile phones
– per 100
inhabitants
Dec
2001
31 72 42.1 14.9
Source: Eurostat (2002)2
In the case of broadband technologies there is again a significant gap in rates of
penetration, with the EU 15 average again being far higher than that for the EUCCs
(see figure 4.3, presented above). Again, however the situation should not be
oversimplified. Some EUCCs, notably Malta, Estonia and Slovenia, are in advance of
Member States, notably the UK, France and Italy, and Greece and Ireland lag several
other EUCCs.
There are also considerable differences between EUCCs. For example, in 2001 the
number of Internet users in Estonia and Slovenia was only slightly below the EU
average whereas it was less than one-fifth of the EU average in Romania (see figure
3.8). A similar pattern is emerging in respect of broadband (see figure 4.3) with some
countries, notably Bulgaria, Romania and Slovakia only beginning to roll out the new
broadband technologies over the past few months. There are also differences between
countries in respect of the degree of liberalisation undertaken. 2 Eurostat (2002) “Information Society Statistics: Data for Candidate Countries: Statistics in Focus, Theme 4 – 17/2002, author Richard Deiss.
10
We have very limited comparable data in respect of business use of ICTs in EUCCs.
A regression analysis carried out on the limited data which we did uncover during
WP3 of our study (see chapter 3), however, suggests that these countries lag EU 15, at
least as measured by companies with their own website. There are, however,
noticeable differences between EUCCs as there are between EU15 member states.
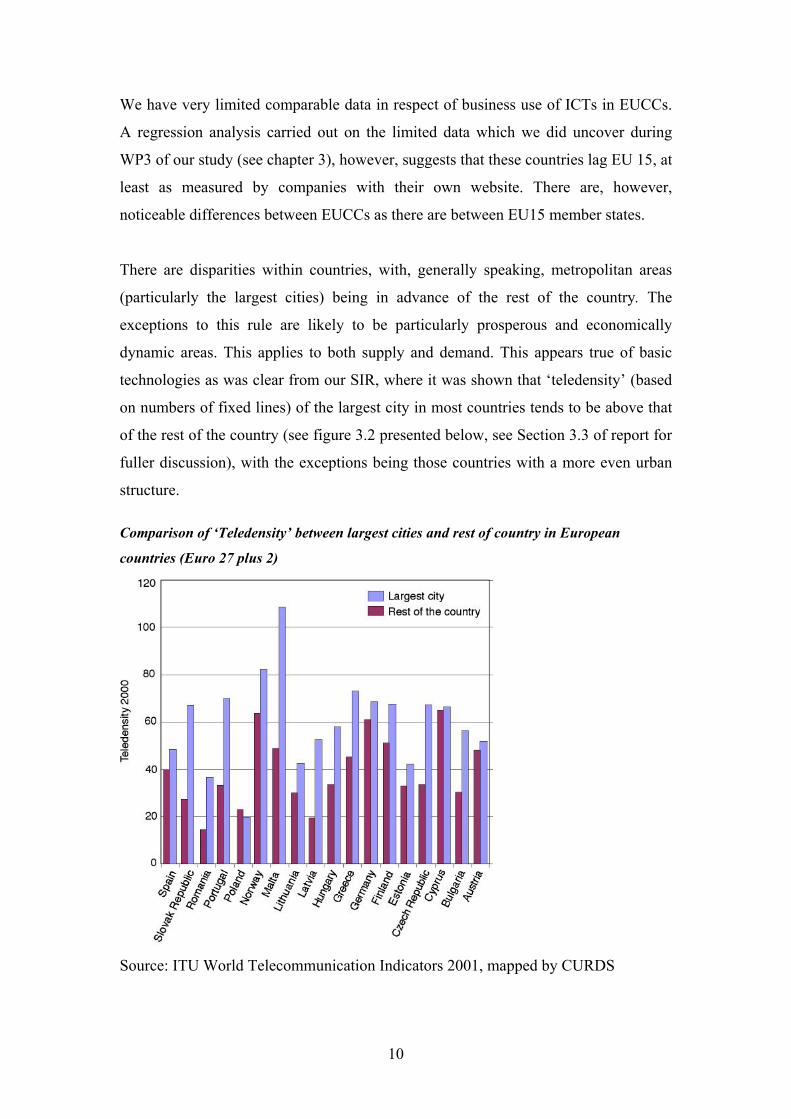
There are disparities within countries, with, generally speaking, metropolitan areas
(particularly the largest cities) being in advance of the rest of the country. The
exceptions to this rule are likely to be particularly prosperous and economically
dynamic areas. This applies to both supply and demand. This appears true of basic
technologies as was clear from our SIR, where it was shown that ‘teledensity’ (based
on numbers of fixed lines) of the largest city in most countries tends to be above that
of the rest of the country (see figure 3.2 presented below, see Section 3.3 of report for
fuller discussion), with the exceptions being those countries with a more even urban
structure.
Comparison of ‘Teledensity’ between largest cities and rest of country in European
countries (Euro 27 plus 2)
Source: ITU World Telecommunication Indicators 2001, mapped by CURDS

11
Similarly, access and use of the Internet appears higher in ‘metropolitan’ areas
(figures 3.10 and 3.11). The highest levels of use of the Internet appear to occur in the
capital city regions of the most Internet-adoptive countries – Vienna, Brussels,
Helsinki, Ile de France, London, Stockholm and Luxembourg. The emerging evidence
also suggests that in most countries the new broadband technologies have been (are
being) rolled out first to the largest urban areas (chapter 4, particularly table 4.1) and
then spreading to other urban areas (though see point below regarding the need to
explore these technologies at a fine territorial unit of analysis).
One of the most significant, and apparently most persistent, divides with respect to
TN&S supply and demand is the urban–rural divide, with rural areas lagging in
relation to most technologies and particularly in relation to the latest technologies.
This difference is particularly pronounced if metropolitan-rural comparisons are made.
This situation holds true for all technologies considered in this report, though lags in
respect of mobile technology appear to be shorter, and only those rural areas which
have natural topographical barriers such as mountains appear to be uncovered by this
technology, though choice of mobile provider may be more limited in some rural
areas. The rapid rollout of mobile technology to date is promising in that, potentially,
it will form a platform (both in terms of infrastructure and a consumer base) to
migrate to the new, third generation (3G) mobile technologies, based on UMTS,
which promise to give broadband access to multimedia services. Whether rollout for
3G will be as rapid as for 2G will, of course, depend on the state of the mobile
telecommunications companies and their ability to meet license obligations. To date,
the speed of commercial rollout of 3G has been slow (fuller discussion in section 3.5).
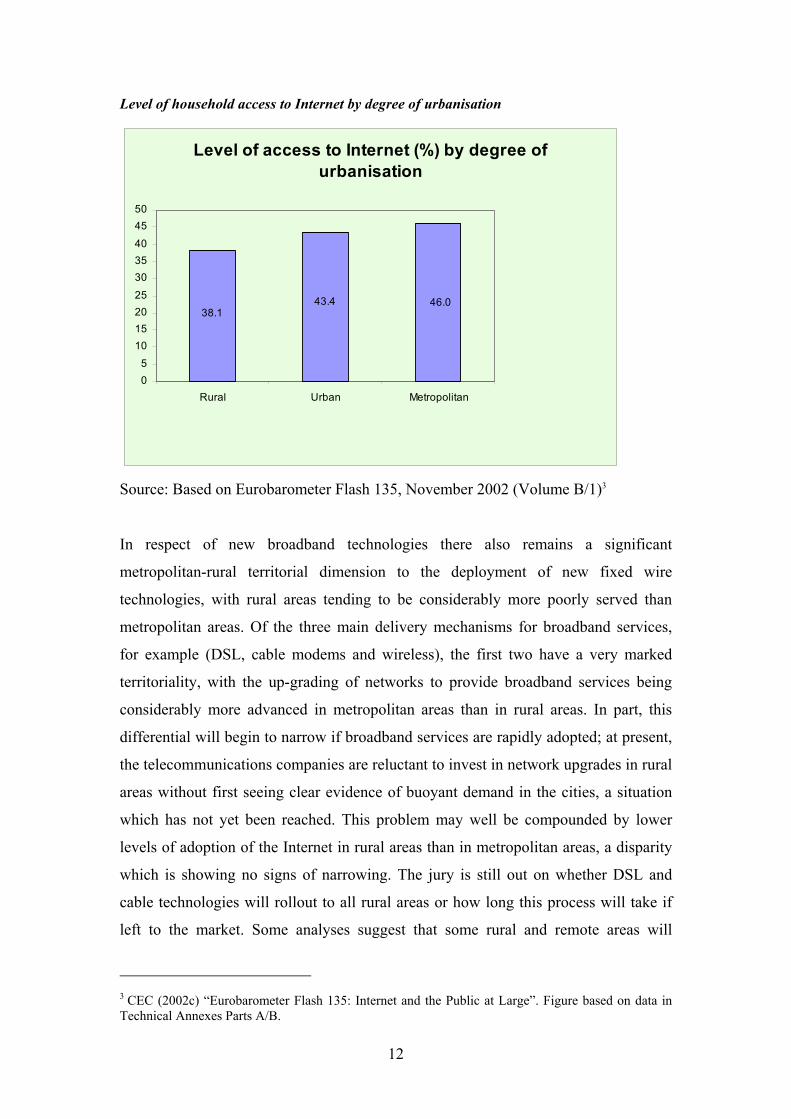
A digital divide between urban and rural can be seen in respect of a key technology,
the Internet. Figure 3.10 (presented below) shows this divide clearly, in terms of
households with connections to the Internet. The evidence which we present in
section 3.6 of this report suggests that this divide has been persistent over time and is
continuing. The data which we were able to call upon at the European level do not
allow us to distinguish clearly between types of rural area, but the limited data we do
have suggests that there will be differences between prosperous and less prosperous
rural areas and rural areas according to their location in core or periphery (but again
see point made below regarding the need to analyse networks at a fine spatial scale).
12
Level of household access to Internet by degree of urbanisation
Level of access to Internet (%) by degree of urbanisation
38.143.4 46.0
05
10152025
303540
4550
Rural Urban Metropolitan
Source: Based on Eurobarometer Flash 135, November 2002 (Volume B/1)3
In respect of new broadband technologies there also remains a significant
metropolitan-rural territorial dimension to the deployment of new fixed wire
technologies, with rural areas tending to be considerably more poorly served than
metropolitan areas. Of the three main delivery mechanisms for broadband services,
for example (DSL, cable modems and wireless), the first two have a very marked
territoriality, with the up-grading of networks to provide broadband services being
considerably more advanced in metropolitan areas than in rural areas. In part, this
differential will begin to narrow if broadband services are rapidly adopted; at present,
the telecommunications companies are reluctant to invest in network upgrades in rural
areas without first seeing clear evidence of buoyant demand in the cities, a situation
which has not yet been reached. This problem may well be compounded by lower
levels of adoption of the Internet in rural areas than in metropolitan areas, a disparity
which is showing no signs of narrowing. The jury is still out on whether DSL and
cable technologies will rollout to all rural areas or how long this process will take if
left to the market. Some analyses suggest that some rural and remote areas will
3 CEC (2002c) “Eurobarometer Flash 135: Internet and the Public at Large”. Figure based on data in Technical Annexes Parts A/B.

13
remain commercially unviable and therefore unserved unless an interventionist
approach is developed.
Our study suggests that the new generation of wireless technologies may have a role
to play in extending access to broadband technologies to remote and rural territories
(and indeed could be used to serve some urban areas). We provide examples of where
strategies around these wireless technologies have been introduced (chapters 4 and 7).
The hope is that these technologies will provide a commercially viable platform from
which to introduce services to rural areas. Beyond certain technical advantages these
technologies also have cost advantages, in particular they do not require the very
labour intensive, and therefore costly, installation of kilometres of cables and wires.
This makes it more cost effective for new companies to enter the market. Further,
incumbents tend not have a dominant position in respect of wireless technologies
which they often retain in respect of more mature technologies and their broadband
successors such as ADSL.
A note of caution should be added, however, and care must be taken not to develop a
technologically determinist approach to these technologies. Firstly, they are still
expensive, even if they prove cheaper than DSL and cable. Secondly, they still rely to
some extent on being connected to fixed line networks – for example, satellite
delivers broadband to the home, but does not carry it from the home. Thirdly, wireless
providers are still most likely to direct investment to urban areas, as has been the case
with Wi-Fi where a number of urban (and transport corridor) hotspots have emerged.
Finally, rural areas are still likely to exhibit low demand for these new technologies. It
is only by combining (probably subsidised) investment in these technologies with
other measures (both short-term and longer-term) to stimulate demand that these
technologies will have the potential to provide a more balanced urban-rural pattern of
technology rollout.
To sum up there is evidence of north-south, west-east, EU15-EUCC, and core-
periphery divides in supply and demand for telecommunications networks and
services. At a sub-national level, there are important capital city-rest of country, major
cities-other cities and urban-rural divides. Looking at the evidence from the ESPON

14
3-scale perspective, i.e., macro, meso and micro, our findings suggest the following
descriptive classification.
Main disparities in supply and demand of TN&S in European Space at Macro, Meso and
Micro levels
Spatial level of
analysis
High supply and
demand
Low supply and demand
Macro North South
West East
Core Periphery*
Capital/major city Rest of country Meso
Urban Rural
Urban Rural hinterland Micro
Urban core Urban periphery
* It is important to note that the Nordic periphery is an important exception to this
rule, indeed it is the most advanced part of Europe in respect of most technologies
The table presented above (table 6.1 in the report) provides a very rough description
of supply and demand for telecommunications networks and services at three
European spatial scales. As with any model it misses some important nuances. As is
pointed out above, for example, although there is a clear core-periphery disparity, the
northern periphery is the most advanced area in Europe, in terms of take-up. Similarly,
though there is a clear West-East disparity some countries are catching up in respect
of newer technologies, notably Estonia and Slovenia.
Clearly, then, there are a range of disparities across European territories. Some of
these disparities appear to be closing. Others, such as the urban-rural gap are not
closing and in some respects may be widening. If the deployment is left solely to the
market it is unlikely that these gaps will be closed. It follows, therefore, that if more
even territorial development is a policy goal, means of public intervention will have to
be found. In chapter 7 of the report we suggest a number of ways in which

15
intervention could be undertaken. We put forward a number of actions which could be
taken to help ameliorate the situation. These include:
• Stimulating competition further, focusing in particular on those territorial
areas where, evidence to date suggests, that it is unlikely to occur
spontaneously;
• Amending the Universal Service Directive to increase the number of
technologies and operators covered by the Directive (and associated national
regulations);
• Requiring telecommunications regulators to take greater account of territorial
development issues rather than concentrating on pricing and competition
issues only;
• The aggregation of demand within a territory. This can be done in several
ways; through aggregated telecommunications procurement by public
(regional) authorities in order to ‘pull through’ broadband technologies into
regions or localities by creating a critical mass in the territory; through
aggregating demand from local businesses; or by creating local ‘hot spots’ by
creating business centres, telecentres or public internet access points;
• Direct intervention by regional and local authorities to ensure the construction
of broadband networks and services in territories where the market will not
provide or needs a ‘kick start’. Examples of how this might be done include:
providing direct subsidies to telecommunications providers; creating public
partnerships with telecommunications providers; constructing networks
themselves and providing access to operators; creating a permissive land use
environment.
• One area in which there is much work to do is in establishing greater
symmetry of knowledge between public authorities and telecommunications
providers. We feel that this is a crucial element in creating the infrastructure
required for the development of information regions, particularly in those
regions where the market is not working.
• Finally, as we stressed in our FIR and SIR. There is the need for a more
rigorous approach to territorial data on ICTs. A common set of indicators
should be established, accompanied by an improved and standardised

16
approach to a regional data collection. Without such measures we will only a
have a poor basis for informed policy-making with respect to regional
telecommunications.
1.3 Short presentation of concepts, methodologies and typologies
used/developed
The general approach deployed during project 1.2.2 to date has largely involved
trying to uncover quantitative and qualitative data. WP1 and WP2 mainly involved
gathering and analysing data at the European level, from the Commission, from
telecommunications companies, from international agencies such as OECD and ITU,
from consultants and from other relevant research projects, such as SIBIS and BISER.
This was reported on in our SIR so we will not detail the issues and problems which
emerged during these WPs. WP1 and WP2 were initially envisaged as stand alone,
time limited, workpackages. It has become clear, however, that in the rapidly
changing telecommunications environment, some resource needs to continue to be
devoted to keeping in touch with the organisations approached earlier in the project in
order to gain access to the latest data. This approach is particularly important given
the difficulties which we have experienced in gaining comparable data from national
agencies (see approach to WP3 below). We have, therefore, continued to review the
key data sources identified in our SIR. This approach has resulted in new data from
ITU and OECD, as well as new data from sources which we were not able to utilise in
our SIR, notably a report on broadband rollout by the consultancy Point Topic. We
have continued to chase the Commission for access to the key 2001 report on regional
demand for ICTs (the follow up to the EOS Gallup Report of 1999), both through
direct contact and through the ESPON CU, without success.
The main element of approach over the past six months has been to contact
appropriate agencies and companies at the national level, in an attempt to seek out
comparable data relating to the supply and demand for data. A list of organisations
contacted through this process is provided in the Annex Volume to this report (Annex
5). As anticipated, this labour intensive exercise resulted in a limited amount of

17
information which was or could be made comparable. We encountered a number of
problems in gaining comparable data. Some of these difficulties would be common to
all research projects where data gathering is required, for example, difficulties in
identifying the appropriate agencies or individuals who could supply information and
the tardiness of respondents in responding to enquiries. Beyond this a number of
specific difficulties can be identified, examples include:
• Lack of data availability which covered our agreed indicators. Simply put,
some countries did not collect data for the indicators which we had developed
under WP1 and WP2. Data on proximate indicators were available in some
cases, but these were not necessary close enough to allow comparison;
• Paucity of regional data on nearly all our indicators. Only a few indicators
relating to the Internet (the current hot topic) were commonly collected (see
regression analysis in Chapter 3 of this report for details);
• Data is collected at different regional levels in different countries. In some
case these related to NUTS levels, in other cases data is reported at other
administrative levels which are not comparable. By imposing a particular
NUTS level (2 or 3) on the data collection exercise would have led to an even
more limited data set than we have obtained;
• Data is collected at different times in different countries, i.e., there is no
common census date. This is particularly important in a rapidly evolving
environment such as telecoms. We initially tried to set a census data of final
quarter of 2002, but it was clear that by adhering to this we would have an
even more limited data set with which to work.
Given the problems identified in collecting regional data at the national level, and
following discussion with the ESPON CU, it was decided to put on hold the data
collection exercise. This does not imply that we discontinued the exercise altogether,
as we continued to follow up contacts and leads and to collate data as it came in. We
did not, however, aggressively chase data or interviews where we had not previously
had a response or where the response had been unsatisfactory. Instead of chasing date
we turned to analysing the limited data which we had collected. This involved:

18
• Analysing our data to identify which indicators we had useable data for (see
Annex 1 in Annex Volume for table of indicators and data collected by
country);
• Carrying out a regression analysis on those indicators (see Chapter 3 for the
results of that regression analysis and Annex 3 in Annex Volume for full
methodology and approach adopted), in part in order to provide estimates of
missing data;
• A synthetic analysis of data provided through our survey in attempt to draw
out common trends and differences (e.g., in approach of regulators to
territoriality) (see Annex 4 in Annex Volume for full methodology and
outcomes);
• An analysis of the data in an attempt to empirically validate the typologies of
territoriality of telecoms which we have constructed;
• An analysis of qualitative data which emerged from our interviews and
surveys in order to identify commonalities and differences between countries.
We have developed a number of typologies of telecommunications territoriality trends.
These are listed below, with the number of categories and the spatial level of each
typology shown in brackets:
• Mobile penetration / internet penetration (2x2) (national level)
• Broadband penetration (3) (NUTS 2)
• Introduction of competitive provision (2) (NUTS 2)
• Broadband / introduction of competitive provision (3x3) (NUTS 2)
• Telecoms supply and demand characteristics, based on core/periphery,
urban/rural and core/periphery categorisations (2x2x2) (NUTS 2)
• Network richness (3) (NUTS 2)
• Network richness / head office concentration (3x3) (NUTS 2)
For further discussion see section 6.4 of the report.

19
1.4 List of indicators developed/provided
Indicators developed for data collection in WP3 of 1.2.2 project
Indicators NUTS 0 NUTS 1 NUTS 2 NUTS 3 NUTS 4 NUTS 5
Development of TN&S
• Number of telephone access lines per 100 inhabitants
• Faults per 100 main lines per year
• Investment in communication network by operators per 100 inhabitants
• Net change in number of main lines (=/-) in previous year
• Proportion of main lines connected to digital exchange
• Proportion of exchanges ISDN enabled
• ISDN lines as a proportion of total main lines
• Proportion of exchanges ADSL enabled
• ADSL lines as a proportion of total main lines
• Homes passed by cable per 100 residencies
• Homes passed by digital cable • Cable modem lines as a
proportion of total lines installed
• Proportion of exchanges with co-located equipment (local loop unbundling)
• Availability of Internet service with (a) local rate charges (b) unmetered access
• Number of PIAPs per 1000 inhabitants
• Number of secure servers per 10000 inhabitants (using IP address look up tables
• Competition in fixed network infrastructure (number of licenses; number of active providers?)
• Competition in cellular phone infrastructure (number of licenses; number of active providers?)
• Number of fixed network operators offering local national

20
telecommunications • Number of fixed operators
offering long distance national telecommunications
• Number of operators offering international telecommunications
• Number of cable service and satellite service providers
• Maps of network configuration?
Up-take and use of TN&S
• Telephone subscribers per 100 inhabitants (i.e., fixed and mobile)
• Percentage of households with a telephone
• Installed PCs (with modem?) per 100 inhabitants
• Cellular subscribers per 100 inhabitants
• Proportion of households subscribing to Cable services
• ISDN subscribers per 100 inhabitants
• ADSL subscribers per 10,000 inhabitants
• Proportion of households with Internet access
• Proportion of households with broadband Internet access
• Internet users per 1000 inhabitants (at work, at school or at home)
Up-take and use by business
• Proportion of firms with access to the Internet
• Proportion of firms with own website
• Proportion of firms making sales via e-commerce
• Proportion of firms making purchases using e-commerce
• Value of sales by businesses made via the Internet
• Value of purchases made by businesses via the Internet
• Use of broadband to access the internet by size of business
• Level of business activity by type of internet access

21
The table set out above provides the list of indicators developed by 1.2.2. for the
collection of regional data from national organisations in WP3. Indicators marked in
bold are priority or core indicators. The data returned was collected into a spreadsheet
and appears as Annex 1 in the Volume Annex.
1.5 List of Figures and Tables in the Report
See list of Figures and Tables.
1.6 Short report on Common Platform and Crete Guidance Paper
Our view is that the Common Platform has become more solid as the project and the
ESPON Programme has proceeded. The Crete Guidance Paper was a particularly
useful document and helped bring clarity to the concept of a Common Platform,
describing well the general idea and philosophy.4 We believe our TIR will make
contributions to the Common Platform as elucidated in the Crete Guidance Paper in
the following respects:
• We have produced a set of core indicators (see 1.4 above).
• We have produced a number of typologies of regions (see 1.3 above, and
section 6.3 of the TIR)
• We have contributed to the ESPON map database. Not all maps which we
have produced in our report will be suitable for the ESPON database, for
copyright and other issues. We will, however, submit a number of maps to the
database in September as requested in the email from BBR dated 18th August.
If we are able to obtain access to the follow up report to the EOS Gallup
Report, used extensively in our SIR, we will be able to deliver further regional
maps to the ESPON database. 4 Although, as several TPGs, pointed out the deliverable timetables put forward in the document were unsustainable.

22
• We have undertaken an analysis of territorial trends in telecommunications
networks and services in each of our reports to date and reflect on how these
differ across different types of regions (e.g., core-periphery, urban-rural);
• We analyse a number of ESPON concepts, most notably, as requested in
ESPON response to our SIR, the relationship between telecoms and
polycentricity (see chapter 6 in particular);
• In chapter 7 we look in detail at a range of policy issues putting forward a
menu of policy options and providing empirical examples of initiatives in
these areas.
1.7 Integration of points raised in Response to Interim Report from March
2003
The two main comments on our SIR were:
• When examining [the] impact of ICT supply and policy please include the
approach to the potentials of ICT improvements and regions and FUAs, which
might support the competitiveness of areas.
We have covered this point in several places in our TIR most notably in Chapters 3, 4,
5, and 7.
• Please include in your territorial analysis the concept of polycentrism (at three
scales)
We have covered this point, particularly in Chapter 6.
1.8 Progress made at Lead Partner meeting on 16 June 2003

23
Our view is that the LP meeting in June 2003 was a very useful meeting. This
presented the opportunity for the first time for TPGs to learn of the research and
progress of other TPGs. From a ‘scientific’ point of view, therefore, this was a useful
meeting. Progress was also made in developing the Common Platform in that the
purpose and structure of the Common Platform was clearly elucidated for the first
time. We believe that this will form a useful base for further work during the
following phases of ESPON. The meeting was also useful in terms of networking (as
was the Crete meeting) with other TPGs. Finally, from the ESPON 1.2.2 perspective
it was useful in that we could start to interface directly with the appropriate
Commission officer, leading to a more tailored and productive interchange and input
into policy. This process is continuing.
1.9 Networking
We have been involved in general networking and exchanging ideas at all the ESPON
seminars and at the Lead Partner meetings and welcome the opportunity to continue
this process in the coming months.
During the past few months we have networked with three TPGs in particular;
• TPG 1.1.1 where we have been involved in bilateral contacts regarding use of
FUA typology ahead of formal release, where they were very helpful. Also we
discussed the use of TPG 1.1.1’s Top 500 company database. In the end, this
was not used, as the Amadeus database was found to be more relevant for our
purposes, but there may be further room for collaboration in this area.
• TPG 2.1.1 where we have a number of contacts to exchange data, to see what
synergies could be developed, and, latterly, to ensure that we are not
duplicating work, particularly in relation to modelling.
• TPG 3.1 whom we have found to be most helpful, particularly in relation to
mapping ideas. Beyond this we have had a number of useful conversations
regarding developing some of the components of our work to date during the
next phase of our report.

24
1.10 Revised SWOT analysis
Our revised SWOT analysis is presented as Annex 1 to this report.

25
PART 2

26
Chapter 2: Introduction to Part 2 of ESPON 1.2.2 Third Interim
Report
ICTs have brought opportunities and challenges for many enterprises and regions.
Firms face ICT induced changes that include increased access to a wide knowledge
base, as well as creating new market opportunities and new forms of industrial
organisation. Regions face a rapidly changing technological landscape which will
have a profound influence on the living and working conditions of their citizens and
in the territorial distribution of economic activity.
The explosive growth of mobile telephony and the rapid diffusion of the Internet, in
both home and work environments, testify to the extent to which our daily lives are
becoming dependent upon these technologies. So pervasive have these technologies
become, and so quickly integrated into the fabric of daily life and business practices,
that access to them is becoming almost a necessity for the full participation of citizens
in society, and, for economic enterprises, a necessity for their economic viability.
Examples of how, in a few short years, firms have come to depend on
telecommunications networks within their competitiveness strategies include:
• Email has become an essential tool of communication within enterprises and
with external partners;
• Telephone call centres have become integral to customer service and
marketing strategies for many consumer services;
• Web sites have become a principal means of providing information to
customers and a major marketing channel;
• Corporate broadband networks and so-called ‘groupware’ are making it
possible to build ‘virtual teams’ of spatially-dispersed team members, with
significant implications for the geography of human resources;
• Mobile digital telephony is enabling field and sales staff to have access to
corporate information systems while at clients’ premises or ‘on the move’;
• Business-to-Business (‘B2B’) e-commerce is radically altering the way supply
chains function (for example it is estimated at over 200billion € in 2002 in

27
Europe, a fourfold increase from the previous year; Business Week, May
2003).
From a territorial perspective, such developments offer enormous opportunities for
reducing the ‘friction of distance’ and/or the problems of remoteness which many
peripheral regions and rural areas have suffered from. At the same time, however,
concerns are arising5 over the territorial dimension to the so-called ‘digital divide’,
whereby any deficiencies in access to the advanced networks, or geographically-
defined limitations in the capabilities of enterprises and households to make use of
these networks, could serve to exacerbate, rather then ameliorate, territorial
development disparities.
Within the context of enlargement, liberalised telecommunications markets, rapid
technological change and the anticipated roll-out of next-generation digital mobile
and broadband networks, there is a need to review the evidence concerning the extent
to which the EU’s diverse territories are sharing in the benefits of ICT up-take and
usage. In this period of rapid change, is the ‘digital divide’ between favoured and less-
favoured regions, or between cities and rural areas, widening or narrowing? The
answers to these questions have considerable importance from a territorial
development perspective, as it is difficult to overstate the significance of
telecommunications networks and ICTs more broadly for development within a
knowledge-based economy, as the following selection of quotes from recent literature
makes clear.
5 The extent of the ‘gap’ in ICT supply, adoption and usage between favoured and less-favoured regions of Europe has been a policy concern of the European Union since the mid-1980s. Community initiatives such as the STAR (Special Telecommunications Action for Regions; 1987-91) and TELEMATIQUE (1991-3) Programmes, and innovative actions such as the Regional Information Society Initiative (RISI) in the second half of the 1990s, are examples of policies to address regional telecommunications disparities, and have led to major efforts to ‘mainstream’ information society measures within the current round of the Structural Funds.

28
“The ability of regions to have access to and exploit the possibilities offered
by new ICT affects their capacity to exploit human resources, technology and
their development potential” (BISER, 2002, D.D1, p8)
“The now evident economic, social and cultural importance for all parties
(households, businesses, schools, public administration), wherever they are
based, to have access to modern information and communication networks,
underlines the territorial stakes of entry in the information society. From now
on, the key factor is no longer only the offer of new technologies, but the rate
of diffusion of these technologies to territories and their cost, given their
contribution to local development” (DATAR website 2003 ).
“A city’s [or region’s] attractiveness as a telecom hub is a major determinant
of whether it will be a prosperous place in the 21st century. In the same way
that access to maritime and overland trading routes determined prosperity in
the past, access to affordable and bountiful bandwidth services will be the
marker of the future” (Lynch, 2000).
In this, Part 2, of our Third Interim Report we pull together the evidence from our
work to date to try and describe the emerging territorial patterns of
telecommunications networks and services supply and demand. In this chapter
(chapter 2) we set out a brief introduction to part 2, outlining the content of the
subsequent chapters.
In Chapters 3 and 4 we consider regional variations in the availability and use of
telecommunications networks and services. We stress the need to explore territorial
patterns for both mature technologies and new broadband technologies. In chapter 3
we consider the more mature technologies. In turn, we look at fixed telephony and
digitisation of the telephone network (3.3 and 3.4), mobile telephony (3.5), personal
computers and the Internet (3.6). We then look at business use of the ICTs,
particularly the Internet, for e-commerce. The evidence presented shows that there are
a number of disparities. These are apparent between Member States and EUCCs, in
respect of all the more mature technologies, though there is also evidence to suggest

29
that the gap is closing in respect of several technologies, including the Internet and
mobile telephony. There are also disparities between member states and between
EUCCs. There are clear differences within individual countries. The urban-rural
divide is particularly apparent, especially the metropolitan-urban divide. Worryingly,
this gap is clear in respect of Internet use, a key tool in linking individuals and places
to the information society. Furthermore, this gap appears to be growing.
In Chapter 4 we explore the rollout of new broadband technologies which are
currently the main focus of policymakers in respect of telecommunications networks
and services. We first reflect on the growing importance of broadband (4.1). We then
go on to consider what is meant by broadband, pointing out that the term tends to be
used loosely by policymakers and in the marketing literature of telecoms companies
and that ‘broadband’ technologies currently being rolled out commercially have
relatively low bandwidth capacity in comparison to some alternative technologies
(4.2). We also point out that these most commercially developed technologies (ADSL
and Cable Modem) appear to have an urban bias. This is partly due to technical
limitations, but is also due to cost of rollout. We then present evidence to show that
there are clear regional disparities in respect of those technologies (4.3). There are
disparities between countries, with north-western countries, together with Austria and
Switzerland, in the lead. Although there is, in general terms, an East-West divide,
certain EUCC countries, Estonia and Slovenia, are more advanced than are a number
of EU 15 countries. Within individual countries the dominance of key cities, including
the capital city, in the early stages of the rollout process is very clear. It seems that a
rollout dynamic is underway and it is likely that most urban areas will be covered in
the relatively near future. There is also, however, some evidence to suggest that some
remote and rural areas may not be covered if investment is left to the market alone, as
telecom companies do not envisage these areas being profitable. We then go on to
explore alternative broadband technologies, suggesting that wireless technologies
might be more appropriate than DSL and cable modem for more remote areas. We
point out, however, that wireless technologies should be seen as complementary to
fixed technologies.
In Chapter 5 we turn our attention to pan-European fibre-optic networks. These
‘backbone’ networks, which offer businesses the fastest, highest-capacity and most

30
seamless broadband connections available, are vitally important in linking the
European space and are in some ways analogous to motorways or inter-city railway
lines. Here we reanalyse the data presented in chapter 5 of our SIR. When preparing
our SIR the ESPON list of functional urban regions (FUA) was not available. We
therefore drew on other sources to form a list of 138 European cities (see chapter 5 of
1.2.2 SIR for details). In this report we are able to draw on the typology of over 1500
FUAs developed by TPG 1.1.1, thus not only standardising the varying network data
which we have uncovered from different sources, but also building a crucial link with
other ESPON projects and offering further validation of these new data sets. We also
reanalyse some of the data presented in chapter 5 of our SIR at the NUTS 2 level. In
addition to reanalysing the data used in our SIR, we carry out further analysis. In
particular, we explore potential connections between the presence of network ‘nodes’
in particular cities and the presence of company headquarters, to underline the
economic development implications of these backbone infrastructures.
In chapter 6 we summarize our findings from chapters 3, 4 and 5 from an ESPON
perspective. We present a model, or typology, which describes the rollout of
technologies from a territorial perspective (6.1). We then consider cultural and
institutional factors which help explain differential roll out patterns between countries
(6.2). We then go on to explore in detail how our findings regarding
telecommunications networks and services relate to ESDP and ESPON concepts,
particularly the concept of polycentricity (6.3). Here we consider three levels – the
macro, the meso and the micro. We then turn to further develop our ESPON
typologies (6.4). We provide a commentary and a set of maps which put some
empirical flesh on the abstract typologies.
In the final chapter, chapter 7, we turn to explore a number of policy issues which
emerge from our analysis of the territoriality of telecommunications networks and
services. We are aware that different Member States and the candidate and accession
countries have different histories and cultures, are at different stages in the
deployment of ICTs and may have different attitudes to regulation and intervention.
We assume, however, that all countries have the objective of more even territorial
development and would argue that, if this is the case, then a more even deployment of
telecommunications infrastructure will be required. We therefore present a ‘menu’ of

31
policy initiatives, covering: changes in the regulatory and competitive environment,
the aggregation of territorial demand of telecommunications (particularly broadband)
infrastructure), methods by which regional and local authorities can intervene to work
with or as a substitute for private sector telecommunications companies to ensure the
provision of networks in their region or locality. In each case we provide boxed
examples of existing initiatives. Finally, we suggest that, regardless of the particular
initiatives undertaken (or not undertaken), there is a need for the spatial development
community to increase its awareness of and knowledge about telecommunications.
We argue that it is only through developing a more symmetrical relationship between
public authorities and private sector telecoms companies (who will remain the main
providers of the infrastructure) will public authorities be able to ensure that territorial
development goals can be met. As part of this process a common set of indicators and
standardised mechanisms for the collection of telecoms supply and demand data at the
regional level, and below, need to be established.

32
Chapter 3: Regional variations in ICT availability and use: the case
of ‘mature’ technologies
3.1 Note on the organization of Chapters 3 and 4
In this chapter and the following chapter (Chapter 4), we draw on our findings to date
from WP1, WP2 and WP36 to explore the territorial patterns of telecommunications
networks and services in Europe. In the present chapter, we first present a general
introduction in which we summarise our key findings in respect of the territoriality of
both ‘mature’ (essentially narrowband) technologies and ‘new’ (essentially broadband)
technologies in Europe (section 3.2). In the rest of chapter 3 we concentrate our
attention on a number of technologies of varying degrees of maturity: fixed telephony,
including the digitisation of fixed networks, mobile telephony, personal computers
and the Internet.
In chapter 4 we turn our focus to broadband technologies. We devote considerable
space to broadband as this set of technologies is currently of most interest to
policymakers, reflecting their perceived importance to the development of
information society applications in domestic, public service and business spheres and
the competitiveness of countries and regions. The division into two chapters is
somewhat artificial, as (as we stress in section 3.2) the ‘mature’ and ‘new’
technologies are closely linked and historical patterns of investment in the former may
condition investment in the latter. We feel, however, that the division into two
chapters will be more convenient to the reader.
3.2 Introduction
Examining territorial disparities in the up-take of ICTs can focus on mature and
widely deployed technologies, in which disparities can be largely interpreted as
reflecting variations in the level of demand and usage, or can focus on the most
6 See discussion of our methodology in Part 1 of this report.

33
advanced technologies, such as broadband. Although the more advanced technologies
are regarded as the most important for policymakers7, it needs to be remembered both
that advanced technologies usually depend on the infrastructure and usage platform
created by earlier technologies, and that at the very early stages of deployment of a
technology, supply-side constraints, as reflected in the geographical ‘roll-out’ of
communications infrastructure, will often have a significant influence on levels of up-
take. To take a current example, the relatively low level of up-take of broadband in
Europe’s rural areas tells as much about the non-availability of broadband services as
it does about the demand for these services by rural businesses and households. We
need, in consequence, to look at a spectrum of ICTs, from mature to advanced, in
order to understand the territorial variations in usage and up-take. This is what we set
out to do in this chapter and in the following chapter. In order to do so, we summarize
the key points from our FIR and SIR as well as introducing new quantitative and
qualitative data gathered through our work under WP3.
The shape of supply and demand for telecommunications in Europe is complex and
different territorial patterns can be discerned for individual technologies. In general
terms, however, a number of dimensions of territorial disparity across the European
space can be identified in respect of ICTs:
• A ‘north-south divide’ across existing member states in relation to most
technologies. This can also be interpreted as a divide between cohesion
countries and non-cohesion countries (and the former east German Länder). It
is notable, however that this pattern does not hold for mobile telephony, the
adoption of which is much more evenly spread. Similarly, in the case of new
broadband services (ADSL and cable modem) a group of northern member
states lead the way, but the southern countries Spain and Portugal have higher
take up than the UK and France.
• A west-east divide, with the EU 15 average being far higher than the EUCC
average penetration rates for all technologies. Demand for several key
technologies is, however, growing more rapidly in the EUCCs s than in EU 15.
In the case of broadband technologies some EUCCs (Malta, Estonia and
7 See, for example, the emphasis on the Internet and broadband in eEurope Action Plan 2005

34
Slovenia) are in advance of Member States, notably the UK, France and Italy,
and Greece and Ireland lag several other EUCCs.
• There are also considerable differences between EUCCs. For example, in 2001
the number of Internet users in Estonia and Slovenia was only slightly below
the EU average whereas it was less than one-fifth of the EU average in
Romania. A similar pattern is emerging in respect of broadband.
• There are disparities within countries, with, generally speaking, metropolitan
areas (particularly the largest cities) being in advance of the rest of the country.
In respect of the new broadband technologies the evidence suggests that in
most countries initial roll-out plans are dominated by the largest urban areas.
• There is an urban–rural divide, with rural areas lagging in relation to most
technologies and particularly in relation to the latest technologies. There is
evidence that this lag is continuing, and in the case of certain key technologies,
such as the Internet, may be growing.
In the rest of this chapter we consider territorial patterns of several mature
technologies in Europe. The term ‘mature’ is, of course, relative. Here we use it to
refer to fixed telephony, including digitised networks, first and second generation
mobile telephony, and narrowband Internet.
3.3 Fixed Telephony
3.3.1 The continued importance of the basic network
Although the main focus of ICT policy relating to networks and services now tends to
be the Internet and broadband, terrestrial fixed line networks remain important. Not
only are they still crucial for most users of basic voice telephony, but the historical
investment patterns in fixed telephone networks also have an impact on patterns of
investment in newer technologies. For example, in countries where extensive
terrestrial networks have been rolled out over a number of decades and where
exchanges have been digitised, the opportunity exists to introduce broadband
technologies by upgrading these existing networks and their nodes (exchanges) in an

35
evolutionary way: for example, by introducing ADSL technologies into exchanges
and utilising existing wires. Thus historical investment can be capitalised upon, with
potential cost savings. On the other hand this historical investment can lead to a
degree of ‘path dependency’. These upgraded networks might not represent the
optimum way of delivering the latest services. Further, their presence may reduce the
return to be expected by investors in more advanced technologies capable of
delivering higher bandwidth. This is particularly the case where the incumbent
provider owns the basic network.
It should be borne in mind that for large numbers of European citizens it is only
relatively recently that they have been able to take the existence of good fixed
telephony systems for granted. In the 1980s, there were very marked supply side
constraints in Europe even in the provision of basic telephony, with Greece, Spain and
Portugal having long waiting lists for the installation of a telephone line.8 Substantial
investment in telecommunications networks – much of it supported by the Structural
Funds – has largely removed these supply-side bottlenecks, at least in EU15. As
Figure 3.1 suggests, however, some of the candidate countries do have relatively few
installed telephone lines, with Poland, Slovakia and Romania having fewer than 30
main telephone lines per 100 inhabitants. The figure for Romania is as low as 19
per100 inhabitants. They do tend to have higher growth rates in the number of lines,
however, suggesting some ‘closing of the gap’. This is not surprising as fixed
telephony may have reached saturation point in Member States, particularly in the
light of the growth of mobile telephony. The ‘gap’ in fixed telephony may not close
completely, however, as EUCCs may substitute investment in mobile telephony for
investment in fixed telephony. Table 3.1 shows that a number of countries in both
EU15 and in EUCC are beginning to experience a decline in fixed telephony, as
measured by main telephone lines per 100 inhabitants. It is, thus, likely that some
EUCCs will not reach the level of fixed telephony experienced by EU15 countries as
alternative technologies will be used. A recent report on ICTs in Slovakia, for
example, showed that the number of mobile subscribers passed the number of fixed
8 For the earliest analysis of regional disparities in telecommunications supply and demand in Europe, see Gillespie, A., Goddard, J., Robinson, J.F., Smith, I., and Thwaites, A. (1984) The effects of new information technology on the less-favoured regions of the Community, Regional Policy Series 23, Commission of the European Communities, Brussels, (pp.192)

36
line subscribers in that country in mid-2000 (UN Economic Commission for Europe,
2002b). There is reason to suppose, therefore, that fixed voice telephony will become
relatively less important as time passes. As a result the nature of network investment
(and perhaps the focus of public support for investment) will differ from that of the
recent past.

37
Figure 3.1: main telephone lines per 100 inhabitants
Source: ITU 2001: Figures abstracted from World Telecommunications Indicators
(2001) mapped by CURDS

38
Table 3.1: Countries experiencing an increase or decrease in fixed telephony penetration
(lines per 100 inhabitants) between 2000 and 2001
EU 15 countries experiencing increase EU 15 countries experiencing decrease
Denmark, Germany, Ireland,
Luxembourg, Netherlands, Spain,
Switzerland
Austria, Belgium, Finland, France,
Greece, Italy, Norway, Portugal, Sweden,
UK
EUCC countries experiencing increase EUCC countries experiencing decrease
Bulgaria, Czech Republic, Latvia, Malta,
Poland, Romania, Slovenia
Cyprus, Estonia, Hungary, Lithuania,
Slovakia
Source: Based on data from ITU, Yearbook of Statistics (2002)
As was pointed out in our SIR there are differences within countries in respect of
uptake of fixed telephony. To a large extent these differences map on to GDP/ph, but
this does not explain all differences and the situation is complex. One clear pattern
described in our SIR, however, is the difference between the largest cities and rest of
country in the case of fixed lines. Figure 3.2 shows levels of ‘teledensity’ of the
largest cities in a number of European countries compared with the rest of the country.
In each of the countries shown, with the exception of Poland, the largest city has a
higher teledensity than the rest of the country. In some countries – notably Slovakia,
Romania, Portugal, Malta and Latvia – the differential is substantial, with the largest
city having a teledensity more than twice that of the rest of the country.

Figure 3.2: Comparison of ‘Teledensity’ between largest cities and rest of country in
European countries (Euro 27 plus 2)
Sourc
3.4
The m
past 2
provid
now f
been c
Greec
substa
basic
of thei
digitis
case o
Nation
39
e: ITU World Telecommunication Indicators 2001, mapped by CURDS
The Digitisation of the Basic Network
ost important technological advance in telecommunications networks over the
0 years has been the digitalisation of switching and transmission, which has
ed the basis for the wide range of advanced digital services with which we are
amiliar. As Figure 3.3 demonstrates, this first stage digitalisation process has
ompleted in most, but not all, of the EU 15, remaining to be completed in
e, the Netherlands and Spain. A number of the candidate countries still have
ntial efforts to be made to complete the digitisation of the exchanges in their
networks, with Romania, Bulgaria, Latvia and Lithuania having less than 50%
r main telephone lines connected to digital exchanges. Strategies are in place to
e the networks in these countries, but the process may take some time. In the
f Bulgaria the incumbent has a target of 60% digitalisation by 2005 (United
s, 2002a).

40
Figure 3.3: Proportion of main lines connected to digital exchanges
Source: ITU 2001. Figures abstracted from World Telecommunication Indicators
(2001)
We have only limited information on the territorial spread of digital exchanges within
those countries where not all exchanges are digitised. We do know from experience in
EU 15 that exchanges tended to be digitised first in urban areas and that exchanges in
many rural areas were only digitised several years later. Research in the UK in the
mid-1990s, for example, showed that digitisation of exchanges in rural areas was not
a priority for the incumbent telecommunications companies in rural areas where there
tended to be no alternative suppliers (Richardson and Gillespie, 1996). Evidence
gathered during the present study suggests that a similar pattern is apparent in EUCCs.
In Hungary, for example, the proportion of ISDN lines to the total number of main
lines shows considerable regional unevenness, with the capital city having the highest
proportionate share of ISDN lines and with the West of the country having higher
penetration rates than the East (see figure 3.4).
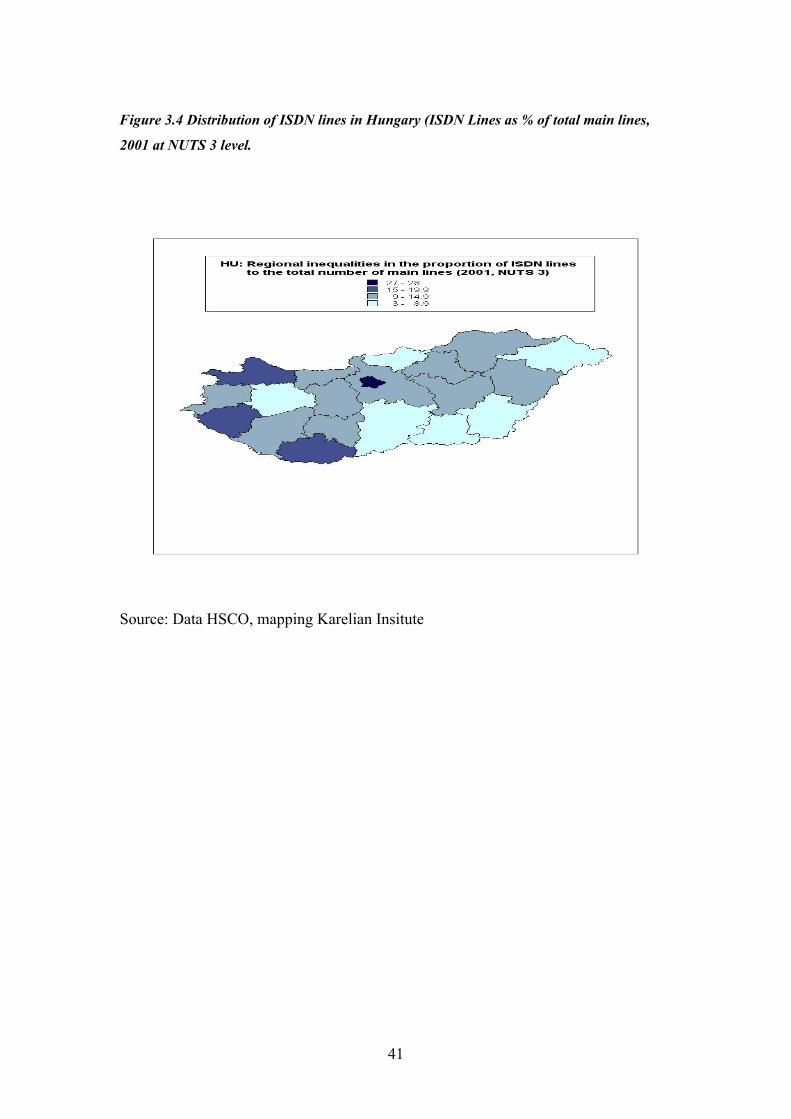
41
Figure 3.4 Distribution of ISDN lines in Hungary (ISDN Lines as % of total main lines,
2001 at NUTS 3 level.
Source: Data HSCO, mapping Karelian Insitute
42
3.5 Mobile Telephony
One very significant technology which has become rapidly diffused through both
domestic and business markets is mobile telephony; not only is mobile significant in
terms of its integration into ways of life and doing business, it also provides a user
platform for more advanced 3rd generation services. In 1999, the penetration of mobile
telephony across the regions of EU 15 displayed very wide disparities (Figure 3.5),
with very high levels of penetration in the Nordic countries, in Italy and in Portugal,
and very low levels of penetration in France and Germany. Mobile penetration in
France, which still stood at only 62.6% in September 2002, is the lowest level of all
EU15 countries (ART, 2003), although take-up is growing faster than in many other
countries. Interestingly then, mobile telephony appears to break with the conventional
pattern of a rich-poor disparity.

43
Figure 3.5: Mobile telephone penetration at regional level (% of households – EU 15) in
1999
Source: EOS Gallup (DG Infso, 2000)
Further evidence for the ‘mould-breaking’ effect of mobile telephony is provided by
Figure 3.6, which shows the situation in 2001, for EU27+2, but only at the national
level. Italy remains in the highest penetration category, and countries such as Greece,
Slovenia and the Czech republic are in the same category as Sweden, Finland and the
rest of Western Europe (notice too that France and Germany have ‘caught up’).
Although most of the EUCCs are at the low end of the adoption spectrum, they are
displaying the highest rates of growth in their subscription base.

44
Figure 3.6: Cellular subscribers per 100 inhabitants 2001(and compound annual growth
rate (CAGR) 1995-2001)
Source: ESPON 1.2.2. FIR. Data abstracted from ITU World Telecommunications
Indicators 2001, Mapping by CURDS, Copyright, CURDS
Turning to the situation within countries the position also seems to be quite positive in
terms of territorial coverage. In all countries which we are considering in this report
most of the territory is covered, the exceptions being very remote and mountainous
areas and some border areas. Maps for individual countries and operators can be
found at http://www.cellular-news.com/coverage/.
This does not mean that there was no lag in rollout or uptake in mobile, but it does
suggest that the lag was of relatively short duration. It should be added that not all
areas are covered by all operators as licenses granted to operators have different
requirements in terms of population coverage. Those operators with more limited
coverage will tend to concentrate on urban areas and business users, thereby leaving
differences in levels of choice in different regions.

45
We have only limited data for penetration (i.e., use as opposed to coverage) of mobile
telephony. Evidence from our interview with the French regulator suggests that
regional patterns within countries are complex. It is interesting to note, for example,
that penetration is slightly higher in the French overseas territories than it is for the
main French territory. Within metropolitan France Ile-de-France leads (with a
penetration of 91%), but there is no clear urban-rural or core-periphery divide in
mobile penetration as Corse ranks second (87.2%) and other relatively urban and / or
core regions (eg Nord-Pas de Calais, Centre, Basse-Normandie) do not rank very
highly.
We can conclude that mobile is then a technology which is (a) widely diffused, in a
very short space of time; (b) is not confined to the more prosperous regions; and (c) is
facilitating a ‘catch up’ process in those countries and regions which have lagged in
the provision and adoption of previous telecommunications services.
To date mobile has mainly been used for voice and, increasingly, text messaging.
With the advent of third generation (3G) UMTS mobile technologies, the use of
mobile for data transfer and for multimedia applications, including higher-speed
access to the Internet, will increase 9 . The speed of rollout of first and second
generation mobile, its widespread territorial coverage and its rapid uptake suggests
that future mobile technology will provide opportunities for citizens and businesses in
more sparsely populated areas to gain access to the Internet. The situation regarding
3G investment, however, remains uncertain. Licenses have been issued across most
member states, but the current state of the telecommunications market has delayed
roll-out. 3G licensing in EUCCs has been slower and by June 2002 only the Czech
Republic, Poland and Slovenia had granted licenses (CEC 2002b) and thus there may
be disparities between countries in terms of the pace of 3G roll-out. Within countries
it is also likely that there will be a territorial lag. In most cases licenses require that a
certain proportion of population will be served within a given time and urban
population coverage will represent an ‘easy win’ in most countries. Whether the lag is
short, as was the case with first and second generation mobile, or long will depend on
the general health of the sector and the identification of demand in rural areas.
9 Transmission speeds are expected to range from 384 kbit/s to 2 mbit/s.
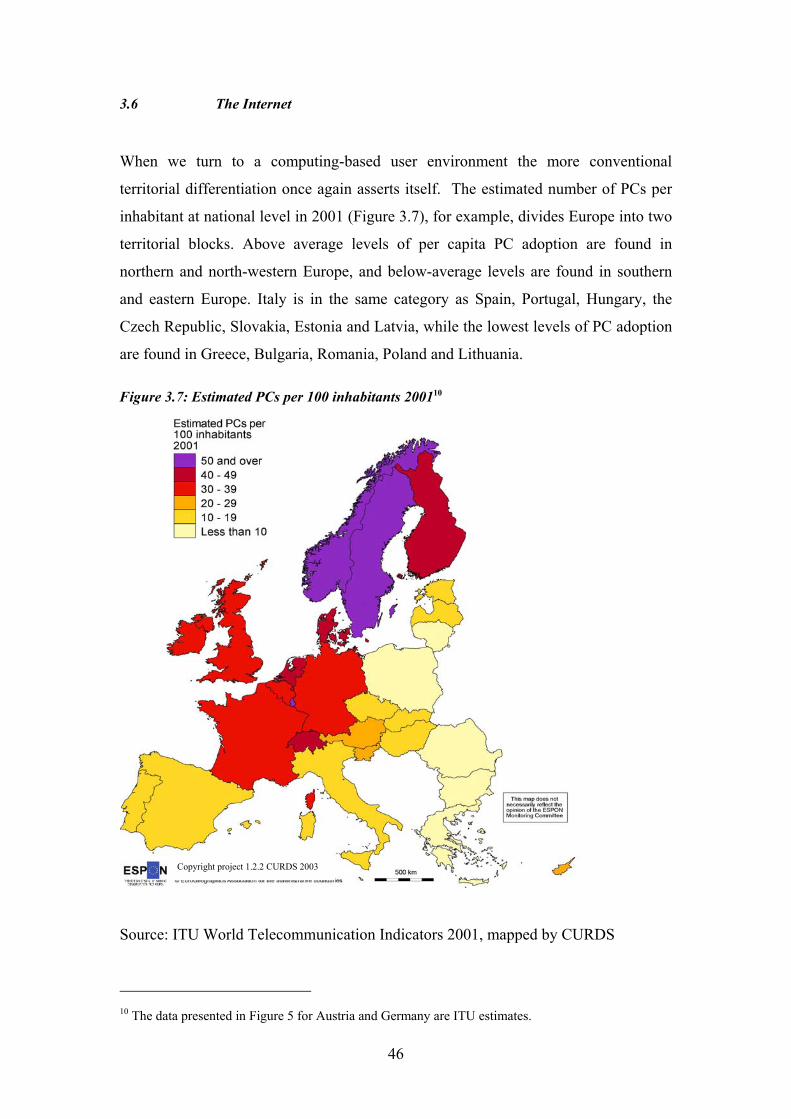
3.6 The Internet
When we turn to a computing-based user environment the more conventional
territorial differentiation once again asserts itself. The estimated number of PCs per
inhabitant at national level in 2001 (Figure 3.7), for example, divides Europe into two
territorial blocks. Above average levels of per capita PC adoption are found in
northern and north-western Europe, and below-average levels are found in southern
and eastern Europe. Italy is in the same category as Spain, Portugal, Hungary, the
Czech Republic, Slovakia, Estonia and Latvia, while the lowest levels of PC adoption
are found in Greece, Bulgaria, Romania, Poland and Lithuania.
Figure 3.7: Estimated PCs per 100 inhabitants 200110
Source:
10 The dat
Copyright project 1.2.2 CURDS 200346
ITU World Telecommunication Indicators 2001, mapped by CURDS
a presented in Figure 5 for Austria and Germany are ITU estimates.

47
Perhaps the most important current differentiator of IS participation is usage of the
Internet. Figure 3.8 shows the number of Internet users per 10,000 inhabitants in 2001,
at the national level for EU27+2. When compared with their PC adoption starting
point, Ireland, Belgium, Luxembourg and France have lower levels of Internet up-take
than might have been anticipated, while Portugal, Austria, Slovenia and Estonia have
above anticipated levels.
Figure 3.8: Internet users per 10,000 inhabitants 2001
Source: ESPON 1.2.2 FIR: Data drawn from ITU World Telecommunication
Indicators 2001, mapped by CURDS
Copyright project 1.2.2 CURDS 2003

Figure 3.9 The limited availability of sub-national data: Internet users per 100 inhabitants
Sour
Figu
usag
4.8 i
The
3
Copyright project 1.2.2 CURDS 20048
ce: Data collected by 1.2.2 partners, mapped by CURDS
re 3.9 illustrates clearly the paucity of European-wide regional data on Internet
e levels (beyond the 1999 analysis for EU15 presented in our SIR – see Figure
n that report), and the paucity of regional data on telecommunications in general.
map is based on the best indicator we were able to collect sub-national data for

49
under WP3, and covers less than half the total number of NUTS 2 regions in the
ESPON space. As a result of these limitations, we have used regression analysis to
provide estimates of missing data, at the NUTS 2 level, of two key Internet usage
indicators: the number of Internet users per 100 inhabitants, and the proportion of
firms with their own website (the second of these indicators is considered in Section
3.7 below). The method used (described in more detail in the Annex volume) is to
calibrate a regression model, relating the Internet usage for regions which we do have
data for (the dependent variable), to a set of ‘explanatory’ independent socio-
economic variables. The calibrated regression coefficients are then used to ‘predict’
the missing Internet usage data, based on the independent socio-economic data for
each region.
For the number of Internet users per 100 inhabitants, the regression model explains
68.9% of the variance in the dependent variable, meaning that the model is likely to
provide reasonable estimates of the missing data. The results of the model – ie the
predicted levels of Internet users per 100 inhabitants for EU27+2 at NUTS 2 - are
shown in Figure 3.10.

Figure 3.10: Estimated number of Internet users per 100 inhabitants
S
T
c
m
F
p
H
50
ource: Regression Analysis undertaken by CEIDET; mapping by CURDS
he highest levels, with in excess of 50 Internet users per 100 inhabitants (the top two
ategories in Fig. 3.10), are estimated as occurring in the capital city regions of the
ost Internet-adoptive countries - Vienna, Brussels, Uusimaa (Helsinki), Ile de
rance, London, Stockholm and Luxembourg; and in a few other particularly
rosperous and economically dynamic regions in Germany (Oberbayern; Bremen;
amburg), the UK (Berkshire, Bucks and Oxfordshire) and in Switzerland.

51
The next highest levels, with between 35 and 49 Internet users per 100 inhabitants, are
estimated as occurring in all of the rest of Sweden; Denmark; a number of Dutch
regions, including Utrecht, Noord-Holland and Suid-Holland; a number of Belgium
regions, including Antwerp; in a number of regions in the north-west and south-west
of Germany, including Stuttgart, Karlsruhe, Darmstadt, Hannover, Dusseldorf,
Detmold and Rheinhessen-Pfalz; the Alsace region of France; the region of Southern
and Eastern Ireland; most of the regions in southern and eastern England and the
English midlands, along with Cheshire, Manchester, West Yorkshire, East Wales and
Eastern and North Eastern Scotland; Salzburg and Vorarlberg in Austria; and
Lombardia in Italy. In summary then, the highest levels of predicted Internet
penetration are dominated by regions in Sweden, Denmark, the Netherlands, Belgium,
the UK, Germany, Austria and Switzerland. There is, therefore, a strong association
(also demonstrated in the regression analysis) between the prosperous metropolitan
regions of the ‘Blue Banana’ and the regions of the Nordic countries, and high levels
of Internet penetration.
At the opposite end of the spectrum, the lowest levels of predicted Internet penetration
(less than 15 Internet users per 100 inhabitants) are found in the two poorest regions
of Spain (Galicia and Extramadura); in the regions of Portugal, excepting Lisboa and
the Algarve; in all of the regions of Greece, excepting Attiki [Athens] and Notio
Aigaio [North Aegean]); in Slovenia; in all of the regions of the Czech Republic
except for Praha [Prague]; in all of the regions of Slovakia except for Bratislavsky
[Bratislava]; in all of the regions of Hungary except for Kozep-Magyarorszag
[Budapest]; in all of the regions of Romania and Poland; and in Estonia, Latvia and
Lithuania. The estimated pattern of low Internet usage is, therefore, starkly defined in
geographical terms; it encompasses the poorer parts of the Iberian peninsular, most of
Greece, and most of the regions of the candidate countries, with the exception of some
capital cities.
The distinction which emerges from this analysis at NUTS 2 between the regions with
major cities and other regions can also be explored by data sets which distinguish
between the Internet adoption rates of urban and rural areas. As figure 3.11 shows
rural areas lag behind metropolitan and urban areas in the current Member States.

52
This gap is not new. A lag in take up of the Internet between urban and rural areas of
about 1 year persisted through the second half of the 1990s11. The results of a recent
Euroflash Barometer survey on the Internet point to the more limited competition in
the provision of Internet services in rural areas and this may also be a factor. This
urban-rural gap may be exacerbated by differential roll-out of broadband which
national studies suggest are currently favouring, and are likely to continue to favour in
the absence of suitable public policies, urban areas (see Chapter 4).
Figure 3.11: Level of household access to Internet by degree of urbanisation
Level of access to Internet (%) by degree of urbanisation
38.143.4 46.0
05
10152025
303540
4550
Rural Urban Metropolitan
Source: Based on Eurobarometer Flash 135, November 2002 (Volume B/1)12
Figure 3.12 is derived from the answers to a question in the same survey which asked
how often the Internet was used by individuals. It shows that users in urban areas
were more likely to use the Internet on a daily basis. Further it suggests that the gap is
widening over time rather than narrowing.
11 CEC (2000) “The situation of telecommunications services in the regions of the European Union: Residential Survey”. Report prepared for DG Information Society by EOS Gallup. This is discussed in more detail in our SIR. 12 CEC (2002c) “Eurobarometer Flash 135: Internet and the Public at Large”. Figure based on data in Technical Annexes Parts A/B.

53
Figure 3.12: Intensity of use of Internet: Growth in daily use by degree of urbanisation
Growth in % using the Internet on a daily basis, by degree of urbanisation:
Feb 2001 - Nov 2002
30
35
40
45
50
55
MetropolitanUrbanRural
We are not aware of any study on aggregate analysis
undertaken for the EUCCs. Where we were able to f
national studies, however, it did tend to show territo
with rural areas following behind urban.
A recent report by the United Nations on Bulgaria
Commission for Europe, 2002a) suggests there is une
use according to location (as well as income levels and
There are substantial regional disparities and a growin
of access to ICT infrastructure and provision of
overwhelming majority of Internet users are young, w
cities….Internet use is highest is highest among resid
limited in rural areas and small towns….and [accordin
fewer than 3 pc of internet users were residents of smal
13 The report cited is “Conditions, Trends and Problems for the Technology and Services in Bulgaria” by Vitosha Research, 200trying to obtain this report.
Nov
Feb 2001of Internet
ind eviden
rial dispari
, for exam
ven penetra
age). The r
g “digital d
Internet-re
ell educat
ents of lar
g to a surve
l towns (p1
Development0. At the tim
55
50
45
40
uptake having been
ce in our individual
ties in Internet use,
ple, (UN Economic
tion rate of Internet
eport states that:
ivide” both in terms
lated services. The
ed and live in large
ger cities. Access is
y in the year 200013]
5).
of Information Society e of writing we are still

54
In Slovakia there is also evidence of territorial disparities in relation to the Internet
(Plintovicova, 2003). Three divides are identified:
• a capital city region/rest of country divide;
• a major-city/other city divide; and,
• an urban-rural divide.
Figure 3.13 shows that households in the Bratislava region – the capital – are far more
likely to have Internet access than those in other parts of the country. Bratislava is
followed by the growth pole Banska Bystrica and by the second largest city Kosice.
Interestingly, those three cities have been selected for the initial roll-out of ADSL (see
Chapter 4) suggesting that regions leading in the use of one set of technologies will be
the first to gain subsequent technologies, thus reinforcing existing advantages. It is
noticeable that even households in Bratislava’s ‘rural hinterland’ are more likely to
have Internet access than those in all but one of the rest of Slovakia’s cities. There is
also an urban/rural divide with households in regional capitals being more likely to
have Internet access than their rural hinterlands.

55
Figure 3.13: Proportion of households with Internet access in the Slovak Regions (by
region and by degree of urbaness1
Source: Plintovicova, 2003, p105
1(kraj = region; krajske mesto = regional capital; vidiek = rural hinterland)
3.7 Territorial variations in the business use of ICT
Although the household and population up-take of technologies such as the Internet
are very significant in terms of participation in the Information Society, it can be
argued that from an economic development perspective it is the up-take and usage of
ICTs by enterprises, including SMEs, that is of prime importance in contributing to
competitiveness. Although there is a distinct lack of regional level data, Eurostat have
undertaken (in 2000/01) comparable pilot surveys of e-commerce at the member state
level for EU15.14 Table 2 in the Annex presents a summary of the results obtained.
14 See Eurostat’s Statistics in Focus, Industry, Trade and Services, Theme 4 -12/2002 for a discussion of these surveys , in which 13 Member States participated, and for preliminary results. It should be noted that the survey is of enterprises with 10 employed persons or more, and thus misses out the very smallest enterprises.
0
1
2
3
4
5
6
7
8
Bratislavský
Trnavský
Trenčiansky
Nitriansky
Žilinský
B.Bystrický
Prešovský
Košický
Podiel domácností vybavených internetom v krajoch, krajských mestách a na vidieku v %
kraj krajské mesto vidiek

56
E-commerce can be defined as the trading of goods and services over computer-
mediated networks, such as the Internet. Because e-commerce uses an electronic
interface for exchanging and processing information, it offers the possibility at least
of overcoming some of the geographically-defined obstacles to commerce in
peripheral or low density regions. Although much of the focus of media interest in e-
commerce has been on so-called ‘business-to-consumer’ (B2C) applications, with the
on-line bookseller Amazon.com being one of the exemplars and indeed survivors
from the dot.com crash of the late 1990s, it is actually in the field of ‘business-to-
business’ (B2B) e-commerce that the most significant growth in markets has been
demonstrated.
At the time of the pilot surveys (end of 2000), 75% of Europe’s enterprises had web
access; 38% had their own web site; 26% of enterprises had implemented e-
purchasing, and 19% used e-commerce to make sales. These European averages
disguise considerable variation between member states (Table 2, Annex). In summary,
the following patterns can be discerned:
• The highest level of enterprises with access to the internet were found in
Finland, Denmark and Sweden, the lowest levels are in Greece and
Luxembourg. Portugal had a higher proportion of firms with Internet access
than either the UK, the Netherlands or Germany;
• The highest level of enterprises with their own websites were found in
Sweden, Germany, Denmark and Finland, while very low levels were
recorded in Spain and Italy;
• The highest level of firms with DSL or other broadband connections to the
Internet were found in Finland, Germany, Austria and Portugal; the lowest
levels were found in Greece, Spain and the UK;
• The highest incidence of e-purchasing was found in Denmark, Germany,
Finland, Sweden and the UK, the lowest levels were in Greece and Spain;
• The highest incidence of e-sales was found in Germany, Denmark and the
Netherlands, the lowest in Italy, Greece, Spain and Portugal;

57
• The highest use of specialised B2B marketplaces was found in Sweden,
Finland, Germany, Denmark and the UK, the lowest in Spain, Italy and
Portugal;
• The highest levels of perceived benefits from e-purchasing were found in
Germany and the UK, the lowest in Italy and Greece;
• The highest levels of perceived benefits from e-sales were found in Germany,
the UK and Finland, the lowest in Spain and Italy.
The pattern that emerges is remarkably consistent across the different categories and
usages of e-commerce; the Nordic countries and Germany are making the fullest use
of e-commerce as a tool of business competitiveness, while firms in Greece, Italy and
Spain are making very limited use of the new opportunities. Portugal is an unusual
case in that although many of its firms are connected to the Internet, often by DSL or
broadband connection, they appear to making little commercial use of these
connections. There is then evidence of a pronounced ‘digital divide’ between
territories in Europe in terms of their business usage of the Internet, which is likely to
have significant implications for regional development disparities.
Unfortunately, below the national level reported above, there is a dearth of
information available concerning regional variations in business usage of the Internet.
In order to provide at least an indication of the regional pattern, we have applied the
same type of regression modelling as discussed earlier to provide estimates of missing
regional data, using what data we have been able to collect, mainly at national levels,
to calibrate the model. Using the proportion of firms with their own website as the
dependent variable, 63.7% of the variance is explained by the independent variables,
suggesting a reasonable basis for estimating the missing regional data. Figure 3.14
maps the estimated proportion of firms with their own website for all of EU27+2 at
NUTS 2 level.

Figure 3.14: Estimated proportion of firms with their own web site
Sour
The
total
[Hel
Lux
3
Copyright project 1.2.2 CURDS 20058
ce: Regression analysis undertaken by CEIDET; mapping by CURDS
highest estimated incidence of firms with their own websites (in excess of 60% of
firms) are to be found in the following regions: Stockholm; Denmark; Ussimaa
sinki]; Brussels and Antwerp; Utrecht, Nord-Holland and Groningen;
embourg; Ile de France; 9 regions of Germany, led by Hamburg, Bremen and

59
Oberbayern; Vienna; Switzerland; and 10 regions in the UK, including London and
most of the regions adjacent to it, Cheshire, and North East Scotland.
In the next category, with between 50% and 59% of firms estimated as having their
own website, are found the remaining Swedish regions; one other Finnish region; a
number of regions in north-east and south-east France; all but two of the other UK
regions; the region of Southern and Eastern Ireland; all other German regions, except
for those in the former East Germany; most of the remaining regions in Austria; all
but three of the remaining regions of Belgium; all but one of the remaining regions of
the Netherlands; the regions of northern and central Italy; four Spanish regions
(Madrid, Catalunia, Pais Vasco and Illes Balears). Although there are then a wide
range of regions represented in the ‘top half’ of Figure 3.14, there are no regions
represented from Portugal, Greece or any of the candidate countries.
The lowest estimated incidence of firms with their own websites (less than 25%) are
found in a number of Greek regions; in many of the regions of Poland; and in all of
Romania with the exception of Bucuresti. Of the candidate countries, Bulgaria, the
Czech Republic, Slovenia, Slovakia, Hungary, Cyprus, Malta, Latvia and Estonia tend
to display a higher estimated incidence of firms with their own websites than do
Lithuania, Poland and Romania.
3.8 Summary
In this section we have considered the territoriality of a number of ‘mature’
telecommunications networks and services. As we described in detail in our SIR there
is a limited amount of data relating to the territoriality of TN&S, particularly at the
sub-national level. The available data suggests a complex and evolving picture. A
number of clear patterns do, however, emerge in respect of the technologies
considered in this chapter.
At the European level there remains a north-south divide and an east-west divide. The
Nordic countries plus the ‘blue banana’ show the highest penetration rates,
particularly in relation to the Internet. These gaps are not only clear in relation to

60
users in general, but also in relation to business use of technology. If this continues to
be the case the existing relative competitive position of nations and regions is likely to
be reinforced.
The situation is evolving, however, and there is some evidence of a general catch up
process. This is illustrated clearly in respect of the East-West divide in table 3.2 below
which shows (albeit for one year only) a more rapid average growth rate of ‘mature’
technologies in EUCC than in EU1515.
Table 3.2: Comparison of penetration and growth rates of key IS technologies in EU15 and
CC
% Growth 2000/2001
CC EU-15 CC EU-15
Number of PCs
- per 100
inhabitants
Dec
2001
7 31 13.1 8.5
Internet hosts–
per 100
inhabitants
Jan
2002
1 4 38.2 19.5
Internet users –
per 100
inhabitants
Dec
2001
8 32 38.9 32.7
Mobile phones
– per 100
inhabitants
Dec
2001
31 72 42.1 14.9
Source: Eurostat (2002)16
Our evidence for differences between regions within countries is more fragmentary.
Nevertheless, a clear message emerges namely that, with the partial exception of
mobile telephony, there is a clear metropolitan bias in the adoption of the ‘mature’
technologies considered in this chapter. This is particularly clear in relation to the
15 Note: these figures include Turkey. 16 Eurostat (2002) “Information Society Statistics: Data for Candidate Countries: Statistics in Focus, Theme 4 – 17/2002, author Richard Deiss.

61
Internet. The most stark contrast uncovered is the urban-rural one, and particularly the
metropolitan-rural one, with the poorer rural areas apparently slowest to adopt the
Internet. This again has implications for the competitiveness of rural and remote
regions.
Nevertheless, the growth of Internet and mobile is particularly encouraging. These
developments are, of course, partly related to the earlier plateauing of demand in
EU15 and, in the case of mobile, the ‘substitution’ of mobile for fixed telephony. As
is noted in section 3.5 (above) mobile seems to have different (or at least accelerated)
rollout patterns to fixed telephony. If this pattern of rollout is replicated for UMTS
then the spread of broadband access should accelerate. This is discussed in chapter 4.
62
Chapter 4: Regional variations in ICT availability and use: the case
of new ‘broadband’ technologies
4.1 The growing importance of broadband
In the previous chapter, we focused on a range of relatively mature technologies;
mature, that is to say, in the context of a rapidly evolving technological environment.
We now turn to a newer set of technologies which are increasingly seen by
policymakers as a key in unlocking the potential of the information society. These
technologies are collectively referred to as ‘broadband’ technologies.
The importance of broadband to economic development is being stressed by
policymakers across the world’s advanced economies.17 Particular attention is paid to
their role in improving competitiveness. Europe, as a whole, lags behind some other
advanced economies, including South Korea, Canada, Hong Kong and Taiwan,
though Europe’s leading countries in terms of broadband take up (Denmark, Sweden,
Belgium, Austria and the Netherlands) are ahead of the United States and Japan.18
In Europe the importance of broadband has been recognised by the Commission as
well as by several Member State governments. The Barcelona European Council
called upon the Commission to draw up an eEurope action plan focusing on “the
widespread availability and use of broadband networks throughout the Union by 2005
(italics added)”. Subsequently, the eEurope Action Plan 2005 suggested that “the
widespread availability of broadband access at competitive prices” is an essential
enabler in meeting the Plan’s main objectives which are: to provide a favourable
environment for private sector investment and for the creation of new jobs, to boost
productivity, to modernise public services, and to give everyone the opportunity to
participate in the global information society. The expectations of broadband are that it
will support (and stimulate) a range of services including videoconferencing, high
17 see OECD (2001) ‘The Development of Broadband Access in OECD Countries’, for a review of developments and the position of European countries in a global context. 18 See ITU (2003) Top economies by broadband penetration, 2002. http://www.itu.int/home/

63
speed data transfer and instant and cheap access to pictures, music and text
(multimedia) over the Internet. Stimulating these services, however, is not straight
forward, as is recognised in the eAction Plan:
Developing new services needs significant investment, most of it from the
private sector. But there is a problem: funding more advanced multimedia
services depends on the availability of broadband for these service to run on,
while funding broadband infrastructure depends on the availability of new
services to use it (eEurope Action Plan, 2005, p2).
In addition to the stimulation of content, competition is seen as a key factor in
creating markets for broadband. There is also recognition, however, that there are
likely to be territorial disparities in access to broadband if left solely to the market.
The eAction Plan specifically addresses the question of broadband access in less
favoured regions stating that:
Member states in co-operation with the Commission should support, where
necessary, deployment in less favoured areas, and where possible may use
structural funds and/or financial incentives (without prejudice to competition
rules) (eEurope 2005, p17).
Recent guidelines from the Commission have stressed the importance of geographical
targeting and suggest that the main focus of intervention should be rural and remote
areas19.
In the next section we seek to define broadband, before turning, in the subsequent
section, to describe patterns of broadband deployment and uptake to date.
19 Guidelines for discussion were recently put forward by the Commission: CEC (2003a) Guidelines on Criteria and Modalities of Implementation of Structural Funds in Support of Electronic Communications: Commission Staff Working Paper (SEC (2003) 895), Brussels 28.7.2003.
64
4.2 Defining broadband
The current focus of governments in respect of ICT infrastructure, then, is broadband.
There is, however, no single definition of broadband. The term broadband is generally
used to refer to the ability of certain technologies to transmit data and pictures, which
are ‘bandwidth hungry’, at high speed. Increasingly the term is used as a shorthand for
high-speed ‘always on’ Internet access (OECD, 2002).
Broadband, or very high bandwidth networks, have been available to large companies
and to large public sector organisations for a number of years. Such organisations
have been able to lease lines from telecommunications providers to create their own
‘private networks’, for example, to link together multiple sites nationally or
internationally. Latterly, large firms have leased capacity within the network of
telecoms providers, rather than leasing dedicated lines, to create what are known as
‘virtual private networks’. These types of products allow data transmission at speeds
of between 2mbt/s and 155mbt/s and have generally been designed (and priced) with
large organisations, with significant data transmission demands, in mind. Leased lines
are also used by value added service providers such as Internet Service Providers
(ISPs). Large firms are likely to continue to use leased lines for some time to come, as
the newer technologies described below do not meet their capacity requirements or
their security concerns (see OECD, 2002 – Broadband Access for SMEs). Leased
lines are covered by the Universal Service Directive (USD), but only for a minimum
set of services. National regulatory authorities are required to make separate
assessments for each market of leased lines in the minimum set (established by
Commission Directive), taking into account their geographic dimension (OJC, 2002;
108/51).
Leased lines are likely to remain beyond the financial reach of most small firms and
domestic consumers, and they do not anyway satisfy their communications
requirements which are for switched services. Recently, however, a number of
‘broadband’ products – notably ADSL and Cable Modem (see below) – have been
designed with the aim of providing access to multi-media services and, in particular,
improved access to the Internet for SMEs and consumers.

65
Amongst the technical community there is a debate about what the minimum speed
requirements are above which a technology can be described as broadband. A
distinction is made between higher bandwidth, current generation broadband and next
generation broadband. Some of the technologies discussed in this section, for example
ADSL, would be regarded by some as being ‘higher bandwidth’ (than traditional
transmission technologies) rather than true broadband. Figure 4.1 illustrates the
capability of existing technologies and the expectations for future technologies.20
Several European governments have set targets for broadband coverage, but, in the
main, it is the lower rate technologies which they seek to push. The
telecommunications providers also tend to use the term to encompass relatively low
bandwidth technologies and it is these technologies which they are marketing. Indeed,
there is an argument that telecommunications companies and governments, by not
developing or supporting higher rate broadband, are going for ‘easy wins’.
20 For a fuller discussion of broadband see, for example, OECD (2001) ‘The development of broadband access in OECD countries”
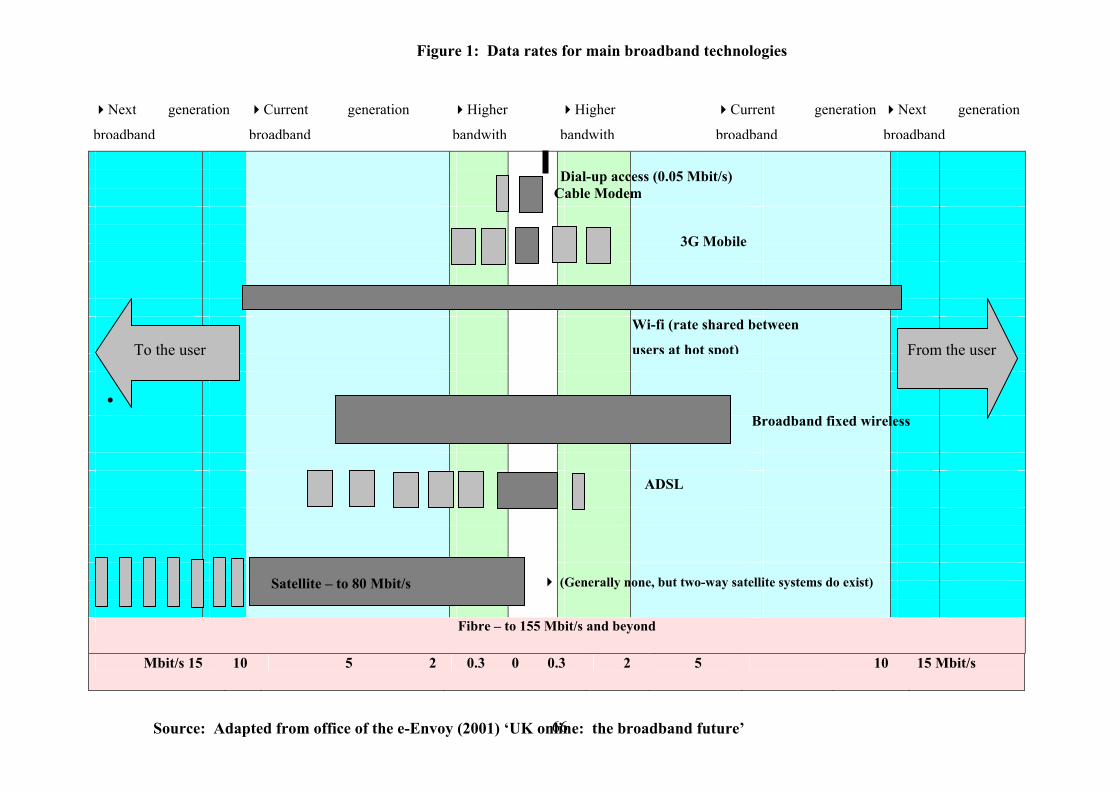
66
•
Fibre – to 155 Mbit/s and beyond
Mbit/s 15 10 5 2 0.3 0 0.3 2 5
Current generation
broadband
Higher
bandwith
Higher
bandwith
Dial-up access (0.05 MbCable Modem
3G
ADSL
(Generally none, but two-
Next generation
broadband
Satellite – to 80 Mbit/s
To the user
Figure 1: Data rates for main broadband
Wi-fi (rate s
users at hot
Source: Adapted from office of the e-Envoy (2001) ‘UK online: the broadband fu
10 15 Mbit/s
Current generation
broadband
Next generation
broadband
it/s)
Mobile
Broadband fixed wireless
way satellite systems do exist)
From the user
technologies
hared between
spot)
ture’

67
In this section we concentrate on the two forms of broadband technology which, to
date, are the most commercially developed – Digital Subscriber Lines (DSL) and
cable modem. The roll-out of these technologies is proceeding at a pace, though they
still represent a relatively small share of total telecommunications infrastructure and
services.
Digital Subscriber Lines (DSL) technology represents a way of delivering broadband
services down a single twisted-pair copper telephone line that has been split down
into two channels – one for voice use and one for data. The currently most popular
form of DSL, and the one being pushed by incumbent telecoms operators in most
European countries, is Asynchronous DSL (ADSL). ADSL provides maximum data
transfer rates of approximately 250 kbt/s upstream (i.e., from the customers’ premises)
and approximately 500 kbt/s, 1 mbt/s or 2mbt/s downstream (the higher values
tending to be restricted to business customers). ADSL is a ‘contended’ system: that is
to say actual transmission rates are conditioned by the number of users at any one
time, meaning that capacity can be ‘overbooked’. This means that ADSL is not
suitable for businesses which need to be sure that they can use the service as and
when required or which need to transmit, as well as receive, significant amounts of
data. These technical limitations mean that only a limited number of operations can be
carried out by the consumer and ADSL should be seen as an entry level version of
broadband. Some new entrants and incumbents are now starting to introduce
Symmetrical DSL, which provides firms with the capacity to transmit data at high
speed.
ADSL makes use of existing copper telephone wires. The upgrading of these wires to
broadband capacity requires the installation of ADSL equipment in local telephone
exchanges. There are number of technical, economic, and competition issues which
constitute barriers to ADSL roll-out into certain territorial areas.
• One technical problem is that the system does not work over some non-copper
wires so places with such networks will not easily be upgraded;

68
• Another technical problem is that the farther from an ADSL enabled exchange
a consumer is the more degraded the service will be. In most countries an
ADSL-enabled exchange covers a radius of 6 km.
• ADSL availability depends on individual exchanges being upgraded. The costs
of upgrading are significant and telecoms companies have been unwilling to
do so unless they perceive there to be sufficient demand from customers in the
exchange area. This, in turn, will depend on the volume of potential domestic
and business consumers, as evidenced by population density and socio-
economic profiles: providers must decide whether there are enough
sufficiently prosperous customers to make it pay. Thus, on a simple cost
model, major cities are most likely to be upgraded first with rural areas
bringing up the rear. It is possible that it will never be commercially viable to
upgrade some exchanges. Work by the UK Broadband Stakeholder Group, for
example, suggests that there will be some places where it will never be
commercially viable for broadband investment, particularly for the
technologies considered here (see 4.12, later in this chapter). A similar point
has been made by the Swedish government. In this view it is not merely a
question of a time lag, but of broadband failing to penetrate these areas at all.
• These points are illustrated graphically in figure 4.2. The figure shows a map
of ADSL enabled exchanges in one European region – the north-east of
England. The nodes represent enabled exchanges. These exchanges are mainly
located in the urban cores of the region and in business development corridors
along the main road trunk route. The circle around the nodes represents the
area within which the ADSL service can be received. Beyond that distance the
service is likely to be either non-existent or degraded. Interviews with BT, the
incumbent fixed telecoms provider in the region reveal that it has no plans to
rollout beyond selected exchanges unless requisite levels of demand can be
shown to exist, at least without some form of subsidy.

69
Figure 4.2: ADSL roll-out in North East England
Source: One North East (2003)
• Another factor which might have an impact on the willingness of a telecoms
provider to upgrade a particular exchange is whether or not competition is
present in that exchange area. Where cable operators are present the
incumbent fixed telephony provider is likely to be concerned about losing both
existing voice customers and potential new Internet customers and might,
therefore, upgrade the exchange. Although the geography of cable varies
between countries, cable tends to be a technology used in urban areas (see
1.2.2 SIR figure 4.17). Therefore, competition is most likely to be present in

70
urban areas, stimulating incumbents to respond to the threat. Competition may
be enhanced by opening up the local loop through local loop unbundling and
through forcing incumbents to offer wholesale ADSL products to competitors
at affordable rates. Regulation is in place to support these moves, but many
incumbents have been criticised for dragging their feet. And, of course,
competitors are most likely to target the most profitable (i.e., urban) exchanges.
Cable modem. Cable technology is now a relatively mature way of delivering
television services, but there is huge variation in rates of penetration between
European countries (see figure 16 in ESPON 1.2.2 FIR). Modern cable technology
also offers the capacity to deliver telephone services and cable operators now tend to
offer a package of services which include both television services (an alternative to
satellite and traditional terrestrial delivery mechanisms) and telephone services. They
are increasingly offering broadband access to the Internet as part of that package.
Cable broadband services utilise the cable television co-axial cable to provide ‘always
on’ connection to the Internet. The customer’s computer is connected via a network
interface card or USB to a ‘cable modem’ which is connected to the co-axial cable
and thus to the nearest fibre optic network point.
Cable broadband internet services operate at maximum speeds of 512 kbt/s into the
subscribers premises and 128 kbt/s out of the subscribers premises. Thus, like ADSL
they are asymmetric. Also like ADSL, services are contended and actual speeds of
service depend on numbers of local subscribers using the service at any one time.
Thus, cable modem broadband suffers from similar bandwidth limitations to ADSL.
The experience in several countries suggests that cable providers tend to target urban
areas in order to reach a large number of customers in a short time and at minimum
cost.
A key policy issue which emerges from the above description is that the key
broadband technologies which are currently being rolled-out by the most powerful
commercial providers are most likely to be available in high density areas and
potentially ignore rural and remote areas. In the next section, after considering
differences between take up between European countries, we explore whether the
empirical evidence supports this hypothesis.
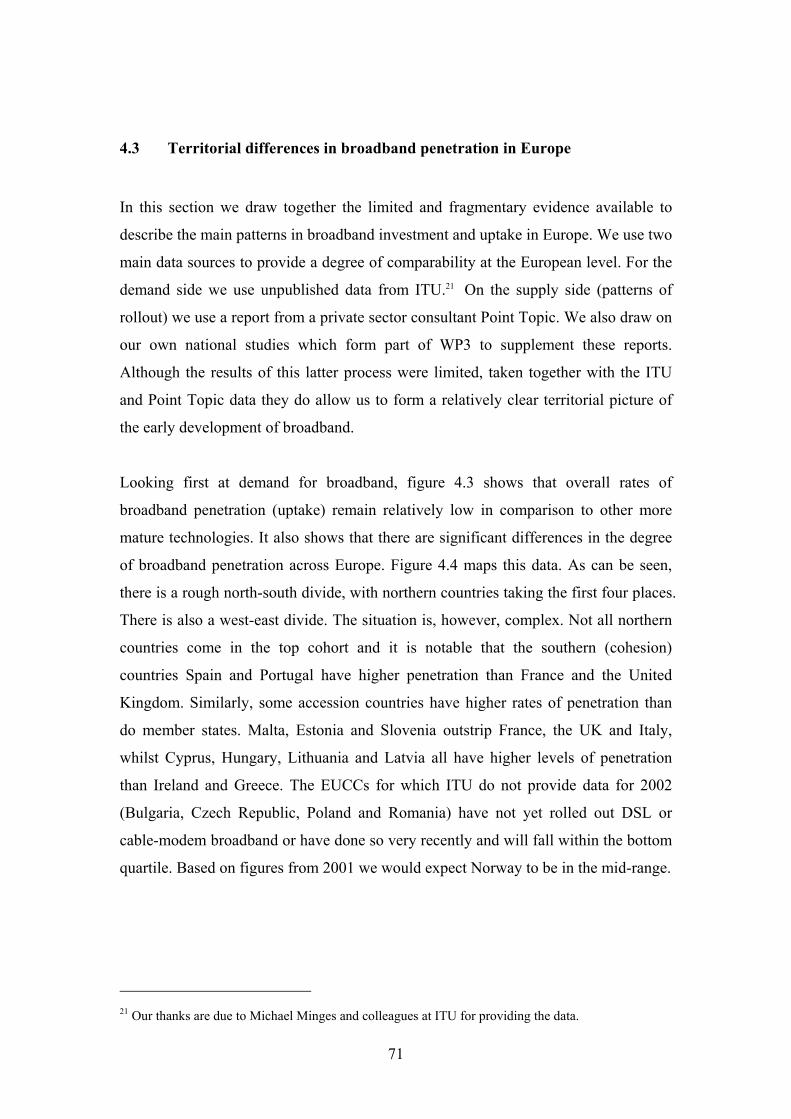
71
4.3 Territorial differences in broadband penetration in Europe
In this section we draw together the limited and fragmentary evidence available to
describe the main patterns in broadband investment and uptake in Europe. We use two
main data sources to provide a degree of comparability at the European level. For the
demand side we use unpublished data from ITU.21 On the supply side (patterns of
rollout) we use a report from a private sector consultant Point Topic. We also draw on
our own national studies which form part of WP3 to supplement these reports.
Although the results of this latter process were limited, taken together with the ITU
and Point Topic data they do allow us to form a relatively clear territorial picture of
the early development of broadband.
Looking first at demand for broadband, figure 4.3 shows that overall rates of
broadband penetration (uptake) remain relatively low in comparison to other more
mature technologies. It also shows that there are significant differences in the degree
of broadband penetration across Europe. Figure 4.4 maps this data. As can be seen,
there is a rough north-south divide, with northern countries taking the first four places.
There is also a west-east divide. The situation is, however, complex. Not all northern
countries come in the top cohort and it is notable that the southern (cohesion)
countries Spain and Portugal have higher penetration than France and the United
Kingdom. Similarly, some accession countries have higher rates of penetration than
do member states. Malta, Estonia and Slovenia outstrip France, the UK and Italy,
whilst Cyprus, Hungary, Lithuania and Latvia all have higher levels of penetration
than Ireland and Greece. The EUCCs for which ITU do not provide data for 2002
(Bulgaria, Czech Republic, Poland and Romania) have not yet rolled out DSL or
cable-modem broadband or have done so very recently and will fall within the bottom
quartile. Based on figures from 2001 we would expect Norway to be in the mid-range.
21 Our thanks are due to Michael Minges and colleagues at ITU for providing the data.
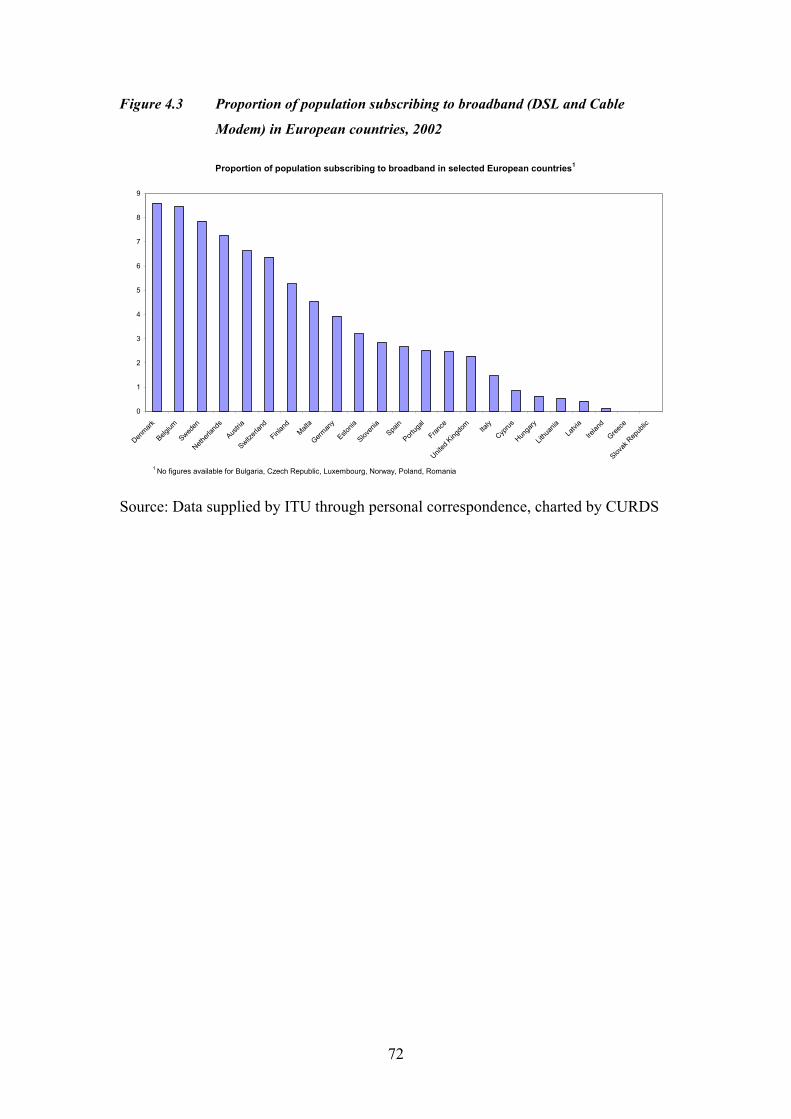
72
Figure 4.3 Proportion of population subscribing to broadband (DSL and Cable
Modem) in European countries, 2002
Proportion of population subscribing to broadband in selected European countries1
0
1
2
3
4
5
6
7
8
9
Denmark
Belgium
Sweden
Netherl
ands
Austria
Switzerl
and
Finlan
dMalt
a
German
y
Estonia
Sloven
iaSpa
in
Portug
al
France
United
King
dom
Italy
Cyprus
Hunga
ry
Lithu
ania
Latvi
a
Irelan
d
Greece
Slovak
Rep
ublic
1 No figures available for Bulgaria, Czech Republic, Luxembourg, Norway, Poland, Romania
Source: Data supplied by ITU through personal correspondence, charted by CURDS

Figure 4.4: Number of broadband subscribers (DSL and cable modem) per 100 of
population
Source: Da
Figure 4.5
different d
Austria an
penetration
Copyright project 1.2.2 CURDS 200373
ta supplied by ITU through personal correspondence, mapped by CURDS
distinguishes between DSL and cable modem and shows that they have
egrees of penetration within individual countries. In the Netherlands,
d Switzerland, for example, the relatively high rates of broadband
are associated primarily with cable modems rather than DSL.

74
Figure 4.5: Proportion of broadband subscribers in European countries, divided by
cable modem subscribers and DSL subscribers
Proportion of population subscribing to broadband - DSL & Cable modem - in selected European countries 1
0
1
2
3
4
5
6
7
8
9
Denmark
Belgium
Sweden
Netherl
ands
Austria
Switzerl
and
Malta
German
y
Estonia
Sloven
iaSpa
in
France
Portug
al
United
King
dom
Italy
Cyprus
Hunga
ry
Lithu
ania
Latvi
a
Irelan
d
Greece
Slovak
Rep
ublic
CABLE modemDSL
1 No figures available for Bulgaria, Czech Republic, Luxembourg, Norway, Poland, Romania2 Figures for Sweden are not broken down by technology and represent all broadband subscribers (DSL & Cable modem). In 2001 68% of total was accounted for by DSL
2
Source: Data supplied by ITU through personal correspondence, charted by CURDS
The general picture of broadband take up which emerges from the ITU data is
supported by data from OECD (OECD, 2001).
As with the other technologies discussed in this report (and in our FIR and SIR)
neither ITU nor OECD collect data at the sub-national level for ADSL uptake. We
carried out, therefore, an extensive search for regional data from national agencies. As
anticipated the results were disappointing with few agencies providing data on
regional differences (see Annex 1). Given that broadband is such a recent technology
this is though not surprising.
We turn now to the supply of broadband. Here, it is possible to draw a relatively clear
general picture of rollout trends, with common patterns evident across most countries.
With the exception of a couple of countries, however, we were not able to access the
data which would allow us to explore the fine-grained patterns which we know exist
in respect of these new technologies, particularly ADSL. Here the key question is
which exchanges have been enabled. We illustrate the importance of considering
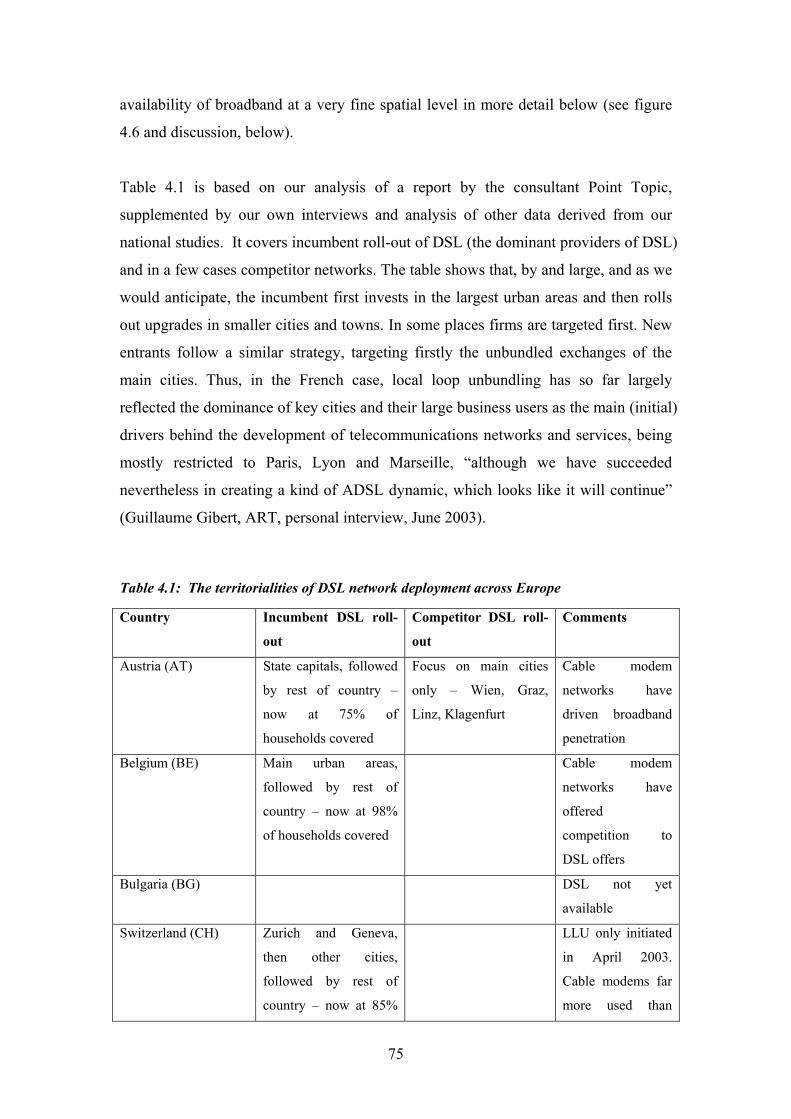
75
availability of broadband at a very fine spatial level in more detail below (see figure
4.6 and discussion, below).
Table 4.1 is based on our analysis of a report by the consultant Point Topic,
supplemented by our own interviews and analysis of other data derived from our
national studies. It covers incumbent roll-out of DSL (the dominant providers of DSL)
and in a few cases competitor networks. The table shows that, by and large, and as we
would anticipate, the incumbent first invests in the largest urban areas and then rolls
out upgrades in smaller cities and towns. In some places firms are targeted first. New
entrants follow a similar strategy, targeting firstly the unbundled exchanges of the
main cities. Thus, in the French case, local loop unbundling has so far largely
reflected the dominance of key cities and their large business users as the main (initial)
drivers behind the development of telecommunications networks and services, being
mostly restricted to Paris, Lyon and Marseille, “although we have succeeded
nevertheless in creating a kind of ADSL dynamic, which looks like it will continue”
(Guillaume Gibert, ART, personal interview, June 2003).
Table 4.1: The territorialities of DSL network deployment across Europe
Country Incumbent DSL roll-
out
Competitor DSL roll-
out
Comments
Austria (AT) State capitals, followed
by rest of country –
now at 75% of
households covered
Focus on main cities
only – Wien, Graz,
Linz, Klagenfurt
Cable modem
networks have
driven broadband
penetration
Belgium (BE) Main urban areas,
followed by rest of
country – now at 98%
of households covered
Cable modem
networks have
offered
competition to
DSL offers
Bulgaria (BG) DSL not yet
available
Switzerland (CH) Zurich and Geneva,
then other cities,
followed by rest of
country – now at 85%
LLU only initiated
in April 2003.
Cable modems far
more used than

76
of households covered DSL connections
Cyprus (CY) Incipient DSL roll-out
by incumbent which
still held monopoly at
end of 2002
Czech Republic (CZ) Prague, Brno and
Ostrava, with limited
access in ten other
cities – 12% of Central
Offices covered
Incipient DSL only
introduced by
incumbent in 2003
Germany (DE) Ruhr cities, other major
cities and business
users, before residential
users and rest of
country – 90% of
households, with the
rest to be covered by
satellite
Unbundled offers target
the business market.
HanseNet only in
Hamburg.
QSC in 46 cities to
cover over 1 million
businesses
Relatively limited
broadband
competition, but
low DSL prices
Denmark (DK) Odense, Alborg, Arhus
and Copenhagen, then
rest of country – 95%
of households
Very high DSL
competition
penetration
Estonia (EE) Tallinn first, then rest
of country, for business
and residential users –
all cities covered
Spain (ES) Barcelona and Madrid,
then other cities (not
always the largest first),
and rest of country –
83% of lines enabled
Jazztel in Madrid first,
then 42 Central Offices,
aimed at SMEs
Colt network between
Madrid, Barcelona and
Valencia
LLU restricted, so
competitive DSL
offers via
incumbent
wholesale services
Finland (FI) Major cities and
regions with business
and residential users at
same time, but different
coverages – southern
and western regions
Focus on major cities,
with Helsinki first and
others after
Importance of
historical structure
of telecoms sector
(local municipal
operators as well
as Sonera)

77
and Aland virtually
fully covered
France (FR) Trials in medium-sized
cities and peripheral
Paris, before Paris first,
and other large city
regions (particularly in
north) – 74% of
population covered
Paris region and
business users targeted
first
Relatively
uncompetitive
market dominated
by incumbent
Greece (GR) Pilot in Athens and
Salonika
Slow development
Hungary (HU) Budapest, then 10 other
cities over a year later
Ireland (IE) Trials in Ennis and
Dublin, followed by
roll-out in Dublin,
Cork, Kerry, Limerick,
Galway and NW – 70
exchanges enabled now
Esat BT with unbundled
access to Limerick
exchange
One of last
European countries
to have broadband
access
Italy (IT) Relatively well
distributed urban area
roll-out – over 30 cities
initially, then rest of
country – 80% of
population covered
Metropolitan areas Limited cable
network and strong
incumbent.
LLU trials in
Rome, Milan and
Turin
Lithuania (LT) Vilnius first, then 4
next major cities, and
34 additional regional
centres
Luxembourg (LU) 10 centres for
residential and
teleworking users
Latvia (LV) SMEs in Riga first,
then other cities and
residential users – 26
regions and 80% of
telephone lines covered
Malta (MT) Deployed by incumbent

78
in a number of areas
since 2000
Netherlands (NL) Main west coast
metropolitan areas,
followed by other cities
– 85% of population
covered
‘Certain regions are
expected to be omitted
for economic reasons’
Cable ahead of
DSL.
Possible ‘technical
limitations and
competitive
disadvantages’ for
DSL
Norway (NO) Trial of business users
in central Oslo, before
Oslo, Tromso and
Baerum covered, and
all main municipalities
– now 65% of
population covered
SME users in
municipalities (Catch) –
Oslo, Bodo and Tronso,
then expanding
gradually to more than
80 places
NextGenTel – Bergen
before other cities
Poland (PL) Warsaw covered first,
then 6 other major
cities
DSL only recently
launched
Portugal (PT) Lisbon and Porto, and
parts of other cities,
then other
municipalities – now
50% of country covered
Dominant
incumbent (also
cable provider).
DSL only recently
promoted
Romania (RO) Incipient DSL roll-out
by incumbent, with
unbundling yet to start
Sweden (SE) Trial in Stockholm and
Gothenburg, then other
cities, and rest of
country – now 80% of
population covered
90% of population
live within 3 km of
digital switch, so
few technical DSL
problems.
Fibre LAN as well
as cable competes
with DSL.
Slovenia (SI) First rolled out in
Llubjana, Maribor,
Medinet – business
access in Llubjana and
Slovenia has one
of highest

79
followed by major
cities
Maribor broadband take up
rates in EUCC.
Incumbent offers
‘reasonable price’
ADSL and there is
competition from
cable (see ITU
figs)
Slovakia (SK) Centre of Bratislava,
Kosice (the second
city) and Banska
Bystrica (one of the
third tier cities). The
next stage of planned
roll-out is other
regional capitals
ADSL only
introduced 1st June
2003
United Kingdom (UK) London exchanges,
then other large cities,
medium-sized English
cities, then Wales, N
Ireland and Scotland,
and rest of country –
now 63% of households
covered
Easynet – trial in Leeds
and Edinburgh, then
other major cities for
business users
Freeserve – Manchester
and London
Kingston – Hull
Slow uptake in
residential
broadband
Source: Drawn from Point Topic, supplemented by national studies by 1.2.2 partners.
Table 4.1 above gives a general view of the rollout process and indicates that, as
suggested in the model outlined (in chapter 6) new technologies with nodal properties
will follow a hierarchical roll out pattern. Our interview and survey work during
WP3 largely confirmed this trend and it was generally acknowledged that rollout was
occurring in areas of high density population. In France, for example, the
development of broadband access has been concentrated in dense, urban areas. This is
shown by the fact that the 74% of the population which do have access to broadband
live on only 21% of the French territory, and that these areas have a population
density of 330 inhabitants per square kilometre, whereas the national average is only

80
95 inhabitants per square kilometre. The 26% of the population without broadband
access live in zones where the density decreases to only 32 inhabitants per square
kilometre (ORTEL, 2003).
Ideally we would have liked to have obtained data on the actual rollout patterns of
ADSL and other broadband technologies but, unfortunately, we are unable to obtain
this data as telecommunications providers regarded it as commercially sensitive. We
were, however, able to obtain data for two countries: Finland is one of the leading
countries in relation to ICTs, Hungary is less developed.
Figure 4.6 shows the importance of considering telecommunications territoriality at
the lowest possible spatial scale. The figure maps data for broadband availability (not
take up) for ADSL, cable modem, fibre and WLAN in Finland. When mapped at
NUTS 2 level (Province), three regional bands are shown with highest penetration in
the south. When mapped at NUTS 5 level, however, it becomes clear that there is no
generalised regional effect at all, and that densely populated areas fare better than
more sparsely populated areas in all regions. In fact, the roll out of broadband follows
the network of cities in Finland, as can be seen by comparing Figure 4.7 broadband
coverage with Figure 4.8 population density. Apparent regional variations in
broadband coverage are, therefore, explained primarily by their different composition
of urban and rural areas.
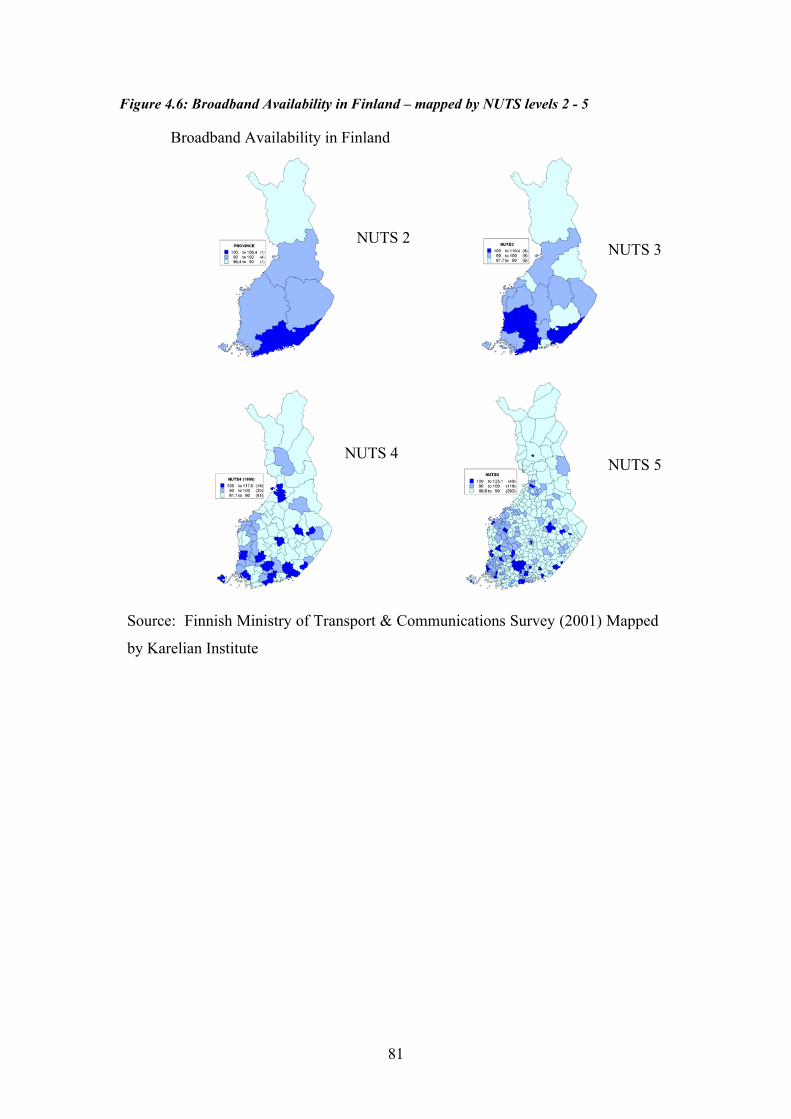
81
Figure 4.6: Broadband Availability in Finland – mapped by NUTS levels 2 - 5
Broadband Availability in Finland
Source: Finnish Ministry of Transport & Communications Survey (2001)
by Karelian Institute
NUTS 2 NUTS 3
NUTS 4 5
NUTSMapped
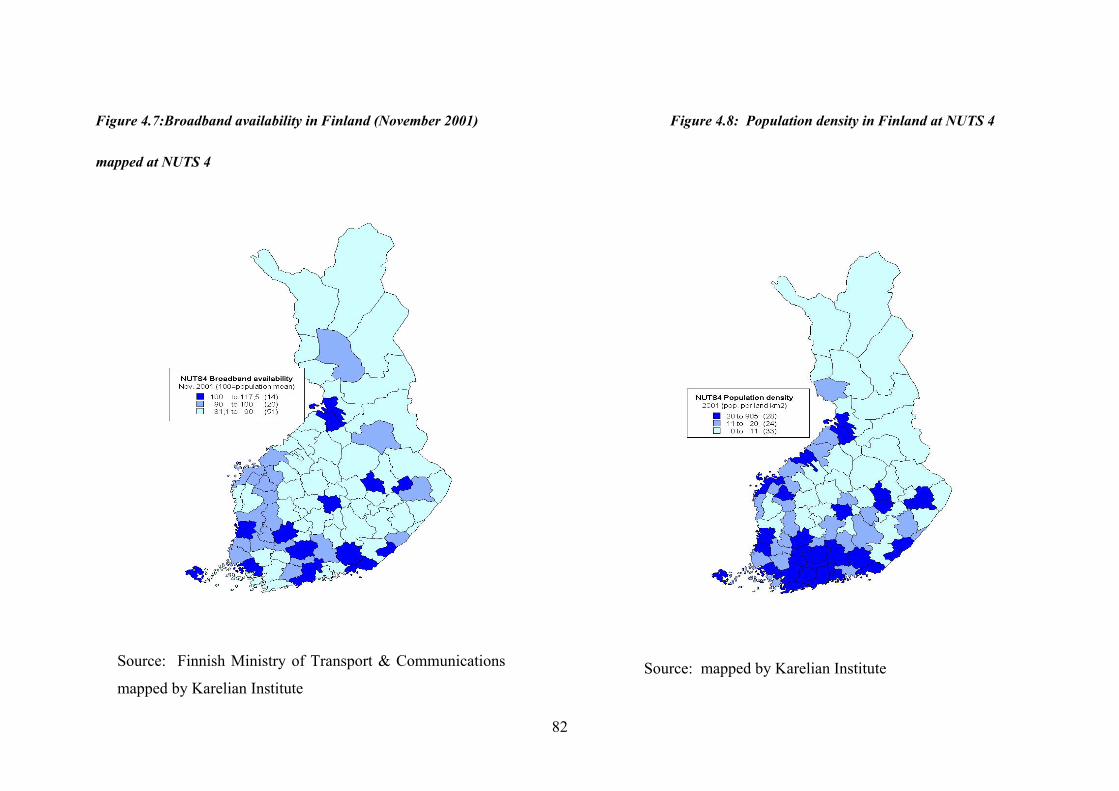
82
Figure 4.7:Broadband availability in Finland (November 2001)
mapped at NUTS 4
Source: Finnish Ministry of Transport & Communications
mapped by Karelian Institute
Figure 4.8: Population density in Finland at NUTS 4
Source: mapped by Karelian Institute

83
A similar picture emerges when we look at the roll out of a single broadband technology –
ADSL – in Hungary. Again, comparing Figure 4.9 and Figure 4.10 suggests that the main
areas in which ADSL has been rolled out are those with the densest population, though the
match is not exact.
The maps in figure 4.11 show the roll out of ADSL in 3 European countries, France22, Italy
and the UK. In each case the central map shows ADSL rollout – that is to say the parts of the
country covered, not the take up of the technology. The left hand map shows population
coverage at NUTS 3 level, the right hand map shows GDP at NUTS 3 level. These maps are
included for illustrative purposes only. We do not have the data behind the roll-out maps, as
this is regarded as commercially sensitive. They do nevertheless allow the reader to make
visual comparisons between rollout, population density and GDP. In the case of the UK and
France there is a relatively clear link between population density and rollout and also GDP
and rollout. In Italy the situation is more complex. What is clear in all cases, however, is that
rural areas tend not to be covered by these technologies. Further, it is also clear that even
NUTS 3 provides too coarse a spatial filter examining ADSL roll out, with individual
exchanges being enabled or not-enabled at a finer-grained level of decision-making.
22 For more information on the territoriality of ADSL coverage in France, see the ORTEL (IDATE/TACTIS) website (http://www.ortel.fr).

84
Figure 4.9 ADSL coverage in Hungary Figure 4.10 Popul
Source: Mapped by Karelian Institute Source: Mapped b
ation distribution in Hungary
y Karelian Institute

Figure 4.11: ADSL coverage, population density and GDP per capita in France, Italy and
the UK
France
Italy
UK
Copyright project 1.2.2 CURDS 2003 Source: ORTEL 2003
Copyright project 1.2.2 CURDS 2003 Source: Osservatorio Banda Larga / Between 2003L
Copyright project 1.2.2 CURDS 2003
85
ADSL
ADS
G
Source: BT/Analysys/BS
86
As suggested in section 4.2, for technical and cost reasons ADSL and cable
technologies are unlikely to reach all areas of Europe in the foreseeable future. One
study carried out in the UK suggests that some areas may not be served at all if rollout
is left only to the market. Figure 4.12 shows the results of a prospective study by the
UK Broadband Stakeholder Group. It shows areas where more than one type of
broadband technology is currently available, areas where only one kind of broadband
is available, areas where broadband is expected to rolled out at some (as yet
undetermined) time and those areas where no rollout is foreseen. It shows that much
of the territory of the UK does not have ‘future provision foreseen’, because these
areas are much less commercially viable than the urban areas where more than one
broadband technology is available. We are not suggesting that telecoms providers will
take this approach in all countries. There is some evidence that in Denmark for
example that the incumbent intends to cover the whole country. These differences
require further exploration and explanation.

87
Figure 4.12: The number of broadband technologies available across the UK
Source: Broadband Stakeholder Group and Ordinance Survey (2003)
4.4 Alternative Broadband Technologies
In this chapter we have shown that the patterns of rollout and uptake of the new, most
commercially developed, broadband technologies are complex, with, for example,
some EUCCs being ahead of member states. The situation also differs from country to
country with Denmark, for example, having wide territorial coverage whilst in other
countries such as Finland and Hungary it is more concentrated. The general trend,
however, appears to be that rural areas are lagging in respect of both sets of

88
technologies, as providers do not see such areas as commercially at present. In some
cases it seems likely that these areas will never be considered commercially viable,
thus endangering the European Union’s goal of balanced territorial development in
the information society.
It may be that the territorial coverage of these new services can be increased by
technical developments; for example, some providers have installed what are know as
DSLAM technologies into rural exchanges, though there is a debate as to whether
these technologies offer much more than ISDN standards. On the public subsidy side
a number of initiatives are under way. These are considered in chapter 7 on policy.
For some rural places, however, DSL and cable technologies may not be the most
suitable. It has been suggested that wireless technologies may be more appropriate for
rural areas and that if supply side intervention is to occur it would be better directed at
those technologies. The French telecommunications regulator, the ART, for example,
has recently emphasised the importance of diversifying the type and number of
technologies available in the local loop, and wireless networks are being viewed as an
increasingly crucial alternative to fixed broadband, which has so far been rarely
extended beyond urban areas. Indeed, although France Télécom announced in June
2003 a new plan to accelerate ADSL deployment across France to allow 90% of the
population to have broadband Internet access by 2005, because the remaining 10% of
the population live in less accessible or concentrated areas, the broadband offer for
them will be restricted to satellite (Irène Le Roch, France Télécom, personal interview,
July 2003). With the development of fixed wireless also being restricted, for
economic reasons, to serving SMEs and other businesses in towns and cities of more
than 50,000 inhabitants, many ‘communities of rural communes’ have already
registered an interest with the ART in developing projects based around wi-fi or
satellite networks.
We turn now to briefly explore three of these alternative technologies: satellite, fixed
wireless access (FWA) and Wi-Fi (we have already covered UMTS in section 3.5 of
this report).
One of the main arguments for investment in these wireless technologies is that they
are in some ways cheaper to roll-out than ADSL and cable modem. Notably, they do

89
not incur the expensive engineering costs which the latter technologies require. It
should be noted, however, that wireless networks are based either on satellite or
terrestrial infrastructure. In the latter case, they do ultimately rely on access to fixed
networks and a ‘full-cost’ model would have to take this into account. In the case of
satellite the costs of launch and maintenance would also have to be factored in. We
now turn to look at each of these technologies in turn, exploring their potential to
bring broadband to those areas currently not served. In chapter 7 on policy we provide
examples of where the public sector has intervened to stimulate their roll out.
Satellite technology remains the type of communications infrastructure theoretically
most adapted to serving the most remote areas and transmitting communications over
extremely long distances and covering large geographical areas, with rural areas
falling within their ‘footprint’ as well as urban areas. Although use of the current
‘geostationary’ satellites for telecommunications remains limited for reasons of cost,
new low Earth orbit satellite networks (Skybridge and Teledesic) should offer more
potential and lower costs for broadband communications access in zones where other
types of network are infeasible. Satellite technologies allow businesses and domestic
consumers to download information (e.g., from the Internet) via a satellite. In effect,
the satellite broadcasts the information and a decoder filters out the information not
required by the consumer. Satellite provides high bandwidth access to information,
with download capacities of around 2 mbt/s claimed, though again services are
contended and real speeds may be much slower. Further, the consumer must still rely
on the telephone line (an analogue modem, ISDN, ADSL, or cable modem)
connection for outward communications, i.e., communicating with their ISP.

90
Box 4.1
France : wi-fi and satellite for rural communes Felletin is a small commune of 2,000 inhabitants in the department of La Creuse in central France between Limoges and Clermont-Ferrand. This is one of the most rural areas of France, and therefore has had more limited access to telecommunications networks and services than other more densely populated and urban areas. Nevertheless, Felletin managed in December 2000 to attract a fixed wireless access (FWA) offer from France Télécom, and this is on the verge of being supplemented by a joint wi-fi and satellite broadband project from Tiscali. By locating a satellite dish and wi-fi antenna on a tall building, and using the latter to diffuse the signals captured by the former to the ‘patch antennas’ of individual users in a 200-300 metre radius, the amount of bandwidth becomes comparable to the 512 kbit/s of ADSL. The project is at the experimentation stage in Felletin, and so is free for the commune and the users until December 2003. After this period, the cost to the user will be equivalent to an ADSL connection (around 45 euros per month). Although it will require communes to finance the base station (with possible help from the FEDER European funds), Tiscali envisages this type of parallel wi-fi and satellite network becoming a solution for other rural communes deprived of ADSL. Another example is the ‘community of communes’ of the pays de Sillé in the department of Sarthe, which has 7,000 inhabitants and 1,000 industrial employees. A wi-fi project was developed to link the 10 communes with 60 access points each. Laser transmission provides the 20 kilometre backbone connecting the communes, for a total estimated cost of 420,000 euros. The departmental council for the Côte-d’Or has initiated a broadband Internet access project based on satellite for two sites (a commercial zone and an agricultural college), with funding from the council and the European Union (the Metafor programme). The aims have been ‘to test the capacity of this technology to bring a collective response to the needs of users located in rural or peri-urban zones with no other broadband Internet access solution, and to explore how satellite broadband could fit within regional broadband infrastructure policy in relation to other technologies’. Source: Observatoire des Télécommunications dans la Ville at http://www.telecomville.org
Fixed wireless access (FWA), or the wireless local loop, is a form of radio
communication like mobile telephony, but connects two fixed locations rather than
offering mobile access, thus normally guaranteeing a certain level of bandwidth. This
infrastructure has tended to be targeted so far at (small) business users, frequently in
urban areas, largely because of the cost of network deployment, which has restricted
extension to residential users. In Canada, however, the government has released large
amounts of spectrum, which together with the enthusiasm of remote rural
communities to embrace FWA, was expected to lead to growth in residential users
(ITU, 2003).

91
Box 4.2
A wireless success story from rural Canada The small community of Saint Pierre-Jolys in the central Canadian province of Manitoba has been forced to look for an alternative method of broadband access to bypass the exorbitant cost of the deployment of a fibre infrastructure by the incumbent operator. The inter-community Rat River Communications Co-operative has led the way by negotiating the construction of a broadband fixed wireless network (plus the necessary fibre connection and point-to-point wireless links) at a very low cost by two local carriers. Other cooperative projects have formed around wi-fi networks, whereby users are constructing ‘a mesh of uninterrupted connectivity via a dense clustering of nodes’. Thus, although wi-fi technology has geographical limits to its diffusion, some Canadian projects are extending its range to between 10 and 20 kilometres through a point-to-point linking of ‘hot spots’, suggesting ‘the possible extension of wi-fi as an alternative means for remote community-dwellers to aggregate demand and share backbone connectivity’. Source: ITU, 2003
Wi-fi (wireless fidelity) or RLAN (radio local area network) is a local wireless
network using the 2.4 GHz frequency and requiring a multidirectional antenna,
connection equipment and an access point. 10-12 users (per access point) with wi-fi
cards in their computers can thus obtain bandwidth of 6-7 Mbit/s. Although the
network range is initially limited to a few hundred metres, interconnecting local
networks is possible via another antenna with a range of up to 30 kilometres.
Nevertheless, wi-fi still necessitates a connection between the local network and a
broadband backbone, which may limit its potential for territorial development. In
France, using satellite access to provide this broadband connection has been suggested,
particularly for rural and mountainous zones.
These differing types of wireless technology can be seen as complementary rather
than necessarily competing. The UK Broadband Stakeholder Group, for example,
views UMTS as ‘complementing wi-fi and FWA in the UK’s broadband
infrastructure, by offering a mobile component’. Indeed, UMTS and wi-fi have been
specifically designed to be compatible with each other.
4.5 Summary
It is, then, evident that in respect of broadband there are, again, territorial differences
across Europe. These appear between countries, with the Nordic countries, plus
Austria and Switzerland, in the lead, and the EUCC countries, plus Ireland and Greece

92
lagging behind. The situation is complex, however, with some EUCCs not only
moving ahead of other EUCCs, but also moving ahead of some EU15 countries.
Based on the fragmentary evidence we have been able to piece together the general
pattern emerging within countries is that rollout is occurring first in capital cities and
other large urban areas, before spreading to urban areas more widely. Generally
speaking rural areas appear to be at the back of the rollout queue. The evidence also
suggests that some places will not obtain access to broadband technologies if
development is left solely to the market. This is particularly true of those technologies
currently being most rapidly rolled out – ADSL and cable modem – which appear to
have an ‘urban bias’ in terms of the techno-commercial model adopted by telecoms
providers.
Alternative broadband technologies may hold out some hope for more rural areas,
though it should not be assumed that there is automatically a market for these new
technologies and demand stimulation will also be required to ensure the rollout and
penetration (uptake) of any broadband technology. We would wish to strike a general
note of caution regarding the extent of the relationship between telecommunications
supply and uptake. Although there is clearly a significant link between where
networks and services are rolled out and where penetration of these is highest, there
may often be intervening factors which mean that the extent of this link is reduced.
Figure 4.13, for example, shows the roll-out and uptake of ADSL in NUTS 1 regions
of the UK. Here, although, in the main, the regions with highest coverage have the
highest penetration levels (London and the South East), the North East stands out as
having the third highest level of coverage, but the lowest uptake of all UK regions.

93
Figure 4.13 ADSL coverage and uptake in UK regions
ADSL: % of homes covered by UK region
30
40
50
60
70
80
90
100
Lond
on SE NENW WM EM
Y & HEas
tSW NI
Scot
Wales
ADSL: % of uptake by UK region
0
1
2
3
4
5
6
7
Lond
on SE NIEas
tSW
Scot
NWY & H EM
WMWales NE
Source: British Telecom, personal correspondence
This chapter, together with chapter 3, has shown that there are significant territorial
differences in both the supply of and demand for telecommunications networks and
services in Europe. This is true both between countries and within countries, although
the data we have with respect to differences between countries is more comprehensive
than the data we have in relation to differences within countries. The most significant
divide appears to be the urban-rural one, both in respect of the Internet and in respect
of the broadband technologies which it is assumed will drive the Internet’s further
adoption. We return to this issue in our policy chapter (Chapter 7).
In theory telecommunications and networks have the potential to support goals of
increased polycentric development at a number of spatial scales. In practice, however,
in a market economy telecommunications companies will prioritise investment in
places where they perceive there to be the biggest and most profitable market. This

94
assumption is supported by our analysis of patterns of network supply. It is also
supported by our interview and survey results, where commercial criteria, whether
measured by population density, density of businesses, anticipated rate of return or
historical consumption patterns, was the dominant factor in investment planning. We
consider the relationship between telecoms and polycentric development more fully in
chapter 6.

95
Chapter 5: The territoriality of pan-European telecommunications
network provision
5.1 The importance of pan-European networks
One of the most important shifts in telecommunications network development in
competitive market environments across Europe in the last decade has been that from
a predominant reliance on the national networks of traditional incumbent operators to
the emergence of a vast number of alternative infrastructures constructed by new
entrant carriers, many on a ‘pan-European’ scale. Thus, telecommunications market
liberalisation engendered not only a significant increase in the number of market
players, but also to some extent, a new transparency to the saliency of national
boundaries as the key spatial scale for backbone infrastructure deployment moved
from the national to European level.
The vast sums of capital poured into their planning, construction and management in
the last decade by dozens of companies (and the willingness of many of these
companies to invest massively often with borrowed money and risk their futures on
building these extensive networks) is symbolic of their strategic importance in the
overall European telecommunications market. Accessibility to existing and potential
clients has been the main driver, as companies have sought particularly to offer
increasingly seamless, end-to-end service provision to business customers located in
major urban centres. Their own fibre backbone networks have created the capacity to
be able to offer the most up-to-date services and by being routed directly between
large cities allow businesses to exchange information between their own office
locations and with those of clients via fast transmission speeds. These pan-European
telecommunications networks are, thus, the major highways of the information society
in Europe, and remain the infrastructural foundation to the availability of competitive
telecommunications services throughout Europe. Given the predilection of major
companies for obtaining the greatest choice, highest quality and lowest cost of
telecommunications services, the location and extent of this type of infrastructure

96
clearly has significant territorial implications for the economic development and
relative competitive advantage of the regions and urban centres of Europe. It is
unlikely, for example, that a region without access to pan-European infrastructure
would be able to attract substantial economic investment, because major companies
are unlikely to locate in such a region. Indeed, research has shown that
telecommunications are a key factor in the location of economic activities,
particularly in the services and knowledge sectors. 23 The presence of multiple
networks offers firms direct access to the globally integrated networks and services of
the biggest operators, offering higher quality and more secure infrastructure, and
faster data communications. Equally importantly, higher levels of competition in
infrastructure provision (through the presence of multiple networks) are likely to lead
to reduced telecommunications costs. For those firms based in places where there is
less choice of networks, or no networks at all, the converse is likely to be the case.
Telecommunications network infrastructure investment can, therefore, be viewed as
both (a) causative of regional and urban economic development; but also (b) highly
responsive to patterns of economic development, such that analysis of their
geographies can reveal much about urban and regional developmental dynamics in
Europe.
Having established the overall importance of the territorial dynamics and implications
associated with pan-European telecommunications network provision, it is the
intention of this chapter to explore in more detail the relationship between the
development of these networks and the development of the European territory as a
whole through investigating the pertinence of key concepts such as the European
urban hierarchy, polycentrism and gateway cities.
As telecommunications markets have become more liberalised and thus more
competitive, data relating to networks – their presence or absence, and their capacity –
has become difficult to obtain, as companies see this information as a commercially
valuable resource. Nevertheless, some information does exist on the total capacity of
23 For example, over the period 1997 to 2002 the ‘quality of telecommunications’ consistently appears in the top 5 factors taken into account by companies when deciding on location, according to property consultants Healey and Baker’s annual European Cities Monitor (see Cushman & Wakefield, Healey & Baker (2002) for latest figures).
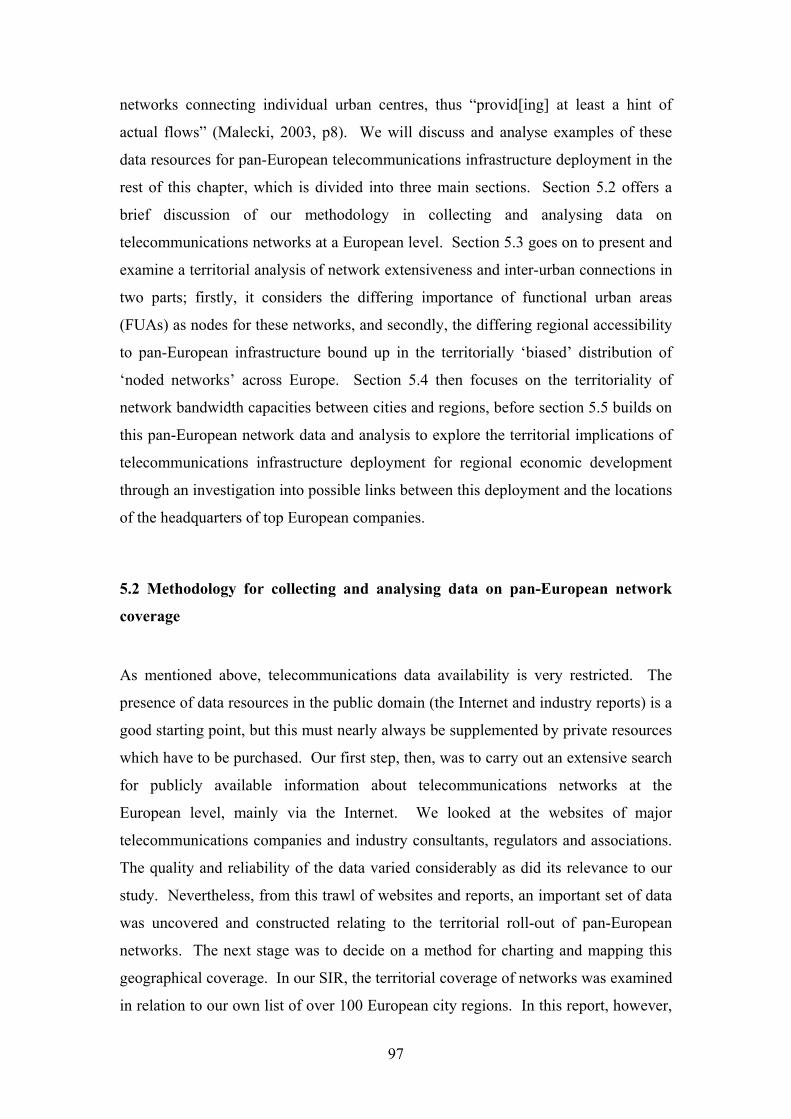
97
networks connecting individual urban centres, thus “provid[ing] at least a hint of
actual flows” (Malecki, 2003, p8). We will discuss and analyse examples of these
data resources for pan-European telecommunications infrastructure deployment in the
rest of this chapter, which is divided into three main sections. Section 5.2 offers a
brief discussion of our methodology in collecting and analysing data on
telecommunications networks at a European level. Section 5.3 goes on to present and
examine a territorial analysis of network extensiveness and inter-urban connections in
two parts; firstly, it considers the differing importance of functional urban areas
(FUAs) as nodes for these networks, and secondly, the differing regional accessibility
to pan-European infrastructure bound up in the territorially ‘biased’ distribution of
‘noded networks’ across Europe. Section 5.4 then focuses on the territoriality of
network bandwidth capacities between cities and regions, before section 5.5 builds on
this pan-European network data and analysis to explore the territorial implications of
telecommunications infrastructure deployment for regional economic development
through an investigation into possible links between this deployment and the locations
of the headquarters of top European companies.
5.2 Methodology for collecting and analysing data on pan-European network
coverage
As mentioned above, telecommunications data availability is very restricted. The
presence of data resources in the public domain (the Internet and industry reports) is a
good starting point, but this must nearly always be supplemented by private resources
which have to be purchased. Our first step, then, was to carry out an extensive search
for publicly available information about telecommunications networks at the
European level, mainly via the Internet. We looked at the websites of major
telecommunications companies and industry consultants, regulators and associations.
The quality and reliability of the data varied considerably as did its relevance to our
study. Nevertheless, from this trawl of websites and reports, an important set of data
was uncovered and constructed relating to the territorial roll-out of pan-European
networks. The next stage was to decide on a method for charting and mapping this
geographical coverage. In our SIR, the territorial coverage of networks was examined
in relation to our own list of over 100 European city regions. In this report, however,

98
we are able to draw on the recent availability of a typology of over 1500 functional
urban areas (FUAs) in Europe developed by TPG 1.1.1, thus not only standardising
the varying network data we have uncovered from different sources, but also building
on crucial links with other ESPON projects and offering further validation of these
new data sets. The FUA data set is particularly relevant to this exploration of pan-
European telecommunications territorialities because network data in this domain is
presented almost invariably in an ‘urban node’ and ‘inter-urban flow’ format.
Nevertheless, we also found it useful that the FUA typology was partly related to their
NUTS 3 region contexts, allowing us to add a crucial ‘regional accessibility’
dimension to our analysis.
5.3 A territorial analysis of network extensiveness and inter-urban connections
a) Functional Urban Areas (FUAs)
Figure 5.1 plots the population of European Functional Urban Areas (FUAs) against
how many of ten of the most extensive pan-European company networks are present
in them. The ten networks are BT Ignite, T-Systems (Deutsche Telekom), Cable &
Wireless, TeliaSonera, Telecom Italia Sparkle, Colt, MCI, Infonet, UPC and Tiscali.24
Only 341 out of the list of 1609 FUAs have one or more of these main pan-European
networks present (21.19%).
If a large population and a higher number of pan-European networks in FUAs are
closely linked, we would expect the chart to show a consistent rising curve. However,
whilst there is a general upward trend like this, the chart shows a much more even
distribution than we might have expected, suggesting that the population of FUAs is
probably only one of a series of factors bound up in the number of pan-European
networks deployed in them.
Thus, while three of the four most populous FUAs in Europe (Paris, London and
Madrid) are well represented on 9 or 10 of the networks, Essen, with its population of 24 A territorial perspective on the network roll-out and investment strategies of some of these individual pan-European telcos was given in the 1.2.2 SIR (see pp129-142).

99
nearly 6 million, is only on 3 networks, and Wien, Amsterdam and Bruxelles, with
relatively lower populations around the 1-1.5 million mark, are on all ten. In the same
way, at the other end of the scale, it is not surprising to find that the majority of the
FUAs which are present on only 1 of the 10 networks have populations of less than
300,000, yet there are still seven FUAs in this category with populations over 1
million, including Napoli which has a population of well over 2 million. Indeed,
given the population spread for these FUAs with only 1 pan-European network, from
the 2.38 million of Napoli down to the 20,000 of Tralee, it is clear that we must look
for other reasons behind the territorial deployment of pan-European networks as well
as population.
We can note that two FUAs with populations of over 1 million, Porto and Sofia, do
not have presence of any of these ten networks. Likewise, capital cities such as
Vilnius, Tallinn and Nicosia (as well as Sofia)25 are not on any of the main networks.26
25 The situation with regard to major pan-European operators is, however, frequently complicated by the fact that many of these operators have subsidiary companies (which may or may not themselves be pan-European operators), which may have presence in other cities. TeliaSonera, for example, has subsidiary presence in Tallinn and Vilnius in this way (but which is not shown on their network configuration maps on their website). 26 See the 1.2.2 SIR, pp104-107, for a discussion and charts of national territorial differences in the relationship between telecommunications infrastructure and city region populations.

100
Figure 5.1 – Comparing the population of FUAs with how many of ten of the main pan-
European network operators are present
0
2000000
4000000
6000000
8000000
10000000
12000000
0 2 4 6 8 10 12
No. of networks / 10
Popu
latio
n
London
Paris
Essen
Madrid
Napoli
WienAmsterdamBruxelles
Source: Data from company websites, plotted by CURDS
This conclusion about the need to consider other factors as well as population is also
largely borne out by figure 5.2 which compares the population of FUAs with their
ranking in terms of the quality of their telecommunications infrastructure by the
Telegeography consultancy. Essen again stands out for its large population but low
ranking, while Dusseldorf, Amsterdam, Hannover and Bruxelles are all considered to
be among the top European cities for telecommunications, despite populations of just
over or just below 1 million.

Figure 5.2 – Comparing the population of FUAs with the ranking of the top 60 cities for
telecommunications by Telegeography Inc.
S
p
101
ource: Data from Telegeography Inc. website (http://www.telegeography.com),
lotted by CURDS
0
2,000,000
4,000,000
6,000,000
8,000,000
10,000,000
12,000,000
0 10 20 30 40 50 60 70
Telegeography ranking
Popu
latio
n
Paris
Essen
London
Dusseldorf

102
Figure 5.3 KMI’s map of pan-European backbone infrastructures
Source: www.kmiresearch.com (based on publicly available information or
information shared with KMI as of Q3 2001). Copyright of map is with KMI, used by
permission.
Figure 5.3 illustrates how non-incumbent telecommunications operators have rolled
out (or intended to roll out) their pan-European networks27 in recent years28 . A
number of preliminary general points of territorial analysis emerge from this map:
27 “KMI’s definition of pan-European network includes those service providers that installed their own fiberoptic cable in more than one European country” (Personal communication from Patrick Fay, KMI Research, 21 March 2003). 28 The map, produced by KMI, covers actual roll-out and intended roll-out by key pan-European network providers as of 3rd quarter 2001. The downturn in the telecommunications market a couple of
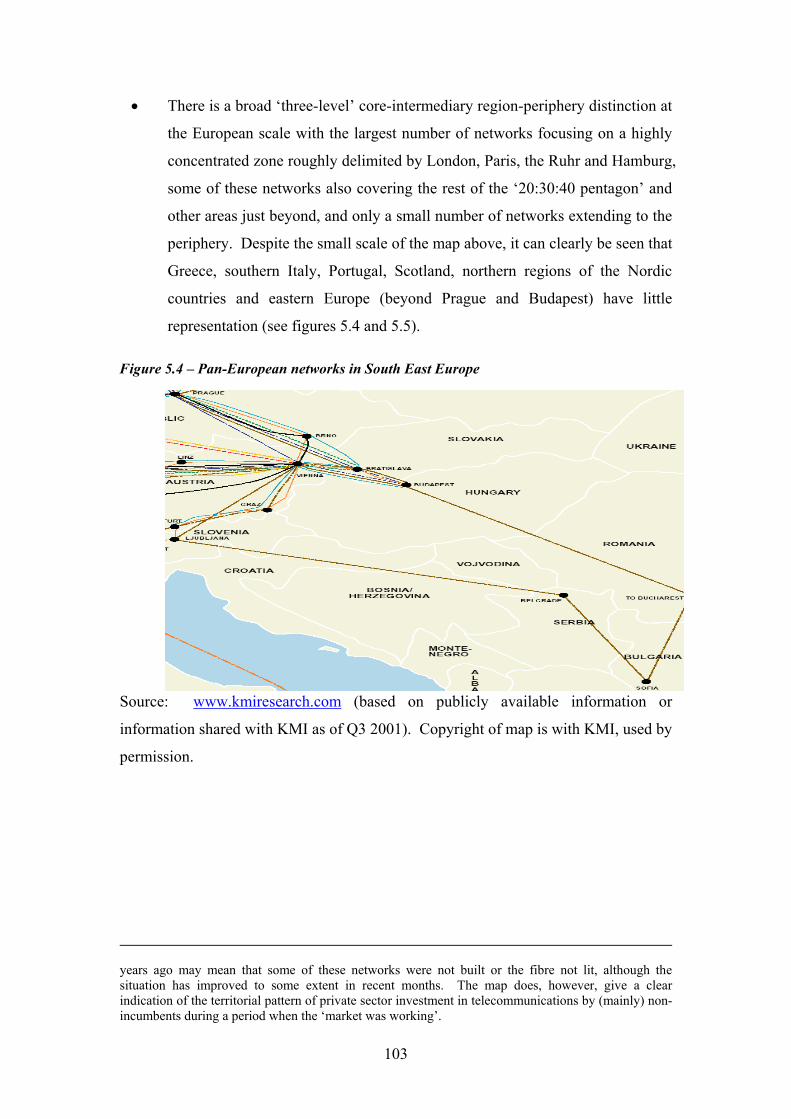
• There is a broad ‘three-level’ core-intermediary region-periphery distinction at
the European scale with the largest number of networks focusing on a highly
concentrated zone roughly delimited by London, Paris, the Ruhr and Hamburg,
some of these networks also covering the rest of the ‘20:30:40 pentagon’ and
other areas just beyond, and only a small number of networks extending to the
periphery. Despite the small scale of the map above, it can clearly be seen that
Greece, southern Italy, Portugal, Scotland, northern regions of the Nordic
countries and eastern Europe (beyond Prague and Budapest) have little
representation (see figures 5.4 and 5.5).
Figure .4 – Pan-European networks in South East Europe
Sourc
inform
permis
years asituatioindicatiincumb
5
103
e: www.kmiresearch.com (based on publicly available information or
ation shared with KMI as of Q3 2001). Copyright of map is with KMI, used by
sion.
go may mean that some of these networks were not built or the fibre not lit, although the n has improved to some extent in recent months. The map does, however, give a clear on of the territorial pattern of private sector investment in telecommunications by (mainly) non-ents during a period when the ‘market was working’.
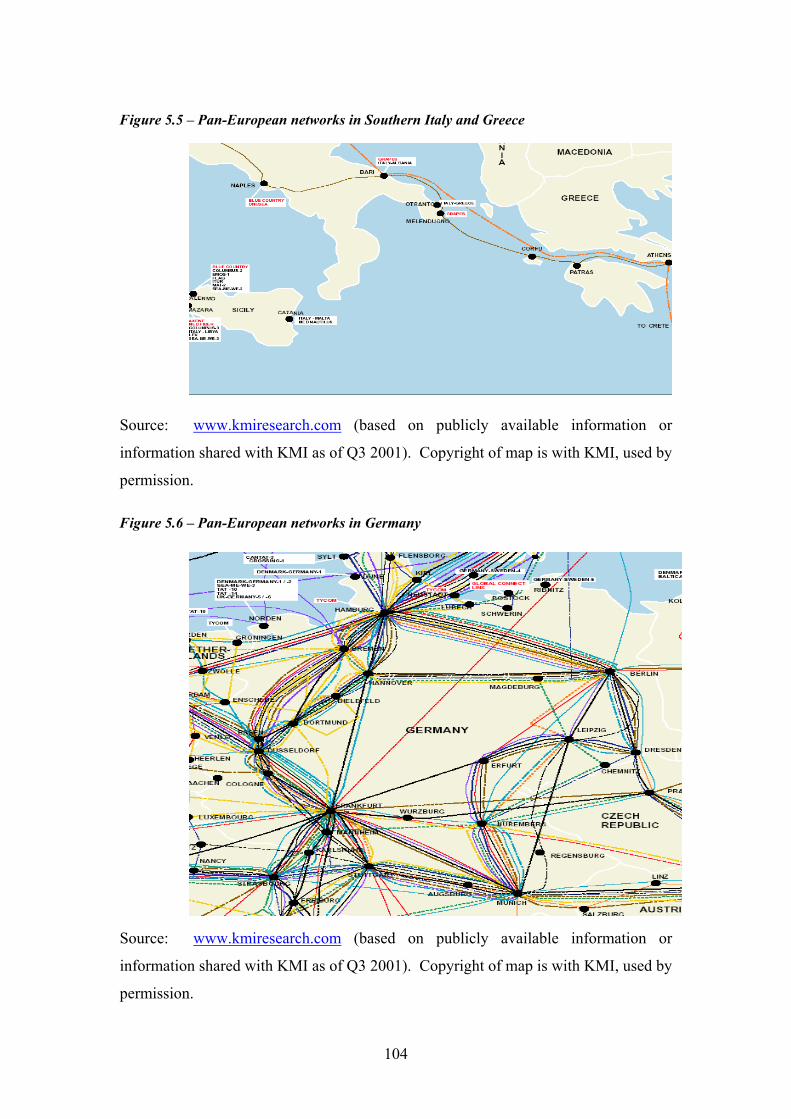
Figure 5.5 – Pan-European networks in Southern Italy and Greece
Source:
informatio
permissio
Figure 5.6
Source:
informatio
permissio
www.kmiresearch.com (based on publicly available information or
n shared with KMI as of Q3 2001). Copyright of map is with KMI, used by
n.
– Pan-European networks in Germany
104
www.kmiresearch.com (based on publicly available information or
n shared with KMI as of Q3 2001). Copyright of map is with KMI, used by
n.

105
• A similar pattern emerges at the national scale, with the primacy of capital
cities, such as London, and other large urban cities and regions, such as Milan,
which host high level functions, set against the paucity of networks in
peripheral regions such as the Highlands of Scotland or the Mezzogiorno.
Germany would be an exception to this as its broad distribution of important
cities across the national territory ensures fuller coverage (see figure 5.6).
This, of course, suggests that new fibre optic telecommunications networks
reinforce existing spatial patterns as companies seek to address large scale
markets hosting large corporate users.
• At a lower territorial level, spatial differences in accessibility of pan-European
telecommunications infrastructure become frequently very stark indeed,
dependent upon the regional presence of an urban node on one or more of
these networks to avoid being subject to the ‘tunnel effect’. The map above
already illustrates how gaping regional holes are left in the pan-European
telecommunications ‘web’ by the deployment of networks along specific city-
to-city infrastructure routes (eg motorways, railways etc) – for example,
central France, central Sweden (see figure 5.7), and even central Germany (see
figure 5.6 above). Other long distance networks might pass through regions,
but without connecting nodes, because they have been customised to link two
particular cities and not the places in between – for example, the Energis
network between Madrid and Stockholm appears to stop only at Frankfurt am
Main, and transatlantic networks being run from the USA into London do not
connect cities in the south of Wales or western England. In this way, they are
more like high speed trains or airline networks in terms of their network
configurations than roads.

Figure 5.7 – Pan-European networks in Sweden
Source: ww
information s
permission.
In addition to
also highligh
particularly a
telecommunic
• Opera
presum
genera
expan
Budap
new in
space
• Some
conne
and G
countr
106
w.kmiresearch.com (based on publicly available information or
hared with KMI as of Q3 2001). Copyright of map is with KMI, used by
these general trends of European territorial ‘divide’, however, we can
t some of the potentially more positive trends which the map shows,
round the notion of a polycentric form of territorial development of
ations:
tors are also investing in cities outside the traditional European core,
ably as they see these cities as new or potential nodes capable of
ting international traffic and perhaps as ‘gateways’ to other parts of the
ded European Union and beyond. Examples of such cities are Prague,
est and Copenhagen (see figure 5.8). Potentially, then these patterns of
vestment may contribute towards the policy goal of a more polycentric
at least at the level of cities.
more regionally focused pan-European networks have concentrated on
cting more peripheral cities, eg. Grapes and Silk Route in southern Italy
reece, Infigate in eastern Europe, and Song (Telel) in the Nordic
ies.
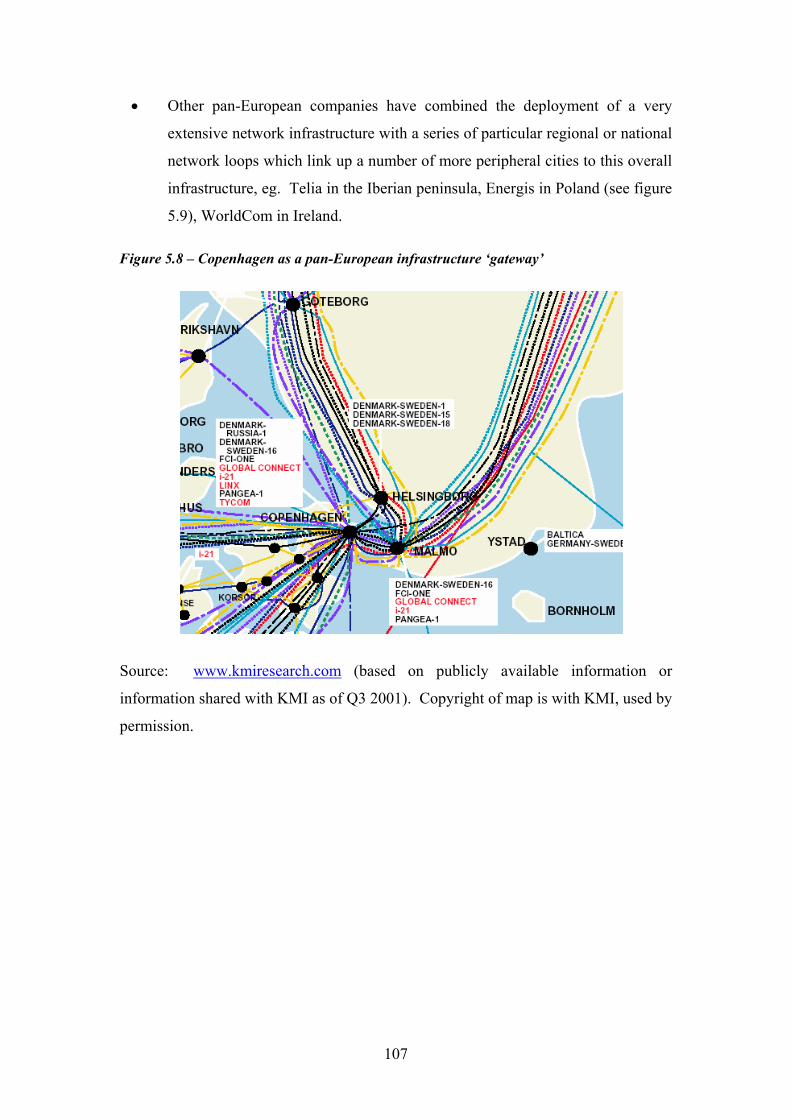
107
• Other pan-European companies have combined the deployment of a very
extensive network infrastructure with a series of particular regional or national
network loops which link up a number of more peripheral cities to this overall
infrastructure, eg. Telia in the Iberian peninsula, Energis in Poland (see figure
5.9), WorldCom in Ireland.
Figure 5.8 – Copenhagen as a pan-European infrastructure ‘gateway’
Source: www.kmiresearch.com (based on publicly available information or
information shared with KMI as of Q3 2001). Copyright of map is with KMI, used by
permission.

Figure 5.9 – The ‘local’ national loop of Energis in Poland
Source:
informa
permiss
108
www.kmiresearch.com (based on publicly available information or
tion shared with KMI as of Q3 2001). Copyright of map is with KMI, used by
ion.

109
Figure 5.10 – Comparing the number of pan-European networks present in FUAs with the
number of inter-city connections from FUAs
0
50
100
150
200
250
0 5 10 15 20 25
No. of networks present
No.
of i
nter
-city
con
nect
ions
Gdansk
Brno
Wuerzburg
Esbjerg
Koeln
Dusseldorf
London
Hamburg
Source: Data from KMI Research map, plotted by CURDS
Figure 5.10 plots the number of pan-European telecommunications networks present
in the FUAs against the number of other places which a particular FUA is connected
to via those networks. As we would expect, the basic pattern is one generally
characterised by the more networks present in a FUA, the more connections to other
places that FUA will have. However, the gradient of the plotted points on the graph
tends to even itself out as we move along the ‘x’ axis, which suggests that FUAs
which are on more networks are only connected to a relatively smaller number of
additional places compared to FUAs on fewer networks. In turn, this suggests firstly
that there are a small number of very extensive pan-European networks which inter-
link a large number of FUAs. This would explain how Gdansk has 119 connections
to other FUAs by being on only 2 of the 27 networks, and Brno has 141 connections
from only 3 networks. Both these FUAs are on the networks of Energis and Telia,
and Brno is also on that of Carrier 1. Secondly, we can also suggest that beyond this

110
small number of extensive networks, there is a larger number of networks which are
either somewhat less extensive or simply replicate the routes followed by other
networks. This would explain why being on the majority of the 27 networks featured
on the KMI map does not lead to a FUA having many more inter-city connections.
For example, while Hamburg and London appear on six or seven times more
networks than Brno, they are linked to only 50 or 60 extra FUAs. In conclusion then,
the density of networks in a FUA does not necessarily appear to closely correlate to
significantly greater territorial connectivity on a wider scale. The differences between
FUAs must therefore emerge in the quality and quantity of network connections
between the same places, ie the number of networks offering the same route and the
amount of overall bandwidth present on that route. These issues will be the focus of
the next sections.
Table 5.1 shows the inter-city connections with the most number of networks passing
along them. We can observe that all the connections take place in a very concentrated
core area which extends no further south than Frankfurt am Main, no further east than
Hamburg, no further west than Paris and no further north than London. The
predominance of large northern and north western German FUAs here stands out,
although the fact that Dusseldorf appears more frequently on these links than
Frankfurt is quite surprising.

111
Table 5.1 – Inter-city connections with most networks along them
Link No of networks on link
Hamburg-Düsseldorf 17
Hamburg-Amsterdam 16
Hamburg-London 16
Düsseldorf-Amsterdam 16
Paris-London 16
Amsterdam-London 16
Bruxelles-Paris 15
Bremen-Hamburg 15
Bremen-Düsseldorf 15
Frankfurt am Main-Düsseldorf 15
Düsseldorf-Paris 15
Düsseldorf-London 15
Paris-Amsterdam 15
Source: www.kmiresearch.com (based on publicly available information or
information shared with KMI as of Q3 2001). Copyright of map is with KMI, used by
permission.
Different territorial peripheralities in telecommunications network provision
The ‘core’ FUAs of Europe tend to exhibit an almost homogenous pattern of
territorial connectivity, with some of them approaching 200 network connections to
other places, and nearly all the others having more than 150 links. There are a few
exceptions – Koeln in Germany has 10 networks passing through it, yet only 139 links
to other FUAs, which actually makes it less linked than Brno and Bratislava. This is
all the more surprising given that Koeln is located in the telecommunications-
intensive core between London, Paris, Frankfurt am Main and Hamburg.
The overall situation is much different though when we analyse our data for more
peripheral FUAs. For example, a Greek or southern Italian city present on 1 or 2
networks is thus only linked to 5 other places, eg Athinai, Patrai, Napoli and Bari.

112
Meanwhile, however, other peripheral cities both in Poland (Bydgoszcz, Krakow,
Rzeszow) and the ‘Celtic fringe’ (Dundalk, Cardiff, Aberdeen, Inverness) are also
only present on 1 network, but that network connects them to 83 other places. We
must clearly, therefore, distinguish both between telecommunications networks in
terms of connectivity and territorial extensiveness (in the first case, the Grapes and
Silk Route networks serving Greece and southern Italy are very limited in extent
compared to the Energis network serving Poland and the ‘Celtic fringe’), and between
peripheral regions across Europe in terms of access to telecommunications
infrastructure as there is evidently more than one form of peripherality in European
telecommunications territoriality.
b) NUTS 2 regions
By re-presenting the data obtained from the KMI map in terms of NUTS 2 regions,
we can create another important perspective on pan-European telecommunications
territoriality. Although the data relates essentially to the territorial extent to which
various networks of (mainly) competitive operators are connecting the urban centres
of Europe, the NUTS 2 regional data and maps provide a crucial snapshot of those
European regions which are benefiting from having a node on these networks, and
conversely those regions which are suffering from pan-European ‘network bypass’.
Some level of regional competitive advantage is more likely to accrue in the first case
(and disadvantages in the second case) as businesses present in ‘noded’ regions will
have a greater possibility of obtaining competitive (in terms of both choice and
reduced costs) broadband service offers, whether it be via leased line or DSL
connections. The fact that alternative non-incumbent broadband infrastructure is
‘noded’ in some regions offers a range of competitive service interconnection
possibilities which may allow competitive services to be extended well beyond the
actual nodes themselves, hence part of the reason for extending the FUA level
analysis of the previous section to analysis of NUTS 2 regions here. Nevertheless, we
emphasise ‘noded’ NUTS 2 regions in particular to distinguish between regions where
pan-European networks connect an urban centre and those regions where these
networks only pass through, without ‘stopping’ so to speak (hence the analogy with
the TGV high speed train). In figure 5.11, the French regions through which a
considerable amount of pan-European infrastructure passes (being on the routes

between the Iberian Peninsula and Paris and Lyon), but they do not have a node on
this infrastructure to provide a level of ‘regional access’ to this alternative set of
network services.
Figure 5.11 – The number of pan-European networks ‘noded’ in NUTS 2 regions
So
Fi
wi
co
Da
113
urce: Data from KMI Research map, analysed and mapped by CURDS
gure 5.11 illustrates primarily a general core-periphery pattern at a European level,
thin the regions which have most networks ‘noded’ in them are to be found in a
ncentrated core area (Hamburg, London, Dusseldorf, Ile de France, Noord-Holland,
rmstradt, Région Bruxelles-Capitale, Oberbayern and Bremen), and the regions

114
which have fewest, or indeed no, ‘noded’ networks are mainly the peripheral regions
of southern and eastern Europe and northern regions of the Nordic countries.
Other relatively well ‘noded’ regions include the major city regions of the Nordic
countries (Stockholm, Oslo og Akershus, Sydsverige, Denmark), and most notably, a
roughly Mediterranean-bordering telecommunications ‘development corridor’
extending from Cataluna through all the regions of southern France to Piemonte and
Lombardia in northern Italy and Région Lémanique and Zurich in Switzerland. This
axis can also be extended up through Alsace and into the German regions of
Karlsruhe, Stuttgart and Mittelfranken, as a number of pan-European operators
already present in the concentrated core area have looked to extend their deployments
towards the south and into the Iberian peninsula. The ‘orienting’ or ‘crossroads’ role
of the Rhône-Alpes region can be highlighted here as, through its main node Lyon,
many pan-European networks are deployed towards southern France, northern Italy
and Spain.
In terms of the ‘polycentrism’ concept, we can suggest that very well or relatively
well ‘noded’ regions are to be found in a reasonably wide territorial distribution,
which includes many core regions clearly (a polycentric territoriality of
telecommunications in the Pentagon appears to be well founded), but also the Iberian
Peninsula (Comunidad de Madrid, Cataluna), the Nordic countries (Stockholm, Oslo,
Denmark) and central Europe (Berlin, Leipzig, Wien). Nevertheless, the relative lack
of well ‘noded’ regions in eastern and south eastern Europe is apparent. Although the
likes of Praha, Bratislavsky Kraj and Kozep-Magyarorszag show signs of beginning
to attract and concentrate pan-European networks (being in the third category), as a
few operators look to serve new, opening markets (using Berlin, Leipzig and Wien as
gateways through which to roll out their infrastructure), the ‘nodedness’ of these
regions remains currently lower than western and north western regions. Depending
on the evolution of the telecommunications market, as eastern European countries
increasingly liberalise their own markets, there may be increased possibilities for pan-
European operators to deploy networks and services there. However, Italy has
liberalised markets, but evidently has only limited attraction for pan-European
infrastructure, as figure 5.11 illustrates that only Piemonte and Lombardia are
relatively well ‘noded’. Beyond this, a kind of ‘shadow effect’ appears to come into

115
operation, as few operators judge it to be worthwhile extending their networks to
central and southern regions. The importance of Milano and Torino as the major
Italian business centres, together with their relative geographical proximity to main
network routes, explains much of this observation.

Figure 5.12 – The number of inter-regional connections via pan-European networks
between ‘noded’ NUTS2 regions
So
Fi
tim
tel
the
mo
116
urce: Data from KMI Research map, analysed and mapped by CURDS
gure 5.12 is a second NUTS2 regional map based on data from the KMI map, this
e of how connected European regions are to each other via ‘noded’ pan-European
ecommunications networks. As we would expect, this map has some similarities to
previous one, because usually the more networks that are ‘noded’ in a region, the
re connections to other regions that region will have. Nevertheless, there are a
117
number of deviations from this broad pattern, which it is particularly interesting to
underline in light of possible polycentric territorial developments, because they show
that even if certain regions do not have a large number of networks nodded in them,
they may still benefit from a territorially extended connectedness if the networks
which they are on highly diffuse. Thus, Praha (6 networks), Bratislavsky Kraj (5) and
Jihovychod (3) may be on fewer networks than, but are still connected to around the
same number of other regions as, Karlsruhe, Languedoc-Roussillon and Koln (all 10
networks). Many of the Polish regions have only 1 network nodded in them, but via
this network they are connected to more than 80 other European regions, which is
more than Picardie which has 4 networks. The major point here then is that
considerations and implications of polycentric telecommunications territoriality
across Europe need to take into account not just the presence, availability or access of
infrastructure networks, but also the territorial extensiveness or diffuseness of the
infrastructure networks nodded in particular regions. A further important measure of
the ‘quality’ of these infrastructure networks, their bandwidth capacities, will be
discussed in the next section.
5.4 A territorial analysis of network capacities between cities and regions in
Europe
In section 5.3.2. of our SIR, we conducted some quite detailed analysis of a map of
terrestrial network bandwidth capacities between European cities produced by the
Telegeography consultancy. This map and the analysis complimented very well the
KMI Research map and analysis which, as above, focused on network presence in
nodes and network connections between nodes. By focusing on the capacities of the
networks deployed between urban nodes across Europe, we can explore a further
layer to the territoriality of pan-European telecommunications networks (beyond
where the networks are and how many of them there are), and more importantly,
begin to bridge the gap between supply and demand trends, as the differing amounts
of demand, particularly from large business users.
From analysis of the Telegeography map, we noted the following important overall
territorial trends, which rather confirmed what we learnt from the KMI map:

118
• The predominance of the core area of the EU (the pentagon) as a cluster of
bandwidth connections/communication corridors (see figure 5.13).
• The most important connections (in terms of bandwidth) are to be found
between the major urban (and business) centres of Europe, thus
telecommunications can be viewed as largely respecting the traditional
European urban hierarchy.
• Both the number of intercity bandwidth connections and the bandwidth
capacity of connections (and therefore overall telecommunications
accessibility) diminish gradually with distance from the core area.
• Peripheral (and/or rural) areas of the ESPON territory have therefore relatively
reduced accessibility to these intercity bandwidth connections (Internet
backbone networks) (see figure 5.14).
• The largest national urban centres concentrate the most intercity bandwidth at
the European level (eg. London, Paris, Madrid).
Figure 5.13 European terrestrial networks in 2002 – ‘core’ area detail
Source: © PriMetrica, Inc., 2003 – http://www.telegeography.com

119
It was, however, possible to identify a number of other possible trends, which might
be viewed as more optimistic for the development of a more polycentric
telecommunications territorial system across Europe:
• The emerging importance of urban centres outside the core area of the EU for
attracting bandwidth connections (eg. Prague, Toulouse, Leipzig, and, to a
slightly lesser extent, Dublin, Oslo). Whilst not yet suggesting any “shake-up
in the urban hierarchy” (Malecki, 2002), these city regions might have the
potential to become viewed as both ‘new network cities’ which surpass some
traditionally larger city regions (Townsend, 2001; Malecki, 2002), and a
crucial part of a more polycentric European urban system.
• Some of these emerging urban centres may be viewed as ‘gateway cities’ for
telecommunications bandwidth connections, in the way in which they act as
links between the core area and more peripheral areas eg. Copenhagen for the
Nordic region, Berlin for Poland, Vienna and Prague for south eastern Europe.
• Smaller urban centres are increasingly connected to the largest European city
regions, which offers access to large capacity global bandwidth connections.
• Some important urban centres in the core area have, for various reasons,
relatively limited bandwidth connections (eg. Essen, Dortmund, Rome).
• Unlike the UK, France, Spain or Italy, Germany has numerous urban centres
with important intercity bandwidth connections (Frankfurt, Dusseldorf,
Cologne, Hamburg, Berlin…), rather than one major centre at which
bandwidth concentrates. The urban bandwidth hierarchy for these German
centres does not strictly respect the national hierarchy either (eg the most
populous urban region Essen has only 1 link to other city regions; Leipzig has
twice as many links as the much larger Mannheim urban region).

120
Figure 5.14 Relatively limited backbone network capacities in eastern Europe
Source: © PriMetrica, Inc., 2003 – http://www.telegeography.com

121
Table 5.2 Major bandwidth routes (4.75-6.5 Gbps)
London-Paris
London-Amsterdam
Frankfurt-Dusseldorf
Frankfurt-Bonn/Cologne
Frankfurt-Mannheim
Dusseldorf-Bonn/Cologne
Dusseldorf-Hamburg
Dusseldorf-Amsterdam
Hamburg-Berlin
Stuttgart-Munich
Hamburg-Copenhagen
Lyon-Marseille
Source: Telegeography Inc. map
Table 5.2 shows the main inter-city bandwidth connections in Europe. This indicates
the total size or capacity of all the networks that have been deployed by telcos
between city regions. They tend to generally confirm the patterns observed earlier in
the context of network connections between city regions. We can note immediately
an overwhelming ‘core’ area dominance, with concentrations between the key
business centres. Within this, the major trend is a German dominance with no fewer
than 7 intra-German routes among the densest in Europe for bandwidth links. Given
this, these inter-city connections tend to be short haul routes as well, as telcos are
evidently keen to maximise bandwidth between important, fairly proximate city
regions, rather than deploy it along longer routes at greater cost and which might risk
remaining under-used.

5.5 The territorial implications of pan-European networks for economic
development
Figure 5.15 – The number of headquarters of the top 1500 European companies present in
NUTS 2 regions
So
Bu
fu
122
urce: Data from Amadeus database, analysed and mapped by CURDS
ilding on our earlier analysis of the population of FUAs, another interesting way of
rther exploring the broader socio-economic context and implications of pan-
Few
Many

123
European telecommunications networks is to investigate the possible correlation
between the locations of these networks and the locations of the headquarters of major
companies in Europe. The latter make up a significant proportion of the clients of
telecommunications companies, frequently accounting in turn for a much vaster
percentage of their revenue than residential and small business users put together. We
have already noted how surveys have shown that the quality of access to high quality
telecommunications infrastructure and services (in terms of cost, competitive choice
and technical capability) is one of the major factors in company locational decisions.
In turn, it is evident that given the vast revenues to be gained from large business
users, telecommunications companies consider the office locations of these users to be
a primary factor in their network and service roll-out strategies. We are not
suggesting a simple one-way causal relationship here between telecommunications
networks and top company locations, but that the inherently relational and mutually
dependent link between the two can shed some further illustrative light on the
territorial implications of telecommunications networks for economic development.
As we argued in our SIR, “the territorial distribution of telecommunications networks
at the European level is at once a presupposition, a medium and an outcome of
complex, intertwined supply and demand-side dynamics. Existing coverage can
determine where further supply is needed and whether demand is generated and
preserved. It can also be seen as the means by which telecommunications services are
supplied and demand is met. In addition, and perhaps most importantly, territorial
distribution is a result of investment decisions taken by suppliers based on market
demand” (1.2.2 SIR, p59).
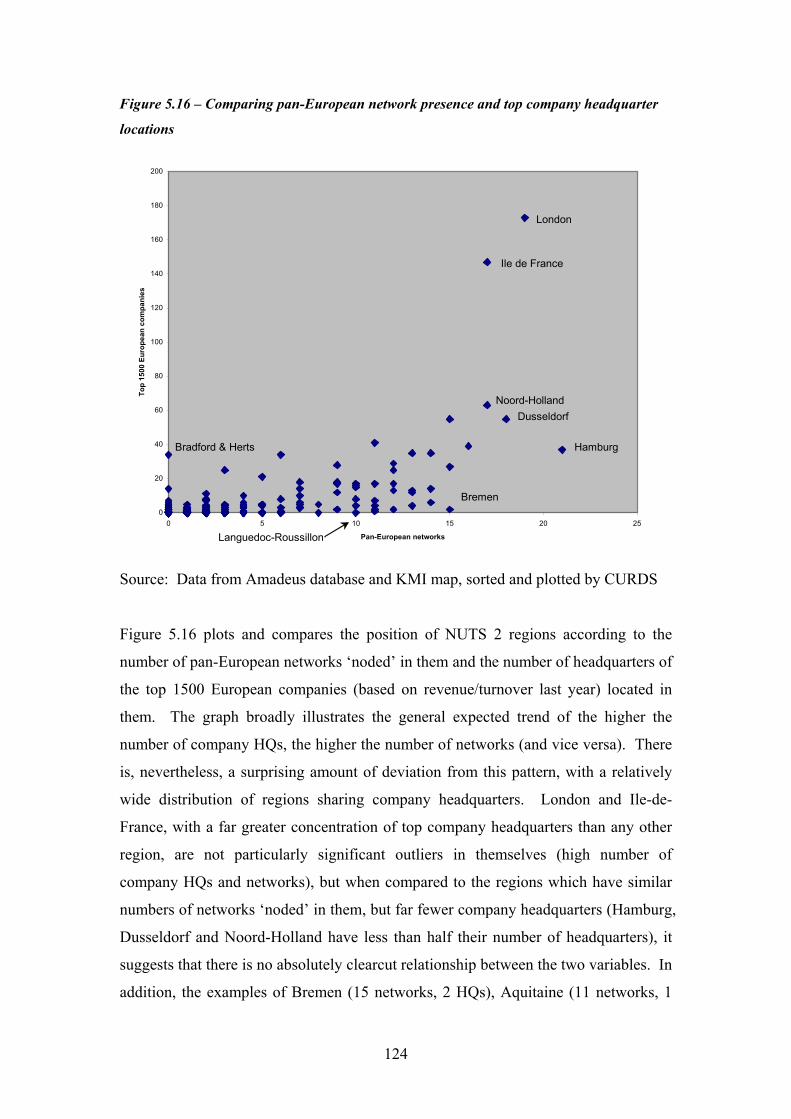
124
Figure 5.16 – Comparing pan-European network presence and top company headquarter
locations
0
20
40
60
80
100
120
140
160
180
200
0 5 10 15 20 25
Pan-European networks
Top
1500
Eur
opea
n co
mpa
nies
London
Ile de France
Noord-HollandDusseldorf
Hamburg
Bremen
Bradford & Herts
Languedoc-Roussillon
Source: Data from Amadeus database and KMI map, sorted and plotted by CURDS
Figure 5.16 plots and compares the position of NUTS 2 regions according to the
number of pan-European networks ‘noded’ in them and the number of headquarters of
the top 1500 European companies (based on revenue/turnover last year) located in
them. The graph broadly illustrates the general expected trend of the higher the
number of company HQs, the higher the number of networks (and vice versa). There
is, nevertheless, a surprising amount of deviation from this pattern, with a relatively
wide distribution of regions sharing company headquarters. London and Ile-de-
France, with a far greater concentration of top company headquarters than any other
region, are not particularly significant outliers in themselves (high number of
company HQs and networks), but when compared to the regions which have similar
numbers of networks ‘noded’ in them, but far fewer company headquarters (Hamburg,
Dusseldorf and Noord-Holland have less than half their number of headquarters), it
suggests that there is no absolutely clearcut relationship between the two variables. In
addition, the examples of Bremen (15 networks, 2 HQs), Aquitaine (11 networks, 1

125
HQ) and Languedoc-Roussillon (10 networks, 0 HQs) suggest that pan-European
networks do not always attract top company HQs to locate in all regions. Conversely,
the example of Bedfordshire and Hertfordshire (34 HQs, 0 networks) suggests that top
companies do not always locate their HQs where they have direct access to pan-
European networks.
Overall, then, as for our network – population analysis earlier, although we can
suggest that there is some level of relationship between the presence of company
headquarters and major telecommunications infrastructure in European regions, we
must underline that it is clear that we cannot consider individual factors such as
headquarters of top European companies as having a major ‘impact’ on
telecommunications territoriality by themselves, but that they must be considered in
parallel with other factors as bound up in the development and implications of pan-
European telecommunications networks for the socio-economic development of the
regions of Europe.

Figure 5.17 – A classification of NUTS 2 regions by top 1500 company headquarters and
pan-European network presence
So
CU
126
urce: Data from Amadeus database and KMI Research, analysed and mapped by
RDS

127
• The above map demonstrates a clearer relationship between company
headquarters and pan-European networks in NUTS 2 regions than the previous
graph.
• The European periphery stands out clearly, with many regions being in the
lowest category signifying that none of the top 1500 company HQs and none
of the major pan-European telecommunications networks are located in them.
• In contrast, the regions which have many HQs and many networks are largely
located in an enlarged European core area, with the exceptions of Madrid,
Denmark, Stockholm and Oslo.
• It is notable that there are a number of German regions with only few HQs and
no networks, in spite of their core or ‘close to core’ location.
• The regions which are classed as having few HQs, but many networks are
clustered around southern France and Cataluna.
• Utrecht has many HQs, but no networks.
• Languedoc-Roussillon has no HQs, but many networks.
• Given that the map shows many regions as having many HQs and many
networks, few HQs and few networks, and no HQs and no networks, this
would suggest that there is a good link between company HQ locations and
network presence in NUTS 2 regions.
5.6 Conclusions
In this chapter, we have focused on some of the major ‘backbone’
telecommunications networks, which offer businesses the fastest, highest-capacity and
most seamless broadband connections available, and are, therefore, important in
linking the European space as a whole, and for the economic competitiveness of
individual cities and regions. Unsurprisingly, the deployment of these infrastructure
networks is strongly related to demand dynamics (hence the relatively close
correlations between population and large company headquarters and presence of
these networks in city nodes). Nevertheless, the territoriality of the development of
these infrastructure networks in Europe appears to have adopted a polycentric form of
development in a number of ways. At one level, although the ‘global cities’ of

128
London and Paris have always been privileged in terms of telecommunications
infrastructure investment (see Rutherford, 2003), some smaller, ‘sub-global’ centres,
such as Hamburg, Dusseldorf and Amsterdam are more or less their equals in terms of
the presence of backbone networks and bandwidth provision. There are also a
number of ‘regional capitals’ emerging in these networks, such as Madrid,
Copenhagen and Vienna, and cities which are acting as ‘gateways’ between national
territories (such as Lyon with respect to France, Italy and Switzerland). Further, the
evidence suggests that, although there are ‘tunnel effects’ with respect to these
backbone networks, there are also many instances of smaller cities along the major
routes being connected.
In the next chapter, we draw out more of the territorial development implications of
the evidence from this chapter within an ESPON and ESDP perspective.

129
Chapter 6: Summary of findings from an ESPON perspective
The aim of this chapter is to provide a brief summary overview of our work to date,
presented in the preceding three chapters, in relation to the key concepts and
typologies which make up an important part of the ESPON research project as a
whole. This meets the suggestions outlined in section 6 of the Crete Guidance Paper
of BBR in June 2003. As we have seen, there are a number of clear patterns or trends
of telecommunications territoriality across Europe bound up with the development of
different types of technology and infrastructure, but given that the majority of these
develop in parallel, both in time and across space, albeit with different levels of
maturity and extent, it is important, particularly from a policy-making viewpoint, to
be able to draw out the main overall macro trends in telecommunications territoriality
and their implications for the promotion of a more cohesive and polycentric form of
European territorial development in the future.
6.1 The territorial dynamics of nodal, network technologies
Telecommunications networks have some distinctive characteristics which influence
strongly their territorial dynamics. Firstly, they are invariably nodal (except for
satellite communications, which is very much a special case in telecommunications),
in that they rely on (usually expensive) fixed pieces of equipment (switches,
exchanges, masts, etc) in order to provide service to a particular area –
telecommunications are never ubiquitously available, therefore, but are based on
particular nodal technologies, which can then connect up customers through wires or
wireless links.29 Secondly, and equally importantly, these nodes are parts of networks,
with their network characteristics applying at different levels; the node has to have a
local access network in order to connect individual users to the node, and the node has
to be connected to other nodes (usually in complex hierarchies involving inter-
connection with other networks) to meet the communications requirements of users.
29 In terms of transport analogies, this nodality of telecommunications networks makes them more like railways than roads, in that they require fixed points of access to the network to be provided, equivalent in this analogy to the station or freight yard.

130
Unlike other network technologies, such as the road or rail system, or energy
distribution networks, all of which are relatively stable and change only slowly and
incrementally, either growing or shrinking over time, telecommunications networks
are considerably more dynamic, fuelled by the rapid pace of technological innovation.
The key dynamic of telecommunications networks, therefore, concerns the roll-out of
new technologies, both within existing networks and in order to launch new networks.
Importantly from an ESPON perspective, network roll-out is an inherently territorial
process, in which new network technologies are deployed over time in a spatially
uneven manner, some areas being early in the ‘roll-out queue’, and others late.
The evidence we have examined in this report suggests there is a distinctive logic or
pattern in the territoriality of network roll-out, explained primarily by the strong
influence of market forces in telecommunications investment. Simply put, the roll-out
of a new network, or of new technology within an existing network, will occur first
where the perceived returns on the investment are greatest, in relation to the costs of
that investment. Practically, this means that this rollout more or less follows the
population distribution of a country, modified by variations in wealth (and hence the
size of the market) and by concentrations of corporate business users, who provide an
important element of most telecommunications operators’ revenues. Thus, usually the
technology is first launched in the biggest cities, due to the concentrated markets they
offer, and is then gradually rolled out down the urban hierarchy. Certainly, from the
findings presented in chapter 4, and particularly the examples of the maps of France,
Italy, the UK, Finland and Hungary, this is very much the pattern for ADSL roll-out.
If we draw a graph of the population coverage of a country over time as a new
network technology is deployed, the basic form of the curve will look akin to that
presented in Figure 6.1. The curve is relatively steep initially, as network nodes are
provided in the largest cities with their sizeable populations. The curve then flattens
out, as subsequent additional nodes will add much smaller increments to the
population coverage. In terms of territorial or regional disparities in the availability of
a network technology, therefore, the tendency will be for regional disparities to be
highest soon after the technology is launched, it being available firstly in only one or a
few cities, and for disparities to then reduce over time as the roll-out process proceeds.

131
It follows that if we look at a technology which has recently been launched, and
compare it with a mature technology, the extent of regional disparity will almost
invariably appear greater with the recent technology. Similarly, if we compare a
recently introduced technology in different countries, it is likely that varying regional
disparities in provision will be apparent which may be explained by them being at
different temporal points on the roll-out curve.
Figure 6.1. The evolution of a technology’s population coverage.
coverage
time
A number of features to do with the intersecting dynamics of markets, costs and
territories will determine the shape of the ‘roll-out curve’ for any particular network
technology. In some, such as curve (a) in Figure 6.2, the curve will be very steep and
will reach a high level of population coverage very quickly. For others, such as curve
(b), the slope of the curve will be less steep, implying a slower roll-out, and may
‘flatten out’ earlier, implying that roll-out slows to a virtual halt with a much lower
level of population coverage. In terms of the networks we have examined earlier in
this report, mobile cellular has had a roll-out curve similar to curve (a), whilst ADSL
appears to be more akin to curve (b).
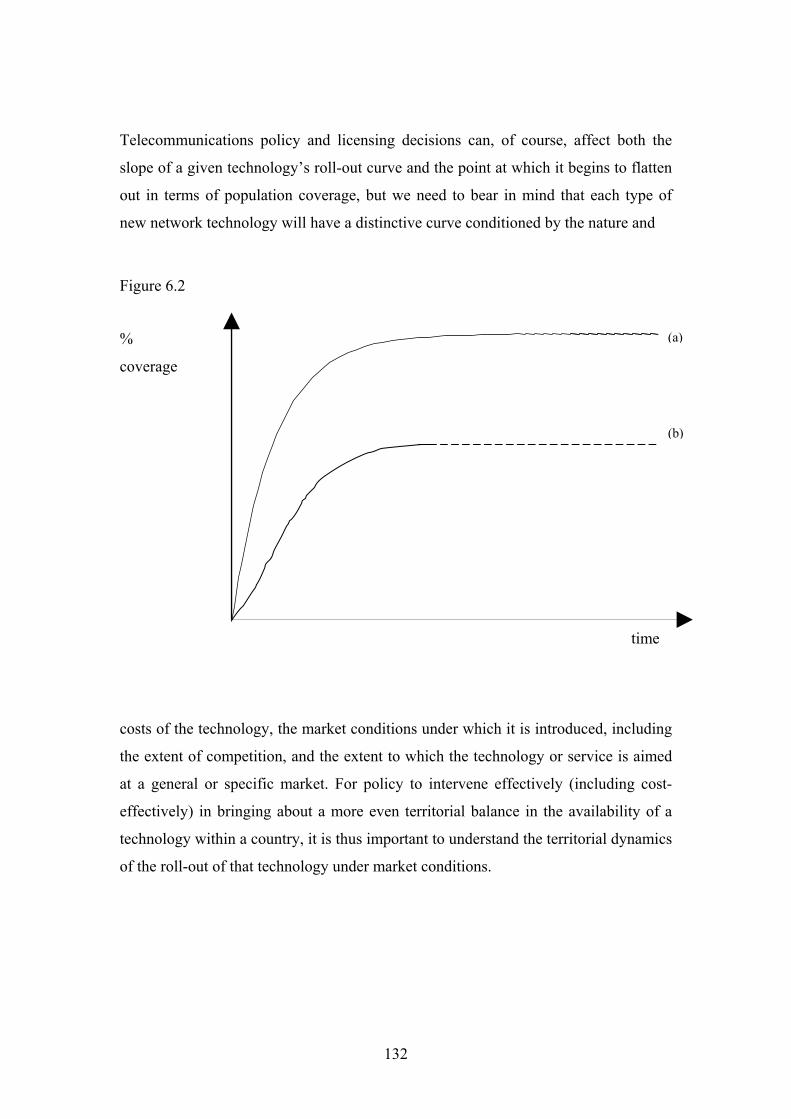
132
Telecommunications policy and licensing decisions can, of course, affect both the
slope of a given technology’s roll-out curve and the point at which it begins to flatten
out in terms of population coverage, but we need to bear in mind that each type of
new network technology will have a distinctive curve conditioned by the nature and
Figure 6.2
costs of the technology, the market conditions under which it is introduced, including
the extent of competition, and the extent to which the technology or service is aimed
at a general or specific market. For policy to intervene effectively (including cost-
effectively) in bringing about a more even territorial balance in the availability of a
technology within a country, it is thus important to understand the territorial dynamics
of the roll-out of that technology under market conditions.
%
coverage
time
(a)
(b)

133
6.2 Explaining sub-national telecommunications territoriality trends:
regulation, geography, culture and institutions
Although in the previous section we have stressed a relatively simple population-
based market logic to explaining the territorial dynamics of telecommunications
provision, there are likely to be a host of parallel and interlinked factors bound up in
patterns of telecommunications territoriality within countries, and the relative
importance of these will differ significantly in each case. The national regulatory
context will be likely to exert a crucial influence, while the specificities of geography,
culture and institutions will also be significant. As the French regulator made clear,
“the key territorial characteristics of France which are important for the promotion of
balanced telecommunications development are the rurality of the country, the
widespread distribution of the population, and the fact that there are over 36,000 local
administrative units” (Guillaume Gibert, ART, personal interview, June 2003). Given
the 4-5 kilometre technical limits for deploying ADSL services (even before the
probable lack of commercial potential is taken into account), the first two factors
explain to a large extent the inherent difficulty (or impossibility?) in achieving
anything like a substantial territorial coverage for broadband using this technology
(thus explaining the increasing interest in and strategies revolving around the use of
wireless and satellite alternatives). In the latter case, multiple government authorities
with differing, but overlapping responsibilities can make it difficult to develop
coherent territorial ICT strategies for areas requiring some form of public sector
intervention: “In administrative terms, one of the problems is that there is a definite
lack of actors to drive strategies and policies along. In other words, between the
régions and the départements, there isn’t really a clear leader in the
telecommunications domain. Maybe the régions can be seen as the major
telecommunications actor, but the division of administrative tasks between the two
levels means that as soon as the development of any policies and strategies touches on
a domain of the départements, for example, schools and colleges (and therefore,
getting broadband into education establishments), it becomes a task for the
départements” (Guillaume Gibert, ART, personal interview, June 2003).

134
It becomes clear that these regulatory, geographical and cultural factors can explain,
to a large extent, territorial differences in telecommunications supply and demand at a
sub-national level, which, if we then consider each national context as a whole, can
begin to suggest reasons for differences between countries. In this way, the macro,
meso and micro level trends in telecommunications territoriality across Europe are
inherently bound up with parallel and overlapping macro, meso and micro level
contexts and factors. In this overarching ‘multiscalar’ perspective, then, just as
regional differences within countries can be partly explained by macro level factors,
so national differences at the European scale can be partly explained by micro level
factors.
6.3 Polycentric development and telecommunications territoriality trends
Although, in theory, telecommunications seem to offer the potential to create a more
balanced European territory, ICT access was one of the six major fields of territorial
disparity identified by the Commission in the introductory speech of Patrick Salez in
Crete. It should, however, be clear from the preceding chapters of this report that
current patterns of telecommunications territoriality across Europe (at macro, meso
and micro scales) offer differing levels of support to the goal of a more balanced,
polycentric form of development. Chapter 5 highlighted that there is perhaps more
evidence for polycentric development at the macro scale than the meso and micro
scales, even if we uncovered some evidence in the latter cases of moves in the right
direction towards a more polycentric form of telecommunications territoriality.
Nevertheless, as was summarised at the beginning of chapter 3, at a European level,
there is evidence of north-south, west-east, EU15-EUCC, and core-periphery divides
in supply and demand for telecommunications networks and services. At a sub-
national level, there are important capital city-rest of country, major cities-other cities
and urban-rural divides.

135
Table 6.1 – Main disparities in supply and demand of TN&S in European space at macro,
meso and micro levels
Spatial level of
analysis
High supply and
demand
Low supply and demand
Macro North South
West East
Core Periphery (but see text)
Capital/major city Rest of country Meso
Urban Rural
Urban Rural hinterland Micro
Urban core Urban periphery
Table 6.1 provides a very rough description of supply and demand for
telecommunications networks and services at three European spatial scales. As with
any model it misses some important nuances. For example, although there is a clear
core-periphery disparity, the Nordic periphery is the most advanced area in Europe, in
terms of provision and take-up. Similarly, though there is a clear West-East disparity
some countries are catching up in respect of newer technologies, notably Estonia and
Slovenia.
Peter Hall has written about how “it is necessary to realise that the central word,
polycentric, needs to be carefully defined: it has a different significance at different
spatial scales and in different geographical contexts” (Hall, 2001, p9). At a European
level, this would mean promoting ‘sub-global’ cities such as Brussels and Frankfurt
rather than ‘global’ cities like London. Other activities could be diffused down to
‘regional capitals’ such as Copenhagen, Rome and Madrid, “each commanding a
significant sector of the European territory” (Hall, 2001, p9). Further down the scale,
polycentricity can also refer to the changing roles of large cities vis-à-vis smaller
cities within their hinterlands, as around London, and then in more peripheral regions,
the key might be to promote the development of ‘regional capitals’ of between
200,000 and 500,000 people or ‘county towns’ with populations of 50,000-200,000

136
(Hall, 2001, p9-10). In this way, the concept of ‘polycentricity’ becomes a pertinent
illustration of the way in which territoriality has become more and more bound up in
parallel and intertwined spatial scales, rather than the traditional distinct hierarchy of
scales that we are used to.
We can suggest that this vision of a parallel and intertwined scalar polycentricity finds
a very good illustration in the deployment of telecommunications infrastructures
across Europe. The spatial organisation of this infrastructure can be viewed as
inherently polycentric in the way in which it focuses on a series of exchanges for the
deployment of local lines and the ‘diffusion’ of services (or base stations in the case
of mobile networks). As we saw in chapters 3 and 4, then, the steady enabling of these
exchanges for the provision of ADSL services by operators within different countries
(even if, as demonstrated in table 4.1, they have concentrated on those of major cities
first) is creating a renewed polycentric broadband territoriality by offering businesses
and consumers access to ADSL services at various ‘equal’ points within a particular
country. The ADSL coverage and population and GDP distribution maps of Finland,
Hungary, France, Italy and the UK (figures 4.7 to 4.11) in chapter 4 provided a good
illustration of this point. Even in Hungary, France and the UK, where capital city
regions concentrate population and GDP, regional ‘pockets’ of relatively high
population and GDP distribution have also driven a good level of ADSL roll-out in
many of these areas, thus supporting the move towards a more polycentric broadband
territoriality. Inversely, in regions with lower population and GDP, such as south west
Italy, the Highlands of Scotland, central rural France and northern Finland, ADSL
coverage is much lower as expected.
In chapter 5, we showed how the broad ‘hub and spoke’ geographies of alternative
backbone infrastructure deployment have a crucial ‘polycentric’ component. For
example, we highlighted the ways in which alternative backbone infrastructures were
increasingly being extended out beyond the European core through ‘gateway cities’
such as Berlin, Vienna and Copenhagen and along ‘development corridors’ to more
peripheral cities, thus offering areas of eastern Europe some level of seamless
connectivity to major nodes acting as ‘global integration zones’, and narrowing, at
least to some extent, the ‘infrastructure gap’. Thus, this increasing multi-nodality of
pan-European telecommunications networks has potentially favourable implications

137
for polycentric development and cohesion through improving territorial connectivity,
which may in turn promote further economic development by offering better
networking possibilities to businesses located in ‘peripheral’ cities. Given then that
these networks are part of the ‘infrastructural foundation’ (cf the motorways or high-
speed train analogy) to the territorial development of telecommunications in Europe,
it is at the very least encouraging that more peripheral cities are increasingly
becoming nodes on these networks. From this, within a polycentric form of
development, the possibility of interconnection with a number of major backbone
networks to provide a relatively diffuse level of territorial connectivity to ‘global’
command and control centres could be expected to drive a certain dynamic of supply
and demand of other networks and services within countries, and the emergence of
sub-national polycentric territorialities of telecommunications development, ie
differing technologies rolled out and taken up in a more balanced regional pattern.
However, the major cities-rest of country and urban-rural divides prevalent
throughout the evidence presented in chapters 3 and 4 suggest that this lower-scaled
polycentrism is rarely taking place so far, as development is concentrating on the
capital city and one or two other major cities at best. This may be a question of time,
however, as in the case of ADSL roll-out, an initially ‘centric’ pattern of operators
focusing on capital cities and one or two other major cities seems to gradually
dissolve into a more balanced version of this lower-scaled polycentrism as a more
substantial number of urban regions are included in ADSL coverage strategies.
Increasing technological maturity appears, therefore, to be highly bound up with
increasing territorial diffusion and possible polycentric forms of development.
On a European scale, however, as we saw in chapters 3 and 4, the fact that EUCCs
such as Estonia and Slovenia are in advance of the UK and France in broadband
technology penetration, and the way in which demand growth in EUCCs in general
appears to be often at least the equal of EU15 for a number of technologies, bodes
well for promoting a more balanced European information society in the near future.
The observation in chapter 3 that ‘mobile telephony appears to break with the
conventional pattern of a rich-poor disparity’ as there are increasingly high levels of
penetration across EUCCs as well as EU15 and in some more remote regions as well
as core regions of Europe, suggests that take-up of this particular technology is

138
already proceeding in a more territorially balanced manner than fixed networks have
done. The regions of southern and eastern European countries have often relatively
similar levels of penetration to Nordic or European core regions. At a sub-national
level, in France, for example, the island region of Corse, not usually a traditionally
dynamic region for telecommunications development, has one of the top three mobile
penetration levels in the whole country. The territorial development of other wireless
technologies such as satellite and wi-fi (as seen in the vignettes of chapter 4) may also
very well promote a more balanced form of telecommunications development, and
facilitate a closing of the ‘infrastructure gap’ by offering broadband solutions to rural
and remote regions where competition in fixed broadband networks is unlikely to
emerge. At least on one level, then, polycentric telecommunications territoriality in
Europe seems to be potentially bound up in the promotion and development of
multiple technological solutions, through which (before cultural and institutional
factors are taken into account) peripheral, rural, less prosperous regions have at least
the opportunity of playing on a relatively level mobile and broadband field with core,
urban and more prosperous regions.
In addition, our analysis of the KMI and Telegeography maps in chapter 5 began to
draw out some of the different territorial dynamics and implications across different
spatial scales as Hall suggests above. It is clear, for example, that while pan-European
telecommunications companies have traditionally viewed the ‘global’ cities of
London and Paris as a crucial territorial foundation to their overall pan-European
strategies, other cities and network links have almost become as important – the ‘sub-
global’ centres of Hamburg, Dusseldorf and Amsterdam are more or less the equals of
London and Paris in terms of network presence, and according to the Telegeography
map, routes such as London-Amsterdam and Dusseldorf-Hamburg have similar
bandwidth provision (4.75-6.5 Gbps) to London-Paris.
Looking at our research, it is possible to identify a number of ‘regional capitals’ in
terms of telecommunications network provision. Madrid, Copenhagen and Vienna, for
example, could all be said to be the leading urban centres for telecommunications in
part of the European territory (Iberian peninsula, Nordic gateway, central Europe and
eastern European gateway respectively).

139
The development of a polycentric form of telecommunications territoriality at lower
levels based around the ‘spheres of influence’ of large cities may be seen to be of two
types. Firstly, the national territorial dominance of cities such as London and Paris has
been such that telecommunications network deployment in the UK and France has
been very much organised in relation to these cities. There is some limited evidence
so far of national territorial polycentricity in telecommunications here – Birmingham,
Manchester and Bristol are all increasingly important centres for telecommunications
concentration, although still in the shadow of the capital, while Lyon, Strasbourg and
Bordeaux have all profited from their ‘gateway’ locations (towards Italy and
Switzerland, Germany, and Spain respectively) to improve their network presence and
connectivities. Secondly, on a finer scale, smaller cities within the wider hinterlands
of these key cities can be seen to have been able to participate in telecommunications
network deployment, eg Reims and Rouen in the Bassin Parisien, and Reading and
Cambridge around London, albeit largely through profiting from their proximate links
to the capital city.
In countries without a real single dominant and influential large city such as Germany,
a more tangible polycentric form of telecommunications territoriality has been able to
develop. For example, many of the most important direct bandwidth connections in
Europe are between German cities according to the Telegeography map, and there are
no less than six German city regions with more than 15 alternative networks present
according to the KMI map (Hamburg, Rhein-Ruhr North, Rhein-Ruhr Middle,
Bremen, Rhein-Main, and Munich). Both the overall centrality of these city regions
and their particular ‘gateway’ locations (eg Hamburg and Bremen link towards
Scandinavia, Munich towards eastern Europe, the Rhein-Ruhr cities towards France
and the Benelux) are principal reasons for the promotion of this polycentricity.
Within this enlarged territorial notion of differing ‘polycentricities’, the concepts of
‘development corridors’ and ‘gateway cities’, also discussed in the ESDP, would
appear to offer some resonance as possible means to promote polycentric forms of
telecommunications territoriality throughout Europe.
Peter Hall talks about ‘development corridors’ from a public transport perspective,
suggesting the need for decentralised ‘clusters of urban developments’ around train
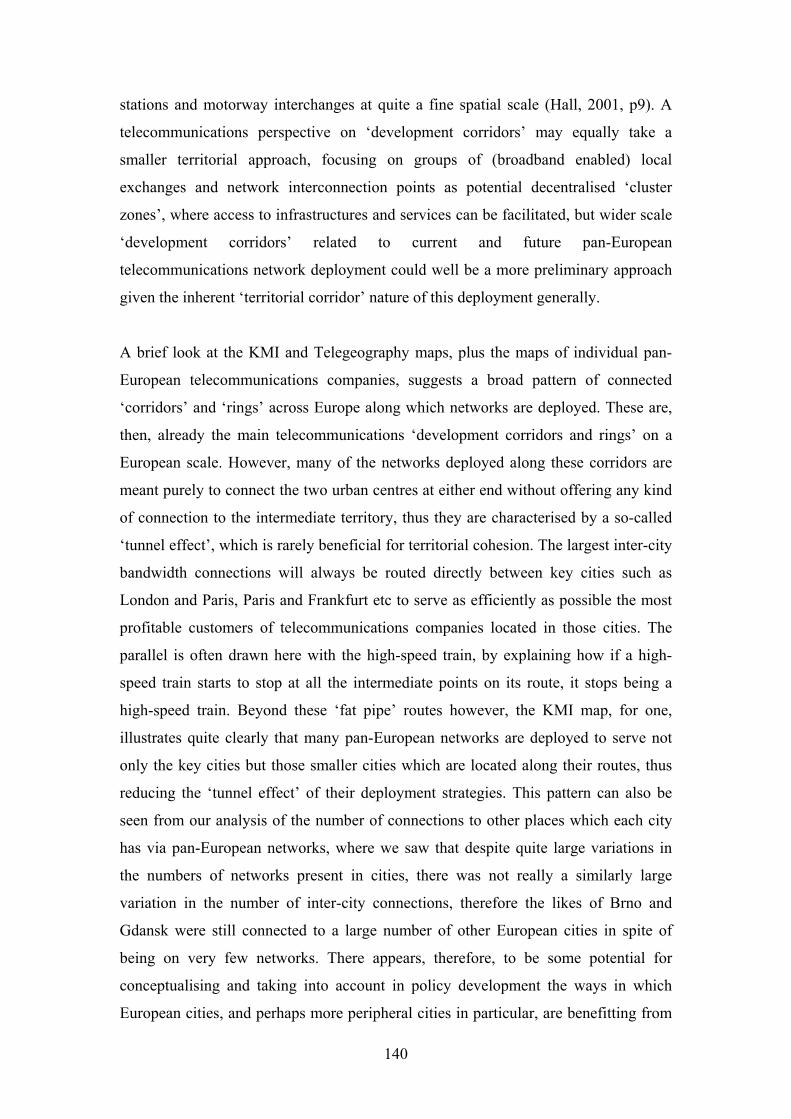
140
stations and motorway interchanges at quite a fine spatial scale (Hall, 2001, p9). A
telecommunications perspective on ‘development corridors’ may equally take a
smaller territorial approach, focusing on groups of (broadband enabled) local
exchanges and network interconnection points as potential decentralised ‘cluster
zones’, where access to infrastructures and services can be facilitated, but wider scale
‘development corridors’ related to current and future pan-European
telecommunications network deployment could well be a more preliminary approach
given the inherent ‘territorial corridor’ nature of this deployment generally.
A brief look at the KMI and Telegeography maps, plus the maps of individual pan-
European telecommunications companies, suggests a broad pattern of connected
‘corridors’ and ‘rings’ across Europe along which networks are deployed. These are,
then, already the main telecommunications ‘development corridors and rings’ on a
European scale. However, many of the networks deployed along these corridors are
meant purely to connect the two urban centres at either end without offering any kind
of connection to the intermediate territory, thus they are characterised by a so-called
‘tunnel effect’, which is rarely beneficial for territorial cohesion. The largest inter-city
bandwidth connections will always be routed directly between key cities such as
London and Paris, Paris and Frankfurt etc to serve as efficiently as possible the most
profitable customers of telecommunications companies located in those cities. The
parallel is often drawn here with the high-speed train, by explaining how if a high-
speed train starts to stop at all the intermediate points on its route, it stops being a
high-speed train. Beyond these ‘fat pipe’ routes however, the KMI map, for one,
illustrates quite clearly that many pan-European networks are deployed to serve not
only the key cities but those smaller cities which are located along their routes, thus
reducing the ‘tunnel effect’ of their deployment strategies. This pattern can also be
seen from our analysis of the number of connections to other places which each city
has via pan-European networks, where we saw that despite quite large variations in
the numbers of networks present in cities, there was not really a similarly large
variation in the number of inter-city connections, therefore the likes of Brno and
Gdansk were still connected to a large number of other European cities in spite of
being on very few networks. There appears, therefore, to be some potential for
conceptualising and taking into account in policy development the ways in which
European cities, and perhaps more peripheral cities in particular, are benefitting from

141
being located along telecommunications network ‘development corridors and rings’.
Being connected via these corridors and rings to many other places is a significant
factor which could promote a more ‘polycentric’ telecommunications territoriality in
the future.
‘Gateway cities’ would also appear to be a key concept for discussion of forms of
‘polycentric’ telecommunications territoriality. In the same way as the ‘polycentricity’
concept itself, ‘gateway city’ must have ‘different significance at different spatial
scales and in different geographical contexts’. London and Paris may be viewed as
networked cities which are on one level ‘gateways’ to the global ‘space of flows’.
Equally, and at the same time, by being the primary focus of important bandwidth
connections to the UK and France, they are the national ‘gateways’ for pan-European
networks to reach other cities in their respective countries. They are also gateways to
their own urban hinterlands and the further development of connectivity of smaller
cities within these hinterlands.
However, the major meaning of ‘gateway cities’ would appear to be at a regional
European level, where certain cities concentrate networks and bandwidth connections
which ‘pass through’ them or are re-routed from them to significant sectors of the
European territory. Copenhagen does this for many of the pan-European networks
which come from Germany and are destined for Nordic countries. Vienna has good
network presence and quite large bandwidth connections because it acts as a
‘gateway’ between the core area of western Europe and the relatively new
telecommunications markets of eastern Europe. Southern French cities such as
Bordeaux and Montpellier must be passed through for those pan-European networks
which have been deployed in Spain and Portugal. This trend has already had
important polycentricity implications because all these ‘gateway cities’ have become
more crucial to the overall functioning and roll-out of pan-European
telecommunications infrastructure than they would have been previously.
In summary, as suggested earlier, the development of telecommunications networks
and services across Europe shows some evidence of taking a polycentric form of
territorial development at macro, meso and micro scales, although this is particularly

142
the case at the macro scale, where more territorially extensive infrastructures have
been deployed by major companies, which, with the inherently nodal or ‘hub and
spoke’ properties of these networks, has promoted polycentricity through the
emerging importance of particular ‘development corridors’ and ‘gateway cities’.
6.4 Typologies of telecommunications territoriality trends
Within the ESPON ‘common platform’, typologies are a means of summarising the
regional disparities for each of the specific themes, in this case of the provision of and
access to telecommunications networks and services. ESPON 1.2.2 has developed 7
typologies in the course of our work. These are listed below, with the number of
categories and the spatial level of each typology shown in brackets:
• Mobile penetration / internet penetration (2x2) (national level)
• Broadband penetration (3) (NUTS 2)
• Introduction of competitive provision (2) (NUTS 2)
• Broadband / introduction of competitive provision (3x3) (NUTS 2)
• Telecoms supply and demand characteristics, based on core/periphery,
urban/rural and core/periphery categorisations (2x2x2) (NUTS 2)
• Network richness (3) (NUTS 2)
• Network richness / head office concentration (3x3) (NUTS 2)
Some of these typologies have been presented earlier in the report, but for
completeness, we reproduce the figures, and their accompanying text, below.
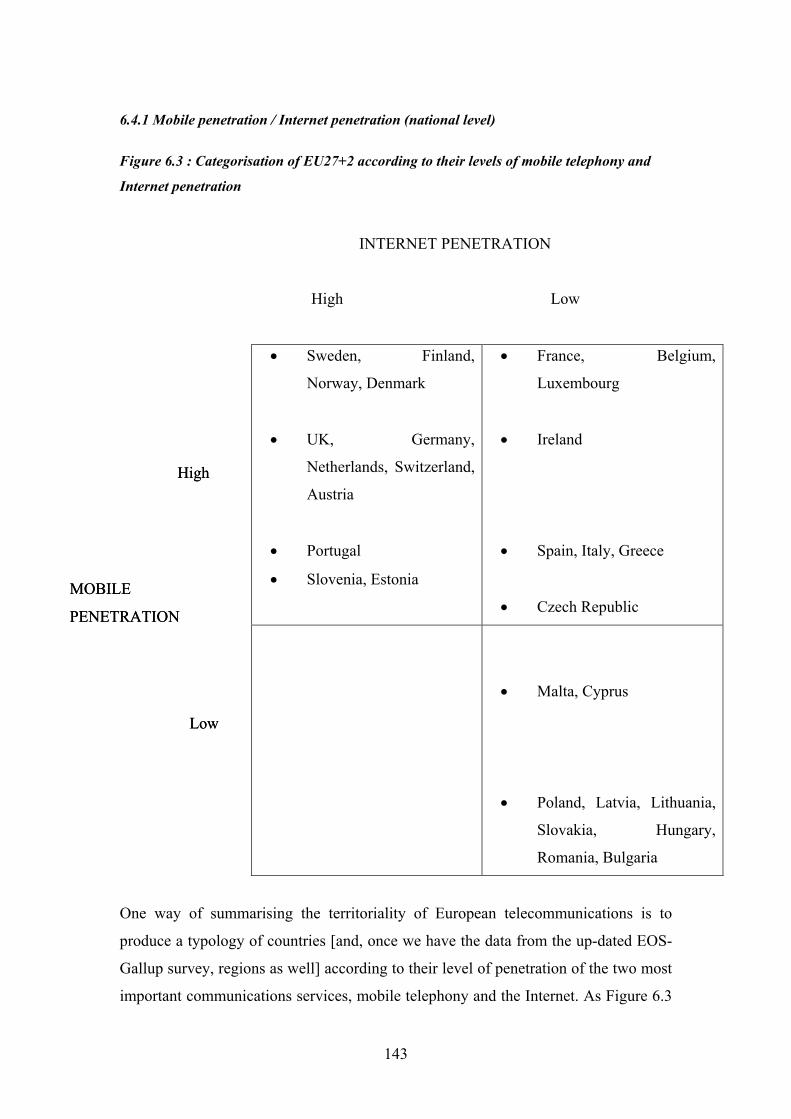
143
6.4.1 Mobile penetration / Internet penetration (national level)
Figure 6.3 : Categorisation of EU27+2 according to their levels of mobile telephony and
Internet penetration
INTERNET PENETRATION
High Low
• Sweden, Finland,
Norway, Denmark
• UK, Germany,
Netherlands, Switzerland,
Austria
• Portugal
• Slovenia, Estonia
• France, Belgium,
Luxembourg
• Ireland
• Spain, Italy, Greece
• Czech Republic
• Malta, Cyprus
• Poland, Latvia, Lithuania,
Slovakia, Hungary,
Romania, Bulgaria
One way of summarising the territoriality of European telecommunications is to
produce a typology of countries [and, once we have the data from the up-dated EOS-
Gallup survey, regions as well] according to their level of penetration of the two most
important communications services, mobile telephony and the Internet. As Figure 6.3
MOBILE
PENETRATION
Low
High
High
MOBILE
PENETRATION
Low

144
shows, a typology of European countries according to whether they are ‘high’ or
‘low’ on mobile and the Internet penetration reveals a clear pattern of variation.
The ‘high-high’ category includes all of the Nordic countries, along with the UK,
Germany, the Netherlands, Switzerland and Austria. Of the Cohesion countries, only
Portugal is represented, while of the EUCCs, both Slovenia and Estonia ‘make the
grade’.
The next category is ‘high’ in terms of mobile penetration, but ‘low’ in terms of the
Internet. The Francophone countries of France, Belgium and Luxembourg are in this
category, as are Spain, Italy, Greece, Ireland and, of the EUCCs, the Czech Republic.
There are no countries which are ‘high’ in terms of Internet penetration and ‘low’ in
terms of mobile; all of the low penetration countries in mobile telephony are also low
in terms of the Internet. None of the EU15 are in this category, but most of the
EUCCs are: Malta, Cyprus (only just in the case of these two), Slovakia, Hungary,
Poland, Latvia, Lithuania, Romania and Bulgaria.

145
6.4.2. Broadband penetration (NUTS 2)
Figure 6.4: A typology of broadband pentration
Figure 6.4 is a map representing the results of a typology of NUTS 2 regions in terms
of likely broadband penetration. In the absence of any available regional broadband
data for European regions, a number of documents including the latest national
broadband figures from ITU and the OECD and the fragmentary evidence from our
Low
High

146
own research in WP3 were considered in an attempt to categorise regions as having
high, medium or low broadband penetration.
Regions with high broadband penetration are concentrated in the Nordic countries,
particularly Sweden and Denmark, the Swiss-Austrian central Europe axis, and in the
Benelux countries. Individual regions correspond to the major metropolitan regions of
Europe (London, Ile-de-France, Comunidad de Madrid, Berlin, Hamburg).
The pattern of regions with low broadband penetration is dominated by the majority
of the eastern Europe / EUCC region (with the exception of Praha, Estonia, Kozep-
Magyarorszag and Slovenia). Southern Europe tends to have low broadband
penetration as well (the whole of Greece, southern Italy, southern Spain and Portugal).
Elsewhere pockets of low broadband appear to correspond with more rural and / or
less prosperous regions of EU15 (Mecklenburg-Vorpommern and Magdeburg in
Germany, Limousin and Auvergne in France, Merseyside, Cornwall, Wales and south
western Scotland in the UK).
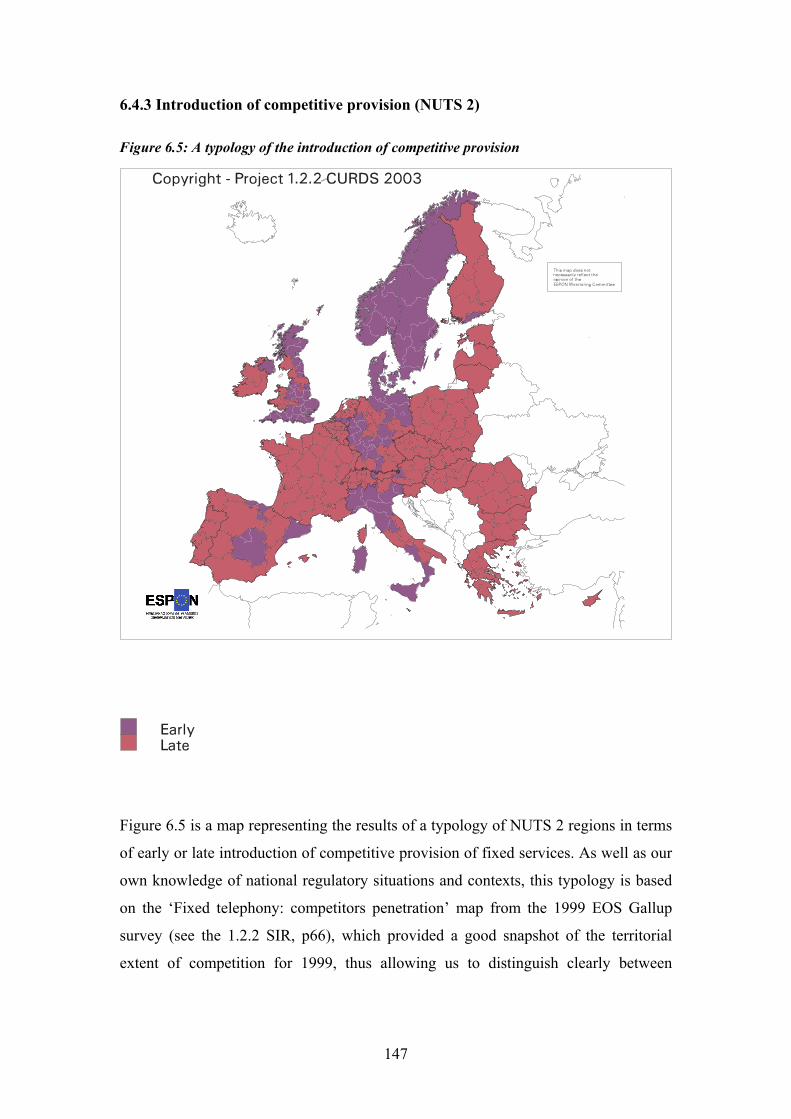
6.4.3 Introduction of competitive provision (NUTS 2)
Figure 6.5: A typology of the introduction of competitive provision
Fig
of
ow
on
sur
ext
147
ure 6.5 is a map representing the results of a typology of NUTS 2 regions in terms
early or late introduction of competitive provision of fixed services. As well as our
n knowledge of national regulatory situations and contexts, this typology is based
the ‘Fixed telephony: competitors penetration’ map from the 1999 EOS Gallup
vey (see the 1.2.2 SIR, p66), which provided a good snapshot of the territorial
ent of competition for 1999, thus allowing us to distinguish clearly between

148
regions which already had a good level of competition at that time (early) and those
which did not (late).
Regions with early introduction of competitive provision correspond strongly with
those countries which opened up fixed markets earlier and most efficiently, hence
much of the UK and nearly all of Nordic countries, and some of Germany, Italy and
Spain dominate here.
Regions with late introduction of competitive provision include all of eastern Europe,
but also French and the majority of Finnish regions stand out here. France was a
notably late liberaliser of markets, and Finland has a very specific local
telecommunications market structure organised around a number of traditional
incumbent providers, which explain their positions in the second category.

6.4.4 Broadband penetration / Introduction of competitive provision (NUTS 2)
Figure 6.6: A typology of broadband penetration/introduction of competitive provision
Fi
rep
pe
Re
do
149
gure 6.6 is the result of a composite typology of the previous two typologies, ie
resenting a classification of NUTS 2 regions based on their levels of broadband
netration and introduction of competitive provision.
gions with high broadband penetration and early competitive provision are
minated by Denmark and Swedish regions where national culture, a dynamic

150
regulatory context and national government policy support has promoted competition
and broadband strongly for a number of years. Other regions in this top category are
major metropolitan regions such as London, Berlin, Hamburg, Dusseldorf and
Comunidad de Madrid.
Regions with high broadband and late competition are mostly clustered in Benelux
regions and the Swiss-Austrian central Europe axis, with Ile-de-France being a
notable exception to this. In these regions, it is evident that competition has either
developed very quickly recently to produce a dynamic broadband market (Ile-de-
France could be explained by this), or has had relatively little influence on the
development of broadband penetration (in which public sector support must be
strong).
Regions with low broadband penetration and early competitive provision have
conversely not seen the benefits of mature liberalised markets diffuse to their
development of broadband. Many of these regions are relatively rural (southern Italy,
La Rioja, Mecklenburg-Vorpommern, Cornwall), suggesting that despite the
regulatory advantage of an open market, operators have not judged it to be
commercially viable enough to roll their broadband services out here due to lack of
demand.
Regions in the lowest category with low broadband and late competition are again
dominated by eastern European regions, although southern European regions (all of
Greece, eastern Italy, the south west part of the Iberian peninsula) and more remote
regions of EU15 (Ireland, Wales, south western Scotland, Limousin, Auvergne) also
appear here. These regions have not benefited, and still are not benefiting, from either
open telecommunications markets or a broadband demand dynamic, suggesting that it
is these regions of Europe in which some form of public intervention is most
necessary in order to stimulate the information society.

6.4.5 Telecoms supply and demand characteristics based on core/periphery,
urban/rural, rich/poor (NUTS 2)
Figure 6.7: A typology of telecoms supply and demand characteristics based on
core/periphery, urban/rural, rich/poor (NUTS 2)
151

152
Table 6.3 – Expected telecommunications supply and demand characteristics for NUTS 2
regions
Core Urban Rich Access to full range of advanced
networks and services driven by strong
market competition and presence of pan-
European operators (fibre MANs)
High levels of uptake, driven by demand
from large companies (leased lines) and
other leading edge consumers
Core Urban Poor Proximity to richer core regions ensures
reasonable availability and choice of
advanced services, but slower uptake
from both business and households
(regions of industrial restructuring)
Core Rural Rich More limited access to advanced
networks and services (eg DSL), mostly
deployed by the incumbent within
technical limits
Still reasonably robust demand and
uptake driven by SMEs, with reasonably
high levels of household demand.
Core Rural Poor Limited availability of more advanced
networks and services, and limited
demand and uptake
Periphery Urban Rich Good levels of competition between
national operators (and some pan-
European companies) promotes access to
advanced networks and services for large
companies, with reasonably high levels of
uptake by SMEs and households
Periphery Urban Poor Deployment of advanced networks and
services limited to incumbent, with slow

153
uptake by SMEs and limited household
demand
Periphery Rural Rich Deployment of advanced networks and
services limited to incumbent and to
urban centres, with reasonable uptake by
SMEs and households (particularly in
Nordic countries)
Periphery Rural Poor Very limited availability of more
advanced networks and services, as even
the incumbent rarely sees it profitable to
roll out in these regions
Very limited demand from business and
households, and very slow uptake of
those services available
Figure 6.7 and Table 6.3 are the results of a typology of NUTS 2 regions attempting
to suggest expected telecommunications supply and demand dynamics based on the
geography and economic performance of these regions (core or periphery, urban or
rural, rich or poor).
The core-periphery classification is based on the location of each region within or
outside of the well-known Pentagon zone, the urban-rural classification is based on
the categorisation of regions by BBR into levels of urban or rural, and the rich-poor
classification is based on GDP data from the BBR database. As we have seen
throughout this report, the urban-rural distinction is particularly important in terms of
telecommunications development (although it might have been preferable to be able
to use a NUTS 3 regional classification rather than NUTS 2). Adding the rich-poor
dichotomy to this allows us to make crucial distinctions between the multiple
‘peripheries’ of the European space with vastly different telecommunications supply
and demand characteristics (rich Nordic regions versus less prosperous southern and
eastern European regions). It is the core-periphery category which, in the domain of
telecommunications territoriality, is most complex and problematic, as we have
already noted earlier in the chapter how it is the northern ‘periphery’ which is most

154
advanced in broadband supply and take-up. Telecommunications territoriality in
Europe suggests both a more extended core area including Denmark, and more of the
UK, northern Italy and France rather than the traditional Pentagon, and multiple
peripheries (northern, southern, eastern).
Nevertheless, taken together, the map of this overall classification and the table
explaining telecommunications supply and demand for each type of region supports
and underlines much of the evidence from the rest of this study. There are evidently
limits to dichotomising the characteristics of European regions in this way, but it is
clear that such geographical and economic characteristics are highly bound up in the
extent and type of supply and demand of telecommunications.
In summary, the map reveals a starkly differentiated territoriality of European
telecommunications. The most dynamic telecommunications environments,
possessing virtuous circles of high quality supply and sophisticated demand,
competing suppliers and multiple backbone networks, are found in the ‘blue banana’
extending from southern England though north-eastern France, the Benelux countries
and Germany to northern Italy (the Core-Urban-Rich category). Similarly high quality
environments, though with perhaps less dense coverage of backbone networks are
found in much of the rest of the UK, south-east France, north-central Italy, and in
major cities such as Madrid, Barcelona and Wien (the Peripheral-Urban-Rich
category).
At the opposite end of the spectrum, the least dynamic telecommunications
environments, with vicious circles of poor supply and limited demand, few
competitive offerings and limited backbone networks, are found in much of the
Iberian peninsular, Greece, parts of Poland, the Czech Republic, Hungary and
Slovakia, most of Romania and Bulgaria, and the Baltic states (the Peripheral-Rural-
Poor category). Similarly under-developed telecommunications environments but
with greater potential for market-led developments due to urban concentration are
found southern-Italy, in Porto and Lisbon, Athens, parts of the former east Germany,
Prague, Bratislava, and a number of Polish regions (the Peripheral-Urban-Poor
category). It is regions in these two categories that are likely to have the strongest
need for structural fund interventions, both to support the deployment of advanced

155
infrastructures (backbone networks, broadband) and to stimulate the demand for
telecommunications, particularly in the business and commerce sectors of the
economy.
Between these two extremes, of particular interest are those peripheral rural regions
which are relatively wealthy, found mainly in the Nordic countries, Scotland, Ireland
and France (the Peripheral-Rural-Rich category). These regions perhaps have made
the most impressive use of telecommunications to overcome or ameliorate problems
of remoteness and low population density; as such they may provide approaches to
infrastructure development or demand stimulation which could provide pointers to
less prosperous regions wishing to move in similar directions. These regions appear to
be innovative both in terms of the deployment of alternative technologies such as
wireless, and in the development of strategies which integrate the information society
with broader development objectives.
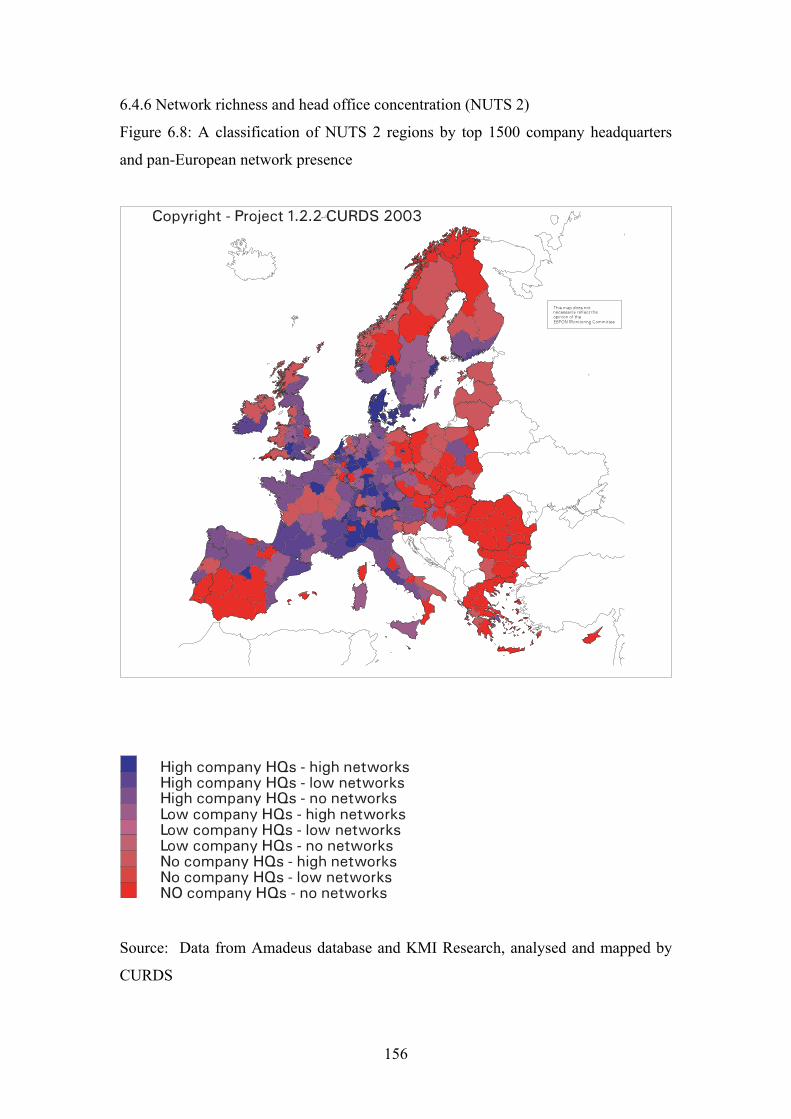
156
6.4.6 Network richness and head office concentration (NUTS 2)
Figure 6.8: A classification of NUTS 2 regions by top 1500 company headquarters
and pan-European network presence
Source: Data from Amadeus database and KMI Research, analysed and mapped by
CURDS

157
Based on the data presented in chapter 5, we developed a simple typology of the
network richness of NUTS 2 regions (with categories of high, low and no networks).
This was then combined with a similar categorisation of head office concentration in
NUTS 2 regions, to create a composite typology of company head offices and
network richness which further explores the relationship between the two variables.
• The above map demonstrates a relatively clear relationship between company
headquarters and pan-European networks in NUTS 2 regions.
• The European periphery stands out clearly, with many regions being in the
lowest category signifying that none of the top 1500 company HQs and none
of the major pan-European telecommunications networks are located in them.
• In contrast, the regions which have many HQs and many networks are largely
located in an enlarged European core area, with the exceptions of Madrid,
Denmark, Stockholm and Oslo.
• It is notable that there are a number of German regions with only few HQs and
no networks, in spite of their core or ‘close to core’ location.
• The regions which are classed as having few HQs, but many networks are
clustered around southern France and Cataluna.
• Utrecht has many HQs, but no networks.
• Languedoc-Roussillon has no HQs, but many networks.
• Given that the map shows many regions as having many HQs and many
networks, few HQs and few networks, and no HQs and no networks, this
would suggest that there is a good link between company HQ locations and
network presence in NUTS 2 regions.
158
Chapter 7: Policy Issues
7.1 Introduction
The evidence presented in this report and in our FIR and SIR clearly demonstrates
differences in terms of supply and demand in TN&S across the European territory.
These divisions can be seen between EU 15 and EUCCs, between existing member
states and between individual EUCCs. These differences can also be seen within
individual countries, that is to say between regions and between urban and rural areas.
Some of these differences will clearly relate to GDP. A CID Harvard study, however,
shows that ‘enabling factors’ are very important as well. In relation to network use,
for example, the report suggests that:
“While income appears to be important in getting a nation to a certain level of
Network Use, after reaching that point, further increases in income are less
relevant and Enabling Factors play the dominant role” (CID-Harvard, 2002).
The CID Harvard report suggests that a complex range of factors, of which physical
infrastructure is only one, account for the take up and use of ICTs and they conclude
that it is difficult to disentangle the individual contributions made by each enabling
factor. This is likely to be true at the regional as well as the national level. This, of
course, has implications for policy. In short, a complex policy response covering a
range of areas from the promotion of human capital to appropriate regulatory regimes
is required. This is increasingly recognised in European policy (see, for example, the
eEurope 2005 Action Plan). We do not address the wider set of policy areas which
will be required if regions and localities are to take full advantage of the Information
Society as this is beyond the brief of this study.
It is also increasingly recognised, however, that places which do not have access to
the latest technologies, particularly broadband technologies, are likely to be at a
disadvantage in accessing the opportunities presented by the Information Society.

159
Consequently, since the late 1990s the question of infrastructure has moved up the
regional development policy agenda and after several years of debate the Commission
appears to have concluded that investment in telecommunications infrastructure
represents a legitimate use of Structural Funds. In July 2003 guidelines were adopted
to aid regions eligible under ERDF who wish to co-finance investments through
structural funds in the electronic communications sector (CEC, 2003a).
In this policy section we concentrate on the question of what steps can be taken to
stimulate the supply and demand of infrastructure and service provision in those areas
which appear to be lagging. We look at four policy areas: in section 7.2 we look at
how the competitive and regulatory environment might be adjusted to be more
sympathetic to territorial development; in section 7.3 we consider how the public
sector can aggregate demand for broadband in order to stimulate rollout in a region; in
section 7.4 we explore ways in which regional and local authorities can create (or be
partners in creating) models of broadband rollout, providing a number of examples of
intervention. In the penultimate section, 7.5, we stress the need for increased
knowledge amongst public authorities in relation to telecommunications networks and
services. Finally, we end with a plea for an improved system of data gathering and
dissemination in respect of telecommunications networks and services.
7.2 The competitive and regulatory environment
In this section we look briefly at some areas in which regulatory environments might
be adjusted to take account of territorial development issues rather than merely
focusing on competition and pricing issues. We look at three policy areas: stimulating
competition in non core parts of the Union, amending the Universal Service Directive
(USD), and adjusting the role of the regulatory authority to enable/require it to take
into account questions of territorial development.

160
7.2.1 Stimulating competition
In a recent report on the development of broadband access in OECD countries, the
OECD suggested that:
The most fundamental policy option open to OECD governments to boost
broadband access is infrastructure competition (OECD, 2001, p4).
There can be little doubt that the opening up of European telecommunications markets
to competition, together with technological advances in the 1980s and 1990s have led
to rapid growth in the availability of telecommunications networks and services.
Competition has clearly had an impact on some parts of the telecommunications
market: for example, competition in the corporate market is intense. Similarly, intense
competition has developed in certain territories, notably capital cities and other major
cities, as new entrants have invested in fixed telephony and cable operators have
provided further competition. Competition in the SME and domestic markets,
however, is still not fully developed in several countries. Competition in localities
where markets are perceived to be small, notably remote and rural areas, but also, in
some cases, peri-urban locations is also muted.
The key question from a regional perspective is how competition can be developed
where there is little appetite amongst the telecommunications providers to address
those markets. Measures adopted by national regulators to date seem to be ‘spatially
blind’ in that the treat the country in question as a single entity and take no account of
territorial differences when considering whether a measure designed to increase
competitiveness is likely to be successful in inducing competition in peripheral
regions. This point can be illustrated by looking at three examples of regulation.
The first point concerns the general question of licenses which (in the case of most
technologies) telecommunications companies require in order to provide services to
businesses and customers. These licenses may allow firms to cover a whole country or
a certain territory within a country. These licences generally contain the provision that
a certain proportion of consumers must be capable of accessing the service within a

161
certain period of time. The proportion of customers to be covered in any given
territory is usually drawn so that the least populous parts of territory are not served,
the target figure being met through serving the more urbanised areas of the territory.
One policy option is to issue licenses conditions which impose more even territorial
coverage. Such a strategy may make sense when the market for licenses is buoyant,
but would be less productive in other circumstances. Furthermore, conditions would
have to be enforced.
The second example is local loop unbundling (LLU). Under a European Directive,
adopted in January 2001, national regulators were required to introduce rules on local
loop unbundling (LLU) to overcome the incumbent’s monopoly of the ‘last mile’30.
This initiative has been judged, by some, to have only had a limited effect due to the
power of the incumbent31 and the failure of regulators to enforce the regulations (see,
for example, OECD 2001; Richardson, 2002). In October 2002 there were just over 1
million unbundled lines in he EU out of a total of 187 million subscriber lines (OECD,
2003). Even were the initiative a success in terms of increasing LLU overall, however,
it is likely that local loop unbundling would take place in those areas which were
adjudged by new entrants to be profitable, that is to say those with dense consumer
and SME populations. It was clear from the interview and survey work carried out
under WP3 of our study that density of population was seen as a key factor in their
investment strategies. It is thus unlikely that LLU will benefit areas currently deprived
of investment, particularly at a time when operators are finding it difficult to justify
capital investment.
The third example is the recent regulation, adopted by several countries, which
requires that incumbents offer wholesale products at reasonable prices to other
providers (i.e., in line with the actual price it offers to its own subsidiaries) such as
resellers and ISPs. Some commentators judge that this approach offers a better
opportunity for new players to enter a market than does LLU, as firms do not have to
30 LLU in EUCC countries is very low, but will become compulsory in some in 2003 (CEC, 2002b), though as in existing member states the attitude of the incumbent will be crucial to its success. In late 2002 three EUCC countries – Czech Republic, Slovakia, Poland – had not introduced LLU (OECD, 2003) 31 Ironically, these incumbents are often new entrants in other countries where they, themselves, are accused of denying access to their competitors.

162
make the same level of capital investment. If properly enforced these new regulations
may provide opportunities for competition in less densely populated areas; for
example, local ISPs may be able to find a market niche, or larger companies may seek
to specialise (or create divisions which specialise) in providing services to less
densely populated or less favoured regions, perhaps in partnership with local
authorities. The problem of market power of incumbents, of course, remains
considerable. The regulator will have the power to ensure that the incumbent does not
charge external customers more for its wholesale products than it does its own
subsidiary. Incumbents have, however, found a number of strategies to retain market
power, including, some allege predatory pricing, thus making it more difficult for
smaller companies to make a profit.
7.2.2 Amending the Universal Service Directive
From a territorial point of view one of the most potentially important European
directives in relation to telecoms is the Universal Service Directive (USD). The USD
lays down minimum requirements for EU Member States (and will also cover EUCCs
on accession). States can go beyond this minimum though there are certain provisos
regarding competition distortion. Our survey and interviews of regulators suggested
that few regulators have actually gone beyond the minimum requirements of the USD.
One goal of the USD is to ensure availability of certain minimum services to citizens
at affordable levels regardless of geographical location. It requires that users should
be provided on request with a connection to the public telephone network at a fixed
location, at an affordable price. The USD, however, relates only to a basic level of
service and requires only a single narrowband network connection. It does not cover
ISDN let alone broadband services. Leased lines are covered by the USD, but again it
is minimum set of services which is mandated. The Union, therefore, effectively
excludes this regulatory tool as a means of achieving the territorial cohesion goals of
its eEurope Action Plan. Revising the USD in the context of rapid technological
change is, of course, not easy: five years ago proponents of raising the service
threshold would have argued for ISDN to be included in the terms of the USD, today
the inclusion of broadband would be the goal. A revision would also have to take into
account the question of technological neutrality. It would also have to cover non-

163
incumbents. An additional complication is whether the same basic levels should be
applied to accession and candidate countries as to current member states. Nevertheless,
a review of the USD, taking more fully into account territorial differences and the
way the market is working in different regions and in different types of place (e.g.,
urban and rural), in the context of rapid technological change should be undertaken.
7.2.3 Requiring the regulator to take greater account of territorial development issues
In addition to considering the USD from a regional perspective there may also be a
need to consider whether and how the policies of the regulator relate (or fail to relate)
to the regional development policies of EU(CC) countries. Generally speaking, the
main concern of telecommunications regulators in Europe appears to be competition
and price control, with the territorial focus being the nation state. Given the
importance of telecommunications to other policy areas it would seem appropriate for
governments to widen their regulators’ brief or to ensure mechanisms for
cooperation/coordination between them and ministries or regional authorities
concerned with territorial development issues. One example of this approach recently
emerged in Ireland. Under the 2002 Communications Act the relevant ministry32 can
issue Ministerial Directions on government policy to the Commission to which it must
have regard. It has been argued that regional development is one such area which
should be taken into account (ComReg, 2003).
Another adjustment of the role of regulators could see them mandated to gather
information on territorial disparities in provision. Regulators collect and publish huge
amounts of valuable information, but in most cases pay little attention to territorial
differences within their countries – for example, which exchanges are ADSL enabled.
There are, of course, questions of commercial sensitivity, but these also apply in areas
where regulators routinely intervene. Regulators should be mandated with collecting
data to show the differential provision of telecommunications networks and services
across territories. This would form a basis on which reasoned public intervention
could be undertaken.
32 Minister for Communications, Marine and Natural Resources.

164
7.3 Aggregation of telecommunications procurement by public (regional) bodies
One approach to stimulating or ‘pulling through’ broadband technologies into a
region or locality is creating a critical mass of users to provide the incentive to
telecommunications companies to provide networks. Regional and local authorities
can act as key players in this process.
In most European regions the public sector is a major economic and social actor and
will therefore have a significant role to play in the stimulation of the information or
‘e’ society. This will be true in all regions of Europe where public authorities (local,
regional and central governments) will be the main players in designing and
delivering eGovernment, eHealth and eLearning which are at the heart of eEurope
2005. In non-core regions of Europe, where the private sector tends to be less strong,
the public sector, through its role as employer, will also have a crucial role in
reorienting the workforce towards the e-economy. This is particularly the case in jobs
associated with the knowledge or information economy, broadly defined, as the public
sector is likely to be the largest employer of ‘white collar’ workers in peripheral areas.
There are examples, both in Europe and elsewhere of regional and local authorities
banding together to jointly procure ICTs, including broadband network capacity. In
Italy the central government has established a system to allow public administrations
to come together to procure broadband, the purpose of which is to “encourage
infrastructure rollout to under-served regions” (Battisti, 2002). It is envisaged that the
initiative will reduce costs and improve the technology available to administrations. In
turn improved technologies should allow customers to access services more easily.
This process, of course, need not result in enhanced capacity in a region or locality
more generally if the aim behind the aggregation is simply cost reduction and
improved capacity for the public sector organisations involved. Ideally, the broadband
aggregation would be complemented by initiatives to organise the private sector
purchasing (particularly SMEs) on the same basis in these regions. The UK
government introducing a system which potentially addresses this issue (Box 7.1)

165
Box 7.1: UK Broadband aggregation project
In the UK, the government has recently established a number of Regional Aggregation Bodies (RAB) to join up individual public sector requirements and present them as one bigger package to the market. The RABs will effectively act as resellers of telecommunications providers’ services and will not own or operate infrastructure. They will initially be publicly funded but the aim is that they become self-funding through the retention of funds derived from reselling. RABs focus is on value for money and maximising broadband for public bodies. The RABs are also allowed to expand into the provision of services for the private sector providing that this is consistent with state aid rules. Decisions on whether or not to offer services to the private sector will be taken at the regional level, through consultation with the relevant Regional Development Agency. It is likely, therefore, that services to the private sector will only be provided in those Regions (or parts of regions) where there is perceived to be gap in provision. Source: Interview with UK Broadband Taskforce representative and information at http://www.broadband.gov.uk/
This process of aggregation has a number of difficulties, even within the public sector.
For example, individual organisations already have contracts with providers which
may run for some time. In countries with weak regional structures key organisations
within a region may well not negotiate contracts locally, but on a national basis. They
may, therefore, see little advantage (in commercial terms or ‘best value’ terms) in
joining the purchasing consortium. There are also questions relating to the balance of
political power within regions with complex territorial structures. For example, in a
region dominated by urban areas will the urban authorities be sensitive to the
differential requirements of rural areas? Despite these reservations, the aggregation of
telecommunications at a regional level, with the participation of national players
located in the region, and with the political will from national or regional
governments to ensure the success of the process, could lead to significant cost
savings through economies of scale. These savings could, in turn, be redirected to
stimulate supply and demand in parts of the region where the market has failed to
deliver in respect of telecommunications.
Another area in which the public sector, or indeed community groups, can aggregate
demand is through coordinating or articulating responses to exchange activation
registration schemes. Several European telecommunications providers now set targets
for the number of potential customers which are required in order for them to invest in
upgrading exchanges to ADSL standard. Individuals or businesses who wish to obtain
ADSL services register with the company and once the number of people registered

166
hits the company’s target the exchange is enabled. Local authorities and community
groups could play a role in awareness raising and encouraging individuals and
businesses to register.
Finally, regional authorities and particularly local authorities in territories which are
sparsely populated may wish to aggregate demand at certain access points in order to
justify investment in infrastructure. These hot-spots can include schools (our research
suggests that ‘wiring’ is a priority in most countries) business centres and community
centres. There are already numerous examples of these activities across Europe, many
of which have been part-funded by Structural Funds. In the EUCCs private sector
involvement in telecentres and PIAPs seems to be emerging. In Hungary, for example,
as a result of co-operation between the civil, private sectors and the Hungarian State,
as well as significant foreign donation, since the success of a local grass-roots
initiative in 1994, telecentres (or “telecottages”) have been mushrooming throughout
Hungary (see Box 7.2).
Box 7.2: Telecentres in Rural Hungary
Over the last few years a large number of telecentres have been created in Hungary with the aim of supporting rural, disadvantaged localities with the provision of ICTs, linked services and training. The majority of telecentres have sprung up in small villages clearly need such institutions. The most dense coverage of telecentres is in western and south-western parts of the country (Southern Transdanubia) which are the most rural parts of the country and whose settlement patterns are characterised by “micro-sized” villages and are thus expensive places in which to invest in telecommunications infrastructure. To some extent, the telecottage movement seems to have been successful in compensating for the lack of interest in the region on the part of major ICT suppliers, yet the lack of advanced technologies in their locations is a drawback to the telecentres as well.
The key issue is how these sites – whether they be telecentres, electronic business
centres, or public internet access points – can be utilised by the wider community and
not just certain segments. For example, the conditions attached to funding streams for
ICTs in schools can mean that the local community is not able to use them. Similarly,
ICT hot-spots created primarily for business users will often not be made accessible to
community groups because of concerns over security of data. There is a need to have
a more ‘joined-up’ approach to these developments so that communities can gain
maximum access to the scarce technological resources. Further research is required in
this area.

167
7.4 Examples of forms of intervention of by regional and local authorities in
creating broadband networks and services
7.4.1 Direct public subsidies to telecommunication providers
Direct subsidy to individual telecommunications providers remains an option of
policy makers. A well known example of this in a rural region was in the Highlands
and Islands of Scotland. More recently Cornwall in the UK has had several exchanges
upgraded as a result of subsidy to the incumbent provider BT. This involved European
Structural Funds. In France in the realm of mobile network coverage, the government
has decided to offer support for operator investment in the construction of base
stations, with the aim of ensuring complete national coverage of all permanently and
semi-permanently inhabited zones and transport routes within three years.
7.4.2 Public partnerships with telecommunications providers
It has been suggested that infrastructure providers should enter into longer term
partnerships with local authorities (Luger et al, 2002). It is argued that public officials
and users cannot be expected to have the knowledge of telecommunications required
to integrate ICTs into their planning process and that ICT providers should contribute
to this process. A recent study of the relationship between ICT and spatial planning in
Europe also suggested that there was a lack of knowledge, and indeed interest, in the
planning community (ASPECT, 2001), beyond a limited group of leading planning
authorities. The notion that the spatial development community should draw on the
expertise of infrastructure providers is, therefore, a sound one. In practice, however,
this approach is not without problems. There are questions as to which providers
should be involved and what role they should have. There is a danger that an advisory
body becomes a lobbying tool for the common interest of telecoms providers. If only
a few telcos (or only one in a particular region) take part there is the danger that some
technologies are promoted over others, thus undermining the notion of technological
neutrality. Further, it has been suggested that larger telecoms companies tend to
attempt to sell one-size fits all systems and technologies which do not necessarily

168
meet the requirements of particular organisations or regions. Planning authorities need,
therefore, to retain the flexibility to utilise smaller alternative providers when
necessary. So whilst we agree that a cooperative approach between regional (and
indeed local and national) authorities and telecoms providers should be welcomed, we
believe that the public authorities, themselves, need to become more knowledgeable
about TN&S as a basis of entering into such partnerships. The crucial point for
authorities forming relationships with infrastructure providers is that, in addition to
delivering technology, the relationship should provide the authority to garner
expertise in respect of ICT networks and services. We return to this question in
section 7.6.
In addition to telecommunications companies public-private partnerships can also
involve private companies based in a particular region, this has the advantage of
creating a guaranteed market for the technology. Box 7.3 provides an example of one
such partnership in a peripheral and rural area of Europe.
Box 7.3: Castres Mazamet: broadband via a public-private partnership
The rural agglomeration of Castres Mazamet in the south western French region of Midi-Pyrenées inaugurated a fibre optic broadband network in 1998 to be accessible to businesses, the public and local authorities. A public-private partnership was created between the various local communes, the Caisse des Dépôts, one of the major enterprises located there, and a dozen or so SMEs. The subsequent 70 kilometre ‘metropolitan’ dark fibre network and teleport interconnection to link to backbone networks are open to operators and service providers. The investment for this infrastructure was partly provided by the Region, the state and the European Union. Since this initiative, it is held that competition in the local broadband telecommunications market has increased, and that ‘the image and the attractiveness of the territory have been boosted’ with 112 ICT sector jobs created in just over a year. Source: Observatoire des Télécommunications dans la Ville – http://www.telecomville.org
The private sector has also been involved in developments in Lithuania. Here the
impetus actually came from the private sector, albeit in the context of a national
information or knowledge society strategy having been articulated by central
government (see Box 7.4).

169
Box 7.4: Private driven public-private initiative – PIAPs in Lithuania
The ‘Window to the future’ initiative was launched in 2002 by the countries biggest telecommunications providers, together with two banks and two IT companies. These companies have entered into partnerships with a number of municipalities and communes to stimulate Internet uptake. It was acknowledged that Lithuania had made great strides in rolling out networks (it is claimed that 80% of fixed network subscribers can access ADSL), but that Internet penetration rates were low. So, the technology was largely in place, there were barriers to its usage in respect of the Internet. These were identified as: (lack of) affordability, awareness and motivation in the less well educated and lower income groups in Lithuania. A three phase plan was developed: to establish Public Internet Access Points (PIAPs), train new Internet users, and, develop new relevant e-content. The PIAPs are reported to be very popular and are oversubscribed. Some communes have plans to extend existing PIAPs or to create others. The project aims to open 1000 PIAPs by 2005, using private state and EU funds. Source:www.helsinkikef.org/.../a87216857c6755b685256ce0006c95e6/ $FILE/lithuania%20case%2010.doc
7.4.3 Public construction and/or ownership of networks
There is increasing evidence that national governments in Europe are prepared to
intervene or permit intervention by regional or local authorities in order to overcome a
perceived failure to invest by the private sector. In France, for example, the previously
restrictive conditions under which local authorities could intervene in the
telecommunications sector have been eased to allow the public construction of
broadband infrastructure networks where necessary (see box 7.5 below for an
example). The government fixed 2005 as the date by which access to broadband
networks for all at a reasonable cost should be achieved. The state bank, the Caisse
des Dépôts et Consignations, was given the task of assisting territorial authorities in
their projects of infrastructure deployment, with a budget of 1.5 billion francs over 5
years. In addition, the national electricity grid network of RTE has been opened to the
deployment of fibre optic infrastructures in order to serve peripheral zones, which
also has the advantage of reducing engineering costs as the fibres are laid along the
electricity lines in the air rather than in ducts under the ground.

170
Box 7.5 Ariège – the first French departmental council to become an operator?
The Conseil Général of the department of Ariège in the south west of France partly in the Pyrenees looks like becoming the first French local authority to take on the status of a telecommunications operator when the new ‘digital economy’ law comes into effect. The department is peripheral, rural and mountainous, and has a population density of only 27 inhabitants per kilometre squared. The authority has realised that competitive broadband offers are highly unlikely to develop on its territory: “Instead of waiting for an offer, we’re creating the need, by starting from the five ADSL plaques of France Télécom, beginning with schools (which is also a political choice) and then towards economic activity zones” (Jean-Louis Vigneau, quoted in La Gazette des Communes, 6 January 2003). Investing around 25 million euros, and having sought the advice of the French regulator and the Caisse des Dépôts, the authority plans to deploy its own network as soon as there are sufficient numbers of users: “it will aim for maximum territorial coverage over 8 years, making use of technologies adapted to the geography of the department: fibre optics, wi-fi from local loops, or satellite” (La Gazette des Communes, 6 January 2003).
The construction of municipal networks is well established in another member state,
Sweden. Here municipal authorities build a dark fibre network as a public utility with
the intention of leasing it to potential users and network builders. Private companies
light the fibre. The best known example of this is the Stokab fibre-optic network in
Stockholm (see box 7.6). The Stokab example is the most advanced in Sweden but the
approach has become common in Sweden with 173 out of total of 289 communities
having such a network 33 and the Swedish Urban Network Association has been
established in order to facilitate cooperation. One example of this approach in a more
rural area is Project Norrsken which covers seven counties which strives to offer
smaller regions the same communication capacities as in the big cities and ultimately
links to Stokab34.
33 http://gigaman.gigaport.nl/en_stokab.html 34 http://english.gavleregionen.com/focus/broadband.regnet.aspx

171
Box 7.6: A publicly owned network – Stokab ‘dark fibre’ network.
Construction of the Stokab fibre-optic network commenced in 1994. The network is owned and managed by a company wholly owned by Stockholm City Council. Stokab provides ‘dark fibre’, thus providing an open infrastructure to private sector telecommunications operators to light the fibre and provide data services to companies and to end consumers. Clients (private sector, public sector and voluntary sector) are connected by Stokab, but must find their own provider of data services (though Stokab will provide a list of companies providing such services). It is argued that this approach allows firms to enter the market without the heavy investment required in laying fibre optic cables and a number of major telcos including Cable and Wireless, Vodafone, BT Ignite, as well as Swedish incumbent Telia use the network. Stokab provides data transfer only on its own behalf and for a network of several municipal organisations. The network mainly utilises existing ducts and other networks, such as railways. Around 80 per cent of customers are in the private sector. The network has grown since 1994, to around 4000 kilometres in 2002, to cover most of the Greater Stockholm, including the larger islands in the Stockholm archipelago. It is now being extended beyond Sweden to the Baltic port of Ventspils in Latvia. Source: information from Stokab; http://gigaman.gigaport.nl/en_stokab.html; http://english.gavleregionen.com/focus/broadband.regnet.aspx.
The Swedish model has been particularly influential. Austria’s telecoms regulator
RTR broadband ‘status report’, for example, identifies the Swedish broadband
strategy as a role model. It has also been influential in Ireland. The case of Ireland is
interesting in that Structural Funds have been used to build a broadband network. The
National Development Plan for 2000-2006 allowed €200 million to spend on
broadband infrastructure, including €90 million ERDF money. As part of this €60
million was committed to support the construction of a Metropolitan Area Network
(MAN) in selected provincial cities and towns across Ireland. As a result of
difficulties being experienced by telecommunications companies the public sector
became more heavily involved. Local and regional authorities were grant aided to put
in place broadband networks. It is envisaged that the infrastructure will be owned by
the local authorities on behalf of the state, while marketing, management and
maintenance of these infrastructures will be undertaken by a Managed Services Entity
(MSE), which will administer access to the networks on a carrier-neutral and open
access basis.

172
7.4.4 Creating a permissive land planning environment
One approach which involves a lighter touch and perhaps less public expenditure is to
create a more permissive planning regime – for example, in respect of mast and
antenna siting – to enable companies to pilot particular technologies. This approach,
of course, potentially raises environmental questions and the opportunities and costs
would have to be explained to the community in question. An example of this
approach is the Ayuntamiento de Zamora in Spain, which formed a test bed for a
Wireless Local Area Network (WLAN) (see box 7.7).
Box 7.7: Permissive Planning Regime – Zamora Wireless City
In June 2002 a small Spanish private sector network operator called Wireless and Satellite Networks (WSN) set up a pilot project in Zamora, a town of around 70,000 people, in Castilla y Leon in Spain, to deliver WiFi broadband services to consumers. Until now WiFi has been generally used in offices and, more recently, at service ‘hot spots’ in densely populated areas or at transport hubs, such as airports. This project aims to ‘wire’ an entire town. The service, known as Afitel, provides Internet access in a similar way to a traditional ISP, but WSN also provides the means of accessing the network through its access points. These act as a substitute for the dial-up phone lines, modems and other telecoms infrastructure which would normally be used. Two hundred access points were created using Intel technology. The service was aimed at those who did not have Internet access or had only slow dial-up access. Local government has provided strong support and encouragement. Importantly, it has granted permission for WSN to site more than 250 white antennas which relay wireless signals from the backbone connection. Source: eris@ (2003): Wall Street Journal Online (http://www.afitel.com/espanol/prensa/wallsj.htm); Intel: http://www.intel.com/ebusiness/pdf/notebook/W_CS_Zamora.pdf)
7.5 Establishing greater symmetry of knowledge between public authorities
and telecommunications providers
A clear message which emerges from our recent research is the need for greater
symmetry of knowledge between the public and private sector in the area of
telecommunications. This is true at European, national, regional and local level. It is
also true regardless of the particular policies adopted from the policy menu, unless a
decision is made to leave everything to the market. Each member state (and the
accession and candidate countries) will have its own government structures, including

173
regional and local governance structures. The relationship between the
telecommunications providers and government agencies will also differ between
countries. In these circumstances it is perhaps unwise to be prescriptive about how
expertise is to be garnered or utilised. One approach would be to create a multi-
layered system, acting in a coordinated manner, with varying degrees of expertise
resting in different layers. At the regional level a regional telecommunications plan,
with a “regional telecommunications directory” to act as a policy and implementation
policy unit, might be established. Such a unit could call upon expertise at the national
or even European level, thus avoiding the replication of expertise on all aspects of
telecommunications in all regions. Regardless of particular structures, however, a
number of requirements can be identified. These include:
• A better system of collecting and disseminating information and data about the
territorial aspects of telecommunications. This requires a common approach so
that decisions on public interventions can be transparent. This should be
coordinated at the European level, though the onus would be on national
statistical agencies and/or regulators to collect the regional and sub-regional
data. This would allow informed judgement in forming regional policy;
• Knowledge of the technical aspects of telecommunications. The examples
provided in the preceding sections and also in Chapter 3 of the report
illustrates that there are a number of technologies which can be used to deliver
broadband networks and services. The environment, in terms of technological
change, is evolving rapidly, even if the commercial development of services
cannot always keep pace. This diversity is recognised and the benefits of
fostering diversity is recognised in the eEurope 2005 Action Plan and also in
the recent Communication ‘Electronic Communications: the Road to the
Knowledge Economy’ (CEC, 2003b). Planning and development authorities
need to be aware of the range of technologies available and to be able to
decide which of these are appropriate for particular circumstances. A regional
fibre ring might best be complemented by ADSL in some parts of a territory
while a wireless solution will be more appropriate in others. An ability to plan
appropriate technological solutions (in a flexible way) for all parts of a

174
territory, either in-house or through an outside systems-integrator, is essential.
Another benefit of being aware of the various technologies available and their
potential is that an informed decision can be made whether to invite or
encourage providers to use a territory for experimental or pilot projects;
• Knowledge of the regulatory aspects of telecommunications;
• Intelligence of the situation within a region regarding deployment of
technologies and pilots to stimulate supply and demand. This would involve
establishing a database of initiatives and pilots. Often these are publicly–
funded but no record is kept and there is no check on outcomes. A new
approach is required to avoid duplication and to exchange best practice.
Intelligence could also be exchanged between regions.
7.6 Development of common indicators and improved and standardised
collection data with a regional focus
Finally, it has become clear from our study to date that there is paucity of data on ICT
from a regional perspective. It is particularly disturbing that the Union, whilst
recognising the importance of the regional question in the eEurope Action Plan 2005
has developed a minimalist approach to benchmarking this aspect of the plan.
Initiatives are underway within FP5, including BISER and NEsis35, are attempting to
establish common indicators for data collection at the regional level. Attempts to
establish regional ICT indicators are also being developed by networks of regions.
There is need to ensure that these processes are integrated, that outcomes are agreed
and that standards are implemented. There is a need to, then, mainstream these
regional ICT indicators and data collection procedures within the European and
national statistical collection processes, as is currently being done in respect of
national indicators.36 At present the amount of data collected by national statistical
offices, the indicators used, and the territorial levels for which data is collected or can
be disaggregated varies considerably. Most collect only at the national level or at the
35 BISER is an acronym for Benchmarking the Information Society: e-Europe Indicators for European Regions. NEsis is an acronym for New Economy Statistical Information Society. 36 For example the E-Commerce in Europe pilot surveys carried out in 2001 by national statistical institutes co-ordinated by Eurostat using a common methodology.

175
level immediately below the national level, providing a very poor basis for informed
policy-making with respect to regional telecommunications.
176
References
AMADEUS database, available at http://amadeus.bvdep.com/
Autorité de Régulation des Télécommunications (2003) ‘L’Observatoire des Mobiles:
Analyse des taux de pénétration par région’, May 2003, available at http://www.art-
telecom.fr
ASPECT (2001) Analysis of Spatial Planning and Emerging Communications
Technologies. Final Synthesis Report. Available at http://www.region-
numerique.org/aspect
Battisti, D. (2002) ‘Demand aggregation to encourage infrastructure rollout to under-
served regions’. Paper presented at the Public Sector Broadband Procurement
Workshop, WPIE/OECD, Paris 4th December 2002.
BISER (2002) “Benchmarking the Information Society: e-Europe Indicators for
European Regions” IST-2000-30187. D1.1, D1.3, D2.2
Broadband Stakeholder Group website, available at http://www.broadbanduk.org/
CEC (2000) “The situation of telecommunications services in the regions of the
European Union: Residential Survey”. Report prepared for DG Information Society
by EOS Gallup
CEC (2002a) eEurope 2005: An information society for all. Brussels, 28.5.2002:
COM (2002) 263 final.
CEC (2002b) 2nd Report on Monitoring of EU Candidate Countries
(Telecommunications Services Sector). Report prepared by IBM for European
Commission. http://www.telecom.gov.sk/english/telecom/2ndmonitor_en.pdf

177
CEC (2002c) “Eurobarometer Flash 135: Internet and the Public at Large”. Technical
Annexes Parts A/B
CEC (2003a) ‘Guidelines on Criteria and Modalities of Implementation of Structural
Funds in Support of Electronic Communications’. Commission Staff Working Paper,
Brussels, 28.07.03, SEC (2003) 895.
CEC (2003b) ‘Electronic Communications: the Road to the Knowledge Economy’
CID Harvard (2002) “The Global Readiness Technology Report 2001-2002:
Readiness for the Networked World”, p21. http://www.cid.harvard.edu/cr/gitrr-
_030202.html
ComReg (2003) Future Delivery of Broadband in Ireland – Responses to Consultation
(03/08): Appendix – Extract from SERA Submission. Irish Commission for
Communications Regulation.
Cushman & Wakefield, Healey & Baker (2002) ‘European Cities Monitor’, London.
DATAR website, available at http://www.datar.gouv.fr
DTI (2003) ‘Britain gets connected’. Press release from the UK Department of Trade
and Industry.
http://www.gnn.gov.uk/gnn/national.nsf/TI/DFA9987A8AB1027F80256D74002C39
8
eris@ (2003) ‘Guide to Regional Broadband Development’. European Regional
Information Association, Brussels.
Eurostat (2002) “Information Society Statistics: Data for Candidate Countries:
Statistics in Focus, Theme 4 – 17/2002, author Richard Deiss
Eurostat’s Statistics in Focus, Industry, Trade and Services, Theme 4 -12/2002

178
La Gazette des Communes (2003) ‘L’Ariège, premier département opérateur de
télécommunications’, 6 January
Gillespie, A., Goddard, J., Robinson, J.F., Smith I., and Thwaites, A. (1984) The
effects of new information technology on the less-favoured regions of the Community,
Regional Policy Series 23, Commission of the European Communities, Brussels.
Hall, P. (2001) ‘Christaller for a Global Age: Redrawing the Urban Hierarchy’.
Globalization and World Cities Study Group and Network Research Bulletin 59.
Available at http://www.lboro.ac.uk/gawc/rb/rb59.html
Helsinki KEF, available at
http://www.helsinkikef.org/.../a87216857c6755b685256ce0006c95e6/
$FILE/lithuania%20case%2010.doc
Intel (2002) ‘Case Study: Zamora – Spain scores world first with public wireless
Internet’ http://www.intel.com/ebusiness/pdf/notebook/W_CS_Zamora.pdf
International Telecommunication Union (2001) ‘World Telecommunication
Indicators’. ITU, Geneva.
International Telecommunication Union (2002) ‘Yearbook of Statistics:
Telecommunications Services Chronological Time Series 1992-2001’. ITU, Geneva.
International Telecommunication Union (2003) Top economies by broadband
penetration, 2002. http://www.itu.int/home/
KMI Research website. Available at http://www.kmiresearch.com
Luger, M.I, Stewart, L.S. and Traxler, J. (2002) ‘Indentifying Technology
Infrastructure Needs in America’s Distressed Communities: A Focus on Information
and Communications Technology.’ Report prepared for US EDA by Office of
Economic Development, University of North Carolina at Chapel Hill and Kenan
Institute of Private Enterprise.

179
Lynch, G. (2000) ‘Hubs: New York City rated as world’s no. 1 telecom center’,
America’s Network Weekly [online], 8 September, Available from:
http://www.americasnetwork.com/enews/2000/Sept/20000908.htm [Accessed 14 Oct
2000].
Malecki, E. (2002) ‘Is the Internet a Railway or an Autobahn? Issues for research’.
Paper presented to the STELLA/STAR Workshop on ICT, Innovation and the
Transport System, Arlington, Virginia, January.
Malecki, E. (2003) ‘Fiber Tracks: Explaining investment in fiber optic backbones’.
Entrepreneurship & Regional Development (forthcoming).
Nairn, G. (2002?) Delays frustrate competitors FT Survey: Telecoms, p XIV
Observatoire des Télécommunications dans la Ville website, available at
http://www.telecomville.org
OECD (2001) ‘The Development of Broadband Access in OECD Countries’.
DSTI/ICCP/TISP(2001)2/FINAL. OECD, Paris.
OECD (2002) ‘Broadband Access for Business’. DSTI/ICCP/TISP(2003)3/FINAL
http://www.olis.oecd.org/olis/2002doc.nsf/LinkTo/dsti-iccp-tisp(2002)3-final
OECD (2003) ‘Developments in Local Loop Unbundling’.
DSTI/ICCP/TISP(2002)5/FINAL http://www.oecd.org/dataoecd/25/24/6869228.pdf
Office of the e-Envoy (2001) ‘UK online: the broadband future’
Official Journal of the European Communities (2002) ‘Directive 2002/22/EC of the
European Parliament and of the Council of 7 March 2002 on universal service and
users’ rights relating to electronic communications networks and services (Universal
Service Directive), L 108/51, 24 April 2002.

180
One North East (2003) ‘The North East Electronic Jigsaw: A Brief Guide’, Newcastle.
ORTEL (2003) ‘L’Atlas des Réseaux de Télécommunications et de l’Usage des PME’,
available at http://www.ortel.fr
Osservatorio Banda Larga website, available at http://www.osservatoriobandalarga.it/
Plintovicova, D. (2003) ‘Uroven rozvoja Internetu na Slovensku’. In: 26th World
Telecommunication Day International Conference (Conference Proceedings),
Slovenska Elektrotechnicka Spolocnost, Banska Bystrica, pp.101-106.
Point Topic (2003) ‘DSL Worldwide Retail Directory’. Edition 7, April 2003. Point
Topic Ltd, London.
PriMetrica Inc website, available at http://www.telegeography.com
Richardson, R. (2002) ‘Information and Communications Technologies and Rural
Inclusion’. Available at www.ncl.ac.uk/curds
Richardson, R. and Gillespie, A. (1996) Advanced Communications and Regional Job
Creation in Rural and Peripheral Areas: A Case Study of the Highlands and Islands of
Scotland Annals of Regional Science 30: 91-110.
Rutherford, J. (2003) ‘A Tale of Two Global Cities: Comparing the Territorialities of
Telecommunications Developments in Paris and London’. Aldershot: Ashgate
(forthcoming).
Stokab, see http://gigaman.gigaport.nl/en_stokab.html;
http://english.gavleregionen.com/focus/broadband.regnet.aspx
Townsend, A. (2001) ‘The Internet and the Rise of the New Network Cities, 1969-
1999’. Environment and Planning B: Planning and Design 28, 39-58.

181
UK Broadband Task Force (2003) ‘Broadband Aggregation Project (BAP): Draft
RAB/NAB Foundation Model Overview’. http://www.broadband.gov.uk/
United Nations Economic Commission for Europe (2002a) ‘Towards a Knowledge-
Based Economy: Bulgaria – Country Readiness Assessment Report’, New York: UN.
United Nations Economic Commission for Europe (2002b) ‘Towards a Knowledge-
Based Economy: Slovakia – Country Readiness Assessment Report’, New York: UN.
Wall Street Journal (2003) ‘Sleepy Spanish Town Becomes Cutting Edge in Wi-Fi
Project’ Wall Street Journal on Line. http://www.afitel.com/espanol/prensa/wallsj.htm

182
Annex 1: (Revised) SWOT Analysis: ESPON 1.2.2
0. ESDP Context
The ESDP’s policy aims with respect to telecommunications services and networks
are stated in Section 3.3 ‘Parity of Access to Infrastructure and Knowledge’. The
relevant sections are reproduced below:
3.3.1 An Integrated Approach for Improved Transport Links and Access to Knowledge
(107) Urban centres and metropolises need to be efficiently linked to one another, to
their respective hinterland and to the world economy. Efficient transport and adequate
access to telecommunications are a basic prerequisite for strengthening the
competitive situation of peripheral and less favoured regions and hence for the social
and economic cohesion of the EU. Transport and telecommunication opportunities are
important factors in promoting polycentric development. Efficient transport and
telecommunication systems and services have a key role in strengthening the
economic attractiveness of the different metropolises and regional centres.
(108) The mobility of people, goods and information in the EU is characterised by
concentration and polarisation tendencies. Increasing competition in the transport and
telecommunication markets can intensify this development. Policy must ensure that
all regions, even islands and peripheral regions, have adequate access to infrastructure,
in order to promote social and economic and, therefore, spatial cohesion in the
Community. It should also ensure that high quality infrastructure, for instance high-
speed /high-capacity rail lines and motorways, do not lead to the removal of resources
from structurally weaker and peripheral regions (“pump effect”); or that these areas
are not crossed without being connected (“tunnel effect”). Spatial development policy
should work towards having high quality transport infrastructure supplemented by
secondary networks to bring about their positive effects in the regions.
(110) These problems cannot be solved solely through building new infrastructure,
however important it may be for all regions. Transport and telecommunication

183
structures are not sufficient prerequisites on their own for regional development.
Accompanying measures in other policy areas, such as regional structural policy or
promotion of education and training, in order to improve the locational advantages of
the regions are required. This applies especially to structurally weak regions.
3.3.2 Polycentric Development Model: A Basis for Better Accessibility
(111) The future extension of the Trans-European Networks (TENs) should be based
on a polycentric development model. That means, in particular, ensuring the internal
development of the globally important economic integration zones and facilitating
their integration into the global economy. In addition, more attention should be paid
to regions with geographical barriers to access, especially islands and remote areas.
Spatial differences in the EU cannot be reduced without a fundamental improvement
of transport infrastructure and services to and within the regions where lack of access
to transport and communication infrastructure restricts economic development. A
fundamental improvement of infrastructure and accessibility requires more than just
providing the missing links in the TENs.
(116) Telecommunication networks can play an important role in compensating for
disadvantages caused by distance and low density in peripheral regions. The relatively
small market volumes in regions with low population density and correspondingly
high investment costs for telecommunication infrastructure can thus lead to lower
technical standards and high tariffs, which bring competitive disadvantages. In many
spheres (tele-working, distance education courses, tele-medicine, etc.) the provision
of high-quality services at affordable prices is a key factor for regional development.
Nevertheless, the application of modern technologies does not depend solely on the
availability of advanced infrastructure, equipment or services and their affordability,
but also on the development level of each region. Particular attention should, therefore,
be focused on measures to stimulate demand, the development of application-related
knowledge and the fostering of awareness of opportunities in order to stimulate
investment. A prerequisite for all infrastructure projects should be an early assessment
of the anticipated spatial impacts and a fine-tuning of Community, national and
regional or local measures.

184
(117) Policy Options
27. Improvement of access to and use of telecommunication facilities and the design
of tariffs in accordance with the provision of “universal services” in sparsely
populated areas.
3.3.3 Efficient and Sustainable Use of the Infrastructure
(123) Telecommunications, information and communications technologies are
important supplementary instrument for regional integration. Thus, they cannot be
seen as substitutes for transport development. A major focus should be on co-
ordination between decision-makers for transport and for telecommunications.
Regional planning and transport planning should also be more strongly integrated
with each other.
(124) Policy Options
30. Better co-ordination of spatial development policy and land use planning with
transport and telecommunications planning
3.3.4 Diffusion of Innovation and Knowledge
(129) Information and communication technology can help to reduce deficits in the
field of access to innovation and knowledge and, by this means, support the
settlement of companies in rural regions. This creates investment incentives in regions
which normally have lower relative location costs. A polycentric development of the
territory of the EU can support this policy.
(130) The dissemination of the new information technologies in all regions involves
the provision of a general basic service of equally high quality and the adoption of an
appropriate policy of charges. As the northern countries demonstrate, low population
density is not an insurmountable obstacle to the provision and widespread use of high-
quality telecommunications services. In addition to regulative measures, strategies
aimed at stimulating demand for knowledge promote the operation and use of

185
information and communications technologies. This includes, for example,
awareness-raising campaigns and better training opportunities.
(131) Policy Options
39. Development of packages of measures which stimulate supply and demand for
improving regional access and the use of information and communication
technologies.
1. In the light of the policy aims of the ESDP: What are the main strengths
identified by your TPG?
The main strengths are:
• The combination of liberalisation of telecommunications markets and the
development and deployment of new technologies has created a highly
dynamic environment. Competition is providing pressures which are leading
to reduced costs of network access and to service improvements. Rates of
Internet penetration and use, and of mobile telephony uptake and use, are very
rapid, and thus at the European scale, the supply of telecommunications
networks and services is improving markedly. It is not yet clear, however,
whether these same competition dynamics are extending to the deployment of
broadband networks; the early evidence does suggest that competitive
offerings accelerate the deployment of broadband technologies by the
incumbent operators.
• The rapid roll-out of digital mobile telephony networks has had particularly
significant positive territorial implications, in that almost universal service
coverage has been achieved across the whole of the European territory in a
very short space of time (less than a decade). For peripheral regions and rural
areas, which have tended to find themselves under-provided by advanced
networks which rely on wires and cables, the development and very rapid
deployment of wireless telephony has transformed the supply of
telecommunications services. In central and eastern Europe, wireless networks

186
have had similarly important impacts, and very high rates of adoption, helping
to overcome the legacy of inadequate fixed wire networks.
• The Internet has provided a very strong stimulus to the up-take of advanced
telecommunications services. In a very real sense, the bundle of generic
applications which the Internet delivers, particularly but not confined to the
World Wide Web, has overcome much of the resistance to the up-take of
advanced telecommunications services which was so prevalent until the late
1990s. Competition between ISPs has aided the adoption process considerably,
by driving down the real cost of accessing the Internet and by facilitating
marketing-led strategies aimed at different segments of both business and
domestic subscriber markets. The widespread availability of the Internet
across Europe will have provided an important boost to the communications
capabilities and access to information of regional SMEs.
• The territoriality of the development of Internet backbone infrastructure
networks in Europe appears to be supporting polycentricity in a number of
ways. At one level, although the ‘global cities’ of London and Paris have
always been privileged in terms of telecommunications infrastructure
investment, some smaller centres, such as Hamburg, Dusseldorf and
Amsterdam are more or less their equals in terms of the presence of Internet
backbone networks and bandwidth provision. There are also a number of
‘regional capitals’ emerging in these networks, such as Madrid, Copenhagen
and Vienna, and cities which are acting as ‘gateways’ between national
territories (such as Lyon with respect to France, Italy and Switzerland).
Further, the evidence suggests that there although there are ‘tunnel effects’
with respect to these backbone networks, there are also many instances of
smaller cities along the major routes being connected.
• The market-led developments in the fields of mobile telephony and the
Internet have been complimented at the regional level by considerable interest
in the promotion of both the supply and demand for telecommunications
services, within the context of regional information society strategies. The
stimulation of the information society at regional level can be said to have
been successfully ‘mainstreamed’ within the current round of Structural Funds.

187
2. In the light of the policy aims of the ESDP: What are the main weaknesses
identified by your TPG?
The main weaknesses are:
• In general, the candidate countries are lagging behind the existing member
states in terms of the deployment of new telecommunications technologies,
particularly with respect to the Internet and broadband. In some countries,
such as Poland and Romania, there are major deficiencies even with respect to
established technologies, such as fixed telephony services.
• The adoption of e-commerce applications, which are likely to have importance
for firm competitiveness and effective market presence, reveals a marked
territoriality at the European scale, with firms to the north and west of the Alps
having a clear ‘head start’ over firms to the south and east.
• At the metropolitan-rural scale, there remains a significant territorial
dimension to the deployment of new fixed wire technologies, with rural areas
tending to be considerably more poorly served than metropolitan areas. Of the
three main delivery mechanisms for broadband services, for example (DSL,
cable modems and wireless), the first two have a very marked territoriality,
with the up-grading of networks to provide broadband services being
considerably more advanced in metropolitan areas than in rural areas. In part,
this differential will begin to narrow if broadband services are rapidly adopted;
at present, the telecommunications companies are reluctant to invest in
network upgrades in rural areas without first seeing clear evidence of buoyant
demand in the cities, a situation which has not yet been reached. This problem
may well be compounded by lower levels of adoption of the Internet in rural
areas than in metropolitan areas, a disparity which is showing no signs of
narrowing.
• This situation with respect to broadband reflects a more general weakness
from a territorial perspective that market-driven telecommunications networks
(which is what liberalised telecommunications markets in Europe have
become) are always likely to discriminate between metropolitan and rural
areas in their investment priorities. Not only are the former seen as having the
critical mass upon which new services can be launched, but they are also

188
deemed to have the type of sophisticated consumers (in both business and
domestic markets) that will generate the most revenues. Rural and peripheral
areas are further handicapped by being more expensive to serve, particularly
for wire based networks.
• An additional weakness is that there is as yet little evidence for the existence
of mechanisms linking telecommunications planning with either transport
planning or spatial planning.
3. In the light of the policy aims of the ESDP: What are the main
opportunities resulting from the identified frame conditions?
• At the regional level, the deployment of broadband networks is likely to
provide a very substantial improvement in the telecommunications
environment of peripheral and remote regions. Although the ‘death-of-
distance’ is unlikely to be realised, the advances currently underway in
telecommunications do offer significant opportunities for peripheral and less-
favoured regions to enhance their levels of integration with the core regions of
Europe.
• For rural areas, the deployment of new wireless based technologies (both
mobile and fixed) could offer a real opportunity for reducing the service-
supply gap they suffer from in relation to metropolitan and urban areas. The
widespread availability and use of mobile telephony across all of Europe’s
regions, and incorporating the smaller towns and rural areas within each
region, has created a platform for the introduction of new technologies and
services, including 3G mobile and Wi-Fi, which will provide new points of
entry to the Internet.
4. In the light of the policy aims of the ESDP: What are the main threats
resulting from the identified frame conditions?
• The main threat in the identified frame conditions is that rural areas lag
persistently behind metropolitan and urban areas in the level, quality and cost
of telecommunications services to which they have access. In the highly
uncertain telecommunications markets which are likely to prevail for some
189
time (in the wake of the bursting of the dot-com bubble and the realisation that
telecommunications companies have considerably over-invested in 3G mobile
licences), there is a real risk that rural areas are not only placed low-down on a
roll-out queue, but may fall-off the queue altogether.
• This risk is likely to be a real threat if broadband fails to be adopted on an
appreciable scale; in this circumstance, broadband may only be deployed in
‘islands’ where demand is sufficiently concentrated. If this situation persisted,
then communication-intensive SMEs operating in rural areas might find it
increasingly difficult to communicate with their customers and suppliers, in
which broadband communications capability will be likely to be taken for
granted. A new urban-rural divide could emerge, in which only lower level,
non-communications intensive activities can be undertaken from rural areas.
5. Looking back on the questions 1) to 4): What are the 3-4 driving forces
dominating the thematic sector? Please explain each driving force in one or two
paragraphs.
The main driving forces are:
• Liberalisation/Competition – without doubt, it is liberalisation, in
conjunction with new technologies, which have transformed the territoriality
of telecommunications markets; the stable pattern of universal service
provision in a basic telephony service context has been transformed by
dynamic, contested (albeit to degrees which vary considerably according to
territory) and multiple markets. The focus of telecommunications provision
has shifted from an engineering, supply-driven condition to a market-pulled
provision. The result of this is a major differentiation between territories in
terms of their demand for telecommunications, with ‘hot spots’ of multiple,
competing suppliers in locations such as the financial services centres of
Europe, contrasting with the uncontested markets of rural areas, in which
there is little incentive for (de facto) monopolistic suppliers to invest.
• The deployment of new technologies - Technological innovation -
represented most obviously by the Internet and mobile wireless technologies –
in conjunction with liberalisation has opened up new services which have

190
diffused considerably more rapidly than any previous communications
technologies have done. These innovations are opening up new opportunities
for peripheral and rural areas, but are at the same time serving to accentuate
the inherent territoriality of telecommunications networks (in the sense that
these networks require investments in fixed infrastructures – wires, cables,
switches, wireless masts, etc – in order to provide services to particular
places) . The roll-out of new technologies and the services based upon them is,
then, one of the main driving forces accentuating the territoriality of
telecommunications networks. Currently, it is the roll-out of broadband
technologies (in addition to specialised networks targeted at large firms and
institutions, there are currently three different delivery technologies which can
deliver broadband services for domestic consumers – digital subscriber lines
[DSL], cable modems and broadband wireless) which are most amply
demonstrating the territoriality of telecommunications networks, with a strong
urban bias evidence in the initial deployment of these technologies.
• National regulatory and support policies – although the European
telecommunications market has now been predominantly liberalised, there
remain marked national differences in the extent to which ‘the state’, broadly
defined to include national and local governments, choose to intervene in
telecommunications provision in order to achieve territorial equity, or
‘universal service’. As is evidenced in the Nordic countries, territorial equity
in telecommunications provision can be achieved even in liberalised markets,
through the use of the regulatory and licensing system, through e-government
policies, through subsidies to operators where market-failure is expressed
territorially, and through the ‘state’ becoming directly involved as a
telecommunications supplier in instances where the market is not providing
the required level of network access. Clearly this provides significant scope
for the Structural Funds to contribute to territorial equity in
telecommunications provision, as is already evidenced by the increasing share
of Structural Funds investment being devoted to Information Society measures,
including telecommunications provision. The opposite example is provided by
much of central and eastern Europe, where the past legacy of under-
investment in telecommunications remains a significant feature of the current
telecommunications landscape.

191
These driving forces can be measured in the following ways.
Liberalisation can be measured in terms of the extent to which territorially-
defined markets are subject to competition, measured either in terms of the number of
competitors present in a market, or in terms of the new entrants’ share of the market.
Such measures can be applied to fixed telephony services, mobile telephony services,
and broadband services.
The deployment of new technologies can be measured with respect to whether
particular technologies – such as, in the case of broadband, ADSL – are available in
particular territories (and, if they are, what the costs of accessing the services are).
The geography of such availability is finely differentiated, with decisions effectively
being made by the telecommunications companies at the level of individual
exchanges. For regional aggregates, therefore (such as NUTS Level 2 or even Level
3), the indicator would need to specify the proportion of the population able to access
ADSL services. At least as important as the availability of new network technologies,
however, is their up-take and usage. The former can be measured by survey-based
adoption rates, standardised on population, households or firms, and usage can be
measured, again by means of user surveys, through concentrating on the intensity of
up-take of particular types of application, such as e-commerce.
It must though be recognised that such information is distinctly lacking at the sub-
national scale within Europe, reflecting a complex set of influences including the
reluctance of telecommunications operators to part with information that they deem
commercially sensitive, through to the failure of the policy community, at national
and European scales, to afford sufficiently high priority to the collection of such
information.
National regulatory and support policies can be measured in terms of the
degrees of political commitment and associated resourcing for ensuring that all
territories share in the benefits of the information society, and, specifically, the extent
to which interventions are made in telecommunications markets to ensure that
telecommunications networks and services are deployed across all parts of the

192
territory. Although the national level of decision-making is in most cases the most
significant (due to regulatory policy usually being determined at the national level
within Europe), regional level (and indeed urban and municipal levels) can also be
significant in stimulating the IS and the introduction of new telecommunications
networks and services. The appropriate indicators would therefore deal with degrees
of state commitment to ensuring that territorial disparities in telecommunications
provision are minimised (ie to universal service), on a qualitative scale ranging from
strong to weak. For a given territory, such an indicator would need to be a composite
reflecting the role of different levels of government in meeting this objective, which
can be expected to vary between member states (in Spain, for example, the regional
government’s role in telecommunications regulation and provision is particularly
strong).
6. Commencing from these driving forces please develop a typology which can
be used to classify the European regions.
The three factors – liberalisation or competition, the deployment of broadband
technologies and national regulatory and support policies – could each can be
dichotomized according to whether they are above or below the European (EU27)
average.
Competitive markets – Highly contested vs. uncontested or limitedly contested
markets;
Deployment of broadband – Widespread availability of broadband vs. limited or no
availability of broadband; and/or high vs. low up-take of broadband services;
Universal service policy – High policy commitment to universal, high quality service
vs. weak commitment to universal, high quality service.
Combining these typologies into a 2 x 2 x 2 matrix gives 8 possible classes,
into which Europe’s regions can in principle be classified:
• High competition, high broadband availability, high universal service
commitment
• High competition, high broadband, low universal service

193
• High competition, low broadband, high universal service
• High competition, low broadband, low universal service
• Low competition, high broadband, high universal service
• Low competition, high broadband, low universal service
• Low competition, low broadband, high universal service
• Low competition, low broadband, low universal service
In attempting to operationalise this typology, however, data deficiencies mean that a
considerable degree of subjective judgement needs to be exercised, even at the NUTS
2 level. At NUTS 3, there are in effect no sources of data which can be used to
provide a typology of European regions, and we have thus confined the analysis to the
NUTS 2 level. Further, there is insufficient information available, either from
secondary sources or from our own WP3 data collection activities, to confidently
categorise Europe’s regions in terms of the universal service policy indicator, and we
have not in consequence attempted to operationalise this indicator. Instead we have
relied on the competition and broadband indicators to provide a typology of NUTS 2
regions.
In operationalising the competitive markets indicator, the distinction was made
between those regions in which the competitive supply of fixed telecommunications
developed relatively early (by 1999), and those in which competition has been later to
emerge. The ‘early’ category includes much of the UK, most of Scandinavia, and
some of Germany, Italy and Spain. The ‘later’ category includes all of eastern Europe,
but also France and the majority of Finland.
In operationalising the deployment of broadband indicator, insufficient information
was available to reliably categorise regions according to the availability of broadband
services, due mainly the lack of consistent national benchmarks. Using a range of
sources, however, including the latest national figures from ITU and the OECD and
our own WP3 material, it proved possible to provide estimates, for NUTS2 regions, of
the extent of broadband penetration, using a three-fold categorisation (high, medium
and low penetration).

194
Regions with high broadband penetration are concentrated in the Nordic countries, the
Swiss-Austrian central Europe axis, the Benelux countries, and major metropolitan
centres such as London, Ile-de-France, Madrid, Berlin and Hamburg. The pattern of
regions with low broadband penetration is dominated by the majority of the eastern
Europe/CC region (with Prague, Estonia, Kozep-Magyarorszag and Slovenia
providing exceptions), most of southern Europe, Ireland, and a number of more rural
and/or less prosperous regions in France, Germany and the UK.
Combining these two operationalised indicators provides a six-fold typology of
Europe’s NUTS 2 regions:
1. Early Competition, High Broadband Penetration
2 Early Competition, Medium Broadband Penetration
3. Early Competition, Low Broadband Penetration
4. Late Competition, High Broadband Penetration
5. Late Competition, Medium Broadband Penetration
6. Late Competition, Low Broadband Penetration
Please map the spatial patterns resulting from this typology

Re
do
reg
an
ma
Co
Re
clu
195
gions with early competitive provision and high broadband penetration are
minated by Denmark and Swedish regions where national culture, a dynamic
ulatory context and national government policy support has promoted competition
d broadband strongly for a number of years. Other regions in this top category are
jor metropolitan regions such as London, Berlin, Hamburg, Dusseldorf and
munidad de Madrid.
gions with late competitive provision and high broadband penetration are mostly
stered in Benelux regions and the Swiss-Austrian central Europe axis, with Ile-de-

196
France being a notable exception to this. In these regions, it is evident that
competition has either developed very quickly recently to produce a dynamic
broadband market (Ile-de-France could be explained by this), or has had relatively
little influence on the development of broadband penetration (in which case public
sector support must be strong).
Regions with early competitive provision and low broadband penetration have
conversely not seen the benefits of mature liberalised markets diffuse to their
development of broadband. Many of these regions are relatively rural (southern Italy,
La Rioja, Mecklenburg-Vorpommern, Cornwall), suggesting that despite the
regulatory advantage of an open market, operators have not judged it to be
commercially viable enough to roll their broadband services out here due to lack of
demand.
Regions in the lowest category with late competition and low broadband penetration
are again dominated by eastern European regions, although southern European
regions (all of Greece, eastern Italy, the south west part of the Iberian peninsula) and
more remote regions of EU15 (Ireland, Wales, south western Scotland, Limousin,
Auvergne) also appear here. These regions have not benefited, and still are not
benefiting, from either open telecommunications markets or a broadband demand
dynamic, suggesting that it is these regions of Europe in which some form of public
intervention is most necessary in order to stimulate the information society.
Another approach to typologising the regions of Europe from a telecommunications
perspective is to combine key territorial descriptors – core/periphery, urban/rural and
rich/poor – each of which appear on the basis of our analysis to be related in
important ways to the nature of a region’s telecommunications environment, to
provide a composite ‘prediction’ of any regions’ telecommunications position.
The core-periphery classification is based on the location of each region within or
outside of the well-known Pentagon zone, the urban-rural classification is based on
the categorisation of NUTS 2 regions by BBR into levels of urban or rural, and the
rich-poor classification is based on GDP data from the BBR database.

197
As is evident in the project’s TIR, the urban-rural distinction is particularly important
in terms of telecommunications development (although it would have been preferable
to be able to use a NUTS 3 regional classification rather than NUTS 2, this was only
available for EU15). Adding the rich-poor dichotomy to this allows us to make crucial
distinctions between the multiple ‘peripheries’ of the European space with vastly
different telecommunications supply and demand characteristics (rich Nordic regions
versus less prosperous southern and eastern European regions). It is the core-
periphery category which, in the domain of telecommunications territoriality, is most
complex and problematic, as it is the northern ‘periphery’ which is most advanced in
broadband supply and take-up. Telecommunications territoriality in Europe suggests
both a more extended core area including Denmark, and more of the UK, northern
Italy and France rather than the traditional Pentagon, and multiple peripheries
(northern, southern, eastern).
Taking each of the above dichotomised variables produces an 8-fold categorisation
(2x2x2) of Europe’s NUTS 2 regions. Table 1 translates each of these 8 categories in
terms of the predicted telecommunications environment likely to prevail in a region
with this combination of characteristics, and Figure 2 maps the categories. There are
undoubtedly limits to typologising the characteristics of European regions in this way,
but it is also clear that such geographical and economic characteristics are highly
bound up in the extent and type of supply and demand of telecommunications.
Table 1: Expected telecommunications supply and demand characteristics for
NUTS 2 regions
Core Urban Rich Access to full range of advanced
networks and services driven by strong
market competition and presence of pan-
European operators (fibre MANs)
High levels of uptake, driven by demand
from large companies (leased lines) and
other leading edge consumers
Core Urban Poor Proximity to richer core regions ensures
reasonable availability and choice of

advanced services, but slower uptake
from both business and households
(regions of industrial restructuring)
Core Rural Rich More limited access to advanced
networks and services (eg DSL), mostly
deployed by the incumbent within
technical limits
Still reasonably robust demand and
uptake driven by SMEs, with reasonably
high levels of household demand.
Core Rural Poor Limited availability of more advanced
networks and services, and limited
demand and uptake
Periphery Urban Rich Good levels of competition between
national operators (and some pan-
European companies) promotes access to
advanced networks and services for large
companies, with reasonably high levels of
uptake by SMEs and households
Peri
Peri
Peri
198
phery Urban Poor Deployment of advanced networks and
services limited to incumbent, with slow
uptake by SMEs and limited household
demand
phery Rural Rich Deployment of advanced networks and
services limited to incumbent and to
urban centres, with reasonable uptake by
SMEs and households (particularly in
Nordic countries)
phery Rural Poor Very limited availability of more
advanced networks and services, as even
the incumbent rarely sees it profitable to
roll out in these regions
Very limited demand from business and

199
households, and very slow uptake of
those services available
The above figure reveals a starkly differentiated predicted territoriality of European
telecommunications. The most dynamic telecommunications environments,
possessing virtuous circles of high quality supply and sophisticated demand,

200
competing suppliers and multiple backbone networks will be found in the ‘blue
banana’ (the Core-Urban-Rich category), extending from southern England though
north-eastern France, the Benelux countries and Germany to northern Italy. Similarly
high quality environments, though with perhaps less dense coverage of backbone
networks are likely to be found in much of the rest of the UK, south-east France,
north-central Italy, and in major cities such as Madrid, Barcelona and Wien (the
Peripheral-Urban-Rich category).
At the opposite end of the spectrum, the least dynamic telecommunications
environments, with vicious circles of poor supply and limited demand, few
competitive offerings and limited backbone networks, will be found in much of the
Iberian peninsular, Greece, parts of Poland, the Czech Republic, Hungary and
Slovakia, most of Romania and Bulgaria, and the Baltic states (the Peripheral-Rural-
Poor category). Similarly under-developed telecommunications environments, but
with greater potential for market-led developments due to urban concentration, are to
be found in southern-Italy, in Porto and Lisbon, Athens, parts of the former east
Germany, Prague, Bratislava, and a number of Polish regions (the Peripheral-Urban-
Poor category). It is regions in these two categories that are likely to have the
strongest need for structural fund interventions, both to support the deployment of
advanced infrastructures (backbone networks, broadband) and to stimulate the
demand for telecommunications, particularly in the business and commerce sectors of
the economy.
Between these two extremes, of particular interest are those peripheral rural regions
which are relatively wealthy (the Peripheral-Rural-Rich category), found mainly in
the Nordic countries, Scotland, Ireland and France. These regions perhaps have made
the most impressive use of telecommunications to overcome or ameliorate problems
of remoteness and low population density; as such they may provide approaches to
infrastructure development or demand stimulation which could provide pointers to
less prosperous regions wishing to move in similar directions. These regions appear to
be innovative both in terms of the deployment of alternative technologies such as
wireless, and in the development of strategies which integrate the information society
with broader development objectives.
201
Please prepare a data set which contains the data of the driving forces and the regional
classification.
[attached]
Refer to the concept of sustainable development and regional competitiveness: Please
describe on a half page how the spatial pattern and developments in your sector outlined
above relate to sustainable development and balanced competitiveness as overall aims in
the field of spatial development and EU policies.
In significant respects, developments in telecommunications networks and services
are contributing very positively to sustainable development and regional
competitiveness. The deployment of advanced telecommunications networks is
occurring in both the core and periphery of Europe, and the geography of
telecommunications networks reveals a highly polycentric rather than centralised
form. The main qualification to this positive assessment concerns the distinction
between metropolitan areas and rural areas, for the combination of market-driven
provision and the deployment of new technologies, notably broadband, is creating
uncertainties about how far down the urban hierarchy the new services will be made
available. However, the Nordic experience demonstrates the effectiveness and
viability of policy interventions to ensure that spatial disparities are not widened, even
in liberalised telecommunications environments.
It must further be recognised, however, that the contribution of telecommunications
networks and services to balanced competitiveness depends primarily on the
innovative use of these technological capabilities in firms, large and small. There is a
considerable volume of evidence to suggest that the extent and effectiveness of usage
is widely differentiated between firms, with larger firms tending to make more
intensive and effective use than smaller firms, and firms in peripheral regions and
rural areas tending to make less intensive and effective use than firms in core regions
and metropolitan areas. Whilst the provision of infrastructure and services is a pre-
requisite for effective usage, effective usage does not necessarily follow from having
these services available. Indeed, the widely differentiated contribution of

202
telecommunications to regional competitiveness appears to be explained much more
by variations in usage than by variations in the supply of services.
The implications for the environmental aspects of sustainable development of
advances in telecommunications are further complicated by the complementarities
between electronic communications and physical movement. All the evidence
suggests a very limited scope for substituting electronic for physical movement;
indeed, it is clearly apparent that telecommunications networks are underpinning
increasingly mobility-intensive forms of interaction.
Please name for both aims the three or four most important indicators you use to measure
and assess these trends.
It follows from the above comments on the contribution of telecommunications to
balanced regional competitiveness that the most appropriate indicators would lie on
the demand or up-take side of the telecommunications market, rather than on the
supply-side. The most important population-based demand side indicators we have
used in this report are:
Number of Internet users per 10,000 inhabitants
Number of broadband users per 10,000 inhabitants
Although regional data is by no means widely available for these two indicators, it is
relatively easy to collect through the types of household survey that statistical
agencies regularly deploy, and with a degree of political will it should be possible to
develop consistent data on these indicators for all of Europe’s regions.
Additionally, however, from a regional economic development perspective it is also
necessary to understand the adoption of key telecommunications services by business
enterprises. Eurostat have begun pilot surveys of e-commerce at the member state
level for EU15, and such surveys need to be extended to the whole of Europe, and
provided with a regional level of disaggregation. The most important regional
indicators would be:

Percentage of enterprises with web access
Percentage of enterprises with their own web site
Percentage of enterprises having implemented e-purchasing
Percentage of enterprises using e-commerce to make sales
11. Refer to sustainability and its economic, social and ecological dimension:
Please give an intuitive assessment to what degree the spatial patterns in your sector
comply with the three dimensions of sustainability
On the economic axis, w
although there are very
Europe from the perspectiv
of concerns with respect to
deployment of broadband n
On the ecological side, we
some would (naively in o
good for the environm
communications for physi
also serious issues concern
highECOLOGICA
ECONOMIC
203
e have provided an estimate just above the mid-point;
positive aspects of telecommunications development in
e of balanced spatial development, there are also a number
the position of rural areas, for example with respect to the
etworks and services.
have provided a ‘cautious’ mid-point estimate. Although
ur opinion) assume that telecommunications is invariably
ent, due to the potential for substituting electronic
cal movement, alongside this substation potential there are
ing the role of telecommunications in expanding ‘activity
lo
highSOCIAL

204
spaces’ and, consequently, the distances over which physical movements and journeys
are made. There is, as yet, no reliable empirical basis for determining the implications
of e-activities for travel and movement; hence our mid-point estimate.
On the social axis, we have provided a high estimate of the contribution of
telecommunications to sustainability, due primarily to the very widespread diffusion
of mobile telephony under competitive market conditions, including those countries
of central and eastern Europe in which fixed telecommunications have been both
expensive and, in places, unavailable due to supply-side constraints. We would
contend that mobile communications are likely to be contributing positively to social
inclusion.