telecommunication regulatory authority investing in infrastructure telecom & ict opportunity
DESCRIPTION
Telecommunication Regulatory Authority Investing In Infrastructure Telecom & ICT Opportunity 13 April 2008. ألاقتصاد والأعمال Al- Iktissad Wal-Aamal Conference. www.tra.gov.om. Overview. Market Profile. Market Statistics. Market Forces. Challenges & Solutions. - PowerPoint PPT PresentationTRANSCRIPT

Telecommunication Regulatory AuthorityInvesting In Infrastructure Telecom & ICT Opportunity13 April 2008
أالقتصاد واألعمالAl-Iktissad Wal-Aamal
Conference
www.tra.gov.om

Overview
Market Profile.
Market Statistics.
Market Forces.
Challenges & Solutions.

Omani Telecom Market Profile
• Fixed Market:– single licensed operator.– 10% Teledensity (2007).– 66% households penetration.– 2.2% CAGR for the last 6 years.– Prepaid segment with higher growth.

Omani Telecom Market Profile
• Mobile Market:– First GSM network introduced in 1996– Second mobile operator in Mach 2005– GPRS, EDGE and 3G services– 96% Penetration rate (2007)– 46% CAGR per annum after liberalization.

Omani Telecom Market Profile
Region Geographical coverage (2007)
Muscat 89%
AlBatinah 80%
Ash Sharqiyah 55%
Al Dhahirah 77%
Ad Dakhiliya 73%
AlWusta 33%
Dhofar 45%
Musandam 71%
AlBuraimi 57%

Omani Telecom Market Profile
• Internet Market:– single provider (incumbent operator).– 6.8% growth per annum since 2001.– High demand for broadband services.
Type Subscribers(2007)
Dialup 50K
Broadband 20k
Leased lines 2k

Omani Telecom Market Profile
•Requirement in the legal frame work in the telecom act (Article 38 of the telecom act)
•Government USO Initiative
•Pilot project for the first phase to be auctioned, might not be economic viable and might attract subsidies according to the telecom act article 39.
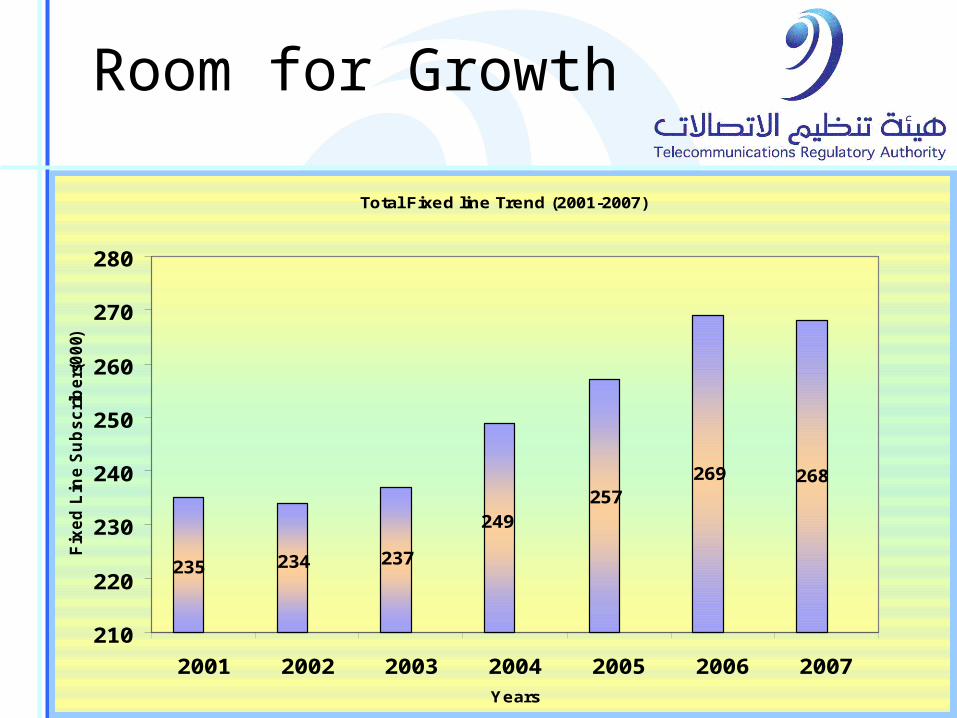
Room for Growth
Total Fixed line Trend (2001-2007)
235 234 237
249257
268269
210
220
230
240
250
260
270
280
2001 2002 2003 2004 2005 2006 2007Years
Fix
ed
Lin
e S
ub
sc
rib
ers
(00
0)

Room for Growth
Fixed Line Household Penetration (Country Comparison 2006)
117
98
85 83
71 7063 63
45
66
0
20
40
60
80
100
120
140
Fix
ed
Lin
e P
en
etr
ati
on

Room for Growth
Mobile Penetration Rate (Country Comparison: 2006)
126
114110
100
69 68
2820 20
72.5
0
20
40
60
80
100
120
140
Mo
bil
e P
en
etr
ati
on

Room for Growth
Internet Subscribers Trend (2002-2007)
4852
48 49
64
70
0
10
20
30
40
50
60
70
80
2002 2003 2004 2005 2006 2007
Years
Inte
rne
t S
ub
sc
rib
ers
, 00
0

Room for Growth
Internet Household Penetration(Country Comparison: 2006)
82
5349
3835
25
15
7 7
18.6
0
10
20
30
40
50
60
70
80
90
Inte
rne
t P
en
etr
ati
on
, 2
00
6

Threats of new entrants
BargainingPower of consumers
Threats ofsubstitutes
BargainingPower of providers
Telecom Market Forces
Telecom MarketCompetition

Forces on the Omani Telecom Market
Public demandsforces
Technological drivingforces
Ecological driving forces
Political drivingforces
Economic drivingforces•Increase in demand for better
QoS
•Increase in demand for new innovative services
•Purchasing power of customers
•Demands on cheaper Telecom services
•Culture requirements
•Legal Framework
•E-government Initiative
•WTO
•FTA
•USO
•Competition
•Potential market size
•Usage patterns
•Pricing policies
•Public safety
•Frequency bands availability•New emerging technologies and
standards
•Convergence of networks into single one
•Internet /E-business technologies
•Innovation/ Repacking
Telecom marketTelecom market

Steps Towards Addressing the Challenges
• Local loop unbundling• Introduction of Carrier select/pre-
select• Introduction of VoIP• Next Generation Networks• Opening of telecom market• Unified licensing (International,
submarine cables, long distance, Wireless Broadband Access).

Challenges to the new entrant
Challenges
Capital requirements
Economies of scale
Product differentiation
Brand performance/customer loyalty
Access to distribution channels
Cost advantages of the Incumbent
Expected retaliation
Legislation/government action

Threats of Substitutes
Challenges
Offer competitive product mix for subscribers to lure from respective competitor
Demonstrate high perceived QoS
Tendency of subscribers to switch to new provider
Consumer disposable income