telecom regulatory authority of india survey report jul sep... · trai (qos) customer satisfaction...
TRANSCRIPT

M a r k e t P u l s e
C - 1 1 , S e c t o r 6 , N o i d a
2 0 1 3 0 1 , U . P . I n d i a
9 1 1 2 0 4 0 7 6 5 0 0 / 8 5 0 0
Assessment of (i) Implementation and
Effectiveness of Telecom Consumers
Protection and Redressal of Grievances
Regulations, 2007 and (ii) Customer Perception
of Service through Survey .
DELHI CIRCLE
July – September 2011
Telecom Regulatory Authority of India

________________________________________________________________________
TRAI (QoS) Customer Satisfaction Survey Report 2011 - 2012 – Delhi Circle
2
Table of Contents
S. No. Chapters
Page No.
1
Preface
4 – 5
2
Executive Summary
6 – 9
3 Scope of Project
Background
Survey Objectives
Survey Methodology
Coverage of the Survey
Geographical Coverage
Respondent Profile
Sampling Methodology & Coverage
Mode of Interview & Sample Size Covered
Respondents Profile by Payment Mode Used
Respondents’ Demographic Profile
Computation Basis for Customer Satisfaction
Explanation of Benchmarks
Definition of Key Terms Used
10 – 34
4
Compliance Report on Customer Perception of Service
Basic Wire-line Service
Cellular Mobile Service
Broadband Service
35 – 41
5 Detailed Survey Findings
Basic Wire-line Service
Cellular Mobile Telephone Service
Broadband Service
42 – 88
________________________________________________________________________
TRAI (QoS) Customer Satisfaction Survey Report 2011 - 2012 – Delhi Circle
3
S. No. Chapters
Page No.
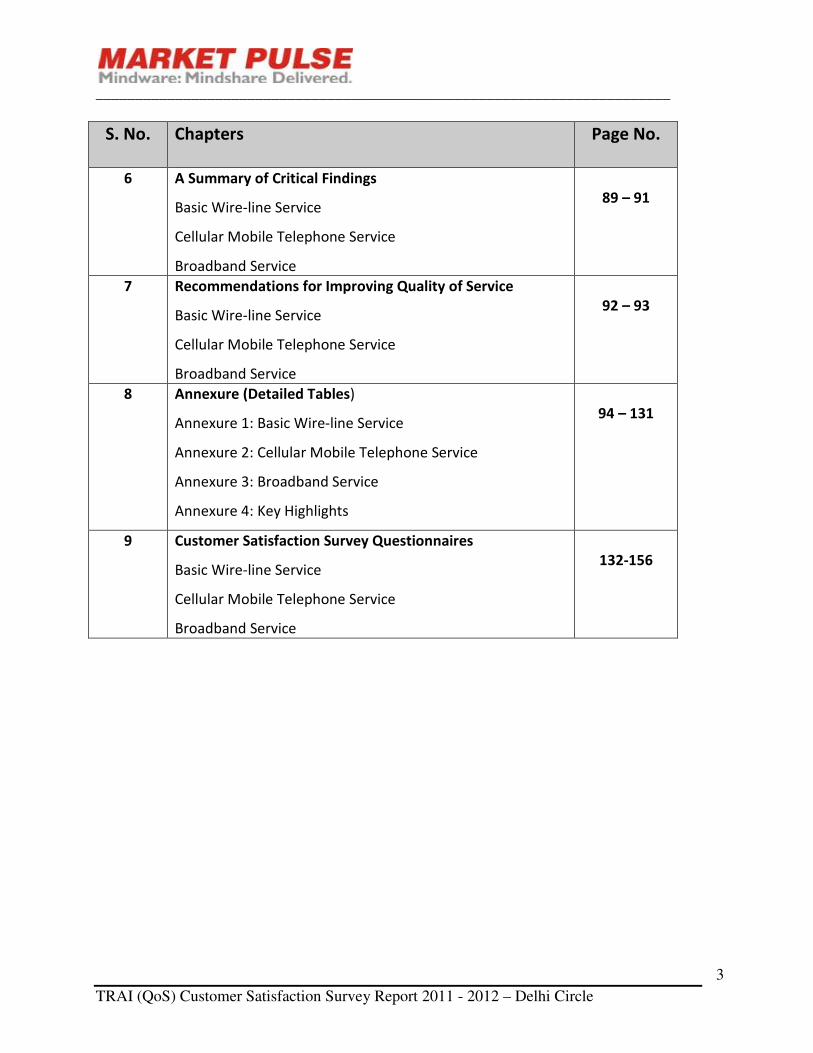
6 A Summary of Critical Findings
Basic Wire-line Service
Cellular Mobile Telephone Service
Broadband Service
89 – 91
7 Recommendations for Improving Quality of Service
Basic Wire-line Service
Cellular Mobile Telephone Service
Broadband Service
92 – 93
8 Annexure (Detailed Tables)
Annexure 1: Basic Wire-line Service
Annexure 2: Cellular Mobile Telephone Service
Annexure 3: Broadband Service
Annexure 4: Key Highlights
94 – 131
9
Customer Satisfaction Survey Questionnaires
Basic Wire-line Service
Cellular Mobile Telephone Service
Broadband Service
132-156

________________________________________________________________________
TRAI (QoS) Customer Satisfaction Survey Report 2011 - 2012 – Delhi Circle
4
PREFACE
The Telecom Regulatory Authority of India (TRAI) has been receiving a substantial number of
complaints from consumers relating to the telecom services being provided by various service
providers. With a view to further improve telecom services, TRAI has passed regulations on
Quality of Service of Basic & Cellular Mobile Telephone (revised on 20th
March, 2009), Quality of
Service of Broadband Service (2006) and on the Telecom Consumers & Redressal of Grievances
(2007). These regulations are applicable to all service providers of basic wire-line, cellular mobile
and broadband service.
To determine the effectiveness of implementation of the regulations, TRAI has initiated the
following survey:
(i) Assessment of Implementation and Effectiveness of Telecom Consumers Protection
and Redressal of Grievances Regulations, 2007 and
(ii) Customer Perception of Service through a Survey
For this survey, customers of Basic Wire-line Service, Cellular Mobile Telephone Service and
Broadband Service are interviewed to obtain their feedback on various QoS parameters.
The survey has been divided into four geographic zones covering the following Telecom Circle/
Metro Service Areas:
North Zone: Delhi, Jammu & Kashmir, Himachal Pradesh, Punjab, Delhi, Rajasthan, Uttar Pradesh
– East and Uttar Pradesh – West (including Uttarakhand). For cellular mobile service the service
areas of Delhi includes Ghaziabad, Faridabad, Noida and Gurgaon.

________________________________________________________________________
TRAI (QoS) Customer Satisfaction Survey Report 2011 - 2012 – Delhi Circle
5
South Zone: Chennai, Andhra Pradesh, Karnataka, Tamilnadu (excluding Chennai) and Kerala.
West Zone: Mumbai, Delhi (including Goa and excluding Mumbai), Gujarat (including and
Madhya Pradesh (Including Chattisgarh).
East Zone: Kolkata, West Bengal (Including Andaman & Nicobar, Sikkim and excluding Kolkata),
Bihar (including Jharkhand), Orissa, Assam and North East which includes Arunachal Pradesh,
Meghalaya, Mizorum, Nagaland, Manipur and Tripura.
With regard to the afore-mentioned survey, Market Pulse has been commissioned by Telecom
Regulatory Authority of India (TRAI) to conduct a Customer Satisfaction Survey (CSS) among
Basic Wire-line Service, Cellular Mobile Telephone Service (including FWP) and Broadband
Service customers, in North Zone.

________________________________________________________________________
TRAI (QoS) Customer Satisfaction Survey Report 2011 - 2012 – Delhi Circle
6
1. EXECUTIVE SUMMARY
In the period 1st
July to 30th
September of 2011, Market Pulse has carried out the customer
satisfaction survey in Delhi circle.
Four basic wire-line service providers present in the circle as on July 2011 have been covered.
Across 7 areas of Delhi circle, a sample of 3,831 basic wire-line customers has been covered.
Nine cellular mobile telephone service providers present in the circle as on July 2011 have been
covered. A sample of 9,602 cellular mobile phone customers was covered. Of this, 8,895 were
prepaid customers and 707 were postpaid customers.
Six broadband service providers present in the circle as on July 2011 have been covered. Across
various points of presence in Delhi, a sample of 6,402 broadband customers was covered. Of
this, 5,964 were postpaid customers and 438 were prepaid customers.
The following feedback was obtained from the sample of customers:
� Satisfaction on the Quality of Service parameters as laid down by TRAI, namely…
- Provision of service (activation/ reactivation)
- Billing performance
- Help services including customer grievance redressal
- Network performance, reliability and availability
- Maintainability
- Supplementary and value added service
- Overall service quality
� Awareness of the grievance redressal mechanism set up by service providers, based on the
regulations laid down by TRAI
The key findings of this survey in Delhi are presented subsequently.
________________________________________________________________________
TRAI (QoS) Customer Satisfaction Survey Report 2011 - 2012 – Delhi Circle
7
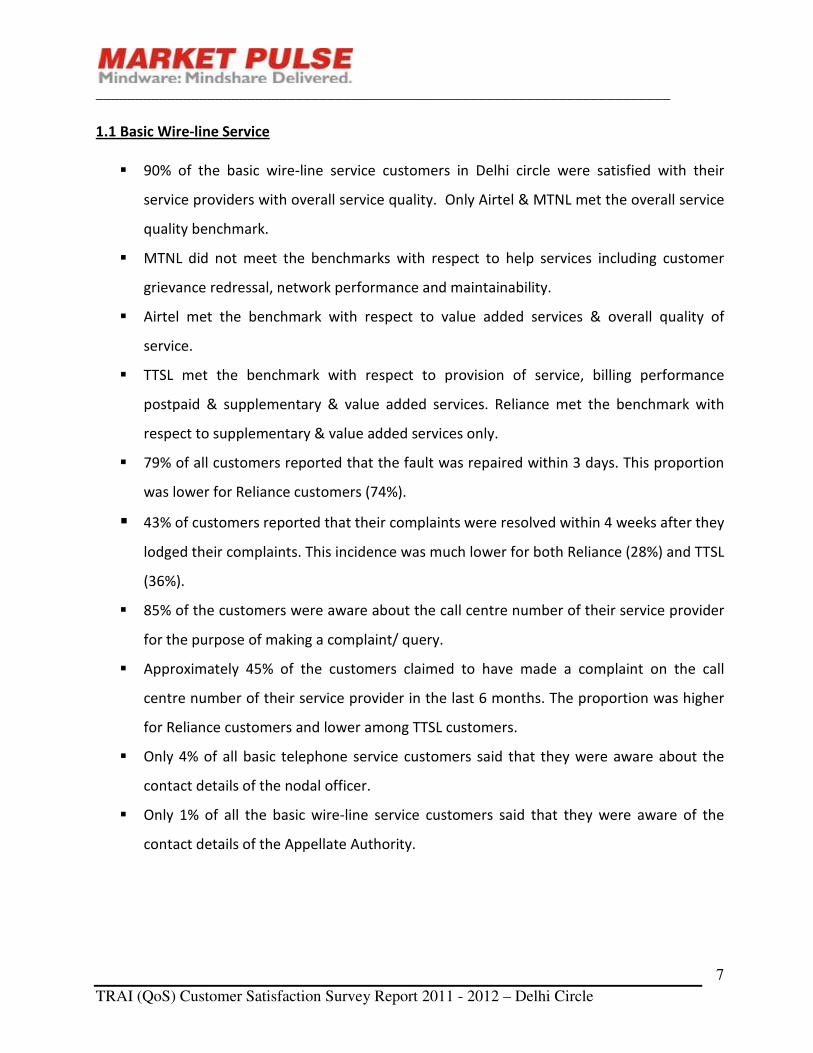
1.1 Basic Wire-line Service
� 90% of the basic wire-line service customers in Delhi circle were satisfied with their
service providers with overall service quality. Only Airtel & MTNL met the overall service
quality benchmark.
� MTNL did not meet the benchmarks with respect to help services including customer
grievance redressal, network performance and maintainability.
� Airtel met the benchmark with respect to value added services & overall quality of
service.
� TTSL met the benchmark with respect to provision of service, billing performance
postpaid & supplementary & value added services. Reliance met the benchmark with
respect to supplementary & value added services only.
� 79% of all customers reported that the fault was repaired within 3 days. This proportion
was lower for Reliance customers (74%).
� 43% of customers reported that their complaints were resolved within 4 weeks after they
lodged their complaints. This incidence was much lower for both Reliance (28%) and TTSL
(36%).
� 85% of the customers were aware about the call centre number of their service provider
for the purpose of making a complaint/ query.
� Approximately 45% of the customers claimed to have made a complaint on the call
centre number of their service provider in the last 6 months. The proportion was higher
for Reliance customers and lower among TTSL customers.
� Only 4% of all basic telephone service customers said that they were aware about the
contact details of the nodal officer.
� Only 1% of all the basic wire-line service customers said that they were aware of the
contact details of the Appellate Authority.

________________________________________________________________________
TRAI (QoS) Customer Satisfaction Survey Report 2011 - 2012 – Delhi Circle
8
1.2 Cellular Mobile Telephone Service
� 87% of all cellular mobile customers were satisfied with overall service quality. Airtel,
Vodafone & Aircel met the benchmark set for overall service quality.
� All the service providers met the benchmark set for provision of service. Only MTNL met the
benchmark set for prepaid billing performance.
� Airtel, Reliance, Idea, Aircel & Etisalat met the benchmark set for postpaid billing
performance.
� None of the service providers met the benchmark set for help services including customer
grievance redressal.
� Airtel, Idea, Vodafone & MTS met the benchmark set for Network performance, reliability &
availability and maintainability. Only MTS & Etisalat met the benchmark set for value added
services.
� Only 43% of the cellular mobile customers who made billing complaints to the call centre
reported that their complaints were resolved within 4 weeks of lodging. This was particularly
low for MTNL.
� 77% of all cellular mobile customers were aware of the call centre number of their service
provider for the purpose of making a complaint/ query. Awareness was very low among
Etisalat customers.
� 41% of all cellular mobile customers claimed that they had complained in the last 6 months
to the toll free Call Centre/ Customer Care/ help-line telephone number. 93% of the
customers reported complaint registration. Only in the case of Aircel, TTSL and Reliance, a
substantial % claimed that the complaint was not registered.
� Only 6% of the cellular mobile customers were aware of the contact details of the nodal
officer while 2% of the mobile phone customers were aware of the contact details of
appellate authority.

________________________________________________________________________
TRAI (QoS) Customer Satisfaction Survey Report 2011 - 2012 – Delhi Circle
9
1.3 Broadband Service
� 86% of all broadband customers were satisfied with overall service quality. Airtel, MTNL
and TATA met the benchmark on this parameter; Reliance, Hathway & Spectranet did not
meet the benchmark scores.
� All service providers met the benchmarks set for provision of service, postpaid billing
performance and network performance except for Reliance & Hathway.
� Only TATA & Spectranet met the benchmark set for help services including customer
grievance redressal.
� None of the service providers met the benchmark set for maintainability while All the
service providers met the benchmark set for supplementary & value added services
except Reliance.
� 79% of the customers got their working connection within 7 working days. However, this
proportion was lower for Spectranet.
� Only 25% of customers reported that their billing complaints were resolved within 4
weeks after they lodged their complaints. 92% of Reliance customers reported that their
complaints were not resolved within 4 weeks.
� 44% of broadband customers who were aware of the call centre number claimed to have
complained in the last 6 months.
� 85% of all broadband customers who had complained claimed that they received a
docket number for most of their complaints.
� 62% all broadband customers who had lodged complaints said that they were satisfied
with the system of resolution of complaints by call centre/ customer care/ helpline.
� Only 10% of the broadband customers said that they were aware of the contact details of
the Nodal Officer while 3% of the customers were aware of the Appellate Authority’s
contact details.

________________________________________________________________________
TRAI (QoS) Customer Satisfaction Survey Report 2011 - 2012 – Delhi Circle
10
2. SCOPE OF THE PROJECT
2.1 Background
TRAI has passed regulations on Quality of Service of Basic & Cellular Mobile Telephone (revised
on 20th
March, 2009), Quality of Service of Broadband Service (2006) and on the Telecom
Consumers & Redressal of Grievances (2007). To determine the effectiveness of implementation
of the regulations, TRAI has initiated the following survey:
(i) Assessment of Implementation and Effectiveness of Telecom Consumers Protection
and Redressal of Grievances Regulations, 2007
(ii) Customer Perception of Service through Survey
With regard to the above mentioned study, Market Pulse has been commissioned by Telecom
Regulatory Authority of India (TRAI) to conduct a Customer Satisfaction Survey (CSS) among
Basic Wire-line, Cellular Mobile Telephone (including FWP) and Broadband customers, in the
Northern zone of India, comprising the metro circle of Delhi and the circles of Delhi, UP East, UP
West, Rajasthan, Punjab, Himachal Pradesh and J&K.
The current report presents the findings of the survey for Delhi circle. This survey was conducted
in the period July – September, 2011.

________________________________________________________________________
TRAI (QoS) Customer Satisfaction Survey Report 2011 - 2012 – Delhi Circle
11
2.2 Survey Objectives
The objectives of this customer satisfaction survey are as follows:
1. To measure the level of satisfaction among customers with respect to:
� Provision of service
� Billing performance
� Help services including customer grievance redressal
� Network performance, reliability and availability
� Maintainability
� Supplementary and value added service
� Overall service quality
2. To measure the awareness among customers with respect to the grievance redressal
mechanism set up by service providers based on the regulations laid down by TRAI.
2.3 Survey Methodology
� The survey was conducted through personal, telephonic and Internet based interviews.
� In the survey of basic telephone service and cellular mobile service customers, 50% of the
sample was covered with the help of personal interviews while the balance interviews were
done on telephone.
� The identity of respondents was recorded in the questionnaires and the signatures of the
customers who were surveyed through personal interviews were taken on the survey
questionnaires. The questionnaires were filled up using a ballpoint pen.
� In the broadband service survey, 50% of the sample was covered through face-to-face
interviews and 50% through a CATI/web-based survey.

________________________________________________________________________
TRAI (QoS) Customer Satisfaction Survey Report 2011 - 2012 – Delhi Circle
12
2.4 Coverage of the Survey
In the period 1st
July to 30th
September of 2011, we conducted the Customer Satisfaction Survey
(CSS) in Delhi circle. The following service providers have been covered in the Delhi circle.
2.4.1 Basic Telephone (Wire-line) Service
1. Bharti Airtel Limited (Referred as Airtel in the report)
2. Mahanagar Telephone Nigam Limited (Referred as MTNL in the report)
3. TTSL Teleservices Delhi Limited (Referred as TTSL in the report)
4. Reliance Communications (Referred as Reliance in the report)
2.4.2 Cellular Mobile Telephone Service (including FWP)
1. Bharti Airtel Limited (Referred as Airtel in the report)
2. Mahanagar Telephone Nigam Limited (Referred as MTNL in the report)
3. Reliance Communications (Referred as Reliance in the report)
4. TTSL Teleservices Delhi Limited (Referred as TTSL in the report)
5. Idea Cellular Limited (Referred as Idea in the report)
6. Vodafone Essar Mobile Services Limited (Referred as Vodafone in the report)
7. Sistema Shyam (Referred as MTS in the report)
8. Aircel Limited (Referred as Aircel in the report)
9. Etisalat (Referred as Etisalat in the report)
2.4.3 Broadband Service
1. Bharti Airtel Limited (Referred as Airtel in the report)
2. Bharat Sanchar Nigam Limited (Referred as MTNL in the report)
3. TTSL Teleservices Delhi Limited (Referred as TTSL in the report)
4. Reliance Communications (Referred as Reliance in the report)
5. Hathway (Referred as Hathway in the report)
6. Spectranet (Referred as Spectranet in the report)

________________________________________________________________________
TRAI (QoS) Customer Satisfaction Survey Report 2011 - 2012 – Delhi Circle
13
2.5 Geographical Coverage
Geographical Coverage Areas/ Exchanges Covered
Delhi Central, East, West, Nehru Place, Trans Yamuna,
North & Bhikaji Kama Place
2.6 Respondent Profile
The random sample included both prepaid & postpaid customers in household and commercial
segments.
2.6.1 Individual/ Household users
Only those above the age of 18 years were interviewed. Actual users of basic telephone service,
mobile or broadband services were interviewed
2.6.2 Commercial users
In case of the basic telephone service survey, the administration or accounts executive/ manager
or whoever takes care of basic telephone service related issues was interviewed. In case of the
broadband survey, the head/manager of the IT/MIS Department or the administration or
accounts executive/ manager was interviewed. In case, there was no such person, then the CEO/
MD/ owner of the firm was interviewed.
2.7 Sampling Methodology & Coverage
A set of residential and commercial areas were identified in 7 main areas of Delhi for this survey.
Random sampling was done in the selected areas to select the respondents.
2.7.1 Basic Telephone (Wire-line) Service: Database obtained from the service providers was
used in case of private operators, while for MTNL, door to door (in residential areas) and office-
to-office (in commercial areas) survey was carried out.

________________________________________________________________________
TRAI (QoS) Customer Satisfaction Survey Report 2011 - 2012 – Delhi Circle
14
MTNL: In Delhi circle, there are 25 exchanges spread over 7 areas. We have covered all the 7
areas namely Central, East, West, Nehru Place, Trans Yamuna, North & Bhikaji Kama Place to get
the geographical spread across Delhi circle. Rural coverage is not being considered as Delhi is a
metropolitan city.
Airtel: Airtel was covered in Central, East, West, Nehru Place, Trans Yamuna, North and Bhikaji
Kama Place.
TTSL: TTSL was covered in Central, East, West, Nehru Place, Trans Yamuna, North and Bhikaji
Kama Place.
Reliance: Reliance was covered in Central, East, West, Nehru Place, Trans Yamuna, North, and
Bhikaji Kama Place.
Service Provider Sample Size Areas Covered
Airtel 1067 7
MTNL 1067 7
TTSL 630 7
Reliance 1067 7
Overall 3831 7
Geographical Coverage Areas Covered
Delhi Central, East, West, Nehru Place, Trans Yamuna,
North, Bhikaji Kama Place

________________________________________________________________________
TRAI (QoS) Customer Satisfaction Survey Report 2011 - 2012 – Delhi Circle
15
2.7.2 Cellular Mobile Telephone Service : For post-paid users, a database obtained from the
service providers was used to boost the sample. The survey was carried out in both residential
areas and commercial areas.
For prepaid users, only a door-to-door (in residential areas) and office-to-office (in commercial
areas) survey was carried out.
In all, there are 9 districts in Delhi, in which we have covered 7 main areas, namely Central, East,
West, Nehru Place, Trans Yamuna, North & Bhikaji Kama Place. Rural coverage is not being
considered as Delhi is a metropolitan city. For all operators including MTNL, 7 main areas have
been covered.
Service Provider Sample Size Areas Covered
Airtel 1067 7
MTNL 1067 7
TTSL 1067 7
Reliance 1067 7
Idea 1067 7
Vodafone 1067 7
Etisalat 1067 7
MTS 1067 7
Aircel 1067 7
Overall 9602 7
Geographical Coverage Areas Covered
Delhi Central, East, West, Nehru Place, Trans Yamuna, North,
Bhikaji Cama Place

________________________________________________________________________
TRAI (QoS) Customer Satisfaction Survey Report 2011 - 2012 – Delhi Circle
16
2.7.3 Broadband Service: In residential areas, the customer database obtained from the service
providers was used. In commercial areas, an office-to-office survey was carried out since
penetration of broadband was high in these areas.
The sample for broadband service customers was evenly spread in the areas served by 10% of
the Points of Presence (POPs) for each service provider in each service area. More than 10% of
point of Presence, has been covered.
MTNL: There are 7 main areas (where their broadband service is available) and we covered all
the 7 areas namely Central, East, West, Nehru Place, Trans Yamuna, North & Bhikaji Kama Place.
Airtel: We have covered North, West, South & East Delhi.
TTSL: We have covered North, West, South & East Delhi.
Reliance: We have covered North, West, South & East Delhi.
Hathway: We have covered North, West, South & East Delhi.
Spectranet: We have covered North, West, South & East Delhi.
Service Provider Sample Size Areas Covered
Airtel 1067 4
MTNL 1067 7
TTSL 1067 4
Reliance 1067 4
Hathway 1067 4
Spectranet 1067 4
Overall 6402
Geographical Coverage Areas Covered
Delhi Central, East, West, Nehru Place, Trans Yamuna,
North & Bhikaji Kama Place

________________________________________________________________________
TRAI (QoS) Customer Satisfaction Survey Report 2011 - 2012 – Delhi Circle
17
2.8 Mode of Interview & Sample Size Covered
2.8.1 Basic Wire-line Service
For customer satisfaction survey of Basic Telephone Service customers, approx. 50% of the
sample was covered with the help of face-to-face interviews while the balance interviews were
done on the telephone.
Service Provider Face to Face Telephonic Sample Size
Covered
Airtel 532 535 1067
MTNL 532 535 1067
TTSL 532 98 630
Reliance 532 535 1067
Overall 2128 1703 3831

________________________________________________________________________
TRAI (QoS) Customer Satisfaction Survey Report 2011 - 2012 – Delhi Circle
18
2.8.2 Cellular Mobile Telephone Service
For the survey of Cellular Mobile Telephone Service customers, approx. 50% of the sample was
covered with the help of face-to-face interviews while the balance interviews were done on the
telephone.
Service Provider Face to Face Telephonic Sample Size Covered
Airtel 532 535 1067
MTNL 531 535 1066
TTSL 532 535 1067
Reliance 532 535 1067
Idea 532 535 1067
Vodafone 532 535 1067
Etisalat 532 535 1067
MTS 532 535 1067
Aircel 532 535 1067
Overall 4787 4815 9603

________________________________________________________________________
TRAI (QoS) Customer Satisfaction Survey Report 2011 - 2012 – Delhi Circle
19
2.8.3 Broadband Service
For customer satisfaction survey of Broadband Service customer, approx. 50% of the sample
were covered through face-to-face interviews and 50% through a CATI/ web-based survey. For
web-based survey we used our proprietary web-based survey editor to host the survey on the
Internet. After sending the survey invitations, follow up phone calls were made to drive
respondents to the survey.
Service Provider Face to Face Telephonic Sample Size
Covered
Airtel 532 535 1067
MTNL 532 535 1067
TTSL 532 535 1067
Reliance 532 535 1067
Hathway 532 535 1067
Spectranet 532 535 1067
Overall 3192 3210 6402

________________________________________________________________________
TRAI (QoS) Customer Satisfaction Survey Report 2011 - 2012 – Delhi Circle
20
2.9 Respondents Profile by Payment Mode Used
2.9.1 Basic Wire-line Service
A total of 4 basic wire-line service providers present in the circle have been covered. All of them
were postpaid connections.
Service Provider Prepaid Postpaid Sample Covered
Airtel -- 1067 1067
MTNL -- 1067 1067
TTSL -- 630 630
Reliance -- 1067 1067
Overall -- 3831 3831
2.9.2 Cellular Mobile Telephone Service
A total of 9 cellular mobile telephone service providers present in the circle as of date have been
covered. Of the total sample of 9,602, prepaid users were 8,895 with the balance being postpaid
customers.
Service Provider Prepaid Postpaid Sample Covered
Airtel 1008 59 1067
MTNL 811 255 1066
TTSL 839 228 1067
Reliance 1023 44 1067
Idea 1038 29 1067
Vodafone 988 79 1067
Etisalat 1064 3 1067
MTS 1063 4 1067
Aircel 1061 6 1067
Overall 8895 707 9602

________________________________________________________________________
TRAI (QoS) Customer Satisfaction Survey Report 2011 - 2012 – Delhi Circle
21
2.9.3 Broadband Service
A total of 6 broadband service providers present in the circle as of date have been covered.
Across various Points of Presence of the Delhi circle, 6,402 broadband service customers were
covered. Of this total sample, 5964 were postpaid customers and 438 were prepaid customers.
Service Provider Prepaid Postpaid Sample
Covered
Airtel 9 1058 1067
MTNL -- 1067 1067
TTSL 9 1058 1067
Reliance 15 1052 1067
Hathway 396 671 1067
Spectranet 9 1058 1067
Overall 438 5964 6402

________________________________________________________________________
TRAI (QoS) Customer Satisfaction Survey Report 2011 - 2012 – Delhi Circle
22
2.10 Respondents Demographic Profile
2.10.1 Basic Wire-line Service
2.10.1.1Gender Profile
Gender % Customers
Male Female Base
Overall 79 21 3831
� 3831 basic telephone service (Wire-line) customers were covered. Of this sample, 79%
were male and the balance 21% were female respondents.
2.10.1.2 Age Profile
Age Group
% Customers
Base Less than 25
years
25-34
years
35-44
years
More than
45 years
Overall 33 33 21 25 3831
� 66% of the customers were less than 35 years while 25% were more than 45 years old.
2.10.1.3 Occupation Profile
Occupation
% Customers
Base Service
Business-
man/ Self
Employed/
Farmers
Student Housewife Retired
Overall 39 45 6 9 2 3831

________________________________________________________________________
TRAI (QoS) Customer Satisfaction Survey Report 2011 - 2012 – Delhi Circle
23
2.11.2 Cellular Mobile Telephone Service
2.11.2.1 Gender Profile
Gender % Customers
Male Female Base
Overall 87 13 9602
� 9602 cellular mobile telephone service customers were covered. Of this sample, 87% were
male and 13% were female respondents.
2.11.2.2 Age Profile
Age Group
% Customers
Base Less than 25
years
25-34
years
35-44
years
More than
45 years
Overall 42 34 16 9 9602
� 76% of the customers were less than 35 years of age while 16% were in the age group 35-44
years and the 9% were more than 45 years old.
2.11.2.3 Occupation Profile
Occupation
% Customers
Base Service
Businessm
an/ Self
Employed/
Farmers
Student Housewife Retired
Overall 46 26 21 7 1 9602
� Out of 9602 cellular mobile telephone service customers, 26% of the customers were
businessmen/ self-employed and 46% of them were salaried while 21% were students.

________________________________________________________________________
TRAI (QoS) Customer Satisfaction Survey Report 2011 - 2012 – Delhi Circle
24
2.12.3 Broadband Service
2.12.3.1 Gender Profile
Gender % Customers
Male Female Base
Overall 85 15 6402
� 6402 broadband service customers were covered. Of this sample, 15% were female
respondents.
2.12.3.2 Age Profile
Age Group
% Customers
Base Less than 25
years
25-34
years
35-44
years
More than
45 years
Overall 18 48 25 9 6402
� 48% of the customers were in the age group of 25 –34 years while 18% were less than 25
years and the 9% were more than 45 years old.

________________________________________________________________________
TRAI (QoS) Customer Satisfaction Survey Report 2011 - 2012 – Delhi Circle
25
2.13 Questionnaire Development Process
Three separate questionnaires were developed for the customer satisfaction survey in
consultation with TRAI. These questionnaires included questions on parameters of Customer
Perception of Service and Implementation and Effectiveness of Telecom Consumer Protection
and Redressal of Grievances Regulations, 2007.
The questionnaires developed were for:
� Basic Wire-line Service
� Cellular Mobile Telephone Service
� Broadband Service
2.14 Methodology for Calculating Percentage of Satisfied Customers
Satisfaction of subscribers has been obtained on a 4-point scale.
To measure the percentage of satisfied customers, the total percentage of satisfied customers
i.e. very satisfied and satisfied customers on various sub-parameters of customer perception of
service, has been computed.
For a parameter, the weighted average of scores on various sub-parameters has been
computed.

________________________________________________________________________
TRAI (QoS) Customer Satisfaction Survey Report 2011 - 2012 – Delhi Circle
26
2.15 Explanation of Benchmarks
TRAI has laid down benchmarks on Customer Perception of Service for the service providers of
Basic Wire-line, Cellular Mobile Telephone and Broadband service. The purpose of laying down
these benchmarks was to protect the interest of consumers of telecommunication services and
to create conditions for maximizing consumer satisfaction by making known the quality of
service that the service providers are required to provide and that the user has a right to expect.
All service providers have to follow these benchmarks, as laid down by TRAI.
2.15.1 Basic Wire-line Service
Customer Perception of Service Benchmarks
% Satisfied with Provision of Service >90%
% Satisfied with Billing Performance >95%
% % Satisfied with Network Performance, Reliability and Availability >95%
% Satisfied with Maintainability >95%
% Satisfaction with Supplementary and Value Added Services >90%
% % Satisfied with Help Services including customer grievance redressal >90%
% Satisfied with Overall Service Quality >90%

________________________________________________________________________
TRAI (QoS) Customer Satisfaction Survey Report 2011 - 2012 – Delhi Circle
27
2.15.2 Cellular Mobile Telephone Service
2.15.3 Broadband Service
Customer Perception of Service Benchmarks
% Satisfied with Provision of Service >90%
% Satisfied with Billing Performance >95%
% Satisfied with Network Performance, Reliability and Availability >95%
% Satisfied with Maintainability >95%
% Satisfaction with Supplementary and Value Added Services >90%
% Satisfied with Help Services including customer grievance redressal >90%
% Satisfied with Overall Service Quality >90%
Customer Perception of Service Benchmarks
% Satisfied with Provision of Service >90%
% Satisfied with Billing Performance >90%
% satisfied with help services >90%
% Satisfied with Network Performance, Reliability and Availability >85%
% Satisfied with Maintainability >85%
% satisfied with Customer satisfaction with offered supplementary services
such as allocation of static/fixed IP addresses, email Ids etc.
>85%
% Satisfied with Overall Service Quality >85%

________________________________________________________________________
TRAI (QoS) Customer Satisfaction Survey Report 2011 - 2012 – Delhi Circle
28
The parameters of customer perception of service have taken into account the following sub-
parameters:
A. Basic Wire-line Service
Provision of Service
� Time taken to provide a customer with working telephone connection
� Ease of understanding or with provision of all relevant information related to tariff plans &
charges
Billing Performance (Postpaid)
� Timely delivery of bills
� Quality, accuracy & completeness of the bills
� Process of resolution of billing complaints
� Clarity of the bills sent by the service provider in terms of transparency and
understandability
Billing Performance (Prepaid)
� Accuracy of amount deducted on every usage
� resolution of billing complaints and the resulting refund/credit/waiver of excess charges on
account of such resolution of complaints
� Ease of recharging process and the transparency of recharge offer

________________________________________________________________________
TRAI (QoS) Customer Satisfaction Survey Report 2011 - 2012 – Delhi Circle
29
Help Services including customer grievance redressal
� Ease of access of call centre/customer care or helpline
� Ease of getting an option for ”talking to a customer care executive”
� Response time taken to answer your call by a customer care executive
� Problem solving ability of the customer care executive(s)
� Time taken by call centre/customer care /helpline to resolve customer complaint
Network Performance, Reliability and Availability
� Availability of working telephone (dial tone)
� Ability to make or receive calls easily
� Voice quality
Maintainability
� Fault repair service
Supplementary and Value Added Services
� Quality of the supplementary services provided
� Process of activating value added services or the process of unsubscribing
� Resolution of your complaint for deactivation of VAS
Overall Service Quality
B. Cellular Mobile Telephone Service
Provision of Service
� Time taken to activate cellular mobile connection after customer applied and completed all
formalities
� Ease of understanding or with provision of all relevant information related to tariff plans &
charges

________________________________________________________________________
TRAI (QoS) Customer Satisfaction Survey Report 2011 - 2012 – Delhi Circle
30
Billing Performance (Postpaid)
� Timely delivery of bills
� Clarity of the bills sent by the service provider in terms of transparency and
understandability
� Accuracy & Completeness of bills
� Process of resolution of billing complaints
Billing Performance (Prepaid)
� Accuracy of amount deducted on every usage
� Resolution of the complaints and the resulting refund/ credit/ waiver of excess charges on
account of resolution of complaints
� Ease of recharging process and the transparency of recharge offer
Help Services including customer grievance redressal
� Ease of access of call centre/customer care or helpline
� Ease of getting an option for ”talking to a customer care executive”
� Response time taken to answer your call by a customer care executive
� Problem solving ability of the customer care executive(s)
� Time taken by call centre/customer care /helpline to resolve customer complaint
Network Performance, Reliability and Availability
� Availability of signal in customer locality
� Ability to make or receive calls easily
� Voice quality
Maintainability
� Availability of network (signal)
� Restoration of network (signal) problems

________________________________________________________________________
TRAI (QoS) Customer Satisfaction Survey Report 2011 - 2012 – Delhi Circle
31
Supplementary and Value Added Services
� Quality of the supplementary services provided
� Process of activating value added services or the process of unsubscribing
� Resolution of your complaint for deactivation of VAS & refund of charges levied
Overall Service Quality
C. Broadband Service
Provision of Service
� Time taken to provide customer with broadband connection after registration and payment
of initial deposit by customer
Billing performance (Postpaid)
� Timely delivery of bills
� Clarity of the bills issued by your service provider in terms of transparency and
understandability
� Accuracy/Completeness of Bills
� Process of resolution of complaints and refund/credit/waiver of excess charges on account
of such resolution of complaints
Billing Performance (Prepaid)
� Accuracy of amount deducted on every usage
� Process of resolution of complaints and refund/credit/waiver of excess charges on account
of such resolution of complaints

________________________________________________________________________
TRAI (QoS) Customer Satisfaction Survey Report 2011 - 2012 – Delhi Circle
32
Help Services
� Ease of access of call centre/customer care or helpline
� Ease of getting an option for “talking to a customer care executive
� Response time taken to answer your call by a customer care executive
� Problem solving ability of the customer care executive(s)
� Time taken by call centre/customer care /helpline to resolve customer complaint
Network Performance, Reliability and Availability
� Speed of broadband connection
� Amount of time for which service is up and working
Maintainability
� Restoration of broadband connection
Supplementary Services
� Process of activating value added services or the process of unsubscribing
� Resolution of your complaint for deactivation of VAS & refund of charges levied
Overall Customer Satisfaction

________________________________________________________________________
TRAI (QoS) Customer Satisfaction Survey Report 2011 - 2012 – Delhi Circle
33
2.16 Definition of Key Terms Used
Appellate Authority: It means one or more persons appointed as appellate authority under
regulation 10, by a service provider, falling in the clause (a) or clause (b) of sub-regulation (3) of
regulation.
Basic Wire-line Service: It covers collection, carriage, transmission and delivery of voice or non-
voice messages over licensee’s Public Switched Telephone Network in the licensed service area
and includes provision of all types of services except those requiring a separate license.
Broadband Service: It means data connection….
(1) which is always on and is able to support interactive services including Internet access.
(2) which has the capability of the minimum download speed of 256 kilo bits per second (kbps)
or such minimum download speed, as may be specified by the licensor, from time to time, to an
individual subscriber from the point of presence of the service provider intending to provide
Broadband service where a multiple of such individual Broadband connections are aggregated
and the subscriber is able to access these interactive services including the internet through the
said point of presence.
(3) in which the interactive services shall exclude and services for which a separate license is
specifically required (such as real-time voice transmission) except to the extent permitted, or, as
may be permitted, under internet service provider’s license with internet telephony.
(4) which shall include such service or download speed or features, as may be specified from
time to time, by the licensor.
Call Centre: means a department or a section or a facility established under regulation 3 by the
service provider, falling in clause (a) or clause (b) of the sub-regulation 3 of regulation 1 for
redressal of grievances of its consumer by telephone or electronic means or by any other means.
Cellular Mobile Telephone Service: Means….

________________________________________________________________________
TRAI (QoS) Customer Satisfaction Survey Report 2011 - 2012 – Delhi Circle
34
(1) telecommunication service provided by mean of a telecommunication system for the
conveyance of the message through the agency of wireless telegraphy where every message
that is conveyed thereby has been, or is to be, conveyed by means of a telecommunication
systems which is designed or adapted to be capable of being used while in motion.
(2) refers to transmission of voice or non-voice message over Licensee’s Network in real time but
service does not cover broadcasting of any messages, voice or non-voice; however, Cell
Broadcast is permitted only to the customers of the service.
(3) in respect of which the subscriber (all types, pre-paid as well as post-paid) has to be
registered and authenticated at the network point of registration and approved numbering plan
shall be applicable.
Consumer: means a consumer of a service provider falling in clause (a) or clause (b) of sub-
regulation (3) of regulation 1 and includes its customer and subscriber.
Manual: means the Manual of Practice for handling consumer complaints referred to in
regulation 20.
Nodal Officer: means the officer appointed or designated under regulation 6 by a service
provider falling in clause (a) or clause (b) of sub-regulation (3) of regulation 1.
________________________________________________________________________
TRAI (QoS) Customer Satisfaction Survey Report 2011 - 2012 – Delhi Circle
35
3. COMPLIANCE REPORT ON CUSTOMER PERCEPTION OF SERVICE
The compliance report has been presented, by using the following method:
The percentage of customers satisfied on various QoS parameters was derived by using the
methodology explained in section 2.14 (Page 25). According to this methodology, the total
percentage of satisfied customers i.e. very satisfied and satisfied customers on various QoS
parameters has been taken into account. This methodology has been used to derive the
percentage of customers satisfied with QoS parameters for all the three services i.e. Basic
Telephone, Cellular Mobile and Broadband.

________________________________________________________________________
TRAI (QoS) Customer Satisfaction Survey Report 2011 - 2012 – Delhi Circle
36
3.1 Basic Wire-line Service 3.1.1 The following table shows the percentage of customers satisfied on QoS parameters.
Sub Parameters Bench
marks
% Customers
Airtel MTNL TTSL Reliance Overall
% Satisfied with Provision of Service ≥90% 88 97 100 68 89
% Satisfied with Billing Performance
Postpaid ≥95% 92 96 94 90 93
% Satisfied with Billing Performance
Prepaid* ≥95% -- -- -- -- --
% Satisfied with Help Services including
customer grievance redressal ≥90% 83 84 77 65 77
% Satisfied with Network Performance,
Reliability and Availability ≥95% 94 94 92 89 92
% Satisfied with Maintainability ≥95% 82 81 81 62 76
% Supplementary and Value Added
Services* ≥90% 94 95 100 100 96
% Satisfied with Overall Service Quality ≥90% 92 92 89 87 90
Base 1067 1067 630 1067 3831
* Denotes small sample and thus, statistically invalid data.
� 90% of the basic wire-line service customers in Delhi circle were satisfied with their
service providers with overall service quality. Only Airtel & MTNL met the overall service
quality benchmark.
� MTNL did not meet the benchmarks with respect to help services including customer
grievance redressal, network performance and maintainability.
� Airtel met the benchmark with respect to value added services & overall quality of
service.
� TTSL met the benchmark with respect to provision of service, billing performance
postpaid & supplementary & value added services.
� Reliance met the benchmark with respect to supplementary & value added services only.

________________________________________________________________________
TRAI (QoS) Customer Satisfaction Survey Report 2011 - 2012 – Delhi Circle
37
3.1.2 % of customers who reported that their telephone fault was repaired within 3 days.
Type
% Customers
Airtel MTNL TTSL Reliance Overall
Overall 85 81 77 74 79
Base 332 462 234 400 1428
� 79% of all customers reported that the fault was repaired within 3 days.
� This proportion was lower for Reliance customers (74%).
3.1.3 % of customers who reported that their telephone service was terminated within 7 days
of request.
Type
% Customers
Airtel MTNL TTSL Reliance Overall
Overall 75
-- --
82
79
*Base 16 -- -- 22 38
*Denotes small sample and thus, statistically invalid data
3.1.4 % of customers who reported that their billing complaints were resolved by call centre
within 4 weeks.
Type
% Customers
Airtel MTNL TTSL Reliance Overall
Overall 55 52 36 28 43
Base 461 346 126 531 1464
� 43% of customers reported that their complaints were resolved within 4 weeks after they
lodged their complaints.
� This incidence was much lower for both Reliance (28%) and TTSL (36%).

________________________________________________________________________
TRAI (QoS) Customer Satisfaction Survey Report 2011 - 2012 – Delhi Circle
38
3.2 Cellular Mobile Telephone Service 3.2.1 The following table shows the percentage of customers satisfied on QoS parameters.
Sub Parameters Bench
marks
% Customers
Air
tel
MT
NL
TT
SL
Re
lia
nce
Ide
a
Vo
da
fon
e
MT
S
Air
cel
Eti
sala
t
Ov
era
ll
% Satisfied with Provision of
Service ≥90% 97 97 98 98 97 97 99 97 97 97
% Satisfied with Billing
Performance Prepaid ≥95% 89 95 89 84 89 92 92 87 91 89
% Satisfied with Billing
Performance Postpaid ≥95% 96 82 89 98 95 91 50 96 100 88
% Satisfied with Help
Services including customer
grievance redressal
≥90% 81 82 77 71 77 82 87 72 89 79
% Satisfied with Network
Performance, Reliability and
Availability
≥90% 95 81 87 82 90 95 90 89 80 88
% Satisfied with
Maintainability ≥90% 94 79 86 81 91 95 92 89 82 88
% Supplementary and Value
Added Services ≥90% 86 71 89 89 83 87 90 89 92 87
% Satisfied with Overall
Service Quality ≥90% 90 82 88 78 87 92 88 91 86 87
Base 1067 1066 1067 1067 1067 1067 1067 1067 1067 9602
� 87% of all cellular mobile customers were satisfied with overall service quality. Airtel,
Vodafone & Aircel met the benchmark set for overall service quality.
� All the service providers met the benchmark set for provision of service.
� Only MTNL met the benchmark set for prepaid billing performance.

________________________________________________________________________
TRAI (QoS) Customer Satisfaction Survey Report 2011 - 2012 – Delhi Circle
39
� Airtel, Reliance, Idea, Aircel & Etisalat met the benchmark set for postpaid billing
performance.
� None of the service providers met the benchmark set for help services including customer
grievance redressal.
� Airtel, Idea, Vodafone & MTS met the benchmark set for Network performance, reliability &
availability and maintainability.
� Only MTS & Etisalat met the benchmark set for value added services.
3.2.2 % customers who reported billing complaint resolution by call centre within 4 weeks.
Type
% Customers
Air
tel
MT
NL
TT
SL
Re
lia
nce
Ide
a
Vo
da
fon
e
MT
S
Air
cel
Eti
sala
t
Ov
era
ll
Overall 55 20 43 49 40 42 40 46 35 43
Base 433 269 390 523 362 288 299 352 137 3053
� Only 43% of the cellular mobile customers who made billing complaints to the call centre
reported that their complaints were resolved within 4 weeks of lodging. This was
particularly low for MTNL.

________________________________________________________________________
TRAI (QoS) Customer Satisfaction Survey Report 2011 - 2012 – Delhi Circle
40
3.3 Broadband Service
3.3.1 Percentage of customers satisfied on QoS parameters
Sub Parameters Bench
marks
% Customers
Airtel MTNL TTSL Reliance Hathway Spectranet Overall
% Satisfied with
Provision of Service ≥90% 96 98 99 83 90 94 93
% Satisfied with Billing
Performance Prepaid ≥90% 100* 100* 100* 88 100* 89
% Satisfied with Billing
Performance Postpaid ≥90% 94 96 91 79 89 98 91
% Satisfied with Help
Services including
customer grievance
≥90% 82 87 97 76 87 92 87
% Satisfied with
Network Performance,
Reliability and
Availability
≥85% 91 89 94 80 80 92 88
% Satisfied with
Maintainability ≥85% 59 42 49 13 4 51 29
% Supplementary and
Value Added Services ≥85% 89 94 98 82 87 100 92
% Satisfied with
Overall Service ≥85% 89 87 94 80 81 84 86
Base 1067 1067 1067 1067 1067 1067 6402
� 86% of all broadband customers were satisfied with overall service quality. Airtel, MTNL
and TTSL met the benchmark on this parameter; Reliance, Hathway & Spectranet did not
meet the benchmark scores.

________________________________________________________________________
TRAI (QoS) Customer Satisfaction Survey Report 2011 - 2012 – Delhi Circle
41
� All service providers met the benchmarks set for provision of service, postpaid billing
performance and network performance except for Reliance & Hathway.
� Only TTSL & Spectranet met the benchmark set for help services including customer
grievance redressal.
� None of the service provider met the benchmark set for maintainability while All the
service providers met the benchmark set for supplementary & value added services
except Reliance.
3.3.2 % of customers who reported getting a working connection within 7 days.
Type
% Customers
Airtel MTNL TTSL Reliance Hathway Spectranet Overall
Overall 88 81 93 77 74 62 79
Base 1067 1067 1067 1067 1067 1067 6402
� 79% of the customers got their working connection within 7 working days. However, this
proportion was lower for Spectranet.
3.3.3 % of customers who reported that their billing complaints were resolved by call centre
within 4 weeks.
Type % Customers
Airtel MTNL TTSL Reliance Hathway Spectranet Overall
Overall 16 20 24 8 57 24 25
Base 422 251 173 593 481 407 2327
� Only 25% of customers reported that their billing complaints were resolved within 4
weeks after they lodged their complaints. 92% of Reliance customers reported that their
complaints were not resolved within 4 weeks.

________________________________________________________________________
TRAI (QoS) Customer Satisfaction Survey Report 2011 - 2012 – Delhi Circle
42
4. DETAILED SURVEY FINDINGS
4.1 Basic Wire-line Service – Delhi Circle
Customer Satisfaction Survey in the Delhi circle was done among customers of 4 Basic Wire-line
Service providers i.e. Airtel and MTNL.
4.1.1 Customer Satisfaction with Provision of Service
4.1.1. The following table shows the percentage of customers satisfied with different sub-
parameters of Provision of Service
Sub Parameters
% Customers
Airtel MTNL TTSL Reliance Overall
Time taken to provide working
connection 80 96 100 42 80
Ease of understanding 95 99 100 94 97
Overall Provision of Service 88 97 100 68 89
Base 40 72 63 62 237
� 80% of the customers were satisfied with the time taken to provide a working telephone.
This score was low among Reliance (42%) customers.
� 97% of the customers were satisfied with the ease of understanding/ provision of all
relevant information related to tariff plans & charges.
� Reliance’s satisfaction with provision of service was low because of the time taken to
provide working connections.

________________________________________________________________________
TRAI (QoS) Customer Satisfaction Survey Report 2011 - 2012 – Delhi Circle
43
4.1.2a Customer Satisfaction with Billing Performance among Postpaid Customers
4.1.2.1a The following table shows the percentage of postpaid customers satisfied with
different sub-parameters of billing performance.
Sub Parameters
% Postpaid Customers
Airtel MTNL TTSL Reliance Overall
Timely delivery of bills 94 96 96 92 94
Quality, Accuracy &
Completeness of the bills 94 97 96 94 95
Process of resolution of
billing complaints 43 57 57 28 43
Clarity of the bills in terms
of transparency &
understandability
94 99 94 92 95
Overall Postpaid Billing
Performance 92 96 94 90 93
Base 1067 1067 630 1067 3831
� 43% customers were satisfied on account of process of resolution of billing complaints.
This was significantly low among Reliance customers and dragged down the Reliance’s
satisfaction score with overall billing performance.
� Performance on all other aspects was highly satisfactory.
4.1.2.2b Customer Satisfaction with Billing Performance among Prepaid Customers
Note: Service providers did not report prepaid wire-line customers and hence a corresponding
sample was not covered.

________________________________________________________________________
TRAI (QoS) Customer Satisfaction Survey Report 2011 - 2012 – Delhi Circle
44
4.1.3 Customer Satisfaction with Help Services including customer grievance redressal
4.1.3.1 The following table shows the percentage of customers satisfied with sub-parameters
of help services including customer grievance redressal.
Sub Parameters
% Customers
Airtel MTNL TTSL Reliance Overall
Ease of access of call centre/customer
care or help-line 84 89 79 72 81
Ease of getting an option for “ talking to a
customer care executive” 83 85 74 68 78
Response time taken to answer the call 82 86 74 65 77
Problem solving ability of customer care
executive 82 81 79 62 76
Time taken by call centre/customer care
/helpline to resolve complaint 82 81 79 61 75
Overall 83 84 77 65 77
Base 735 657 342 702 2436
� Reliance customers were less satisfied with all aspects of help services.
� Time taken by customer care to resolve complaints registered the lowest proportion of
satisfied customers.

________________________________________________________________________
TRAI (QoS) Customer Satisfaction Survey Report 2011 - 2012 – Delhi Circle
45
4.1.4 Customer Satisfaction with Network Performance, Reliability & Availability
4.1.4.1 The following table shows the percentage of customers satisfied with sub-parameters
of network performance, reliability & availability.
Sub Parameters
% Customers
Airtel MTNL TTSL Reliance Overall
Availability of working telephone (dial tone) 95 94 94 88 93
Ability to make or receive calls easily 95 95 91 89 93
Voice Quality 93 92 90 89 91
Overall Network Performance 94 94 92 89 92
Base 1067 1067 630 1067 3831
� A higher percentage of Airtel & MTNL’s customers were satisfied with the availability of
working telephone (dial tone), ability to make or receive calls easily and voice quality.
� Reliance (88%) registered a low percentage of customers satisfied with the availability of
working telephone (dial tone) as well as voice quality.

________________________________________________________________________
TRAI (QoS) Customer Satisfaction Survey Report 2011 - 2012 – Delhi Circle
46
4.1.5 Customer Satisfaction with Maintainability
4.1.5.1 The following table shows the percentage of customers satisfied with maintainability.
Sub Parameters
% Customers
Airtel MTNL TTSL Reliance Overall
Fault repair service 82 81 81 62 76
Overall Maintainability 82 81 81 62 76
Base 332 462 234 400 1428
� A lower percentage of Reliance customers were satisfied with the fault repair service as
compared to other service providers.
4.1.6 Customer Satisfaction with Supplementary and Value Added Services
4.1.6.1 The following table shows the percentage of customers satisfied with supplementary
and value added services.
Sub Parameters
% Customers
Airtel MTNL TTSL Reliance Overall
Quality of the supplementary services /
value added service 94 95 100 100 96
Process of activating value added
services or the process of unsubscribing 92 98 100 100 97
Overall Value Added Services 94 95 100 100 96
Base 79 59 63 24 225
� All the service providers met the benchmark set for supplementary & value added
services. There was no issue on any aspect.

________________________________________________________________________
TRAI (QoS) Customer Satisfaction Survey Report 2011 - 2012 – Delhi Circle
47
4.1.7 Customer Satisfaction with Overall Service Quality
4.1.7.1 The following table shows the % of customers satisfied with overall service quality.
� 90% of the customers were satisfied with the overall quality of telephone service. The
satisfaction was lower among Reliance & TTSL customers.
Sub Parameters
% Customers
Airtel MTNL TTSL Reliance Overall
Overall quality of Telephone service 92 92 89 87 90%
Base 1067 1067 630 1067 3831
________________________________________________________________________
TRAI (QoS) Customer Satisfaction Survey Report 2011 - 2012 – Delhi Circle
48
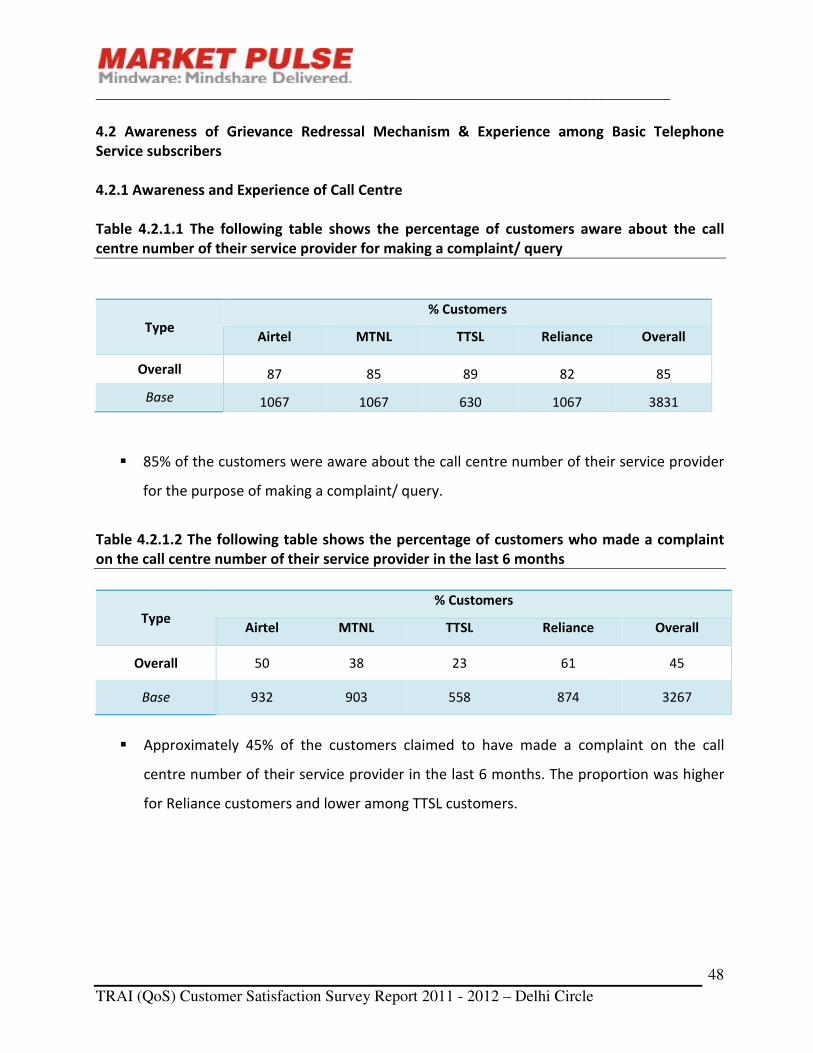
4.2 Awareness of Grievance Redressal Mechanism & Experience among Basic Telephone
Service subscribers
4.2.1 Awareness and Experience of Call Centre
Table 4.2.1.1 The following table shows the percentage of customers aware about the call
centre number of their service provider for making a complaint/ query
Type
% Customers
Airtel MTNL TTSL Reliance Overall
Overall 87 85 89 82 85
Base 1067 1067 630 1067 3831
� 85% of the customers were aware about the call centre number of their service provider
for the purpose of making a complaint/ query.
Table 4.2.1.2 The following table shows the percentage of customers who made a complaint
on the call centre number of their service provider in the last 6 months
Type
% Customers
Airtel MTNL TTSL Reliance Overall
Overall 50 38 23 61 45
Base 932 903 558 874 3267
� Approximately 45% of the customers claimed to have made a complaint on the call
centre number of their service provider in the last 6 months. The proportion was higher
for Reliance customers and lower among TTSL customers.

________________________________________________________________________
TRAI (QoS) Customer Satisfaction Survey Report 2011 - 2012 – Delhi Circle
49
4.2.1.3 The following table shows the percentage of customers who received or did not receive
docket numbers for their complaints.
Sub Parameters
% Customers
Airtel MTNL TTSL Reliance Overall
Docket number received for most
of the complaints 86 84 50 79 80
No docket number received for
most of the complaints 6 11 43 7 11
It was received on request 7 4 7 13 8
No docket number received even
on request 1 1 0 2 1
Base 461 346 126 531 1464
� 80% of the customers who had complained said that they had received a docket number
for most of their complaints. This was significantly higher for Airtel customers as
compared to TTSL customers.
� 11% of all customers who had complained said that they did not receive docket number
for most of their complaints. 8% received it on request.

________________________________________________________________________
TRAI (QoS) Customer Satisfaction Survey Report 2011 - 2012 – Delhi Circle
50
4.2.1.4 The following table shows the percentage of customers who were informed about the
action taken on their complaint by call centre.
Type
% Customers
Airtel MTNL TTSL Reliance Overall
Overall 80 80 50 49 66
Base 461 346 126 531 1464
� 66% all the basic telephone service customers who had complained said that they were
informed about the action taken on their complaint by call centre.
� A lower proportion of Reliance & TTSL customers were informed about the action taken
on their complaint by call centre.
4.2.1.5 The following table shows the percentage of customers who got their billing
complaints resolved satisfactorily by call centre/customer care within four weeks.
Type
% Customers
Airtel MTNL TTSL Reliance Overall
Overall 55 52 36 28 43
Base 461 346 126 531 1464
� 43% of the customers who had made billing complaints said that their complaints were
resolved satisfactorily by the call centre/ customer care within four weeks of lodging
their complaints. This was lower for both TTSL and Reliance.

________________________________________________________________________
TRAI (QoS) Customer Satisfaction Survey Report 2011 - 2012 – Delhi Circle
51
4.2.2 Awareness and experience of Nodal Officer
Table 4.2.2.1 The following table shows the percentage of customers who were aware about
contact details of nodal officer.
Type
% Customers
Airtel MTNL TTSL Reliance Overall
Overall 5 5 -- 5 4
Base 1067 1067 630 1067 3831
� Only 4% of all basic telephone service customers said that they were aware about the
contact details of the nodal officer. None of the TTSL customers were aware of the nodal
officer.
Table 4.2.2.2 The percentage of customers who have made complaints to the Nodal Officer
Type
% Customers
Airtel MTNL TTSL Reliance Overall
Overall 21 35 -- 53 36
Base 52 48 -- 51 151
� Of those who were aware of the Nodal Officer’s contact details, 36% claimed to have
complained to the nodal officer.

________________________________________________________________________
TRAI (QoS) Customer Satisfaction Survey Report 2011 - 2012 – Delhi Circle
52
Table 4.2.2.3 The percentage of customers who were able to contact to the Nodal Officer
without difficulty.
Type
% Customers
Airtel MTNL TTSL Reliance Overall
Overall 73 47 -- 56 56
Base 11 17 -- 27 55
� Only 56% of the customers who contacted the Nodal Officers, claimed to have been able
to do so without any difficulty.
Table 4.2.2.4 The percentage of customers who were intimated about the decision taken on
their complaints by the Nodal Officer
Type
% Customers
Airtel MTNL TTSL Reliance Overall
Overall 82 59 -- 44 56
Base 11 17 -- 27 55
� 56% of those customers, who complained to the Nodal Officer, claimed that they were
intimated about the decision taken on their complaints by the Nodal Officer.

________________________________________________________________________
TRAI (QoS) Customer Satisfaction Survey Report 2011 - 2012 – Delhi Circle
53
Table 4.2.2.5 % of customers satisfied with redressal of complaint by the Nodal Officer
Type
% Customers
Airtel MTNL TTSL Reliance Overall
Overall 82 65 -- 30 51
Base 11 17 -- 27 55
� 51% of customers, who complained to the Nodal Officer, claimed that they were satisfied
with redressal of complaint by the Nodal Officer.
4.2.3 Awareness and experience of Appellate Authority
Table 4.2.3.1 The following table shows the percentage of customers who were aware about
the contact details of the appellate authority.
Type
% Customers
Airtel MTNL TTSL Reliance Overall
Overall 2 1 -- -- 1
Base 1067 1067 630 1067 3831
� Only 1% of all the basic wire-line service customers said that they were aware of the
contact details of the Appellate Authority. None of the TTSL and Reliance customers were
aware of the Appellate Authority’s details.

________________________________________________________________________
TRAI (QoS) Customer Satisfaction Survey Report 2011 - 2012 – Delhi Circle
54
4.2.3.2 Incidence of Appeal being filed in the prescribed form in the last 6 months
Type
% Customers
Airtel MTNL TTSL Reliance Overall
Overall -- 7 -- -- 2
Base 22 15 -- 4 41
� 2% of all the basic wire-line service customers who were aware of the contact details of
Appellate Authority claimed to have filed an appeal in last the 6 months.
4.2.3.3 Percentage of Customers who filed an appeal with the Appellate & Received an
Acknowledgement
Type
% Customers
Airtel MTNL TTSL Reliance Overall
Overall -- 100 -- -- 100
Base -- 1 -- -- 1
4.2.3.4 Percentage of Customers who filed an appeal with the Appellate & for Whom a
Decision was taken within 3 months
Type
% Customers
Airtel MTNL TTSL Reliance Overall
Overall -- 100 -- -- 100
Base --
1
--
--
1

________________________________________________________________________
TRAI (QoS) Customer Satisfaction Survey Report 2011 - 2012 – Delhi Circle
55
4.2.4 General Information
Table 4.2.4.1 The following table shows the percentage of the new customers who got the
Manual of Practice containing the terms and conditions of service, toll free number of call
centre and contact details of Nodal Officer & Appellate Authority for complaint redressal etc.,
while subscribing to the new basic telephone connection.
Type
% Customers
Airtel MTNL TTSL Reliance Overall
Overall 49 42 54 36 44
Base 1067 1067 630 1067 3831
� 44% of the new basic telephone service customers said that they got the Manual of
Practice while subscribing to the new basic telephone connection.
Table 4.2.4.2 The following table shows the percentage of prepaid customers who were aware
that a prepaid customer can get item-wise usage charge details, on request.
� Note: Service providers did not report prepaid wire-line customers and hence a
corresponding sample was not covered.
4.2.4.3 The following table shows the percentage of customers who were denied item-wise
usage charge details for their pre-paid connection.
� Note: Service providers did not report prepaid wire-line customers and hence a
corresponding sample was not covered.
Table 4.2.4.4 The following table shows the percentage of customers who cited different
reason(s) for their request for item-wise details being denied.
� Note: Service providers did not report prepaid wire-line customers and hence a
corresponding sample was not covered.

________________________________________________________________________
TRAI (QoS) Customer Satisfaction Survey Report 2011 - 2012 – Delhi Circle
56
Table 4.2.4.5 The following table shows the percentage of customers who terminated a
telephone connection in the last 6 months.
Type
% Customers
Airtel MTNL TTSL Reliance Overall
Overall 2 1 0 2 1
Base 1067 1067 630 1067 3831
� Only 1% of the customers claimed to have terminated a wire-line telephone connection
in the last 6 months.
4.2.4.6 The following table shows the percentage of customers who terminated a telephone
connection of a particular service provider in the last 6 months.
Sample is too sample to report any meaningful information.
4.2.4.8 The following table shows the percentage of customers who were aware about getting
rent rebate in case fault is not repaired within 3 days
Type
% Customers
Airtel MTNL TTSL Reliance Overall
Overall 18 21 27 13 19
Base 1067 1067 630 1067 3831
� Only 19% of the customers were aware about the rent rebate entitlement, in case fault
was not repaired within 3 days.

________________________________________________________________________
TRAI (QoS) Customer Satisfaction Survey Report 2011 - 2012 – Delhi Circle
57
4.2.5.1 The following table shows the percentage of customers who were aware about the
facility for registering telephone number with the service provider for not receiving unwanted
tele marketing calls/SMS.
Type
% Customers
Airtel MTNL TTSL Reliance Overall
Overall 32 30 21 39 32
Base 1067 1067 630 1067 3831
� 32% of the customers were aware about the facility for registering telephone number
with the service provider for not receiving unwanted tele marketing calls/SMS.
4.2.5.2 The following table shows the percentage of customers who registered with service
provider for not receiving any unwanted tele marketing calls/SMS
Type
% Customers
Airtel MTNL TTSL Reliance Overall
Overall 6 1 0 5 4
Base 337 321 135 419 1212
� Only 4% of the aware customers were registered with the service provider for not
receiving unwanted tele marketing calls/SMS.

________________________________________________________________________
TRAI (QoS) Customer Satisfaction Survey Report 2011 - 2012 – Delhi Circle
58
4.2.5.3 The following table shows the percentage of customers who reported varying degrees
of reduction in number of unwanted tele marketing calls/SMS received after registering.
Sub Parameters
% Customers
Airtel MTNL TTSL Reliance Overall
No change 10 25 -- -- 7
Slight decrease 5 -- -- -- 2
Considerable decrease 10 25 -- -- 7
Stopped receiving 76 50 -- 100 84
Base 21 4 -- 19 44
� Of the customers who had registered in the DNC register, 84% had stopped receiving
unwanted tele-marketing calls/ SMSes.
________________________________________________________________________
TRAI (QoS) Customer Satisfaction Survey Report 2011 - 2012 – Delhi Circle
59
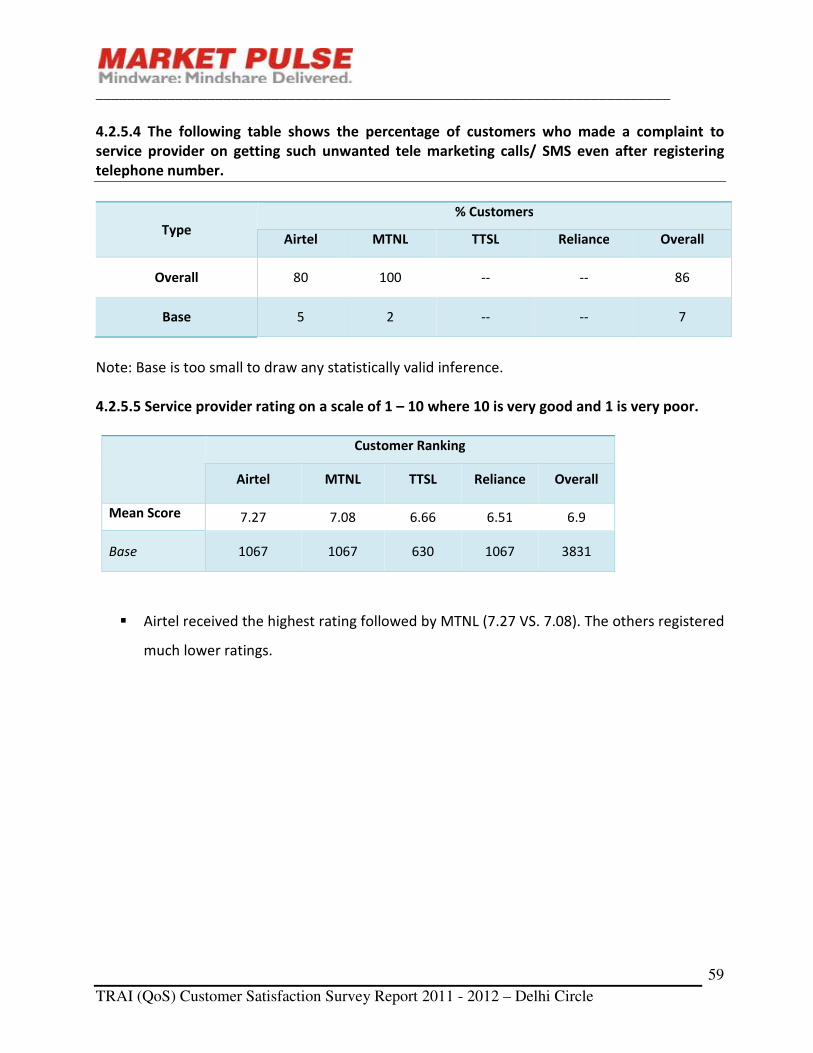
4.2.5.4 The following table shows the percentage of customers who made a complaint to
service provider on getting such unwanted tele marketing calls/ SMS even after registering
telephone number.
Type
% Customers
Airtel MTNL TTSL Reliance Overall
Overall 80 100 -- -- 86
Base 5 2 -- -- 7
Note: Base is too small to draw any statistically valid inference.
4.2.5.5 Service provider rating on a scale of 1 – 10 where 10 is very good and 1 is very poor.
Customer Ranking
Airtel MTNL TTSL Reliance Overall
Mean Score 7.27 7.08 6.66 6.51 6.9
Base 1067 1067 630 1067 3831
� Airtel received the highest rating followed by MTNL (7.27 VS. 7.08). The others registered
much lower ratings.
________________________________________________________________________
TRAI (QoS) Customer Satisfaction Survey Report 2011 - 2012 – Delhi Circle
60
4.3 Cellular Mobile Telephone Service – Delhi Circle
Customer Satisfaction Survey in the Delhi circle was done among customers of 9 Cellular Mobile
Telephone service providers i.e. Airtel, MTNL, Reliance, TTSL, Idea, Vodafone, MTS, Aircel and
Etisalat.
4.3.1 Customer Satisfaction with Provision of Service
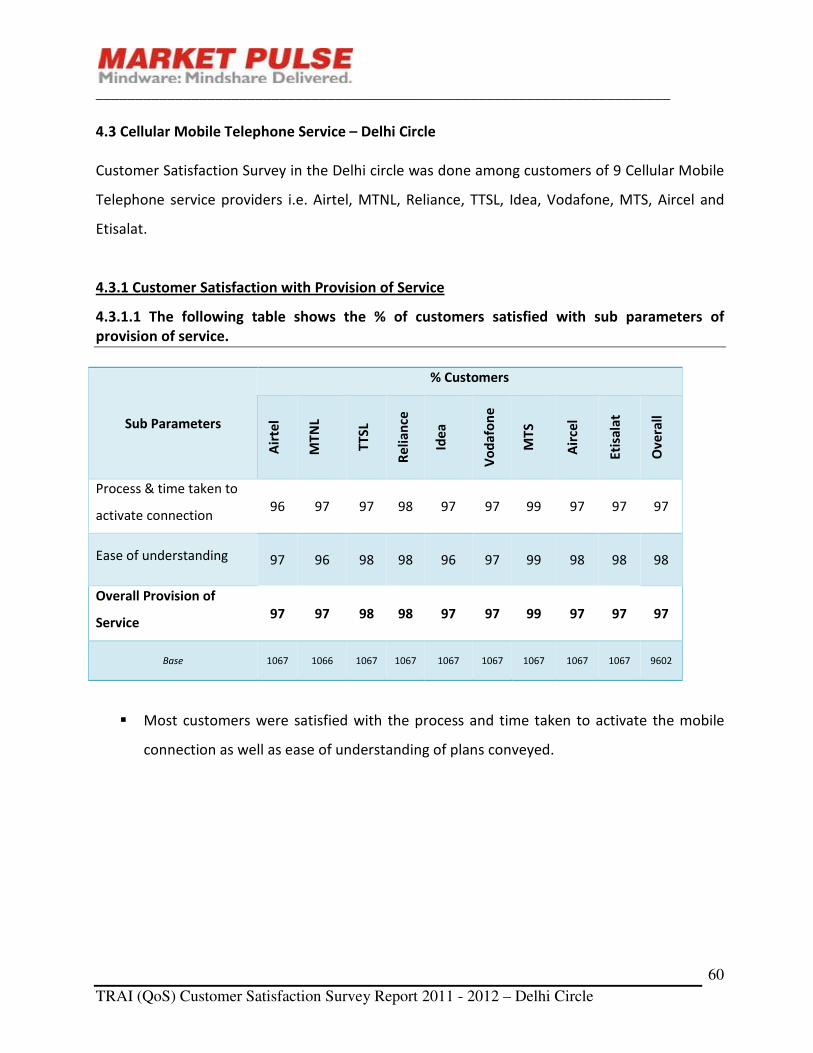
4.3.1.1 The following table shows the % of customers satisfied with sub parameters of
provision of service.
Sub Parameters
% Customers
Air
tel
MT
NL
TT
SL
Re
lia
nce
Ide
a
Vo
da
fon
e
MT
S
Air
cel
Eti
sala
t
Ov
era
ll
Process & time taken to
activate connection 96 97 97 98 97 97 99 97 97 97
Ease of understanding 97 96 98 98 96 97 99 98 98 98
Overall Provision of
Service 97 97 98 98 97 97 99 97 97 97
Base 1067 1066 1067 1067 1067 1067 1067 1067 1067 9602
� Most customers were satisfied with the process and time taken to activate the mobile
connection as well as ease of understanding of plans conveyed.

________________________________________________________________________
TRAI (QoS) Customer Satisfaction Survey Report 2011 - 2012 – Delhi Circle
61
4.3.2a Customer Satisfaction with Billing Performance among Postpaid Customers
4.3.2.1a The following table shows the percentage of postpaid customers satisfied with sub-
parameters of billing performance.
Sub Parameters
% Postpaid Customers
Air
tel
MT
NL
TT
SL
Re
lia
nce
Ide
a
Vo
da
fon
e
MT
S
Air
cel
Eti
sala
t
Ov
era
ll
Timely delivery of bills 95 68 80 98 97 92 50 83 100 80
Clarity of the bills in terms of
transparency and
understandability
98 90 96 100 93 92 50 100 100 94
Accuracy & completeness of the
bills 95 88 91 100 97 85 50 100 100 90
Process of resolution of billing
complaints 95 83 88 96 93 94 50 100 100 88
Overall Postpaid Billing
Performance 96 82 89 98 95 91 50 96 100 88
Base 59 255 228 44 29 79 *4 *6 *3 707
*Denotes small sample not adequate for any statistical inference.
� Overall satisfaction was low on account of timely delivery of bills, especially for TTSL.
� Satisfaction was high on account of clarity of bills in terms of transparency and
understandability.
� However, satisfaction on account of billing complaint resolution was low for most service
providers with substantial population of postpaid customers.
________________________________________________________________________
TRAI (QoS) Customer Satisfaction Survey Report 2011 - 2012 – Delhi Circle
62
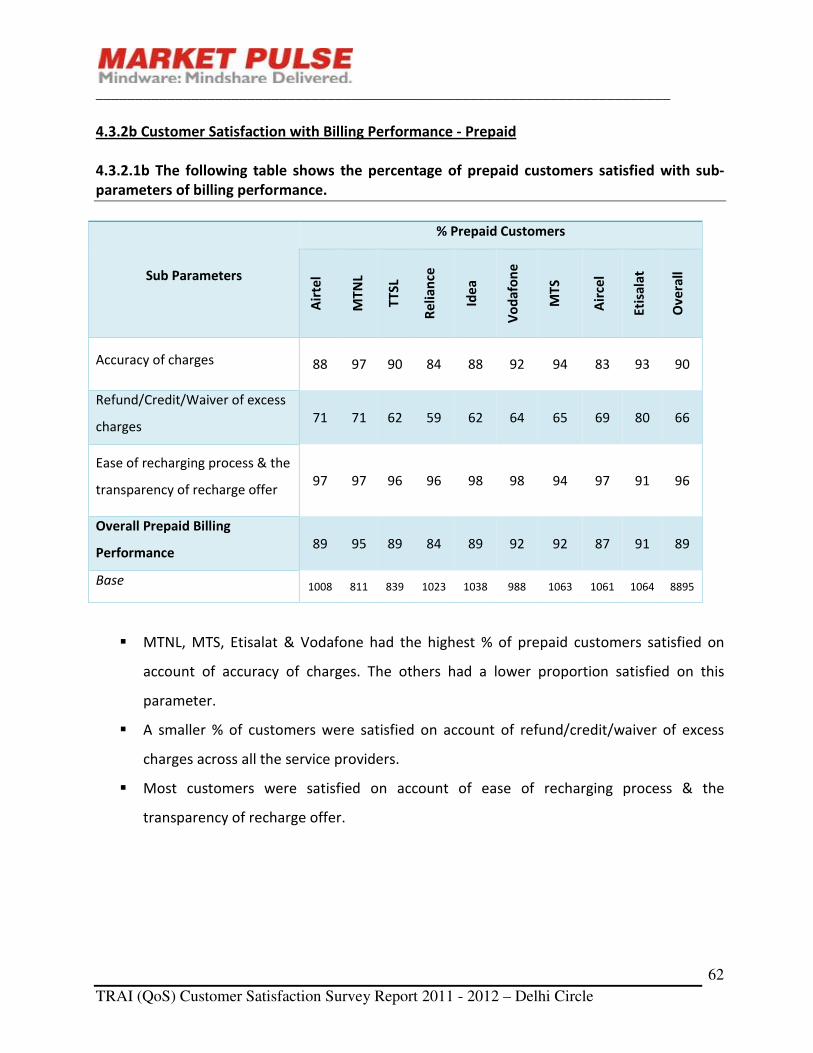
4.3.2b Customer Satisfaction with Billing Performance - Prepaid
4.3.2.1b The following table shows the percentage of prepaid customers satisfied with sub-
parameters of billing performance.
Sub Parameters
% Prepaid Customers
Air
tel
MT
NL
TT
SL
Re
lia
nce
Ide
a
Vo
da
fon
e
MT
S
Air
cel
Eti
sala
t
Ov
era
ll
Accuracy of charges 88 97 90 84 88 92 94 83 93 90
Refund/Credit/Waiver of excess
charges 71 71 62 59 62 64 65 69 80 66
Ease of recharging process & the
transparency of recharge offer 97 97 96 96 98 98 94 97 91 96
Overall Prepaid Billing
Performance 89 95 89 84 89 92 92 87 91 89
Base 1008 811 839 1023 1038 988 1063 1061 1064 8895
� MTNL, MTS, Etisalat & Vodafone had the highest % of prepaid customers satisfied on
account of accuracy of charges. The others had a lower proportion satisfied on this
parameter.
� A smaller % of customers were satisfied on account of refund/credit/waiver of excess
charges across all the service providers.
� Most customers were satisfied on account of ease of recharging process & the
transparency of recharge offer.

________________________________________________________________________
TRAI (QoS) Customer Satisfaction Survey Report 2011 - 2012 – Delhi Circle
63
4.3.3 Customer Satisfaction with Help Services including customer grievance redressal
4.3.3.1 The following table shows the percentage of customers satisfied with sub-parameters
of Help Services including customer grievance redressal.
Sub Parameters
% Customers
Air
tel
MT
NL
TT
SL
Re
lia
nce
Ide
a
Vo
da
fon
e
MT
S
Air
cel
Eti
sala
t
Ov
era
ll
Ease of access of call
centre/customer care or help-line 82 92 79 75 80 85 89 73 90 82
Ease of getting an option for “ talking
to a customer care executive” 80 88 80 75 80 82 89 75 91 82
Response time taken 84 84 79 73 79 84 92 69 90 81
Problem solving ability 80 74 76 68 76 80 85 71 87 77
Time taken to resolve complaint 79 74 73 65 72 80 82 70 86 75
Overall Help Services 81 82 77 71 77 82 87 72 89 79
Base 686 580 715 748 572 527 593 634 379 5434
� MTNL & Etisalat had higher % of customers satisfied on ease of access of call
centre/customer care or help-line.
� Etisalat, MTNL & MTS had a higher satisfaction level on account of ease of getting an
option for “ talking to a customer care executive”
� Aircel had very low satisfaction on account of response time taken by the customer care
executive to answer the call.
� Operators registered lower satisfaction scores on all aspects of Help Services.

________________________________________________________________________
TRAI (QoS) Customer Satisfaction Survey Report 2011 - 2012 – Delhi Circle
64
4.3.4 Customer Satisfaction with Network Performance, Reliability & Availability
4.3.4.1 The following table shows the percentage of customers satisfied with sub-parameters
of network performance, reliability & availability.
Sub Parameters
% Customers
Air
tel
MT
NL
TT
SL
Re
lia
nce
Ide
a
Vo
da
fon
e
MT
S
Air
cel
Eti
sala
t
Ov
era
ll
Availability of signal of your
service provider in your
locality
92 75 85 78 87 94 86 86 78 84
Ability to make or receive
calls easily 96 84 89 84 92 97 93 91 79 89
Voice quality 96 85 87 85 90 95 91 91 84 89
Overall Network
Performance 95 81 87 82 90 95 90 89 80 88
Base 1067 1066 1067 1067 1067 1067 1067 1067 1067 9602
� Both Airtel and Vodafone registered higher satisfactions scores on overall network
performance.
� Vodafone had the highest percentage of satisfied customers on availability of signal in
the locality and ability to make or receive calls easily.
� Higher % of Airtel & Vodafone customers were satisfied with the voice quality of their
connections.

________________________________________________________________________
TRAI (QoS) Customer Satisfaction Survey Report 2011 - 2012 – Delhi Circle
65
4.3.5 Customer Satisfaction with Maintainability
4.3.5.1 The following table shows the % of customers satisfied with sub-parameters of
maintainability.
Sub Parameters
% Customers
Air
tel
MT
NL
TT
SL
Re
lia
nce
Ide
a
Vo
da
fon
e
MT
S
Air
cel
Eti
sala
t
Ov
era
ll
Availability of network
(signal) 94 77 86 81 92 95 89 91 82 87
Restoration of network
(signal) problems 95 82 86 81 91 95 94 87 82 88
Overall Maintainability 94 79 86 81 91 95 92 89 82 88
Base 1067 1066 1067 1067 1067 1067 1067 1067 1067 9602
� MTNL, Reliance and Etisalat registered much lower satisfaction scores on maintainability.
� A higher proportion of Vodafone and Airtel customers were satisfied with availability of
network (signal) and restoration of network (signal) problems.

________________________________________________________________________
TRAI (QoS) Customer Satisfaction Survey Report 2011 - 2012 – Delhi Circle
66
4.3.6 Customer Satisfaction with Supplementary and Value Added Services
4.3.6.1 The following graph shows the percentage of customers satisfied with supplementary
and value added services.
Sub Parameters
% Customers
Air
tel
MT
NL
TT
SL
Re
lia
nce
Ide
a
Vo
da
fon
e
MT
S
Air
cel
Eti
sala
t
Ov
era
ll
Quality of supplementary
service 84 58 86 85 78 84 87 86 88 83
Process of activating VAS 89 84 91 93 88 90 92 92 97 91
Overall Supplementary &
Value Added Services 86 71 89 89 83 87 90 89 92 87
Base 161 43 125 182 147 156 78 205 33 1130
� Etisalat & MTS had a higher percentage of satisfied customers on quality of
supplementary service and on the process of activating VAS.

________________________________________________________________________
TRAI (QoS) Customer Satisfaction Survey Report 2011 - 2012 – Delhi Circle
67
4.4 Awareness of Grievance Redressal Mechanism & Experience among Cellular Mobile Service
subscribers
4.4.1 Awareness and experience of Call Centre
Table 4.4.1.1 The following table shows the percentage of customers aware about the call
centre number of their service provider for making a complaint/ query.
Type
% Customers
Air
tel
MT
NL
TT
SL
Re
lia
nce
Ide
a
Vo
da
fon
e
MT
S
Air
cel
Eti
sala
t
Ov
era
ll
Overall 80 87 77 87 72 75 77 76 65 77
Base 1067 1066 1067 1067 1067 1067 1067 1067 1067 9602
� 77% of all cellular mobile customers were aware of the call centre number of their
service provider for the purpose of making a complaint/ query. Awareness was very low
among Etisalat customers.
4.4.1.2 The following table shows the percentage of customers who had complained in last 6
months to the toll free Call Centre/ Customer Care/ Help-line telephone number.
Type
% Customers
Air
tel
MT
NL
TT
SL
Re
lia
nce
Ide
a
Vo
da
fon
e
MT
S
Air
cel
Eti
sala
t
Ov
era
ll
Overall 51 29 47 56 47 36 37 43 20 41
Base 857 923 825 928 765 805 818 811 693 7425
� 41% of all cellular mobile customers claimed that they had complained in the last 6
months to the toll free Call Centre/ Customer Care/ help-line telephone number. This
was lower among both Etisalat & MTNL customers.

________________________________________________________________________
TRAI (QoS) Customer Satisfaction Survey Report 2011 - 2012 – Delhi Circle
68
4.4.1.3 The following table shows the percentage of customers who received or did not receive
docket number for their complaints.
% Customers
Air
tel
MT
NL
TT
SL
Re
lia
nce
Ide
a
Vo
da
fon
e
MT
S
Air
cel
Eti
sala
t
Ov
era
ll
Complaint was registered
and Docket number
received
74 73 71 68 65 75 89 63 76 72
Complaint was registered
and Docket number not
received
19 15 16 18 24 17 7 21 11 17
Complaint was registered
and docket number
provided on request
3 5 3 2 2 1 1 3 10 3
Complaint was registered
and docket number not
provided even on request
1 0 0 2 2 2 0 1 1 1
Refused to register the
complaint
4 8 11 10 7 6 3 12 3 7
Base 433 269 390 523 362 288 299 352 137 3053
� 93% of the customers reported complaint registration. Only in the case of Aircel, TTSL
and Reliance, a substantial % claimed that the complaint was not registered.
� 72% of all the cellular mobile customers belonging to different service providers said that
they had received a docket number for most of their complaints. Another 17% of those
who had complained did not receive docket numbers.

________________________________________________________________________
TRAI (QoS) Customer Satisfaction Survey Report 2011 - 2012 – Delhi Circle
69
4.4.1.4 The following table shows the percentage of customers who were informed about the
action taken on their complaint by call centre.
Type
% Customers A
irte
l
MT
NL
TT
SL
Re
lia
nce
Ide
a
Vo
da
fon
e
MT
S
Air
cel
Eti
sala
t
Ov
era
ll
Overall 70 61 68 64 58 62 71 67 68 65
Base 433 269 390 523 362 288 299 352 137 3053
� 65% all the cellular mobile customers who had complained said that they were informed
about the action taken on their complaint by the call centre.
4.4.1.5 The following table shows the percentage of customers who got their billing
complaints resolved satisfactorily by call centre/customer care within four weeks.
Type
% Customers
Air
tel
MT
NL
TT
SL
Re
lia
nce
Ide
a
Vo
da
fon
e
MT
S
Air
cel
Eti
sala
t
Ov
era
ll
Overall 55 20 43 49 40 42 40 46 35 43
Base 433 269 390 523 362 288 299 352 137 3053
� Only 43% of the cellular mobile customers who had made billing complaints said that
their complaints were resolved satisfactorily within four weeks after they lodged their
complaint.

________________________________________________________________________
TRAI (QoS) Customer Satisfaction Survey Report 2011 - 2012 – Delhi Circle
70
4.4.2 Awareness and experience of Nodal Officer
4.4.2.1 The following table shows the percentage of customers who were aware about contact
details of the nodal officer.
Type
% Customers
Air
tel
MT
NL
TT
SL
Re
lia
nce
Ide
a
Vo
da
fon
e
MT
S
Air
cel
Eti
sala
t
Ov
era
ll
Overall 5 9 6 7 4 7 3 5 5 6
Base 1067 1066 1067 1067 1067 1067 1067 1067 1067 9602
� Only 6% of the cellular mobile customers were aware of the contact details of the nodal
officer. However, this stood at 9% among MTNL customers.
4.4.2.2 The following table shows the % of aware customers who complained to the nodal
officer regarding their complaints not being resolved or unsatisfactorily resolved by the call
center/customer care.
Type
% Customers
Air
tel
MT
NL
TT
SL
Re
lia
nce
Ide
a
Vo
da
fon
e
MT
S
Air
cel
Eti
sala
t
Ov
era
ll
Overall 11 12 13 29 17 7 15 8 0 13
Base 54 96 61 79 42 74 27 49 53 535
� Only 13% 0f the cellular mobile customers who were aware of the nodal officer had
complained to the nodal officer regarding their complaints not being resolved or being
unsatisfactorily resolved by the call center/customer care.

________________________________________________________________________
TRAI (QoS) Customer Satisfaction Survey Report 2011 - 2012 – Delhi Circle
71
4.4.2.3 Incidence of Customer Intimation Regarding Decision taken on Complaint
Type
% Customers A
irte
l
MT
NL
TT
SL
Re
lia
nce
Ide
a
Vo
da
fon
e
MT
S
Air
cel
Eti
sala
t
Ov
era
ll
Overall 67 36 38 48 86 60 -- 75 -- 50
Base 6 11 8 23 7 5 4 4 -- 68
4.4.2.4 Satisfaction with Nodal Officer
Type
% Customers
Air
tel
MT
NL
TT
SL
Re
lia
nce
Ide
a
Vo
da
fon
e
MT
S
Air
cel
Eti
sala
t
Ov
era
ll
Overall 83 36 50 48 71 100 -- 100 -- 56
Base 6 11 8 23 7 5 4 4 -- 68
� Only 56% of those who had complained to the Nodal Officer were satisfied with the
action taken/ response.

________________________________________________________________________
TRAI (QoS) Customer Satisfaction Survey Report 2011 - 2012 – Delhi Circle
72
4.4.3 Awareness and experiences with Appellate Authority
4.4.3.1 The following table shows the percentage of customers who were aware about the
contact details of the appellate authority.
Type
% Customers
Air
tel
MT
NL
TT
SL
Re
lia
nce
Ide
a
Vo
da
fon
e
MT
S
Air
cel
Eti
sala
t
Ov
era
ll
Overall 1 3 2 2 2 3 1 2 3 2
Base 1067 1066 1067 1067 1067 1067 1067 1067 1067 9602
� Only 2% of the mobile phone customers were aware of the contact details of appellate
authority.
4.4.3.2 Incidence of Appeal being filed in the prescribed form in last 6 months
Type
% Customers
Air
tel
MT
NL
TT
SL
Re
lia
nce
Ide
a
Vo
da
fon
e
MT
S
Air
cel
Eti
sala
t
Ov
era
ll
Overall 0 0 6 15 19 0 0 16 6 7
Base 15 27 16 26 16 28 14 19 34 195
� Only 7% of those who were aware, had filed an appeal with the Appellate Authority.

________________________________________________________________________
TRAI (QoS) Customer Satisfaction Survey Report 2011 - 2012 – Delhi Circle
73
4.4.3.3 % Customers who Filed An Appeal with the Appellate Authority & Received an
acknowledgement
Type
% Customers A
irte
l
MT
NL
TT
SL
Re
lia
nce
Ide
a
Vo
da
fon
e
MT
S
Air
cel
Eti
sala
t
Ov
era
ll
Overall -- -- -- 75 67 -- -- 33 100 62
Base -- -- -- 4 3 -- -- 3
2
13
4.4.3.4 Reported Decisions by the Appellate Authority
Type
% Customers
Air
tel
MT
NL
TT
SL
Re
lia
nce
Ide
a
Vo
da
fon
e
MT
S
Air
cel
Eti
sala
t
Ov
era
ll
Overall -- -- -- 75 67 -- -- 33 100 62
Base -- -- 1 4 3 -- -- 3 2 13

________________________________________________________________________
TRAI (QoS) Customer Satisfaction Survey Report 2011 - 2012 – Delhi Circle
74
4.4.4 General Information
4.4.4.1 The following table shows the percentage of prepaid customers who were aware that a
prepaid customer can get item-wise usage charge details, on request.
Type
Service Provider
Air
tel
MT
NL
TT
SL
Re
lia
nce
Ide
a
Vo
da
fon
e
MT
S
Air
cel
Eti
sala
t
Ov
era
ll
Overall 18 26 15 19 18 15 6 20 15 17
Base 1008 811 839 1023 1038 988 1063 1061 1064 8895
� Only 17% of the prepaid cellular mobile customers said that they were aware of the fact
that they can get item-wise usage charge details on request.
4.4.4.2 The following table shows the percentage of customers who were denied item-wise
usage charge details for their pre-paid connection.
Type
Service Provider
Air
tel
MT
NL
TT
SL
Re
lia
nce
Ide
a
Vo
da
fon
e
MT
S
Air
cel
Eti
sala
t
Ov
era
ll
Overall 3 7 6 9 2 4 11 6 7 6
Base 180 212 127 195 188 145 63 213 155 1478

________________________________________________________________________
TRAI (QoS) Customer Satisfaction Survey Report 2011 - 2012 – Delhi Circle
75
4.4.4.3 The following table shows the percentage of customers who cited different reason(s)
for their request for item-wise details being denied.
% Customers
Air
tel
MT
NL
TT
SL
Re
lia
nce
Ide
a
Vo
da
fon
e
MT
S
Air
cel
Eti
sala
t
Ov
era
ll
No reason given 80 71 88 89 100 100 86 75 100 86
Technical problem -- 29 13 11 -- -- 14 25 -- 13
Others 20 -- -- -- -- -- -- -- -- 1
Base 5 14 8 18 4 6 7 12 10 84
4.4.4.4 The following table shows the percentage of customers who claimed to have got the
Manual of Practice containing the terms & conditions of service, toll free number of the call
centre and contact detail of Nodal Officer & Appellate Authority for complaint redressal while
subscribing the new mobile telephone connection.
Type
Service Provider
Air
tel
MT
NL
TT
SL
Re
lia
nce
Ide
a
Vo
da
fon
e
MT
S
Air
cel
Eti
sala
t
Ov
era
ll
Overall 80 73 79 82 83 86 83 77 77 80
Base 1067 1066 1067 1067 1067 1067 1067 1067 1067 9602
� Only 80% of the new customers claimed to have received the Manual of Practice. This
proportion was significantly lower among MTNL customers.

________________________________________________________________________
TRAI (QoS) Customer Satisfaction Survey Report 2011 - 2012 – Delhi Circle
76
4.5 Broadband Service – Delhi circle
The survey of customer perception of Satisfaction was done in Delhi circle among customers of 6
Broadband service providers i.e. Airtel, MTNL,TTSL, Reliance, Hathway & Spectranet.
4.5.1 Customer Satisfaction with Provision of Service
4.5.1.1 The following table shows the % of customers satisfied with provision of service.
Sub Parameters Type
Customers
Airtel MTNL TTSL Reliance Hathway Spectra
net Overall
Time taken Overall 96 98 99 83 90 94 93
Base 1067 1067 106
7 1067 1067 1067 6402
� 93% the customers were satisfied with the provision of service.
4.5.2a Postpaid Customer Satisfaction with Billing Performance
4.5.2.2a The following table shows the percentage of postpaid customers satisfied with sub-
parameters of billing performance.
Sub Parameters
% Postpaid Customers
Airtel MTNL TTSL Reliance Hathway Spectranet Overall
Timely delivery of bills 94 96 97 81 80 99 92
Clarity of the bills in terms of
transparency 95 97 89 82 95 98 93
Accuracy of the bills 96 97 89 84 96 99 93
Process of resolution of billing
complaints 58 63 90 43 61 88 65
Overall postpaid billing 94 96 91 79 89 98 91
Base 1058 1067 1058 1052 671 1058 5964
� All the service provider registered high satisfaction levels on account of timely delivery of
bills, clarity of bills in terms of transparency & understandability and accuracy except for
Reliance.
� However, all of them had a low % of satisfied customers on account of resolution of
billing complaints; only 65% were satisfied.
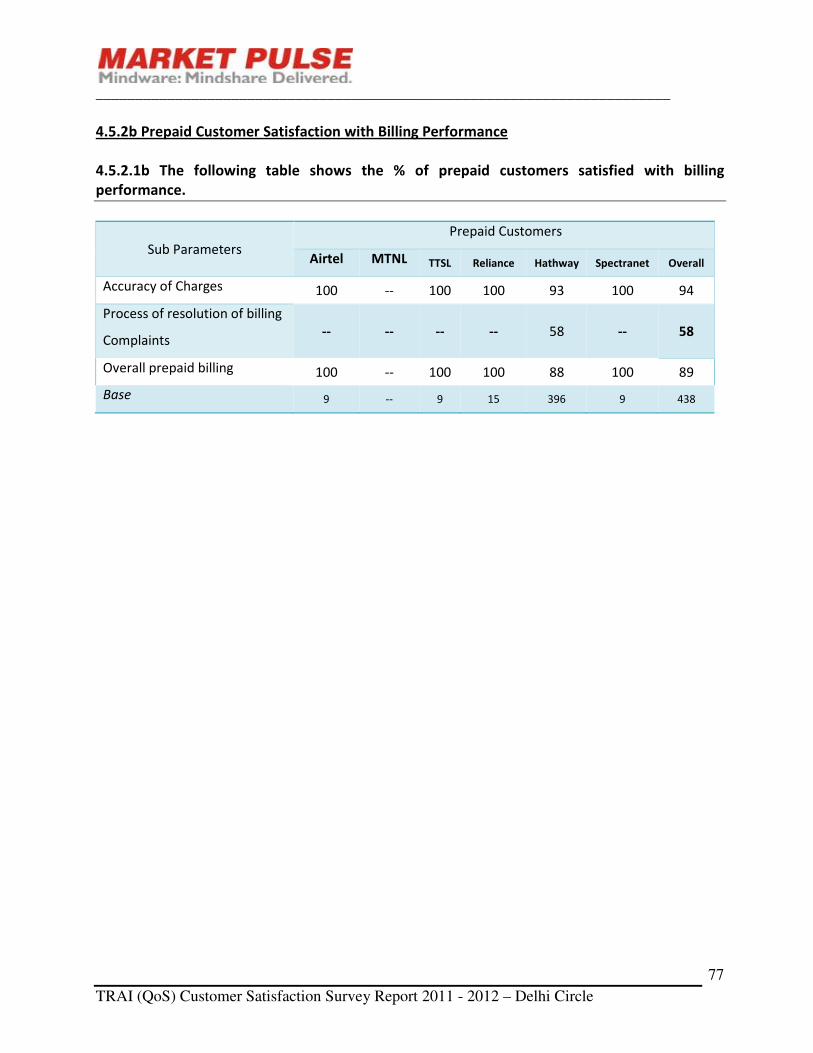
________________________________________________________________________
TRAI (QoS) Customer Satisfaction Survey Report 2011 - 2012 – Delhi Circle
77
4.5.2b Prepaid Customer Satisfaction with Billing Performance
4.5.2.1b The following table shows the % of prepaid customers satisfied with billing
performance.
Sub Parameters
Prepaid Customers
Airtel MTNL TTSL Reliance Hathway Spectranet Overall
Accuracy of Charges 100 -- 100 100 93 100 94
Process of resolution of billing
Complaints -- -- -- -- 58 -- 58
Overall prepaid billing 100 -- 100 100 88 100 89
Base 9 -- 9 15 396 9 438
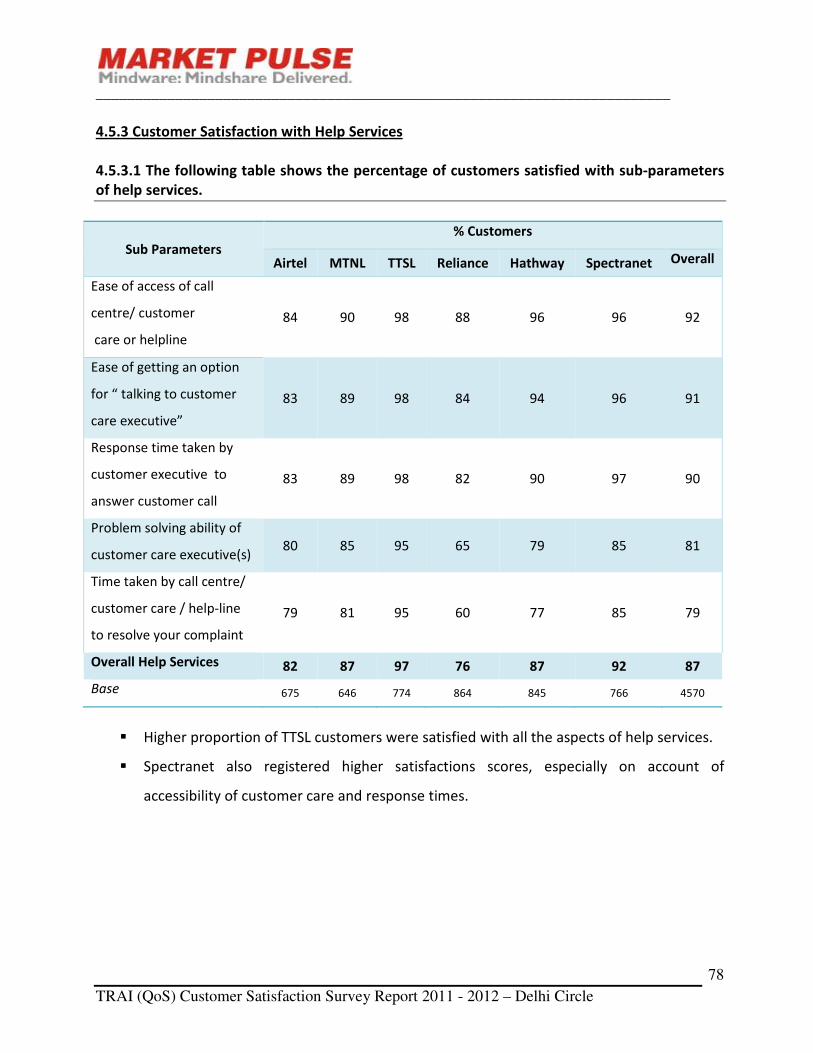
________________________________________________________________________
TRAI (QoS) Customer Satisfaction Survey Report 2011 - 2012 – Delhi Circle
78
4.5.3 Customer Satisfaction with Help Services
4.5.3.1 The following table shows the percentage of customers satisfied with sub-parameters
of help services.
Sub Parameters
% Customers
Airtel MTNL TTSL Reliance Hathway Spectranet Overall
Ease of access of call
centre/ customer
care or helpline
84 90 98 88 96 96 92
Ease of getting an option
for “ talking to customer
care executive”
83 89 98 84 94 96 91
Response time taken by
customer executive to
answer customer call
83 89 98 82 90 97 90
Problem solving ability of
customer care executive(s) 80 85 95 65 79 85 81
Time taken by call centre/
customer care / help-line
to resolve your complaint
79 81 95 60 77 85 79
Overall Help Services 82 87 97 76 87 92 87
Base 675 646 774 864 845 766 4570
� Higher proportion of TTSL customers were satisfied with all the aspects of help services.
� Spectranet also registered higher satisfactions scores, especially on account of
accessibility of customer care and response times.

________________________________________________________________________
TRAI (QoS) Customer Satisfaction Survey Report 2011 - 2012 – Delhi Circle
79
4.5.4 Customer Satisfaction with Network Performance, Reliability & Availability
4.5.4.1 The following table shows the percentage of customers satisfied with sub-parameters
of network performance, reliability & availability.
Sub Parameters
% Customers
Airtel MTNL TTSL Reliance Hathway Spectranet Overall
Speed of broadband
connection 90 88 95 80 82 89 87
Amount of time for
which service is up and
working
92 90 94 81 78 95 88
Overall Network
Performance 91 89 94 80 80 92 88
Base 1067 1067 1067 1067 1067 1067 6402
� Airtel & TTSL had the highest % of satisfied customers with respect to speed of
broadband connection
� Spectranet had the highest % of satisfied customers with respect to amount of time for
which service is up & working.

________________________________________________________________________
TRAI (QoS) Customer Satisfaction Survey Report 2011 - 2012 – Delhi Circle
80
4.5.5 Customer Satisfaction with Maintainability
4.5.5.1 The following table shows the percentage of customers satisfied with maintainability
Sub Parameters
%Customers
Airtel MTNL TTSL Reliance Hathway Spectranet Overall
Time taken for
restoration of
broadband connection
59 42 49 13 4 51 29
Base 126 93 83 216 227 92 837
� Only 29% of the customers were satisfied with the time taken for restoration of
broadband connection. Airtel (59%) had the highest percentage of satisfied customers on
this parameter, followed by Spectranet.
4.5.6 Customer Satisfaction with Supplementary Services
4.5.6.1 The following table shows the percentage of customers satisfied with supplementary
services.
Sub Parameters
% Customers
Airtel MTNL TTSL Reliance Hathway Spectranet Overall
Process of activating
VAS or process of
unsubscribing
89 94 98 82 87 100 92
Base 140 100 139 66 47 75 567
� 92% of customers satisfied with process of activating VAS or process of unsubscribing.

________________________________________________________________________
TRAI (QoS) Customer Satisfaction Survey Report 2011 - 2012 – Delhi Circle
81
4.5.7 Customer Satisfaction with Overall Service Quality
4.5.7.1 The following graph shows the % of customers satisfied with overall service.
� 86% of the customers were satisfied with the quality of overall service. TTSL (94%) had
the highest percentage of satisfied customers, followed by Airtel.
4.6 Awareness of Grievance Redressal Mechanism and Experience among Broadband Service
Subscribers
4.6.1 Awareness and experience of Call Centre
4.6.1.1 % of customers aware about the call centre number for making a complaint/ query.
Type
% Customers
Airtel MTNL TTSL Reliance Hathway Spectranet Overall
Overall 79 76 74 84 96 85 82
Base 1067 1067 1067 1067 1067 1067 6402
� 82% of broadband customers belonging to different service providers said that they were
aware about the call centre number of their service provider for making a complaint/
query.
Sub
Parameters
% Customers
Airtel MTNL TTSL Reliance Hathway Spectranet Overall
Overall service
quality 89 87 94 80 81 84 86
Base 1067 1067 1067 1067 1067 1067 6402

________________________________________________________________________
TRAI (QoS) Customer Satisfaction Survey Report 2011 - 2012 – Delhi Circle
82
4.6.1.2 The following table shows the percentage of customers who had complained in last 6
months to the toll free call centre/ customer care/ help-line telephone number.
Type
% Customers
Airtel MTNL TTSL Reliance Hathway Spectranet Overall
Overall 50 31 22 66 47 45 44
Base 839 810 794 898 1024 909 5274
� 44% of broadband customers who were of the call centre number claimed to have
complained in the last 6 months.
4.6.1.3 The following table shows the percentage of customers who received or did not receive
the docket number for their complaints.
Customers
% Customers
Airtel MTNL TTSL Reliance Hathway Spectranet Overall
Docket number
received for most of
the complaints
92 80 69 78 90 92 85
No Docket number
received for most of
the complaints
3 1 23 6 1 2 4
It was received on
request 4 12 8 16 6 6 9
No Docket number
received even on
request
1 7 0 0 2 0 1
Base 422 251 173 593 481 407 2327
� 85% of all broadband customers who had complained claimed that they received a
docket number for most of their complaints.
� 4% of all broadband customers who had complained said that they did not receive
docket numbers for most of their complaints. Another 9% received it on request.
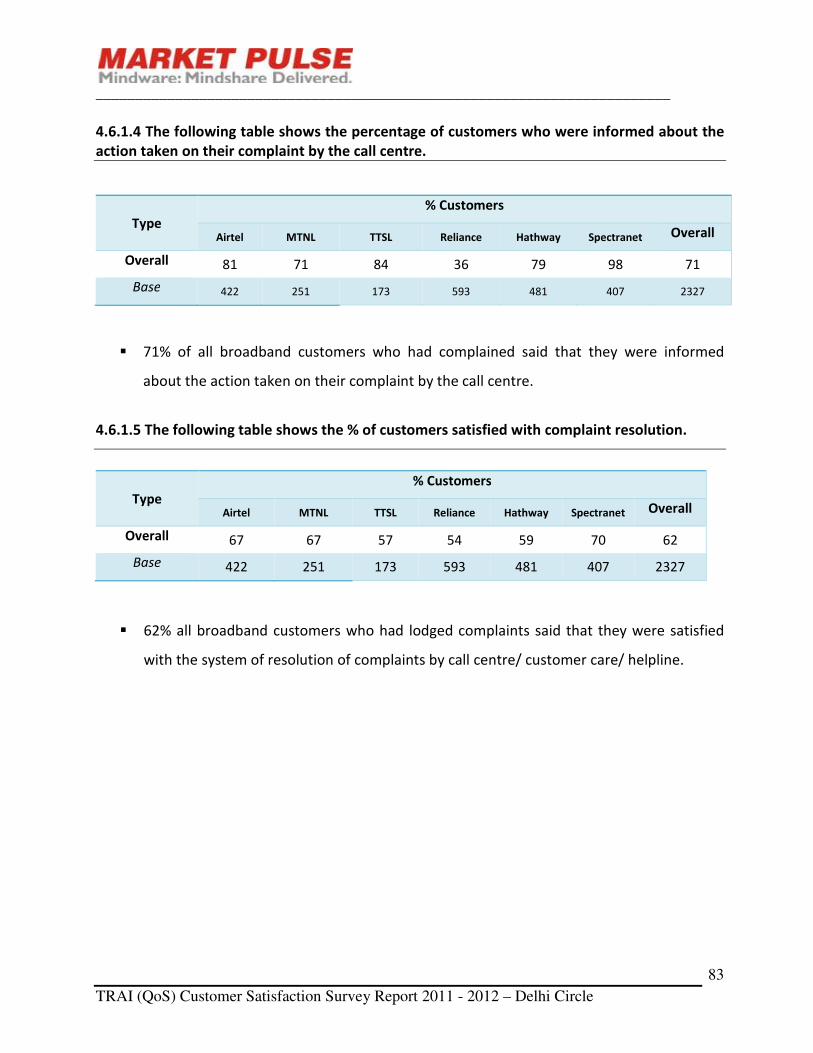
________________________________________________________________________
TRAI (QoS) Customer Satisfaction Survey Report 2011 - 2012 – Delhi Circle
83
4.6.1.4 The following table shows the percentage of customers who were informed about the
action taken on their complaint by the call centre.
Type
% Customers
Airtel MTNL TTSL Reliance Hathway Spectranet Overall
Overall 81 71 84 36 79 98 71
Base 422 251 173 593 481 407 2327
� 71% of all broadband customers who had complained said that they were informed
about the action taken on their complaint by the call centre.
4.6.1.5 The following table shows the % of customers satisfied with complaint resolution.
Type
% Customers
Airtel MTNL TTSL Reliance Hathway Spectranet Overall
Overall 67 67 57 54 59 70 62
Base 422 251 173 593 481 407 2327
� 62% all broadband customers who had lodged complaints said that they were satisfied
with the system of resolution of complaints by call centre/ customer care/ helpline.
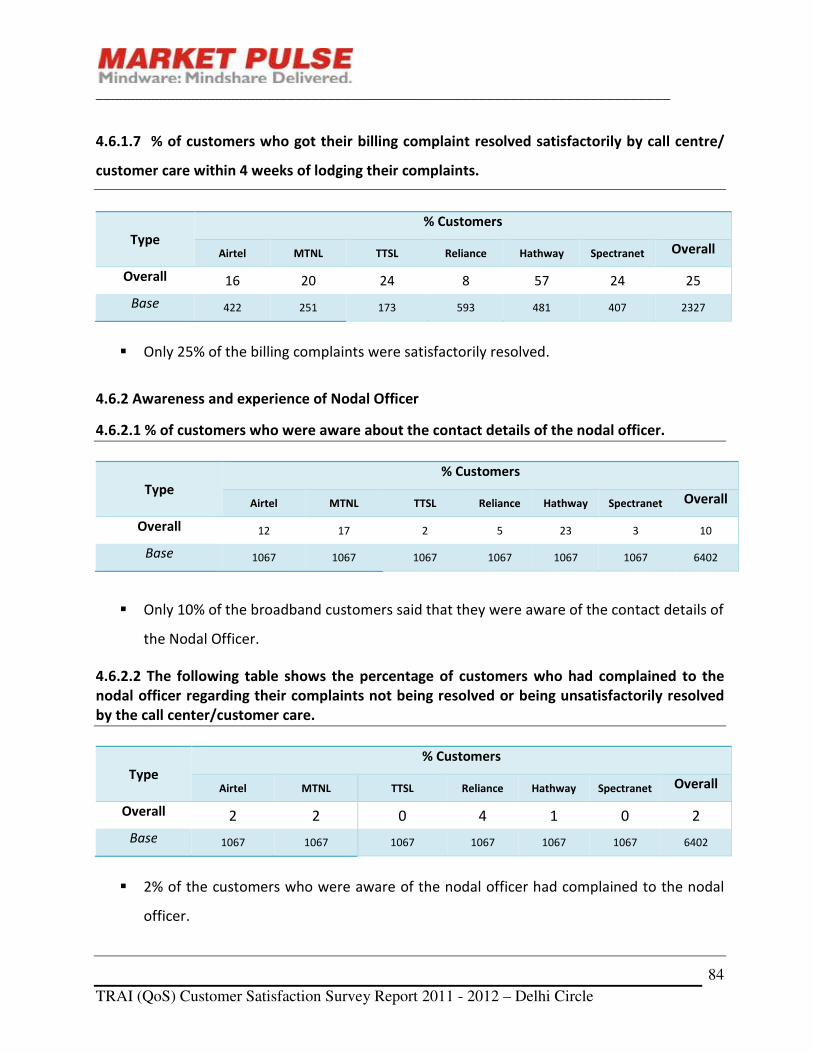
________________________________________________________________________
TRAI (QoS) Customer Satisfaction Survey Report 2011 - 2012 – Delhi Circle
84
4.6.1.7 % of customers who got their billing complaint resolved satisfactorily by call centre/
customer care within 4 weeks of lodging their complaints.
Type
% Customers
Airtel MTNL TTSL Reliance Hathway Spectranet Overall
Overall 16 20 24 8 57 24 25
Base 422 251 173 593 481 407 2327
� Only 25% of the billing complaints were satisfactorily resolved.
4.6.2 Awareness and experience of Nodal Officer
4.6.2.1 % of customers who were aware about the contact details of the nodal officer.
Type
% Customers
Airtel MTNL TTSL Reliance Hathway Spectranet Overall
Overall 12 17 2 5 23 3 10
Base 1067 1067 1067 1067 1067 1067 6402
� Only 10% of the broadband customers said that they were aware of the contact details of
the Nodal Officer.
4.6.2.2 The following table shows the percentage of customers who had complained to the
nodal officer regarding their complaints not being resolved or being unsatisfactorily resolved
by the call center/customer care.
Type
% Customers
Airtel MTNL TTSL Reliance Hathway Spectranet Overall
Overall 2 2 0 4 1 0 2
Base 1067 1067 1067 1067 1067 1067 6402
� 2% of the customers who were aware of the nodal officer had complained to the nodal
officer.

________________________________________________________________________
TRAI (QoS) Customer Satisfaction Survey Report 2011 - 2012 – Delhi Circle
85
4.6.2.3 The following table shows the percentage of customers who were able to connect to
the Nodal Officer without any difficulty.
Type
% Customers
Airtel MTNL TTSL Reliance Hathway Spectranet Overall
Overall 58 100 -- 88 46 100 78
Base 24 18 40 11 3 96
� 78% of the customers were able to connect to Nodal officer without any difficulty.
4.6.2.4 The following table shows the percentage of customers who were intimated by the
Nodal Officer about the decision taken on their complaint.
Type
% Customers
Airtel MTNL TTSL Reliance Hathway Spectranet Overall
Overall 50 100 25 0 100 45
Base 24 18 40 11 3 96
� 45% of the customers were conveyed the decision taken by the Nodal officers on their
complaints.
4.6.2.5 The following table shows the percentage of customers satisfied with the redressal of
the complaint by the Nodal Officer.
Type
% Customers
Airtel MTNL TTSL Reliance Hathway Spectranet Overall
Overall 25 100 38 0 100 44
Base 24 18 40 11 3 96
� 44% of the customers were satisfied with the redressal of the complaint by the Nodal
Officer.
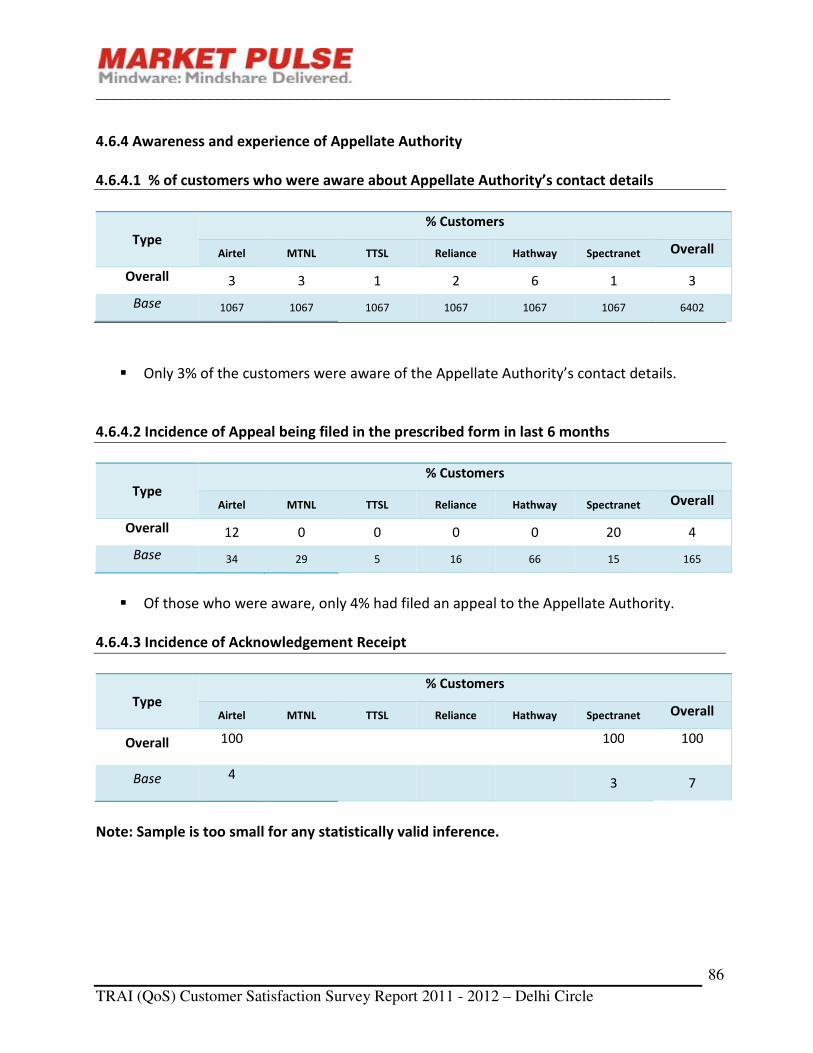
________________________________________________________________________
TRAI (QoS) Customer Satisfaction Survey Report 2011 - 2012 – Delhi Circle
86
4.6.4 Awareness and experience of Appellate Authority
4.6.4.1 % of customers who were aware about Appellate Authority’s contact details
Type
% Customers
Airtel MTNL TTSL Reliance Hathway Spectranet Overall
Overall 3 3 1 2 6 1 3
Base 1067 1067 1067 1067 1067 1067 6402
� Only 3% of the customers were aware of the Appellate Authority’s contact details.
4.6.4.2 Incidence of Appeal being filed in the prescribed form in last 6 months
Type
% Customers
Airtel MTNL TTSL Reliance Hathway Spectranet Overall
Overall 12 0 0 0 0 20 4
Base 34 29 5 16 66 15 165
� Of those who were aware, only 4% had filed an appeal to the Appellate Authority.
4.6.4.3 Incidence of Acknowledgement Receipt
Type
% Customers
Airtel MTNL TTSL Reliance Hathway Spectranet Overall
Overall 100
100
100
Base 4
3 7
Note: Sample is too small for any statistically valid inference.

________________________________________________________________________
TRAI (QoS) Customer Satisfaction Survey Report 2011 - 2012 – Delhi Circle
87
4.6.4.4 Reported Incidence of Decision by the Appellate Authority
Type
% Customers
Airtel MTNL TTSL Reliance Hathway Spectranet Overall
Overall 0 100 43
Base 4 3 7
Note: Sample is too small for any statistically valid inference.
4.6.5 General Information
4.6.5.1 The following table shows the percentage of prepaid customers who were aware that
they can get item-wise usage charge details, on request.
Type
% Customers
Airtel MTNL TTSL Reliance Hathway Spectranet Overall
Overall 44 22 0 7 0 7
Base 9 9 15 396 9 438
4.6.5.2 The following table shows the percentage of customers who were denied item-wise
usage charge details.
Type
% Customers
Airtel MTNL TTSL Reliance Hathway Spectranet Overall
Overall 50
0
0
6
Base 4 2
26 32

________________________________________________________________________
TRAI (QoS) Customer Satisfaction Survey Report 2011 - 2012 – Delhi Circle
88
4.6.5.3 The following table shows the percentage of customers who cited different reason(s)
for their request being denied.
Customers
% Customers
Airtel MTNL TTSL Reliance Hathway Spectranet Overall
No reason
given -- -- -- -- -- -- --
Technical
problem 100 -- -- -- -- -- 100
Others -- -- -- -- -- -- --
Base 2 -- -- -- -- -- 2
Note: Sample is too small for any statistically valid inference.
4.6.5.4 The following table shows the percentage of new customers who got the Manual of
Practice containing the terms and conditions of service, grievance redressal mechanism etc.
while taking the connection.
Type
% Customers
Airtel MTNL TTSL Reliance Hathway Spectranet Overall
Overall 40 32 37 21 68 71 45
Base 1067 1067 1067 1067 1067 1067 6402
� Only 45% of the customers claimed to have got the Manual of Practice while taking the
connection.
________________________________________________________________________
TRAI (QoS) Customer Satisfaction Survey Report 2011 - 2012 – Delhi Circle
89
5. SUMMARY OF CRITICAL FINDINGS
5.1 Basic Wire-line Service
� 90% of the basic wire-line service customers in Delhi circle were satisfied with their
service providers with overall service quality. Only Airtel & MTNL met the overall service
quality benchmark while TTSL and Reliance did not.
� None of the service providers met the benchmarks with respect to help services including
customer grievance redressal, network performance and maintainability.
� Airtel, TTSL and Reliance did not meet the benchmark with respect to billing
performance.
� 79% of all customers reported that the fault was repaired within 3 days. This proportion
was lower for Reliance customers (74%).
Grievance Redressal
� Approximately 45% of the aware customers claimed to have made a complaint on the
call centre number of their service provider in the last 6 months. 11% of all customers
who had complained said that they did not receive docket number for most of their
complaints
� Only 4% of all basic telephone service customers said that they were aware about the
contact details of the nodal officer. 49% of customers, who complained to the Nodal
Officer, were not satisfied with redressal of complaint by the Nodal Officer.
� Only 1% of all the basic wire-line service customers said that they were aware of the
contact details of the Appellate Authority.

________________________________________________________________________
TRAI (QoS) Customer Satisfaction Survey Report 2011 - 2012 – Delhi Circle
90
5.2 Cellular Mobile Service
� 87% of all cellular mobile customers were satisfied with overall service quality. Airtel,
Vodafone & Aircel met the benchmark set for overall service quality. MTNL, TTSL, Reliance,
Idea, MTS and Etisalat did not meet the benchmark.
� None of the service providers with the exception of MTNL met the benchmark set for
prepaid billing performance.
� Airtel, Reliance, Idea, Aircel & Etisalat met the benchmark set for postpaid billing
performance.
� None of the service providers met the benchmark set for help services including customer
grievance redressal.
� Airtel, Idea, Vodafone & MTS met the benchmark set for Network performance, reliability &
availability and maintainability; the others did not.
� None of the service providers with the exception of MTS & Etisalat met the benchmark set
for value added services.
Grievance Redressal
� Only 43% of the cellular mobile customers who made billing complaints to the call centre
reported that their complaints were resolved within 4 weeks of lodging.
� 41% of all cellular mobile customers claimed that they had complained in the last 6 months
to the toll free Call Centre/ Customer Care/ help-line telephone number.
� Only 6% of the cellular mobile customers were aware of the contact details of the nodal
officer. Only 56% of those who had complained to the Nodal Officer were satisfied with the
action taken/ response.
� Only 2% of the mobile phone customers were aware of the contact details of appellate
authority.
� Only 17% of the prepaid cellular mobile customers said that they were aware of the fact that
they can get item-wise usage charge details on request.

________________________________________________________________________
TRAI (QoS) Customer Satisfaction Survey Report 2011 - 2012 – Delhi Circle
91
5.3 Broadband Service
� 86% of all broadband customers were satisfied with overall service quality. Airtel, MTNL and
TTSL met the benchmark on this parameter; Reliance, Hathway & Spectranet did not meet
the benchmark scores.
� All service providers met the benchmarks set for provision of service, postpaid billing
performance and network performance except for Reliance & Hathway.
� Only TTSL & Spectranet met the benchmark set for help services including customer
grievance redressal.
� None of the service providers met the benchmark set for maintainability while All the service
providers met the benchmark set for supplementary & value added services except Reliance.
� 79% of the customers got their working connection within 7 working days. However, this
proportion was even lower for Spectranet.
Grievance Redressal Mechanism
� Only 25% of customers reported that their billing complaints were resolved within 4 weeks
after they lodged their complaints. 92% of Reliance customers reported that their complaints
were not resolved within 4 weeks.
� 44% of broadband customers who were aware of the call centre number claimed to have
complained in the last 6 months.
� 62% all broadband customers who had lodged complaints said that they were satisfied with
the system of resolution of complaints by call centre/ customer care/ helpline.
� Only 10% of the broadband customers said that they were aware of the contact details of
the Nodal Officer. 44% of the customers were satisfied with the redressal of the complaint
by the Nodal Officer.
� Only 3% of the customers were aware of the Appellate Authority’s contact details.

________________________________________________________________________
TRAI (QoS) Customer Satisfaction Survey Report 2011 - 2012 – Delhi Circle
92
6. RECOMMENDATIONS (QUALITY OF SERVICE)
6.1 Quality of Service
6.1.1 Basic Wire-line
� Overall quality of service needs to be improved for TTSL & Reliance.
� Network performance, reliability and availability, maintainability and Help Services need
to be improved by all the services providers. Accessibility to the call centre needs to be
improved.
� Both Airtel and Reliance need to improve provision of service, especially in time taken for
providing the connection.
� Airtel, TTSL and Reliance need to improve their process of resolution of billing complaints
6.1.2 Cellular Mobile
� MTNL, TTSL, Reliance, Idea, MTS and Etisalat need to improve their overall service
quality.
� All service providers need to improve their Help services including customer grievance
redressal. Process of resolution of billing complaints need to be improved by all service
providers.
� MTNL, TTSL, Reliance, Aircel & Etisalat need to improve on maintainability. Restoration of
network problems needs to be hastened.
� Network performance needs to be improved by MTNL, TTSL, Reliance, Aircel & Etisalat.
� Value added services need to be improved by all the service providers except MTS &
Etisalat.

________________________________________________________________________
TRAI (QoS) Customer Satisfaction Survey Report 2011 - 2012 – Delhi Circle
93
6.3 Broadband
� Reliance, Hathway and Spectranet need to improve their overall quality of service.
� Reliance needs to improve their provision of service, Help Services, network performance
(speed of broadband) and process of resolution of billing complaints.
� Hathway needs to focus on help services, billing compliant resolution and network
performance.
� All the service providers need to improve on maintainability – quick restoration of
broadband connection.
� Airtel and MTNL also need to improve their help services including customer grievance
redressal, particularly accessibility and ability to solve the problem by the customer care
need to be improved.
6.2 Grievance Redressal Mechanism
� Service providers should make their customers aware about the contact details of their
Customer care, Nodal officer and appellate Authority.
� The effectiveness of the Nodal Officer needs to be enhanced so that complaints are
speedily addressed to the satisfaction of the customers.
� All the customers should be informed about the facility whereby they can get item-wise
usage charges on request.
� Delivery of the manual practice should be strengthened.

________________________________________________________________________
TRAI (QoS) Customer Satisfaction Survey Report 2011 - 2012 – Delhi Circle
94
Annexure 1: Detailed Tables (Basic Telephone Service - Customers Survey)
A. Service Provision
Q1(a). Have you taken a telephone connection, shifted your connection or had your connection
temporarily suspended in the last 6 months?
Airtel MTNL TTML Reliance Overall
Yes Count 40 72 63 62 237
% 4 7 10 6 6
NO Count 1027 995 567 1005 3594
% 96 93 90 94 94
Q(2). Have you been informed in writing, at the time of subscription of service or within a week
of activation of service the complete details of your tariff plan?
Airtel MTNL TTML Reliance Overall
Yes Count 25 60 54 38 177
% 63 83 86 61 75
NO Count 15 12 9 24 60
% 38 17 14 39 25

________________________________________________________________________
TRAI (QoS) Customer Satisfaction Survey Report 2011 - 2012 – Delhi Circle
95
Q 5 (b) Please specify the reason(s) for your dissatisfaction with the quality of bills accuracy &
completeness of the bills.
Airtel MTNL TTML Reliance Overall
Charges not as per
tariff plan
Count 9 7 4 20
% 15 19 6 10
Tariff plan changed
without information
Count 4 4 8
% 7 6 4
Charged for value
added services not
subscribed
Count 1 2 9 12
% 2 5 33 6
Charged for
calls/services not
made/used
Count 2 6 7 15
% 3 16 10 8
Details like item-wise
charges are not
provided
Count 3 3
% 8 2
Calculations are not
clear
Count 4 9 9 7 29
% 7 24 33 10 15
Others Count 42 12 9 51 114
% 68 32 33 74 59
Qus.6 Have you made any billing related complaints in the last 6 months?
Type
Airtel MTNL TTML Reliance Overall
Yes
Urban
Count 128 75 63 136 402
% 12 7 10 13 11
No
Urban
Count 939 992 567 931 3429
% 88 93 90 87 90

________________________________________________________________________
TRAI (QoS) Customer Satisfaction Survey Report 2011 - 2012 – Delhi Circle
96
Qus.9 Please specify the reason(s) for your dissatisfaction with the clarity of the bills sent by
your service provider in terms of transparency and understandability.
Airtel MTNL TTML Reliance Overall
Difficult to
read the bill
Count 2 2
% 3 1
Difficult to
understand
the language
Count 3 1 9 13
% 5 6 25 6
Calculations
not clear
Count 13 4 9 24 50
% 20 25 25 28 25
Item-wise
charges not
given
Count 8 3 11
% 12 4 5
Others Count 40 11 18 59 128
% 61 69 50 69 63
Qus.10(b) Please specify the reason(s) for your dissatisfaction with the charges deducted for
every call i.e. amount deducted on every usage.
Note: None of the prepaid customer of basic wireline service was covered.
Qus. 10(c) Have you made any complaint relatecharging/credit/waiver/validity/adjustments in
the last 6 months?
Note: None of the prepaid customer of basic wireline service was covered.
Qus.10(f) Please specify the reason(s) for your dissatisfaction.
Note: None of the prepaid customer of basic wireline service was covered.

________________________________________________________________________
TRAI (QoS) Customer Satisfaction Survey Report 2011 - 2012 – Delhi Circle
97
Qus.11 In the last 6 months, have you contacted customer care/ helpline/ call centre of your
service provider?
Airtel MTNL TTML Reliance Overall
Yes
Count 735 657 342 702 2436
% 69 62 54 66 64
No
Count 332 410 288 365 1395
% 31 38 46 34 36
Qus 19. How many times has your telephone connection required repair in the last 6 months?
Airtel MTNL TTML Reliance Overall
Nil Count 735 605 396 667 2403
% 69 57 63 63 63
Once Count 169 241 162 176 748
% 16 23 26 17 20
2-3 times Count 91 120 36 92 339
% 9 11 6 9 9
More than 3
times
Count 72 101 36 132 341
% 7 10 6 12 9
Qus.22 Do you use services like call waiting, call forwarding, voice mail or any other
supplementary services / value added services?
Airtel MTNL TTML Reliance Overall
Yes
Count 79 59 63 24 225
% 7 6 10 2 6
No
Count 988 1008 567 1043 3606
% 93 95 90 98 94

________________________________________________________________________
TRAI (QoS) Customer Satisfaction Survey Report 2011 - 2012 – Delhi Circle
98
Qus.24(b). Please tell me the reason for dissatisfaction with the process of activating value
added services or the process of unsubscribing.
Airtel MTNL TTML Reliance Overall
Not informed of
charges
Count 1 1
% 17 14
Activated without
consent
Count 1 1 2
% 17 100 29
Not informed about
toll free number for
unsubscribing
Count 4 4
% 67 57
other Count -- -- -- -- --
% -- -- -- -- --
Qus.25 . In the last 6 months have you faced the problem of unauthorized activation of VAS by
your service provider?
Airtel MTNL TTML Reliance Overall
Yes
Count 19 4 45 8 76
% 2% 0% 7% 1% 2%
No
Count 1048 1063 585 1059 3755
% 98% 100% 93% 99% 98%
Qus.25(a) How satisfied are you with the resolution of your complaint for deactivation of VAS
Airtel MTNL TTML Reliance Overall
Satisfaction
Count 14 2 18 4 38
% 74 50 40 50 50

________________________________________________________________________
TRAI (QoS) Customer Satisfaction Survey Report 2011 - 2012 – Delhi Circle
99
Qus.26b . Please tell me the reason for dissatisfaction with the overall quality of your
telephone service.
Airtel MTNL TTML Reliance Overall
BILL NOT DELIVERY ON
TIME
Count 0 8 0 0 8
% 0 9 0 0 2
COMPLAIN NOT
RESOLVE
Count 0 2 0 4 6
% 0 2 0 3 2
CONNECTION NETWORK
PROBLEM
Count 2 7 27 16 52
% 2 8 38 11 14
CUSTOMER CARE ARE
NOT ACTIVE AND LINE
MAN DIDN'T
Count 14 24 0 12 50
% 16 28 0 9 13
Poor Network Count 0 0 0 3 3
% 0 0 0 2 1
NOT AVAILABILITY Of
DIAL TONE
Count 4 4 0 20 28
% 5 5 0 14 7
Poor VOICE QUALITY Count 7 6 9 4 26
% 8 7 13 3 7
Others
Count 11 2 9 12 34
% 13 2 13 9 9

________________________________________________________________________
TRAI (QoS) Customer Satisfaction Survey Report 2011 - 2012 – Delhi Circle
100
Qus.27 . What kind of others services are you also taking from this service provider.
Airtel MTNL TTML Reliance Overall
Broadband Count 577 363 153 494 1587
% 54 34 24 46 41
Mobile Count 236 199 63 380 878
% 22 19 10 36 23
Others Count 10 12 45 36 103
% 1 1 7 3 3
None Count 250 499 369 157 1275
% 23 47 59 15 33
Qus.42. Please specify the reason for your dissatisfaction with the redressal of the complaint by
the Nodal Officer.
Airtel MTNL TTML Reliance Overall
Difficult to connect to
the Nodal office
Count -- -- -- 4 4
% -- -- -- 21 15
Nodal officer not
polite/courteous
Count -- -- -- -- --
% -- -- -- -- --
Time taken by Nodal
Officer for redressal of
complaint is too long
Count -- 2 -- 8 10
% -- 33 -- 42 37
Unable to understand
the problem
Count -- -- -- 3 3
% -- -- -- 16 11
Others Count 2 4 -- 4 10
% 100 67 -- 21 37

________________________________________________________________________
TRAI (QoS) Customer Satisfaction Survey Report 2011 - 2012 – Delhi Circle
101
Annexure 2: Detailed Tables (Cellular Mobile Telephone Customers Survey) A. Service Provision
A.1. (Q 2) Have you been informed in writing, at the time of subscription of service or within a
week of activation of service the complete details of your tariff plan?
Sub
Parameters
% Customers
Air
tel
MT
NL
TT
SL
Re
lia
nce
Ide
a
Vo
da
fon
e
MT
S
Air
cel
Eti
sala
t
Ov
era
ll
Yes Count
534 830 602 500 525 545 605 421 479 5041
% 50 78 56 47 49 51 57 40 45 53
No Count
533 236 465 567 542 522 462 646 588 4561
% 50 22 44 53 51 49 43 61 55 48

________________________________________________________________________
TRAI (QoS) Customer Satisfaction Survey Report 2011 - 2012 – Delhi Circle
102
B. Billing Process - Prepaid Customers
B.2. (Q 4b) Please specify the reason(s) for your dissatisfaction with the accuracy of charges for
the services used such as call, SMS, GPRS etc
Sub Parameters
% Customers
A
irte
l
MT
NL
TT
SL
Re
lia
nce
Ide
a
Vo
da
fon
e
MT
S
Air
cel
Eti
sala
t
Ov
era
ll
Charges not as per
tariff plan
subscribed
Count 38 4 18 27 42 29 11 53 7 229
% 31 17 22 16 34 35 17 30 9 25
Tariff plan
changed without
information
Count 11 4 9 32 16 17 4 25 47 165
% 9 17 11 19 13 21 6 14 63 18
Charged for value
added services
not subscribed
Count 21 4 29 53 9 17 17 43 10 203
% 17 17 35 32 7 21 27 24 13 22
Charged for
call/services not
made
Count 40 28 90 49 38 20 63 8 336
% 33 34 54 39 46 31 35 11 37
Others Count 29 11 22 16 28 7 21 26 4 164
% 24 48 27 10 22 8 33 15 5 18

________________________________________________________________________
TRAI (QoS) Customer Satisfaction Survey Report 2011 - 2012 – Delhi Circle
103
B.2. (Q 5a) Have you made any complaint related to charging/credit/ waiver/ validity/
adjustments in the last 6 months?
% Customers
Air
tel
MT
NL
TT
SL
Re
lia
nce
Ide
a
Vo
da
fon
e
MT
S
Air
cel
Eti
sala
t
Ov
era
ll
Yes Count 408 96 282 501 315 205 180 338 227 2552
% 41 12 34 49 30 21 17 32 21 29
No Count 600 715 557 522 723 783 883 723 837 6343
% 60 88 66 51 70 79 83 68 79 71
B.3. (Q 5d) Please specify the reason(s) for your dissatisfaction with the ease of recharging
process and the transparency of recharge offer
Sub Parameters
% Customers
Air
tel
MT
NL
TT
SL
Re
lia
nce
Ide
a
Vo
da
fon
e
MT
S
Air
cel
Eti
sala
t
Ov
era
ll
Lack of complete
information about
the offer
Count 3 4 10 6 10 4 8 9 54
% 10 14 32 13 39 19 23 10 14
Charges/Services
not as per the
offer
Count 4 3 9 4 6 2 5 9 42
% 13 10 20 15 29 3 14 10 11
Delay in activation
of recharge
Count 1 4 7 13 6 1 6 1 22 61
% 3 14 23 29 23 5 9 3 23 16
Non availability of
all denomination
recharge coupons
Count 1 5 6 1 57 3 42 115
% 3 16 13 5 85 9 44 30
Others Count 21 20 8 14 8 9 5 18 19 122
% 70 71 26 31 31 43 8 51 20 32

________________________________________________________________________
TRAI (QoS) Customer Satisfaction Survey Report 2011 - 2012 – Delhi Circle
104
B.4. (Q 5e) Did you get information regarding call duration, amount deducted for call and
balance in the account after every call?
Sub
Parameters
% Customers
Air
tel
MT
NL
TT
SL
Re
lia
nce
Ide
a
Vo
da
fon
e
MT
S
Air
cel
Eti
sala
t
Ov
era
ll
Yes Count 966 764 771 916 991 932 955 1022 1017 8334
% 96 94 92 90 96 94 90 96 96 94
No Count 42 47 68 107 47 56 108 39 47 561
% 4 6 8 11 5 6 10 4 4 6
C. Billing Process - Postpaid Customers
C.1. (Q 7b) Please specify the reason(s) for your dissatisfaction with the clarity of the bills issued
by your service provider in terms of transparency and understandability
Sub Parameters
% Customers
Air
tel
MT
NL
TT
SL
Re
lia
nce
Ide
a
Vo
da
fon
e
MT
S
Air
cel
Eti
sala
t
Ov
era
ll
Difficult to read the
bill
Count -- 3 -- -- -- -- 2 -- -- 5
% -- 12 -- -- -- -- 100 -- -- 11
Difficult to
understand the
language
Count -- 3 -- -- 1 -- -- -- -- 4
% -- 12 -- -- 50 -- -- -- -- 9
Calculations not clear Count 1 1 1 -- -- 4 -- -- -- 7
% 100 4 10 -- -- 67 -- -- -- 15
Item-wise charges
like total minutes of
usage of local, STD,
calls and charges
thereon not given
Count 3 4 -- -- 1 -- -- -- 8
% 12 40 -- -- 17 -- -- -- 17
Others Count 15 5 -- 1 1 -- -- -- 22 15
% 60 50 -- 50 17 -- -- -- 48 60

________________________________________________________________________
TRAI (QoS) Customer Satisfaction Survey Report 2011 - 2012 – Delhi Circle
105
C.1. (Q 8b) Please specify the reason(s) for your dissatisfaction with the accuracy &
completeness of the bills
Sub Parameters
% Customers
Air
tel
MT
NL
TT
SL
Re
lia
nce
Ide
a
Vo
da
fon
e
MT
S
Air
cel
Eti
sala
t
Ov
era
ll
Charges not as per
tariff plan
subscribed
Count 1 10 5 -- -- 2 2 20 1
% 33 32 25 -- -- 17 100 29 33
Tariff plan
changed without
information
Count 1 6 -- -- -- -- -- -- 7 1
% 33 19 -- -- -- -- -- -- 10 33
Charged for value
added services not
subscribed
Count -- -- 4 -- -- 2 -- -- 6 --
% -- -- 20 -- -- 17 -- -- 9 --
Charged for
calls/services not
made/used
Count 1 7 10 -- 1 1 -- -- 20 1
% 33 23 50 -- 100 8 -- -- 29 33
Calculations are
not clear
Count 1 8 3 -- -- 7 -- -- 19 1
% 33 26 15 -- -- 58 -- -- 28 33

________________________________________________________________________
TRAI (QoS) Customer Satisfaction Survey Report 2011 - 2012 – Delhi Circle
106
(Q 9a) Have you made any billing related complaints in the last 6 months?
Sub
Parameters
% Customers
Air
tel
MT
NL
TT
SL
Re
lia
nce
Ide
a
Vo
da
fon
e
MT
S
Air
cel
Eti
sala
t
Ov
era
ll
Yes Count 4 68 56 4 9 13 2 1 0 157
% 7 27 25 9 31 17 50 17 0 22
No Count 55 187 172 40 20 66 2 5 3 550
% 93 73 75 91 69 84 50 83 100 78
Q 10 In the last 6 months, have you contacted customer care/ helpline/ call centre of your
service provider?
Sub
Parameters
% Customers
Air
tel
MT
NL
TT
SL
Re
lia
nce
Ide
a
Vo
da
fon
e
MT
S
Air
cel
Eti
sala
t
Ov
era
ll
Yes Count 686 580 715 748 572 527 593 634 379 5434
% 64 54 67 70 54 49 56 59 36 57
No Count 381 486 352 319 495 540 474 433 688 4168
% 36 46 33 30 46 51 44 41 65 43

________________________________________________________________________
TRAI (QoS) Customer Satisfaction Survey Report 2011 - 2012 – Delhi Circle
107
C.2. (Q 18) How often does your call drops during conversation?
Sub
Parameters
% Customers
Air
tel
MT
NL
TT
SL
Re
lia
nce
Ide
a
Vo
da
fon
e
MT
S
Air
cel
Eti
sala
t
Ov
era
ll
Very
Frequently
Count 7 15 10 21 8 6 22 12 10 111
% 1 1 1 2 1 1 2 1 1 1
Frequently Count 144 150 180 226 167 136 144 168 264 1579
% 14 14 17 21 16 13 14 16 25 16
Occasionally Count 392 737 558 493 517 430 473 492 523 4615
% 37 69 52 46 49 40 44 46 49 48
Never Count 524 164 319 327 375 495 428 395 270 3297
% 49 15 30 31 35 46 40 37 25 34
C.2. (Q 20) How often do you face signal problems?
Sub
Parameters
% Customers
Air
tel
MT
NL
TT
SL
Re
lia
nce
Ide
a
Vo
da
fon
e
MT
S
Air
cel
Eti
sala
t
Ov
era
ll
Very
Frequently
Count 5 28 25 15 11 5 12 19 14 134
% 1 3 2 1 1 1 1 2 1 1
Frequently Count 1062 1038 1042 1052 1056 1062 1055 1048 1053 9468
% 100 97 98 99 99 100 99 98 99 99
Occasionally Count -- -- -- -- -- -- -- -- -- --
% -- -- -- -- -- -- -- -- -- --
Never Count -- -- -- -- -- -- -- -- -- --
% -- -- -- -- -- -- -- -- -- --

________________________________________________________________________
TRAI (QoS) Customer Satisfaction Survey Report 2011 - 2012 – Delhi Circle
108
G.1. (Q 23) Have you subscribed to any supplementary services like call forwarding, call diverting
and value added services like ring tone, alerts, GPRS, e-mail, voice mail or any other such
services, in the last 6 months?
Sub
Parameters
% Customers
Air
tel
MT
NL
TT
SL
Re
lia
nce
Ide
a
Vo
da
fon
e
MT
S
Air
cel
Eti
sala
t
Ov
era
ll
Yes Count 161 43 125 182 147 156 78 205 33 1130
% 15 4 12 17 14 15 7 19 3 12
No Count 906 1023 942 885 920 911 989 862 1034 8472
% 85 96 88 83 86 85 93 81 97 88
C.3. (Q 25b) Please tell me the reasons for your dissatisfaction with the process of activating
value added services or the process of unsubscribing
% Customers
Air
tel
MT
NL
T
TS
L
Re
lia
nce
Ide
a
Vo
da
fon
e
MT
S
Air
cel
Eti
sala
t
Ov
era
ll
Not informed of
charges
Count 3 -- 1 2 -- -- -- 1 -- 7
% 75 -- 100 67 -- -- -- 50 -- 47
Activated
without consent
Count -- -- -- -- -- -- -- -- --
% -- -- -- -- -- -- -- -- --
Not informed
about toll free
number for
unsubscribing
Count 1 -- -- 1 1 4 -- 1 -- 8
% 25 -- -- 33 100 100 -- 50 -- 53
Others Count -- -- -- -- -- -- -- -- -- --
% -- -- -- -- -- -- -- -- -- --

________________________________________________________________________
TRAI (QoS) Customer Satisfaction Survey Report 2011 - 2012 – Delhi Circle
109
C.4. (Q 26) In last 6 months have you faced the problem of unauthorized activation of VAS by
your service provider?
Sub
Parameters
% Customers
Air
tel
MT
NL
T
TS
L
Re
lia
nce
Ide
a
Vo
da
fon
e
MT
S
Air
cel
Eti
sala
t
Ov
era
ll
Yes Count 472 122 411 564 340 243 193 434 74 2853
% 44 11 39 53 32 23 18 41 7 30
No Count 595 944 656 503 727 824 874 633 993 6749
% 56 89 62 47 68 77 82 59 93 70
C.4. (Q 27) Have you complained to your service provider for deactivation of such services and
refund of charges levied?
% Customers
Air
tel
MT
NL
T
TS
L
Re
lia
nce
Ide
a
Vo
da
fon
e
MT
S
Air
cel
Eti
sala
t
Ov
era
ll
Yes Count 385 82 311 498 248 167 158 330 59 2238
% 82 67 76 88 73 69 82 76 80 78
No Count 87 40 100 66 92 76 35 104 15 615
% 18 33 24 12 27 31 18 24 20 22

________________________________________________________________________
TRAI (QoS) Customer Satisfaction Survey Report 2011 - 2012 – Delhi Circle
110
Qus 28(b) How satisfied are you with the resolution of your complaint for deactivation of VAS &
refund of charges levied?
% Customers
Air
tel
MT
NL
T
TS
L
Re
lia
nce
Ide
a
Vo
da
fon
e
MT
S
Air
cel
Eti
sala
t
Ov
era
ll
% Total
Satisfacted
Count 306 85 243 326 211 167 133 255 49 1775
% 65 70 59 58 62 69 69 59 66 62
(Q 29 b) Please specify the reason(s) for your dissatisfaction with the overall quality of your
mobile service
% Customers
Air
tel
MT
NL
TT
SL
Re
lia
nce
Ide
a
Vo
da
fon
e
MT
S
Air
cel
Eti
sala
t
Ov
ara
ll
No reason given
Count 53 101 61 82 56 52 25 47 17 494
% 50 52 48 35 39 60 19 47 11 39
% -- -- -- -- -- -- -- -- -- --
Automatic
balance
Deduction
Count 4 0 8 13 13 4 2 5 0 49
% 4 0 6 6 9 5 2 5 0 4
Unauthorized
activation of VAS
Count 18 0 20 16 22 8 2 15 105
% 17 0 16 7 15 9 2 15 3 8
Signal Problem Count 3 3 0 0 2 0 0 0 0 8
% 3 2 0 0 1 0 0 0 0 1
Poor customer
Care
Count 9 40 7 51 14 11 23 6 12 173
% 9 21 6 22 10 13 17 6 8 14
Poor Network Count 8 36 18 58 15 5 65 19 101 325
% 8 19 14 25 11 6 49 19 68 26
Others
Count 11 13 13 15 21 7 16 9 15 120
% 10 7 10 6 15 8 12 9 10 9

________________________________________________________________________
TRAI (QoS) Customer Satisfaction Survey Report 2011 - 2012 – Delhi Circle
111
C.4. (Q 30) What kind of other telecom services are you using
Sub Parameters
% Customers
Air
tel
MT
NL
T
TS
L
Re
lia
nce
Ide
a
Vo
da
fon
e
MT
S
Air
cel
Eti
sala
t
Ov
era
ll
Broadband Count 62 73 76 71 -- -- -- 48 74 404
% 5.8 6.8 7.1 6.7 -- -- -- 4.5 6.9 4.2
Wireline Count 48 67 55 31 -- -- -- -- -- 201
% 4.5 6.3 5.2 2.9 -- -- -- -- -- 2.1
Others Count
%
-- -- -- -- -- -- -- 161 -- 161
-- -- -- -- -- -- -- 15.1 -- 1.7
None Count
%
965 942 939 972 1067 1067 1067 858 993 8870
90.4 88.4 88 91.1 100 100 100 80.4 93.1 92.4

________________________________________________________________________
TRAI (QoS) Customer Satisfaction Survey Report 2011 - 2012 – Delhi Circle
112
C.4. (Q 42b)Were you able to connect to the Nodal officer without any difficulty?
Sub Parameters
% Customers
Air
tel
MT
NL
T
TS
L
Re
lia
nce
Ide
a
Vo
da
fon
e
MT
S
Air
cel
Eti
sala
t
Ov
era
ll
Yes Count 3 7 4 11 5 4 2 1 -- 37
% 50 64 50 48 71 80 50 25 -- 54
No
Count 3 4 4 12 2 1 2 3 -- 31
% 50 36 50 52 29 20 50 75 -- 46
% 50 36 50 52 29 20 50 75 -- 46
Q31 The following table shows the percentage of customers who aware about the facility for
registering your mobile number with the service provider for not receiving unwanted tele
marketing calls/SMS.
Sub Parameters
% Customers
Air
tel
MT
NL
T
TS
L
Re
lia
nce
Ide
a
Vo
da
fon
e
MT
S
Air
cel
Eti
sala
t
Ov
era
ll
Yes Count 337 550 407 606 319 333 566 432 498 4048
% 32 52 38 57 30 31 53 41 47 42
No Count 730 516 660 461 748 734 501 635 569 5554
% 68 48 62 43 70 69 47 60 53 58

________________________________________________________________________
TRAI (QoS) Customer Satisfaction Survey Report 2011 - 2012 – Delhi Circle
113
Q32 The following table shows the percentage of customers who registered with service
provider for not receiving any unwanted tele marketing calls/SMS
Sub
Parameters
% Customers
Air
tel
MT
NL
T
TS
L
Re
lia
nce
Ide
a
Vo
da
fon
e
MT
S
Air
cel
Eti
sala
t
Ov
era
ll
Yes Count 113 92 145 340 95 94 354 139 32 1404
% 34 17 36 56 30 28 63 32 6 35
No Count 224 458 262 266 224 239 212 293 466 2644
% 67 83 64 44 70 72 38 68 94 65

________________________________________________________________________
TRAI (QoS) Customer Satisfaction Survey Report 2011 - 2012 – Delhi Circle
114
Q33A The following table shows the percentage of customers who significant reduction in
number of unwanted tele marketing calls/SMS received even after registering
Sub
Parameters
% Customers
Air
tel
MT
NL
T
TS
L
Re
lia
nce
Ide
a
Vo
da
fon
e
MT
S
Air
cel
Eti
sala
t
Ov
era
ll
No change Count 21 20 15 25 15 16 23 12 2 149
% 19 22 10 7 16 17 7 9 6 11
Slight decrease Count 20 32 27 25 14 15 16 10 1 160
% 18 35 19 7 15 16 5 7 3 11
Considerable
decrease
Count 13 7 13 55 9 4 42 19 3 165
% 12 8 9 16 10 4 12 14 9 12
Stopped
receiving
Count 59 33 90 235 57 59 273 98 26 930
% 52 36 62 69 60 63 77 71 81 66
Q33b The following table shows the percentage of customers who made any complaint to
your service provider on getting such unwanted tele marketing calls/ SMS even after
registering your mobile number.
Sub Parameters
% Customers
Air
tel
MT
NL
T
TS
L
Re
lia
nce
Ide
a
Vo
da
fon
e
MT
S
Air
cel
Eti
sala
t
Ov
era
ll
Yes Count
28 17 22 36 8 15 13 7 4 150
% 52 29 40 34 21 43 16 17 67 32
No Count
26 42 33 70 30 20 68 34 2 325
% 48 71 60 66 79 57 84 83 33 68

________________________________________________________________________
TRAI (QoS) Customer Satisfaction Survey Report 2011 - 2012 – Delhi Circle
115
Q33c The following table shows the percentage of customers who made any complaint to
your service provider on getting such unwanted tele marketing calls/ SMS even after
registering your mobile number and…
Sub Parameters
% Customers
Air
tel
MT
NL
T
TS
L
Re
lia
nce
Ide
a
Vo
da
fon
e
MT
S
Air
cel
Eti
sala
t
Ov
era
ll
Complaint was registered by the
service provider and informed
about the action taken
Count 11 7 9 21 3 6 7 2 1 67
% 39 41 41 58 38 40 54 29 25 45
Complaint was registered by the
service provider and did not
inform about the action taken
Count 12 4 5 9 2 7 6 4 3 52
% 43 24 23 25 25 47 46 57 75 35
Service Provider refused to
register the complaint
Count 2 3 1 3 2 1 0 1 0 13
% 7 18 5 8 25 7 0 14 0 9
Difficult to lodge the complaint Count 3 3 7 3 1 1 0 0 0 18
% 11 18 32 8 13 7 0 0 0 12
Q34a The following table shows the percentage of customers who aware of facility by which
you can change your service provider without changing your mobile number
Sub Parameters
% Customers
Air
tel
MT
NL
T
TS
L
Re
lia
nce
Ide
a
Vo
da
fon
e
MT
S
Air
cel
Eti
sala
t
Ov
era
ll
Yes Count 552 691 596 702 492 582 717 622 725 5679
% 52 65 56 66 46 55 67 58 68 59
No Count 515 375 471 365 575 485 350 445 342 3923
% 48 35 44 34 54 46 33 42 32 41

________________________________________________________________________
TRAI (QoS) Customer Satisfaction Survey Report 2011 - 2012 – Delhi Circle
116
Q34b The following table shows the percentage of customers who Have you utilized SMS
based Mechanism for getting ‘Unique Porting Code’ from your existing service provider
Sub Parameters
% Customers
Air
tel
MT
NL
T
TS
L
Re
lia
nce
Ide
a
Vo
da
fon
e
MT
S
Air
cel
Eti
sala
t
Ov
era
ll
Yes Count 22 37 15 25 21 57 425 29 7 638
% 4 5 3 4 4 10 59 5 1 11
No Count 530 654 581 677 471 525 292 593 718 5041
% 96 95 98 96 96 90 41 95 99 89
34d The following table shows the percentage of customers If they have utilized the service of
MNP, you satisfied with its entire process
Sub Parameters
% Customers
Air
tel
MT
NL
T
TS
L
Re
lia
nce
Ide
a
Vo
da
fon
e
MT
S
Air
cel
Eti
sala
t
Ov
era
ll
Very dissatisfied Count 3 3 2 0 0 2 11 0 0 21
% 14 8 13 0 0 4 3 0 0 3
Dissatisfied Count 5 4 2 5 5 5 17 5 1 49
% 23 11 13 20 24 9 4 17 14 7.70
Satisfied Count 13 26 9 16 14 40 378 21 5 522
% 59 70 60 64 67 70 89 72 71 82
Very satisfied Count 1 4 2 4 2 10 19 3 1 46
% 5 11 13 16 10 18 5 10 14 7

________________________________________________________________________
TRAI (QoS) Customer Satisfaction Survey Report 2011 - 2012 – Delhi Circle
117
34 (C) When did you get ‘Unique Porting Code’ from your existing service provider
Sub
Parameters
% Customers
Air
tel
MT
NL
TT
SL
Re
lia
nce
Ide
a
Vo
da
fon
e
MT
S
Air
cel
Eti
sala
t
Ov
era
ll
Within 5
minutes
Count 12 13 6 10 8 29 210 17 0 305
% 55 35 40 40 38 51 49 59 0 48
After 5 to 10
minutes
Count 5 14 5 11 4 10 183 3 4 239
% 23 38 33 44 19 18 43 10 57 38
After 10 minutes Count 4 10 4 2 6 16 32 5 3 82
% 18 27 27 8 29 28 8 17 43 13
Never Count 1 0 0 2 3 2 0 4 0 12
% 5 0 0 8 14 4 0 14 0 2
Q35 On a scale of 1 – 10 where 10 is very good and 1 is very poor, how do you rate your
service provider
Sub
Parameters
% Customers
Air
tel
MT
NL
TT
SL
Re
lia
nce
Ide
a
Vo
da
fon
e
MT
S
Air
cel
Eti
sala
t
Ov
era
ll
Average score Count 1067 1066 1067 1067 1067 1067 1067 1067 1067 9602
Mean 7.72 6.9 7.2 6.84 7.41 7.82 7.45 7.34 7.02 7.3

________________________________________________________________________
TRAI (QoS) Customer Satisfaction Survey Report 2011 - 2012 – Delhi Circle
118
Annexure 3: Detailed Tables (Broadband Customers Survey)
A. Service Provision
A.1. (Q 1a) When did you last apply for a broadband connection?
Airtel MTNL TATA Reliance Hathway Spectranet Overall
More than
7to 15 days
ago
Count 256 349 142 129 573 494 1943
% 24 33 13 12 54 46 30
More than
15 day to 30
days ago
Count 20 18 41 38 298 90 505
% 2 2 4 4 28 8 8
More than
30 days ago
Count 791 700 884 900 196 483 3954
% 74 66 83 84 18 45 62

________________________________________________________________________
TRAI (QoS) Customer Satisfaction Survey Report 2011 - 2012 – Delhi Circle
119
Qus.3 . In case your connection was temporarily suspended due to non-payment of bills, how
much time was taken by the service provider to reactivate service after you made the payment?
Service
Providers Airtel MTNL TATA Reliance Hathway Spectranet Overall
Within 24
hrs
Count 237 202 717 214 89 86 1545
% 22 19 67 20 8 8 24
2-3 days Count 128 144 194 92 56 265 879
% 12 14 18 9 5 25 14
4-7 days Count 8 14 2 16 0 24 64
% 1 1 0 2 0 2 1
More than
7 days
Count 38 33 2 70 0 9 152
% 4 3 0 7 0 1 2
Not
applicable
Count 656 674 152 675 922 683 3762
% 62 63 14 63 86 64 59

________________________________________________________________________
TRAI (QoS) Customer Satisfaction Survey Report 2011 - 2012 – Delhi Circle
120
Qus.5(b) Please specify the reason(s) for your dissatisfaction with the clarity of the bills issued by service
provider in terms of transparency and understandability
Service Providers Airtel MTNL TATA Reliance Hathway Spectranet Overall
Difficult to read
the bill
Count -- 4 -- 44 -- -- 48
% -- 8 -- 24 -- -- 11
Difficult to
understand the
language
Count 8 -- 99 22 5 9 143
% 16 -- 83 12 14 38 32
Calculation-on
not clear
Count 6 11 16 32 30 6 101
% 12 32 13 17 86 25 23
Item-wise
charges not
given
Count -- -- -- 5 -- -- 5
% -- -- -- 3 -- -- 1
others
Count 34 23 4 119 -- 9 189
% 68 68 3 64 -- 38 42

________________________________________________________________________
TRAI (QoS) Customer Satisfaction Survey Report 2011 - 2012 – Delhi Circle
121
Qus.6(b) Please specify the reason(s) for your dissatisfaction with the accuracy/completeness
of the bills.
Service
Providers Airtel MTNL TATA Reliance Hathway Spectranet Overall
Charges not as
per tariff plan
subscribed
Count 8 7 8 15 6 -- 44
% 18 20 7 9 20 -- 11
Tariff plan
changed
without
information
Count 4 7 2 11 -- -- 24
% 9 20 2 6 -- -- 6
Charged for
value added
services not
subscribed
Count 8 -- 92 32 -- 3 135
% 18 -- 80 19 25 33
Charged for
calls not made
Count 8 8 2 55 24 -- 97
% 18 23 2 32 80 -- 24
others
Count 20 13 11 70 -- 9 123
% 46 37 10 41 -- 75 30

________________________________________________________________________
TRAI (QoS) Customer Satisfaction Survey Report 2011 - 2012 – Delhi Circle
122
Qus.7 Have you made any billing related complaints in last 6 months?
Airtel MTNL TATA Reliance Hathway Spectranet Overall
Yes Count 119 56 182 293 99 146 895
% 11 5 17 28 15 14 15
No Count 939 1011 876 759 572 912 5069
% 89 95 83 72 85 86 85
Qus.9(b) Please specify the reason(s) for your dissatisfaction with the accuracy of charges i.e.
amount deducted on every usage
Airtel MTNL TATA Reliance Hathway Spectranet Overall
Charges not as
per tariff plan
subscribed
Count -- -- -- -- 16 -- 16
% -- -- -- -- 59 -- 59
Tariff plan
changed
without
information
Count -- -- -- -- 5 -- 5
% -- -- -- -- 19 -- 19
Charged for
value added
services not
requested
Count -- -- -- -- 6 -- 6
% -- -- -- -- 22 -- 22
Charged for calls
not made
Count -- -- -- -- -- -- --
% -- -- -- -- -- -- --
others
Count -- -- -- -- -- -- --
% -- -- -- -- -- -- --
% -- -- -- -- -- -- --

________________________________________________________________________
TRAI (QoS) Customer Satisfaction Survey Report 2011 - 2012 – Delhi Circle
123
Qus 9(c) Have you made any complaints related to charging/credit/waiver/validity/adjustments
in last 6 months?
Airtel MTNL TATA Reliance Hathway Spectranet Overall
Yes Count -- -- -- -- 62 -- 62
% -- -- -- -- 16 -- 14
No
Count 9 -- 9
15 334 9 376
% 100 -- 100
100 84 100 86
Qus.10 In the last 6 months, have you contacted customer care/helpline/call centre of your
service provider?
Airtel MTNL TATA Reliance Hathway Spectranet Overall
Yes
Count 675
646 774 864 845 766 4570
% 63
61 73 81 79 72 71
No
Count 392
421 293 203 222 301 1832
% 37
40 28 19 21 28 29
Qus.17 . How often do you face a problem with your Broadband connection?
Service
Providers Airtel MTNL TATA Reliance Hathway Spectranet
Overal
l
Very
frequently
Count 13 9 13 40 27 6 108
% 1 1 1 4 3 1 2
Frequently Count 113 84 70 176 200 86 729
% 11 8 7 17 19 8 11
Occasionally Count 741 760 376 731 762 796 4166
% 69 71 35 69 71 75 65
Never Count 200 214 608 120 78 179 1399
% 19 20 57 11 7 17 22

________________________________________________________________________
TRAI (QoS) Customer Satisfaction Survey Report 2011 - 2012 – Delhi Circle
124
Qus.18 What was the broadband connection problem faced by you in last 6 months related to,
please specify?
Service Providers Airtel MTNL TATA Reliance Hathway Spectranet
Overal
l
Problem was
related to my
computer
Hardware/software
Count 4 0 13 6 0 3 26
% 3 0 16 3 0 3 3
Problem was
related to broad
band and modem
provided by the
service operator
Count 122 93 70 210 227 89 811
% 97 100 84 97 100 97 97
Qus20(a) Do you use any value added services or supplementary services such as static/ fixed IP
addresses, e-mail IDs etc.
Service
Providers Airtel MTNL TATA Reliance Hathway
Spectran
et Overall
Yes
Count 140 100 139 66 47 75 567
% 13 9 13 6 4 7 9
NO Count 927 967 928 1001 1020 992 5835
% 87 91 87 94 96 93 91

________________________________________________________________________
TRAI (QoS) Customer Satisfaction Survey Report 2011 - 2012 – Delhi Circle
125
Qus.20(c) Please tell me the reasons for your dissatisfaction with the process of activating value
added services or the process of unsubscribing
Service
Providers Airtel MTNL TATA Reliance Hathway Spectranet Overall
Not informed
of charges
Count 2 -- -- 6 -- -- 8
% 13 -- -- 50 -- -- 19
Activated
without
consent
Count 4 -- -- -- -- -- 4
% 25 -- -- -- -- -- 9
Not informed
about toll free
no. for
unsubscribing
Count 2 3 -- 6 6 -- 17
% 13 50 -- 50 100 -- 40
others
Count 10 3 3 -- -- -- 16
% 63 50 100 -- -- -- 37
Qus 21(a) In last 6 months have you faced the problem of unauthorized activation of VAS by
your service provider?( such as static/fixed IP addresses, email-ids, antivirus packages, etc)
Service
Providers Airtel MTNL TATA Reliance Hathway
Spectra
net Overall
Yes Count 16 11 8 12 0 9 56
% 2 1 1 1 0 1 1
NO Count 1051 1056 1059 1055 1067 1058 6346
% 99 99 99 99 100 99 99
Qus 21(b) Have you complained to your service provider for deactivation of such services and
refund of charges levied?
Service
Providers Airtel MTNL TATA Reliance Hathway
Spectra
net
Overal
l
Yes Count 10 3 0 12 -- 9 34
% 63 27 0 100 -- 100 61
NO Count 6 8 8 0 -- 0 22
% 38 73 100 0 -- 0 39

________________________________________________________________________
TRAI (QoS) Customer Satisfaction Survey Report 2011 - 2012 – Delhi Circle
126
Qus21(c) What difficulties you have faced while deactivating of such services and refund of
charges levied?
Service
Providers Airtel MTNL TATA Reliance Hathway Spectranet Overall
None Count 6 -- -- -- 9 15
% 60 -- -- -- 100 44
Delay in
deactivation
Count 4 -- -- 6 -- -- 10
% 40 -- -- 50 -- -- 29
Customer care
refused to
register
Count -- 3 -- 6 -- -- 9
% -- 100 -- 50 -- -- 27
Not aware of
whom to be
contacted
Count -- -- -- -- -- -- --
% -- -- -- -- -- -- --
others Count -- -- -- -- -- -- --
% -- -- -- -- -- -- --
Qus22. How satisfied are you with the resolution of your complaint for deactivation of VAS &
refund of charges levied?
Service
Providers Airtel MTNL TATA Reliance Hathway Spectranet
Overall
%
Satisfaction
Count 6 3 -- 0 -- 9 18
% 60 100 -- 0 -- 100 53

________________________________________________________________________
TRAI (QoS) Customer Satisfaction Survey Report 2011 - 2012 – Delhi Circle
127
Qus23 (b) Please specify the reason(s) for your dissatisfaction with the overall quality of your
Broadband service
Airtel MTNL TATA Reliance Hathway Spectranet Overall
No Reason
Given
Count 7 47 14 45 0 6 119
% 6 35 22 21 0 3 13
bill not on time
and speed is
low
Count 6 0 11 37 21 0 75
% 5 0 17 18 11 0 8
CONNECTIVIY
PROBLEM
Count 14 7 0 6 21 6 54
% 12 5 0 3 11 3 6
CUSTOMER
CARE IS POOR
Count 30 27 2 15 5 74 153
% 26 20 3 7 3 42 17
Difficulty to
read the bill
Count 2 0 2 0 0 0 4
% 2 0 3 0 0 0 0
NET WORK
PROBLEM
Count 10 7 3 27 5 0 52
% 9 5 5 13 3 0 6
SERVICE ISSUE Count 0 0 0 25 0 0 25
% 0 0 0 12 0 0 3
speed is slow Count 32 18 17 40 135 89 331
% 27 13 27 19 68 51 37
Others Count 16 26 15 16 6 0 79
% 14 19 23 8 3 0 9

________________________________________________________________________
TRAI (QoS) Customer Satisfaction Survey Report 2011 - 2012 – Delhi Circle
128
Qus.24 How many persons in your house are using this Broadband connection?
Airtel MTNL TATA Reliance Hathway Spectranet
Average
score
Count 1067 1067 1067 1067 1067 1067
Mean 2.87 2.84 2.33 2.38 3.22 3.18

________________________________________________________________________
TRAI (QoS) Customer Satisfaction Survey Report 2011 - 2012 – Delhi Circle
129
Qus.24(a) What kind of other telecom services are you also taking from your service provider
Service
Providers Airtel MTNL TATA Reliance Hathway Spectranet Overall
Mobile Count 196 98 260 154 -- -- 708
% 18.4 9.2 24.4 14.4 -- -- 11.1
Wireline Count 584 739 27 615 -- -- 1965
% 54.7 69.3 2.5 57.6 -- -- 30.7
Others Count -- -- -- -- -- -- --
% -- -- -- -- -- -- --
None Count 419 278 789 394 1067 1067 4014
% 39.3 26.1 73.9 36.9 100 100 62.7
Qus 25 Are you aware of the facility for measuring the broadband connection speed provided by
your service provider?
Service
Providers Airtel MTNL TATA Reliance Hathway Spectranet Overall
Yes Count 516 747 620 596 872 732 4083
% 48 70 58 56 82 69 64
No Count 551 320 447 471 195 335 2319
% 52 30 42 44 18 31 36

________________________________________________________________________
TRAI (QoS) Customer Satisfaction Survey Report 2011 - 2012 – Delhi Circle
130
Qus.32 Please specify the reason(s) for your dissatisfaction with the system of resolving of your
complaints by call centre/customer care/ helpline
Service
Providers Airtel MTNL TATA Reliance Hathway Spectranet Overall
Difficult to
connect to the
call centre
Count 2 3 3 -- 6 -- 14
% 1 4 4 -- 3 -- 2
Customer care
executive not
polite
Count 6 10 3 10 30 -- 59
% 4 12 4 4 15 -- 7
Customer care
not equipped
with adequate
information
Count 10 3 5 98 33 9 158
% 7 4 7 36 17 7 18
Time taken by
call centre for
redresser of
complaint is too
long
Count 66 48 17 89 95 107 422
% 47 59 23 33 49 88 48
Customer care
ex. Was unable
to understand
the problem
Count 2 -- 37 -- 21 -- 60
% 1 -- 49 -- 11 -- 7
Others
Count 58 18 10 75 11 6 178
% 41 22 13 28 6 5 20

________________________________________________________________________
TRAI (QoS) Customer Satisfaction Survey Report 2011 - 2012 – Delhi Circle
131
Qus.36(b) Please specify the reason(s) for your dissatisfaction with the redressal of the
complaint by the Nodal Officer.
Airtel MTNL TATA Reliance Hathway Spectranet Overall
Difficult to connect
to the nodal officer
Count -- -- -- -- -- -- --
% -- -- -- -- -- -- --
Nodal officer not
polite
Count -- -- -- -- -- -- --
% -- -- -- -- -- -- --
officer not equipped
with adequate
information
Count -- -- -- -- -- -- --
% -- -- -- -- -- -- --
Time taken by Nodal
officer for redresser
of complaint is too
Count 2 -- -- -- 5 -- 7
% 10 -- -- -- 46 -- 13
Nodal officer was
unable to
understand the
problem
Count 2 -- -- -- -- -- 2
% 10 -- -- -- -- -- 4
Others Count 16 -- -- 25 6 -- 47
% 80 -- -- 100 55 -- 84

________________________________________________________________________
TRAI (QoS) Customer Satisfaction Survey Report 2011 - 2012 – Delhi Circle
132
SURVEY A: Basic Service (WireLine)
Good morning/ afternoon/ evening. I am _______ from Market Pulse, a reputed market research and consulting
company. We are currently doing a survey on satisfaction amongst phone and broadband users. This survey is being
carried out on behalf of TRAI – Telecom Regulatory Authority of India a body set up by the government, so that
customers like you get better service in future. We would appreciate if you could spare 15 minutes of your valuable
time to answer a few questions. Thank you.
THE QUESTIONNAIRE SHALL BE FILLED USING ONLY BALL POINT PEN.
ALL QUESTIONS ARE SINGLE CODE UNLESS MULTICODE IS SPECIFIED.
S1.1. Which landline service provider are you using currently? READ OUT & TICK
[1] Airtel [2] BSNL [3] Reliance [4] Tata Indicom [5] MTS/ Sistema Shyam [6] HFCL [7] MTNL
<IF ANY OPTION IS TICKED ABOVE, THEN CONTINUE ELSE TERMINATE>
S1.2. Name:___________________________________ S1.3. RECORD Gender: 1 Male 2 Female
Could you please sign here. We are taking your signature to establish that someone has actually taken your
feedback and not some one else’s:_______________________________ (QUESTIONNAIRE WITHOUT SIGNATURE
WILL BE CONSIDERED INVALID)
S1.4 Tel: S1.5. Age (in years): 1 Less than 25 2 25-34 3 35-44 4 More than 45
S1.6 Please tell us your Occupation: 1 Service 2 Business/self employed
3 Student 4 Housewife 5 Retired
S1.7. RECORD Usage Type: 1 Residential 2 Commercial
S1.8. RECORD Area: 1 Rural 2 Urban
S1.9. User Type: 1 Postpaid 2 Prepaid
S1.10. RECORD State: [1] Jammu & Kashmir [2] Himachal Pradesh [3] Rajasthan [4] Punjab
[5] Haryana [6] Delhi [7] Uttar Pradesh(East) [8] Uttar Pradesh(West)
S1.11. RECORD District______________________________ Address: _______________________________
S1.12. RECORD Name of SDCA: ____________________
S1.13. RECORD Name of Exchange: _________________
S1.14. RECORD Mode of Interview: 1 Telephonic 2 In-person
Serial No.
STD
Code
Telephone Number

________________________________________________________________________
TRAI (QoS) Customer Satisfaction Survey Report 2011 - 2012 – Delhi Circle
133
QUESTIONNAIRE FOR CUSTOMER SATISFACTION SURVEY
A. SERVICE PROVISION
1(a) . Have you taken a telephone connection, shifted your
connection or had your connection temporarily suspended in
the last 6 months?
[1] Yes ADMINISTER Q.NOS. 1 - 3
[2] No SKIP TO SECTION B
1(b). In case you have taken a telephone connection in the last
6 months, how satisfied are you with time taken to provide
working phone connection?
4 Very Satisfied 3 Satisfied
2 Dissatisfied 1 Very Dissatisfied
2. Have you been informed in writing, at the time of
subscription of service or within a week of activation of
service the complete details of your tariff plan?
1 Yes 2 No
3. How satisfied are you with the ease of understanding or
with provision of all relevant information related to tariff
plans & charges?
4 Very Satisfied 3 Satisfied
2 Dissatisfied 1 Very Dissatisfied
B. BILLING RELATED (Only for Postpaid Customers) (For Pre-Paid customers go to Q 10)
4. How satisfied are you with the time taken to deliver your
bills?
4 Very Satisfied 3 Satisfied
2 Dissatisfied 1 Very Dissatisfied
5(a). How satisfied are you with the quality of your bills?
accuracy & completeness of the bills?
4 Very Satisfied 3 Satisfied
2 Dissatisfied 1 Very Dissatisfied
(Ask Q 5(b) only if 1 OR 2 is coded)
(Ask this question only if 1 OR 2 is coded in Q5(a))
5(b). Please specify the reason(s) for your dissatisfaction.
(Multiple Code)
1 Charges not as per tariff plan subscribed
2 Tariff plan changed without information
3 Charged for value added services not
subscribed
4 Charged for calls/services not made/used
5 Details like item-wise charges are not
provided
6 Calculations are not clear
7 Others (please specify)
____________________
6. Have you made any billing related complaints in the last 6
months?
1 Yes 2 No (If No, go to
Q 8 )
7. How satisfied are you with the process of resolution of
billing complaints?
4 Very Satisfied 3 Satisfied
2 Dissatisfied 1 Very Dissatisfied

________________________________________________________________________
TRAI (QoS) Customer Satisfaction Survey Report 2011 - 2012 – Delhi Circle
134
8. How satisfied are you with the clarity of the bills sent by
your service provider in terms of transparency and
understandability?
4 Very Satisfied 3 Satisfied
2 Dissatisfied 1 Very Dissatisfied
(Ask Q 9 only if 1 OR 2 is coded)
(Ask this question only if 1 OR 2 is coded in Q 9(a))
9. Please specify the reason(s) for your dissatisfaction.
(Multiple Code)
1 Difficult to read the bill
2 Difficult to understand the language
3 Calculations not clear
4 Item-wise charges like total minutes of usage
of local, STD, ISD calls and charges thereon not
given
5 Others (please
specify)_____________________
For Prepaid Customers only
10(a) How satisfied are you with the charges deducted for
every call i.e. amount deducted on every usage?
4 Very Satisfied 3 Satisfied
2 Dissatisfied 1 Very Dissatisfied
(Ask this question only if 1 OR 2 is coded in Q10(a))
10(b). Please specify the reason(s) for your
dissatisfaction. (Multiple Code)
1 Charges not as per tariff plan subscribed
2 Tariff plan changed without information
3 Charged for value added services not
subscribed
4 Charged for calls/services not made/used
5 Others (please specify)
____________________
10(c). Have you made any complaint related to
charging/credit/waiver/validity/adjustments in the
last 6 months?
1 Yes (If Yes, go to Q 10(d))
2 No
10(d).How satisfied are you with the resolution of such
billing complaints and the resulting
refund/credit/waiver of excess charges on account of
such resolution of complaints?
4 Very Satisfied 3 Satisfied
2 Dissatisfied 1 Very Dissatisfied
10(e). How satisfied are you with the ease of recharging
process and the transparency of recharge offer?
4 Very Satisfied 3 Satisfied
2 Dissatisfied 1 Very Dissatisfied
(Ask Q 10(f) only if 1 OR 2 is coded)

________________________________________________________________________
TRAI (QoS) Customer Satisfaction Survey Report 2011 - 2012 – Delhi Circle
135
10(f) Please specify the reason(s) for your dissatisfaction.
(Multiple Code)
1 Lack of complete information about the offer
2 Charges/Services not as per the offer
3 Delay in activation of recharge
4 Non availability of all denomination recharge
coupons
5 Others (please specify)_____________________
C. HELP SERVICES/CUSTOMER CARE INCLUDING CUSTOMER GRIEVANCE REDRESSAL
11. In the last 6 months, have you contacted customer care/
helpline/ call centre of your service provider?
1 Yes 2 No (If No, go
to Q 16)
12(a). How satisfied are you with the ease of access of call
centre/customer care or helpline?
4 Very Satisfied 3 Satisfied
2 Dissatisfied 1 Very Dissatisfied
12(b). How satisfied are you with the ease of getting an
option for ”talking to a customer care executive”?
4 Very Satisfied 3 Satisfied
2 Dissatisfied 1 Very Dissatisfied
13. How satisfied are you with the response time taken to
answer your call by a customer care executive?
4 Very Satisfied 3 Satisfied
2 Dissatisfied 1 Very Dissatisfied
14. How satisfied are you with the problem solving ability of
the customer care executive(s)?
4 Very Satisfied 3 Satisfied
2 Dissatisfied 1 Very Dissatisfied
15. How satisfied are you with the time taken by call
centre/customer care /helpline to resolve your
complaint?
4 Very Satisfied 3 Satisfied
2 Dissatisfied 1 Very Dissatisfied
D. NETWORK PERFORMANCE, RELIABILITY AND AVAILABILITY
16. How satisfied are you with the availability of working
telephone (dial tone)?
4 Very Satisfied 3 Satisfied
2 Dissatisfied 1 Very Dissatisfied
17. How satisfied are you with the ability to make or receive
calls easily?
4 Very Satisfied 3 Satisfied
2 Dissatisfied 1 Very Dissatisfied
18. How satisfied are you with the voice quality? 4 Very Satisfied 3 Satisfied
2 Dissatisfied 1 Very Dissatisfied
E. MAINTAINABILITY (FAULT REPAIR)
19. How many times has your telephone connection
required repair in the last 6 months?
1 Nil 2 One time
3 2-3 times 4 More than 3 times

________________________________________________________________________
TRAI (QoS) Customer Satisfaction Survey Report 2011 - 2012 – Delhi Circle
136
20. How long did it take generally for repairing the fault
after lodging a complaint?
1 1 day 2 2-3 days
3 4 - 7 days 4 more than 7 days
21. How satisfied are you with the fault repair service? 4 Very Satisfied 3 Satisfied
2 Dissatisfied 1 Very Dissatisfied
F. SUPPLEMENTARY SERVICES AND VALUE ADDED SERVICES
22. Do you use services like call waiting, call forwarding,
voice mail or any other supplementary services / value
added services?
1 Yes 2 No (If No, go to Q
26(a))
23. How satisfied are you with the quality of the
supplementary services / value added service provided?
4 Very Satisfied 3 Satisfied
2 Dissatisfied 1 Very Dissatisfied
24(a) How satisfied are you with the process of activating
value added services or the process of unsubscribing?
4 Very Satisfied 3 Satisfied
2 Dissatisfied 1 Very Dissatisfied
24(b) Please tell me the reasons for your dissatisfaction. 1 Not informed of charges
2 Activated without consent
3 Not informed about toll free number for
unsubscribing
4 If any other reasons, please specify
25. In the last 6 months have you faced the problem of
unauthorized activation of VAS by your service
provider?
1 Yes 2 No (If No, go to Q
26(a))
(Ask only If Yes in Q25)
25(a).How satisfied are you with the resolution of your
complaint for deactivation of VAS?
4 Very Satisfied 3 Satisfied
2 Dissatisfied 1 Very Dissatisfied
G. OVERALL CUSTOMER SATISFACTION
26(a). How satisfied are you with the overall quality of your
telephone service?
4 Very Satisfied 3 Satisfied
2 Dissatisfied 1 Very Dissatisfied
(Ask Q 26(b) only if 1 OR 2 is coded)

________________________________________________________________________
TRAI (QoS) Customer Satisfaction Survey Report 2011 - 2012 – Delhi Circle
137
(Ask this question only if 1 OR 2 is coded in Q25(a))
26(b) Please specify the reason(s) for your dissatisfaction
1. _______________________________________
_______________________________________
2. _______________________________________
_______________________________________
3. _______________________________________
_______________________________________
H. GENERAL INFORMATION
27. What kind of other services are you also taking from this
service provider?
1 Broadband 2 Mobile
3 Others 4 None
28(a) Have you terminated a telephone connection that you
had in the last 6 month?
1 Yes 2 No
28(b) If Yes, Please name your service provider? 1 Airtel 2 BSNL 3 TATA Indicom
4 Rel Com 5 MTNL 6 HFCL
7 Shyam/MTS 8 MTNL
29. How many days were taken for termination of your
telephone connection?
1 1 day 2 2-3 days
3 4-7 days 4 more than 7 days
30. Are you aware that in case your fault was not repaired
within 3 days you are entitled for rent rebate?
1 Yes 2 No
31. Are you aware about the facility for registering your
telephone number with the service provider for not
receiving unwanted tele marketing calls/SMS?
1 Yes
2 No
32(a). Have you registered with your service provider for not
receiving any unwanted tele marketing calls/SMS?
1 Yes (If Yes, go to Q 32(b))
2 No
(Ask only if Yes in Q 32(a))
32(b). Is there a significant reduction in number of unwanted
tele marketing calls/SMS received even after
registering?
4 Stopped receiving 3 Considerable decrease
2 Slight decrease 1 No change
(Ask Q 32(b) only if 3 OR 2 OR 1 is coded)
(Ask only if 3 OR 2 OR 1 coded in Q 32 (b))
32.(c) Have you made any complaint to your service provider
on getting such unwanted tele marketing calls/ SMS
even after registering your telephone number?
1 Yes (If Yes, go to Q 32(c))
2 No

________________________________________________________________________
TRAI (QoS) Customer Satisfaction Survey Report 2011 - 2012 – Delhi Circle
138
(Ask only if Yes in Q32 (c))
32.(d) If Yes then ask
Please indicate whether -
1 Complaint was registered by the service
provider and informed about the action taken
2 Complaint was registered by the service
provider and did not inform about the action
taken
3 Service Provider refused to register the
complaint
4 Difficult to lodge the complaint
33. On a scale of 1 – 10 where 10 is very good and 1 is very
poor, how do you rate your service provider?
QUESTIONNAIRE FOR ASSESSMENT OF IMPLEMENTATION AND EFFECTIVENESS OF TELECOM CONSUMERS
PROTECTION AND REDRESSAL OF GRIEVANCES REGULATIONS, 2007
34(a). Are you aware of the call centre telephone number of
your telecom service provider for making complaints/
query?
1 Yes 2 No
34(b). Have you made any complaint within last 6 months to
the toll free Call Centre/customer care/Helpline
telephone number?
1 Yes 2 No (If No, go to
Q 40)
35. With respect to complaint made by you to the call centre,
please specify which of these was most applicable to
you? (Single Code)
1 Docket number received for most of the
complaints
2 No Docket number received for most of the
complaints
3 It was received on request
4 No docket number received even on request
36. Did the Call Centre inform you about the action taken on
your complaint?
1 Yes 2 No
37. Was your complaint resolved satisfactorily by call
centre/customer care within four weeks after lodging of
the complaint?
1 Yes 2 No
3 Not applicable
38. In case the complaint has not been resolved by the call
centre, you can contact the next level called as Nodal
Officer. Are you aware of the contact details of the
Nodal Officer?
1 Yes 2 No (If No, go to
Q 43)

________________________________________________________________________
TRAI (QoS) Customer Satisfaction Survey Report 2011 - 2012 – Delhi Circle
139
39(a). Have you ever made a complaint to the Nodal Officer
regarding your complaints not resolved or
unsatisfactorily resolved by the call center/customer
care?
1 Yes 2 No (If No, go to
Q 43)
39(b). Were you able to contact to the Nodal officer without
difficulty?
1 Yes 2 No
40. Did the Nodal Officer intimate you about the decision
taken on your complaint?
1 Yes 2 No
41. How satisfied are you with the redressal of the
complaint by the Nodal Officer?
4 Very Satisfied 3 Satisfied
2 Dissatisfied 1 Very Dissatisfied
(Ask Q 42 only if 1 OR 2 is coded)
(Ask this question only if 1 OR 2 is coded in Q41)
42. Please specify the reason(s) for your dissatisfaction.
(Multiple Code)
1 Difficult to connect to the Nodal Officer
2 Nodal Officer not polite/courteous
3 Nodal Officer not equipped with adequate
information
4 Time taken by Nodal Officer for redressal of
complaint is too long
5 Nodal Officer was unable to understand the
problem
6 Others (please
specify)________________________
43. In case the complaint has not been resolved by the
Nodal Officer or you are not satisfied with the decision
taken by the Nodal Officer, you can file an appeal to the
appellate authority of the service provider. Are you
aware of the contact details of the appellate authority
for filing of appeals?
1 Yes 2 No (If No, go to
Q 47)
44. Have you filed any appeal in last 6 months?
1 Yes
2 No (If No, go to Q 47)
45. Did you receive any acknowledgement? 1 Yes
2 No
46. Did the appellate authority take a decision upon your
appeal within 3 months of filing the appeal?
1 Yes
2 No
3 Appeal filed only recently
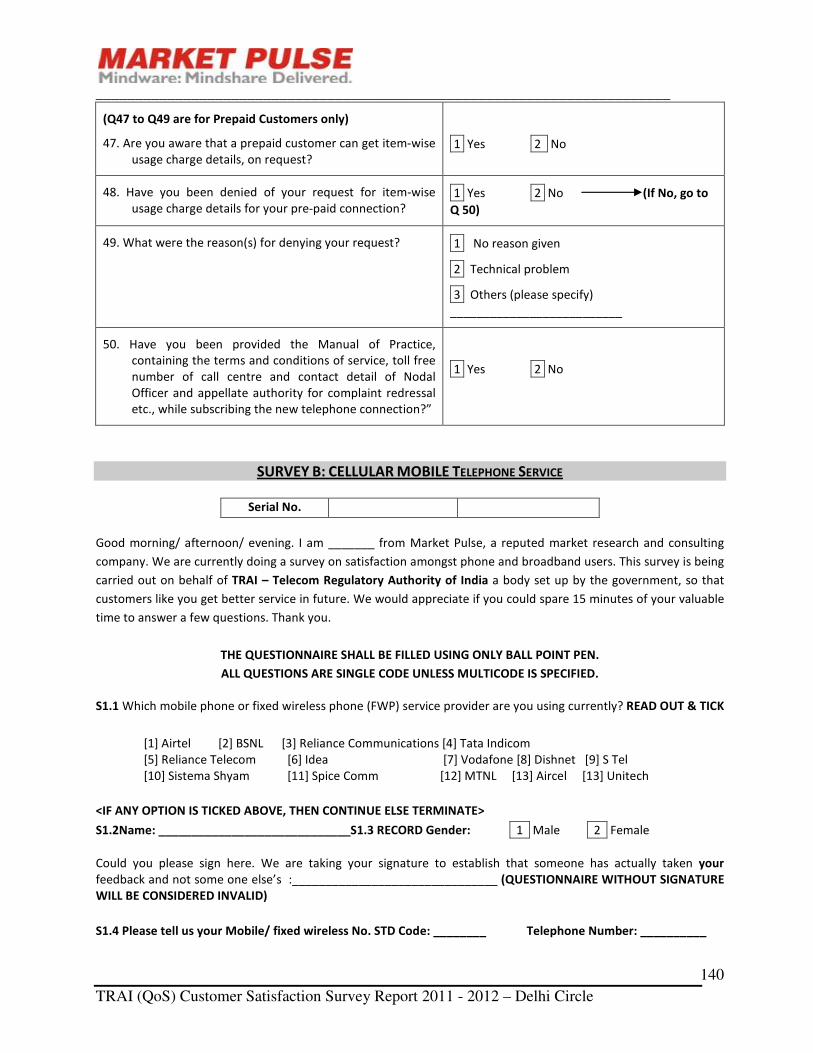
________________________________________________________________________
TRAI (QoS) Customer Satisfaction Survey Report 2011 - 2012 – Delhi Circle
140
(Q47 to Q49 are for Prepaid Customers only)
47. Are you aware that a prepaid customer can get item-wise
usage charge details, on request?
1 Yes 2 No
48. Have you been denied of your request for item-wise
usage charge details for your pre-paid connection?
1 Yes 2 No (If No, go to
Q 50)
49. What were the reason(s) for denying your request? 1 No reason given
2 Technical problem
3 Others (please specify)
__________________________
50. Have you been provided the Manual of Practice,
containing the terms and conditions of service, toll free
number of call centre and contact detail of Nodal
Officer and appellate authority for complaint redressal
etc., while subscribing the new telephone connection?”
1 Yes 2 No
SURVEY B: CELLULAR MOBILE TELEPHONE SERVICE
Good morning/ afternoon/ evening. I am _______ from Market Pulse, a reputed market research and consulting
company. We are currently doing a survey on satisfaction amongst phone and broadband users. This survey is being
carried out on behalf of TRAI – Telecom Regulatory Authority of India a body set up by the government, so that
customers like you get better service in future. We would appreciate if you could spare 15 minutes of your valuable
time to answer a few questions. Thank you.
THE QUESTIONNAIRE SHALL BE FILLED USING ONLY BALL POINT PEN.
ALL QUESTIONS ARE SINGLE CODE UNLESS MULTICODE IS SPECIFIED.
S1.1 Which mobile phone or fixed wireless phone (FWP) service provider are you using currently? READ OUT & TICK
[1] Airtel [2] BSNL [3] Reliance Communications [4] Tata Indicom
[5] Reliance Telecom [6] Idea [7] Vodafone [8] Dishnet [9] S Tel
[10] Sistema Shyam [11] Spice Comm [12] MTNL [13] Aircel [13] Unitech
<IF ANY OPTION IS TICKED ABOVE, THEN CONTINUE ELSE TERMINATE>
S1.2Name: _____________________________S1.3 RECORD Gender: 1 Male 2 Female
Could you please sign here. We are taking your signature to establish that someone has actually taken your
feedback and not some one else’s :_______________________________ (QUESTIONNAIRE WITHOUT SIGNATURE
WILL BE CONSIDERED INVALID)
S1.4 Please tell us your Mobile/ fixed wireless No. STD Code: ________ Telephone Number: __________
Serial No.

________________________________________________________________________
TRAI (QoS) Customer Satisfaction Survey Report 2011 - 2012 – Delhi Circle
141
S1.5. Age (in years): 1 Less than 25 2 25-34 3 35-44 4 More than 45
S1.6 Please tell us your Occupation: 1 Service 2 Business/self employed
3 Student 4 Housewife 5 Retired
S1.7. RECORD Usage Type: 1 Residential 2 Commercial
S1.8. RECORD Area: 1 Rural 2 Urban
S1.9. User Type: 1 Postpaid 2 Prepaid
S1.10. RECORD State: [1] Jammu & Kashmir [2] Himachal Pradesh [3] Rajasthan [4] Punjab
[5] Haryana [6] Delhi [7] Uttar Pradesh (East) [8] Uttar Pradesh(West)
S1.11. RECORD District______________________________ Address: _______________________________
S1.12. RECORD Name of SDCA: ____________________
S1.13. RECORD Name of Exchange: _________________
S1.14. RECORD Mode of Interview: 1 Telephonic 2 In-person
_____________________________________________________________________
QUESTIONNAIRE FOR CUSTOMER SATISFACTION SURVEY
A. SERVICE PROVISION
1. How satisfied are you with the process and time taken to
activate the mobile connection, after you applied and
completed all formalities?
4 Very Satisfied 3 Satisfied
2 Dissatisfied 1 Very Dissatisfied
2. Have you been informed in writing, at the time of
subscription of service or within a week of activation of
service the complete details of your tariff plan?
1 Yes 2 No
3. How satisfied are you with the ease of understanding or
with provision of all relevant information related to tariff
plans & charges?
4 Very Satisfied 3 Satisfied
2 Dissatisfied 1 Very Dissatisfied
B. BILLING RELATED – PREPAID CUSTOMER
4(a) How satisfied are you with the accuracy of charges for the
services used such as call, SMS, GPRS etc.?
4 Very Satisfied 3 Satisfied
2 Dissatisfied 1 Very Dissatisfied
4(b). Please specify the reason(s) for your dissatisfaction.
(Multiple Code)
1 Charges not as per tariff plan subscribed
2 Tariff plan changed without information
3 Charged for value added services not
subscribed
4 Charged for calls/services not made/used
5 Others (please specify)
____________________

________________________________________________________________________
TRAI (QoS) Customer Satisfaction Survey Report 2011 - 2012 – Delhi Circle
142
5(a). Have you made any complaint related to charging/credit/
waiver/ validity/ adjustments in the last 6 months?
1 Yes 2 No
(If Yes go to 5(b))
5(b).ASK IF YES IN Q.5a. How satisfied are you with the
resolution of the complaints and the resulting refund/
credit/ waiver of excess charges on account of such
resolution of complaints?
4 Very Satisfied 3 Satisfied
2 Dissatisfied 1 Very Dissatisfied
5(c). How satisfied are you with the ease of recharging process
and the transparency of recharge offer?
4 Very Satisfied 3 Satisfied
2 Dissatisfied 1 Very Dissatisfied
(Ask Q 5(d) only if 1 OR 2 is coded)
5(d) Please specify the reason(s) for your dissatisfaction.
(Multiple Code)
1 Lack of complete information about the
offer
2 Charges/Services not as per the offer
3 Delay in activation of recharge
4 Non availability of all denomination
recharge coupons
5 Others (please
specify)_____________________
5(e) Did you get information regarding call duration, amount
deducted for call and balance in the account after every
call?
1 Yes 2 No
C. BILLING RELATED – POSTPAID CUSTOMER
6. How satisfied are you with the time taken to deliver your
bills?
4 Very Satisfied 3 Satisfied
2 Dissatisfied 1 Very Dissatisfied
7(a). How satisfied are you with the clarity of the bills
issued by your service provider in terms of
transparency and understandability?
4 Very Satisfied 3 Satisfied
2 Dissatisfied 1 Very Dissatisfied
(Ask this question only if 1 OR 2 is coded in Q7(a))
7(b) Please specify the reason(s) for your dissatisfaction.
(Multiple Code)
1 Difficult to read the bill
2 Difficult to understand the language
3 Calculations not clear
4 Item-wise charges like total minutes of usage of
local, STD, ISD calls and charges thereon not given
5 Others (please specify)
__________________________

________________________________________________________________________
TRAI (QoS) Customer Satisfaction Survey Report 2011 - 2012 – Delhi Circle
143
8(a). How satisfied are you with the accuracy &
completeness of the bills?
4 Very Satisfied 3 Satisfied
2 Dissatisfied 1 Very Dissatisfied
(Ask this question only if 1 OR 2 is coded in Q8(a))
8(b). Please specify the reason(s) for your dissatisfaction.
(Multiple Code)
1 Charges not as per tariff plan subscribed
2 Tariff plan changed without information
3 Charged for value added services not subscribed
4 Charged for calls/services not made/used
5 Calculations are not clear
6 Others (please specify) ____________________
9(a). Have you made any billing related complaints in the
last 6 months?
1 Ye s 2 No (If No, go to Q
10)
9(b). How satisfied are you with the process of resolution of
billing complaints?
4 Very Satisfied 3 Satisfied
2 Dissatisfied 1 Very Dissatisfied
D. HELP SERVICES/CUSTOMER CARE INCLUDING CUSTOMER GRIEVANCE REDRESSAL
10. In the last 6 months, have you contacted customer care/
helpline/ call centre of your service provider?
1 Yes 2 No (If No, go
to Q 16)
11. How satisfied are you with the ease of access of call
centre/customer care or helpline?
4 Very Satisfied 3 Satisfied
2 Dissatisfied 1 Very Dissatisfied
12. How satisfied are you with the ease of getting an option
for ”talking to a customer care executive”?
4 Very Satisfied 3 Satisfied
2 Dissatisfied 1 Very Dissatisfied
13. How satisfied are you with the response time taken to
answer your call by a customer care executive?
4 Very Satisfied 3 Satisfied
2 Dissatisfied 1 Very Dissatisfied
14. How satisfied are you with the problem solving ability of
the customer care executive(s)?
4 Very Satisfied 3 Satisfied
2 Dissatisfied 1 Very Dissatisfied
15. How satisfied are you with the time taken by call
centre/customer care /helpline to resolve your
complaint?
4 Very Satisfied 3 Satisfied
2 Dissatisfied 1 Very Dissatisfied
E. NETWORK PERFORMANCE, RELIABILITY AND AVAILABILITY
16. How satisfied are you with the availability of signal of your
service provider in your locality?
4 Very Satisfied 3 Satisfied
2 Dissatisfied 1 Very Dissatisfied

________________________________________________________________________
TRAI (QoS) Customer Satisfaction Survey Report 2011 - 2012 – Delhi Circle
144
17. How satisfied are you with the ability to make or receive
calls easily?
4 Very Satisfied 3 Satisfied
2 Dissatisfied 1 Very Dissatisfied
18. How often does your call drops during conversation? 1 Never 3 Occasionally
2 Frequently 1 Very Frequently
19. How satisfied are you with the voice quality? 4 Very Satisfied 3 Satisfied
2 Dissatisfied 1 Very Dissatisfied
F. MAINTAINABILITY
20. How often do you face signal problems? 4 Never 3 Occasionally
2 Frequently 1 Very Frequently
21. How satisfied are you with the availability of signal in your
area?
4 Very Satisfied 3 Satisfied
2 Dissatisfied 1 Very Dissatisfied
22. How satisfied are you with the restoration of network
(signal) problems?
4 Very Satisfied 3 Satisfied
2 Dissatisfied 1 Very Dissatisfied
G. SUPPLEMENTARY SERVICES AND VALUE ADDED SERVICES
23. Have you subscribed to any supplementary services like
call forwarding, call diverting and value added services like
ring tone, alerts, GPRS, e-mail, voice mail or any other such
services, in the last 6 months?
1 Yes 2 No (If No, go to Q
24)
24. How satisfied are you with the quality of the
supplementary / value added services provided?
4 Very Satisfied 3 Satisfied
2 Dissatisfied 1 Very Dissatisfied
25(a) How satisfied are you with the process of activating value
added services or the process of unsubscribing?
4 Very Satisfied 3 Satisfied
2 Dissatisfied 1 Very Dissatisfied
25(b) Please tell me the reasons for your dissatisfaction. 1 Not informed of charges
2 Activated without consent
3 Not informed about toll free number for
unsubscribing
4 If any other reasons, please specify

________________________________________________________________________
TRAI (QoS) Customer Satisfaction Survey Report 2011 - 2012 – Delhi Circle
145
26. In last 6 months have you faced the problem of
unauthorized activation of VAS by your service provider?
1 Yes
2 No
27. ASK IF YES IN Q26.
Have you complained to your service provider for
deactivation of such services and refund of charges levied?
1 Yes
2 No
28(a). What difficulties have you faced while deactivating of
such services and refund of charges levied?
1 None
2 Delay in deactivation resulting in repeat
complaints
3 Customer care refused to register the
complaint
4 Not aware of whom to contact
5 Others please specify ____________
28(b).How satisfied are you with the resolution of your
complaint for deactivation of VAS & refund of charges
levied?
4 Very Satisfied 3 Satisfied
2 Dissatisfied 1 Very Dissatisfied
G. OVERALL CUSTOMER SATISFACTION
29(a).How satisfied are you with the overall quality of your
mobile service?
4 Very Satisfied 3 Satisfied
2 Dissatisfied 1 Very Dissatisfied
(Ask this question only if 1 OR 2 is coded in Q29(a))
29(b) Please specify the reason(s) for your dissatisfaction
1.
____________________________________
_____________________________________
2.
____________________________________
_____________________________________
3.
____________________________________
_____________________________________
H. GENERAL INFORMATION
30. What kind of other telecom services are you using? 1 Broadband 2 Wire line
3 Others 4 None

________________________________________________________________________
TRAI (QoS) Customer Satisfaction Survey Report 2011 - 2012 – Delhi Circle
146
31. Are you aware about the facility for registering your mobile
number with the service provider for not receiving
unwanted tele marketing calls/SMS?
1 Yes
2 No
32. Have you registered with your service provider for not
receiving any unwanted tele marketing calls/SMS?
1 Yes (If Yes, go to Q 33(a))
2 No
(Ask only if Yes in Q 32)
33(a). Is there a significant reduction in number of unwanted tele
marketing calls/SMS received even after registering?
4 Stopped receiving 3 Considerable
decrease
2 Slight decrease 1 No change
(Ask Q 33(b) only if 3 OR 2 OR 1 is coded)
(Ask only if 3 OR 2 OR 1 coded in Q 33 (a))
33.(b) Have you made any complaint to your service provider on
getting such unwanted tele marketing calls/ SMS even after
registering your mobile number?
1 Yes (If Yes, go to Q 33(c))
2 No
(Ask only if Yes in Q33 (b))
33.(c) If Yes, please indicate the following -
1 Complaint was registered by the service
provider and informed about the action
taken
2 Complaint was registered by the service
provider and did not inform about the
action taken
3 Service Provider refused to register the
complaint
4 Difficult to lodge the complaint
34(a). Are you aware of facility by which you can change your
service provider without changing your mobile number?
1 Yes 2 No (If No, go
to Q35)
34(b). Have you utilized SMS based mechanism for getting
unique porting code?
1 Yes 2 No
34(c) If yes, when did you get ‘Unique Porting Code’ from your
existing service provider?
1 Within 5 miuntes
2 After 5 to 10 miuntes
3 After 10 miuntes
4 Never
34 (d) If you have utilized the service of MNP, are you satisfied
with its entire process?
4 Very Satisfied 3 Satisfied
2 Dissatisfied 1 Very Dissatisfied

________________________________________________________________________
TRAI (QoS) Customer Satisfaction Survey Report 2011 - 2012 – Delhi Circle
147
35. On a scale of 1 – 10 where 10 is very good and 1 is very poor,
how do you rate your service provider?
QUESTIONNAIRE FOR ASSESSMENT OF IMPLEMENTATION AND EFFECTIVENESS OF TELECOM CONSUMERS
PROTECTION AND REDRESSAL OF GRIEVANCES REGULATIONS, 2007
36. Are you aware of the call centre telephone number of your
telecom service provider for making complaints? 1 Yes
2 No
37. Have you made any complaint within last 6 months to the
toll free Call Centre/customer care/Helpline telephone
number?
1 Yes 2 No (If No, go to
Q 41)
38. With respect to complaint made by you to the call centre,
please specify which of these was most applicable to you?
(Single Code)
1 Complaint was registered and Docket
number received
2 Complaint was registered and Docket
number not received
3 Complaint was registered and docket
number provided on request
4 Complaint was registered and docket
number not provided even on request
5 Refused to register the complaint
39. Did the Call Centre inform you about the action taken on
your complaint? 1 Yes
2 No
40. Was your billing/charging complaint resolved satisfactorily
by call centre/customer care within four weeks after
lodging of the complaint?
1 Yes
2 No
3 Not applicable
41. In case the complaint has not been resolved by the call
centre, you can contact the next level called as Nodal
Officer. Are you aware of the contact detail of the Nodal
Officer?
1 Yes
2 No (If No, go to Q 46)
42(a). Have you ever made a complaint to the Nodal Officer
regarding your complaints not resolved or unsatisfactorily
resolved by the call center/customer care?
1 Yes 2 No (If No, go
to Q 46)
42(b). Were you able to connect to the Nodal officer without
any diffculty? 1 Yes 2 No
43. Did the Nodal Officer intimate you about the decision
taken on your complaint? 1 Yes
2 No
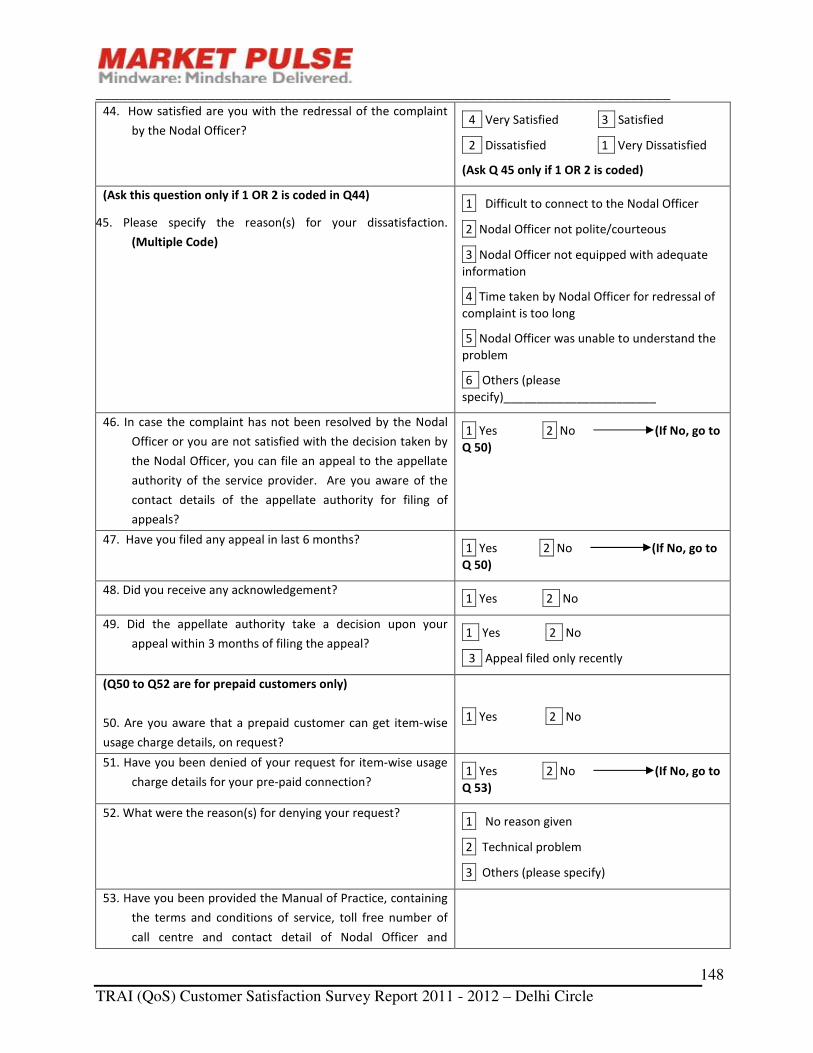
________________________________________________________________________
TRAI (QoS) Customer Satisfaction Survey Report 2011 - 2012 – Delhi Circle
148
44. How satisfied are you with the redressal of the complaint
by the Nodal Officer? 4 Very Satisfied 3 Satisfied
2 Dissatisfied 1 Very Dissatisfied
(Ask Q 45 only if 1 OR 2 is coded)
(Ask this question only if 1 OR 2 is coded in Q44)
45. Please specify the reason(s) for your dissatisfaction.
(Multiple Code)
1 Difficult to connect to the Nodal Officer
2 Nodal Officer not polite/courteous
3 Nodal Officer not equipped with adequate
information
4 Time taken by Nodal Officer for redressal of
complaint is too long
5 Nodal Officer was unable to understand the
problem
6 Others (please
specify)_______________________
46. In case the complaint has not been resolved by the Nodal
Officer or you are not satisfied with the decision taken by
the Nodal Officer, you can file an appeal to the appellate
authority of the service provider. Are you aware of the
contact details of the appellate authority for filing of
appeals?
1 Yes 2 No (If No, go to
Q 50)
47. Have you filed any appeal in last 6 months?
1 Yes 2 No (If No, go to
Q 50)
48. Did you receive any acknowledgement? 1 Yes 2 No
49. Did the appellate authority take a decision upon your
appeal within 3 months of filing the appeal? 1 Yes 2 No
3 Appeal filed only recently
(Q50 to Q52 are for prepaid customers only)
50. Are you aware that a prepaid customer can get item-wise
usage charge details, on request?
1 Yes 2 No
51. Have you been denied of your request for item-wise usage
charge details for your pre-paid connection? 1 Yes 2 No (If No, go to
Q 53)
52. What were the reason(s) for denying your request? 1 No reason given
2 Technical problem
3 Others (please specify)
53. Have you been provided the Manual of Practice, containing
the terms and conditions of service, toll free number of
call centre and contact detail of Nodal Officer and

________________________________________________________________________
TRAI (QoS) Customer Satisfaction Survey Report 2011 - 2012 – Delhi Circle
149
appellate authority for complaint redressal etc., while
subscribing the new mobile telephone connection?”
1 Yes 2 No
SURVEY C: BROADBAND SERVICE
Good morning/ afternoon/ evening. I am _______ from Market Pulse, a reputed market research and consulting
company. We are currently doing a survey on satisfaction amongst phone and broadband users. This survey is being
carried out on behalf of TRAI – Telecom Regulatory Authority of India a body set up by the government, so that
customers like you get better service in future. We would appreciate if you could spare 15 minutes of your valuable
time to answer a few questions. Thank you.
THE QUESTIONNAIRE SHALL BE FILLED USING ONLY BALL POINT PEN.
ALL QUESTIONS ARE SINGLE CODE UNLESS MULTICODE IS SPECIFIED.
S1.1 Which broadband service provider are you using currently? READ OUT & TICK
[1] BSNL [2] Tata Comm/VSNL [3] Airtel [4] Reliance [5] Sify
[6] Hathway [7] Shyam Telelink [8] You Telecom [9] Spectranet [10] HFCL
<IF ANY OPTION IS TICKED ABOVE, THEN CONTINUE ELSE TERMINATE>
S1.2 Name: _______________________________ S1.3 RECORD Gender: 1 Male 2 Female
Could you please sign here. We are taking your signature to establish that someone has actually taken your
feedback and not some one else’s :_______________________________ (QUESTIONNAIRE WITHOUT SIGNATURE
WILL BE CONSIDERED INVALID)
S1.4 Tel: AgeS1.5. Age (in years): 1 Less than 25 2 25-60 3 More than 60
S1.6. RECORD Usage Type: 1 Residential 2 Commercial
S1.7. RECORD
Area: 1 Rural 2 Urban
S1.8. User Type: 1 Postpaid 2 Prepaid
S1.9 E-mail
_______________________________________________
S1.10 User Type: 1 Prepaid 2 Postpaid
S1.11. RECORD State: [1] Jammu & Kashmir [2] Himachal Pradesh [3] Rajasthan [4] Punjab
[5] Haryana [6] Delhi [7] Uttar Pradesh (East) [8] Uttar Pradesh(West)
S1.12. RECORD District______________________________
S1.13. RECORD Name of SDCA: _________________S1.14. RECORD Name of Exchange: __________
S1.15 RECORD Name of POP: __________________________
S1.16 RECORD Mode of interview: 1 Telephonic 2 In-person 3 E-mail 4 Web/Online
Serial No.
STD Code Telephone Number
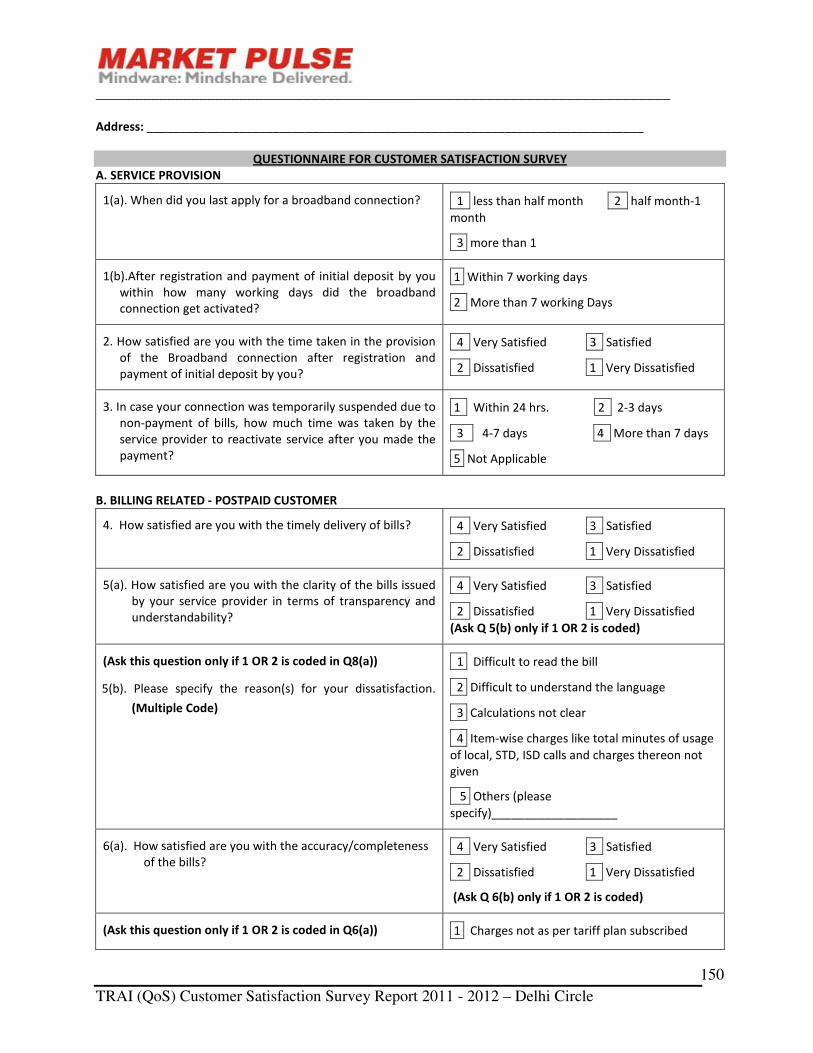
________________________________________________________________________
TRAI (QoS) Customer Satisfaction Survey Report 2011 - 2012 – Delhi Circle
150
Address: ___________________________________________________________________________
QUESTIONNAIRE FOR CUSTOMER SATISFACTION SURVEY
A. SERVICE PROVISION
1(a). When did you last apply for a broadband connection? 1 less than half month 2 half month-1
month
3 more than 1
1(b).After registration and payment of initial deposit by you
within how many working days did the broadband
connection get activated?
1 Within 7 working days
2 More than 7 working Days
2. How satisfied are you with the time taken in the provision
of the Broadband connection after registration and
payment of initial deposit by you?
4 Very Satisfied 3 Satisfied
2 Dissatisfied 1 Very Dissatisfied
3. In case your connection was temporarily suspended due to
non-payment of bills, how much time was taken by the
service provider to reactivate service after you made the
payment?
1 Within 24 hrs. 2 2-3 days
3 4-7 days 4 More than 7 days
5 Not Applicable
B. BILLING RELATED - POSTPAID CUSTOMER
4. How satisfied are you with the timely delivery of bills? 4 Very Satisfied 3 Satisfied
2 Dissatisfied 1 Very Dissatisfied
5(a). How satisfied are you with the clarity of the bills issued
by your service provider in terms of transparency and
understandability?
4 Very Satisfied 3 Satisfied
2 Dissatisfied 1 Very Dissatisfied
(Ask Q 5(b) only if 1 OR 2 is coded)
(Ask this question only if 1 OR 2 is coded in Q8(a))
5(b). Please specify the reason(s) for your dissatisfaction.
(Multiple Code)
1 Difficult to read the bill
2 Difficult to understand the language
3 Calculations not clear
4 Item-wise charges like total minutes of usage
of local, STD, ISD calls and charges thereon not
given
5 Others (please
specify)___________________
6(a). How satisfied are you with the accuracy/completeness
of the bills?
4 Very Satisfied 3 Satisfied
2 Dissatisfied 1 Very Dissatisfied
(Ask Q 6(b) only if 1 OR 2 is coded)
(Ask this question only if 1 OR 2 is coded in Q6(a)) 1 Charges not as per tariff plan subscribed

________________________________________________________________________
TRAI (QoS) Customer Satisfaction Survey Report 2011 - 2012 – Delhi Circle
151
6(b) Please specify the reason(s) for your dissatisfaction.
(Multiple Code)
2 Tariff plan changed without information
3 Charged for value added services not
requested
4 Charged for calls/services not made/used
5 Others (please specify)
______________________
7. Have you made any billing related complaints in last 6
months?
1 Yes
2 No (If No, go to Q 9(a))
8. How satisfied are you with the process of resolution of
complaints and refund/credit/waiver of excess charges on
account of such resolution of complaints?
4 Very Satisfied 3 Satisfied
2 Dissatisfied 1 Very Dissatisfied
C. BILLING RELATED - FOR PREPAID CUSTOMER ONLY
9(a). How satisfied are you with the accuracy of charges i.e.
amount deducted on every usage?
4 Very Satisfied 3 Satisfied
2 Dissatisfied 1 Very Dissatisfied
(Ask Q 9(b) only if 1 OR 2 is coded)
(Ask this question only if 1 OR 2 is coded in Q9(a))
9(b) Please specify the reason(s) for your dissatisfaction
1 charges not as per tariff plan subscribed
2 tariff plan changed without information
3 charged for value added services not
requested
4 charged for calls/services not made/used
5 Others (please specify)
_____________________
9(c).Have you made any complaints related to
charging/credit/waiver/validity/adjustments in last 6
months?
1 Yes
2 No
9 (d). How satisfied are you with the process of resolution of
complaints and refund/credit/waiver of excess charges on
account of such resolution of complaints?
4 Very Satisfied 3 Satisfied
2 Dissatisfied 1 Very Dissatisfied
D. HELP SERVICE
10. In the last 6 months, have you contacted customer
care/helpline/call centre of your service provider?
1 Yes
2 No (If No, go to Q 15)
11(a). How satisfied are you with the ease of access of
customer care or helpline?
4 Very Satisfied 3 Satisfied
2 Dissatisfied 1 Very Dissatisfied

________________________________________________________________________
TRAI (QoS) Customer Satisfaction Survey Report 2011 - 2012 – Delhi Circle
152
11(b). How satisfied are you with the ease of getting an
option for “talking to a customer care executive”?
4 Very Satisfied 3 Satisfied
2 Dissatisfied 1 Very Dissatisfied
12. How satisfied are you with the response time taken to
answer your call by a customer care executive?
4 Very Satisfied 3 Satisfied
2 Dissatisfied 1 Very Dissatisfied
13. How satisfied are you with the problem solving ability of
the customer care executive(s)?
4 Very Satisfied 3 Satisfied
2 Dissatisfied 1 Very Dissatisfied
14. How satisfied are you with the time taken by call
centre/customer care /helpdesk to resolve your
complaint?
4 Very Satisfied 3 Satisfied
2 Dissatisfied 1 Very Dissatisfied
E. NETWORK PERFORMANCE, RELIABILITY AND AVAILABILITY
15. How satisfied are you with the speed of Broadband
connection?
4 Very Satisfied 3 Satisfied
2 Dissatisfied 1 Very Dissatisfied
16. How satisfied are you with the amount of time for which
service is up and working?
4 Very Satisfied 3 Satisfied
2 Dissatisfied 1 Very Dissatisfied
F. MAINTAINABILITY
17. How often do you face a problem with your Broadband
connection?
1 Never 2 Occasionally
3 Frequently 4 Very Frequently
(Ask if response to Q17 is Frequently/Very Frequently)
18. What was the broadband connection problem faced by
you in last 6 months related to, please specify?
1 Problem was related to my computer
hardware/ software
2 Problem was related to the broadband
connection and modem provided by the service
provider.
19. How satisfied are you with the time taken for restoration
of Broadband connection?
4 Very Satisfied 3 Satisfied
2 Dissatisfied 1 Very Dissatisfied
G. SUPPLEMENTARY SERVICES
20(a) .Do you use any value added services or supplementary
services such as static/ fixed IP addresses, e-mail IDs etc.
1 Yes
2 No (If No, go to Q 23(a)
20(b) How satisfied are you with the process of activating
value added services or the process of unsubscribing?
4 Very Satisfied 3 Satisfied
2 Dissatisfied 1 Very Dissatisfied
20(c) Please tell me the reasons for your dissatisfaction. 1 Not informed of charges

________________________________________________________________________
TRAI (QoS) Customer Satisfaction Survey Report 2011 - 2012 – Delhi Circle
153
2 Activated without consent
3 Not informed about toll free number for
unsubscribing
4 If any other reasons, please specify
21(a). In last 6 months have you faced the problem of
unauthorized activation of VAS by your service
provider?( such as static/fixed IP addresses, email-ids,
antivirus packages, etc)
1 Yes
2 No (If No, go to Q 23(a)
21(b). ASK IF YES IN Q26. Have you complained to your
service provider for deactivation of such services and
refund of charges levied?
1 Yes
2 No (If No, go to Q 23(a)
21(c). What difficulties you have faced while deactivating of
such services and refund of charges levied?
1 None
2 Delay in deactivation resulting in repeat
complaints
3 Customer care refused to register the
complaint
4 Not aware of whom to be contacted
5 Others please specify ____________
22.How satisfied are you with the resolution of your
complaint for deactivation of VAS & refund of charges
levied?
4 Very Satisfied 3 Satisfied
2 Dissatisfied 1 Very Dissatisfied
G. OVERALL CUSTOMER SATISFACTION
23(a). How satisfied are you with the overall quality of your
Broadband service? 4 Very Satisfied 3 Satisfied
2 Dissatisfied 1 Very Dissatisfied
(Ask this question only if 1 OR 2 is coded in Q22(a))
23(b) Please specify the reason(s) for your dissatisfaction
1. _______________________________________
_______________________________________
2. _______________________________________
_______________________________________
3. _______________________________________
_______________________________________
H. GENERAL
24. How many persons in your house are using this
Broadband connection?
------------
24(a). What kind of other telecom services are you also
taking from your service provider? 1 Mobile
2 Wireline
3 Others

________________________________________________________________________
TRAI (QoS) Customer Satisfaction Survey Report 2011 - 2012 – Delhi Circle
154
4 None
25. Are you aware of the facility for measuring the
broadband connection speed provided by your service
provider?
1 Yes
2 No
26. On a scale of 1-10 where 10 is very good and 1 is very
poor, how do you rate your service provider?
------------
27. Are you aware of the call centre telephone number of
your telecom service provider for making complaints/
query?
1 Yes
2 No (If No, go to Q 31)
28. Have you made any complaint within last 6 months to the
toll free Call Centre/customer care/Helpline telephone
number?
1 Yes
2 No (If No, go to Q 34(a))
29. With respect to complaint made by you to the call centre,
please specify which of these was most applicable to
you? (Single Code)
1 Docket number received for most of the
complaints
2 No Docket number received for most of
the complaints
3 It was received on request
4 No docket number received even on
request
30. Did the Call Centre inform you about the action taken on
your complaint? 1 Yes 2 No
31. How satisfied are you with the system of resolving of
your complaints by call centre/customer care/ helpline? 4 Very Satisfied 3 Satisfied
2 Dissatisfied 1 Very Dissatisfied
(Ask Q 32 only if 1 OR 2 is coded)
(Ask this question only if 1 OR 2 is coded in Q 28)
32. Please specify the reason(s) for your dissatisfaction.
(multiple code)
1 Difficult to connect to the call centre
executive
2 Customer care executive not
polite/courteous
3 Customer care executive not equipped
with adequate information
4 Time taken by call centre for redressal of
complaint is too long
5 Customer care executive was unable to
understand the problem
QUESTIONNAIRE FOR ASSESSMENT OF IMPLEMENTATION AND EFFECTIVENESS OF TELECOM CONSUMERS
PROTECTION AND REDRESSAL OF GRIEVANCES REGULATIONS, 2007

________________________________________________________________________
TRAI (QoS) Customer Satisfaction Survey Report 2011 - 2012 – Delhi Circle
155
6 Others (please specify)
__________________________
33. Was your billing/charging complaint resolved
satisfactorily by call centre/customer care within four
weeks after lodging of the complaint?
1 Yes 2 No
3 Not applicable
34(a). In case the complaint has not been resolved by the
call centre, you can contact the next level called as
Nodal Officer. Are you aware of the contact detail of
the Nodal Officer?
1 Yes
2 No (If No, go to
Q37)
34(b). Have you ever made a complaint to the Nodal Officer
regarding your complaints not resolved or
unsatisfactorily resolved by the call center/customer
care?
1 Yes
2 No (If No, go to Q
37)
34(c). Were you able to connect to the nodal officer without
any difficulty? 1 Yes
2 No
35. Did the Nodal Officer intimate you about the decision
taken on your complaint? 1 Yes 2 No
36(a). How satisfied are you with the redressal of the
complaint by the Nodal Officer? 4 Very Satisfied 3 Satisfied
2 Dissatisfied 1 Very Dissatisfied
(Ask Q 36(b) only if 1 OR 2 is coded)
(Ask this question only if 1 OR 2 is coded in Q36(a))
36(b). Please specify the reason(s) for your dissatisfaction.
(Multiple Code)
1 Difficult to connect to the Nodal Officer
2 Nodal Officer not polite/courteous
3 Nodal Officer not equipped with adequate
information
4 time taken by Nodal Officer for redressal of
complaint is too long
5 Nodal Officer was unable to understand the
problem
6 Others (please specify)
__________________________
37. In case the complaint has not been resolved by the Nodal
Officer or you are not satisfied with the decision taken
by the Nodal Officer, you can file an appeal to the
appellate authority of the service provider. Are you
aware of the contact details of the appellate authority
for filing of appeals?
1 Yes
2 No (if no go to Q
41)
38. Have you filed any appeal in last 6 month?
1 Yes
2 No (if no go to Q 41)

________________________________________________________________________
TRAI (QoS) Customer Satisfaction Survey Report 2011 - 2012 – Delhi Circle
156
39. Did you receive any acknowledgement? 1 Yes 2 No
40. Did the appellate authority take a decision upon your
appeal within 3 months of filing the appeal? 1 Yes 2 No
3 Appeal filed only recently
(Q41 to Q43 are for prepaid customers only)
41. Are you aware that a prepaid customer can get item-wise
usage charge details, on request?
1 Yes 2 No
42. Have you been denied of your request for item-wise
usage charge details for your pre-paid connection? 1 Yes
2 No (if no go to Q 44)
43. What were the reason(s) for denying your request? 1 No reason given
2 technical problem
3 Others (please specify)
__________________________
44. Have you been provided the Manual of Practice,
containing the terms and conditions of service, toll free
number of call centre and contact detail of Nodal
Officer and appellate authority for complaint redressal
etc., while subscribing the new Broadband
connection?”
1 Yes 2 No
THANKS
Name of the interviewer: __________________ Date: __________________
Name of the scrutinizer: __________________ Date: __________________
Back-check done by: __________________ Date of back-check: __________________
Name of field officer: __________________