telecom italia group · s.p.a. business or acquisition strategy or planned capital expenditures or...
TRANSCRIPT

0
TELECOM ITALIA GROUP
Telecom Italia Group
Investor Meetings – Paris, July 3-4 2012
Franco Bernabè – Chairman and Group CEO

1
TELECOM ITALIA GROUP
Safe Harbour
These presentations contain statements that constitute forward-looking statements within the meaning of the Private Securities Litigation Reform Act of 1995. These statements appear in a number of places in this presentation and include statements regarding the intent, belief or current expectations of the customer base, estimates regarding future growth in the different business lines and the global business, market share, financial results and other aspects of the activities and situation relating to the Company and the Group. Such forward looking statements are not guarantees of future performance and involve risks and uncertainties, and actual results may differ materially from those projected or implied in the forward looking statements as a result of various factors. Consequently, Telecom Italia S.p.A. makes no representation, whether expressed or implied, as to the conformity of the actual results with those projected in the forward looking statement.Forward-looking information is based on certain key assumptions which we believe to be reasonable as of the date hereof, but forward looking information by its nature involves risks and uncertainties, which are outside our control, and could significantly affect expected results.Analysts are cautioned not to place undue reliance on those forward looking statements, which speak only as of the date of this presentation. Telecom Italia S.p.A. undertakes no obligation to release publicly the results of any revisions to these forward looking statements which may be made to reflect events and circumstances after the date of this presentation, including, without limitation, changes in Telecom Italia S.p.A. business or acquisition strategy or planned capital expenditures or to reflect the occurrence of unanticipated events. Analysts and investors are encouraged to consult the Company's Annual Report on Form 20-F as well as periodic filings made on Form 6-K, which are on file with the United States Securities and Exchange Commission.

2
TELECOM ITALIA GROUP
Agenda
Telecom Italia Group Overview
1Q12 Results
Focus on UBB
Financial Position and Group Targets
Sustainability at TI

3
TELECOM ITALIA GROUP
* Revenues based on net contributions
Euro mln, Organic Data
TI Group
FY 11 Δ% yoy FY 11 Δ% yoy
Brazil
FY 11 Δ% yoy
Argentina
FY 11 Δ% yoy
Revenues* 35%29,958 +2.7% 7,343 +18.2% 3,220 +26.5%19,033 -4.8%
EBITDA-CAPEX 7,467 -0.4% 708 +20.7% 479 +23.3 %6,374 -3.7%
85%
Domestic
EBITDA 25%12,339 Flat 1,998 +10.7% 1,035 +24.1%9,351 -3.9%
Cash Generation
for the Group
Engine of Growth
for the Group
Weight in TI Group
FY2011 Group Key Figures
4
TELECOM ITALIA GROUP
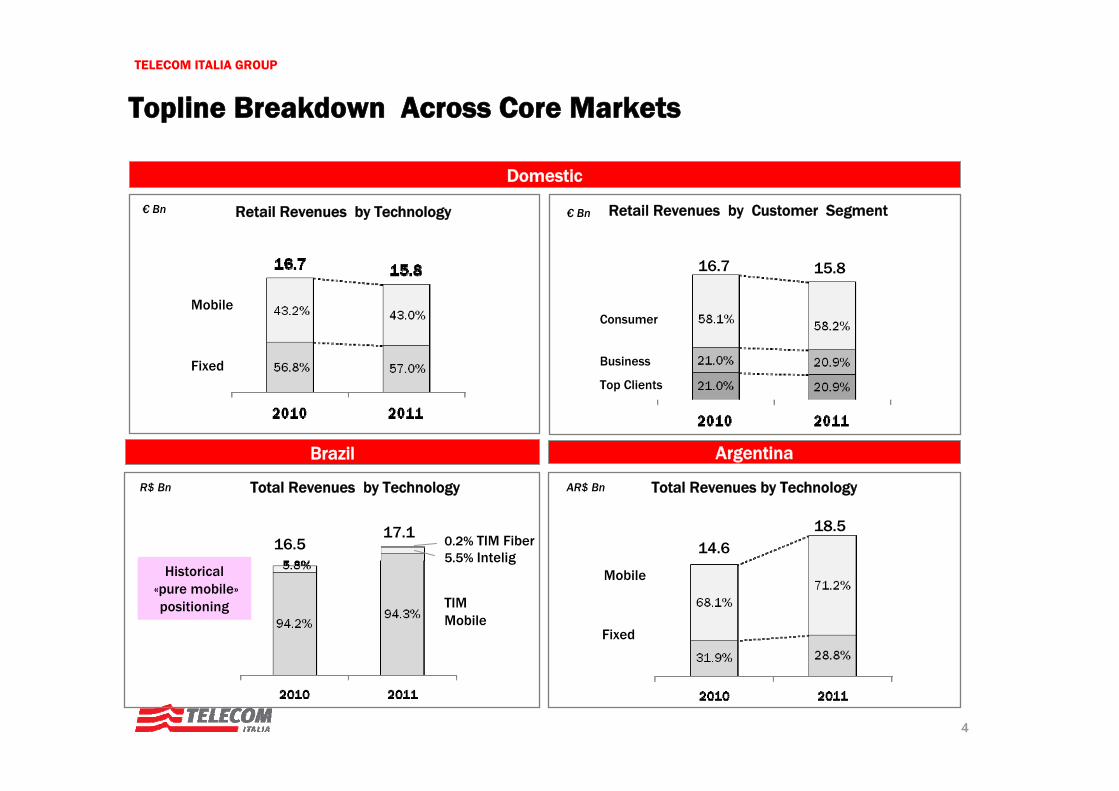
Topline Breakdown Across Core Markets
Brazil Argentina
Domestic
€ Bn
Fixed
Mobile
16.7 15.8
Consumer
Business
Top Clients
Retail Revenues by Customer Segment
18.514.6
Mobile
Fixed
AR$ Bn Total Revenues by Technology
17.116.5
TIM Mobile
0.2% TIM Fiber5.5% Intelig
Total Revenues by Technology R$ Bn
Historical«pure mobile»positioning
Retail Revenues by Technology € Bn

5
TELECOM ITALIA GROUP
TI’s Domestic Market: the Growing Importance of Innovation
FixedDomestic Retail Revenues
Mobile
16.715.8
€bn
Innovative
Traditional
€bn
Innovative
Traditional
7.4Innovative
Traditional
€bn
• Broadband• Web Contents• ICT (products
and services)
• Mobile browsing (Large & Small Screen)
• Contents (premium services, donwloads, games, ringtones, Infotainment)
6
TELECOM ITALIA GROUP
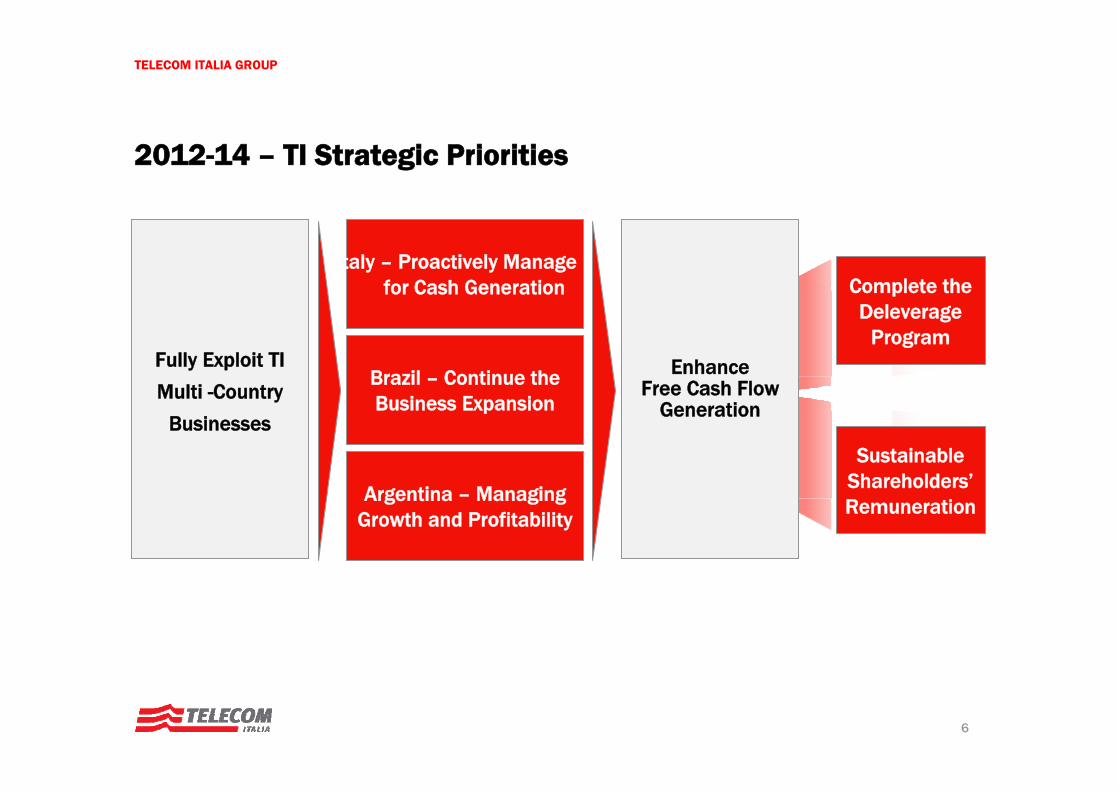
Fully Exploit TI
Multi -Country
Businesses
Brazil – Continue the Business Expansion
Argentina – Managing Growth and Profitability
Italy – Proactively Manage for Cash Generation
Enhance Free Cash Flow
Generation
Sustainable Shareholders’Remuneration
Complete the Deleverage
Program
2012-14 – TI Strategic Priorities

7
TELECOM ITALIA GROUP
** excluding Latam spectrum licences
TI Group – FY 2012 Key Guidance
Revenues
Ebitda
Capexcum ’12-’14
NFP Adj.**
NFP Adj. 2012-’14
Stable
Broadly Stable
>15 € bln
∼ 27.5 € bln
FY 2012: ∼ 27.5 € bln
FY 2013: ∼ 25 € bln
From FY 2014: < 2x Net Debt/Ebitda***
Organic Data*
TI Group – 2012-14 Plan Key Guidance **Ebitda-Capexcum ’12-’14
>22 € bln
Organic Data*
*exchange rates 2011 (R$/€ 2.33; ARS/€5.74), excluding impact from non-organic items
*** reported figure
Telecom Italia Group – FY 2012 and 2012-14 Plan Key Guidance

8
TELECOM ITALIA GROUP
Agenda
Telecom Italia Group Overview
1Q12 Results
Focus on UBB
Financial Position and Group Targets
Sustainability at TI

9
TELECOM ITALIA GROUP
Revenues EBITDA
42.0% 40.1%% on Revenues -1.9 p.p.
Revenues Trend YoY EBITDA-CAPEX
Euro mln, Organic data, %
27.2%-2.1 p.p.29.3%
+15 M€+0.5%
-43 M€-2.1%
TI Group Key Results
+373 M€+5.3%7,019
7,392
1Q11 1Q12
2,055 2,012
1Q11 1Q12
2,951 2,966
1Q11 1Q12
-0,2%
2.1%
3.7%
5.0%5.3%
1Q11 2Q11 3Q11 4Q11 1Q12
% on Revenues
10
TELECOM ITALIA GROUP
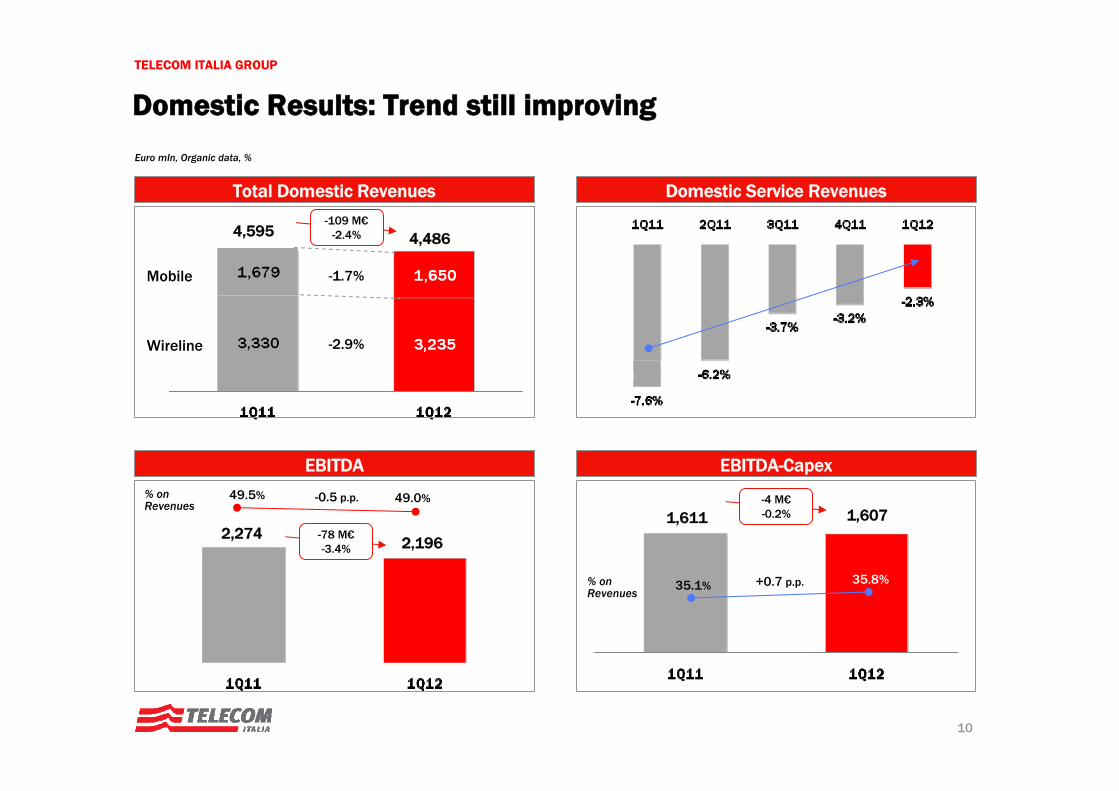
Domestic Results: Trend still improving
Euro mln, Organic data, %
4,595 4,486-109 M€
-2.4%
-1.7%
-2.9%Wireline
Mobile
Total Domestic Revenues Domestic Service Revenues
EBITDA
-78 M€-3.4%
49.5% 49.0%-0.5 p.p.% on Revenues
2,2742,196
EBITDA-Capex
1,611 1,607
35.8%+0.7 p.p.% on Revenues 35.1%
-4 M€-0.2%

11
TELECOM ITALIA GROUP
Euro mln, Organic Data
Mobile Revenues: 1Q12 Results at a Glance
Total Mobile Revenues
Mobile Service Revenues Trend – YoY % change
Handset revenues
Service revenues
1,650-29
-1.7%1,679
Normalized (*)
~-2.5%
Total Mobile
-3.7%
Normalized (*)
~-4.5%
+71.1%
(*) Leap year
Mobile Handsets Revenues Trend – YoY % change

12
TELECOM ITALIA GROUP
Domestic Mobile – Surfing the Data Wave
Increasing Smartphone Penetration in All Segments
Smartphones increasingly Service-Driven
Bri
ngin
g In
nova
tion
to t
he
Mas
s M
arke
t Operating Systems on TIM ‘s Network - The Android Growth
Dou
blin
g sm
artp
hone
pe
netr
atio
n on
C
B
Furt
her
roo
m fo
r gr
owth
Smartphone Penetration on Customer Base
~1,3 mln
May 2012 Dealer Convention
Of which >75% Smartphones
Data Bundle users and Renewal Rate
Number of Data connections by Device (*)
+~20%
2.2mln1.9mln
Renewal rate 79%87%
+1,9X
* Peak of traffic on the average day of the second week of each month
Dec’11 Jan’12 Feb’12 Mar’12 Apr’12
13
TELECOM ITALIA GROUP
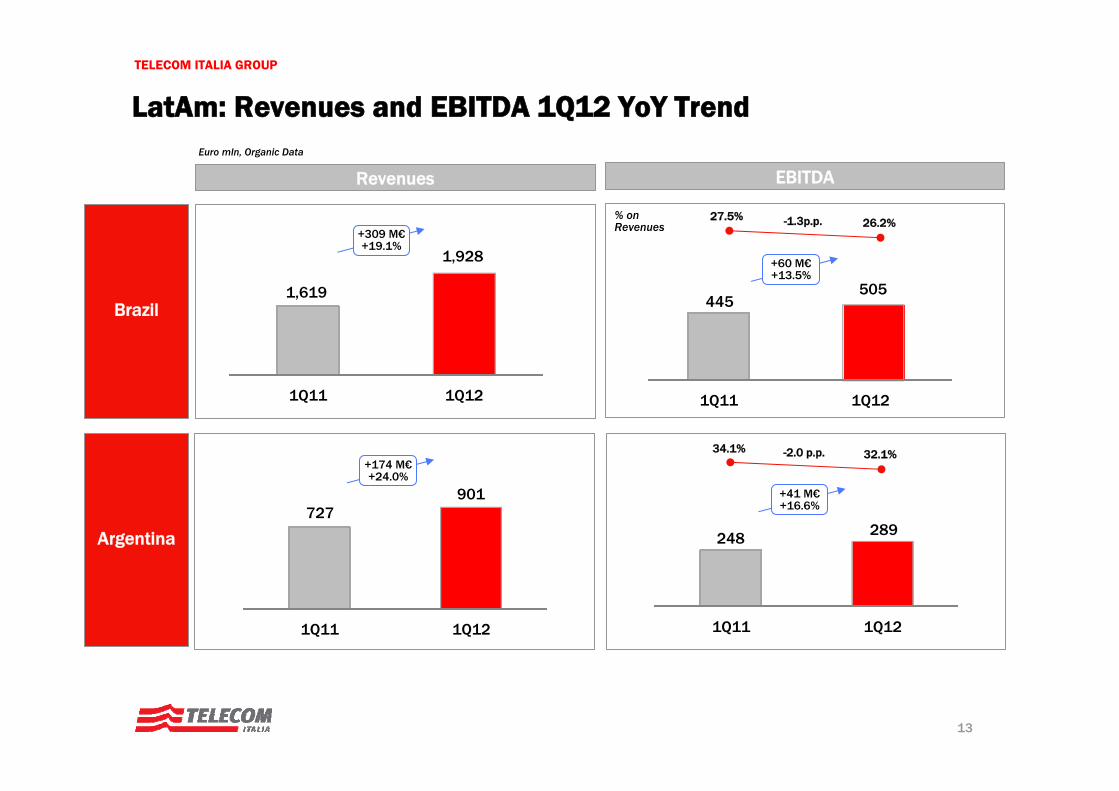
Euro mln, Organic Data
Revenues EBITDA
LatAm: Revenues and EBITDA 1Q12 YoY Trend
% on Revenues
+309 M€+19.1%
+60 M€+13.5%
27.5% 26.2%-1.3p.p.
1,619
1,928
1Q11 1Q12
445 505
1Q11 1Q12
Brazil
Argentina
+174 M€+24.0%
+41 M€+16.6%727
901
1Q11 1Q12
248 289
1Q11 1Q12
32.1%-2.0 p.p.34.1%

14
TELECOM ITALIA GROUP
Market Leaders In Our Footprint (March 2012)
Brazil ArgentinaDomestic
Mobile
Fixed
Broadband
#1 position - 32.3 mln lines
#1 position - 7.1 mln accesses
#1 position - 14.46 mln accesses
#2 position - 57.6 mln lines #2 position - 18.5 mln lines
#2 position - 1.56 mln accesses
#2 position - 4.14 mln accesses
A Competitive and still Healthy Market where TI remains the
Leading Operator
Customer base expansionacross all segments, driven by mobile rebranding of Personal
and the successful proposition of Arnet on broadband TV
Successful «Challenger «strategy and leadership in growth . TIM re-gained the
second position during 2011.
52.7%
34.9%
66.2%
26.8% 33.6%
47%
35%
Tim Brasil acquiredrelevant fiber infrastructure
through the Intelig and AES purchases,to further profitably develop
its mobile business.AES now offers the opportunity to enter the Fixed BB business

15
TELECOM ITALIA GROUP
Agenda
Telecom Italia Group Overview
1Q12 Results
Focus on UBB
Financial Position and Group Targets
Sustainability at TI

16
TELECOM ITALIA GROUP
% families
Families(mln)
23.9 24.3 24.6 24.9 25.2 25.4
Source: Between
UBB Networks allow TI to further tap growing BB demand:Mobile BB is complementary to Fixed BB
29%32% 30%
22%
18%
15%2%
7%18%
24% 28%
2%8% 12%
16%
71%66%
61%
52%
45%41%
2006 2007 2008 2009 2010 2011
FBB‐only families FBB & MBB families
MBB‐only families "No‐BB" families
Source: <Osservatorio Banda Larga
Italian Families - Broadband Penetration Italian Soho & SME - Broadband Penetration

17
TELECOM ITALIA GROUP
Capex Allocation
Strengthen the Network for a Technological Leadership
UltraBB Roadmap
Customer Service& Traffic Driven
Network Development
Network Maintainance
Acceleration
Decrease
HSPDA 42 Mbps LTE
NGAN Roll-out
Mobile Coverage
Optimize Network Investment to maintain excellent quality in TLC services
Increase the effort in Network Development and Innovation to confirm Technological Leadership and grant the Best Experience on the Net
2014100 Cities (including all
main ones) covered throughFTTH&Cab Technology
~¼ of Housing units passed with >30 Mb/s
Speed
2014More than 40% of
population covered by LTE
Optimization
Network Capex
2012-2014 Plan

18
TELECOM ITALIA GROUP
TI’s Convergent Approach to Fixed and Mobile UBB
The Value of our Core Asset A
cces
sN
etw
ork Key asset both for fixed and mobile
Huge capital and time already fruitfully investedHigh CapillarityStrategic asset in the economic , social & regulatory landscape
Yesterday Today: Pervasive Ultra Broadband
UBB
Super Internet +
NGAN Fttx HSPA+ LTE
NGN
Fixed Network
Fixed & Mobile Network
19
TELECOM ITALIA GROUP
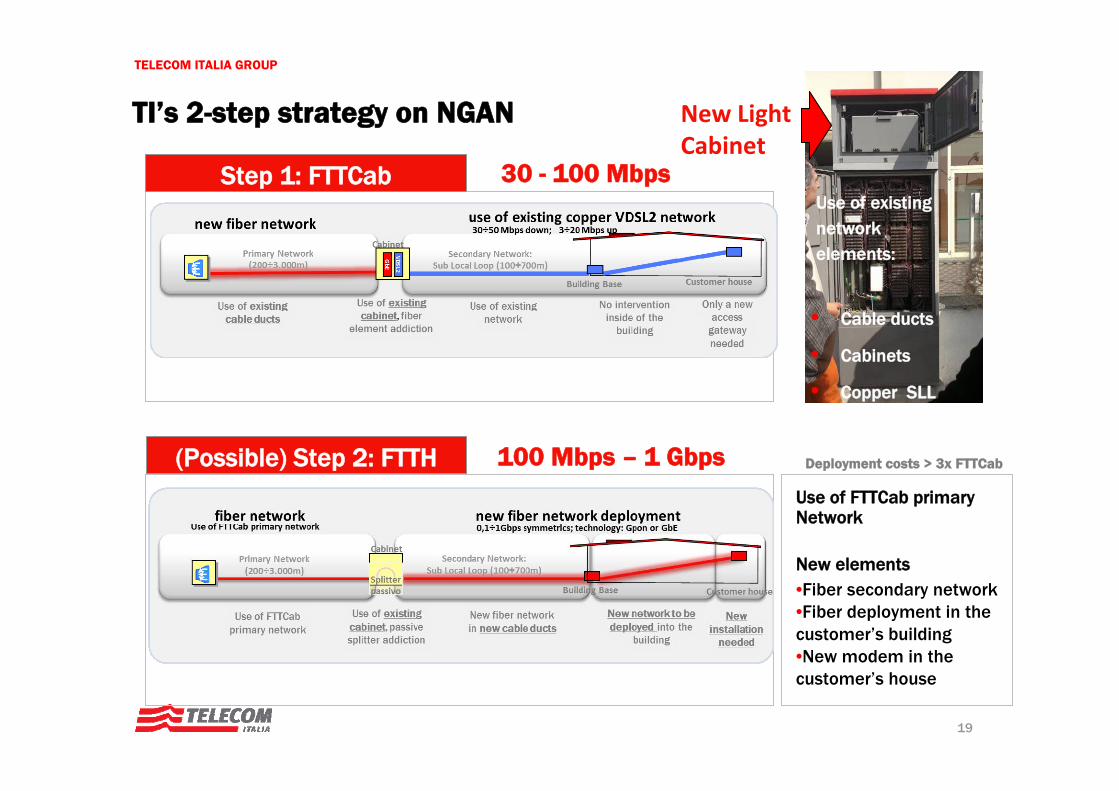
TI’s 2-step strategy on NGAN
Step 1: FTTCab
(Possible) Step 2: FTTH
30 - 100 Mbps
100 Mbps – 1 Gbps
• Cable ducts
• Cabinets
• Copper SLL
Use of FTTCab primary Network
New elements•Fiber secondary network•Fiber deployment in the customer’s building•New modem in the customer’s house
Deployment costs > 3x FTTCab
New Light Cabinet
Use of existing network elements:

20
TELECOM ITALIA GROUP
TI Fixed UBB Plan: 2012-2014 and beyond
About 60% cities target in the North (i.e. Milan, Turin, Genoa); NewCo Trentino NGN for Trento region
About 20% cities located in the Central part of the country (i.e. Rome, Florence)
About 20% cities located in the South(i.e. Naples, Bari, Palermo)
2014 within 20202012 - 1H13
30 cities 100 cities
Driver for NGAN Plan:
Density of population;
Leverage on existing infrastructure (i.e. ducts already in place in most of 100 targeted cities)
Moving towards DAE
Targets
21
TELECOM ITALIA GROUP
Agenda
Telecom Italia Group Overview
1Q12 Results
Focus on UBB
Financial Position and Group Targets
Sustainability at TI
22
TELECOM ITALIA GROUP
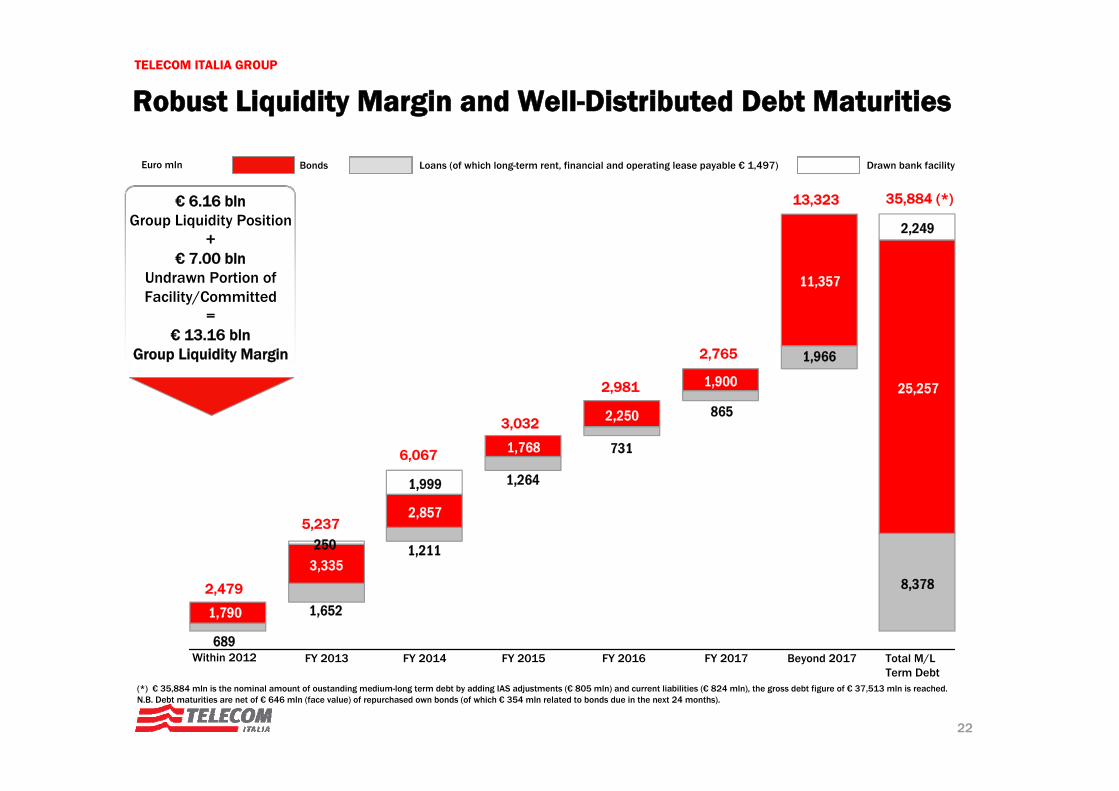
Bonds Loans (of which long-term rent, financial and operating lease payable € 1,497) Drawn bank facilityEuro mln
€ 6.16 bln Group Liquidity Position
+€ 7.00 bln
Undrawn Portion of Facility/Committed
=€ 13.16 bln
Group Liquidity Margin
Robust Liquidity Margin and Well-Distributed Debt Maturities
689
1,652
1,211
1,264
731
865
1,966
8,378
1,790
3,335
2,857
1,768
2,250
1,900
11,357
25,257
250
1,999
2,249
2,479
5,237
6,067
3,032
2,981
2,765
13,323 35,884 (*)
(*) € 35,884 mln is the nominal amount of oustanding medium-long term debt by adding IAS adjustments (€ 805 mln) and current liabilities (€ 824 mln), the gross debt figure of € 37,513 mln is reached.N.B. Debt maturities are net of € 646 mln (face value) of repurchased own bonds (of which € 354 mln related to bonds due in the next 24 months).
Within 2012 FY 2013 FY 2014 FY 2015 FY 2016 FY 2017 Beyond 2017 Total M/LTerm Debt

23
TELECOM ITALIA GROUP
2011-2013 Deleverage Targets Confirmed
Cash Flow Generation (EBITDA- Capex) Net Financial Position Adjusted**
New Dividend Policy (as announced on Feb. 24 2012)
Euro Bln
35.930.4
2007 2011 2012
∼27.5
-5.5 Bln € Net Debt
2013
∼25
2014
Latam
Domestic
Financial Discipline
2012 and 2013 targets confirmed
~20%
~80%
>22 Bln €
Cum. ‘12-’14
Organic Data*
*Organic: same perimeter, 2011 FX rates, excluding spectrum licences acquisitions.** Excluding Latam spectrum licences acquisitions.
24
TELECOM ITALIA GROUP
Agenda
Telecom Italia Group Overview
1Q12 Results
Focus on UBB
Financial Position and Group Targets
Sustainability at TI
25
TELECOM ITALIA GROUP
TI is part of all main global and European sustainability indexes
Electricity consumption and Greenhouse Gas emissions have been curbed downwards (respectively, -6,3% and -6,2% versus 2010)
TI delivers a wide range of Green and Social telecommunications solutions for the Public Administration and private Customers, improving their environmental footprint and lifestyle
Relations with Trade Unions are excellent. This is key to deliver agreements which are considered satisfactory by all involved parties (e.g the one of August 4, 2010)
A wide range of projects aimed at bridging the social digital divide are under way, sometimes with the involvement of the Public Administration
Telecom Italia is a founding member of a joint auditing project on suppliers' production sites in developing countries, carried out in partnership with other leading Telecom operators. As of December 2011, 33 sites were audited involving 155,000 workers
Sustainability at TI: Key Actions and Results