technology sector strategy special report - august 1/2017 ... · bca research inc special report...
TRANSCRIPT
1
SPECIAL REPORT Electric Vehicles Part 1: Costs Of Ownership
Editorial BoardBrian Piccioni Vice President, Technology Sector Strategist
Peter Berezin Senior Vice President Chief Global Strategist
Anastasios Avgeriou Vice President, Global Alpha Sector Strategy & U.S. Equity Strategy
Johanna El-Hayek Research Assistant
[email protected] • www.bcaresearch.com • Copyright © 2017 BCA Research Inc. All Rights Reserved. Refer to last page for important disclaimer.
In this Issue: F Cost Comparison: EV Vs. ICEV ........... 1
F Batteries: A Review ............... 4
F Finally A Reliable Battery Price Data Point! .................... 5
F Difference In Cost Of Ownership: Chevy Bolt Vs. ICEV ......... 9
August 1, 2017
GLOBAL INVESTMENT STRATEGY
TECHNOLOGY SECTOR STRATEGY
This is the first of two Special Reports on Electric Vehicles. In this report, we will look at the current costs of ownership of a typical mass-market EV, including and excluding
subsidies, versus a similar Internal Combustion Engine Vehicle (ICEV). Based on current manufacturing costs and battery capabilities, EVs carry a significantly higher total cost per mile, even including current subsidies.
Electric Vehicles have galvanized the interest of consumers, investors, and governments for several years now. We touched on the subject in our Special Report “Electric Vehicle Batteries”, published September 20, 2016, where we noted that there were many mis-conceptions regarding batteries in general and EV batteries in particular.
Despite the current cost and utility disadvantages of EVs, we expect governments (especially Europe and China) will continue to provide subsidies (carrots) and mandates (sticks) to further the adoption of EVs for the purposes of reducing CO2 emissions and tailpipe particulate pollution. The longer-term hope is that by forcing the EV market to expand, meaningful technological breakthroughs on batteries will eventually enable EVs to exceed ICEVs on a cost and utility basis. In our second report, we will look at the potential issues associated with adoption of EVs and the investment implications for the auto industry and energy markets.
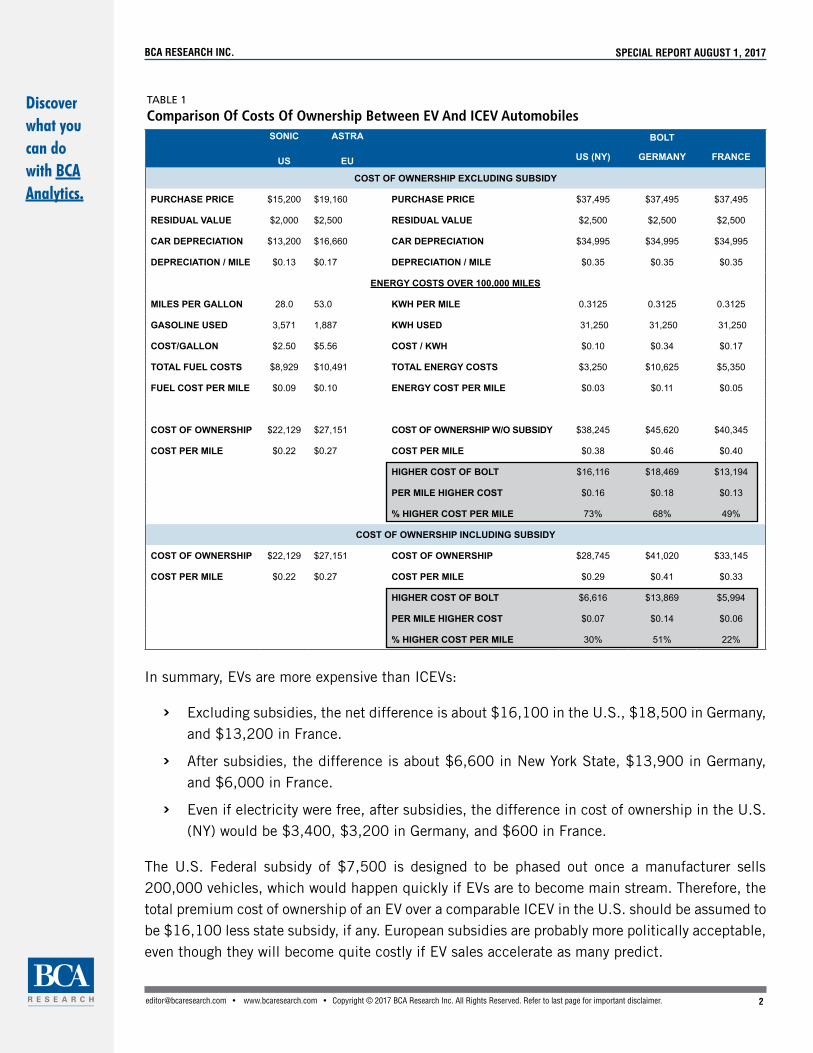
Cost Comparison: EV Vs. ICEVWe estimated the difference in cost of ownership of a Chevy Bolt EV (known as the Opel Ampera-e in Europe) and two equivalent Internal Combustion Engine Vehicles (ICEVs), the Chevy Sonic and the Opel Astra, over 160,000 km or 100,000 miles (Table 1). Deprecia-tion is an important consideration in cost of ownership, and we expect EVs to depreciate much more rapidly than ICEVs, a cost that many consumers either ignore or simply fail to incorporate into their purchase decisions.
There are many unknowns, such as actual selling price, actual manufacturing cost, etc., in this exercise which may add or subtract a thousand dollars or more to the net results. Under realistic assumptions, those probably cancel out.
BCA HouseView Matrix
COMMODITY & ENERGY STRATEGY
ENERGY SECTOR STRATEGY
COMMODITY & ENERGY STRATEGY
2
BCA RESEARCH INC. SPECIAL REPORT AUGUST 1, 2017
[email protected] • www.bcaresearch.com • Copyright © 2017 BCA Research Inc. All Rights Reserved. Refer to last page for important disclaimer.
Discover what you can do with BCA Analytics.
In summary, EVs are more expensive than ICEVs:
F Excluding subsidies, the net difference is about $16,100 in the U.S., $18,500 in Germany, and $13,200 in France.
F After subsidies, the difference is about $6,600 in New York State, $13,900 in Germany, and $6,000 in France.
F Even if electricity were free, after subsidies, the difference in cost of ownership in the U.S. (NY) would be $3,400, $3,200 in Germany, and $600 in France.
The U.S. Federal subsidy of $7,500 is designed to be phased out once a manufacturer sells 200,000 vehicles, which would happen quickly if EVs are to become main stream. Therefore, the total premium cost of ownership of an EV over a comparable ICEV in the U.S. should be assumed to be $16,100 less state subsidy, if any. European subsidies are probably more politically acceptable, even though they will become quite costly if EV sales accelerate as many predict.
5 http://www.sewbo.com/
SONIC
US
ASTRA
EU
BOLT
US (NY) GERMANY FRANCE
COST OF OWNERSHIP EXCLUDING SUBSIDY
PURCHASE PRICE $15,200 $19,160 PURCHASE PRICE $37,495 $37,495 $37,495
RESIDUAL VALUE $2,000 $2,500 RESIDUAL VALUE $2,500 $2,500 $2,500
CAR DEPRECIATION $13,200 $16,660 CAR DEPRECIATION $34,995 $34,995 $34,995
DEPRECIATION / MILE $0.13 $0.17 DEPRECIATION / MILE $0.35 $0.35 $0.35
ENERGY COSTS OVER 100,000 MILES
MILES PER GALLON 28.0 53.0 KWH PER MILE 0.3125 0.3125 0.3125
GASOLINE USED 3,571 1,887 KWH USED 31,250 31,250 31,250
COST/GALLON $2.50 $5.56 COST / KWH $0.10 $0.34 $0.17
TOTAL FUEL COSTS $8,929 $10,491 TOTAL ENERGY COSTS $3,250 $10,625 $5,350
FUEL COST PER MILE $0.09 $0.10 ENERGY COST PER MILE $0.03 $0.11 $0.05
COST OF OWNERSHIP $22,129 $27,151 COST OF OWNERSHIP W/O SUBSIDY $38,245 $45,620 $40,345
COST PER MILE $0.22 $0.27 COST PER MILE $0.38 $0.46 $0.40
HIGHER COST OF BOLT $16,116 $18,469 $13,194
PER MILE HIGHER COST $0.16 $0.18 $0.13
% HIGHER COST PER MILE 73% 68% 49%
COST OF OWNERSHIP INCLUDING SUBSIDY
COST OF OWNERSHIP $22,129 $27,151 COST OF OWNERSHIP $28,745 $41,020 $33,145
COST PER MILE $0.22 $0.27 COST PER MILE $0.29 $0.41 $0.33
HIGHER COST OF BOLT $6,616 $13,869 $5,994
PER MILE HIGHER COST $0.07 $0.14 $0.06
% HIGHER COST PER MILE 30% 51% 22%
TABLE 1
Comparison Of Costs Of Ownership Between EV And ICEV Automobiles
3
BCA RESEARCH INC. SPECIAL REPORT AUGUST 1, 2017
[email protected] • www.bcaresearch.com • Copyright © 2017 BCA Research Inc. All Rights Reserved. Refer to last page for important disclaimer.
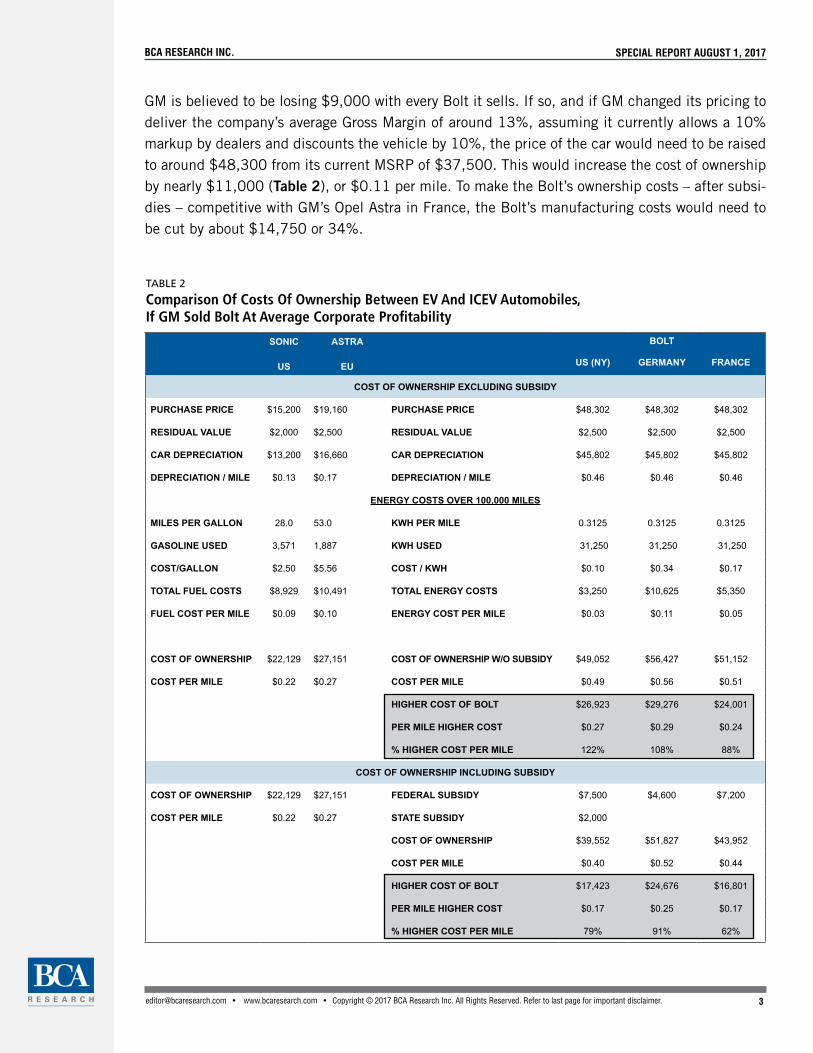
GM is believed to be losing $9,000 with every Bolt it sells. If so, and if GM changed its pricing to deliver the company’s average Gross Margin of around 13%, assuming it currently allows a 10% markup by dealers and discounts the vehicle by 10%, the price of the car would need to be raised to around $48,300 from its current MSRP of $37,500. This would increase the cost of ownership by nearly $11,000 (Table 2), or $0.11 per mile. To make the Bolt’s ownership costs – after subsi-dies – competitive with GM’s Opel Astra in France, the Bolt’s manufacturing costs would need to be cut by about $14,750 or 34%.
TABLE 2
Comparison Of Costs Of Ownership Between EV And ICEV Automobiles, If GM Sold Bolt At Average Corporate Profitability
SONIC
US
ASTRA
EU
BOLT
US (NY) GERMANY FRANCE
COST OF OWNERSHIP EXCLUDING SUBSIDY
PURCHASE PRICE $15,200 $19,160 PURCHASE PRICE $48,302 $48,302 $48,302
RESIDUAL VALUE $2,000 $2,500 RESIDUAL VALUE $2,500 $2,500 $2,500
CAR DEPRECIATION $13,200 $16,660 CAR DEPRECIATION $45,802 $45,802 $45,802
DEPRECIATION / MILE $0.13 $0.17 DEPRECIATION / MILE $0.46 $0.46 $0.46
ENERGY COSTS OVER 100,000 MILES
MILES PER GALLON 28.0 53.0 KWH PER MILE 0.3125 0.3125 0.3125
GASOLINE USED 3,571 1,887 KWH USED 31,250 31,250 31,250
COST/GALLON $2.50 $5.56 COST / KWH $0.10 $0.34 $0.17
TOTAL FUEL COSTS $8,929 $10,491 TOTAL ENERGY COSTS $3,250 $10,625 $5,350
FUEL COST PER MILE $0.09 $0.10 ENERGY COST PER MILE $0.03 $0.11 $0.05
COST OF OWNERSHIP $22,129 $27,151 COST OF OWNERSHIP W/O SUBSIDY $49,052 $56,427 $51,152
COST PER MILE $0.22 $0.27 COST PER MILE $0.49 $0.56 $0.51
HIGHER COST OF BOLT $26,923 $29,276 $24,001
PER MILE HIGHER COST $0.27 $0.29 $0.24
% HIGHER COST PER MILE 122% 108% 88%
COST OF OWNERSHIP INCLUDING SUBSIDY
COST OF OWNERSHIP $22,129 $27,151 FEDERAL SUBSIDY $7,500 $4,600 $7,200
COST PER MILE $0.22 $0.27 STATE SUBSIDY $2,000
COST OF OWNERSHIP $39,552 $51,827 $43,952
COST PER MILE $0.40 $0.52 $0.44
HIGHER COST OF BOLT $17,423 $24,676 $16,801
PER MILE HIGHER COST $0.17 $0.25 $0.17
% HIGHER COST PER MILE 79% 91% 62%

4
BCA RESEARCH INC. SPECIAL REPORT AUGUST 1, 2017
[email protected] • www.bcaresearch.com • Copyright © 2017 BCA Research Inc. All Rights Reserved. Refer to last page for important disclaimer.
Discover what you can do with BCA Analytics.
Note that although we have focused on the Bolt, the common denominator for all EVs is the cost of batteries, which are a commodity. As such, our estimates probably hold for similarly sized vehicles and the differential costs of ownership are likely larger for larger EVs. As we will show in Part 2, integrated auto manufacturers probably have a significant cost advantage over “pure play” EV vendors such as Tesla, because outside of the drive train, they are able to use many of the same components they manufacture for ICEVs.
Batteries: A ReviewAll assumptions regarding EV technology are predicated on continued improvements in the cost, durability, and performance of batteries. The leading battery technology for EVs is a Lithium Ion technology (Illustration 1), and there really are no proven near-term alternatives worth discussing.
In our Special Report “Electric Vehicle Batteries”, we concluded that:
F Although the consensus view is that EV battery prices have experienced rapid (8 – 14% per annum) price declines over the past few years, we found no evidence to support that position;
F Battery durability is at least as important as price, and batteries will not likely last much more than 100,000 miles (160,000 km);
F Planned expansion of EV battery manufacturing capacity may significantly exceed demand by 2020, resulting in the collapse of EV battery prices and heavy losses for battery manufacturers.
Lithium Nickel Manganese Cobalt Oxide (Used In Mobile phones)
Lithium Nickel Cobalt Aluminum Oxide (Used In Tesla EVs)
SPECIFIC ENERGY
SPECIFICPOWER
SAFETY
PERFORMANCE
LIFE SPAN
COST
SPECIFIC ENERGY
SPECIFICPOWER
SAFETY
PERFORMANCE
LIFE SPAN
COST
ILLUSTRATION 1
Lithium Ion Technology
SOURCE: BATTERY UNIVERSITY.

5
BCA RESEARCH INC. SPECIAL REPORT AUGUST 1, 2017
[email protected] • www.bcaresearch.com • Copyright © 2017 BCA Research Inc. All Rights Reserved. Refer to last page for important disclaimer.
We continue to stand by those conclusions, and would like to stress that recent stories such as “China Is About to Bury Elon Musk in Batteries”1 and “10 Battery Gigafactories Are Now in the Works and Elon Musk May Add 4 More”2 are more or less consistent with our comment that
“even though there is no reason to expect significant price improvements due to technological shifts, battery prices might drop due to oversupply – at least as long as manufacturers are willing to sell batteries at a loss.”3
It seems likely now that China may follow the path it took to the solar industry and mass produce batteries, likely at a loss. The exact motivation for them to do so is uncertain, but this would be moot from the perspective of a western auto manufacturer or consumer.
Finally A Reliable Battery Price Data Point!As we will demonstrate in Part 2 of our EV report, excluding the cost of the battery, it should be slightly cheaper to manufacture an EV than a similar ICEV. The EV drive train is much simpler and should be less expensive than that of an ICEV (Illustration 2), offset slightly by the need for a somewhat more robust chassis and suspension due to the weight of the battery, the requirement for electric powered air conditioning, and regenerative braking.
ILLUSTRATION 2
Key Components Of A Bolt EV Drive Unit
1 https://www.bloomberg.com/news/articles/2017-06-28/china-is-about-to-bury-elon-musk-in-batteries2 https://www.greentechmedia.com/articles/read/10-battery-gigafactories-are-now-in-progress-and-musk-may-add-4-more3 Please see Technology Sector Strategy Special Report “Electric Vehicle Batteries”, dated September 20, 2016.
SOURCE: CHEVROLET.

6
BCA RESEARCH INC. SPECIAL REPORT AUGUST 1, 2017
[email protected] • www.bcaresearch.com • Copyright © 2017 BCA Research Inc. All Rights Reserved. Refer to last page for important disclaimer.
The battery is the most expensive part of an EV and responsible for the higher vehicle prices, and that is likely to remain the case even as manufacturing efficiencies allow EV prices to decline. Un-fortunately, the cost of EV batteries is subject to much more speculation than should be the case: many articles cite speculative forecasts, projections, anecdotes, and so on, but without hard data backing them up. Fortunately, we finally have a data point: GM lists the cost of the Bolt EV battery pack as $15,734 for a 60 kWh unit, or $262/kWh.4
Some reports claim the battery cells cost $145/kWh,5 however, battery cells are not the same thing as a battery pack, which is a fully assembled unit complete with wiring, electronics, and a cooling system. Peer reviewed research suggests the cost of the battery pack is about 50% greater than the cost of the battery cells,6 however, we note the same article suggests that ratio will remain the same as battery prices drop. This is unlikely as there is no reason to believe the largely mechani-cal battery pack will decline proportionately any more than the cost of an engine or transmission will decline. Most likely, the battery pack assembly, excluding the cells, will decline only slightly.
EV vendors likely oversize their battery pack in order to limit stress on the batteries (Illustration 3). In other words, the actual capacity of the battery is likely somewhat larger than the rated or useable capacity. If GM is indeed paying $145/kWh for its cells and its pack costs are 50% more than its cell costs and it is oversizing its pack by 20%, the cost of the pack works out to $261/kWh.
4 http://insideevs.com/heres-how-much-a-chevrolet-bolt-replacement-battery-costs/ 5 http://insideevs.com/gm-chevrolet-bolt-for-2016-145kwh-cell-cost-volt-margin-improves-3500/6 https://www.researchgate.net/publication/260339436_An_Overview_of_Costs_for_Vehicle_Components_Fuels_and_
Greenhouse_Gas_Emissions
ILLUSTRATION 3
Oversizing Battery To Account For Capacity Fade
EV MAKERS CAN LIMIT BATTERY DEGRADATION AND CONCEAL IT FROM OWNERS BY OVERSIZING THE BATTERY, SUCH THAT IT IS ONLY CHARGED TO 80% AND DISCHARGED TO 30%. AS THE “SPARE CAPACITY” IS USED UP, THE RESULT IS MUCH FASTER DEGRADATION WHICH, SUPPOSEDLY, IS DESIGNED TO HAPPEN AFTER THE WARRANTY EXPIRES. PRESUMABLY, GM’S WARRANTY PROVISION TAKES INTO ACCOUNT WHATEVER OVERSIZING MAY HAVE BEEN INCORPORATED INTO THE BATTERY PACK. SOURCE: BATTERY UNIVERSITY.
0
End-of-life
Mid-point Spare
Spare
Spare Spare
Spare
238 miles Driving Range
238 miles Driving Range
238 miles Driving Range
Battery Capacity In %
New Battery
10 20 30 40 50 60 70 80 90 100
© BCA Research 2017
Discover what you can do with BCA Analytics.

7
BCA RESEARCH INC. SPECIAL REPORT AUGUST 1, 2017
[email protected] • www.bcaresearch.com • Copyright © 2017 BCA Research Inc. All Rights Reserved. Refer to last page for important disclaimer.
The reports which cite a $145/kWh cell price further suggest GM believes cells will cost $100/kWh in 2022, which implies a potential battery cost reduction of $2,700 (assuming the packs are not oversized) over the next 5 years (Table 3). The aforementioned research paper states:
“The pure material costs for the VDA-type batteries are estimated to be currently about 50 EUR/kWh ($67.50), which seems to be the lower possible limit at long term.”
Even if the difference between materials cost and selling price is only 20%, that implies a lower limit of $81/kWh for the cells, meaning savings of $64/kWh are possible. This has not prevented some commentators from suggesting batteries will decline in price by 77% (or $112, implying $33/kWh pricing) by 2030.7 Regardless, savings of $64/kWh work out to $3,840 assuming a 60 kWh pack, or $4,680 assuming the pack is 20% oversized. Even if the pack cost were to decline a simi-lar amount, the cost savings (assuming 50% for the pack, 20% oversized) would only be $7,000.
According to press reports, at the onset GM will lose $9,000 for every Bolt it sells.8 Since the major difference in costs between an EV and an ICEV is the battery pack, the $262 price cited above is probably not representative of the true cost. It may be that part of GM’s commercial strategy is to show EV buyers that a replacement battery pack is not overwhelmingly expensive, and it is therefore willing to offer them at a loss. After all, the vehicle comes with a 100,000-mile, 8-year warranty on the battery, and we doubt many consumers would spend $15,734 (plus labor) to replace the battery on an 8-year-old EV. Therefore, GM is probably not going to sell that many replacements, so they won’t suffer many losses by offering a replacement battery below its cost.
The price differential between a Bolt and a Chevy Sonic, which is a similar vehicle manufactured in the same factory, is about $22,300. If we include the reported $9,000 expected loss, the “true” difference in price is $31,300. We believe that most likely the actual cost of the battery pack of the Bolt is much higher than $15,734.
TABLE 3
GM Aims To Cut The Battery Cost By $2,700 By 2022
5-YEAR %
CURRENT COST
2022 TARGET
COST REDUCTION
COST REDUCTION
BATTERY CELLS COST PER KWH $145 $100 -$45 -31%
ASSEMBLY, WIRING, ELECTRONICS, COOLING $117 $117 $0 0%
BATTERY PACK COST PER KWH $262 $217 -$45 -17%
KWH PER BATTERY PACK 60 60
COST PER 60 KWH PACK $15,720 $13,020 -$2,700 -17%
7 https://www.bloomberg.com/news/articles/2017-05-26/electric-cars-seen-cheaper-than-gasoline-models-within-a-decade 8 https://www.bloomberg.com/news/articles/2016-11-30/gm-s-ready-to-lose-9-000-a-pop-and-chase-the-electric-car-boom

8
BCA RESEARCH INC. SPECIAL REPORT AUGUST 1, 2017
[email protected] • www.bcaresearch.com • Copyright © 2017 BCA Research Inc. All Rights Reserved. Refer to last page for important disclaimer.
GM Confirms That Batteries Get Used Up
Although the Bolt battery pack is covered by an 8-year 100,000-mile warranty, that warranty con-siders the potential for degradation of up to 40%:
“Like all batteries, the amount of energy that the high voltage ‘propulsion’ battery can store will decrease with time and miles driven. Depending on use, the battery may degrade as little as 10% to as much as 40% of capacity over the warranty period.”9
We highlight “all batteries” because this is the fate of all existing battery technologies. We further note that the amount of degradation will depend on the driving habits of the user: if the car is “lightly used” (i.e. traveled much less than 12,000 miles/year), chances are the battery degrada-tion will be at the low end of the scale, whereas if the car is used a lot, chances are it will be at the high end of the scale.
The average U.S. driver travels ~13,500 miles (22,000 km) per year,10 meaning the average driver with a single car would exceed the warranty on the Bolt in less than 8 years and, most likely, battery degradation would be closer to 40% than to 10%. Assuming a normal distribution, half of drivers would likely exceed the average annual miles driven, and as a result, their battery degradation would be even greater and happen even sooner, since they would be stressing the battery system through deeper and more frequent charging. Of course, if you were to travel 100,000 miles in 5 years, your battery warranty would expire.
A major motivation for buying an EV is the expectation that it will save money on gasoline, which is true as shown in Table 1. However, the more you drive, the faster you use up the battery, and the sooner you would be faced with buying an expensive replacement battery. As such, drivers who drive a lot would be best to be cautious about purchasing an EV, as their costs of ownership due to battery degradation/replacement would be even higher.
The Bolt has a purported range of 238 miles, but that range is achieved only when the battery is new and likely measured under ideal circumstances. Use of air conditioning, extreme temperatures (i.e. winter), etc., would probably trim the range significantly, likely to well below 200 miles. Assuming a reasonable usage for the vehicle, an 8-year-old Bolt would probably have a range closer to 100 miles than to 200 miles. This would significantly affect resale value as a vehicle with a range of 100 miles has much less utility than one with 200 miles.
9 https://electrek.co/2016/12/07/gm-chevy-bolt-ev-battery-degradation-up-to-40-warranty/
10 http://www.carinsurance.com/Articles/average-miles-driven-per-year-by-state.aspx
Discover what you can do with BCA Analytics.

9
BCA RESEARCH INC. SPECIAL REPORT AUGUST 1, 2017
[email protected] • www.bcaresearch.com • Copyright © 2017 BCA Research Inc. All Rights Reserved. Refer to last page for important disclaimer.
Difference In Cost Of Ownership: Chevy Bolt Vs. ICEVCalculating costs of ownership is subject to numerous assumptions, and this is especially the case with respect to an emerging technology such as EVs. Because we have a significant amount of information from GM on the cost and operating characteristics of the Bolt, and because GM makes “mass market” ICEVs which are roughly comparable to the Bolt, we thought it would be a uniquely useful benchmark for a cost of ownership analysis. We are neither making a claim that the Bolt or any EV will be commercially successful, nor are we endorsing it in any way; we are simply identify-ing the Bolt as representative of a typical mass-market EV.
In our analysis we assume:
F The Chevy Bolt is a typical mass market EV;
F The sales price of the Bolt is roughly the same in the U.S.11 and Europe12 at $37,495;
F The Bolt is comparable to the Sonic in North America and the Opel Astra in Europe (Table 4);
F There are no direct financial subsidies associated with EVs; and
F After 100,000 miles, both the EV and the comparable ICEV have a similar residual value.
As we noted above, GM is believed to be taking a $9,000 loss associated with each Bolt sold. This is not sustainable if the firm expects to sell a lot of them. Most likely, either the company sees a path to significant cost reduction over the life of the product, or the company will artificially limit supply and use profits from its other products to subsidize the sales of Bolts. For the purpose of this analysis, we will assume the company and its rivals believe they can sell such vehicles at a reasonable profit in the future.
11 http://www.chevrolet.com/byo-vc/client/en/US/chevrolet/bolt-ev/2017/bolt-ev/features/trims/?section=Highlights§ion=Fuel%20Efficiency§ion=Dimensions&styleOne=388584
12 https://electrek.co/2016/12/15/chevy-bolt-ev-europe-june-2017-opel-ampera-e-gm/
TABLE 4
The Bolt Is Much More Expensive Than Similarly-Sized GM ICEVs
DIMENSIONS BASE CURB WEIGHT (LBS)
PRICE ($000)
LENGTH (IN.) HEIGHT (IN.) WIDTH (IN.) WHEELBASE (IN.)
2017 BOLT (EV) 164 62.8 69.5 102.4 3563 $37.50
2017 SONIC (ICEV) 173.1 59.7 68.3 99.4 2733 $15.20
2017 ASTRA (ICEV) 172 58.5 71.2 104.8 2736 -2992 $19.20

10
BCA RESEARCH INC. SPECIAL REPORT AUGUST 1, 2017
[email protected] • www.bcaresearch.com • Copyright © 2017 BCA Research Inc. All Rights Reserved. Refer to last page for important disclaimer.
The difference in the cost of ownership for similar vehicles is mainly associated with purchase cost, fuel costs, repair costs, and resale value. Insurance, parking, and so on would be a wash and an-nual repair and maintenance bills on most new cars are quite modest, so it would not significantly tilt the balance. Although EV enthusiasts tend to highlight the fact EVs do not require oil changes, the significantly increased weight of the battery means EVs require more frequent tire replacement than an equivalent ICEV.13 For example, modern ICEVs require an oil change every 10,000 miles. At $70/oil change this works out to $700, similar in price to a set of tires. Furthermore, the repair experience with EVs is extremely limited, and if we are to take Tesla as an example, they do not fare as well as many had hoped.14
We address the likely higher depreciation rates of EVs below.
Estimating Electric Power Costs For An EV
Charging a battery is not 100% efficient as losses occur in the charger and at the battery. Batter-ies get warm as they are charged, and that is a sign of inefficiencies in the charging process. As smartphone and notebook owners are aware, aged batteries produce a lot more heat when they are charged because the charging becomes less efficient as the batteries age.
A new EV with a “slow” charger (see below) is about 85% efficient,15,16 while the figure is almost certainly lower for an aged battery. Assuming the system were 100% efficient, the Bolt vehicle goes 238 miles on 60 kWh, averaging about 0.25 kWh/mile, or approximately 25,000 kWh for 100,000 miles. Assuming lifetime average efficiency of 80% (85% when new, 75% when old), lifetime power consumption would be about 31,250 kWh.
EV advocates note there are numerous “free” public charging stations. This is true, but there are far fewer public charging stations than there are EVs, which means the average EV owner pays for her electricity (Chart 1). Regardless, somebody has to pay for the electricity, and it is unreasonable to assume that “free charging” will persist if EVs gain significant market share, which apparently they have been doing in the past few years, especially in the U.S. and the EU (Chart 2).
Furthermore, although many utilities have “time of use” utility rates which are lower in the evening when an EV is being charged, there is reason to question whether those can coexist with significant EV market penetration, a subject we will address in Part 2. Regardless, average power rates incor-porate discounted time of use power to some extent, so that is the figure we use.
13 The Bolt weighs almost 800 pounds (360 kg) more than a similar sized Chevrolet Sonic. 14 http://www.consumerreports.org/cars-tesla-reliability-doesnt-match-its-high-performance/ 15 https://www.veic.org/docs/Transportation/20130320-EVT-NRA-Final-Report.pdf 16 http://teslaliving.net/2014/07/07/measuring-ev-charging-efficiency/
Discover what you can do with BCA Analytics.

11
BCA RESEARCH INC. SPECIAL REPORT AUGUST 1, 2017
[email protected] • www.bcaresearch.com • Copyright © 2017 BCA Research Inc. All Rights Reserved. Refer to last page for important disclaimer.
Net Operating Costs: U.S.
The Bolt17 is roughly comparable to a Chevy Sonic18 in terms of size, and the vehicles are made in the same factory. The difference in price is about $22,300. At 25/33 mpg, fuel use of the Sonic over 100,000 miles would be about 3,600 gallons (13,627 liters), costing about $9,000, assum-ing a gasoline price of $2.50 per gallon ($0.66/liter), which is slightly higher than the current nationwide average of ~$2.30/gallon.
Assuming lifetime power consumption of 31,250 kWh and an average electricity price in the U.S. of $0.104/kWh,19 electric power costs for the Bolt would be around $3,250, for a net “fuel costs savings” of $5,700 in favor of the Bolt.
However, the substantially higher initial purchase price and faster depreciation still results in the Sonic costing about $16,100 less over the duration of the vehicles’ 100,000 miles (160,000 km). Put another way, the Bolt’s total operating costs would average about $0.38 per mile, 73% higher than the $0.22/mile cost of the Sonic.
17 http://www.chevrolet.com/bolt-ev-electric-vehicle 18 http://www.chevrolet.com/sonic-small-car 19 https://www.eia.gov/electricity/state/
2000
1600
1200
800
400
2009 2010 2011 2012 2013 2014 2015 2016 2017
2000
1600
1200
800
400
GLOBAL* ELECTRIC CAR STOCK (BEV + PHEV)**
GLOBAL* PUBLICLY ACCESSIBLE FAST AND SLOW CHARGER STOCK
Th Th
SOURCE: OECD/IEA, GLOBAL EV OUTLOOK 2017.*GLOBAL STOCK INCLUDES CANADA, CHINA, FRANCE, GERMANY, INDIA,JAPAN, KOREA, NETHERLANDS, NORWAY, SWEDEN, UK, US, AND27 OTHER EURO COUNTRIES.**BEV: BATTERY ELECTRIC VEHICLE. PHEV: PLUG-IN HYBRID VEHICLE.
25
20
15
10
5
2011 2012 2013 2014 2015 2016 2017
4
3
2
1
EV MARKET SHARE WITHIN COUNTRY*:NORWAY (LS)NETHERLANDS (LS)FRANCE (RS)U.K. (RS)GERMANY (RS)SWEDEN (RS)OTHER EURO** (RS)U.S. (RS)
% %
*SOURCE:OECD/IEA, GLOBAL EV OUTLOOK 2017.**INCLUDES 27 OTHER EUROPEAN COUNTRIES.
CHART 1
Globally, EVs Outnumber Charging Stations By 6 To 1
CHART 2
EV Market Share Is Increasing, Especially In Europe
© BCA Research 2017© BCA Research 2017
12
BCA RESEARCH INC. SPECIAL REPORT AUGUST 1, 2017
[email protected] • www.bcaresearch.com • Copyright © 2017 BCA Research Inc. All Rights Reserved. Refer to last page for important disclaimer.
Net Operating Costs: Europe
In Europe, both fuel and electricity costs are typically much higher than in the U.S., but ICEVs also tend to be more fuel efficient. The Bolt is roughly equivalent to an Opel Astra, which costs €16,700 ($19,160) in France and consumes 4.4 litres/100 km20 (53 MPG). The difference in price between the Bolt and the Astra is about $18,300, a smaller premium than in the U.S. comparison. However, even though gasoline prices are more than twice as expensive in Europe than in the U.S., fuel costs for the Astra are moderated by the car’s higher fuel efficiency, approximating $10,500 for the first 100,000 miles.
Energy costs and EV subsidies vary widely across the EU. Because the economic impact of EVs would be roughly proportional to GDP, we decided to look at the largest EU economies excluding the UK. It happens that EV sales in Italy are negligible, with total market share less than 0.1%,21
and EV subsidies in the country are somewhat opaque. Therefore, we confined our analysis to Ger-many and France.
20 http://www.opel.fr/vehicules/gamme-astra/astra-5-portes/points-forts.html#trim-edition 21 http://www.eafo.eu/content/italy
Discover what you can do with BCA Analytics.
13
BCA RESEARCH INC. SPECIAL REPORT AUGUST 1, 2017
[email protected] • www.bcaresearch.com • Copyright © 2017 BCA Research Inc. All Rights Reserved. Refer to last page for important disclaimer.
Assuming lifetime power consumption of 31,250 kWh, the electric power costs of the Bolt would be around $5,350 in France, which has low power prices, for net energy savings of $5,100. In Germany, where power prices of $0.34/kWh are considerably higher, the Bolt and the Astra would have energy costs that are roughly equal.
In France, EVs’ ownership costs would be $13,200 (49%) higher than the ICEV; in Germany, EV ownership costs would be $18,500 (68%) higher.
Bolt Vs Sonic Cost Of Ownership: Impact Of Subsidies
In the U.S., there is a federal subsidy of $7,500 and some states also have an EV incentive. In New York State, the subsidy is $2,000, meaning the net increased cost of owning the Bolt instead of a Sonic drops to around $6,600. Note that the federal subsidy is designed to “phase out” once a manufacturer sells 200,000 vehicles. GM hopes to sell 30,000 EVs in 2017 despite only launch-ing U.S.-wide in summer 2017. Combined with prior Volt sales of over 150,000 units, GM should exhaust its federal subsidies in early 2018.
Subsidies vary considerably across the EU.22 In France, there is a subsidy of €6,300 ($7,200)23
associated with the purchase of an EV, while Germany24 has a €4,000 ($4,600) incentive.
Besides subsidies, there are other benefits of owning an EV including reserved or even free parking spaces, often including free charging. These are offset to some extent by the limited range of EVs which may disqualify them from purchase by some.
It remains to be seen how long EV subsidies will persist. They may be affordable to governments as long as the number of vehicles sold remains small, but they would become very costly if EV sales accelerate. For example, about 2 million new passenger cars are registered in France every year. If only half of those were EVs, subsides would total $7.2B. Money for roads, infrastructure mainte-nance, policing, and so on have to come from somewhere, and if ICEV sales decline substantially, European governments’ huge gasoline tax revenues would also deteriorate; in such an environment, it is reasonable to assume that EV subsidies would eventually disappear and be replaced by taxes.
It seems highly unlikely to us that a massive subsidy program would be a politically acceptable solution in the U.S. auto market; however, it may very well be that over the near term subsidies persist in the EU where concerns over climate change have greater political weight.
Cost Of Ownership: Depreciation
Depreciation of the EV is almost certainly going to be much higher than the ICEV, which accounts for some of the higher cost of ownership. We believe that most EV batteries will be substantially
22 https://www.iea.org/publications/freepublications/publication/GlobalEVOutlook2017.pdf pages 53-55 23 http://insideevs.com/overview-incentives-buying-electric-vehicles-eu/ 24 https://electrek.co/2016/04/27/germany-electric-vehicle-incentive-4000/

14
BCA RESEARCH INC. SPECIAL REPORT AUGUST 1, 2017
[email protected] • www.bcaresearch.com • Copyright © 2017 BCA Research Inc. All Rights Reserved. Refer to last page for important disclaimer.
degraded after 160,000 km (100,000 miles), and we doubt there will be many EVs on the road past about 200,000 km or 15 years of operation. In contrast, the average age of a vehicle in the EU is over 10.5 years,25 while the average age of a vehicle in the U.S. is 11.6 years.26
The overwhelming majority of EVs on the road today are still under warranty and, in either event, relatively new, which means consumers lack the information to understand the inherent issues of battery degradation. As more consumers have experience with EVs, the problems of degradation and replacement cost (i.e. the high cost of depreciation) will likely temper demand. This would be the case even if battery costs drop significantly: few consumers would invest even $5,000 into repair-ing a 10-year-old vehicle, and an EV with a 100 mile (160 km) range is significantly less useful than one with a 200 mile (320 km) range. Rapid depreciation has been the experience of Nissan Leaf owners who are discovering their vehicles have lost 80% of their value after only 3 years.27
EV advocates suggest that degradation is not an issue and that, in any event, batteries are getting better and better. This flies in the face of what essentially every consumer has experienced with mobile phones, notebook computers, or any other cordless device. We believe GM has better insights into the issue than EV advocates do and, in any event, we see no evidence for significant improvements in battery life. If, indeed, significant improvements are made to batteries, prior-generation EVs (including today’s Bolt) will plummet in value.
That said, consumer understanding of battery degradation is not likely to be a factor for EV adop-tion over the near term.
Conclusion: Costs Of Ownership
Assuming similar depreciation and excluding subsidies, the net difference in cost of ownership over 160,000 km (100,000 miles) between a Bolt and an equivalent ICEV is about $16,100 in the U.S., $13,200 in France, and $18,500 in Germany, in favor of the ICEV.
After subsidies, an optimistic analysis suggests the difference in cost of ownership to travel 100,000 miles (160,000 km) between a Bolt EV and a roughly similar ICEV is about $6,600 in the U.S. (New York), $6,000 in France, and $13,900 in Germany, in favor of the ICEV.
Electric power costs for the Bolt are around $3,250 in the U.S., $10,600 in Germany, and around $5,350 in France. Even if electricity were free, after subsidies, the difference in cost of ownership would be $3,400 in the U.S. (NY), $3,200 in Germany, and $600 in France.
GM is believed to be losing $9,000 with every Bolt it sells. If so, and it wanted to sell the vehicle at its average Gross Margin of around 13%, it would sell for closer to $48,300, which would
25 http://www.acea.be/statistics/tag/category/average-vehicle-age 26 http://www.autonews.com/article/20161122/RETAIL05/161129973/average-age-of-vehicles-on-road-hits-11.6-years 27 http://blog.caranddriver.com/tesla-aside-resale-values-for-electric-cars-are-still-tanking/
Discover what you can do with BCA Analytics.

15
BCA RESEARCH INC. SPECIAL REPORT AUGUST 1, 2017
[email protected] • www.bcaresearch.com • Copyright © 2017 BCA Research Inc. All Rights Reserved. Refer to last page for important disclaimer.
increase cost of ownership by about $11,000. In other words it would take a cost reduction of around $14,750 (about 34%) of likely manufacturing cost before the cost of ownership would favor the Bolt in France after subsidies.
As noted above in our discussion of battery costs, GM expects a $2,700 cost saving associated with battery cells by 2022. Given that it is losing money on the vehicle, it is hard to believe they will immediately pass these savings on to the consumer. Even if they did, cost of ownership would still favor the ICEVs.
Brian Piccioni, Vice President Technology Sector Strategy [email protected]
Matt Conlan, Senior Vice President Energy Sector Strategy [email protected]
Robert P. Ryan, Senior Vice President Commodity & Energy Strategy [email protected]
Johanna El-Hayek, Research Assistant [email protected]

16
BCA RESEARCH INC. SPECIAL REPORT AUGUST 1, 2017
[email protected] • www.bcaresearch.com • Copyright © 2017 BCA Research Inc. All Rights Reserved. Refer to last page for important disclaimer.
RECOMMENDATIONS
S&P 500 TECHNOLOGY SUB-SECTOR
OVERWEIGHT NEUTRAL UNDERWEIGHT
INTERNET SOFTWARE & SERVICES
GOOGL - (11/24/15, +24.5%) FB - (11/24/15)
AABA - (11/24/15)
AKAM - (11/24/15)
VRSN, Q - (11/24/15)
SOFTWAREMSFT - (10/08/15, +61.1%)
CRM - (01/17/17, +20.8%)
EA - (05/24/16)
ATVI - (05/24/16)
ORCL - (10/8/15, -37.0%)
ADSK - (01/17/17, -41.8%)
TECHNOLOGY HARDWARE, STORAGE & PERIPHERALS
HPQ - (12/08/15)
HPE - (01/10/17)
WDC - (04/14/16, -111.1%)
AAPL - (01/19/16, -59.4%)
STX - (10/06/15, +19.6%)
IT SERVICES IBM - (04/19/16, -4.8%)
COMMUNICATIONS EQUIPMENT
JNPR - (08/23/16, +20.2%)
FFIV - (12/08/15, +17.7%)
HRS - (12/08/15, -40.3%)
MSI - (12/08/15, -35.8%)
CSCO - (03/28/17, +5.7%)
SEMICONDUCTORS AND SEMICONDUCTOR EQUIPMENT
SWKS - (05/31/16, +60.6%)
TXN - (12/22/15, +51.9%)
QRVO - (12/22/15, +31.7%)
MCHP - (12/22/15, +77.5%)
XLNX - (12/22/15, +39.5%)
MU - (10/06/15, +60.7%)
INTC - (12/22/15)
ADI - (12/22/15)
KLAC - (12/22/15)
AMAT - (05/31/16, -87.4%)
AVGO - (12/22/15, -76.7%)
NVDA - (12/22/15, -405.1%)
QCOM - (12/22/15, -13.8%)
ELECTRONIC INSTRUMENTS AND COMPONENTS
GLW - (09/06/16)
TEL - (02/02/16)
FLIR - (02/02/16)
APH - (09/06/16, -22.6%)
NON-S&P 500
RPD - (06/14/16, +13.0%)
CHKP - (06/14/16, +26.4%)
QLYS - (02/16/16, +84.8%)
FTNT - (02/16/16, +47.7%)
CYBR - (02/16/16, +22.4%)
TER - (12/22/15, +65.5%)
SIMO - (10/06/15, +50.0%)
SOXX ETF* (11/15/16, +29.3%)
VDSI - (06/14/16)
MTLS - (06/06/17)
PANW - (06/14/16, -2.7%)
FEYE - (02/16/16, -15.7%)
PFPT - (02/16/16, -111.9%)
ASML - (12/22/15, -72.6%)
IMPV - (02/14/17, +2.4%)
DDD - (06/06/17, +19.9%)
SSYS - (06/06/17, +11.8%)
* EQUALLY -WEIGHTED BASKET OF ON, MTSI, CRUS, IDTI, IPHI, MRVL , CY, CAVM , MSCC, AND MXL UNTIL APRIL 18, 2017. SOXX ETF AFTER.

17
SPECIAL REPORT AUGUST 1, 2017BCA RESEARCH INC.
[email protected] • www.bcaresearch.com • Copyright © 2017 BCA Research Inc. All Rights Reserved. Refer to last page for important disclaimer.
Closed RecommendationsCOMPANY S&P 500 SUBSECTOR RATING RECOMMENDATION DATE CLOSING DATE TOTAL
RETURN
SANDISK (SNDK)TECHNOLOGY HARDWARE, STORAGE & PERIPHERALS
OVERWEIGHT OCTOBER 06, 2015 OCTOBER 23, 2015 28.0%
WESTERN DIGITAL (WDC)TECHNOLOGY HARDWARE, STORAGE & PERIPHERALS
UNDERWEIGHT OCTOBER 06, 2015 OCTOBER 23, 2015 16.5%
HP ENTERPRISE (HPE)TECHNOLOGY HARDWARE, STORAGE & PERIPHERALS
OVERWEIGHT DECEMBER 08, 2015 JANUARY 10, 2017 53.0%
CORNING (GLW)ELECTRONIC INSTRUMENTS AND
COMPONENTSOVERWEIGHT FEBRUARY 02, 2016 SEPTEMBER 06, 2016 29.0%
VASCO DATA SYSTEMS (VDSI) NON-S&P 500 OVERWEIGHT FEBRUARY 16, 2016 JUNE 14, 2016 20.2%
LINEAR TECHNOLOGY (LLTC)SEMICONDUCTORS AND
SEMICONDUCTOR EQUIPMENTOVERWEIGHT DECEMBER 22, 2015 MARCH 10, 2017* 55.4%
SMALL SEMICONDUCTOR STOCKS**SEMICONDUCTORS AND
SEMICONDUCTOR EQUIPMENTOVERWEIGHT NOVEMBER 15, 2016 APRIL 18, 2017 13.1%
MATERIALISE (MTLS) NON-S&P 500 OVERWEIGHT OCTOBER 04, 2016 JUNE 06, 2017 63.6%
* ACQUISITION BY ANALOG DEVICES COMPLETED ON MARCH 10, 2017.** EQUALLY -WEIGHTED BASKET OF ON, MTSI, CRUS, IDTI, IPHI, MRVL , CY, CAVM , MSCC, AND MXL.
18
BCA RESEARCH INC. SPECIAL REPORT AUGUST 1, 2017
[email protected] • www.bcaresearch.com • Copyright © 2017 BCA Research Inc. All Rights Reserved. Refer to last page for important disclaimer.
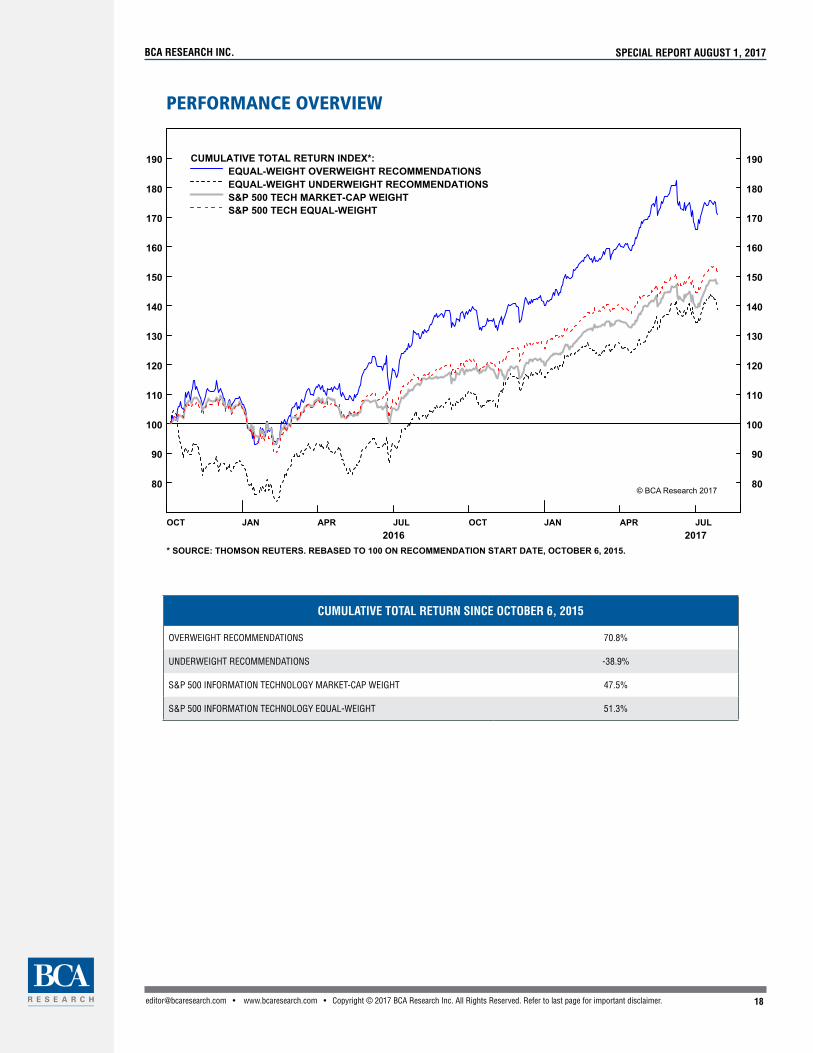
CUMULATIVE TOTAL RETURN SINCE OCTOBER 6, 2015
OVERWEIGHT RECOMMENDATIONS 70.8%
UNDERWEIGHT RECOMMENDATIONS -38.9%
S&P 500 INFORMATION TECHNOLOGY MARKET-CAP WEIGHT 47.5%
S&P 500 INFORMATION TECHNOLOGY EQUAL-WEIGHT 51.3%
PERFORMANCE OVERVIEW
190
180
170
160
150
140
130
120
110
100
90
80
2016 2017
190
180
170
160
150
140
130
120
110
100
90
80
OCT JAN APR JUL OCT JAN APR JUL
CUMULATIVE TOTAL RETURN INDEX*:EQUAL-WEIGHT OVERWEIGHT RECOMMENDATIONSEQUAL-WEIGHT UNDERWEIGHT RECOMMENDATIONSS&P 500 TECH MARKET-CAP WEIGHTS&P 500 TECH EQUAL-WEIGHT
* SOURCE: THOMSON REUTERS. REBASED TO 100 ON RECOMMENDATION START DATE, OCTOBER 6, 2015.
© BCA Research 2017

GLOBAL OFFICES
Head Office – Montreal, Canada1002 Sherbrooke Street West, Suite 1600Montreal, Quebec, Canada H3A 3L6TEL 1.800.724.2942 (514.499.9550)FAX 1.800.843.1763 (514.843.1763) London, U.K.29 Ludgate HillLondon, U.K. EC4M 7JRTEL +44 (0)207 556 6008FAX +44 (0)207 827 6413
New York, U.S.A.1120 6th Avenue6th FloorNew York, NY 10036TEL 212 224 3669FAX 212 224 3861
San Francisco, U.S.A. 580 California Street16th FloorSan Francisco, CA 94104 TEL 415 568 2123
Hong Kong38/F., Hopewell Centre 183 Queen’s Road EastWanchai, Hong KongTEL +852 2912 8055FAX +852 2842 7007
Sydney, AustraliaLevel 19, 1 O’Connell StreetSydney, AustraliaNSW 2000TEL +61 (02) 8249 1867 TEL +61 (02) 8249 1868FAX +61 (02) 8249 1800 Cape Town, South Africa7th Floor, Mandela Rhodes PlaceCnr of Wale and Burg StreetCape Town, 8001South AfricaTEL +27 21 403 6338
São Paulo, BrazilRua Tabapuã, 422 - 4°andar - conj. 43/44 - Cep: 04533001São Paulo - SP - BrazilTEL +55 11 3074 2656 MOBILE + 55 11 99484 5777
Dubai5th Floor, The PalladiumCluster CJumeirah Lake TowersDubai, UAEMOBILE +971 (0) 5430 58839
Copyright 2017, BCA Research Inc. All rights reserved.
The text, images and other materials contained or displayed on any BCA Research Inc. product, service, report, e-mail or web site are proprietary to BCA Research Inc. and constitute valuable intellectual property. No material from any part of any BCA Research Inc. web site may be downloaded, transmitted, broadcast, transferred, assigned, reproduced or in any other way used or otherwise disseminated in any form to any person or entity, without the explicit written consent of BCA Research Inc. All unauthorized reproduction or other use of material from BCA Research Inc. shall be deemed willful infringement(s) of BCA Research Inc. copyright and other proprietary and intellectual property rights, including but not limited to, rights of privacy. BCA Research Inc. expressly reserves all rights in connection with its intellectual property, including without limitation the right to block the transfer of its products and services and/or to track usage thereof, through electronic tracking technology, and all other lawful means, now known or hereafter devised. BCA Research Inc. reserves the right, without further notice, to pursue to the fullest extent allowed by the law any and all criminal and civil remedies for the violation of its rights.
Non-residents of Canada confirm that they do not, and have never had the right to use any of BCA Research Inc.’s materials in Canada, and agree that they have not and never will use any of the materials in Canada unless they acquire this right by paying the applicable Canadian and Quebec sales taxes. All unauthorized use of the materials in Canada shall be deemed willful infringement of BCA Research Inc. copyright and other proprietary and intellectual property rights.
While BCA will use its reasonable best efforts to provide accurate and informative Information Services to Subscriber, BCA cannot guarantee the accuracy, relevance and/or completeness of the Information Services, or other information used in connection therewith. BCA, its affiliates, shareholders, directors, officers, and employees shall have no liability, contingent or otherwise, for any claims or damages arising in connection with (i) the use by Subscriber of the Information Services and/or (ii) any errors, omissions or inaccuracies in the Information Services. The Information Services are provided for the benefit of the Subscriber. It is not to be used or otherwise relied on by any other person.
Some of the data contained in this publication may have been obtained from Bloomberg Barclays Indices; Bloomberg Finance L.P.; CBRE Inc.; CEIC data; First Bridge Data LLC; Copyright @ 2017, IHS Markit; MSCI Inc. Neither MSCI Inc. nor any other party involved in or related to compiling, computing or creating the MSCI Inc. data makes any express or implied warranties or representations with respect to such data (or the results to be obtained by the use thereof), and all such parties hereby expressly disclaim all warranties of originality, accuracy, completeness, merchantability or fitness for a particular purpose with respect to any of such data. Without limiting any of the foregoing, in no event shall MSCI Inc., any of its affiliates or any third party involved in or related to compiling, computing or creating the data have any liability for any direct, indirect, special, punitive, consequential or any other damages (including lost profits) even if notified of the possibility of such damages. No further distribution or dissemination of the MSCI Inc. data is permitted without MSCI Inc.’s express written consent. Real Capital Analytics Inc.; Reis Services LLC; S&P Capital IQ; Standard and Poor’s (“S&P”) Copyright © 2017 The McGraw-Hill Companies, Inc., S&P is a division of The McGraw-Hill Companies Inc. All rights reserved; or from THOMSON REUTERS, “The THOMSON REUTERS Kinesis Logo and THOMSON REUTERS are trademarks of Thomson Reuters and its af-filiated companies in the United States and other countries and used herein under license.” In addition to the foregoing, Client shall display or print the following notice in the Help About section or in a general attribution page. “Copyright © Thomson Reuters, 2017. All Rights Reserved. Use, duplication, or sale of this service, or data contained herein, except as described in the BCA Research products subscription agreement, is strictly prohibited.”
Important Disclaimer
This publication does not constitute an offer to sell any security, nor a solicitation of an offer to buy any security. Only a prospectus may be used to offer to sell or purchase securities, and a prospectus must be read and considered carefully before investing or spending money.
This publication is designed to provide information and analysis that BCA believes to be accurate, but it is published with the understanding that neither the author nor the publisher is rendering investment advice, nor offering individualized advice tailored to any specific portfolio or to any individual’s particular needs, nor offering professional services such as legal or accounting advice. Anyone needing assistance in areas that include investment, legal, and accounting advice should consult a competent professional’s services.
This publication may reference historical performance data. Past results do not guarantee future performance. Additionally, business conditions, laws, regulations, and other factors affecting performance all change over time, which could change the status of the information in this publication.
This communication reflects our analysts’ opinions as of the date of this communication and will not necessarily be updated as views or information change. BCA or its affiliated companies or their respective shareholders, directors, officers and/or employees, may have long or short positions in the securities discussed herein and may purchase or sell such securities without notice.
For important copyright, disclosure, disclaimer, and other information, including limitations on BCA’s liability, see our terms and conditions, available here: http://www.bcaresearch.com/copyright.