technological and cost-based comparison of next generation pon technologies: 10gpon...
TRANSCRIPT

1
Technological and cost-based comparison of next generation PON technologies: 10GPON and WDM PON
Chandan Bhagat, Kedar Raje, Rohit Shetye, Amit Vaity,
[email protected], [email protected], [email protected], [email protected],
A capstone paper submitted as partial fulfillment of the requirements for the degree of Masters in Interdisciplinary Telecommunications at the University of Colorado, Boulder, 2 May 2011. Project directed by Jose Santos.
1 Introduction
Since the arrival of bandwidth intensive applications such as IPTV, interactive HDTV and video-on-demand, Internet Service Providers have an urging need to provide high-speed broadband access to every Internet subscriber [1]. One of the long term goals of the National Broadband Plan proposed by the Federal Communications Commission (FCC) is to make America a “100 Megabit Nation” by the end of 2020 [2]. Fiber-to-the-Home (FTTH) is turning out to be a mainstream technology due to the exponential increase in bandwidth demanded by end users and its capability to provide such high speeds per customer, which is beyond the scope of current broadband access technologies [3]. Passive Optical Network (PON) based fiber access systems (a system that brings optical fiber cabling and signals to the end user) [4], due to their simplicity and cost-effectiveness, have been widely deployed in Asia, Europe and United States to provide FTTH to the end users [5]. However, to support higher bandwidth demands by end users in the future (up to 1Gbps), it is inevitable to upgrade the existing PON infrastructure to Next Generation PON (NGPON) technology involving 10GPON, 10G EPON and WDM PON which support much higher bandwidth than the existing PON technology [5].
Through this paper, we determine which Next Generation PON technology among 10GPON and WDM PON is most suitable for implementation in an area of 10000 SFUs through a technical and cost based analysis of both technologies. The paper is organized as follows: Section 2 describes the background of the FTTH technology and the different options available to deploy it, followed by the scope and assumptions in section 3. Further, in section 4, the results obtained through prior research done on 10GPON (ITU-T G.987.1 standard) [6] and WDM PON (Wavelength Division Multiplexed PON) are discussed in brief. Sections 5 and 6 briefly state the research problem and research question. Next, the architecture for 10GPON and WDM PON networks for the considered suburban area is illustrated in section 7. Section 8 describes the comparison methodology adopted in this research followed by a technical comparison between 10GPON and WDM PON based on factors like bandwidth, power consumption, network reach and splitting ratio in section 9. After this, a cost-based analysis of 10GPON and WDM PON is performed including respective cost of deployment and projected expenses for a 8 year period considering a 20% penetration rate. Finally, after the comparative analysis of the two

2
technologies, the NGPON that is technically superior and cost-effective to be deployed in that particular area is identified.
2 Background on FTTH
“Fiber to the home (FTTH) is the delivery of a communications signal over optical fiber from the operator’s switching equipment all the way to a home or business, thereby replacing existing copper infrastructure such as telephone wires and coaxial cable” [3]. FTTH networks can be Active Networks (those using active electronic components in the network) or Passive Networks (those using passive electronic components in the network). The use of Fiber Optics technology in the last mile networks was proposed during the late 80’s. However, commercial development of the technology was not started until the mid 90’s primarily due to several technical and economic barriers [5]. During this time, the Internet was just introduced and consumers were not utilizing it to its full potential, which also prevented them from paying high costs for broadband access [7]. Several trials were carried out in North America during the period of 1995 to 2000 in an attempt to introduce PON technology on a wide scale [5]. However, actual commercial deployment did not start until mid 2001, primarily due to the high costs for trenching fiber, unclear demand and regulatory approach [5]. Deployment of PON technology started with B-PON in 2002 with wide scale deployment in 16 different states of the United States [5]. Efforts were intensified following these deployments to improve the bandwidth speeds and reach for PON technologies. This resulted in the introduction of GPON technology (ITU-T G.984 standard) [8]–[10] supporting speeds of 1.25Gbps and a reach of 20 km being ready for wide scale deployment in 2007 [5]. Today, GPON has been the most successfully deployed PON technology in United States [5]. According to a report by the FTTH council, as of March 2010, Regional Bell Operating Companies or RBOCs (mainly Verizon and AT&T) have a 77% market share in deploying FTTH networks in the United States [11]. “Today, there is certainly much activity in the research community on next generation PON alternatives, including systems for future PON migration” [5]. The challenge lies in identifying the most ideal and sustainable NGPON technology for service providers to deploy given a particular area and that is the purpose of this research.
3 Scope and Assumptions
This paper is primarily concentrating on Next Generation PON (NGPON) technologies with a focus on 10GPON and WDM PON. The scope of this paper is only limited to the deployment and cost comparison of the 10GPON and WDM PON network infrastructure in an area where no previous fiber has been laid. This paper considers a hypothetical dense suburban area of 2.24km x 2.24km (5 sq.km) with about 10000 Single Family Homes or Units (SFUs) in the locality and develops a technical and cost based model assuming approximately 20% penetration within the first 6 years of deployment. This model could be used as a guideline during the actual deployment of NGPON technology.
The target audience for this paper includes Broadband Service providers providing Internet services, as they are the ones who will be investing in these NGPON technologies and will profit as the number of broadband subscribers increase. Also, the FCC, which is mandated by the Congress to develop regulations for promoting broadband deployment, will be interested in the findings of this paper. In addition to these, PON equipment manufacturers as well as end users

3
are the target audience here. Cost figures for the Customer Premise Equipment (set top boxes for IPTV and home networking equipment) are beyond the scope of this research and it is assumed here that consumers would purchase such devices or the broadband service providers would provide them when necessary.
4 Prior Work
Most of the previous research in this field has been concentrated on comparing a particular technical characteristic of 10GPON and WDM PON. A lot of effort has been put into identifying the dynamic bandwidth allocation, link utilization and reliability provided by these networks. However, no significant work has been done to compare these two technologies from a technical and economic perspective to identify the most cost effective and technically superior solution for deployment in a particular geographic area. Ling [7] have concentrated on identifying why 10GPON should be standardized and how WDM PON would be able to solve the ever-increasing bandwidth requirements. Hajduczenia and Da Silva [12] identified the current status of next generation PON technology and further made a comparison between them based on their ability to co-exist with current PON infrastructure. Vukovic [13] have compared 10GPON and WDM PON based on technical parameters. However, this comparison has failed to project the costs for actual deployment. A team of researchers involved in finding out the capital cost associated with deploying a 10G EPON network in a semi urban area [14] did not consider the cost projections and sustainability of the network infrastructure. Compared to these previous efforts, this paper develops a model, which could be used by other researchers to estimate the cost of a 10GPON or WDM PON deployment in a suburban area with 10000 SFU’s based on its specific characteristics. It also compares the technical specifications of these two technologies to support its cost analysis.
5 Research Problem
The average bandwidth consumption in United States is increasing at exponential rate and within the next 5 years, it is expected to reach 300 Mbps [19]. Considering such a high bandwidth requirement along with the necessity to support triple play services (voice, video and data) requires upgrading of existing PON network infrastructure. “As next generation PON systems emerge providing line rates of higher than 10Gbps” [5], the problem that Internet Service Providers are faced with is which next generation PON technology among 10GPON and WDM PON should be selected for implementation in their access networks.
6 Research Question
Which NGPON technology among 10GPON and WDM PON is the most cost-effective and technologically superior (based on various technical factors like bandwidth, architecture, network reach, splitting ratio and power consumption) for implementation in a limited service sub urban area of 10000 Single Family Units (SFUs)?
7 Architecture of 10GPON and WDM PON
Both, 10GPON and WDM PON essentially have an Optical Line Terminal (OLT) (“A device that terminates the common (root) endpoint of an ODN, implements a PON at the head-end or

4
central office, such as that defined by ITU-T G.984, and adapts PON PDU’s for uplink communications over the provider service interface”) [8]-[10] that generates the downstream optical feed and an ONT (“ONT or ONU is a device that terminates any one of the distributed (leaf) endpoints of an Optical Distribution Network, implements a PON protocol, and adapts PON PDU’s to subscriber service interfaces”) [8]-[10] at the customer premises which receives the optical signals. The only difference is that 10GPON has a passive optical splitter (“A device used in the PON to split the optical signal from one fiber to several fibers.”) [8] to split the bandwidth while WDM PON has an Arrayed Waveguide Grating filter (AWG) (“A passive optical device used in WDM PON networks which is located at a remote node and is used to separate the wavelength channels from OLT to ONT” [1].
7.1 10GPON Architecture
Figure 1: Architecture of 10GPON for 2048 subscribers considering only SFU ONT’s
At the head-end, there will be 2 OLTs with 8 Access Modules (AM) each. Each AM has four 10Gbps ports that can transmit 10Gbps bandwidth downstream and receive 2.5Gbps bandwidth upstream from subscribers. Each OLT also contains a System Controller Module (SCM) and a Switching Module (SM) for management functions and aggregation of traffic. A single level of splitting is considered where downstream bandwidth will be split among 32 subscribers by a POS. This gives each ONT 300Mbps downstream and 80Gbps upstream. Every home will be connected through SFU ONTs as a Customer Premise Equipment (CPE).

5
7.2 WDM PON Architecture
Figure 2: WDM PON Architecture considering only SFU ONTs
At the Central Office (CO), we have 2 OLTs each having 8 PON interfaces (also known as feeder lines) which support a bandwidth of 40 Gbps per PON interface. Each feeder line is connected to an AWG that has a splitting ratio of 1:32 i.e. each AWG can supports 32 different wavelengths. Every interface from the AWG has a unique wavelength and a bandwidth of 1.25 Gbps. It connects to a colorless ONT that has 4 ports which connects 4 different homes. Thus, we get 300 Mbps bandwidth per customer. From an architectural perspective, WDM PON provides more bandwidth per port on the OLT than 10GPON.
8 Methodology
For our analysis, a suburban area of high density with 10000 SFUs is considered and technical requirements for deploying 10GPON and WDM PON within that area are defined. This is done in terms of factors like bandwidth, splitting ratio, network reach and standardization. After this, the technical characteristics of both technologies are compared against this requirement. Further, the economic performance of both NGPON technologies for the same area is compared by calculating deployment cost, service provisioning cost and operational cost for a period of 8 years. Based on the results of the technical and economic analysis, we expect to find out the most suitable NGPON technology to be implemented in the suburban area.
9 Technical Requirements and Comparative Analysis
This section lists technological requirements for customers based on the suburban area of 10000 SFUs
Requirements for Services and Architecture:
1) Standardized Technology: The NGPON technology selected needs to be either standardized or must be in process of it. Selecting a standardized technology will provide important benefits such as interoperability, quality, and confidence in adoption of it by service providers as well as equipment vendors.

6
2) Splitter location and ratio: For a high-density area such as considered in this paper, the splitter needs to be placed “close to customers for it to be cost-effective because the shared fiber represents a larger percentage of the access-line length” [18]. Any split ratio below 1:32 will result in requirement of more splitters and inefficient utilization of fiber. Hence, the NGPON technology must support a minimum split ratio of 1:32.
3) Transport requirements a. Bit rate: Considering the bandwidth growth as mentioned in [19], the desired bit rate
is at least 300 Mbps downstream and 100 Mbps upstream. b. Reach: The area considered by us has a 20 Km radius, with OLT being 3Km away.
Based on the loss budget requirements defined previously, NGPON should have a minimum reach of 20Km.
c. Power Saving: In order to reduce the operational expenditure, power savings in the network has become an important design consideration [18]. Since this network is used for providing lifeline service such as voice, battery backup is required for support in case of power outage. However, in this paper we are not considering the cost of battery backup as ONT’s are placed inside the customer’s home. The requirement here is that the selected technology needs to be more power efficient.
The following table shows the comparison between 10GPON and WDM-PON in terms of many factors:
Table 1: Technical comparison of 10GPON and WDM PON
Parameters Requirement 10 GPON WDM PON
Standard Preferred ITU G.984 No standard
Maximum Downstream Line
Rate 300 Mbps/ home
10 Gbps shared
(320 Mbps/Home)
1.25 Gbps/channel
(1.25
Maximum Upstream Line Rate Min 100 Mbps 2.5 Gbps shared 1-10 Gbit/s per
channel
PON Splits Min 1:32 1:64 1:128
Reach Min 20 Km 20 Km 120 Km
Power Saving Less consumption 18W per OLT 7W per OLT

7
10 Cost Analysis of NGPON for a 10000 SFU suburban area
10.1 Cost Model
An important consideration when deploying any FTTH network is the cost involved in setting up the network and sustaining it over a period of time. Colle [20] have provided a framework for estimating the cost of an FTTH network, which we have also used for our calculations. According to their cost model, any FTTH network is comprised of the following 3 costs:
1) Capital Expenditure (67%) 2) Service Provisioning (24%) 3) Operational Expenditure (9%)
The below mentioned pie charts provide a clear picture of the various proportions involved:
Figure 3: Split up of costs for an FTTH network
1) Capital expenditure
The length of fiber to be deployed in the area is 121km (Appendix D) and the cost of trenching fiber (along with cost of fiber) is $50/m in a dense suburban area.
Total cost of fiber + fiber trenching = 121 x 1000 x 50 = $6.05 million
64%
24%
12%
Service Provisioning
CPE Equipments
Outdoor & Indoor Installa6on
Administra6on
50% 27%
23%
Equipment Deployment
OLT
Customer Driven(Chassis+rack+shelf)
Equipment Installa6on
39%
15%
6%
22%
9% 9%
Operational Cost Maintainance CPE
Maintainance inside Plant Maintainance outside Plant Opera6onal Planning
Marke6ng
Price and Billing
80%
20%
Capex
Fibre trenching
Equipment Deployment

8
2) Service provisioning
We are assuming that in the 0th year (the year when we will deploy and roll-out the network), there will not be any customers and all the time will be spent in laying the fiber infrastructure and equipment at the head-end or central office (OLT and modules). From the first year onwards, CPE will be provided, splitters will be installed along with inside and outside plant construction. As per our conversation with different PON vendors like Calix, Adtran, Huawei and Ericsson, the cost of CPE equipment is expected to drop 15% each year. Also, for customers, a variable take rate is considered and at the end of 5 years, there will be 20% penetration.
Table 2: Penetration rate and number of customer per year
Year1 Year 2 Year 3 Year 4 Year 5 Year 6 Year 7 Year 8
Penetration 2% 5% 9% 14% 20% 20% 20% 20%
Actual customers 200 500 900 1400 2000 2000 2000 2000
3) Operational Expenditure
Operational Expenses are incurred to keep the deployed network up and running and are directly proportional to the number of customers connected to our network.
We have considered the life of equipment as being 7 years and that of fiber as 10 years. For our analysis, we are focused on recovering equipment and fiber costs in 4 years and 8 years respectively with a 20% subscriber penetration rate.
10.2 10GPON cost analysis
10.2.1 Capital Expenditure
Appendix B shows the complete calculations for finding the cost of a 10GPON OLT. Accordingly, the OLT cost for ‘n’ subscribers in 10GPON is found out as:
10GPON OLT Cost = n/1024(Pc + Ps + Psw) + n/128(Pa), (1)
where ‘n’ is the number of customers, Pc = Price of OLT chassis, Ps = Price of SCM, Psw = Price of SM and Pa = Price of AM, n/1024 and n/128 is the next higher integer value
The total costs involved with the OLT for serving 2048 subscribers amount to $0.32 million, equipment deployment comes out to be $0.64 million and the cost associated with fiber is $6.05 million. Therefore, the capital expenditure for a 10GPON network solution is $6.69 million.

9
10.2.2 Service Provisioning and Operational Costs
Table 3: Service provisioning and Operational Costs for 10GPON
Year1 Year 2 Year 3 Year 4 Year 5 Year 6 Year 7 Year 8
ONT Cost $80,000 $170,000 $265,500 $350,000 $440,000 $0 $0 $0
Service Provisioning $125,000 $265,625 $414,844 $546,875 $687,500 $0 $0 $0
Operational Cost $89,866 $224,665 $404,397 $629,062 $898,660 $898,660 $898,660 $898,660
To achieve the goal of recovering equipment cost in 4 years and the capital cost in 7 years, we have to charge $104 per customer. Our cost curves look as shown in the following graph:
Figure 4: Cost curves for a 10GPON solution
10.3 WDM-PON network design with cost
10.3.1 Capital Expenditure
Appendix C shows the detailed calculations for finding the cost of a WDM PON OLT. From this, we get:
WDM PON OLT cost = n/512(3Pc + 2Ps + 2Psw) + n/64(1.75Pa) (2)
0 1 2 3 4 5 6 7 8
2011 2012 2013 2014 2015 2016 2017 2018 2019
Cos
t (in
Mill
ions
of U
S $)
Year
10GPON Cost Analysis
Equipment Cost
Fiber Trenching
CAPEX
Cost Recovery
10
Therefore, total cost for OLT deployment for 2048 subscribers is $1.14 million, equipment deployment amounts to $2.28 million and the capital cost including the fiber comes out to be $8.33 million.
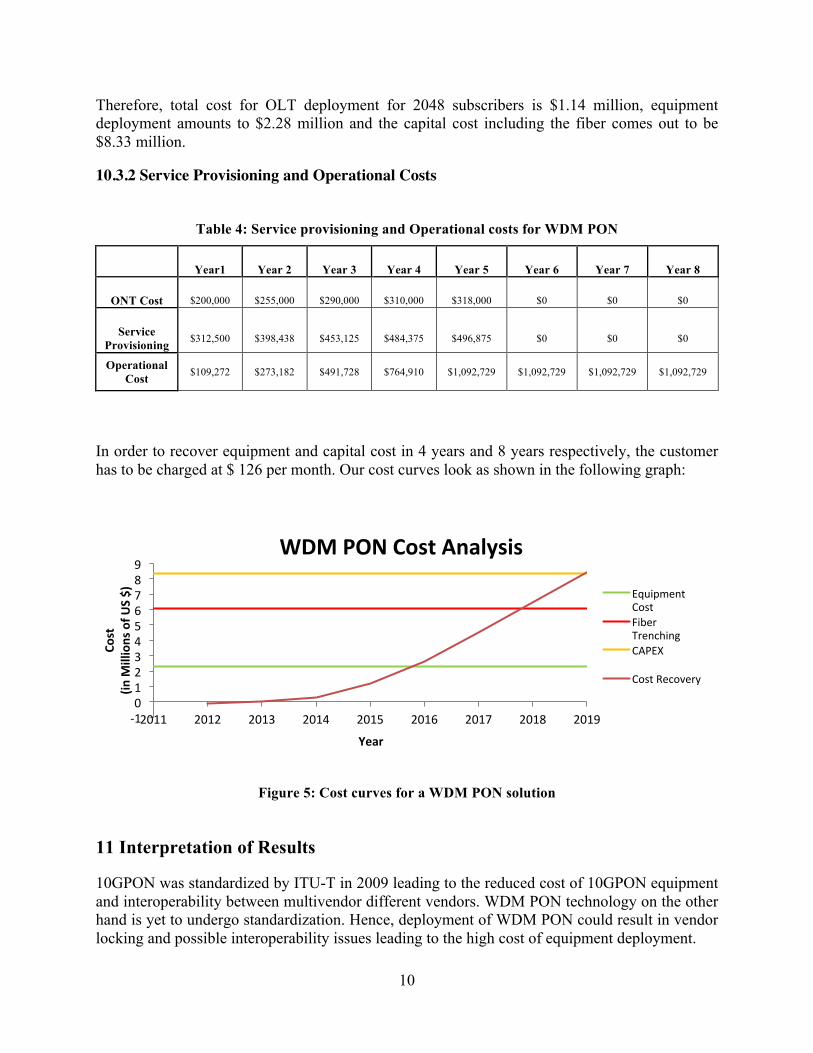
10.3.2 Service Provisioning and Operational Costs
Table 4: Service provisioning and Operational costs for WDM PON
Year1 Year 2 Year 3 Year 4 Year 5 Year 6 Year 7 Year 8
ONT Cost $200,000 $255,000 $290,000 $310,000 $318,000 $0 $0 $0
Service Provisioning $312,500 $398,438 $453,125 $484,375 $496,875 $0 $0 $0
Operational Cost
$109,272
$273,182 $491,728 $764,910 $1,092,729 $1,092,729 $1,092,729 $1,092,729
In order to recover equipment and capital cost in 4 years and 8 years respectively, the customer has to be charged at $ 126 per month. Our cost curves look as shown in the following graph:
Figure 5: Cost curves for a WDM PON solution
11 Interpretation of Results
10GPON was standardized by ITU-T in 2009 leading to the reduced cost of 10GPON equipment and interoperability between multivendor different vendors. WDM PON technology on the other hand is yet to undergo standardization. Hence, deployment of WDM PON could result in vendor locking and possible interoperability issues leading to the high cost of equipment deployment.
-‐1 0 1 2 3 4 5 6 7 8 9
2011 2012 2013 2014 2015 2016 2017 2018 2019
Cost
(in M
illions of U
S $)
Year
WDM PON Cost Analysis
Equipment Cost Fiber Trenching CAPEX
Cost Recovery

11
As far as bandwidth requirements are concerned, even though WDM PON provides higher and symmetrical bandwidth, both technologies satisfy the bandwidth requirement for the considered area.
10GPON technology has a network reach of 20 km whereas WDM PON technology supports network reach of about 40 km. In the case of a suburban area considered in this paper, both technologies support the required network reach. However, in the case of more diverse area requiring longer reach, WDM PON is the only possible solution in spite of its higher deployment costs.
10GPON consumes 18W per OLT, 11W more than that of WDM PON, which consumers 7 W per OLT [17]. This results into a saving of approximately 96,000 watt-hours per year. Considering a rate of 12 cents/hour, the total cost saving is around $20,000 per year per OLT. This amount is approximately 3% of total operational expenditure for WDM PON deployment. Hence, this power saving is less significant in the case of a dense suburban area similar to the one mentioned in this paper. For a larger area with more subscribers and more OLT’s, this power saving could be significant as compared to operational expenditure.
From the cost analysis of 10GPON and WDMPON, it is found that WDM PON has high initial investment costs as compared to 10GPON and this is directly proportional to the increase in the number of customers ‘n’. For recovering equipment costs in 4 years and capital costs in 8 years, a WDM PON subscriber has to pay 1.21 times as much money per month as a 10GPON subscriber for the same amount of bandwidth making 10GPON a cheaper alternative to WDM PON for a service provider as well as the subscriber in a dens suburban area of 10000 SFUs.
11 Conclusion
The primary aim of this paper was to identify the most suitable technology between 10GPON and WDM PON in an area of 10000 SFUs. Based on the technical comparisons done, it is shown that WDM PON technology has longer network reach, provides higher bandwidth per ONT and has low power consumption as compared to 10GPON. In spite of these advantages, 10GPON satisfies all the technical requirements for the area under consideration. Moreover, cost analysis illustrates that WDM PON service would cost consumer 1.21 times as much money as 10GPON service. Therefore, considering both the technical and cost analysis, we conclude that 10GPON is the most scalable and cost effective solution for the area under consideration.

12
References [1] A. Banerjee et al., “Wavelength-division multiplexed passive optical network (WDM-PON) technologies for broadband access-A review [Invited],” OSA J. Opt. Netw. Special Issue Optical Access Networks, vol. 4, no. 11, pp. 737–758, Nov. 2005.
[2] National Broadband Plan: Connecting America. (2010, March 15). Goals and action items. [Online] Available: http://www.broadband.gov/plan/goals-action-items.html
[3] FTTH: Fiber-to-the-Home council. (n.d). What is fiber to the home? [Online] Available: http://www.ftthcouncil.org/en/content/what-is-fiber-to-the-home
[4] G. Kramer, Ethernet Passive Optical Networks. New York: McGraw-Hill, 2005.
[5] F. Effenberger, K. McCammon, and V. O’Byrne, “Passive optical network deployment in North America [Invited],” J. Opt. Netw, vol. 6, pp. 808-818, July 2007.
[6] ITU-T Recommendation G.987.1, “10Gigabit-capable Passive Optical Networks (XG-PON): General requirements,” 2009.
[7] C. Ling, S. Dahlfort, and D. Hood, “Evolution of PON: 10GPON and WDM PON,” Communications and Photonics Conf., Shanghai, 2010, pp. 709.
[8] ITU-T Rec. G.984.1, “Gigabit-capable Passive Optical Networks (GPON): General characteristics”, ITU-T, March 2003.
[9] ITU-T Rec. G.984.2, “Gigabit-capable Passive Optical Networks (GPON): Physical Media Dependent (PMD) layer specification”, ITU-T, March 2003.
[10] ITU-T Rec. G.984.3, "Gigabit-capable Passive Optical Networks (GPON): Transmission Convergence Layer Specification," Oct. 2003.
[11] FTTH: Fiber-to-the-Home council, (April, 2009). “Fiber-to-the-Home: North American Market Update” [Online] Available: http://s.ftthcouncil.org/files/RVA.FTTH_.Apr09.060109.pdf
[12] M. Hajduczenia, and H. da Silva, “Next Generation PON Systems - Current Status,” Int. Conf. Transparent Optical Networks., France., 2009, pp. 1
[13] A. Vukovic, K. Maamoun, and H. Hua et al., “Performance characterization of PON technologies,” Journal of Lightwave Technology, vol. 23, no. 1, pp. 236-246, 2005
[14] G. Chheda., N. Bandla., P. Mishra., S. Reddy, “ Gigabit to the Desktop,” unpublished.
[15] IEEE 802.3ah, “IEEE Standard for Local and Metropolitan Area Networks - Specific requirements - Part 3: Carrier Sense Multiple Access With Collision Detection (CSMA/CD) Access Method and Physical Layer Specifications Amendment: Media Access Control Parameters, Physical Layers, and Management Parameters for Subscriber Access Networks”, IEEE, 2004.
[16] T. Rokkas, D. Katsianis, and T. Kamalakis et al., “Economics of time and wavelength domain multiplexed passive optical networks,” Journal of Optical Networking, vol. 2, no. 12, pp. 1042-1051, Nov. 2010.
[17] K. Grobe, M. Roppelt, and A. Autenrieth et al., “Cost and Energy Consumption Analysis of Advanced WDM-PONs,” IEEE Communications Magazine, vol. 49, no. 2, pp. s25-s32, Feb 2011.
[18] H. Kim, S. Kang, and C. Lee, “A low cost WDM source with an ASE injected Fabry-Pérot semiconductor laser,” IEEE Photon. Technol. Lett, vol. 12, pp. 1067–1069, Aug. 2000.
[19] A. Marshall, “Future Bandwidth requirements for subscriber and visitor based networks,” unpublished.
[20] D. Colle, K. Casier, and M. Pickavet et al., “A clear and balanced view on FTTH deployment costs,” The Journal of the Institute of Telecommunications Professionals, vol.2, no. 3, pp. 27-30, 2008.
[21] D. Lavery, M. Ionescu, and S. Makovejs et al., “A long-reach ultra-dense 10 Gbit/s WDM-PON using a digital coherent receiver,” Optics Express, vol. 18, no. 25, pp. 25855-25860, Dec. 2010.

13
Appendix A
Next Generation PON Architecture
10GPON General Architecture
Figure: Architecture of a 10GPON Network
According to ITU-T Rec. G.987.1, the network infrastructure of 10GPON primarily consists of an Optical Line Terminal (OLT), Optical Network Terminal (ONT) and Passive Optical Splitters (POS). The OLT is situated in the Central Office of the service provider and generates the main optical feed. This signal is then transmitted through the POS which splits the signal into N number of shares where N can be anywhere between 4 to 128 [5]. The signal that is split by the splitter is then transmitted towards the ONT, which is located at the customer premise. 10GPON supports a bit rate of 10 Gbps downstream and 2.5 Gbps upstream [6]. The transmission is based on time division multiplexing (TDM) where each ONT transmits in a particular timeslot.
WDM PON General Architecture
Figure: Architecture of a WDM-PON network
WDM PON helps to deliver higher bandwidth by separating users based on the wavelengths of an optical signal. The architecture of WDM PON is similar to 10GPON. It has an OLT at the

14
central office and an ONT located at the customer’s premises. The POS is replaced by an arrayed waveguide grating filter (AWG). Each ONT is tuned to a separate wavelength and has a transceiver to transmit and receive at a particular wavelength [16]. The OLT has a multiple wavelength source that can transmit different wavelengths for each ONT [1]. The AWG has a property called as periodicity with which it can aggregate different wavelengths and send it to the OLT or it can route a specific wavelength back to a specific ONT [1].
Appendix B
Formula for calculating 10GPON OLT cost
Let ‘n’ be the number of customers, Pc = Price of OLT chassis, Ps = Price of SCM, Psw = Price of SM and Pa = Price of AM
One AM supports 32 x 4 = 128 subscribers; One OLT supports 128 x 8 = 1024 subscribers
No. of OLT’s required for ‘n’ subscribers = n/1024 = No. of SM = No. of SCM
No. of AM required for ‘n’ subscribers = n/128
10GPON OLT Cost = n/1024(Pc + Ps + Psw) + n/128(Pa),
where n/1024 and n/128 is the next higher integral value
For our analysis, Pc = $5000, Ps = $10000, Psw = $25000, Pa = $15000
Therefore, OLT cost for 10GPON for 2048 subscriber = $320000
Appendix C
Formula for calculating WDM PON OLT Cost
Let ‘n’ be the number of subscribers for a WDM PON network solution. Each PON interface can support 128 customers (32 x 4) with a 1:32 splitting ratio. Therefore, each OLT can support 8 x 128 = 1024 subscribers. Moreover, from conversations with various WDM PON vendors, we found:
Price of OLT chassis for WDM PON = 3 x Price of 10GPON OLT Chassis
Price of WDM PON Interface Cards = 1.75 x Price of 10GPON AM
Price of Maintenance Control Card = 2 x Price of 10GPON SCM
Price of Switch & Network Interface (SW/NI) = 2 x Price of 10GPON SM
WDM PON OLT cost = n/512(3Pc + 2Ps + 2Psw) + n/64(1.75Pa)
From this formula, WDM PON OLT cost for 2048 subscribers = $1,140,000
15
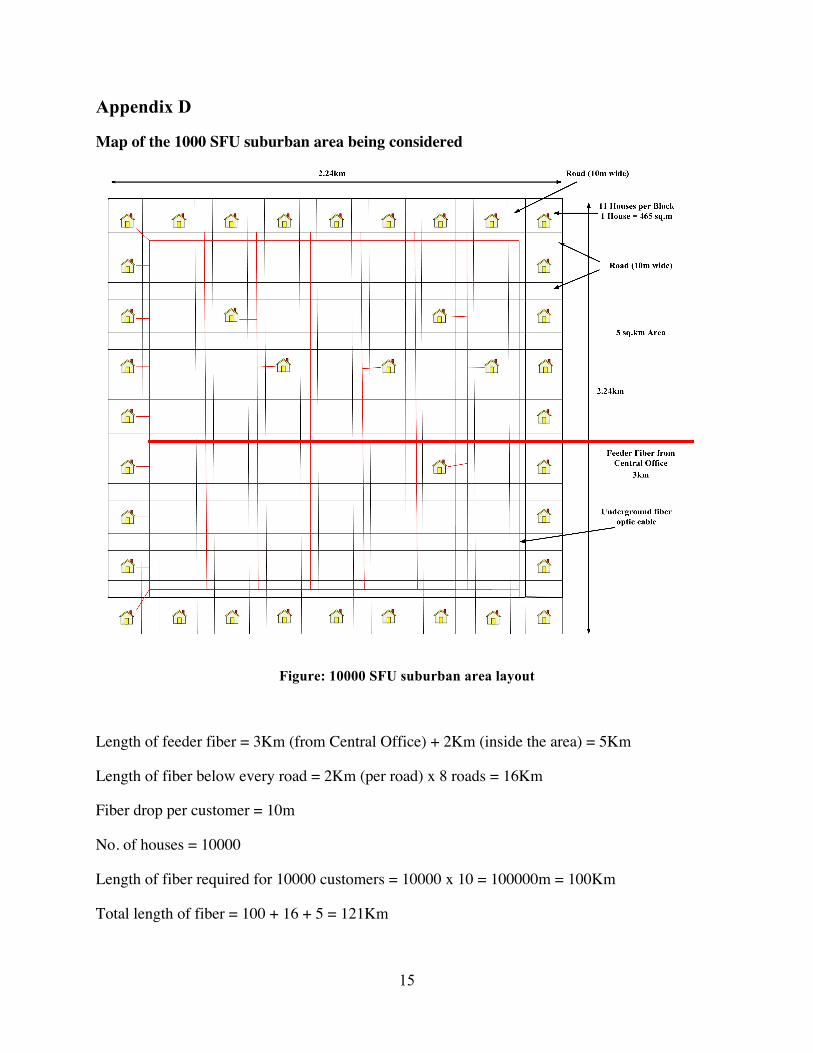
Appendix D
Map of the 1000 SFU suburban area being considered
Figure: 10000 SFU suburban area layout
Length of feeder fiber = 3Km (from Central Office) + 2Km (inside the area) = 5Km
Length of fiber below every road = 2Km (per road) x 8 roads = 16Km
Fiber drop per customer = 10m
No. of houses = 10000
Length of fiber required for 10000 customers = 10000 x 10 = 100000m = 100Km
Total length of fiber = 100 + 16 + 5 = 121Km