techno-economic feasibility of pv-wind-diesel-battery...
TRANSCRIPT
162
AMSE JOURNALS-AMSE IIETA publication-2017-Series: Modelling A; Vol. 90; N°2; pp 162-182
Submitted Mar. 10, 2017; Revised Apr. 28, 2017; Accepted May 10, 2017
Techno-Economic Feasibility of PV-wind-diesel-battery Hybrid
Energy System in a Remote Island in the South China Sea
*Jiaxin Lu, **Weijun Wang, ***Yingchao Zhang, ****Sheng Ye
*Department of Electrical Engineering, Army Logistics University of PLA, Chongqing 401331,
China
**Department of Electrical Engineering, Army Logistics University of PLA, Chongqing 401331,
China ([email protected])
***Department of Electrical Engineering, Chongqing Communication Institute, Chongqing
400035, China
****Department of Electrical Engineering, Army Logistics University of PLA, Chongqing
401331, China
Abstract
This paper explores the techno-economic feasibility of renewable power generation in a
remote South China Sea island, seeking to substitute the existing diesel generator with a PV-wind-
diesel-battery hybrid energy system (HES). First, the authors assessed the availability of local
renewable energy resources, elaborated the dispatch strategy of the HES, and introduced the load
curve, system configuration, techno-economic specifications of the major components. Then, the
Hybrid Optimization of Multiple Energy Resources (HOMER) software was employed to simulate
and optimize the HES. In order to identify the optimal configuration of the system, different
combinations of the HES were simulated before comparing the economic and operation
information of the feasible alternatives. Through the simulation and optimization, it is concluded
that the HES can provide sufficient and reliable power to the study area. Finally, the economic and
resources sensitivity analysis was performed to identify how the optimal design is to change with
the sensitivity variables.
Key words
Hybrid energy system, Techno-economic feasibility, Hybrid Optimization of Multiple Energy
Resources (HOMER).
163
1. Introduction
As a major coastal country, China holds a vast sea area of about 3,400,000km2, dotted with
6,500 islands greater than 500m2 [1]. Since “building a maritime power” became a national strategy
in late 2012 [2], China has embarked on developing remote islands, particularly those located in
the South China Sea.
With the gradual perfection of the infrastructure, electrical demand in remote islands also grow
rapidly. However, due to geographic inaccessibility, it is impossible to supply power to these areas
via conventional grid. Most of these islands have to rely on the stand-alone power supply system
(SPSS), which is mainly composed by diesel generator [3]. The SPSS generates power by
continuous burning of fossil fuel, creating massive emission of greenhouse gases. What is worse,
the shipment of fuel is often delayed or cut off by the perilous weather conditions, not to mention
the global shortage of fossil fuel.
A possible solution to the energy blight lies in the abundance of renewable energy resources,
as most of the remote islands are located in the equatorial belt [4, 5]. In this regards, introducing
fuel free alternative power generation system based on renewable energy cannot only tackle the
aforementioned environmental problems, but also meet the growing electrical demand in the future
[6]. However, in contrast to diesel generators, the power output of renewable energy system (RES)
is highly dependent on the atmospheric condition, leading to an unpredictable fluctuation of energy
production, which severely affects the stability and security of power supply [7]. This gives birth
to the hybrid energy system (HES), which realizes more consistent power supply through the
optimal integration of the RES with conventional energy system and energy storage system [8].
The superiority of the HES over conventional energy systems has been validated by a number of
recent studies [9-11].
Abdullah et al. [12] suggested that the HES offers a much more reliable and sustainable
electricity supply plan than the stand-alone PV system for rural tech centers during prolonged
cloudy and dense haze weather. Chauhan and Saini [13] analyzed the techno-economic feasibility
of micro hydropower (MHP)-biomass-biogas-wind-solar-battery hybrid system for an isolated area
in India, and compared the HES with each system based on a single energy against the economic,
technical and social criteria. The results show that the HES is undoubtedly the best choice, featuring
the least net present cost, levelized energy cost, the smallest battery storage, and the greatest
employment potential. Through simulation and comparison, Nema et al. [14] observed that the
HES reduced nearly 80% of the fuel consumption, CO2 emission, and harmful gas exhaust from

164
those of the conventional diesel-powered system, indicating that the HES is an environmentally
friendly power solution to cope with climate change and environmental pollution. Patil et al. [15]
looked for the optimal sizing of an integrated RES in four different scenarios, it was found that
MHP-biomass-biogas-PV-energy plantation-wind turbine based configuration, which containing
the most various types of renewable energy resources had the lowest cost of energy and was
considered as the most cost-effective option for power supply. Sinha and Chandel [16] concluded
that the HES outperforms single resource-based system in reliability, efficiency, energy storage,
and levelized energy cost. Sigarchian et al. [17] found that the HES with biogas engine boasts
cheaper energy cost and lower CO2 emission than that with diesel engine.
For the reliability and cost-effectiveness of the HES, the sizing of the system must be
determined in light of resource availability and electrical demand [18, 19]. Several softwares have
been developed for the design and assessment of the HES [20]. In this research, the Hybrid
Optimization of Multiple Energy Resources (HOMER) software is adopted to analyze the techno-
economic feasibility and achieve the optimal design of the proposed system. Originally created by
National Renewable Energy Laboratory (NREL), HOMER is widely recognized as a powerful tool
for simulation, optimization and sensitivity analysis [21]. To the authors’ knowledge, there are few
comprehensive studies on the HES development in China’s remote islands. Therefore, this paper
mainly aims to examine the techno-economic feasibility of the HES in the study area, Yongxing
Island, and find the optimal HES design for reliable, sustainable and cost-effective power supply.
The research starts with the availability assessment of local renewable energy resources.
Subsequently, the authors elaborated the dispatch strategy of the HES, and introduced the load
curve, system settings and techno-economic specifications of the major components. Then, the
HOMER software was employed to identify the optimal scale of the system. Finally, the sensitivity
analysis was performed to identify how the optimal design responds to the sensitivity variables.
2. Overview of Study Area
2.1 Location
Yongxing Island (16°50′3″N, 112°20′15″E) was taken as the representative of the remote
islands in the South China Sea. As shown in Fig.1, the tiny island (2.6 km2) is separated from the
Chinese mainland by a distance of about 339km. As the center of Sansha City, the island has shops,
hostels, a hospital, a post office and even an airport. In 2012, there were about 1,000 residents
living on the island. The flat terrain makes the island an ideal local for PV and wind farms.

165
Fig.1. Location of Yongxing Island
2.2 Load Curve
The typical daily load curve of Yongxing Island was obtained from the energy management
system (EMS) of the current power system. As shown in Fig.2, the load curve remains in the
vicinity of 500kW from 0:00a.m. to 6:00a.m., accounting for 50% of the total capacity of the
system. This is because many air-conditioners works around the clock under the high annual
average temperature (26.1 ℃); since the working hours start at 8:00a.m. and end at 6:00 pm, the
power demand grows in the morning and stays at high levels in the afternoon; the load curve peaks
at 7:00p.m. when most residents return home and turn on lights, water heaters and air-conditioners.
Fig.2. Typical Daily Load Curve of Yongxing Island
0
200
400
600
800
1000
1200
0:0
0
1:0
0
2:0
0
3:0
0
4:0
0
5:0
0
6:0
0
7:0
0
8:0
0
9:0
0
10
:00
11
:00
12
:00
13
:00
14
:00
15
:00
16
:00
17
:00
18
:00
19
:00
20
:00
21
:00
22
:00
23
:00
Lo
ad (
kW
)
Hour
166
3. Assessment of Renewable Energy Resources
As mentioned above, HES is a proper, green power supply solution to remote islands by
optimal combination of renewable energy resources. Hence, it is critical to evaluate the availability
of renewable energy resources in the early phase of system design [22]. In this chapter, the potential
of solar energy and wind energy of Yongxing Island is evaluated based on meteorological data
obtained from NASA atmospheric database [23].
3.1 Solar Energy
3.1.1 Monthly Average Solar Irradiance
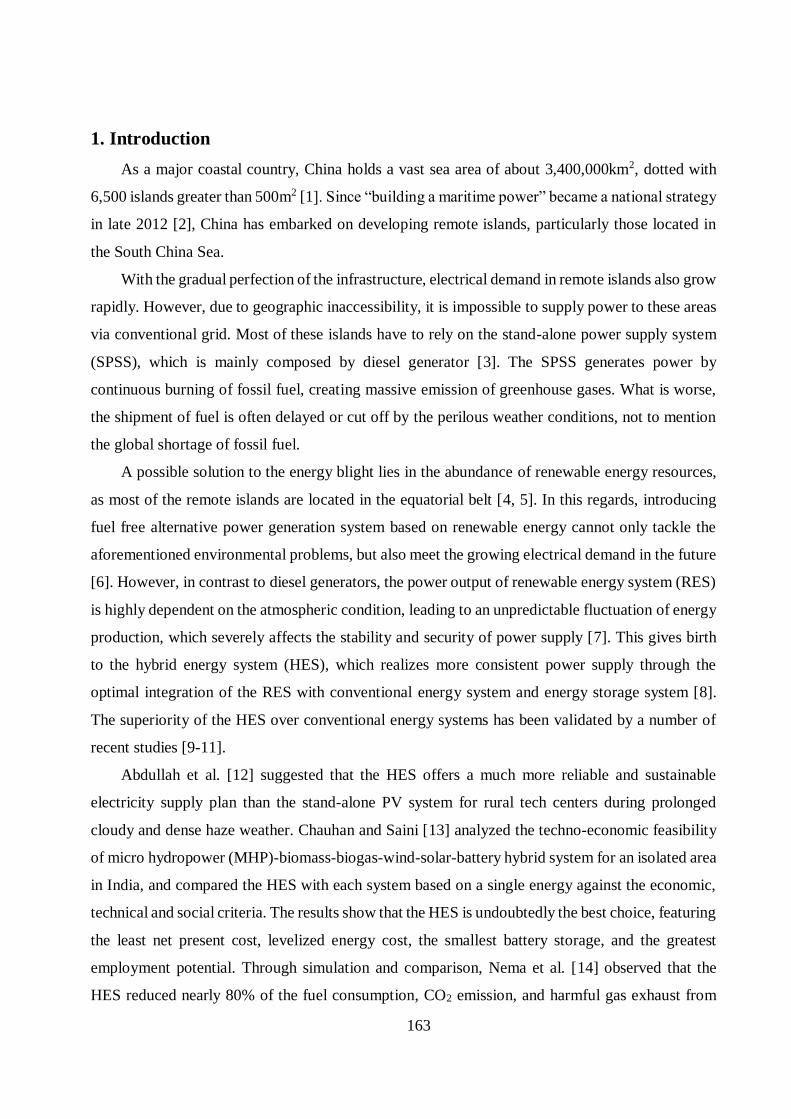
Fig.3 illustrates the monthly average solar irradiance of the study area. Located in the
equatorial belt, Yongxing Island is exposed to intense solar irradiance all year around. The
irradiance increases steadily from January to March until reaching the peak at 6.92kWh/m2/day in
April. Then, it gradually decreases to the lowest point of 3.91kWh/m2/day in December. It is worth
mentioning that the annual average solar irradiance is averaged at 5.57kWh/m2/day, more than any
other sunny city in China, such as Lhasa (5.53kWh/m2/day) and Lanzhou (4.43kWh/m2/day).
Fig.3. Monthly Average Solar Irradiance of Yongxing Island
3.1.2 Total Solar Irradiance
The total solar irradiance (TSI), defined as the sum of irradiance in a whole year, can be
calculated with the following equation:
0
1
2
3
4
5
6
7
Jan Feb Mar Apr May Jun Jul Aug Sep Oct Nov Dec
Dai
ly s
ola
r ir
rad
iance
(kW
h/m
2/d
ay)
Month

167
12
1
total i i
i
E E N
(1)
where Etotal is the TSI (kWh/m2/year); Ei
is the monthly average solar irradiance (kWh/m2/day); Ni
is the number of days in each month; i is the number of each month. By this equation, the TSI of
Yongxing Island is calculated as 2,032 kWh/m2/year.
According to the Assessment Method for Solar Energy Resources (QX/T 89-2008) issued by
China Meteorological Administration [24], the TSI is the most important criterion for solar power
classification (Table 1). In view of the abundant solar resource, large-scale solar energy system is
very suitable for Yongxing Island.
Tab.1. Solar Power Classification.
Solar power class Potential Total solar irradiation (kWh/m2/year)
1 Very good >1850
2 Good 1750-1850
3 Fair 1400-1750
4 Poor <1400
3.2 Wind Energy
3.2.1 Monthly Average Wind Speed
Thanks to the East Asian monsoon, Yongxing Island is blessed with a good potential in wind
energy [25]. The monthly average wind speed of the island stands at 10m above the Earth’s surface
(Fig.4), and the annual average wind speed is 6.23m/s. Moreover, the wind speed varies from the
southwest monsoon (SWM) season and the northeast monsoon (NEM) season in the range of
4.12m/s~9.05m/s. The SWM lasts from April to September, and the NEM lasts from October to
the next March.

168
Fig.4. Monthly Average Wind Speed at 10m Above the Earth’s Surface of Yongxing Island
3.2.2 Wind Speed Probability Distribution
The wind speed probability distribution is an important indicator of the statistical
characteristics of wind energy [26]. In this paper, the two-parameter Weibull probability density
function is adopted with the following equation:
1
exp
k kk v v
f vc c c
(2)
where f(v) is the probability of wind speed at v; k is the shape factor, a determinant of the shape of
the density curve; c is the scale factor correlated to the average wind speed.
For proper selection of wind turbine, it is imperative to know the wind speed probability less
than or equal to a particular wind speed. Hence, the Weibull cumulative distribution function
should be obtained by taking the integral of probability density function:
1 exp
kv
F vc
(3)
In this research, the Weibull shape and scale factors are calculated by the Wind Energy
Resource Analysis (WERA) software [27]. According to the monthly average wind speed in the
given time (Table 2), the shape and scale factors of the Weibull distribution were obtained as
k=4.56 and c=6.76, respectively.
Tab.2. Monthly Average Wind Speed in Indicated Time
0
2
4
6
8
10
Jan Feb Mar Apr May Jun Jul Aug Sep Oct Nov Dec
Win
d s
peed
(m
/s)
Month

169
Time
(GMT)
Wind speed (m/s)
Month
Jan Feb Mar Apr May Jun Jul Aug Sep Oct Nov Dec
1:30 7.58 6.14 5.36 4.49 3.76 5.17 4.68 5.23 4.07 6.64 8.37 8.32
4:30 7.35 5.97 5.21 4.42 3.72 4.94 4.53 4.95 3.96 6.49 8.06 8.00
7:30 7.06 5.76 5.10 4.43 3.80 4.82 4.40 4.76 3.97 6.52 7.90 7.80
10:30 7.26 5.96 5.25 4.46 3.80 4.80 4.28 4.65 4.17 6.87 8.22 8.08
13:30 7.73 6.34 5.47 4.51 3.79 4.86 4.34 4.72 4.32 7.12 8.69 8.56
16:30 7.82 6.41 5.59 4.65 3.93 5.16 4.62 5.10 4.29 6.90 8.61 8.56
19:30 7.61 6.12 5.42 4.48 3.89 5.44 4.91 5.49 4.20 6.64 8.37 8.32
22:30 7.53 6.07 5.31 4.42 3.78 5.37 4.90 5.50 4.15 6.56 8.30 8.40
3.2.3 Wind Power Density
The wind power density is the best criterion for the assessment of wind resource potential [28].
Based on the Weibull probability density function, the wind power density can be calculated as
below:
3 3
0
1 1 31
2 2P v f v dv c
k
(4)
where P is the wind power density (W/m2); ρ is the air density (kg/m3); Γ is the gamma function.
With the shape and scale factors obtained earlier, the wind power density was calculated to be
179.6W/m2.
In accordance with the Methodology of Wind Energy Resource Assessment for Wind Farm
(GB/T 18710-2002), the wind power is divided into 7 classes by the annual average wind speed
and the wind power density (Table 3) [29].
Tab.3. Wind Power Classification at 10m Above the Surface.
Wind power class Potential Wind power density
(W/m2)
Annual average wind speed
(m/s)
1 Poor <100 4.4
2 Marginal 100-150 5.1
3 Moderate 150-200 5.6
4 Good 200-250 6
5 Excellent 250-300 6.4
6 Excellent 300-400 7
170
7 Excellent 400-1000 9.4
According to the classification standard, Yongxing Island falls to the moderate class of wind
power density, making it reasonable to set up a small-scale wind power system on the island.
4. Description of the Proposed Hybrid Energy System
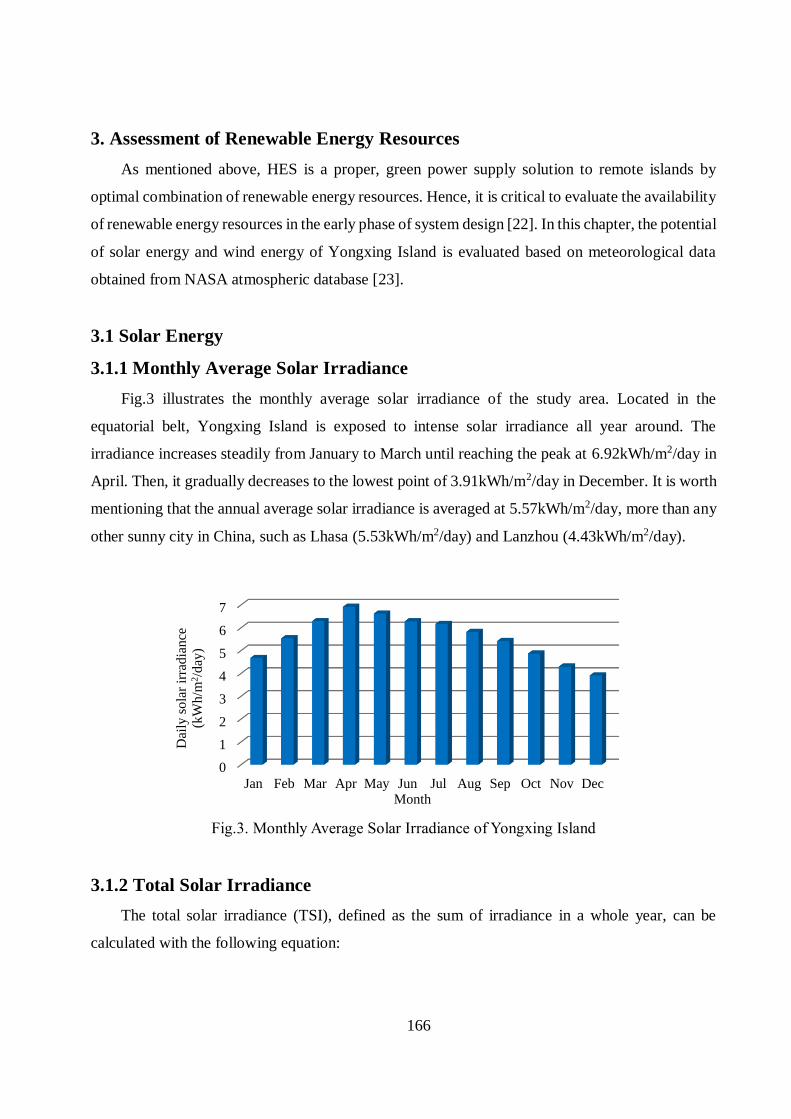
In the proposed HES (Fig.5), the distributed generators (e.g. PV panel, wind turbine and diesel
generator) are connected to the AC bus, the battery bank is placed in a separate DC bus, and the
AC and DC buses are interconnected via an AC/DC bidirectional converter. The detailed techno-
economic specifications of each component are presented in the following sections.
Fig.5. System Configuration of the Proposed HES
4.1 Major Components
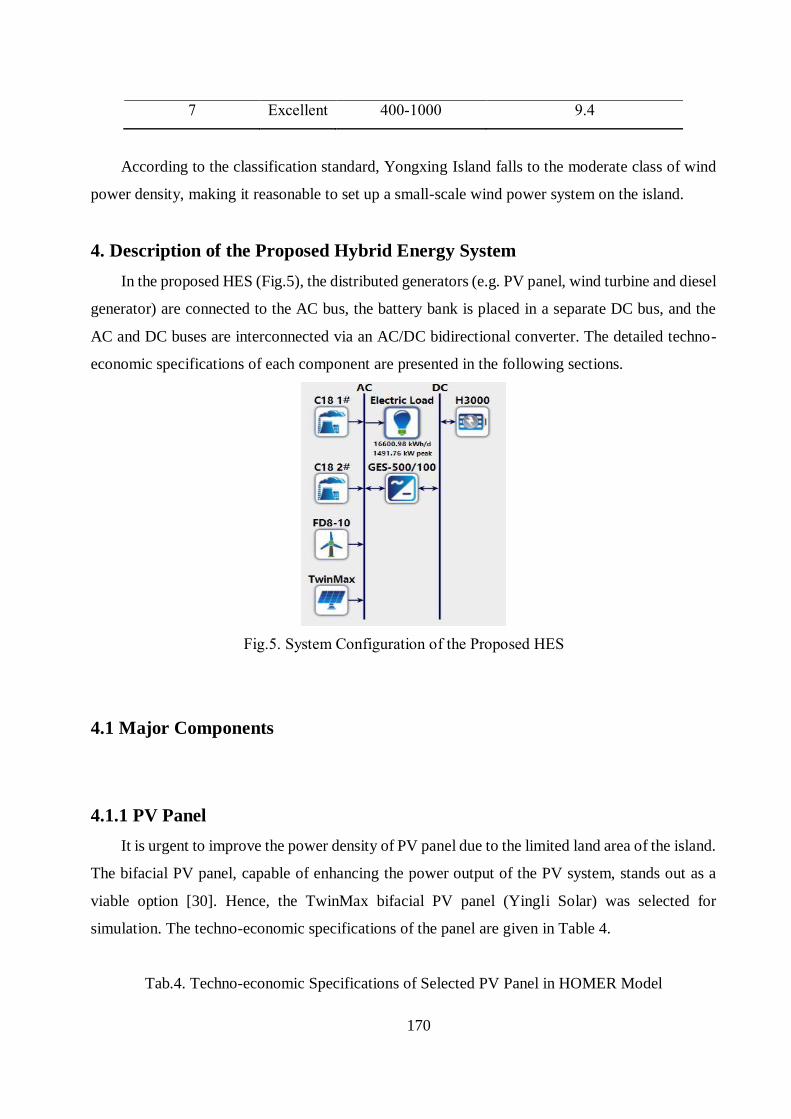
4.1.1 PV Panel
It is urgent to improve the power density of PV panel due to the limited land area of the island.
The bifacial PV panel, capable of enhancing the power output of the PV system, stands out as a
viable option [30]. Hence, the TwinMax bifacial PV panel (Yingli Solar) was selected for
simulation. The techno-economic specifications of the panel are given in Table 4.
Tab.4. Techno-economic Specifications of Selected PV Panel in HOMER Model

171
Description Specification
Derating factor (%) 90
Life time (year) 30
Temperature coefficient of power (%/℃) -0.38
Nominal operating cell temperature (℃) 46
Efficiency at standard test conditions (%) 21.2
Initial capital cost ($/kW) 2000
Replacement cost ($/kW) 2000
Operation and maintenance cost ($/kW/year) 0
4.1.2 Wind Turbine
The wind speed probability distribution (Table 5) of Yongxing Island was calculated
according to equation (4). It can be inferred that the wind speed of the island ranges from 4m/s to
8m/s in about 90% of the time of a year. This means a small wind turbine (cut-in speed:
2.5m/s~3.5m/s; rated power: 1kW~25kW) is suitable for the island [13].
Tab.5. Wind Speed Probability Distribution of Yongxing Island at a Height of 10m.
Wind speed (m/s) 1 2 3 4 5 6 7 8 9 10 11
Frequency (%) 0.07 0.88 3.65 9.51 17.9 24.69 23.65 14.23 4.68 0.7 0.04
Based on the above analysis, FD8-10 (Shanghai Ghrepower) was chosen as the wind energy
conversion system (WECS). The small-scale wind turbine has a rated power of 10kW and a hub
height of 13m. With the permanent magnet synchronous generator (PMSG) as wind generator, the
wind turbine realizes high power factor and efficiency through variable speed constant frequency
(VSCF) operation, and reduces the weight, volume and fault rate of the WECS by removing the
gearbox. The techno-economic specifications of the selected wind turbine in HOMER model are
shown in Table 6.
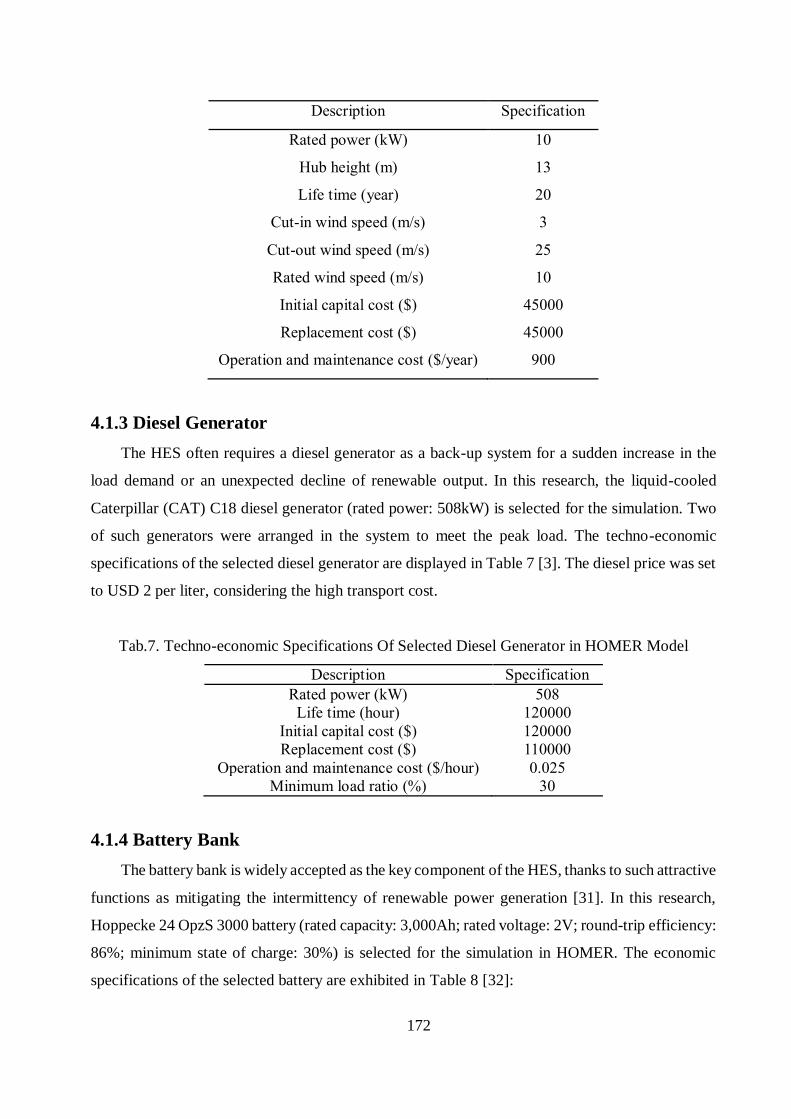
Tab.6. Techno-economic Specifications Of Selected Wind Turbine in HOMER Model
172
Description Specification
Rated power (kW) 10
Hub height (m) 13
Life time (year) 20
Cut-in wind speed (m/s) 3
Cut-out wind speed (m/s) 25
Rated wind speed (m/s) 10
Initial capital cost ($) 45000
Replacement cost ($) 45000
Operation and maintenance cost ($/year) 900
4.1.3 Diesel Generator
The HES often requires a diesel generator as a back-up system for a sudden increase in the
load demand or an unexpected decline of renewable output. In this research, the liquid-cooled
Caterpillar (CAT) C18 diesel generator (rated power: 508kW) is selected for the simulation. Two
of such generators were arranged in the system to meet the peak load. The techno-economic
specifications of the selected diesel generator are displayed in Table 7 [3]. The diesel price was set
to USD 2 per liter, considering the high transport cost.
Tab.7. Techno-economic Specifications Of Selected Diesel Generator in HOMER Model
Description Specification
Rated power (kW) 508
Life time (hour) 120000
Initial capital cost ($) 120000
Replacement cost ($) 110000
Operation and maintenance cost ($/hour) 0.025
Minimum load ratio (%) 30
4.1.4 Battery Bank
The battery bank is widely accepted as the key component of the HES, thanks to such attractive
functions as mitigating the intermittency of renewable power generation [31]. In this research,
Hoppecke 24 OpzS 3000 battery (rated capacity: 3,000Ah; rated voltage: 2V; round-trip efficiency:
86%; minimum state of charge: 30%) is selected for the simulation in HOMER. The economic
specifications of the selected battery are exhibited in Table 8 [32]:
173
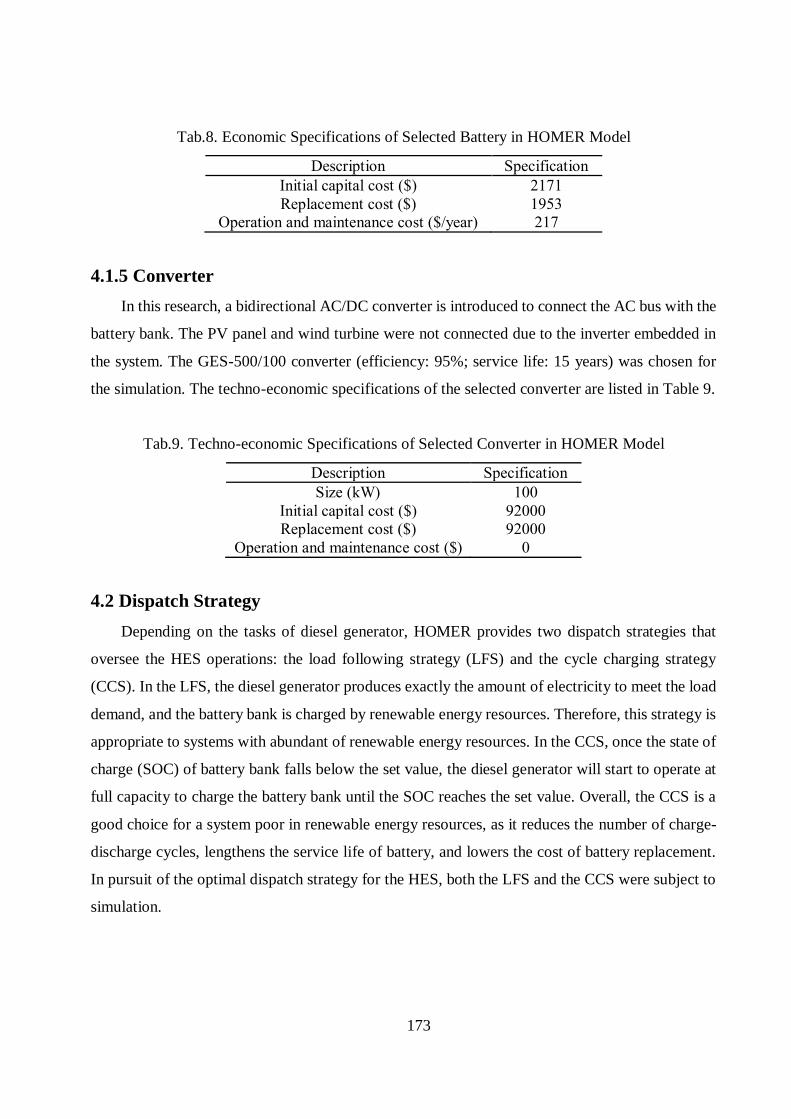
Tab.8. Economic Specifications of Selected Battery in HOMER Model
Description Specification
Initial capital cost ($) 2171
Replacement cost ($) 1953
Operation and maintenance cost ($/year) 217
4.1.5 Converter
In this research, a bidirectional AC/DC converter is introduced to connect the AC bus with the
battery bank. The PV panel and wind turbine were not connected due to the inverter embedded in
the system. The GES-500/100 converter (efficiency: 95%; service life: 15 years) was chosen for
the simulation. The techno-economic specifications of the selected converter are listed in Table 9.
Tab.9. Techno-economic Specifications of Selected Converter in HOMER Model
Description Specification
Size (kW) 100
Initial capital cost ($) 92000
Replacement cost ($) 92000
Operation and maintenance cost ($) 0
4.2 Dispatch Strategy
Depending on the tasks of diesel generator, HOMER provides two dispatch strategies that
oversee the HES operations: the load following strategy (LFS) and the cycle charging strategy
(CCS). In the LFS, the diesel generator produces exactly the amount of electricity to meet the load
demand, and the battery bank is charged by renewable energy resources. Therefore, this strategy is
appropriate to systems with abundant of renewable energy resources. In the CCS, once the state of
charge (SOC) of battery bank falls below the set value, the diesel generator will start to operate at
full capacity to charge the battery bank until the SOC reaches the set value. Overall, the CCS is a
good choice for a system poor in renewable energy resources, as it reduces the number of charge-
discharge cycles, lengthens the service life of battery, and lowers the cost of battery replacement.
In pursuit of the optimal dispatch strategy for the HES, both the LFS and the CCS were subject to
simulation.
174
5. Techno-economic Assessment Criteria
Based on component specifications, input parameters and system constraints, the HOMER
was utilized to perform energy balance calculation for every possible configuration of the proposed
HES. Then, each feasible configuration was sorted by the techno-economic assessment criteria,
including the total net present cost (TNPC) and levelized cost of energy (LCOE).
5.1 Total Net Present Cost (TNPC)
As the main techno-economic assessment criterion of HOMER, the TNPC comprises all the
profits and costs incurred in the life cycle of the system. The parameter can be calculated as follows:
,
,
ann totCTNPC
CRF i N (5)
where Cann,tot is the annualized cost of the system, that is, the sum of the annualized capital cost,
replacement cost, operation cost and fuel cost; CRF(i, N) is the capital recovery factor (CRF), a
ratio used to convert the present value into annualized cash flows. For a specific real interest rate
i, the CRF can be calculated as:
1,
1 1
N
N
i iCRF i N
i
(6)
Where N is the number of years.
5.2 Levelized Cost of Energy (LCOE)
The LCOE is defined as the average cost per kWh of available electricity generated by the
HES. The parameter equals the quotient of dividing the annualized system cost by the total electric
load served:
,ann tot
served
CLCOE
E (7)
where Eserved is the total electric load served (kWh).

175
6. Simulation and Optimization
In this section, the proposed configuration of HES would be simulated in HOMER, using the
aforementioned meteorological, techno-economic specifications. The simulation process would
determine whether the HES is feasible by judging the system could meet the electrical demand or
not. Both the economic information and operation information were calculated for each feasible
configuration to sieve out the most profitable alternative.
6.1 The Optimal System
Table 10 listed the optimization results of each categorized HES configuration, which includes
optimal configuration, dispatch strategy (DS), TNPC, LCOE and renewable fraction (RF).
Obviously, these configurations demonstrate the feasibility of HES development to Yongxing
Island, with the LFS being the most suitable dispatch strategy.
Tab.10. Optimization Results of Each Categorized HES Configuration
PV (kW) FD8-10 C18 (kW) H3000 DS TNPC ($) LCOE ($/kWh) RF
3000 60 1016 600 LFS 27,061,298 0.314 0.71
3000 0 1016 600 LFS 29,353,508 0.341 0.58
0 60 1016 200 LFS 42,338,192 0.493 0.16
0 0 1016 200 LFS 45,704,041 0.534 0
In terms of environmental protection, Fig.6 illustrates the contribution of energy resource in
each feasible HES configuration. It can be seen that renewables are the major contributor to power
generation in the first two configuration (71% and 58%). This means the two configuration can
significantly reduce the dependency on diesel fuel. Compared to the conventional diesel-powered
system, the three HES can lower the diesel consumption by 70.9%, 56.9% and 15.5%, respectively,
and cut the annual CO2 emission by 2,894ton, 2,323ton and 631ton, respectively.
Fig.6. Contribution of Energy Resource in Each Feasible Configuration (%)
0%
10%
20%
30%
40%
50%
60%
70%
80%
90%
100%
PV/WT/DG PV/DG WT/DG
Ener
gy r
eso
urc
e p
enet
rati
on
CAT-C18
Wind
PV

176
On the economic front,Fig.7 and 8 show the TNPC and LCOE of all feasible configurations.
It is clear that the HES is more profitable than conventional diesel-powered system, and the PV-
wind-diesel-battery configuration is the most cost-effective system (TNPC: $27,061,298; LCOE:
$0.314/kWh).
Fig.7. The TNPC of All Feasible Configurations
Fig.8. The LCOE of All Feasible Configurations
In view of the cost-effectiveness and low CO2 emission, the PV-wind-diesel-battery
configuration was selected as the optimal system for Yongxing Island. In this scenario, the monthly
average generating capacity is given by Fig. 9. By virtue of the abundance of solar energy resource
on the island, the electricity generated by PV panel amounts to 5,305,159kWh/year, taking up
66.16% of the total output of the system; the annual average output power of PV panel reaches
605kW, with a standard deviation as low as 63.66. The results reflect that the PV panel can provide
a stable power supply to the HES all year around. By contrast, the output by the wind turbine
fluctuates significantly under the seasonal variation of wind energy resource. During the NEM
season, the wind turbine generates plenty of electricity. With the arrival of SWM season, however,
the output of the wind turbine plunges, and the diesel generator work for prolonged hours to keep
the power balance of the system.
0
5
10
15
20
25
30
35
40
45
50
PV/WT/DG/BT PV/DG/BT WT/DG/BT DG/BT
27.061298
29.353508
42.338192
45.704041
TN
PC
(10
6$
)
0
0.1
0.2
0.3
0.4
0.5
0.6
PV/WT/DG/BT PV/DG/BT WT/DG/BT DG/BT
0.3140.341
0.493 0.534
LC
OE
($
/kW
h)

177
Fig.9. Monthly Average Generating Capacity
6.2 The Importance of Battery Bank
The optimal configuration (PV-wind-diesel-battery) was contrasted with the configuration
without battery bank (PV-wind-diesel) in terms of initial capital cost, the TNPC, power surplus,
and power shortage (Table 11). The purpose is to demonstrate the importance of the battery bank
in enhancing the economy and reliability of the HES.
Tab.11. Comparison Between the Optimal System with and without Battery Bank
Configuration Initial capital
($)
TNPC
($)
Excess electricity
(kWh/year)
Capacity shortage
(kWh/year)
PV/wind/diesel/battery 10,794,600 27,061,298 1,730,726 5,247
PV/wind/diesel 8,940,000 28,298,300 2,889,911 45,396
Despite a higher initial capital cost resulted from the high price of battery, the optimal
configuration features a 4.4% smaller TNPC than the configuration without battery bank. A
possible reason lies in the fact that the battery bank can improve the system efficiency through peak
loading shifting, and lower the operating cost by shortening the operation hours of diesel generator.
Moreover, battery bank reduces the power shortage by 88.4%, which greatly enhances the
reliability of the HES.
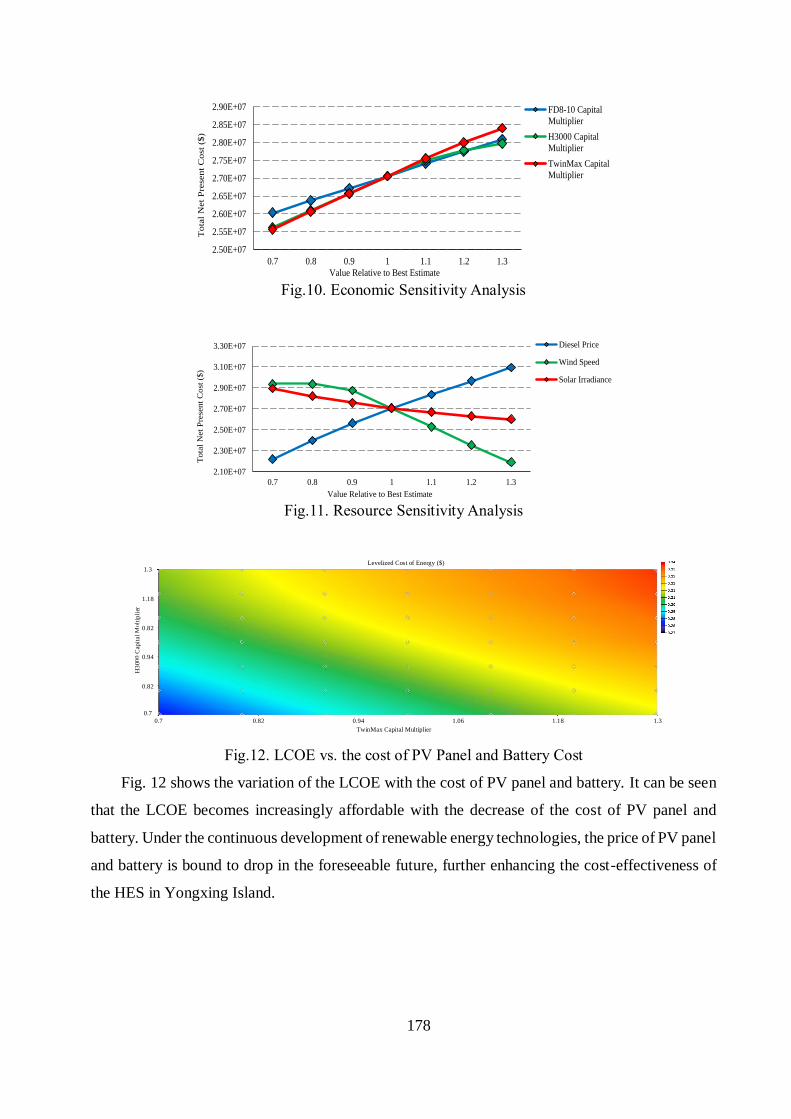
7. Sensitivity Analysis
The sensitivity analysis attempts to identify the optimal design responds to the sensitivity
variables, including major meteorological data and techno-economic parameters. The analysis
results are displayed in the spider graphs of Fig. 10 and 11. The sensitivity variables fall within
+30%~-30% of the best estimate. It is observed that the TNPC is more sensitive to the cost of PV
panel and battery, wind speed and diesel price, as the corresponding curves are steeper than those
of the other variables.
178
Fig.10. Economic Sensitivity Analysis
Fig.11. Resource Sensitivity Analysis
Fig.12. LCOE vs. the cost of PV Panel and Battery Cost
Fig. 12 shows the variation of the LCOE with the cost of PV panel and battery. It can be seen
that the LCOE becomes increasingly affordable with the decrease of the cost of PV panel and
battery. Under the continuous development of renewable energy technologies, the price of PV panel
and battery is bound to drop in the foreseeable future, further enhancing the cost-effectiveness of
the HES in Yongxing Island.
2.50E+07
2.55E+07
2.60E+07
2.65E+07
2.70E+07
2.75E+07
2.80E+07
2.85E+07
2.90E+07
0.7 0.8 0.9 1 1.1 1.2 1.3
Tota
l N
et
Pre
sen
t C
ost
($)
Value Relative to Best Estimate
FD8-10 Capital
Multiplier
H3000 Capital
Multiplier
TwinMax Capital
Multiplier
2.10E+07
2.30E+07
2.50E+07
2.70E+07
2.90E+07
3.10E+07
3.30E+07
0.7 0.8 0.9 1 1.1 1.2 1.3
To
tal
Net
Pre
sen
t C
ost
($
)
Value Relative to Best Estimate
Diesel Price
Wind Speed
Solar Irradiance
TwinMax Capital Multiplier
0.7 0.82 0.94 1.06 1.18 1.3
H3
00
0 C
apit
al
Mult
ipli
er
0.82
0.7
0.94
0.82
1.18
1.3Levelized Cost of Energy ($)

179
Fig.13. Optimal System Type for Wind Speed vs. Diesel Price
Fig. 13 displays the optimal system type for wind speed vs. diesel price. As shown in the
figure, wind turbine is a favourable way to tackle both the growing wind speed and the rising diesel
price. Hence, the wind turbine should be integrated into the HES as the substitute of diesel
generator, as long as the system is deployed in remote southern islands like Yongxing.
Conclusion
This paper investigates the techno-economic feasibility of renewable power generation in
Yongxing Island, seeking to substitute the existing diesel generator with the HES. Through the
simulation and optimization, it is concluded that the proposed PV-wind-diesel-battery hybrid
system can provide sufficient and reliable power to the study area; Compared to the conventional
diesel-powered system, the proposed system can relieve the dependency on diesel fuel, and operate
in a more cost-effective manner. In addition, as the key component of the HES, the battery bank is
able to significantly enhance the cost-effectiveness and reliability of the entire system.
According to the results of sensitivity analysis, the TNPC is most sensitive to the cost of PV
panel and battery. Hence, the economic competitiveness of the HES will be further improved with
the continuous price reduction of these major components. In terms of energy resources, the TNPC
is most sensitive to the wind speed and diesel price, indicating that the wind turbine must be
integrated into the HES as the substitute of diesel generator, as long as the system is deployed in
remote southern islands like Yongxing. Suffice it to say that the research findings provide new
insights on the design, optimization and development of the HES in the South China Sea.
Diesel Fuel Price ($/L)
1.4 1.64 1.88 2.12 2.36 2.6
5.1
5.98
6.85
7.73
8.6
9.48
Win
d S
peed
Avera
ge (
m/s
)Optimal System Type
C18/FD8-10/TwinMax/H3000
C18/TwinMax/H3000
180
Acknowledgement
This work is financially supported by “The national science and technology support program
(supported by Ministry of Science and Technology of P.R.C. No. 2014BAC01B05)”. The authors
are grateful that comments and suggestions provided by anonymous reviewers and editor helped to
improve the quality of the paper.
References
1. W. Kunlin, Y. You, Y. Zhang, Energy management system of renewable stand-alone energy
power generation system in an island, 2010, Automation of Electric Power Systems, vol. 34,
no. 14, pp. 13-17.
2. J. Yongming, On China's strategy of building an ocean power and its legal system. 2015, the
bulletin of the Institute for World Affairs, Kyoto Sangyo University, pp. 41-59.
3. K.M.R. Basir, Optimal combination of solar, wind, micro-hydro and diesel systems based on
actual seasonal load profiles for a resort island in the South China Sea, 2015, Energy, vol. 82,
pp. 80-97.
4. H. Momowar, S. Mekhilef, L. Olatomiwa, Performance evaluation of a stand-alone PV-wind-
diesel-battery hybrid system feasible for a large resort center in South China Sea, Malaysia,
2017, Sustainable Cities and Society, vol. 28, pp. 358-366.
5. M. Ali, F. Tangang, L. Juneng, Wave energy potential assessment in the central and southern
regions of the South China Sea, 2015, Renewable Energy, vol. 80, pp. 454-470.
6. R.M. Mustafizur, M.M.U.H. Khan, M.A. Ullah. A hybrid renewable energy system for a North
American off-grid community, 2016, Energy, vol. 97, pp. 151-160.
7. W. Shouxiang, Z.X. Li, L. Wu, New metrics for assessing the reliability and economics of
microgrids in distribution system, 2013, IEEE Trans. on Power Systems, vol. 28, no. 3, pp.
2852-2861.
8. B. Binayak, K.T. Lee, C.S. Lee, A novel off-grid hybrid power system comprised of solar
photovoltaic, wind, and hydro energy sources, 2014, Applied Energy, vol. 133, pp. 236-242.
9. H.R. Baghaee, M. Mirsalim, G.B. Gharehpetian, Reliability/cost-based multi-objective Pareto
optimal design of stand-alone wind/PV/FC generation microgrid system, 2016, Energy, vol.
115, pp. 1022-1041.
10. W.L. Theo, J.S. Lim, W.S. Ho. Review of distributed generation (DG) system planning and
optimization techniques: Comparison of numerical and mathematical modelling methods,
2017, Renewable and Sustainable Energy Reviews, vol. 67, pp. 531-573.

181
11. A.Q. Jakhrani, A.K. Othman, A.R.H. Rigit, A novel analytical model for optimal sizing of
standalone photovoltaic systems, 2012, Energy, vol. 46, pp. 675-682.
12. M.O. Abdullah, V.C. Yung, M. Anyi, Review and comparison study of hybrid diesel-solar-
hydro-fuel cell energy schemes for a rural ICT Tele-center, 2010, Energy, vol. 35, pp. 639-646.
13. A. Chauhan, R.P. Saini, Techno-economic feasibility study on integrated renewable energy
system for an isolated community of India, 2016, Renewable and Sustainable Energy Reviews
vol. 59, pp. 388-405.
14. P. Nema, R.K. Nema, S. Rangnekar, Minimization of greenhouse gases emission by using
hybrid energy system for telephony base station site application, 2010, Renewable and
Sustainable Energy Reviews, vol. 14, pp. 1635-1639.
15. A.B. Kanase-Patil, R.P. Saini, M.P. Sharma, Integrated renewable energy systems for off grid
rural electrification of remote area, 2010, Renewable Energy, vol. 35, pp. 1342-1349.
16. S. Sinha, S.S. Chandel, Review of software tools for hybrid renewable energy systems, 2014,
Renewable and Sustainable Energy Reviews, vol. 32, pp. 192-205.
17. S.G. Sigarchian, R. Paleta, A. Malmquist, Feasibility study of using a biogas engine as backup
in a decentralized hybrid (PV-wind-battery) power generation system-Case study Kenya, 2015,
Energy, vol. 90, pp. 1830-1841.
18. H. Borhanazad, S. Mekhilef, V.G. Ganapathy, Optimization of micro-grid system using
MOPSO, 2014, Renewable Energy, vol. 71, pp. 295-306.
19. T. Tezer, R. Yaman, G. Yaman, Evaluation of approaches used for optimization of stand-alone
hybrid renewable energy systems, 2017, Renewable and Sustainable Energy Reviews, vol. 73,
pp. 840–853.
20. G. Mendes, C. Ioakimidis, P. Ferrão, On the planning and analysis of Integrated Community
Energy Systems: A review and survey of available tools, 2011, Renewable and Sustainable
Energy Reviews, vol. 15, pp. 4836-4854.
21. S. Bahramara, M.P. Moghaddam, M.R. Haghifam, Optimal planning of hybrid renewable
energy systems using HOMER: A review, 2016, Renewable and Sustainable Energy Reviews
vol. 62, pp. 609-620.
22. N. Izadyar, H.C. Ong, W.T. Chong, Resource assessment of the renewable energy potential for
a remote area: A review, 2016, Renewable and Sustainable Energy Reviews, vol. 62, pp. 908-
923.
23. NASA, Atmospheric science data center, https://eosweb.larc.nasa.gov, accessed 13 March
2017.
182
24. China meteorological administration, Assessment Method for Solar Energy,
http://www.cma.gov.cn, accessed 13 March 2017.
25. C.W. Zheng, J. Pan, J.X. Li. Assessing the China Sea wind energy and wave energy resources
from 1988 to 2009, 2013, Ocean Engineering, vol. 65, pp. 39-48.
26. J. Wang, J. Hu, K. Ma, Wind speed probability distribution estimation and wind energy
assessment, 2016, Renewable and Sustainable Energy Reviews, vol. 60, pp. 881-899.
27. S. Mathew, Wind Energy: Fundamentals, resource analysis and economics, 2007, Springer.
28. K. Mohammadi, O. Alavi, A. Mostafaeipour, Assessing different parameters estimation
methods of Weibull distribution to compute wind power density, 2015, Energy Conversion and
Management, vol. 108, pp. 322-335.
29. General administration of quality supervision, Methodology of Wind Energy Resource
Measurement for Wind Farm, http://english.aqsiq.gov.cn/LawsandRegulations, accessed 13
March 2017.
30. R. Guerrero-Lemus, R. Vega, T. Kim, Bifacial solar photovoltaics-A technology review, 2016,
Renewable and Sustainable Energy Reviews, vol. 60, pp. 1533-1549.
31. X. Luo, J. Wang, M. Dooner, Overview of current development in electrical energy storage
technologies and the application potential in power system operation, 2015, Applied Energy,
vol. 137, pp. 511-536.
32. A.H. Mamaghani, S.A.A. Escandon, G.B. Gharehpetian, Techno-economic feasibility of
photovoltaic, wind, diesel and hybrid electrification systems for off-grid rural electrification in
Colombia, 2016, Renewable Energy, vol. 97, pp. 293-305.