techno- economic evaluation and improvement possibilities of … inad... · 2016-04-13 · an-najah...
TRANSCRIPT
An-Najah National University
Faculty of Graduate Studies
Techno- Economic Evaluation and Improvement
Possibilities of Local Grid Connected House – PV
Power System
By
Alaa Inad Mahmoud Awwad
Supervisor
Prof. Dr. Marwan Mahmoud
This Thesis is Submitted in Partial Fulfillment of the Requirements for
the Degree of Master of Clean Energy and Conservation strategy
Engineering, Faculty of Graduate Studies, An-Najah National
University, Nablus, Palestine.
2015

III
Dedication
To my parents
To my husband(Basem)
To my brothers, and sisters
To my teachers
To all friends and colleagues
To all of them,
I dedicate this work

IV
Acknowledgment
I would like to express my special appreciation
and thanks to my advisor Prof. Dr. Marwan
Mahmoud who has always been providing
kindest support, encouragement, and guidance
throughout the accomplishment of this thesis.
My thanks also goes to the staff of Clean Energy
and Energy Conservation Engineering Master
Program in An-Najah National University.
I place on record my sincere thank you to Tubas
District Electricity Company (TDECO) for their
assistance in providing technical and measured
data, and I am also immensely grateful to Eng.
Ishraq Jarrar who provided expertise that
greatly assisted the theses.
family: my parents, husband, brothers, and
sisters for supporting me throughout this
venture.
VI
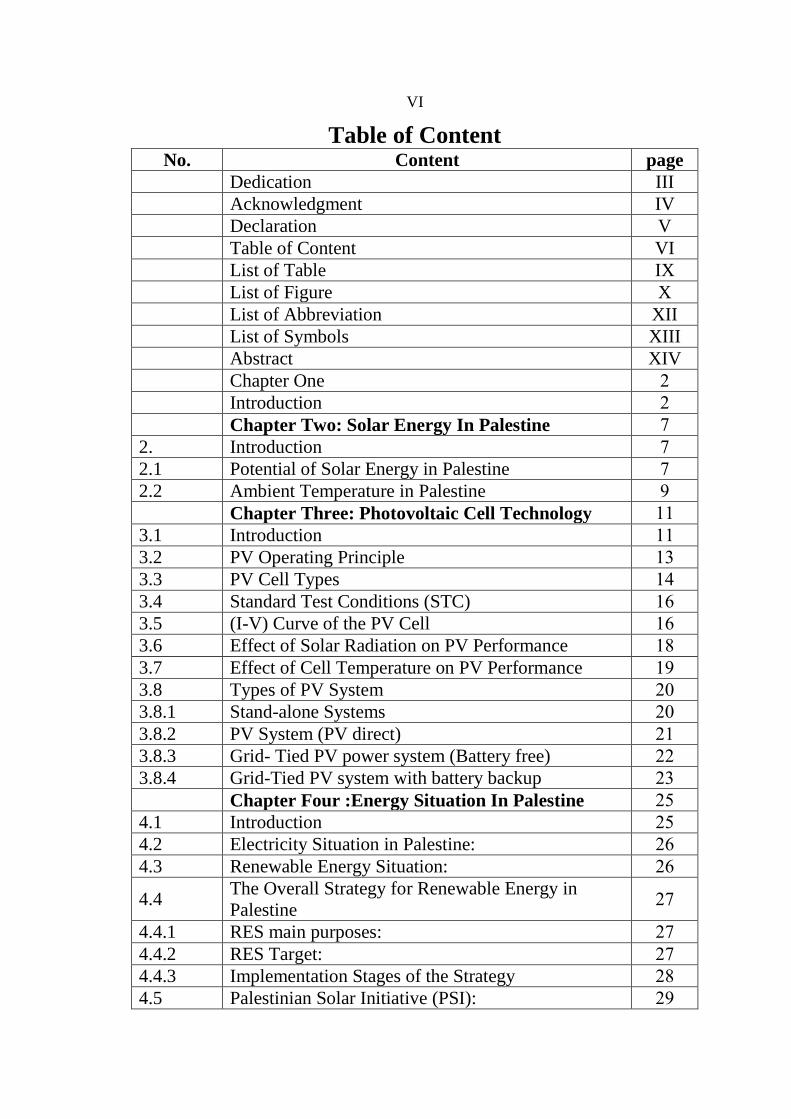
Table of Content No. Content page
Dedication III
Acknowledgment IV
Declaration V
Table of Content VI
List of Table IX
List of Figure X
List of Abbreviation XII
List of Symbols XIII
Abstract XIV
Chapter One 2
Introduction 2
Chapter Two: Solar Energy In Palestine 7
2. Introduction 7
2.1 Potential of Solar Energy in Palestine 7
2.2 Ambient Temperature in Palestine 9
Chapter Three: Photovoltaic Cell Technology 11
3.1 Introduction 11
3.2 PV Operating Principle 13
3.3 PV Cell Types 14
3.4 Standard Test Conditions (STC) 16
3.5 (I-V) Curve of the PV Cell 16
3.6 Effect of Solar Radiation on PV Performance 18
3.7 Effect of Cell Temperature on PV Performance 19
3.8 Types of PV System 22
3.8.1 Stand-alone Systems 22
3.8.2 PV System (PV direct) 21
3.8.3 Grid- Tied PV power system (Battery free) 22
3.8.4 Grid-Tied PV system with battery backup 23
Chapter Four : Energy Situation In Palestine 25
4.1 Introduction 25
4.2 Electricity Situation in Palestine: 26
4.3 Renewable Energy Situation: 26
4.4 The Overall Strategy for Renewable Energy in
Palestine 27
4.4.1 RES main purposes: 27
4.4.2 RES Target: 27
4.4.3 Implementation Stages of the Strategy 28
4.5 Palestinian Solar Initiative (PSI): 29

VII
4.6 Tubas district Electricity Company(TDECO) 32
Chapter Five: Case study Project area Tubas 34
5.1 Introduction 34
5.2 Energy Produced for the Systems. 35
5.2.1 House No.1 35
5.2.2 House no.2 39
5.2.3 House No.3 41
5.3 Comparison of the energy produced from the three
houses 43
5.4 Effect of Tilt angle on PV performance 45
5.5 Effect of temperature on PV performance 46
5.6 The energy produced of the three houses in a
particular day 47
5.7 Impacts of Electric Grid Connected PV Systems on
the Power Systems 50
5.7.1 Impacts of small/medium PV systems 51
5.8 Impact of PV Systems on Tubas District Grid. 54
5.8.1 Technical losses 54
5.8.2 Impacts of PV systems on voltage. 55
5.8.3 Impacts of PV generators on power factor(PF) 56
5.9 The Inverters 56
5.9.1 The inverters are used in house (1) and (2) 57
5.9.2 The inverter used in house (3) 58
5.10 The Surge Protective Device (surge arrestor) 59
5.11 Impacts of Existence of Air Conditions on the Home 60
Chapter Six: Economic Analysis 65
6. Introduction 65
6.1 Economic Study of PV Home System 65
6.2 Cash Flow Analysis of PV System 5 kWp: 66
6.2.1 Economic Analysis of House no.(1): 67
6.2.2 Economic Analysis of House no.(2): 70
6.2.3 Economic Analysis House no.(3): 72
6.3 Simple Payback Period Analysis: 75
6.4 Economic Analysis Using NPV 75
6.4.1 Net Present Value (NPV) of House no.(1) 75
6.4.2 Net Present Value (NPV) of House no.(2) 76
6.4.3 Net Present Value (NPV) of House no. (3) 76
6.5 Economic Analysis Using ROR 77
6.5.1 ROR of house no.(1): 78
6.5.2 ROR of house no.(2): 78
6.5.3 ROR of house no.(3): 79
VIII
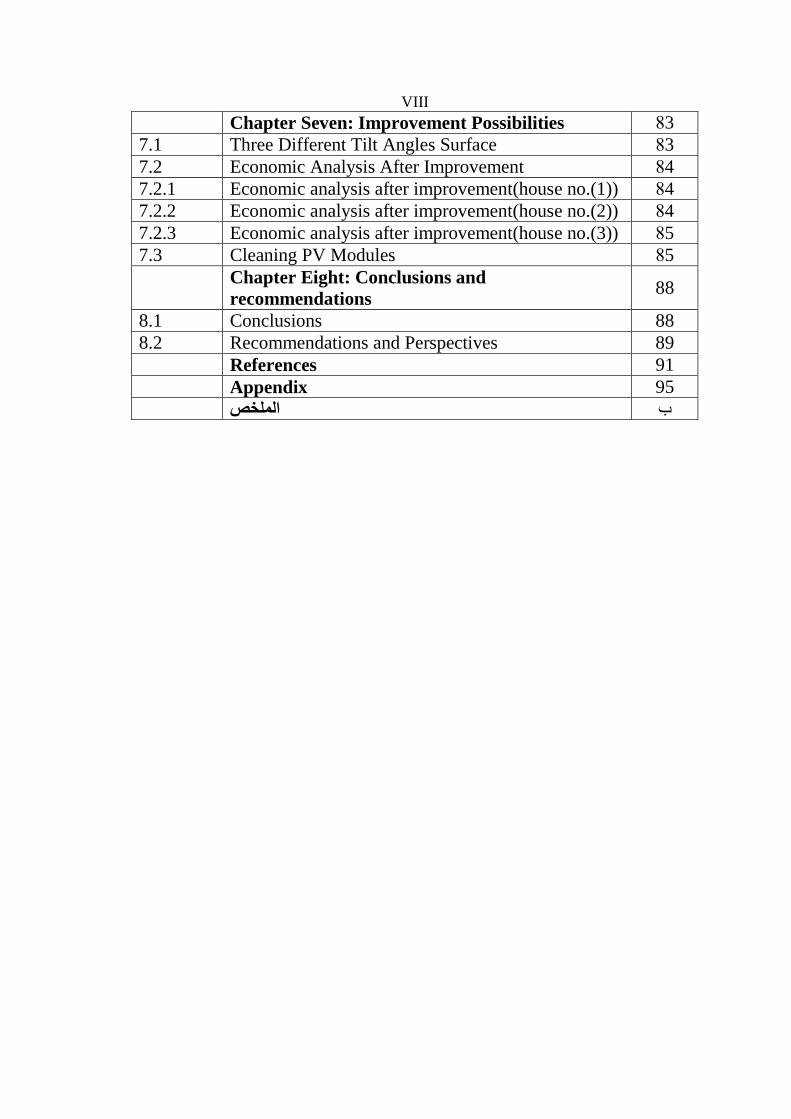
Chapter Seven: Improvement Possibilities 83
7.1 Three Different Tilt Angles Surface 83
7.2 Economic Analysis After Improvement 84
7.2.1 Economic analysis after improvement(house no.(1)) 84
7.2.2 Economic analysis after improvement(house no.(2)) 84
7.2.3 Economic analysis after improvement(house no.(3)) 85
7.3 Cleaning PV Modules 85
Chapter Eight: Conclusions and
recommendations 88
8.1 Conclusions 88
8.2 Recommendations and Perspectives 89
References 91
Appendix 95
ب الولخص

IX
List of Table No. Table Page
Table (2.1) Monthly average solar radiation (kWh/m²-day)in
Jordan Valley 8
Table (4.1) The Overall Strategy for Renewable Energy in
Palestine 28
Table (4.2) Renewable energy technology used in the first
phase 29
Table (4.3) The second phase of the renewable energy (2016-
2020) 29
Table (4.4) Phases of the Palestinian Solar Initiative. 30
Table (5.1) Monthly average energy production in (kWh) from
Aug 2013 to Sep 2014 for home no.(1). 38
Table (5.2) Monthly average energy production in (kWh) from
June 2013 to June 2014 for home no.(2) 41
Table (5.3) Monthly average of energy production in (kWh)
during 2014 of home no.(3). 43
Table (5.4) The energy produced from the three houses. 44
Table (5.5) Technical losses of Karag transformer before and
after PV installation. 56
Table (5.6) Technical losses and the voltage of Karag
transformer. 59
Table (5.7) Technical information of Safeh north transformer
before install PV system.
Table (6.1) Monthly outcome of house no.(1). 68
Table (6.2) Cash flow components of the homes. 68
Table (6.3) Monthly outcome of house No.(2). 71
Table (6.4) Monthly outcome of house No.(3). 73
Table (6.5) Simple payback period for the PV generators of the
three homes. 75

X
List of Figure No. Figure Page
Figure (2.1) Monthly average solar radiation in Jordan
Valley .
8
Figure (2.3) Variation of PV module efficiency with PV
cell temperature
9
Figure(3.1) Price history of silicon PV cells. 12
Figure(3.2) World annual solar photovoltaic production,
1985-2012
12
Figure(3.3) How a photovoltaic cell generates power. 13
Figure (3.4) PV panel types 15
Figure (3.5) Cells, modules and arrays. 16
Figure(3.6) (I-V) Characteristics of a typical silicon PV
cell.
17
Figure (3.7) The effect of irradiance on the voltage and
the current of the PV array.
18
Figure (3.8) The effect of the irradiance change on power
production of PV array
19
Figure (3.9) Effect of cell temperature variation at PV
module.
20
Figure (3.10) PV direct system. 21
Figure (3.11) Grid-Tie Battery less PV System. 22
Figure (3.12) Grid-Tied PV System with Battery Backup. 22
Figure (4.1) The Palestinian Energy Sector. 25
Figure(4.2) The production of PV generators of TEDCO
company as percentage of total consumption
32
Figure (5.1) The PV power system of house no.(1) 35
Figure (5.2) IV characteristic curve for One PV- Module
in function of solar radiation intensity.
35
Figure(5.3) Monthly average energy production in (kWh)
from Aug 2013 to Sep2014 for house no.(1)
37
Figure (5.4) Monthly energy produced(without respecting
the year).
38
Figure (5.5) The PV generator of house no. (2). 39
Figure(5.6) Monthly average energy production in (kWh)
from June2013 to June2014 of house no.(2).
40
Figure(5.7) Monthly energy produced(without respecting
the year) for house no.(2).
41
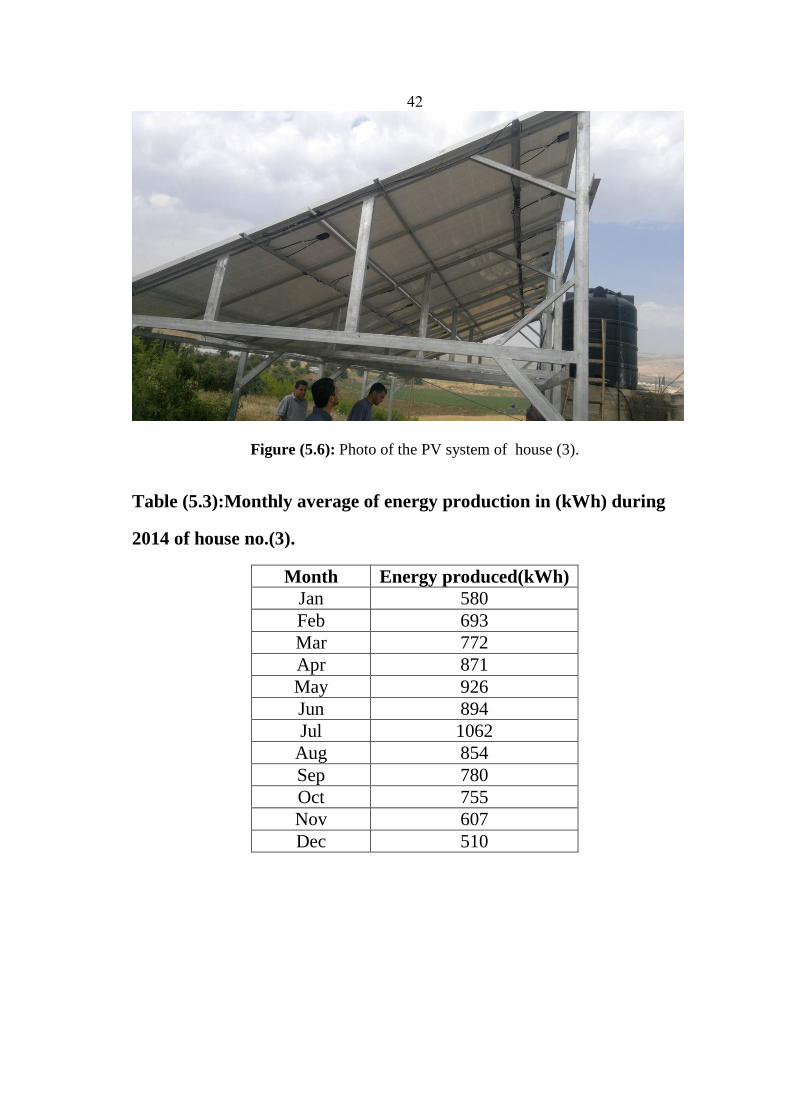
Figure (5.6) PV system of house (3). 42
Figure(5.8) Monthly average energy production in (kwh)
during 2014of house no.(3).
43
XI
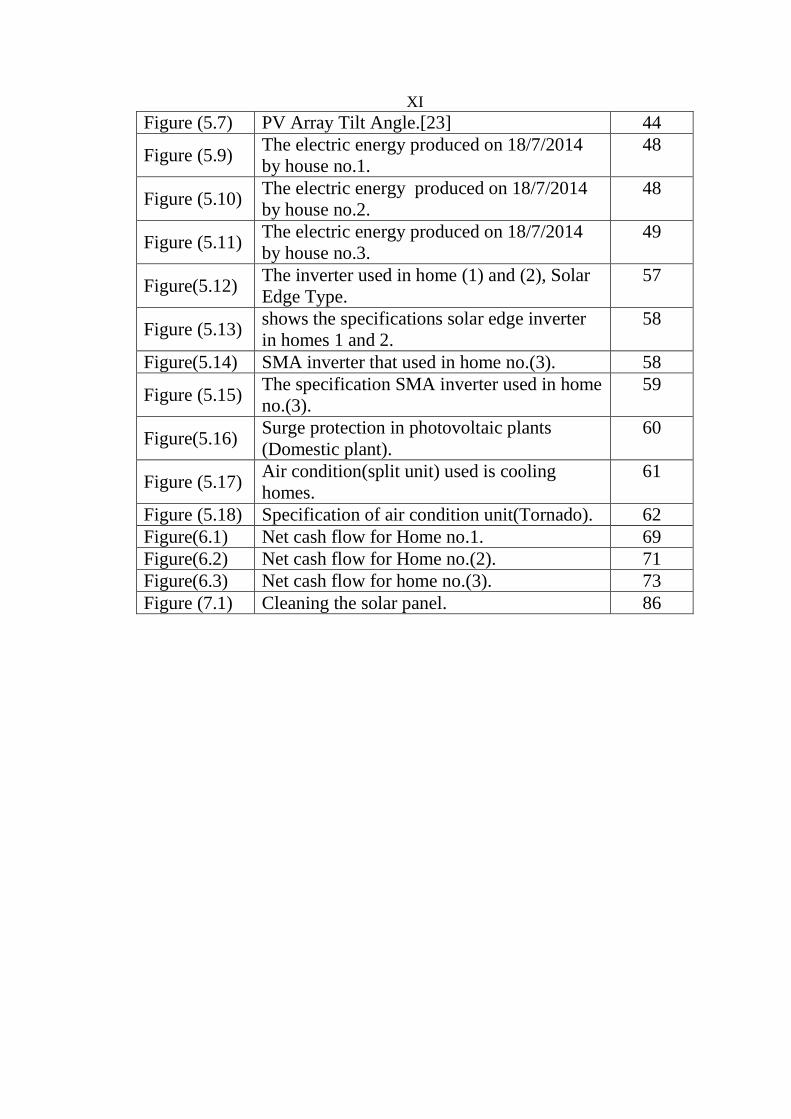
Figure (5.7) PV Array Tilt Angle.[23] 44
Figure (5.9) The electric energy produced on 18/7/2014
by house no.1.
48
Figure (5.10) The electric energy produced on 18/7/2014
by house no.2.
48
Figure (5.11) The electric energy produced on 18/7/2014
by house no.3.
49
Figure(5.12) The inverter used in home (1) and (2), Solar
Edge Type.
57
Figure (5.13) shows the specifications solar edge inverter
in homes 1 and 2.
58
Figure(5.14) SMA inverter that used in home no.(3). 58
Figure (5.15) The specification SMA inverter used in home
no.(3).
59
Figure(5.16) Surge protection in photovoltaic plants
(Domestic plant).
60
Figure (5.17) Air condition(split unit) used is cooling
homes.
61
Figure (5.18) Specification of air condition unit(Tornado). 62
Figure(6.1) Net cash flow for Home no.1. 69
Figure(6.2) Net cash flow for Home no.(2). 71
Figure(6.3) Net cash flow for home no.(3). 73
Figure (7.1) Cleaning the solar panel. 86
XII
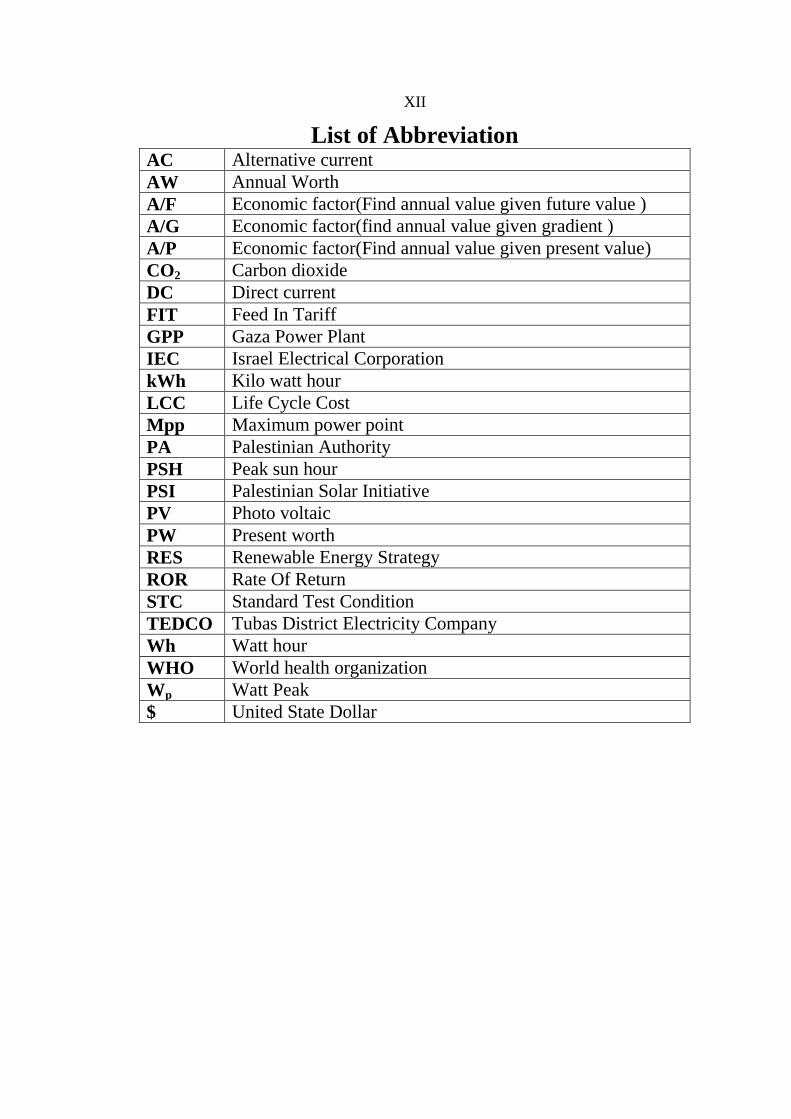
List of Abbreviation AC Alternative current
AW Annual Worth
A/F Economic factor(Find annual value given future value )
A/G Economic factor(find annual value given gradient )
A/P Economic factor(Find annual value given present value)
CO2 Carbon dioxide
DC Direct current
FIT Feed In Tariff
GPP Gaza Power Plant
IEC Israel Electrical Corporation
kWh Kilo watt hour
LCC Life Cycle Cost
Mpp Maximum power point
PA Palestinian Authority
PSH Peak sun hour
PSI Palestinian Solar Initiative
PV Photo voltaic
PW Present worth
RES Renewable Energy Strategy
ROR Rate Of Return
STC Standard Test Condition
TEDCO Tubas District Electricity Company
Wh Watt hour
WHO World health organization
Wp Watt Peak
$ United State Dollar

XIII
List of Symbols Ac Area of solar cell(m )
AM Air Mass
Edl Daily load energy (Wh/day)
EPV Photovoltaic energy (Wh)
Esd The average daily solar radiation intensity for a month
Go the peak solar radiation intensity = 1000W/m2
Impp Current at maximum power point (A)
Isc Short circuit current (A
Lat Latitude (degree)
NOCT Nominal Operating Cell Temperature (°C)
PM Module power (Wp)
PPV Photovoltaic power (Wp)
PSH The average Peak Sun Hours around the year (h)
PSHm The average Peak Sun Hours around month
T Temperature (°C)
Ta Ambient temperature (°C)
Tc Cell temperature (°C)
Vmmp Voltage at maximum power point (V)
VOC Open circuit voltage (V)
X Amount of CO2 produced by burned of 1 liter diesel (kg/L)
ƞ Efficiency (%)
β Tilt angle of the PV array on a horizontal level amounting
to (degree)
XIV
Techno- Economic Evaluation and Improvement Possibilities of Local
Grid Connected House – PV Power System
By
Alaa Inad Mahmoud Awwad
Supervisor
Prof. Dr. Marwan Mahmoud
Abstract
The daily average of solar radiation intensity on horizontal surface in
Palestine is 5.4 kWh/m²-day while the total annual sunshine hour amounts
to about 3000. The implemented renewable energy projects in Palestine are
focused on PV applications, as a part of its concentration on solar
renewable energy PENRA setup the Palestinian Solar Initiative(PSI). The
initiative target is to achieve 20 MW by 2020 through installing PV panels
on the rooftops of households with 5 kWp for each house.
This thesis discusses the rooftops PV systems, the techno-economic issues,
improvement possibilities, and environmental analysis of such systems.
Three houses in Tubas area are studied, the energy produced by house
no.(1) is 8496.6 kWh/ year then the total average revenue is 8759.33
NIS/year, and the annual saving after paying the electrical bills to the
company is 5,690.34 NIS/year. House no.(2) produces 9617.66 kWh/year,
the total revenue is 9,914.44 NIS/year, and the annual saving after paying
the bills is 6,978.64 NIS/year. House no.(3) produces 9304 kWh/year, the
total revenue is 7443.200 NIS/year, and the annual saving 5596.59
NIS/year.
Economic analysis shows that the cost of 1kWh produced by these systems
is 0.40 NIS.

XV
Environmental analysis shows that these systems preserve the environment
of production CO2, house no.(1) reduces CO2 by 7,919.08 kg/year, house
no.(2) reduces CO2 by 9,006.62 kg year, and house no.(3) reduces CO2 by
8,702.26 kg/year.

1
Chapter One
Introduction
2
Chapter One
Introduction
Solar energy is one of the main promising clean energy sources in the
future of the world. The technology of Photovoltaic PV is always on
continuous developing in many applications, so it generates electricity
without dangerous effects on environment. It can be utilized in pipelines
catholic protection. Furthermore, Photovoltaic systems are today largely
used in rural electrification, and in supplying the electric grid, also in water
pumping irrigation projects, in desalination of brackish and sea water, and
for supplying of communication systems.
Palestine has high solar energy potential, about 3000 sunshine hours per
year and an average daily solar radiation intensity of 5.4kWh/m² –day
which is suitable for using solar energy in electricity generation. One of the
important applications is the residential PV systems. Residential solar panel
installations have been used since the 1970's but in recent years these
installations have become increasingly prevalent due to government
programs and to the increase of awareness on the advantages of renewable
energy towards economic and environment.
On 31/1/2012, the Palestinian Energy and Natural Resources authority
issued the Palestine solar initiative, the initiative's target is to achieve 20
MW of solar energy by 2020 through installing PV panels on the roof tops
of Palestinian households as illustrated in chapters four and five.
This thesis aims at investigation the present PV systems depending on real
measurements, in order to evaluate the performance of these systems,

3
considering the actual efficiency and the energy produced as well as to
figure out the economic and environmental revenues.
Thesis Objectives
The main purpose of this thesis is to evaluate the performance of the top
roof PV's connected to the grid , and to investigate different possibilities to
improve their efficiency and safety .Implementation of this project has in
particular the following objectives :-
1. Investigating module types and their characteristics.
2. Examine the support structure (the type) with tilt angle, it's direction,
height and do calculations to determine the optimum tilt angles
necessary to achieve maximum output power .
3. Check the used inverter types , the nominal power and the output
voltage.
4. Measure the daily average of produced energy (kWh) from the
studied homes .
5. Figure out the ways of improving the system performance and
efficiency .
6. Illustration of the expected advantages through the improvement .
7. Determining the economic benefits through the improvement in
comparison to the current situation .
8. The environmental impacts of using such systems.
Thesis Structure
The works done in this thesis are illustrated in eight chapters as follows:
4
Chapter 1: Introduction
Chapter 2: Solar Energy in Palestine
This chapter describes the potential of solar energy in Palestine and the
ambient temperatures in Palestine.
Chapter 3: Photovoltaic Cell Technology
This chapter illustrates the PV cell technology in terms of operating
principles, cell types, (I-V) curve for PV cell and (STC). Also this chapter
studies the effect of solar radiation and cell temperature on PV
performance, and presents the types of PV system.
Chapter 4: Energy Situation in Palestine
This chapter talks about energy situation in Palestine , the main sources of
the Palestinian energy sector, the strategy of renewable energy in Palestine
with its targets, stages, implementation, and the PSI. Then the area of the
study (Tubas District Electricity Company) is discussed.
Chapter 5: Case Study Project Area Tubas
In this chapter we selected three houses in Tubas area to perform the study.
The measured monthly energy produced by the three houses are presented
in tables and the related energy values for each hour are analyzed to enable
performing a comparison among them.
Chapter 6: Economic Analysis and Environmental Impact Of ON-Roof
Solar Power System

5
This chapter presents the economic analysis and total revenue of each
house, then the total revenue on the life cycle of the system, cash flow
analysis, the cost of energy produced, simple payback period and economic
analysis using rate of return(ROR) method. Also it explains the
environmental impacts of using Solar PV systems.
Chapter 7: Improvements of the Systems Performance and Efficiency
This chapter presents ways of improving the PV system performance and
efficiency, illustration of the expected advantages through the
improvement as well as determining the economic benefits through the
improvement in comparison to the current situation .
Chapter 8: Conclusions and Recommendations
This chapter presents the main conclusions and recommendation related to
the roof PV generators.

6
Chapter Two
Solar Energy In Palestine
7
Chapter Two
Solar Energy In Palestine
2.1 Introduction
Palestine locates between the longitude meridian 34.15° and 35.40° east
and between the latitude circle 29.30° and 33.15° North, The area of
Palestine is 27000 Km2
.The atmosphere of Palestine is clear and its air is
pure. In summer temperatures reach 35° centigrade while in winter
temperature may drop to Zero.[1]
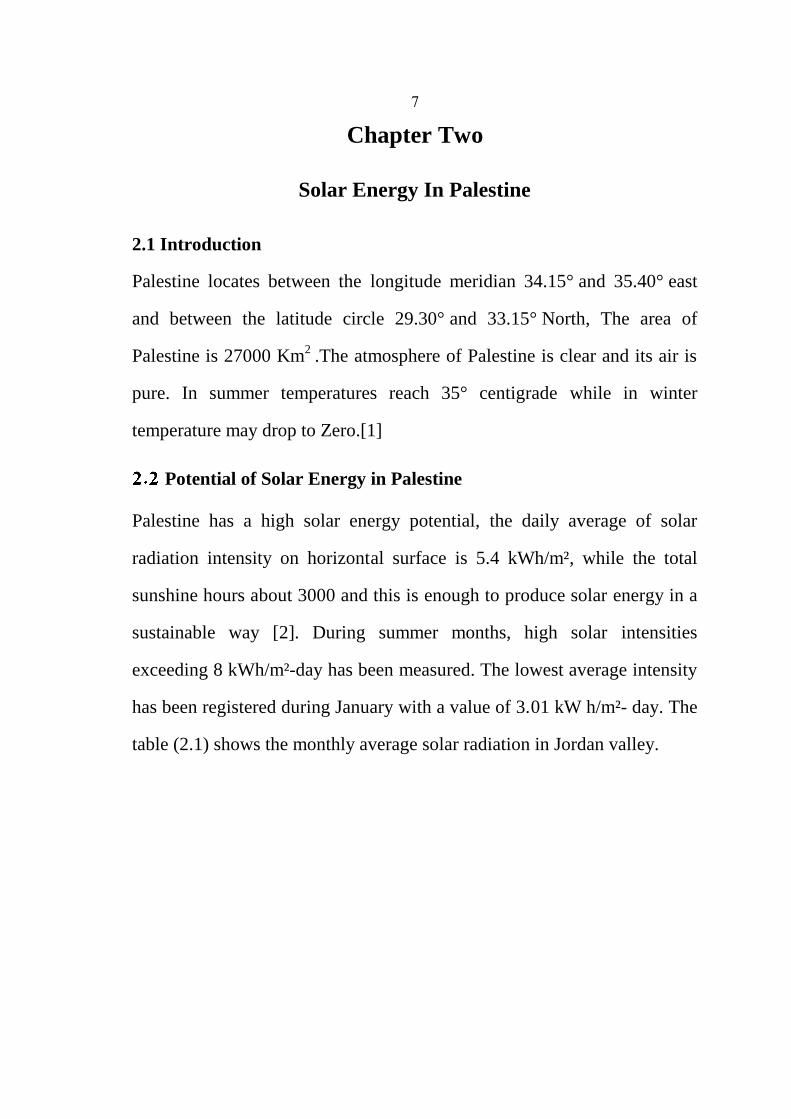
Potential of Solar Energy in Palestine
Palestine has a high solar energy potential, the daily average of solar
radiation intensity on horizontal surface is 5.4 kWh/m², while the total
sunshine hours about 3000 and this is enough to produce solar energy in a
sustainable way [2]. During summer months, high solar intensities
exceeding 8 kWh/m²-day has been measured. The lowest average intensity
has been registered during January with a value of 3.01 kW h/m²- day. The
table (2.1) shows the monthly average solar radiation in Jordan valley.
8
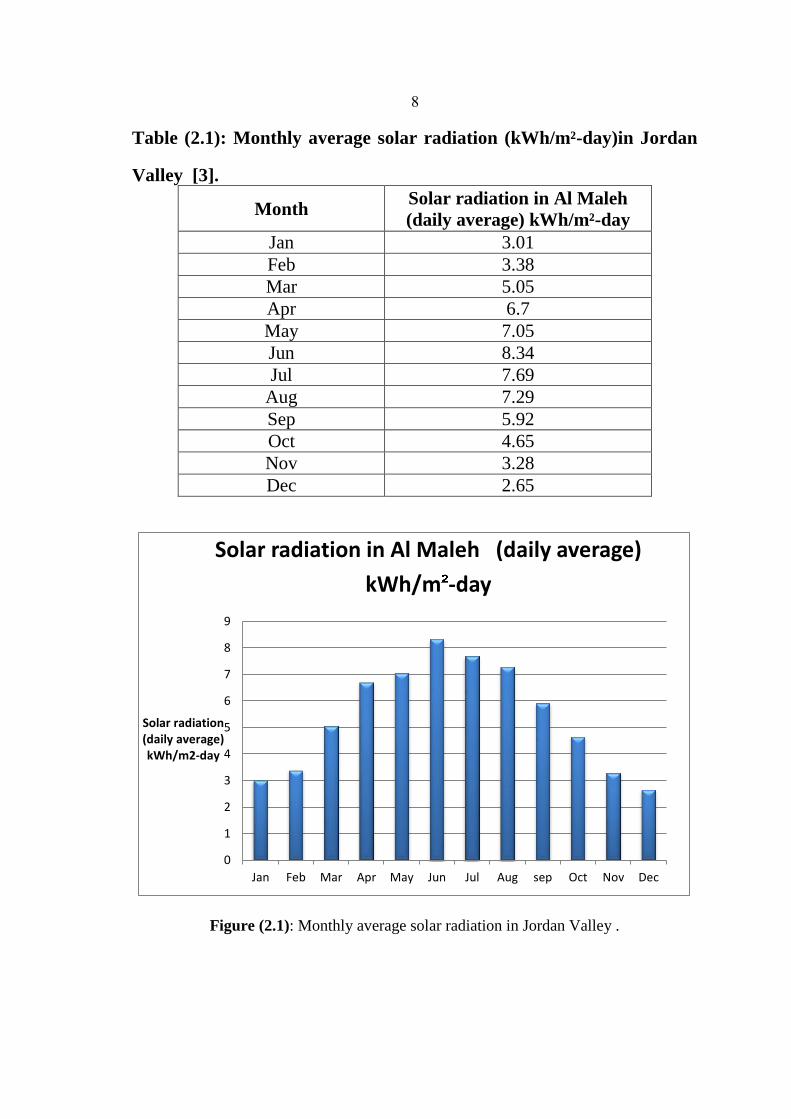
Table (2.1): Monthly average solar radiation (kWh/m²-day)in Jordan
Valley [3].
Solar radiation in Al Maleh
(daily average) kWh/m²-day Month
3.01 Jan
3.38 Feb
5.05 Mar
6.7 Apr
7.05 May
8.34 Jun
7.69 Jul
7.29 Aug
5.92 Sep
4.65 Oct
3.28 Nov
2.65 Dec
Figure (2.1): Monthly average solar radiation in Jordan Valley .
0
1
2
3
4
5
6
7
8
9
Jan Feb Mar Apr May Jun Jul Aug sep Oct Nov Dec
Solar radiation (daily average) kWh/m2-day
Solar radiation in Al Maleh (daily average)
kWh/m -day
9
Data in table (2.1) have been measured in almaleh village, the horizontal
distance between Almaleh and Tubas about 22 km, and within 30 km
distance the data doesn’t change.
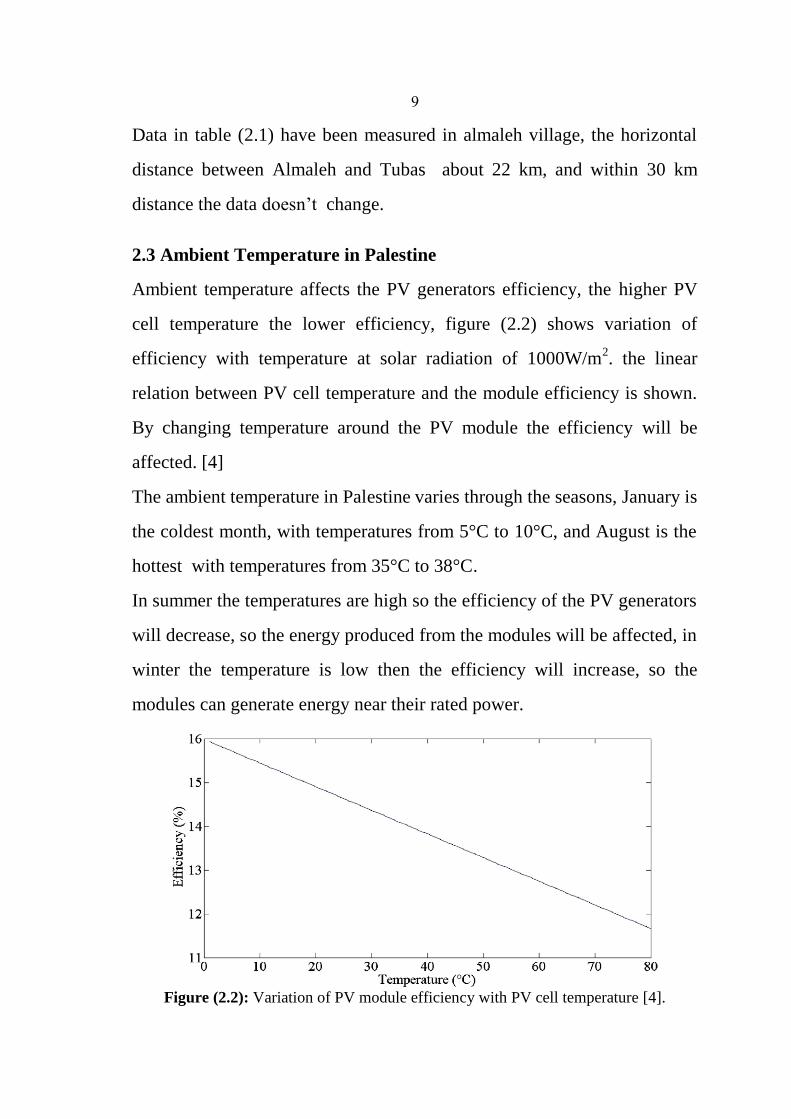
2.3 Ambient Temperature in Palestine
Ambient temperature affects the PV generators efficiency, the higher PV
cell temperature the lower efficiency, figure (2.2) shows variation of
efficiency with temperature at solar radiation of 1000W/m2. the linear
relation between PV cell temperature and the module efficiency is shown.
By changing temperature around the PV module the efficiency will be
affected. [4]
The ambient temperature in Palestine varies through the seasons, January is
the coldest month, with temperatures from 5°C to 10°C, and August is the
hottest with temperatures from 35°C to 38°C.
In summer the temperatures are high so the efficiency of the PV generators
will decrease, so the energy produced from the modules will be affected, in
winter the temperature is low then the efficiency will increase, so the
modules can generate energy near their rated power.
Figure (2.2): Variation of PV module efficiency with PV cell temperature [4].
12
Chapter Three
Photovoltaic Cell Technology
11
Chapter Three
Photovoltaic Cell Technology
3.1 Introduction
Photovoltaic offer consumers the ability to generate electricity in a clean,
quiet and reliable way. Photovoltaic systems are comprised of photovoltaic
cells, devices that convert light energy directly into electricity. Because the
source of light is usually the sun, they are often called solar cells. The word
photovoltaic comes from “photo” meaning light and “voltaic” which refers
to producing electricity. Therefore, the photovoltaic process is “producing
electricity directly from sunlight". Photovoltaic are often referred to as
PV[5].
The history of PV goes back to the year 1839, when Becquerel discovered
the PV effect .Bell laboratories produced the first solar cell in 1954, the
efficiency of that cell was about 5%, and the cost was not a major issue,
because the first cells were designed for space applications [2].
In the following years solar cell production have decreased significantly
while the efficiency of the cell increased and the cost decreased.
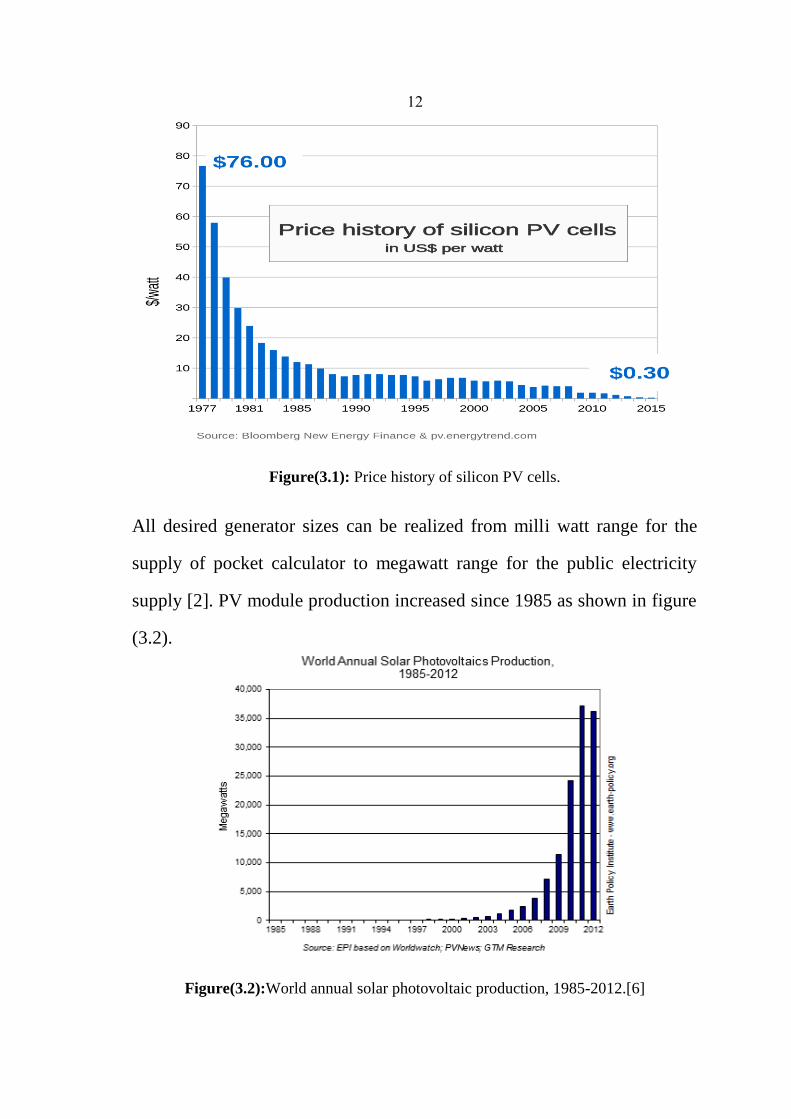
Figure(3.1) shows the change of PV cost until now.
12
Figure(3.1): Price history of silicon PV cells.
All desired generator sizes can be realized from milli watt range for the
supply of pocket calculator to megawatt range for the public electricity
supply [2]. PV module production increased since 1985 as shown in figure
(3.2).
Figure(3.2):World annual solar photovoltaic production, 1985-2012.[6]

13
3.2 PV Operating Principle
Sunlight is composed of photons, or particles of radiant solar energy. These
photons contain various amounts of energy depending on the wavelength of
the solar spectrum. When the photons strike a solar cell some are absorbed
while others are reflected. When the material absorbs sufficient photon
energy, electrons within the solar cell material dislodge from their atoms.
The electrons migrate to the front surface of the solar cell, which is
manufactured to be more receptive to the free electrons. When many
electrons, each carrying a negative charge, travel toward the front surface
of the cell, the resulting imbalance of charge between the cell's front and
back surfaces creates a voltage potential like the negative and positive
terminals of a battery. When the two surfaces are connected through an
external load, electricity flows [7]. Figure (3.3) shows the cell construction
and how it produce electricity.
Figure(3.3): How a photovoltaic cell generates power.[8]

14
3.3 PV Cell Types
There are many types of PV cells, these types are:
Mono-crystalline silicon
The open circuit voltage is (0.6-0.62) for each cell.
The short circuit current (3.4A/100cm2).
Efficiency (10-15) %.
The most expensive to produce and buy.
It has very slow degradation (typically 0.25-0.5% per year).
Usually provide best warranties typically 25 years, with best over
90% power generation output for 10 years and 80% output to 20
years.
Poly-crystalline silicon
The open circuit Voltage (0.55-0.58).
The short circuit current (2.6-3.1A/100cm2)
The efficiency (8-13) %.
Moderately expensive to produce and buy.
Output efficiency decreases by approximately 0.5% per degree C
above the standard test temperature of 25°C [9 ].
Amorphous silicon (non-crystalline, “thin film”)
Open circuit Voltage (0.65-0.78).
Short circuit current (1-2 A/100cm2)
Efficiency (4.5-8) %.
Least expensive to produce and buy.
15
Efficiency degradation with time up to 30% of the initial efficiency
after one year of operation.
Output efficiency decreases slightly less than crystalline modules
above the standard test temperature of 25°C [9].
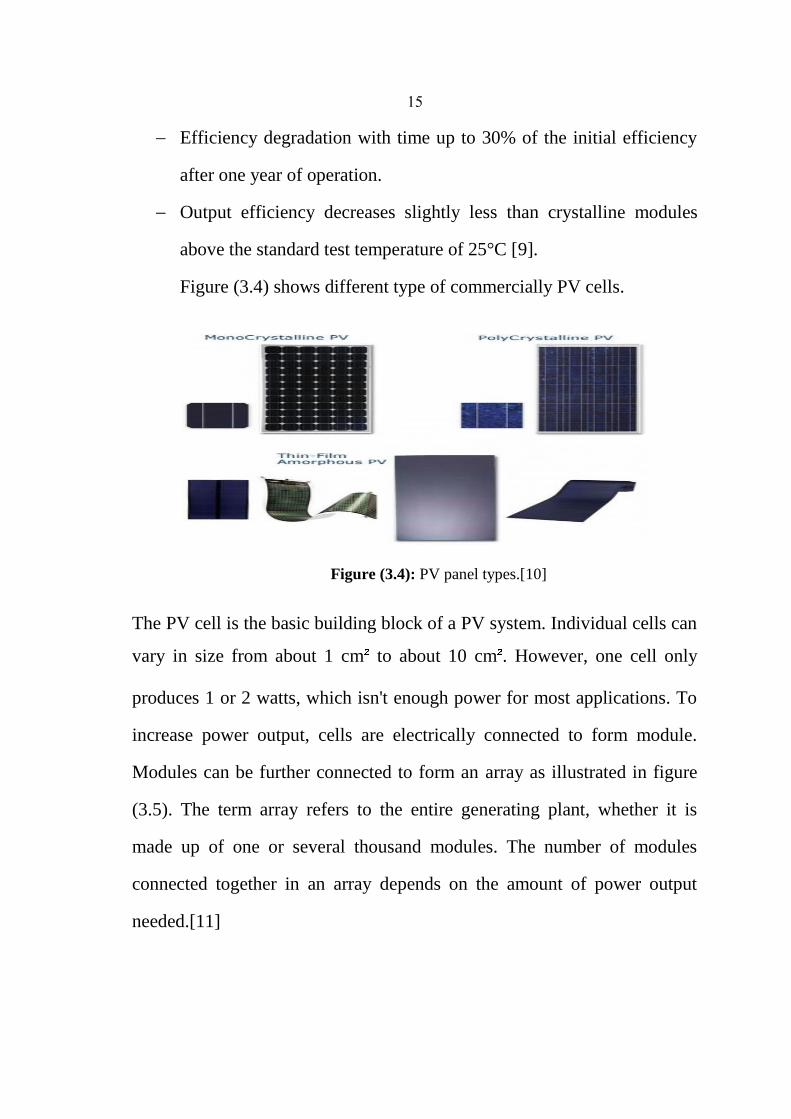
Figure (3.4) shows different type of commercially PV cells.
Figure (3.4): PV panel types.[10]
The PV cell is the basic building block of a PV system. Individual cells can
vary in size from about 1 cm to about 10 cm . However, one cell only
produces 1 or 2 watts, which isn't enough power for most applications. To
increase power output, cells are electrically connected to form module.
Modules can be further connected to form an array as illustrated in figure
(3.5). The term array refers to the entire generating plant, whether it is
made up of one or several thousand modules. The number of modules
connected together in an array depends on the amount of power output
needed.[11]
16
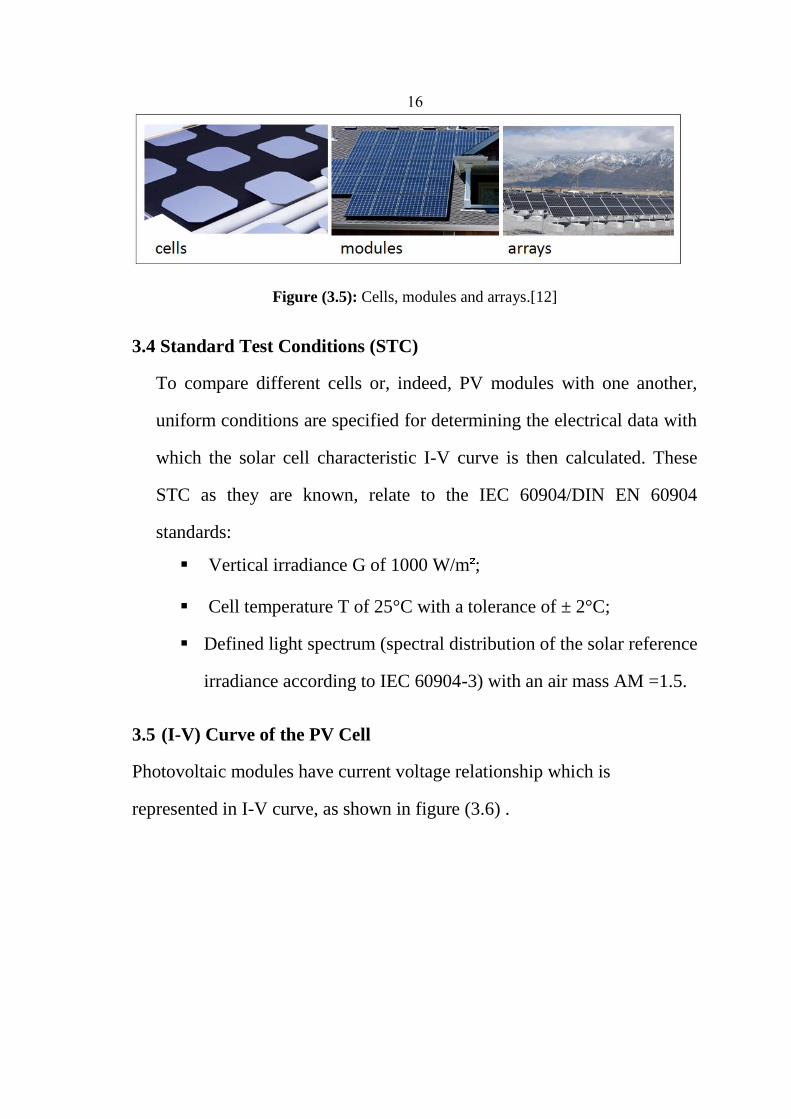
Figure (3.5): Cells, modules and arrays.[12]
3.4 Standard Test Conditions (STC)
To compare different cells or, indeed, PV modules with one another,
uniform conditions are specified for determining the electrical data with
which the solar cell characteristic I-V curve is then calculated. These
STC as they are known, relate to the IEC 60904/DIN EN 60904
standards:
Vertical irradiance G of 1000 W/m ;
Cell temperature T of 25°C with a tolerance of ± 2°C;
Defined light spectrum (spectral distribution of the solar reference
irradiance according to IEC 60904-3) with an air mass AM =1.5.
3.5 (I-V) Curve of the PV Cell
Photovoltaic modules have current voltage relationship which is
represented in I-V curve, as shown in figure (3.6) .

17
Figure(3.6): (I-V) Characteristics of a typical silicon PV cell.[13]
Basically, the I-V curve is characterized by the following three points:
a. The maximum power point (MPP) value, is the point on the I-V
curve at which the solar cell works with maximum power. For this
point, the power PMPP, the current IMPP and voltage VMPP are
specified. This MPP power is given in units of peak watts (Wp).
b. The short circuit current ISC is approximately 5 % to 15 % higher
than the MPP current. With crystalline standard cells (10cm x 10cm)
under STC, the short circuit current ISC is around the 3A.
c. The open circuit voltage VOC registers, with crystalline cells,
approximately 0.5V to 0.6V, and for amorphous cells is
approximately 0.6V to 0.9V.[9].

18
3.6 Effect of Solar Radiation on PV Performance
The irradiance will affect the current generated by a solar cell, the
higher the irradiance the higher the current. The effect of irradiance on
voltage is minimal .The change in Irradiance can be calculated, the
manufacturer’s standards will provide the user with a short circuit
current, which can be recalculated for the new irradiance value by
equation (5.1).
Isc (G) = (Isc rated@1000 W/m2) × (G/Gstc) (3.1)
Isc: Short circuit current.
G: The actual radiation.
Gstc: STC value of radiation (1000W/m2).
Figure (3.7): The effect of irradiance on the voltage and the current of the PV
array.[14]
19
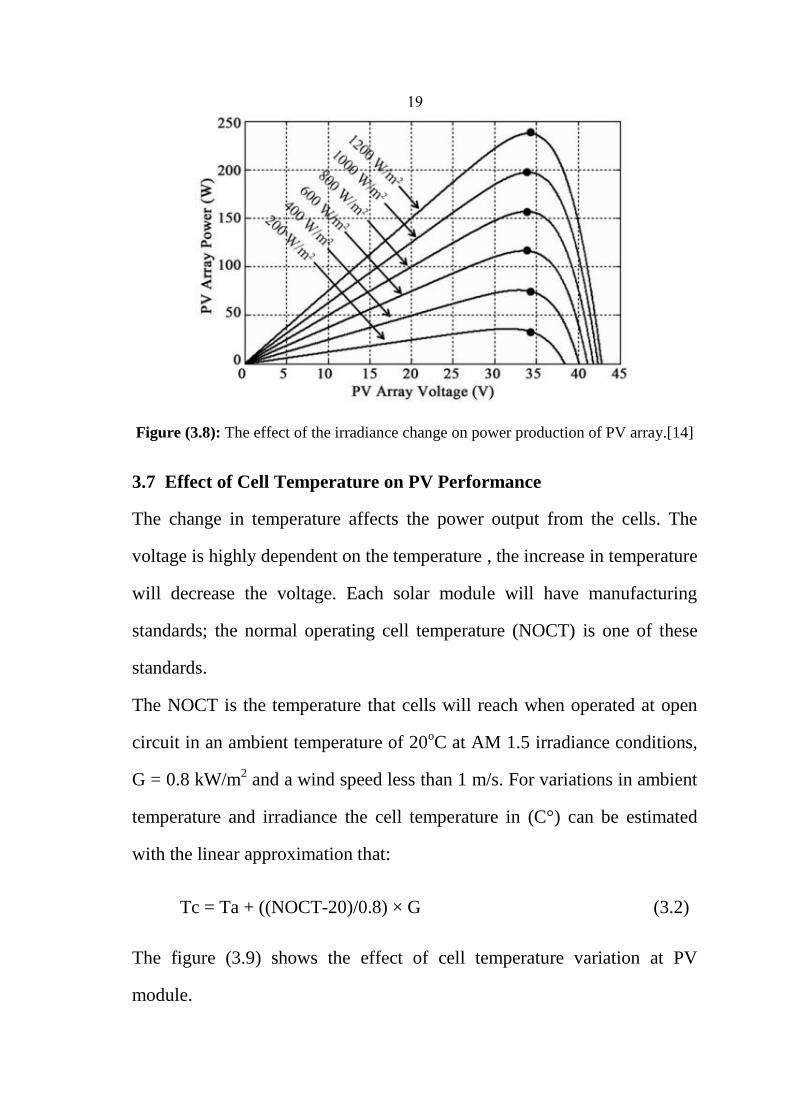
Figure (3.8): The effect of the irradiance change on power production of PV array.[14]
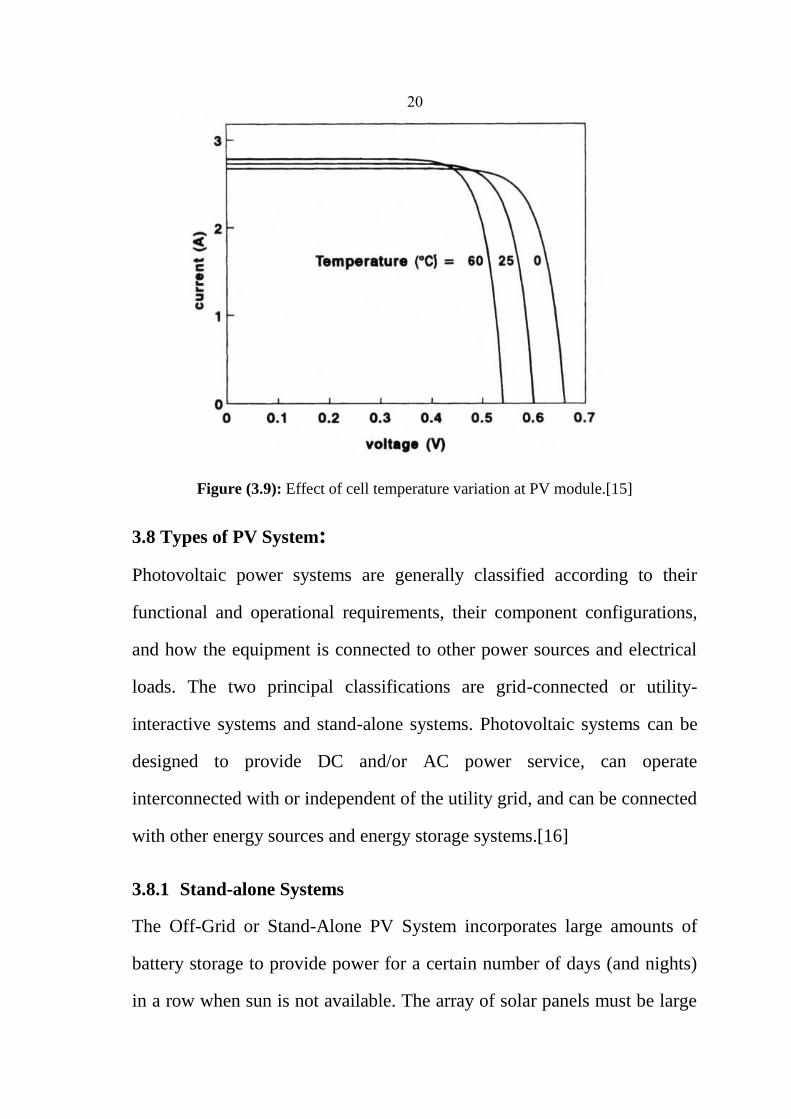
3.7 Effect of Cell Temperature on PV Performance
The change in temperature affects the power output from the cells. The
voltage is highly dependent on the temperature , the increase in temperature
will decrease the voltage. Each solar module will have manufacturing
standards; the normal operating cell temperature (NOCT) is one of these
standards.
The NOCT is the temperature that cells will reach when operated at open
circuit in an ambient temperature of 20oC at AM 1.5 irradiance conditions,
G = 0.8 kW/m2 and a wind speed less than 1 m/s. For variations in ambient
temperature and irradiance the cell temperature in (C°) can be estimated
with the linear approximation that:
Tc = Ta + ((NOCT-20)/0.8) × G (3.2)
The figure (3.9) shows the effect of cell temperature variation at PV
module.
22
Figure (3.9): Effect of cell temperature variation at PV module.[15]
3.8 Types of PV System:
Photovoltaic power systems are generally classified according to their
functional and operational requirements, their component configurations,
and how the equipment is connected to other power sources and electrical
loads. The two principal classifications are grid-connected or utility-
interactive systems and stand-alone systems. Photovoltaic systems can be
designed to provide DC and/or AC power service, can operate
interconnected with or independent of the utility grid, and can be connected
with other energy sources and energy storage systems.[16]
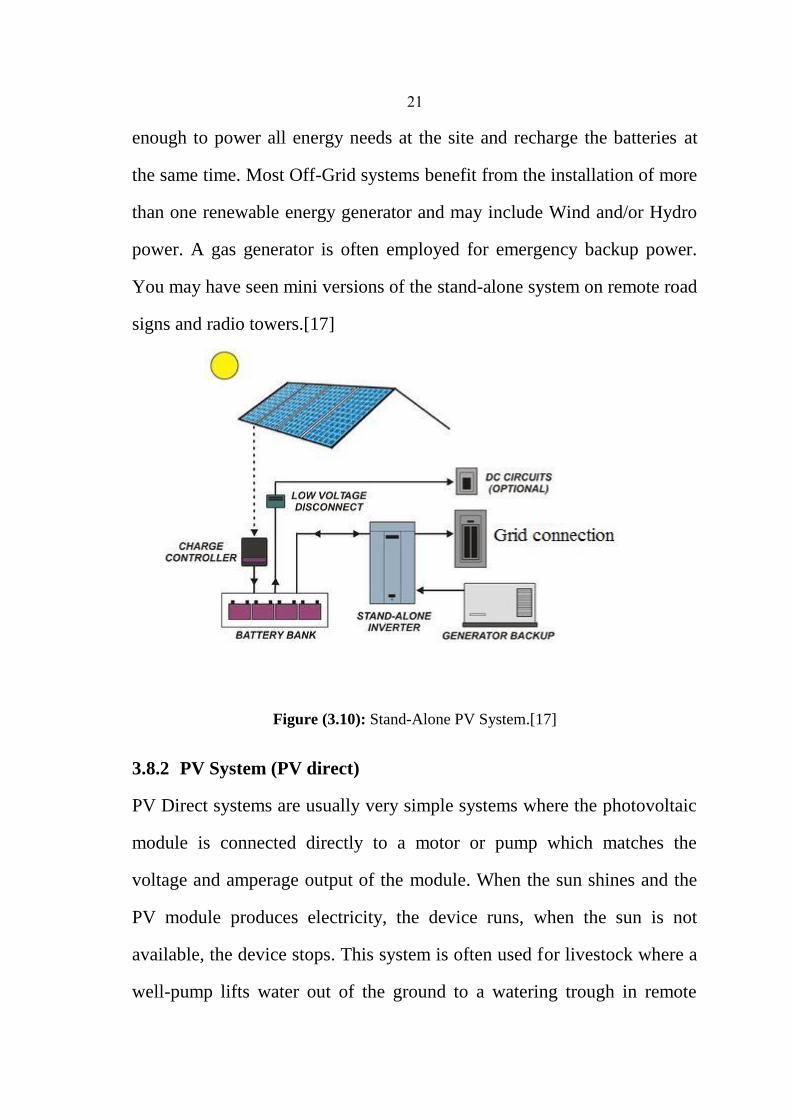
3.8.1 Stand-alone Systems
The Off-Grid or Stand-Alone PV System incorporates large amounts of
battery storage to provide power for a certain number of days (and nights)
in a row when sun is not available. The array of solar panels must be large
21
enough to power all energy needs at the site and recharge the batteries at
the same time. Most Off-Grid systems benefit from the installation of more
than one renewable energy generator and may include Wind and/or Hydro
power. A gas generator is often employed for emergency backup power.
You may have seen mini versions of the stand-alone system on remote road
signs and radio towers.[17]
Figure (3.10): Stand-Alone PV System.[17]
3.8.2 PV System (PV direct)
PV Direct systems are usually very simple systems where the photovoltaic
module is connected directly to a motor or pump which matches the
voltage and amperage output of the module. When the sun shines and the
PV module produces electricity, the device runs, when the sun is not
available, the device stops. This system is often used for livestock where a
well-pump lifts water out of the ground to a watering trough in remote

22
locations. Other applications include solar powered attic fans, irrigation
systems and small day-time garden waterfalls or fountains.
Figure (3.11): PV direct system.[17]
3.8.3 Grid- Tied PV power system (Battery free)
The simplest and most cost effective PV design for most sites is the "Grid-
Tie" (sometimes referred to as intertied or utility-interactive) system. This
system does not provide backup power during a power outage (even if the
sun is shining) but for sites with reliable grid power, this is usually
the logical system choice.[17]
Figure (3.12): Grid-Tie Battery less PV System.[17]

23
3.8.4 Grid-Tied PV system with battery backup
The Grid-Tie with battery backup system can also push excess electricity
produced to the electric utility grid but has the added feature of batteries in
order to power some selected backup loads when the grid is down. With
this benefit comes increased complexity, cost and maintenance
requirements.[17]
Figure (3.13): Grid-Tied PV System with Battery Backup.[17]

24
Chapter Four
Energy Situation In Palestine
25
Chapter Four
Energy Situation In Palestine
4.1 Introduction:
Palestine is considered as one of the poorest countries in terms of
conventional energy resources. Gaza Power Plant (GPP) is the only
significant generation, with a capacity of 140MW. Indigenous energy
resources are almost limited to solar energy for photovoltaic and thermal
applications (mainly for water heating), and biomass (wood and
agricultural waste) for cooking and heating in rural areas.
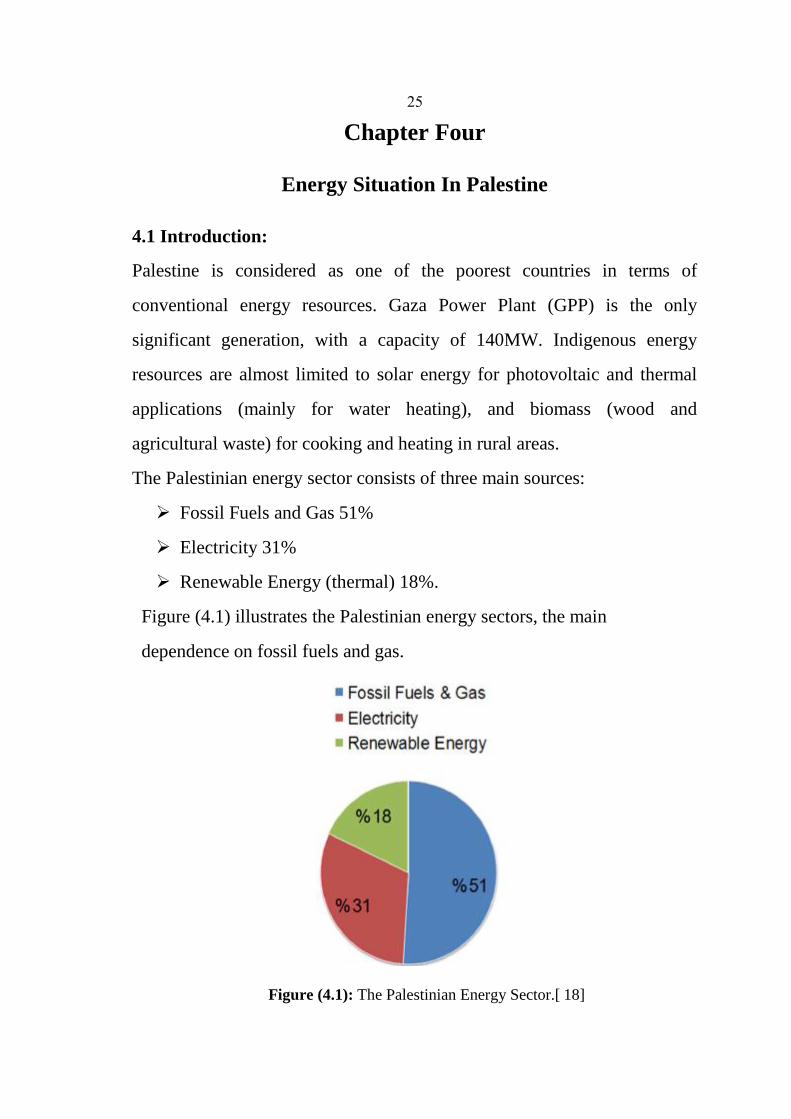
The Palestinian energy sector consists of three main sources:
Fossil Fuels and Gas 51%
Electricity 31%
Renewable Energy (thermal) 18%.
Figure (4.1) illustrates the Palestinian energy sectors, the main
dependence on fossil fuels and gas.
Figure (4.1): The Palestinian Energy Sector.[ 18]

26
West Bank depends almost entirely on Israel Electrical Corporation (IEC)
for electricity supply. IEC supplies a maximum of 650 MW to the West
Bank. West Bank has three 161/33 KV substations:
South in area C close to Hebron.
North in the Ariel settlement (area C) close to Nablus.
Atarot industrial area (area C) near Jerusalem.[19]
Palestinian Authority (PA) agreement with Jordan:
Grid connected 33 kV line at Jericho via King Abdullah Bridge with
nominal power of 20 MW.
JDECO requested line upgrade to 132 KV to be compatible with
Jordanian voltage.
4.2 Electricity Situation in Palestine:
The electric power supply is characterized now as follows.
Fully dependent on the IEC (88%).
99% of population benefit from electricity.
High growth of electricity consumption 7% every year.
High tariff imposed from the IEC compared with neighboring
countries.
High rate of electricity losses (26%).
4.3 Renewable Energy Situation:
The daily solar radiation in Palestine is between 2.63 kWh/m²-day in
December to 8.5 kWh/m²-day in June.

27
Daily average of solar radiation intensity on horizontal surface is
(5.4 kWh/m²-day) while the total annual sunshine hour amounts to
about 3000.
Average Wind speed in Palestine about 2-6 m/s.
About 72% of Palestinians are using now solar water heating system
in their houses.
The implemented renewable energy projects in Palestine are
focused on PV applications. The total installed capacity of PV is
about 1 MW peak.[18]
4.4 The Overall Strategy for Renewable Energy in Palestine:
4.4.1 RES main purposes:
•The renewable energy strategy provides the basis for planning,
implementing and monitoring RE in Palestine.
•The renewable energy strategy provides a roadmap for allocating
external financing sources needed in the short-term.
4.4.2 RES Target:
By the year 2020:
240 GWh (130 MWp(.
10% electricity from RES (locally generated(.
Raise RE to 25% (as Electric Energy).
Based on the assessment studies of RES conducted by the PEA 2010:
28
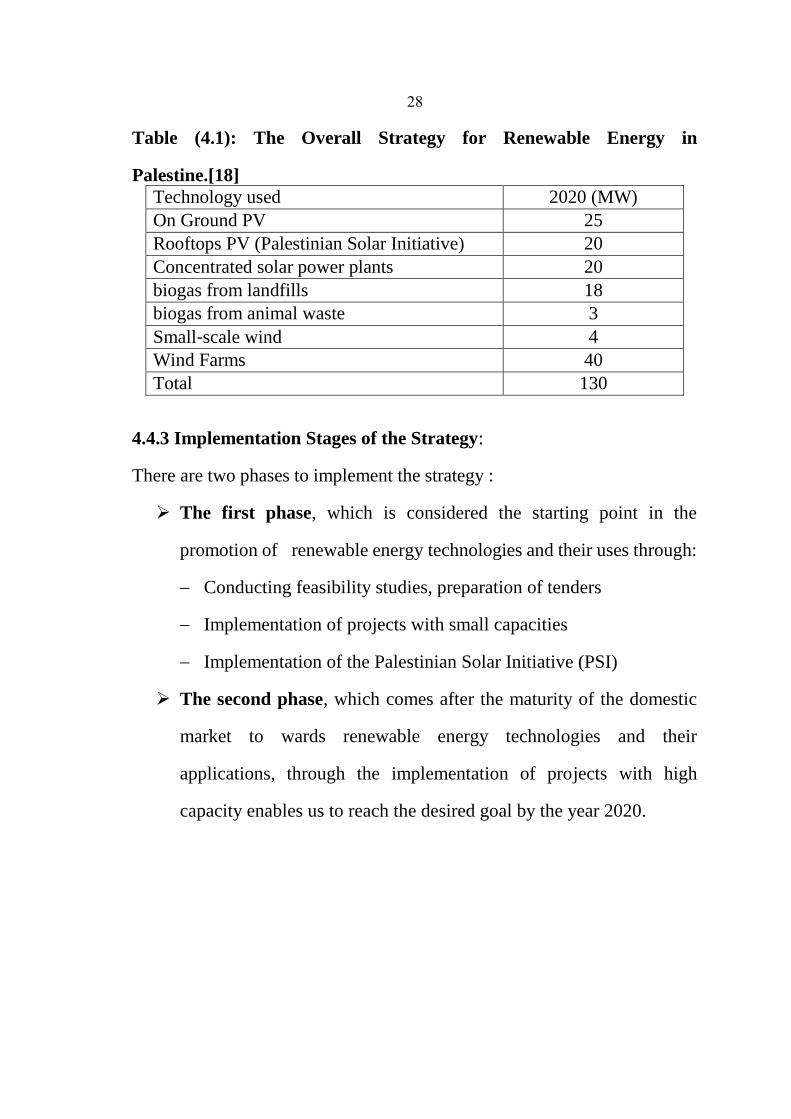
Table (4.1): The Overall Strategy for Renewable Energy in
Palestine.[18]
Technology used 2020 (MW)
On Ground PV 25
Rooftops PV (Palestinian Solar Initiative) 20
Concentrated solar power plants 20
biogas from landfills 18
biogas from animal waste 3
Small‐scale wind 4
Wind Farms 40
Total 130
4.4.3 Implementation Stages of the Strategy:
There are two phases to implement the strategy :
The first phase, which is considered the starting point in the
promotion of renewable energy technologies and their uses through:
Conducting feasibility studies, preparation of tenders
Implementation of projects with small capacities
Implementation of the Palestinian Solar Initiative (PSI)
The second phase, which comes after the maturity of the domestic
market to wards renewable energy technologies and their
applications, through the implementation of projects with high
capacity enables us to reach the desired goal by the year 2020.
29
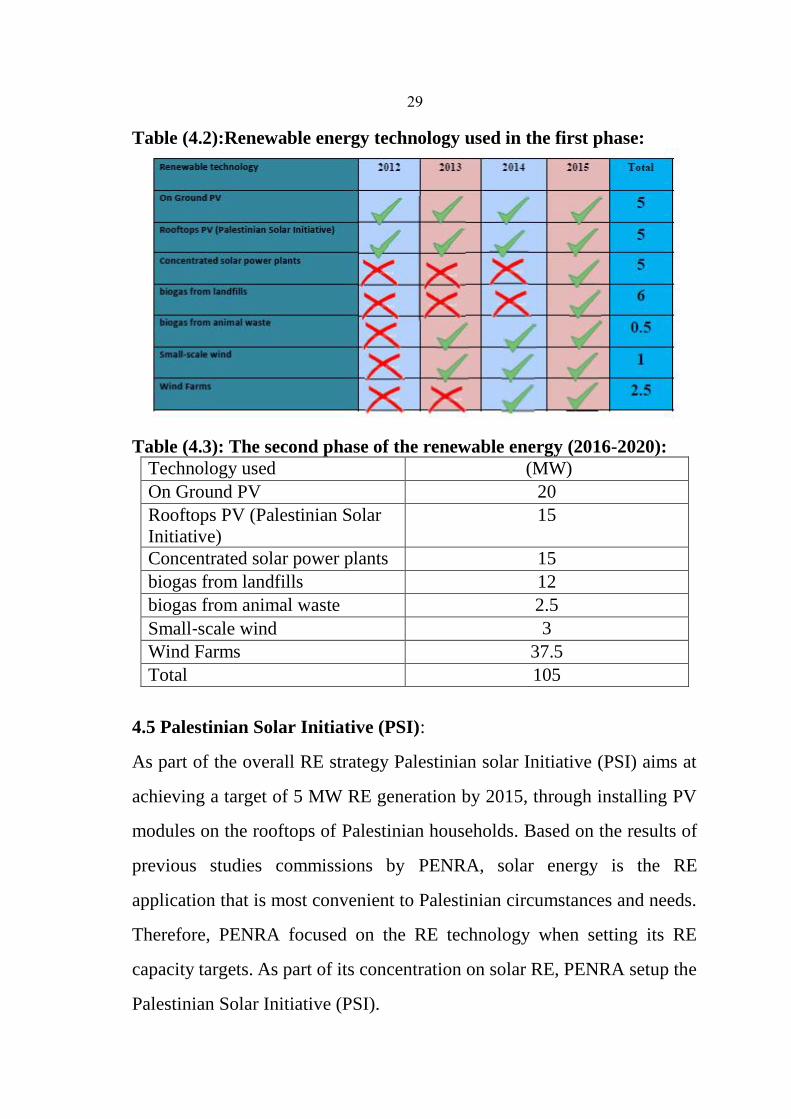
Table (4.2):Renewable energy technology used in the first phase:
Table (4.3): The second phase of the renewable energy (2016-2020):
Technology used (MW)
On Ground PV 20
Rooftops PV (Palestinian Solar
Initiative)
15
Concentrated solar power plants 15
biogas from landfills 12
biogas from animal waste 2.5
Small‐scale wind 3
Wind Farms 37.5
Total 105
4.5 Palestinian Solar Initiative (PSI):
As part of the overall RE strategy Palestinian solar Initiative (PSI) aims at
achieving a target of 5 MW RE generation by 2015, through installing PV
modules on the rooftops of Palestinian households. Based on the results of
previous studies commissions by PENRA, solar energy is the RE
application that is most convenient to Palestinian circumstances and needs.
Therefore, PENRA focused on the RE technology when setting its RE
capacity targets. As part of its concentration on solar RE, PENRA setup the
Palestinian Solar Initiative (PSI).

32
The initiative 's target is to achieve 5MW of solar RE by 2015 through
installing PV modules on the rooftops of Palestinian households throughout
the west bank. In addition, the initiative will include capacity building and
training component for all the relevant stakeholders and the preparation of
required detailed studies and documents necessary for the implementation
of the overall RE strategy. For the first stage of the initiative the cost of 1
kWh produced by the first 100 house is 1.07 NIS, while the remaining
houses 0.80 NIS for the cost of 1 kWh, but as a result of funding problems
the tariff have been reduced to 0.63 NIS.
Table (4.4): Phases of the Palestinian Solar Initiative.
Phase 2012-2013 2013-2014 2014-2015
Capacity Installed (MW) 0.5 1.5 3
Number of Homes 100 300 600
Percentage
(geography
distribution)
30% N 40% M 30% S
4.6 Tubas district Electricity Company(TDECO)
The company was established in 2006, but it began the actual work since
2002, the company is currently supplying forty area in Jenin and Tubas by
electricity. It has one point link with Israel Electrical Corporation (IEC)
with rated power 20 MVA.
The company, with funding from the Czech government has established the
Maintenance Center in 2010 and started to use programs like (GIS) and
(SCADA), but the solar projects is the most important. They were
classified as follow:
1. Generating units owned by the company.

31
470KWp generating unit using solar energy There are two stages of this
projects:
It has been implemented in two phases:
First stage : the rated power is 120 kWp, it started working in June
2013, the cost of this stage is 465,000 $, built on 3000 m² area and
produced 216,000 kWh/year and reduced the CO2 by 205 ton/year.
Second stage: the rated power is 370 kWp, it started working in
2015 the cost was 700,000 $, the yearly energy production will be
630,000 kWh and reduces the CO2 by 600 ton/year.
The production of the whole generating units will represent 1.05% of
the company consumption.
2. Generating units using solar energy to serve the agricultural sector.
First stage: Three generating units each rated 15 kWp were
implemented in 2013.
Second stage: 90 kWp will be implemented soon.
After the completion of these phases, they will represent 0.23% of the
company consumption.
3. Feed In Tariff (FIT) : initiative has been called "the Palestinian Solar
Initiative" "PSI" designed to encourage investment in the energy sector.
The first phase was planned for the first hundred houses in the West
Bank at a price 1.07 shekels ($ 0.31) and joined by 48 house on the area
of Tubas Electricity Company which represent 48% of the phase.
Although the tariff is reduced to 0.8 shekels, the joined houses
increased to 112 houses. The yearly energy production from these
generators is 1008,000 kWh which cost 134,467 $, this will represent

32
1.25% of the company consumption, and reduce the CO2 by 957
ton/year.
4. PV generators to light the remote villages: PV generators on grid and
off grid in some villages like Atoof , Yerza and Ibziq with rated power
28 kWp were built. These plants produce 50,400 kWh/year and
represent 0.06% from the company consumption.
5. PV generators for other sectors: 112 kWp was installed for this purpose
to represent 0.25% of the company consumption, producing about
202,000 kWh/year.
6. PV stations for the private sectors: It is planned to establish a new
station with rated power of 3MWp which will produce 5,400,000
kWh/year and represent 6.67% of the total consumption of TEDCO.
In 2016 the energy produced from solar energy will represent 23% from the
total consumption of TEDCO.[20]
Figure(4.2): The production of PV generators of TEDCO company as percentage of
total consumption.
0.00%
0.20%
0.40%
0.60%
0.80%
1.00%
1.20%
1.40%
Owned bycompany
Feed in tarrif Agricultural Remote area Other sectors

33
Chapter Five
Case study Project area Tubas

34
Chapter Five
Case study Project area Tubas
5.1 Introduction:
Solar energy is the conversion of the sun's radiation into useful forms of
energy such as electricity or heat. The amount of solar radiation depends on
many factors including geographic location (latitude, longitude) ,time of
the day, season ,and the local weather.[9]
On 31/1/2012, the Palestinian energy and natural resources authority issued
the Palestine solar initiative. The Palestinian Authority had set a goal in
which 10% of electricity generated in Palestine is going to be generated
through renewable resources by the year 2020. The initiative's target is to
achieve 5 MW of solar energy by 2015 through installing PV modules on
the rooftops of Palestinian households through the west bank.[18]
These PV power systems consist of modules, inverter, electric equipment (
cable,joint boxes, swiches ,etc) , aluminum supports structure, earthing and
the protection components. Each element of these affects the production of
energy or the safety. In order to increase the energy output and improve the
safety of these PV systems, there are different possibilities that have to be
investigated.
In order to do that three houses in Tubas area were selected to be studied.
We made visits to the three systems and took some measurements to do the
study like energy produced and mounting tilt angles.
35
5.2 Energy Produced for the Systems.
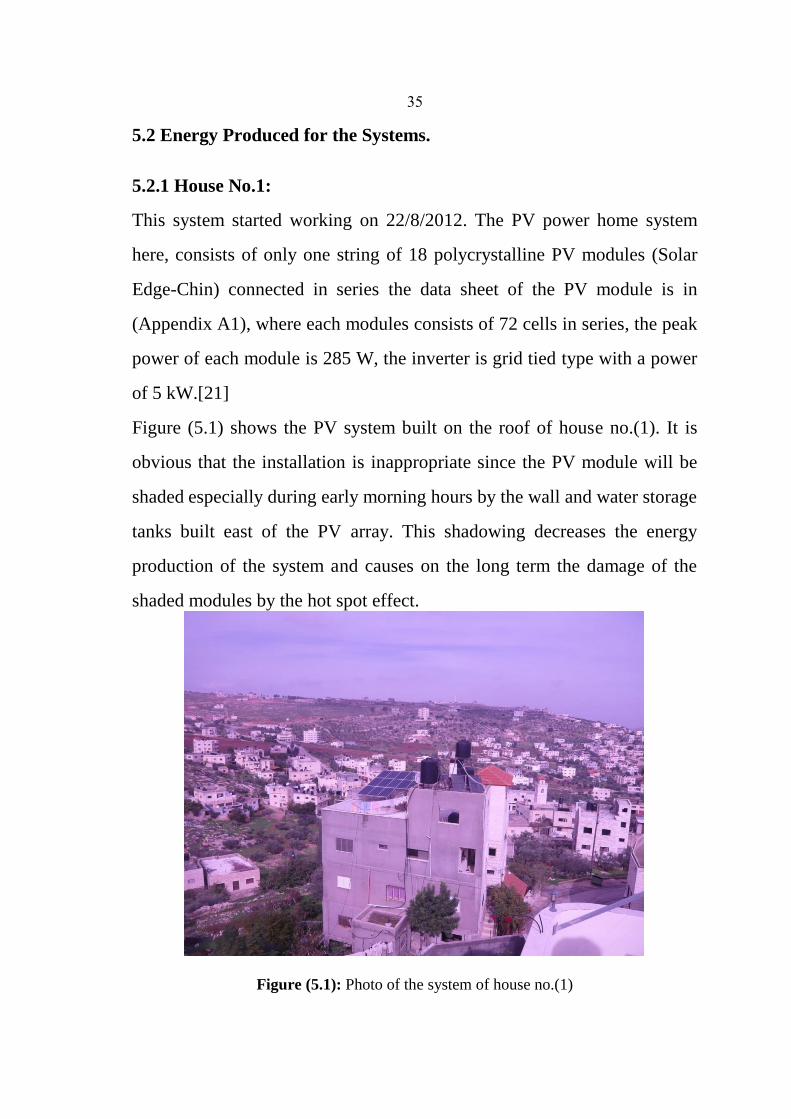
5.2.1 House No.1:
This system started working on 22/8/2012. The PV power home system
here, consists of only one string of 18 polycrystalline PV modules (Solar
Edge-Chin) connected in series the data sheet of the PV module is in
(Appendix A1), where each modules consists of 72 cells in series, the peak
power of each module is 285 W, the inverter is grid tied type with a power
of 5 kW.[21]
Figure (5.1) shows the PV system built on the roof of house no.(1). It is
obvious that the installation is inappropriate since the PV module will be
shaded especially during early morning hours by the wall and water storage
tanks built east of the PV array. This shadowing decreases the energy
production of the system and causes on the long term the damage of the
shaded modules by the hot spot effect.
Figure (5.1): Photo of the system of house no.(1)

36
The IV characteristics of the used PV module is illustrated in Fig(5.2). This
curve can be considered also for the modules that were used in house(2)
and hosee(3), with the only difference that the peak power of each module
is 280 W. The tilt angle for this system is 15° faced south, the area of one
module is 1.940 m². For all systems the structure type is galvanized steel.
Figure (5.2): IV characteristic curve for One PV- Module in function of solar radiation
intensity.[22]
Note: the specifications are obtained under the Standard Test Conditions
(STCs): 1000 W/m2 solar irradiance, 1.5 Air Mass, and cell temperature of
25 C°.
37
The NOCT is obtained under the Test Conditions : 800 W/m2, 20°C
ambient temperature, 1 m/s wind speed, AM 1.5 spectrum.
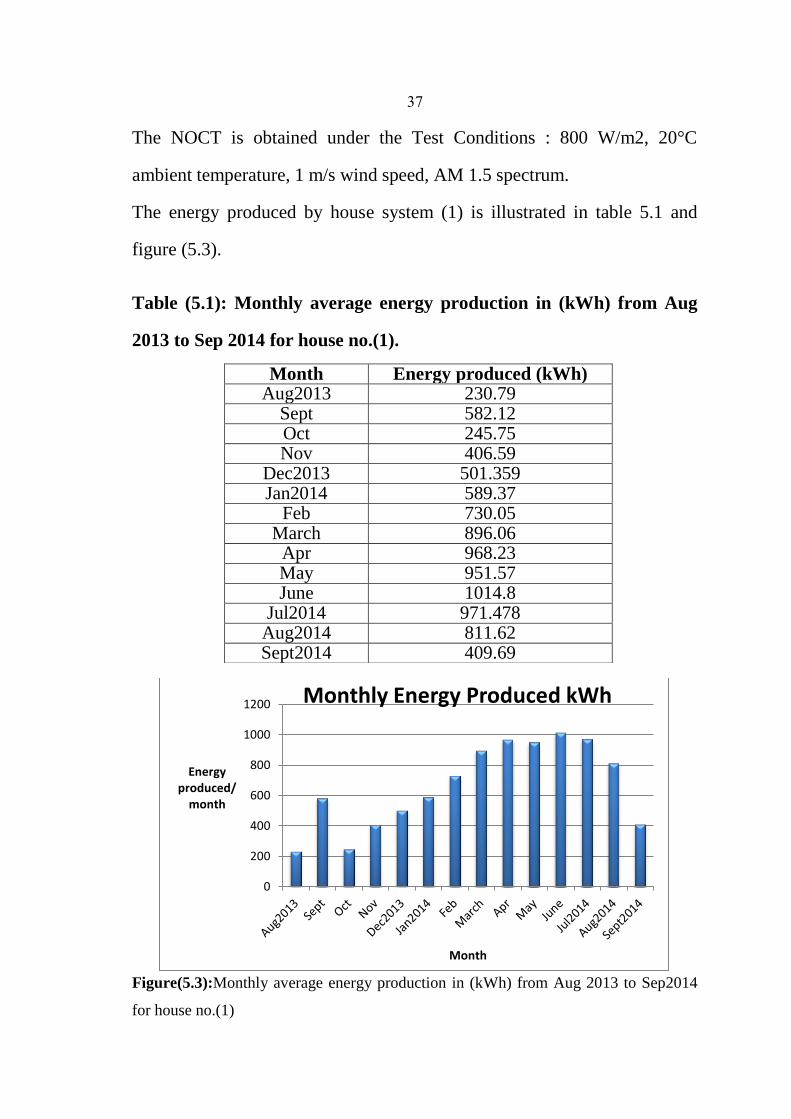
The energy produced by house system (1) is illustrated in table 5.1 and
figure (5.3).
Table (5.1): Monthly average energy production in (kWh) from Aug
2013 to Sep 2014 for house no.(1).
Figure(5.3):Monthly average energy production in (kWh) from Aug 2013 to Sep2014
for house no.(1)
0
200
400
600
800
1000
1200
Energy produced/
month
Month
Monthly Energy Produced kWh
Energy produced (kWh) Month 230.79 Aug2013 582.12 Sept 245.75 Oct 406.59 Nov 501.359 Dec2013 589.37 Jan2014 730.05 Feb 896.06 March 968.23 Apr 951.57 May 1014.8 June 971.478 Jul2014 811.62 Aug2014 409.69 Sept2014

38
As we see from the previous table and curve the largest production was
1014.8 kWh in June, due to the largest solar radiation on this month. The
lowest production was in Aug 2013 230.79 kWh.
Without respecting the year and rearranging the measured data (Jan- Dec)
we obtain the distribution of the produced energy illustrated in Fig(5.4) .
Figure (5.4): Monthly energy produced(without respecting the year).
Checking the obtained results in table (5.1) we can conclude that the results
for August, September and October (2013) are less than expected if these
are compared with the corresponding results in house no.(2) (Aug. 842.44
kWh, Sept. 732.24 kWh, Oct. 521.78 kWh) which is built at distance of
about 70 m from house no.1. Therefore, the PV system of house 1 was shut
off for unknown number of days during Aug, Sept , and Oct. 2013 which
resulted in decreasing the monthly energy production.
This measuring results for the remaining corresponding months in the two
houses are very closed which assures our above assumption for house
no.(1).
0
200
400
600
800
1000
1200
Energy produced/
month(kWh)
Monthly Energy Produced kWh
39
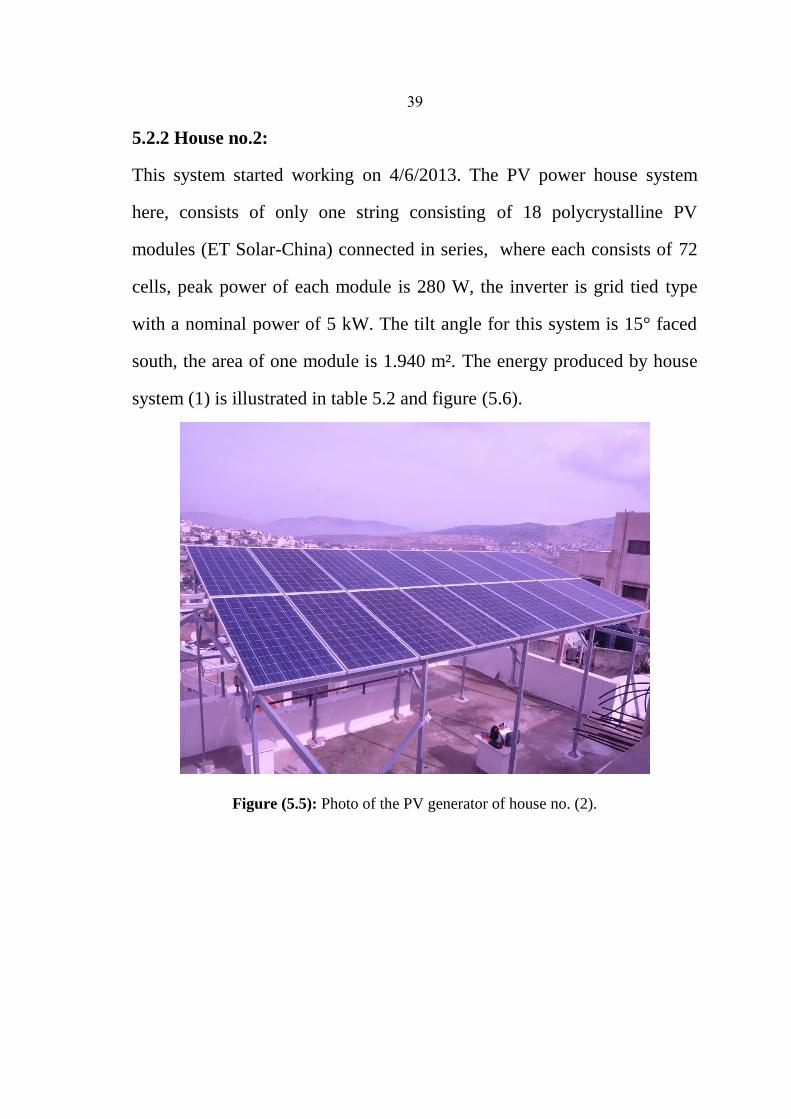
5.2.2 House no.2:
This system started working on 4/6/2013. The PV power house system
here, consists of only one string consisting of 18 polycrystalline PV
modules (ET Solar-China) connected in series, where each consists of 72
cells, peak power of each module is 280 W, the inverter is grid tied type
with a nominal power of 5 kW. The tilt angle for this system is 15° faced
south, the area of one module is 1.940 m². The energy produced by house
system (1) is illustrated in table 5.2 and figure (5.6).
Figure (5.5): Photo of the PV generator of house no. (2).

42
Table (5.2): Monthly average energy production in (kWh) from June
2013 to June 2014 for house no.(2).
Energy Produced (kWh) Month
913.33 June2013
983.59 July
842.44 Aug
732.24 Sept
521.78 Oct
422.33 Nov
508.24 Dec
571.29 Jan2014
719.44 Feb
884.87 March
955.04 April
951.18 May
1034.19 June2014
Figure(5.6):Monthly average energy production in (kWh) from June2013 to June2014
of house no.(2).
0
200
400
600
800
1000
1200
Energy produced/
month
Energy Produced (kWh)

41
From table (5.2), the largest energy production was in July 2014 amounting
to 1034.19 kWh , while the lowest energy production was in November
2013 amounting to 422.33 kWh.
Without respecting the year and rearranging the measured data (as usual
Jan- Dec) we obtain the distribution of the produced energy illustrated in
Fig(5.5) .
Figure(5.7): Monthly energy produced(without respecting the year) for house no.(2).
5.2.3 House No.3:
This system started working on 9/5/2013. The PV power house system
here, consists of 18 polycrystalline PV modules (ET Solar-China)
connected in two parallel stings where each string consists of 9 modules
connected in series. Each PV module consists of 72 cells connected in
series. The peak power of each module is 280 W. The inverter is grid tied
type with a rated power of 5 kW. The tilt angle of this system is 25° and the
area of each module is 1.940 m².
0
200
400
600
800
1000
1200
energy produced/
month
Energy Produced (kWh)
42
Figure (5.6): Photo of the PV system of house (3).
Table (5.3):Monthly average of energy production in (kWh) during
2014 of house no.(3).
Month Energy produced(kWh)
Jan 580
Feb 693
Mar 772
Apr 871
May 926
Jun 894
Jul 1062
Aug 854
Sep 780
Oct 755
Nov 607
Dec 510

43
Figure(5.8): Monthly average energy production in (kwh) during 2014of house no.(3).
From the last table the largest production was in July 1062 kWh , while the
smallest production was in December with 510 kWh.
5.3 Comparison of the energy produced from the three houses
The monthly energy produced by the three houses is illustrated in table 5.4.
Table (5.4): The energy produced from the three houses.
House(3) House(2) House(1) Month
580 571.29 589.37 Jan
693 719.44 730.05 Feb
772 884.87 896.06 Mar
871 955.04 968.23 Apr
926 951.18 951.57 May
894 1034.19 1014.8 Jun
1062 983.59 971.478 Jul
854 842.44 811.62 Aug
780 732.24 409.69 Sep
755 521.78 245.75 Oct
607 422.33 406.59 Nov
510 508.24 501.359 Dec
9304 9126.63 8496.567 Yearly avg
0
200
400
600
800
1000
1200
Jan Feb Mar Apr May Jun Jul Aug Sep Oct Nov Dec
Energy produced/
month
Energy Produced (kWh)

44
As table (5.4) shows , different energy values were produced by the houses
during the same month. This is due to many reasons as different array tilt
angle, increased and decreased temperatures during different seasons.
Tilt angle is the angle between the surface of the PV-array and the
horizontal axis. Fixing tilt angle at a certain angle all the year to the latitude
value (32º) in Palestine increases the solar energy collected by the modules.
Seasonal changes of tilt angle of solar modules collect higher solar energy
than those of the fixed solar modules.[9]
Figure (5.7): PV Array Tilt Angle.[23]
The tilted angle β should be seasonally changed to increase the annual
produced energy as follows[23]:
β =L+20 =32 +20 =52 during winter period.
β =L=32 during spring and autumn period.
β = L-10 =32-10=22 during summer period.
45
5.4 Effect of Tilt angle on PV performance
During Jan higher tilt angle delivers more power, the tilt angle of house
no.(1) and house no.(2) is 15°, while the tilt angle for house no(3) is 25°.
The energy produced from house no.(3) should be higher than the energy of
other houses. From the measured data we find that house no.(3) produced
580 kWh which is more than house no.(1) and (2) that produced 571.29
kWh, 579.37 kWh respectively. In June the energy produced from the
house which has higher tilt angle should be smaller than the other houses.
From the measured data, house (3) produced 894 kWh and the other two
houses produced 1014.8 kWh, and 1034.19 kWh respectively which
assures the assumption.
If we take another month as September the smallest value was the energy
produced by house (3) 780 kWh which has the higher tilt angle.
The energy produced by house no(3) is the best, because its tilt angle is
nearest to the latitude angle (32°). Also this house is located in Al Fari'a
and the expected solar radiation is somehow higher than in Tubas, since Al
Fari'a is elevated at about 150 m above sea level, while Tubas is located at
about 450 m from sea level.
Although house no(1) and (2) are identical since they are located closed to
each other, they have the same kind of modules, the same inverters, and the
same tilt angle but their energy production differ, especially during
September and October. This difference is referred to unknown reasons in
house (1) resulting in unusual lower energy production during these two

46
months. Probably the system was shut down for many days during these
months.
However during the remaining months, it is obvious that the energy
production of house (1) and house (2) are as expected very close
5.5 Effect of temperature on PV performance
Solar cell performance decreases with increasing temperature, The
operating temperature plays a key role in the photovoltaic conversion
process. Both the electrical efficiency and the output power of a
photovoltaic (PV) module depend linearly on the operating
temperature.[24]
Checking the obtained measured data we find the total energy produced
during particular month like June for house (3) was only 894 kWh. This
shows that the system produces only 0.74 of its peak power. This
difference refers to the increment of temperature in June beside the higher
tilt angle resulting in remarkable less power production.
At standard conditions (STC) this system should produce in June (PSH~ 8
hours)
Energy produced/day = 8*5.04 = 40.32 kWh/day.
Which means
Energy produced/ June = 40.32*30= 1209.6 kWh/June.
If we chick the measured data in January the energy produced is 580 kWh,
the peak sun shine hours for this month is almost 3 hours.
At standard conditions:
Energy produced/day = 5.04*3= 15.12 kWh/ day.
47
Energy produced/Jan= 15.12*31=468.7 kWh/ Jan.
Measured data:
Energy produced in Jan =580 kWh/month
We find that the measured energy is higher than the energy at standard
conditions. The reason is PSH for this month was higher than 3 hours so
the PV modules produced more energy. Also the cold climate raised the
efficiency of the PV modules beside the higher tilt angle of the PV array
resulting in higher energy production.
Checking the data in Dec we find that the system performs almost at its
standard conditions and the real data is the peak power.
For the same house if we calculate the PSH we find that:
Ppv * PSHd * 31 = 580 kWh.
PSHd = 580 kWh/ 5.04 kWp * 31 =3.71 hours.
The calculated PSH was higher than the average daily PSH for Jan, which
is 3 hours. Therefore higher produced energy was obtained.
If we calculate the PSHd for Dec we will find that:
PSHd=510/5.04*31= 3.26 hours.
Which means less produced energy than in Jan.
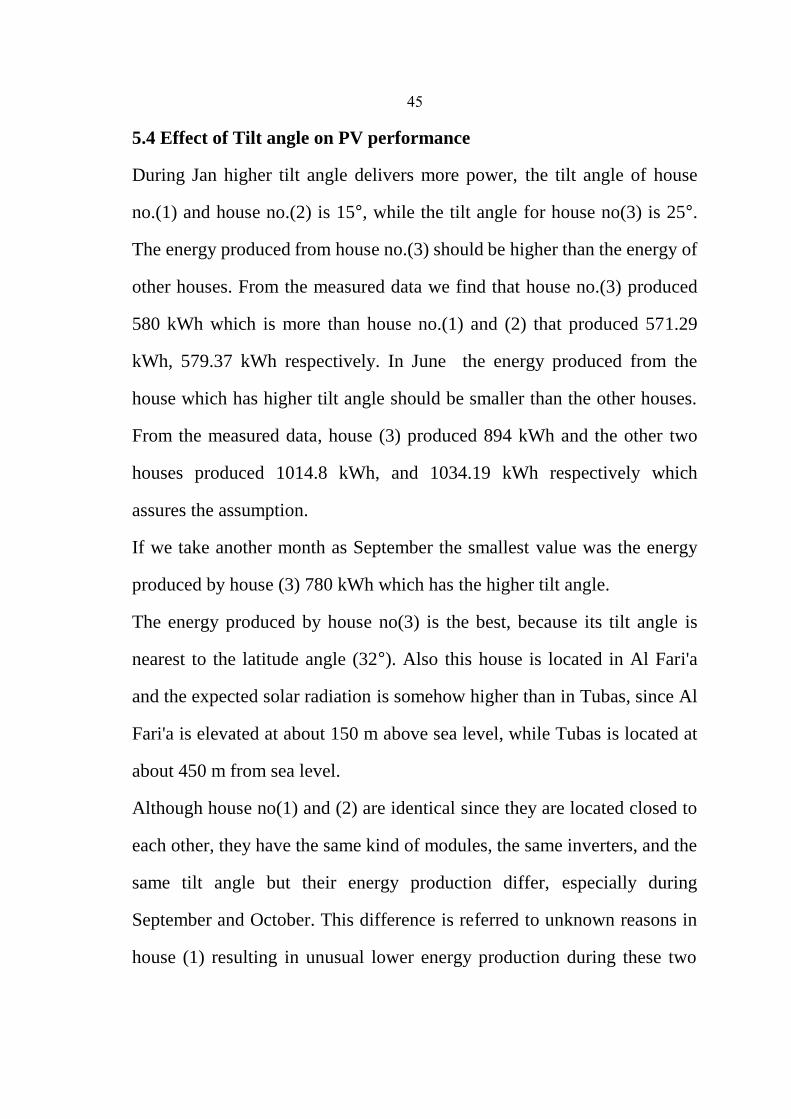
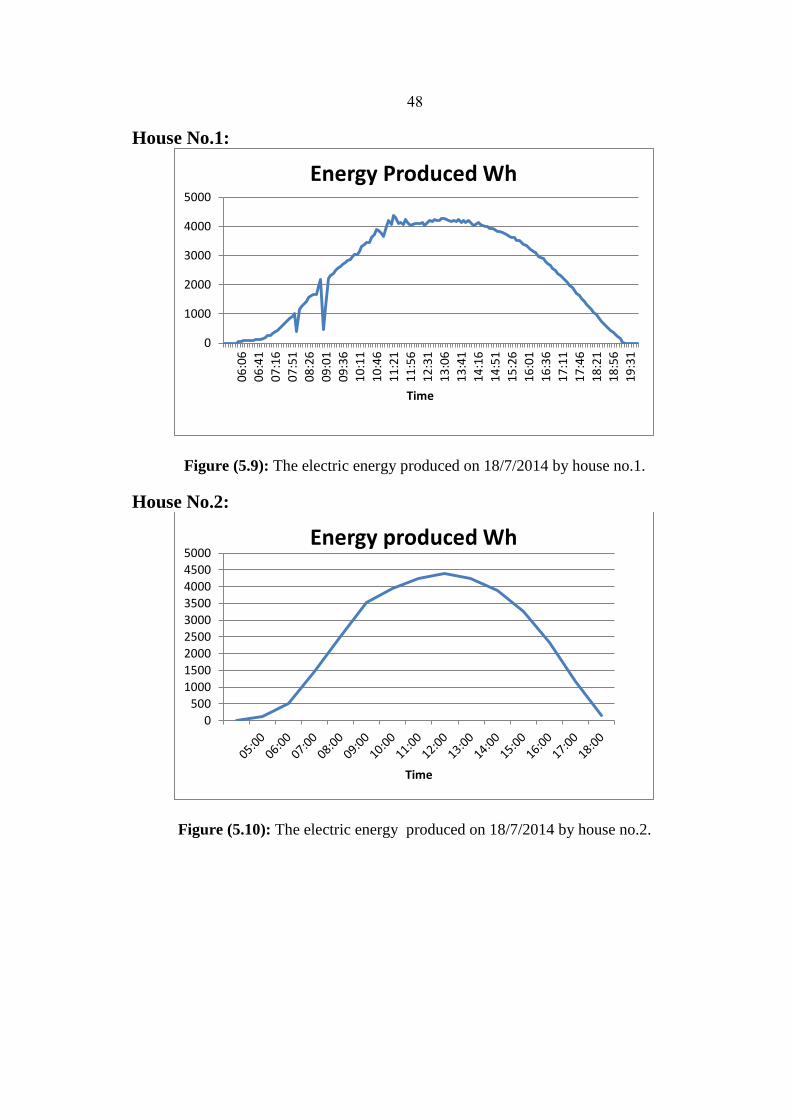
5.6 The energy produced of the three houses in a particular day:
The data was taken in a sunny day (18/7/2014) for all three houses in order
to compare the production of the systems under the same climate
conditions, (same solar radiation and ambient temperature).
48
House No.1:
Figure (5.9): The electric energy produced on 18/7/2014 by house no.1.
House No.2:
Figure (5.10): The electric energy produced on 18/7/2014 by house no.2.
0
1000
2000
3000
4000
5000
06
:06
06
:41
07
:16
07
:51
08
:26
09
:01
09
:36
10
:11
10
:46
11
:21
11
:56
12
:31
13
:06
13
:41
14
:16
14
:51
15
:26
16
:01
16
:36
17
:11
17
:46
18
:21
18
:56
19
:31
Time
Energy Produced Wh
0
500
1000
1500
2000
2500
3000
3500
4000
4500
5000
Time
Energy produced Wh
49
House No.3:
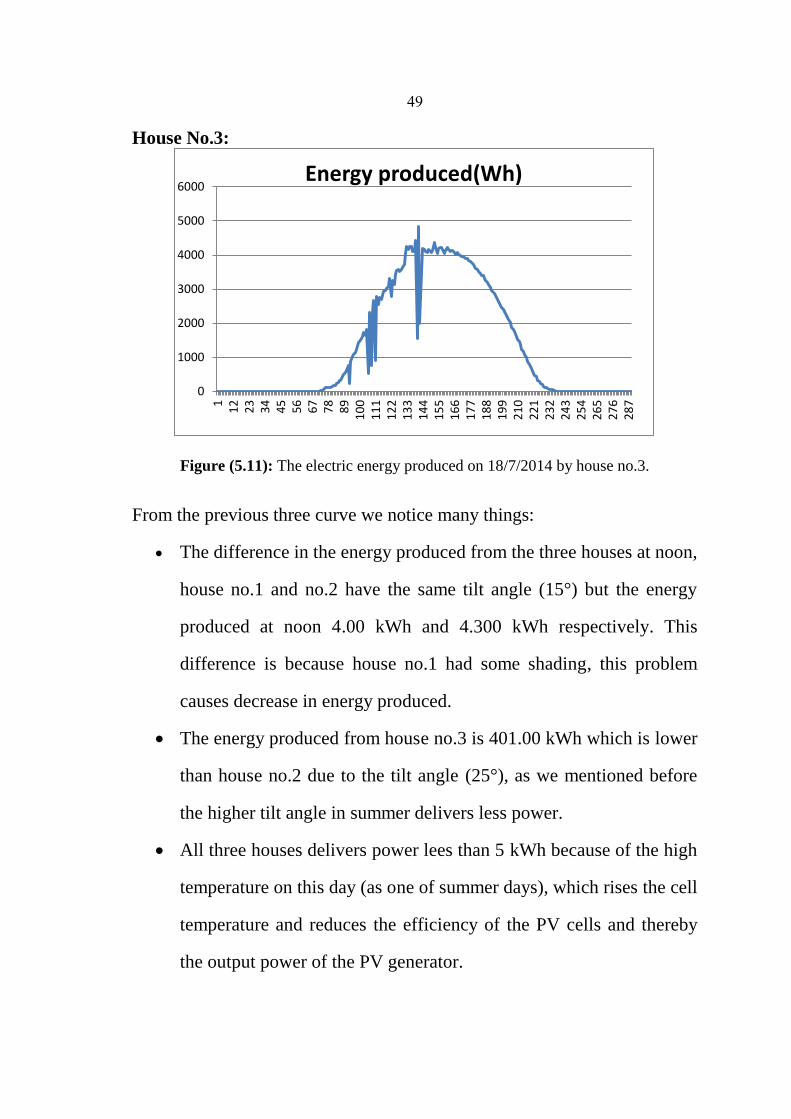
Figure (5.11): The electric energy produced on 18/7/2014 by house no.3.
From the previous three curve we notice many things:
The difference in the energy produced from the three houses at noon,
house no.1 and no.2 have the same tilt angle (15°) but the energy
produced at noon 4.00 kWh and 4.300 kWh respectively. This
difference is because house no.1 had some shading, this problem
causes decrease in energy produced.
The energy produced from house no.3 is 401.00 kWh which is lower
than house no.2 due to the tilt angle (25°), as we mentioned before
the higher tilt angle in summer delivers less power.
All three houses delivers power lees than 5 kWh because of the high
temperature on this day (as one of summer days), which rises the cell
temperature and reduces the efficiency of the PV cells and thereby
the output power of the PV generator.
0
1000
2000
3000
4000
5000
6000
11
22
33
44
55
66
77
88
91
00
11
11
22
13
31
44
15
51
66
17
71
88
19
92
10
22
12
32
24
32
54
26
52
76
28
7
Energy produced(Wh)

52
5.7 Impacts of Electric Grid Connected PV Systems on the Power
Systems
In general, grid-connected PV systems are installed to improve the
performance of the electric network, PV arrays (as well as other distributed
generation (DG) units) provide energy at the load side of the distribution
network, reducing the feeder active power loading and improving the
voltage as a result. PV systems can reduce the operation time of shunt
capacitors and series voltage regulators, thus increasing their lifetime. PV
systems can also reduce the losses in the distribution feeders if optimally
sized and allocated.
However, PV systems has also several negative impacts on power
networks, especially if their penetration level is high. These impacts are
dependent on the size as well as the location of the PV system.
PV systems are classified based on their ratings into three categories:
(1) Small systems rated at 10 kW or less.
(2) Intermediate systems rated between 10 kW and 500 kW,
(3) Large systems rated above 500 kW.
The first two categories are usually installed at the distribution level, the
last category is usually installed at the transmission/sub-transmission
levels.
51
5.7.1 Impacts of small/medium PV systems
1. Excessive reverse power flow.
In a normal distribution system, the power flow is usually
unidirectional from the Medium Voltage (MV) system to the Low
Voltage (LV) system. However, at a high penetration level of PV
systems, there are instants when the net production is more than the
net demand (especially at noon), and as a result, the direction of power
flow is reversed, and power flows from the LV side to the MV side.
This reverse flow of power results in overloading of the distribution
feeders and excessive power losses. Reverse power flow has also been
reported to affect the operation of automatic voltage regulators
installed along distribution feeders as the settings of such devices need
to be changed to accommodate the shift in load center. Reverse power
flow may have adverse effects on online tap changers in distribution
transformers especially if they are from the single bridging resistor
type.
2. Over voltages along distribution feeders.
Reverse power flow leads to over voltages along distribution feeders.
Capacitor banks and voltage regulators used to boost voltage slightly
can now push the voltage further, above the acceptable limits, when
the voltage along the feeder is already boosted by transformer tap
changers to compensate for voltage drop along the line.
52
3. Increased difficulty of voltage control .
a power system with embedded generation, voltage control becomes a
difficult task due to the existence of more than one supply point. All
the voltage regulating devices, i.e., capacitor banks and voltage
regulators, are designed to operate in a system with unidirectional
power flow. The impacts of the back feed of PV units on these devices
need to be studied.
4. Increased power losses.
DG systems in general reduce system losses as they bring generation
closer to the load. This assumption is true until reverse power flow
starts to occur. A study showed that distribution system losses reach a
minimum value at a penetration level of approximately 5%, but as the
penetration level increases, the losses also increase and may exceed
the no-DG case.
5. Severe phase unbalance.
Inverters used in small residential PV installations are mostly single
phase inverters. If these inverters are not distributed equally among
different phases, phase unbalance may take place shifting the neutral
voltage to unsafe values and increasing the voltage unbalance. This
problem occurred in the PV installation at Freiburg, Germany, where
the power unbalance between L1 and L3 was found to be around 6%.
6. Power quality problems.
Power quality issues are one of the major impacts of high PV
penetration on distribution networks; power inverters used to interface

53
PV arrays to power grids are producing harmonic currents; thus, they
may increase the total harmonic distortion (THD) of both voltage and
currents at the point of common coupling (PCC).
7. Increased reactive power requirements.
PV inverters normally operate at unity power factor for two reasons.
The first reason is that current standards (IEEE 929-2000) do not
allow PV inverters to operate in the voltage regulation mode. The
second reason is that owners of small residential PV systems in the
incentive-programs are revenued only for their kilowatt-hour yield, not
for their kilovolt-ampere hour production.
8. Electromagnetic interference issues.
The high switching frequency of PV inverters may result in
electromagnetic interference with neighboring circuits such as
capacitor banks, protection devices, converters, and DC links leading
to mal-function of these devices. Thus, they prefer to operate their
inverters at unity power factor to maximize the active power generated
and accordingly, their return. As a result, the active power
requirements of existing loads are partially met by PV systems,
reducing the active power supply from the utility. However, reactive
power requirements are still the same and have to be supplied
completely by the utility. A high rate of reactive power supply is not
preferred by the utilities because in this case distribution transformers
will operate at very low power factor (in some cases it can reach 0.6).
Transformers’ efficiency decreases as their operating power factor

54
decreases, as a result, the overall losses in distribution transformers
will increase reducing the overall system efficiency.
9. Difficulty of islanding detection.
IEEE Std. 929-2000 recommends that photovoltaic inverters should be
disconnected within 6 cycles if an islanding condition is detected.
Many techniques can be used to detect islanding, such as passive,
active, hybrid, and communication based techniques[25].
5.8 Impact of PV Systems on Tubas District Grid.
In this section we will talk about the effects of solar systems on the grid in
Tubas.
5.8.1 The losses
Installation of generating units as close as possible from the center of loads
is one of the targets of networks designer; because of its effects of reducing
losses in electric networks. A study was performed by using
ELECTROGIS program(which is a program that integrates both GIS and
MV and LV network analysis ), this program was designed to TEDCO.
Table (5.5) shows the losses before and after installation of PV systems on
the (Karag transformer).

55
Table (5.5): Losses of Karag transformer before and after PV
installation.
Transformer name Karag
Number of feeders 3
TR Core losses before PV installation 0.3 KW
TR Core losses after PV installation 0.3 KW
TR Copper losses before PV installation 1.3916 KW
TR Copper losses after PV installation 1.15343 KW
Losses before PV installation 4.25427 KW
Losses after PV installation 2.98507 KW
As we notice from the table (5.5) that the PV systems decrease the total
losses on transformer from 4.25427 KW to 2.98507 KW.
5.8.2 Impacts of PV systems on voltage.
This study represents the effect of PV generators on the voltage at the load.
Table (5.6) shows the technical losses and voltage of Karag transformer.
Table (5.6): Technical losses and the voltage of Karag transformer.
Transformer name Karag
Apparent power 400 kVA
Load factor 77%
Number of participants 423
Number of PV systems 7
Peak power 35 kWp
Percentage of PV 9%
Losses before PV 4.25427 KW
Losses after PV 2.98507 KW
Voltage before PV installation 207.9 V
Voltage after PV installation 213.6 V
The effects of PV system on voltage are:
Voltage rise in LV network, as we see from the table, during light load
conditions the voltage at the point of interconnection may increase by

56
2%–3% above the no-load voltages especially when the PV cluster is
located far from the distribution transformer. This voltage rise may
exceed the accepted limits when the voltage along the feeder is already
boosted by transformer tap changers to compensate for voltage drop
along the line.[25]
5.8.3 Impacts of PV generators on power factor(PF)
Through the studying of PV systems the power factor was decreased during
the day light hours, this case is clear in table (5.7) which represent the
information of (Safeh nourth / housing staff).
Table (5.7): Technical information of Safeh north transformer before install
PV system. Transformer name Safeh nourth / housing staff
Number of feeders 2
TR Core losses before PV installation 0.25 KW
TR Core losses after PV installation 0.25 KW
TR Copper losses before PV installation 0.274518 KW
TR Copper losses after PV installation 0.0965383 KW
Total PF on TR before PV installation 0.865518
Total PF on TR after PV installation 0.801754
As we notice that the PF decrease from 0.855 to 0.801, this problem can be
solved by install capacitor banks to improve the power factor.
5.9 The Inverters
Depending on the requirements of the load, a number of different types of
inverters are available. Selection of the proper inverter for a particular
application depends on the waveform requirements of the load and on the
efficiency of the inverter. Inverter selection will also depend on whether
the inverter will be a part of a grid-connected system or a stand-alone
57
system. Many opportunities still exist for the design engineer to improve
the inverters, since inverter failure remains one of the primary causes of PV
system failure.
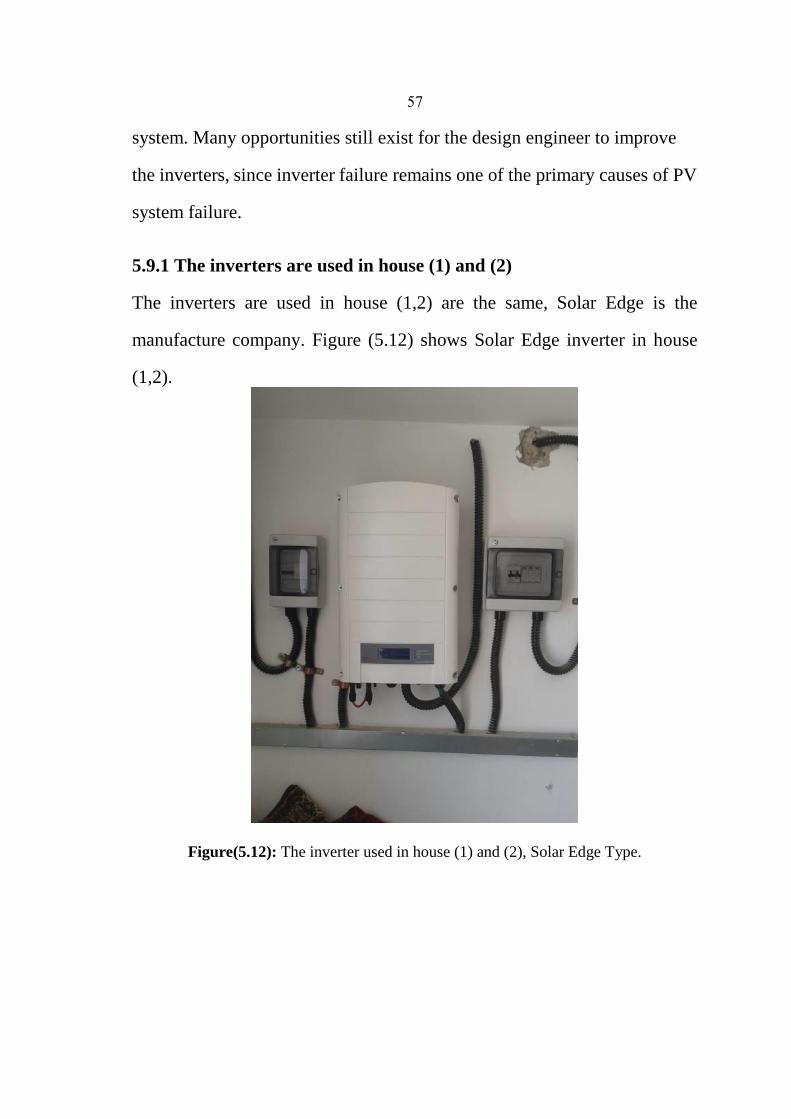
5.9.1 The inverters are used in house (1) and (2)
The inverters are used in house (1,2) are the same, Solar Edge is the
manufacture company. Figure (5.12) shows Solar Edge inverter in house
(1,2).
Figure(5.12): The inverter used in house (1) and (2), Solar Edge Type.

58
Figure (5.13): shows the specifications solar edge inverter in houses 1 and 2.[26]
5.9.2 The inverter used in house (3)
The inverter used in house (3) is 5 kW grid tied inverter. The rated power
at 230 V and 50 Hz is 5,200 W.
Figure(5.14): SMA inverter that used in home (3).

59
Figure (5.15): The specification SMA inverter used in house no.(3).[27]
5.10 The Surge Protective Device (surge arrestor)
Installed outside, almost always in wide open areas, photovoltaic plants are
particularly subject to atmospheric phenomena and can sustain damage
from surges caused by lightning strikes. For this reason, and given the high
value of the components and the high cost of any down time, it is always
best practice to fit PV plants with suitable surge protection. It is necessary
to protect both the direct current and alternating current circuits from
surges: lightning is not interested in what type of current is flowing in the
cables!.

62
Figure(5.16): Surge protection in photovoltaic plants (Domestic plant).[28]
Only house no. (1) has surge arrestors for AC and DC currents, house
no.(2) and no.(3) must have arrestors to protect them.
5.11 Impacts of Existence of Air Conditions on the Home
Air conditioners have evolved a lot over the years. The models produced in
the year 2000 used 30 to 50 percent less energy than the ones that were
manufactured in 1970s. Nowadays, the newer models are designed with
better energy efficiency features.
Before going into the details about the energy consumed by air
conditioners, it is essential to know how the device works. Air conditioners
work on the same principle as a refrigerator, where circuit of pipes and a
pump form the cooling system. The room is cooled by the indoor cold
evaporator coil, and the hot coil ejects the heat outside the rooms.
61
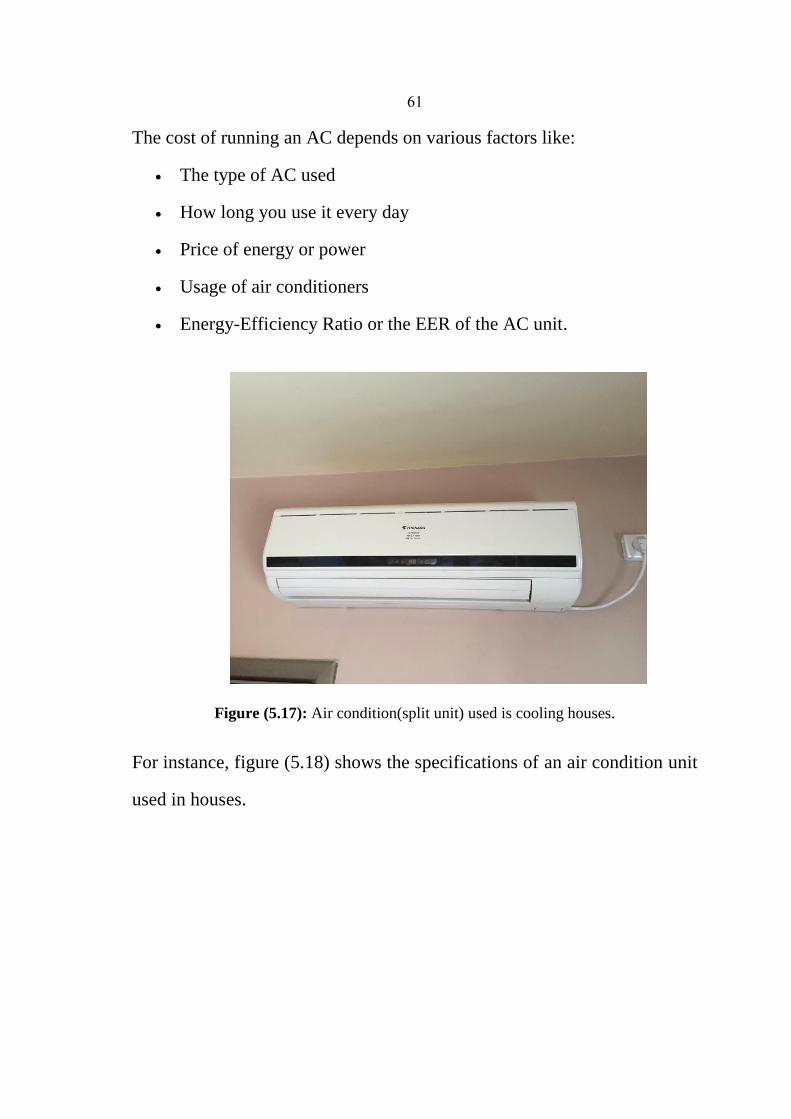
The cost of running an AC depends on various factors like:
The type of AC used
How long you use it every day
Price of energy or power
Usage of air conditioners
Energy-Efficiency Ratio or the EER of the AC unit.
Figure (5.17): Air condition(split unit) used is cooling houses.
For instance, figure (5.18) shows the specifications of an air condition unit
used in houses.

62
Figure (5.18): Specification of air condition unit(Tornado).
The existence of air condition in a house cause higher electric power
consumption, let us take the air condition in figure (5.18) as an example:
I = 3.8 A from the specification in figure (5.22)
V = 230 V from the specification in figure (5.22)
P = 3.8* 230* 0.92 = 978.88 W
Energy consumed if the air condition used for 6 hours per day is:
E = P* 6 = 5873.28 Wh = 5.873 kWh
Cost of energy consumed = 5.873 * 0.65= 3.817 NIS/ day
Cost of 1 kWh from the utility = 0.65 NIS
Assume that the month is June:

63
The cost of energy consumed by the air condition in June = 114.529 NIS
So the electric bill will increase by 114.529 NIS this will reduce monthly
revenue from the PV system.
As seen before the air condition energy consumption is very high this will
increase the electric bill, so decrease the revenue from PV system.
64
Chapter Six
Economic Analysis
65
Chapter Six
Economic Analysis
6. Introduction
The need for engineering economy is primarily motivated by the work that
engineers do in performing analyses, synthesizing, and coming to a
conclusion as they work on projects of all sizes. In other words,
engineering economy is at the heart of making decisions. These decisions
involve the fundamental elements of cash flows of money, time, and
interest rates. This chapter will talk about the outcome of the PV systems,
cash flows, and other economic calculations.
6.1 Economic Study of PV House System
A) Initial cost of PV system
The initial cost includes the costs of equipment represented in PV
modules, inverter, wires and other components used in installation. It
includes also labor and technicians costs for installation. These costs
depend on the size and type of a component. All these costs are summed
to give the overall initial cost.
Initial cost=(components cost+ installation cost) (6.1)
PV modules are available in different sizes and types, the size of PV is
characterized by its peak watt at STC (rated power).The price of peak
watt is almost the same for mono or poly crystalline, but the installation

66
or structure cost will differ depending on the installed PV area. The
(NIS/Wp) will decrease as the size of module increases.
Inverter available in different sizes and types. The price of the inverter
depends on its capacity, efficiency, protection feature and type. On this
systems the size of the inverter is 5 kW, grid tie inverter.
Shipping costs and accessories needed for installation and system
protection, wiring, should be also considered. These costs depend on the
system size and vary with the kind of the project; if it is for public use
(may be land available free), or for private use, in our case the roof is
free.
B) Operation and maintenance cost of PV system
The operation costs considered are incurred after installation in order to
run the system for a certain number of years (system life time). On this
systems the operation cost is negligible, the only thing that needs is
cleaning by water only.
C) Salvage value
The salvage value is considered as the value of the project components
after the system life time is finished. The salvage value is assumed to be
2% of the capital cost.
6.2 Cash Flow Analysis of PV System 5 kWp:
Cash Flow: It’s the estimated outcomes (costs) and incomes (revenues) of
money over a identified time period. In this section the cash flow charts
67
will show the incomes money and outcomes money for PV generators
5kWp.
Notice that operating and maintenance (O&M) cost is Zero because such a
small system doesn’t need maintenance beside just periodic cleaning with
water that the owner can do cleaning by himself, in order to absorb higher
solar radiation.
Ground cost is free, the system is installed on the roof of the home, so there
is no need to ground cost. In other system which installed on ground the
cost of ground is important.
The inverter works for over 20 years because it is indoor, not affected by
sunlight and temperature fluctuations.
The interest rate we assume is 7%, it varies according to several economic
parameters in the world.
Salvage value at the end of system life can be estimated to 2% from the
capital cost which is equal 38000 NIS for all systems.
Cost of 5 kWp PV system = 38000 NIS
Salvage value= .02*capital cost= 760 NIS
6.2.1 Economic Analysis of House no.(1):
This house is in Tubas area as we mentioned before, the table below shows
the monthly measured energy produced by the first house which was
8496.606 kWh per year. This house was from the first 100 household who
installed PV on rooftops ,(PSI) so the tariff is 1.07 NIS/kWh. The outcome
from this system is 9091.368 NIS in this year

68
Outcome = Energy produced * Tariff (6.2)
Outcome = 8496.606*1.07
Yearly Outcome = 9091.36832 NIS
Table (6.1): Monthly outcome of house no.(1).
monthly outcome NIS House(1) E produced kWh Month
536.45 501.359 Jan
630.62 589.36 Feb
781.15 730.049 Mar
958.78 896.059 Apr
1036.00 968.23 May
1018.17 951.56 Jun
1085.88 1014.8 Jul
1039.48 971.47 Aug
868.43 811.62 Sep
438.36 409.69 Oct
262.95 245.74 Nov
435.04 406.58 Dec
9091.368 8496.6 yearly avg
In order to do calculation, the cash flow is necessary. Table (6.2) shows the
cash flow components for the all houses.
The energy produced each year will be degreased because of degradation,
the efficiency of the solar cells decreased each year. We assume that the
degradation in the efficiency is 0.5% each year.
Table (6.2): Cash flow components of the houses. Description NIS
Capital cost 38000
Ground cost Free
Maintenance cost Free
Inverter replacement cost Free
Interest 7%
n (number of years) 20
Degradation in yearly energy produced 0.5%
Salvage value 2% capital cost

69
Figure(6.1): Net cash flow for House no.1.
Cost of energy produced by solar energy:
On this procedure we are going to calculate the cost of energy produced by
solar energy (the cost of 1 kWh) .
Tariff(NIS/ kWh)= LCC(AW)/ Energy produced yearly. (6.3)
Life Cycle Cost in Annual worth (LCC)= Investment Cost in annual worth
+ Annual running cost- Salvage Value in annual worth (6.4)
Annual fixed cost = Capital cost * (A/P, 7%, 20) (6.5)
Annual fixed cost= 38000* 0.09439 = 3586.82 NIS/year
The Recovery Factor (A/P, 7%, 20) = 0.09439 from the appendix A2.
Salvage Value in annual worth = 760 (A/F, 7%, 20)
The factor(A/F, 7%, 20) = 0.02439 from the appendix A2
Salvage Value in annual worth = 760* 0.02439= 10.54 NIS/year
-50000
-40000
-30000
-20000
-10000
0
10000
20000
0 1 2 3 4 5 6 7 8 9 10 11 12 13 14 15 16 17 18 19 20
Net Cashflow

72
Life Cycle Cost in Annual worth (LCC)= 3,576.28 NIS/year
Revenue From Energy Produced/year =
9091.93 –(.005*9091.93)(A/G,7%,20)
The factor (A/G,7%,20)= 7.3163 from the table on the appendix A2.
Annual Revenue From Energy Produced = 8759.33 NIS/year
Tariff (NIS/ kWh) =3576.28/8759.33 = 0.408 NIS/kWh
The yearly energy consumption of house no.(1) is 5114.99 kWh, so they
pay to the company :
Yearly electric bill = annual consumption* cost of kWh.
Yearly electric bill = 5114.99 * 0.6 = 3,068.99 NIS.
The total average revenue from the PV generators/ year= 8759.33/year
So the annual saving after paying the electrical bills to the company is:
Annual saving =8759.33– 3,068.99 = 5,690.34 NIS/year.
The total revenue for the life cycle of the system (20 year) is :
Total revenue = 5,690.34 * 20 = 113,806.8 NIS.
6.2.2 Economic Analysis of House No.(2):
As the previous house table (6.3) shows the energy produced from the
system and the outcome. The tariff used was 1.07 NIS, so the energy
produced was 9617.66 kWh and the revenue 10290.90092 NIS.
Outcome = Energy produced * Tariff
Outcome =9617.66 *1.07
Yearly Outcome = 10290.90092 NIS
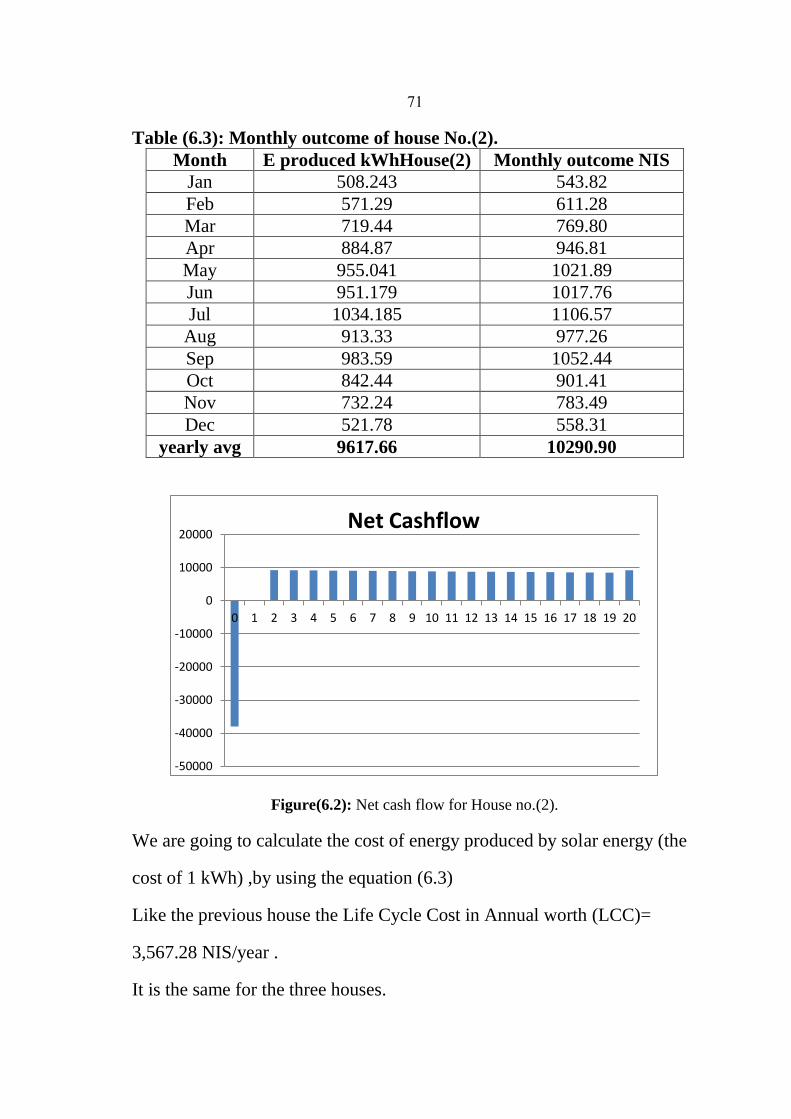
71
Table (6.3): Monthly outcome of house No.(2).
Monthly outcome NIS E produced kWhHouse(2) Month
543.82 508.243 Jan
611.28 571.29 Feb
769.80 719.44 Mar
946.81 884.87 Apr
1021.89 955.041 May
1017.76 951.179 Jun
1106.57 1034.185 Jul
977.26 913.33 Aug
1052.44 983.59 Sep
901.41 842.44 Oct
783.49 732.24 Nov
558.31 521.78 Dec
10290.90 9617.66 yearly avg
Figure(6.2): Net cash flow for House no.(2).
We are going to calculate the cost of energy produced by solar energy (the
cost of 1 kWh) ,by using the equation (6.3)
Like the previous house the Life Cycle Cost in Annual worth (LCC)=
3,567.28 NIS/year .
It is the same for the three houses.
-50000
-40000
-30000
-20000
-10000
0
10000
20000
0 1 2 3 4 5 6 7 8 9 10 11 12 13 14 15 16 17 18 19 20
Net Cashflow

72
Annual Revenue from Energy Produced = 10290.90 –
(.005*10290.90)(A/G,7%,20)
The factor (A/G,7%,20)= 7.3163 from the table on the appendix A2.
Annual Revenue From Energy Produced = 9,914.44 NIS/year
Tariff (NIS/ kWh) = 3,567.28/9414.44 = 0.3789 NIS/kWh
The yearly energy consumption of house no.2 is 4893 kWh, so they pay to
the company :
Yearly electric bill = annual consumption* cost of kWh.
Yearly electric bill = 4893 * 0.6 = 2935.8 NIS/year.
The total revenue from the PV generators is 9,914.44 NIS so the annual
saving after paying the electrical bills to the company is:
Annual saving = 9,914.44 – 2,935.8 = 6,978.64 NIS/year.
The total revenue after 20 years:
Total revenue = 6,978.64* 20 = 139,572.8 NIS.
6.2.3 Economic Analysis House No.(3):
On this house the average yearly energy production was 9304 kWh , the
tariff used was 0.80 NIS because the Palestinian Energy Authority changed
the tariff from 1.07 NIS to 0.80 NIS after the first 100 home. The outcome
was 7443.200 NIS which was less than the other houses as a result of a
different Tariff.
Outcome = Energy produced * Tariff
Outcome =9304.00 * 0.80
Yearly Outcome = 7443.200 NIS

73
Table (6.4): Monthly outcome of house No.(3).
Monthly
outcome NIS
Energy produced kWh
House(3)
Month
464.000 580 Jan
554.400 693 Feb
617.600 772 Mar
696.800 871 Apr
740.800 926 May
715.200 894 Jun
849.600 1062 Jul
683.200 854 Aug
624.000 780 Sep
604.000 755 Oct
485.600 607 Nov
408.000 510 Dec
7443.200 9304.000 yearly
average
The cash flow components of house no.3are the same as house (1) and (2).
Figure (6.3) shows the net cash flow of house no.(3).
Figure(6.3): Net cash flow for house no.(3).
We are going to calculate the cost of energy produced by solar energy (the
cost of 1 kWh) .
-50000
-40000
-30000
-20000
-10000
0
10000
20000
0 1 2 3 4 5 6 7 8 9 10 11 12 13 14 15 16 17 18 19 20
Net Cashflow

74
Tariff(NIS/ kWh)= Total annual cost/ Energy produced yearly.
Annual running cost due the degradation of the efficiency will decrease
along the life cycle of the project then it will be calculated as follows :
Like the previous homes the Life Cycle Cost in Annual worth (LCC)=
3,567.28 NIS/year .
Annual Revenue = 7443.2 – (.005* 7443.2)(A/G, 7%, 20)
Annual Revenue = 7170.9 NIS/year
Tariff (NIS/ kWh) = 3,567.28/7170.9 = 0.497 NIS/kWh
The yearly energy consumption of home no.3 is 2623.84 kWh, so they pay
to the company :
Yearly electric bill = annual consumption* cost of kWh.
Yearly electric bill = 2623.84 * 0.6 = 1,574.304 NIS.
The total revenue from the PV generators is 7170.9 NIS so the annual
saving after paying the electrical bills to the company is:
Annual saving = 7170.9 – 1,574.304 = 5596.596 NIS.
If we suppose that the life cycle of the PV generator is 20 year then the
total revenue is:
Total revenue (for 20 year) =5596.596 * 20 = 111,931.9 NIS.
The total revenue of house no.3 is less than other houses due to the tariff =
0.8 NIS which is less than the tariff was used in the other houses and equal
1.07 NIS.
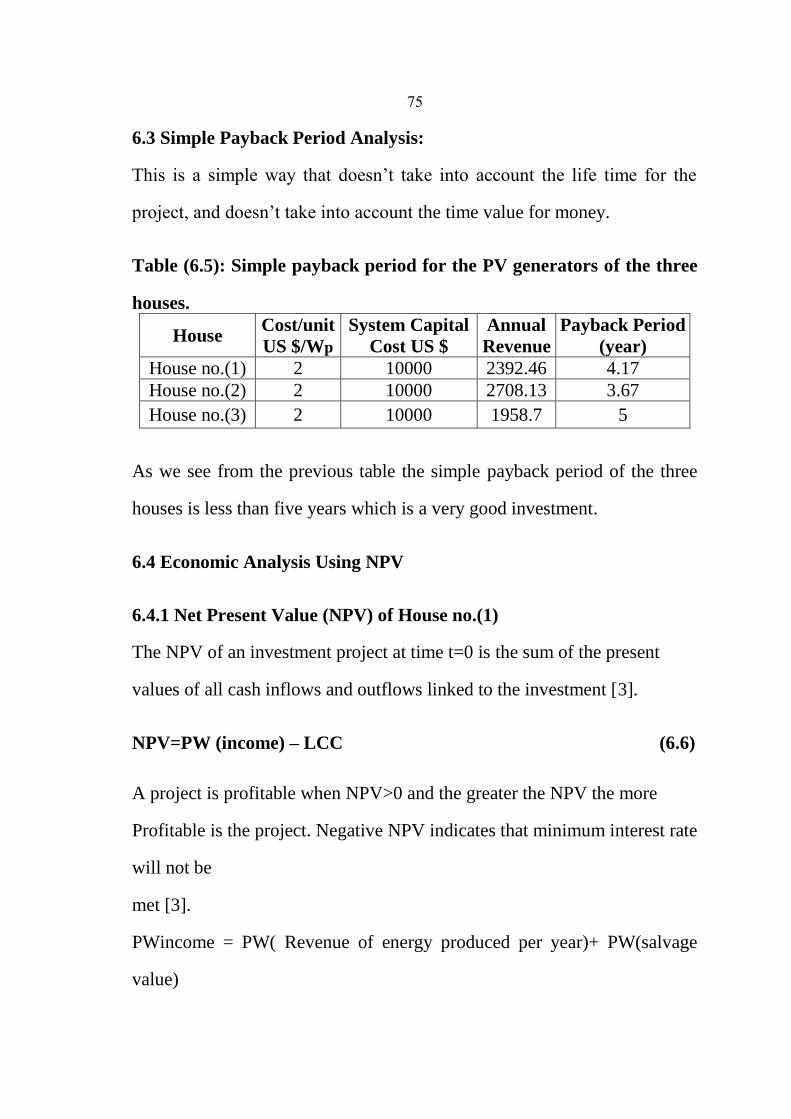
75
6.3 Simple Payback Period Analysis:
This is a simple way that doesn’t take into account the life time for the
project, and doesn’t take into account the time value for money.
Table (6.5): Simple payback period for the PV generators of the three
houses.
House Cost/unit
US $/Wp
System Capital
Cost US $
Annual
Revenue
Payback Period
(year)
House no.(1) 2 10000 2392.46 4.17
House no.(2) 2 10000 2708.13 3.67
House no.(3) 2 10000 1958.7 5
As we see from the previous table the simple payback period of the three
houses is less than five years which is a very good investment.
6.4 Economic Analysis Using NPV
6.4.1 Net Present Value (NPV) of House no.(1)
The NPV of an investment project at time t=0 is the sum of the present
values of all cash inflows and outflows linked to the investment [3].
NPV=PW (income) – LCC (6.6)
A project is profitable when NPV>0 and the greater the NPV the more
Profitable is the project. Negative NPV indicates that minimum interest rate
will not be
met [3].
PWincome = PW( Revenue of energy produced per year)+ PW(salvage
value)

76
PWincome = 8759.33* (P/A,7%,20) + 760* (P/F,7%,20)
PWincome = 92,992.726 NIS
(P/A,7%,20) = 10.5940 from appendix (A1)
(P/F,7%,20) = 0.2584 from appendix (A1)
PWoutcome = fixed cost(initial value)
PWoutcome = 38,000 NIS
NPV = 92,992.726 – 38,000 =54,992.726 NIS
NPV>0 then the investment in such system is feasible.
6.4.2 Net Present Value (NPV) of House no.(2)
PWincome = PW( Revenue of energy produced per year)+ PW(salvage
value)
PWincome = 9,914.44* (P/A,7%,20) + 760* (P/F,7%,20)
PWincome = 105,229.96 NIS
(P/A,7%,20) = 10.5940 from appendix (A2)
(P/F,7%,20) = 0.2584 from appendix (A2)
PWoutcome = fixed cost(initial value)
PWoutcome = 38,000 NIS
NPV = 105,229.96 – 38,000 =67,229.96 NIS
NPV>0 then the investment in such system is feasible.
6.4.3 Net Present Value (NPV) of House no. (3)
PWincome = PW( Revenue of energy produced per year)+ PW(salvage
value)
PWincome = 7170.9* (P/A,7%,20) + 760* (P/F,7%,20)
77
PWincome = 76,164.89 NIS
(P/A,7%,20) = 10.5940 from appendix (A2)
(P/F,7%,20) = 0.2584 from appendix (A2)
PWoutcome = fixed cost(initial value)
PWoutcome = 38,000 NIS
NPV = 76,164.89 – 38,000 = 38,164.898 NIS
NPV>0 then the investment in such systems is feasible.
6.5 Economic Analysis Using ROR
It is the effective annual interest rate earned on an investment and it is one
of the important economic methods to justify whether the project is feasible
or not.
We can find ROR by using the following equation.
PWincome–PWoutcome=0 (6.7)
Where:
PW income, it means present worth income (positive value in cash
flow) and the formula for it is :
PW income=annual saving (P/A, i*, 20) +Salvage value (P/F, i*, 20) (6.8)
(P/A, i*,20): find the present value from the annual value at the
interest rate of i*% and at the life time of 20 years.
(P/F, i*,20): find the present value from the future value at the
interest rate of i% and at the life time of 20 years.

78
PW outcome it means present worth outcome (negative value in
cash flow), the formula for it.
PW outcome = annual cost(P/A,i*,20)+capital investment (6.9)
20 is the lifetime of the project in years.
i* is the interest rate ROR.
6.5.1 ROR of house no.(1):
For house no.1 we use equation (6.7) to find ROR, and other values from
cash flow figure (6.1):
To find PW income and PW outcome, we use equations (6.8) and (6.9) as
follows:
PW income=8759.33 (P/A, i*, 20) +760 (P/F, i*, 20)
PW outcome = capital investment = 38000 NIS (since there is no annual
cost)
Using equation(6.6):
8759.33 (P/A, i*, 20) +760 (P/F, i*, 20) – 38000 = 0
By solving this equation we obtain i*=ROR = 25% using (appendix A3).
6.5.2 ROR of house no.(2):
For house no.2 we use equation (6.7) to find ROR, and other values from
cash flow figure (6.2):
To find PW income and PW outcome, we use equations (6.8) and (6.9) as
follows:
PW income=9,914.44 (P/A, i*, 20) +760 (P/F, i*, 20)

79
PW outcome = capital investment = 38000 NIS (since there is no annual
cost)
Use equation (6.6):
9,914.44 (P/A, i*, 20) + 760 (P/F, i*, 20) – 38000 = 0
By solving this equation we obtain i*= ROR = 25.7 % using (appendix
A3).
6.5.3 ROR of house no.(3):
For house no.2 we use equation 1 to find ROR, and other values from cash
flow figure (6.3):
To find PW income and PW outcome, we use equations (6.7) and (6.8) as
follows:
PW income=7170.9 (P/A, i*, 20) +760 (P/F, i*, 20)
PW outcome = capital investment = 38000 NIS (since there is no annual
cost)
Using equation (6.6):
7170.9 (P/A, i*, 20) + 760 (P/F, i*, 20) – 38000 = 0
By solving this equation ROR = 22 % using (appendix A4).
ROR for all systems are more than minimum attractive rate of return
(MAROR) this mean that the investment in such systems is feasible.
Environment impact of PV system
The PV technologies have great environmental advantages over
conventional technologies for electricity generation. The operation of PV
systems does not produce any noise, toxic-gas emissions, and greenhouse

82
gases. PV energy help to meet the growing worldwide demand for
electricity, and can do so without incurring the high economic and
environmental costs of installing power lines or burning fossil fuels.
Relative to burning coal, every gaga watt-hour of electricity generated by
PV would prevent the emission of about 10 tons of SO2 , 4 tons of NOx,
0.7 tons of particulates (including 1 kg of Cd and 120 kg of As), and up to
1000 tons of CO2 .[26]
The PV systems also require less area than other facilities, total land area
requirements estimates from 8-13 m2 per 1 kWp. Smaller scale solar PV
arrays, which can be built on houses or commercial buildings, have
minimal land use impact.
Solar PV cells do not use water for generating electricity. However, as in
all manufacturing processes, some water is used to manufacture solar PV
components , and in periodic cleaning of the PV modules.
1 kWh of electricity produced from a coal powered station emits 0.97kg of
CO2 to the atmosphere, so producing 1 kWh from solar energy will reduce
0.97 kg of CO2 .
If we calculate how this systems can reduce CO2 emissions we find this
results:
CO2 reduced by house no.1= 0.97 * 8164.00 = 7,919.08 kg/year.
After 20 years the amount of CO2 reduced by this system:
CO2 reduced by house no.1= 158,381.6 kg
CO2 reduced by house no.2= 0.97 * 9,285.18 = 9,006.62kg/year.
After 20 years the amount of CO2 reduced by this system:

81
CO2 reduced by house no.2=180,132.4 kg
CO2 reduced by house no.3 = 0.97 * 8971.41 = 8,702.26 kg/year
After 20 years the amount of CO2 reduced by this system:
CO2 reduced by house no.3= 174,045.35 kg
82
Chapter Seven
Improvement Possibilities
83
Chapter Seven
Improvement Possibilities
There are many simple ways to improve the PV generators energy
production discussed hereafter:
7.1 Three Different Tilt Angles Surface
The amount of direct-beam solar energy that strikes the PV surface is
optimized by keeping the surface at right angles to the sun's direct radiation
all the day. In most cases, maneuvering a surface is impractical and affects
the system reliability negatively. The cost of the energy and the mechanical
assembly required to track the sun consistently each day generally
outweighs the extra energy obtained through tracking when fiat-plate solar-
cell modules without concentrators are used.
The next best propositions are to fix the surface's position so that the sun's
angle on the plane is closest to the perpendicular most of the time, or to
make it able to be constructed for seasonal adjustment.[19]
Since the optimum tilt angle over a full year must balance the summer
maximum and winter minimum declination angle, and to maximize the
solar energy received during the winter and summer months, the PV
mounting structure has to be constructed for seasonal mounting at three tilt
angles (latitude, latitude -10, latitude +20).
According to a previous literature [19] the variable angle mounting
structure shows an annual average of 5.6% improvement in radiation
received over the structure with fixed optimum tilt angle. The above
84
mentioned percentage increases to achieve the double value during the
main winter months. It is worth mentioning, that this improvement is
achieved without considerable additional cost. The owner of the home can
vary the position by himself so it is easy to be done.
As a result of this improvement, the energy produced by PV systems will
be increased according to the following calculations.
7.2 Economic Analysis After Improvement
7.2.1 Economic analysis after improvement (house no.(1))
From the previous chapter the total revenue by PV system on the roof of
house (1) is 113,806.8 NIS, as the solar radiation increases by 5.6% the
energy produced also increases by 5.6%, so :
The increment after 20 year(after improvement) = 5.6% * 113,806.8.
The increment after 20 year(after improvement)= 6,373.18 NIS.
The total revenue after 20 year = 120,179.98 NIS
Since this is a small investment it is important to improve it as possible as
we can.
7.2.2 Economic analysis after improvement(home no.(2))
From the previous chapter the total revenue by PV system on the roof of
home no.(2) is 139,572.8 NIS, as the solar radiation increases by 5.6% the
energy produced also increases by 5.6%, so :
The increment after 20 year(after improvement) = 5.6% * 139,572.8
The increment after 20 year(after improvement)= 7,816.07 NIS.
The total revenue after 20 year = 147,388.88 NIS

85
7.2.3 Economic analysis after improvement(house no.(3))
From the previous chapter the total revenue by PV system on the roof of
house no.(3) is 111,931.9 NIS, as the solar radiation increases by 5.6% the
energy produced also increases by 5.6%, so :
The increment after 20 year(after improvement) = 5.6% * 111,931.9
The increment after 20 year(after improvement)= 6268.18 NIS.
The total revenue after 20 year = 118,200.08 NIS
7.3 Cleaning PV Modules
Many studies assessing how dust, dirt and bird droppings accumulated on
PV modules decrease the module efficiency. A test was performed by a
team to study short-term effect of cleaning performed on a smaller sample
of PV modules in which the modules were left exposed to the usual
environmental soiling in urban areas for three summer months and then
cleaned. The comparison of the measurement results before and after the
cleaning showed that cleaning increased module efficiency by up to 5.06
%, with an average of 4.73 %[30].
The modules are cleaned with a brush and de-mineralized water. The hard
part (especially for roof mounted solar panels is reaching them). Assuming
the owner can reach his solar modules, cleaning the surface of a solar
module is like cleaning a car, with warm water and dishwashing soap to
remove any accumulation of dirt and grime.[31]
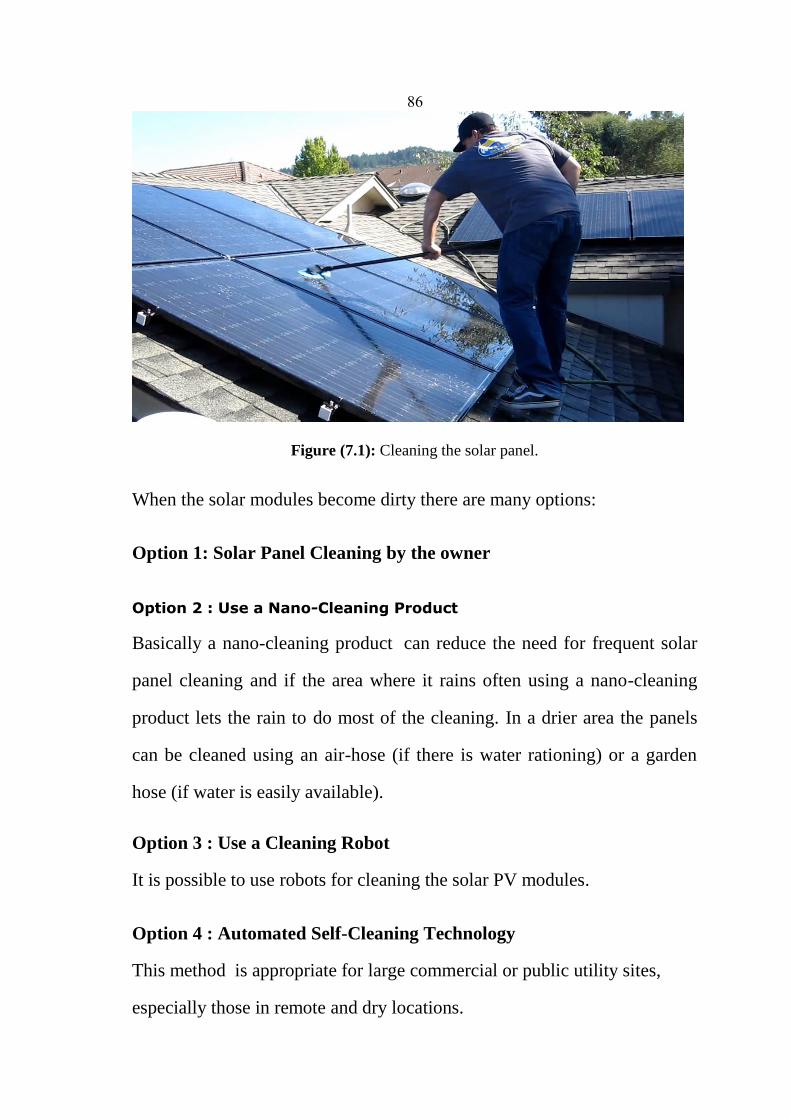
86
Figure (7.1): Cleaning the solar panel.
When the solar modules become dirty there are many options:
Option 1: Solar Panel Cleaning by the owner
Option 2 : Use a Nano-Cleaning Product
Basically a nano-cleaning product can reduce the need for frequent solar
panel cleaning and if the area where it rains often using a nano-cleaning
product lets the rain to do most of the cleaning. In a drier area the panels
can be cleaned using an air-hose (if there is water rationing) or a garden
hose (if water is easily available).
Option 3 : Use a Cleaning Robot
It is possible to use robots for cleaning the solar PV modules.
Option 4 : Automated Self-Cleaning Technology
This method is appropriate for large commercial or public utility sites,
especially those in remote and dry locations.

87
Chapter Eight
Conclusions and recommendations
88
Chapter Eight
Conclusions and recommendations
8.1 Conclusions
Based on this study the following conclusions can be made:
Palestine has a distinguished high solar energy potential estimated in
average to 5.4 kWh/m2-day, therefore it is appropriate to use this
energy in electricity production.
The economic analysis has shown that the cost of 1kWh produced
from solar energy is 0.40 NIS as an average, while the Israel
company provides the energy with 0.4527 NIS, so the energy
produced from the sun is more reliable and economically feasible.
The simple payback period of a house_ PV power system is about 4
years, which is good investment for home owners.
Provided tangible economic result of the establishment and use of
energy-generating systems, the amount of 7000 NIS is the yearly
average for each generating unit to the Palestinian economy.
The total revenue after 20 years for house no.(1) is 113,806.34 NIS/
year, house no.(2) 139,572.8 NIS/ year , and house no.(3) 111,931.9
NIS/year.
Reduction of the emission of carbon dioxide is 160,000 kg per
annum at least, for each house- PV power system.
89
By doing simple improvement, the production of the systems will be
increased, variable-angle mounting structure improves the
production by 5.6%.
The usage of three tilt angles improves the energy production by
5.6% and thereby the revenue of the systems.
Cleaning the PV panels increases module efficiency by up to 5.06 %,
with an average of 4.73 % .
8.2 Recommendations and Perspectives
Depending on the carried out investigations, the measuring results and the
analysis within these thesis, the following recommendations are made:
Based on the technical and economical results obtained through
investigation the three home PV- systems, it is recommended to
increase the PV- generators on the roof tops.
Adoption of the Palestinian Solar Initiative by the Energy Authority,
by using motivational fixed prices.
Form a technical committee at the national level to test new types of
PV system components, and to identify the names of certified
equipment lists pre-marketing.
Providing each house- PV system with a proper surge arrestor and
grounding is very necessary to protect the PV system and the home
from any dangerous caused weather conditions.
The installation of the PV system should be properly located and
performed to that no PV module can be shaded all the day.

92
It is highly recommended to use PV- support structure with three
adjustable tilt angles(β= latitude, latitude- 10°, latitude= 20°) in
order to increase the annual energy production along the year.
Intensifying advertising campaigns and awareness about renewable
energy, to encourage people to use solar energy and make
investment, since the PV- system is a feasible project and the owner
retrieves his money after about 4 years or less.
Providing a special training in the field of solar energy for to
contracting companies to secure for better performance of PV
systems.
Developing policies that encourage investment in solar energy and
continue to work out, and facilitating the access to private financing
for low-income home owners.

91
References
[1] Ministry of National Economy “Palestine”
http://www.mne.gov.ps/DesktopDefault.aspx?tabindex=4&tabid=9&l
ng=1[Access date 17June 2015]
[2] Mo'ien A. A. Omar “Computer–Aided Design and Performance
Evaluation of PV-Diesel Hybrid System” M.Sc. Thesis presented to
An-Najah National University, Nablus, Palestine, 2007.
[3] Marwan M.Mahmoud, Imad Ibrik"Techno-economic feasibility of
energy supply of remote villages in Palestine by PV-systems diesel
generators and electric grid": Renewable and Sustainable Energy
reviews 10 (128-138), 2006 .
[4] V.Jafari Fesharaki, Majid Dehghani, J. Jafari Fesharaki, Hamed
Tavasoli “The Effect of Temperature on Photovoltaic Cell
Efficiency” 1st International Conference on Emerging Trends in
Energy Conservation – ETEC, Tehran, Iran, 20-21 November 2011.
[5] Ja'far, Jallad “Design and Simulation of a Photovoltaic System with
Maximum Power Control to Supply a Load with Alternating Current
"M.Sc. Thesis presented to An-Najah National University, Nablus,
Palestine, 2012.
[6] Earth policy institute
http://www.earthpolicy.org/indicators/C47/solar_power_2013
[Access date 18 July 2015]
[7] Solar schools “How a PV cell Works”
http://www.solarschools.net/resources/stuff/how_pv_cells_work.aspx
[Access date 18July 2015].
92
[8] Solar boat regatta 2013, http://cockroach-boat.weebly.com/energy.html
[Access date July 20, 2015]
[9] Marwan M. Mahmoud “Renewable Energy Technology I & II
Lectures” An Najah National University, 2012-2013.
[10] Facts About Residential Solar Power Systems
https://green-building.knoji.com/facts-about-residential-solar-power-
systems/ [Access date 21 July 2015]
[11] Samer, Yousef,"Performance Test and Techno-Economic Evaluation
of a PV Powered Reverse Osmosis Brackish Water Desalination
System in West Bank", M.Sc. Thesis presented to An-Najah National
University, Nablus, Palestine, 2013.
[12] Building Integrated Solar Energy Technologies,
https://www.e-education.psu.edu/eme807/node/650 [ access date
July 22, 2015]
[13] Calculating Current Ratings of Photovoltaic Modules,
http://ecmweb.com/green-building/calculating-current-ratings-
photovoltaic-modules [access date 23 July, 2015 ]
[14] Nur Mohammad1, Muhammad Quamruzzaman
1, Mohammad
Rubaiyat Tanvir Hossain2, Mohammad Rafiqul Alam
1 , Parasitic
Effects on the Performance of DC-DC SEPIC in Photovoltaic
Maximum Power Point Tracking Applications, Smart Grid and
Renewable Energy Vol.4No.1(2013),ArticleID:28142, 9
pagesDOI:10.4236/sgre.2013.41014
[15] photovoltaic cells flat roof
http://photovoltaicell.com/2015/01/page/137/ [Access date 23 July,
2015]

93
[16] Florida solar energy center
http://www.fsec.ucf.edu/en/consumer/solar_electricity/basics/types_o_
pv.htm [Access date 23 July, 2015 ]
[17] Photovoltaic systems http://www.aladdinsolar.com/pvsystems.html
[Access date 23 July, 2015]
[18] Palestine energy initiative available at www.erai.org .
[19] Energy Research center (ERC). Nablus, An-Najah National
University (2015).
[19] Mahmoud, M.,and Nabhan, I. " Determination of Optimum Tilt
Angle of Single and Multi Rows of Photovoltaic Arrays for Selected
Sites in Jordan ". Solar and Wind Technology.1990; 7(6): 739-745.
[20] Ishraq. Jarrar, "Feeding of Tubas district Electricity Company’s Grid
by Photovoltaic Projects (Now and future)", in The 5th International
Energy Conferance , Palestain, 2015.
[21] Measurements and technical data Tubas district Electricity Company
(TEDCO).
[22] Civisolar, http://www.civicsolar.com/ [Access date 7 August 2015]
[23] PV Performance modeling collaborative https://pvpmc.sandia.gov
[Access date 10 August 2015]
[24] Swapnil Dubey, , Jatin Narotam Sarvaiya, Bharath Seshadri ,
"Temperature Dependent Photovoltaic (PV) Efficiency and Its
Effect on PV Production in the World – A Review", Energy Procedia
Volume 33, 2013, Pages 311–321 PV Asia Pacific Conference 2012.

94
[25] M. S. ElNozahy, M. M. A. Salama, "Technical impacts of grid-
connected photovoltaic systems on electrical networks—A Review",
Journal of Renewable and Sustainable Energy 5, 032702 (2013).
[26] Solar Edge inverter http://www.solaredge.com/groups/products/pv-
inverter .
[27] SMA inverter http://www.sma.de/en/products/solarinverters.html .
[28] Surge protection in photovoltaic plants
https://library.e.abb.com/public/9cac57dfe824c267c1257b190030c287
/Brochure%20OVR%20PV%20EN_2CSC432012B0301.pdf .
[29] V.M. Fthenakis “Overview of Potential Hazards” Elsevier, 2003.
[30] R&D test: Effects of cleaning on PV module performance
http://www.bisol.com [Access date September 20, 2015 ].
[31]Solar facts and advice http://www.solar-facts-and-advice.com/solar-
panel-cleaning.html [Access date September 20, 2015].

95
Appendix
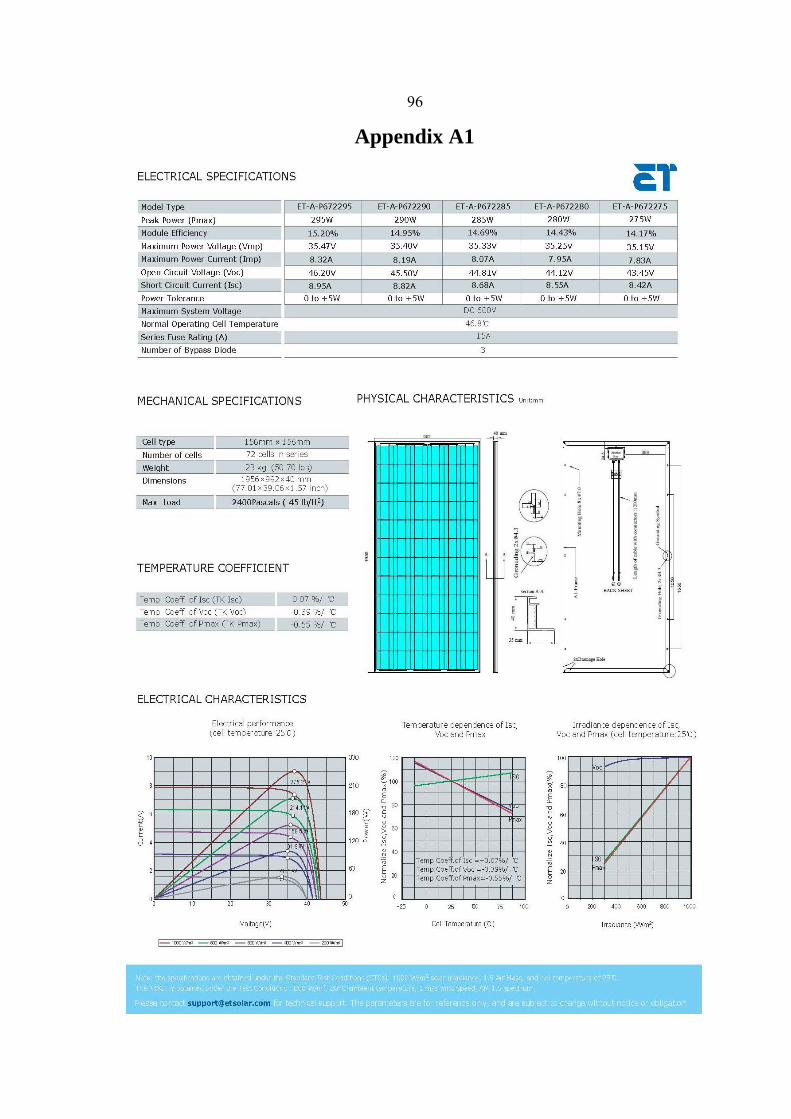
96
Appendix A1

97
Appendix A2

98
Appendix A3

99
Appendix A4