technical support document: development of the … support document: development of the advanced ......
TRANSCRIPT

NREL is a national laboratory of the U.S. Department of Energy Office of Energy Efficiency & Renewable Energy Operated by the Alliance for Sustainable Energy, LLC. This report is available at no cost from the National Renewable Energy Laboratory (NREL) at www.nrel.gov/publications.
Contract No. DE-AC36-08GO28308
Technical Support Document: Development of the Advanced Energy Design Guide for Medium to Big Box Retail Buildings – 50% Energy Savings Eric Bonnema, Matt Leach, and Shanti Pless National Renewable Energy Laboratory
Technical Report NREL/TP-5500-52589 June 2013

NREL is a national laboratory of the U.S. Department of Energy Office of Energy Efficiency & Renewable Energy Operated by the Alliance for Sustainable Energy, LLC. This report is available at no cost from the National Renewable Energy Laboratory (NREL) at www.nrel.gov/publications.
Contract No. DE-AC36-08GO28308
National Renewable Energy Laboratory 15013 Denver West Parkway Golden, CO 80401 303-275-3000 • www.nrel.gov
Technical Support Document: Development of the Advanced Energy Design Guide for Medium to Big Box Retail Buildings – 50% Energy Savings Eric Bonnema, Matt Leach, and Shanti Pless National Renewable Energy Laboratory
Prepared under Task No. BEC8.1112
Technical Report NREL/TP-5500-52589 June 2013

NOTICE
This report was prepared as an account of work sponsored by an agency of the United States government. Neither the United States government nor any agency thereof, nor any of their employees, makes any warranty, express or implied, or assumes any legal liability or responsibility for the accuracy, completeness, or usefulness of any information, apparatus, product, or process disclosed, or represents that its use would not infringe privately owned rights. Reference herein to any specific commercial product, process, or service by trade name, trademark, manufacturer, or otherwise does not necessarily constitute or imply its endorsement, recommendation, or favoring by the United States government or any agency thereof. The views and opinions of authors expressed herein do not necessarily state or reflect those of the United States government or any agency thereof.
This report is available at no cost from the National Renewable Energy Laboratory (NREL) at www.nrel.gov/publications.
Available electronically at http://www.osti.gov/bridge
Available for a processing fee to U.S. Department of Energy and its contractors, in paper, from:
U.S. Department of Energy Office of Scientific and Technical Information P.O. Box 62 Oak Ridge, TN 37831-0062 phone: 865.576.8401 fax: 865.576.5728 email: mailto:[email protected]
Available for sale to the public, in paper, from:
U.S. Department of Commerce National Technical Information Service 5285 Port Royal Road Springfield, VA 22161 phone: 800.553.6847 fax: 703.605.6900 email: [email protected] online ordering: http://www.ntis.gov/help/ordermethods.aspx
Cover Photos: (left to right) photo by Pat Corkery, NREL 16416, photo from SunEdison, NREL 17423, photo by Pat Corkery, NREL 16560, photo by Dennis Schroeder, NREL 17613, photo by Dean Armstrong, NREL 17436, photo by Pat Corkery, NREL 17721.
Printed on paper containing at least 50% wastepaper, including 10% post consumer waste.

i This report is available at no cost from the National Renewable Energy Laboratory (NREL) at www.nrel.gov/publications.
Acknowledgments The authors would like to thank Arah Schuur and Jeremiah Williams of the U.S. Department of Energy (DOE) Building Technologies Office. This report was prepared by the Commercial Buildings Group of the National Renewable Energy Laboratory (NREL) Electricity, Resources, and Building Systems Integration Center.
We would also like to thank ASHRAE, the American Institute of Architects (AIA), the Illuminating Engineering Society of North America (IES), the U.S. Green Building Council (USGBC), and DOE, as well as all the members of the Advanced Energy Design Guide for Medium to Big Box Retail Buildings: Achieving 50% Energy Savings Toward a Net Zero Energy Building (AEDG-MBBR) project committee (PC) for their valuable input and willingness to share their expertise. Much work went into producing the recommendations in the AEDG-MBBR, covering the following topic areas: lighting and daylighting; heating, ventilation, and air-conditioning (HVAC); building envelope; plug loads; and operations and maintenance. Without the committee’s expertise and differing views, as well as the support of the members’ organizations, this report would not have been possible.
The authors extend their thanks to their NREL colleague Daniel Studer, to Paul Holliday of Holliday Electrical Mechanical Engineering for peer reviews, and to Stefanie Woodward of NREL for editorial assistance.
Finally, other NREL colleagues provided valuable guidance and information during the modeling process, either directly or through their past work. Brent Griffith contributed extensive support in creating and debugging the complex energy models.
ii This report is available at no cost from the National Renewable Energy Laboratory (NREL) at www.nrel.gov/publications.
Executive Summary Background This Technical Support Document (TSD) describes the process and methodology for the development of the AEDG-MBBR (ASHRAE et al. (2011b). The AEDG-MBBR provides recommendations for achieving 50% whole-building energy savings in retail stores over levels achieved by following ANSI/ASHRAE/IESNA Standard 90.1-2004, Energy Standard for Buildings Except Low-Rise Residential Buildings (Standard 90.1-2004) (ASHRAE 2004b). The guide was developed in collaboration with ASHRAE, AIA, IES, USGBC, and DOE.
The AEDG-MBBR is the second AEDG for retail buildings; the first was targeted toward small retail buildings and is part of a series of six AEDGs targeting 30% energy savings over levels achieved by following ANSI/ASHRAE/IESNA Standard 90.1-1999, Energy Standard for Buildings Except Low-Rise Residential Buildings (ASHRAE 1999). The guides in the 30% energy savings series are:
• The Advanced Energy Design Guide for Small Office Buildings: Achieving 30% Energy Savings Toward a Net Zero Energy Building (ASHRAE et al. 2004)
• The Advanced Energy Design Guide for Small Retail Buildings: Achieving 30% Energy Savings Toward a Net Zero Energy Building (ASHRAE et al. 2006)
• The Advanced Energy Design Guide for K-12 School Buildings: Achieving 30% Energy Savings Toward a Net Zero Energy Building (ASHRAE et al. 2008a)
• The Advanced Energy Design Guide for Small Warehouses and Self-Storage Buildings: Achieving 30% Energy Savings Toward a Net Zero Energy Building (ASHRAE et al. 2008b)
• The Advanced Energy Design Guide for Highway Lodging: Achieving 30% Energy Savings Toward a Net Zero Energy Building (ASHRAE et al. 2009a)
• The Advanced Energy Design Guide for Small Hospitals and Healthcare Facilities: Achieving 30% Energy Savings Toward a Net Zero Energy Building (ASHRAE et al. 2009b)
The AEDG-MBBR is part of a series of AEDGs targeting 50% energy savings over levels achieved by following Standard 90.1-2004. The other guides in the 50% energy savings series include:
• The Advanced Energy Design Guide for Small to Medium Office Buildings: Achieving 50% Energy Savings Toward a Net Zero Energy Building (ASHRAE et al. 2011c)
• The Advanced Energy Design Guide for K-12 School Buildings: Achieving 50% Energy Savings Toward a Net Zero Energy Building (ASHRAE et al. 2011a)
• The Advanced Energy Design Guide for Large Hospitals: Achieving 50% Energy Savings Toward a Net Zero Energy Building (ASHRAE et al. 2012)
Each guide provides user-friendly design assistance and recommendations to design, architectural, and engineering firms to achieve energy savings. The AEDG-MBBR includes prescriptive recommendations by climate zone for the building envelope; fenestration; lighting systems (including interior and exterior electrical lights and daylighting); plug, process, and phantom loads; commercial kitchen equipment; service water heating (SWH); HVAC systems; building automation and controls; outdoor air treatment; and measurement and verification.

iii This report is available at no cost from the National Renewable Energy Laboratory (NREL) at www.nrel.gov/publications.
Additional savings recommendations are also included, but are not necessary to achieve the 50% savings goal. These are provided for renewable energy systems and alternative HVAC systems.
The objectives in developing this TSD included:
• Develop baseline and low-energy retail store energy models. • Document the modeling assumptions needed to verify 50% energy savings. • Present the recommendations for achieving at least 50% savings over Standard
90.1-2004. • Demonstrate through annual whole-building energy modeling that the recommendations
result in 50% or greater energy savings by climate zone. • Document the process used to develop the AEDG-MBBR.
AEDG-MBBR Development Process The AEDG-MBBR was developed by a PC representing a diverse group of professionals. Guidance and support were provided through a collaboration of ASHRAE, AIA, IESNA, USGBC, and DOE. Publication of the AEDG-MBBR was accomplished by two separate committees: a steering committee that provided high-level guidance and a PC that developed the guide.
AEDG-MBBR Scope This guide applies primarily to retail buildings with 20,000 ft² to 100,000 ft² of floor area; however, many of the recommendations also apply to smaller and larger retail buildings. These facilities typically include some or all of the following space types: administrative and office areas, sales areas, hallways and restrooms, meeting and dining areas, storage spaces, and mechanical/electrical rooms. It does not consider commercial refrigeration, kitchens, or other atypical specialty spaces that generate extraordinary heat or pollution. Its primary focus is new construction, but recommendations may be applicable to facilities undergoing major renovation, and in part to many other retail store renovation, addition, remodeling, and modernization projects (including changes to one or more systems in existing buildings).
The guide does not include all the components listed in Standard 90.1-2004. It focuses only on a building’s primary energy systems (lighting, HVAC, etc.), so the underlying energy analysis presumes that all the other components are built according to the criteria in Standard 90.1-2004.
Certain aspects of retail store design, including commercial refrigeration equipment, domestic water well piping, and sewage disposal, were excluded, as they were too complex to include given the scope of the project. Significant energy efficiency opportunities may be available with these aspects, and AEDG-MBBR users are encouraged to take advantage of these opportunities.
The AEDG-MBBR is not intended to substitute for rating systems or references that address the full range of sustainable issues in retail store design, such as acoustics, productivity, indoor air quality, water efficiency, landscaping, and transportation, except as they relate to energy use; nor is it a design text (ASHRAE et al. 2011b). The guide contains recommendations only and is not a code or standard.
Evaluation Approach and Results The purpose of the building energy simulation analysis presented in this TSD is to assess and quantify the energy savings potential of the set of climate-specific energy efficiency

iv This report is available at no cost from the National Renewable Energy Laboratory (NREL) at www.nrel.gov/publications.
recommendations in the AEDG-MBBR. The following steps describe how the energy savings potential of the AEDG-MBBR’s recommendations were determined.
1. Develop “typical” retail store facility prototype models For building characteristics that are not specified by Standard 90.1-2004, but that are needed to develop baseline models that represent typical operation, the retail store models from Hale et al. (2009) were used as a starting point. A “typical” prototype is an energy model that is a representative example of a retail store facility. Three prototype models were developed; two medium box and one big box. The two medium box stores were identical except for the plug loads; the low plug prototype is meant to represent a store that sells items such as clothing or books and has little plug-in merchandise; the high plug prototype is meant to represent an electronics retailer with a larger amount of plug-in merchandise. A larger big box prototype was developed to represent larger general merchandise stores. The high-level building characteristics for the three prototype models are shown in Table ES–1.
Table ES–1 AEDG-MBBR Prototype Characteristics
Building Characteristic Medium Box Low Plug Medium Box High Plug Big Box
Size 40,500 ft² 40,500 ft² 99,225 ft² Aspect ratio 1.25 1.25 1.00 Sales floor area 32,400 ft² 32,400 ft² 79,380 ft² Back-of-house area 8,100 ft² 8,100 ft² 19,845 ft² Floor-to-ceiling height 20 ft 20 ft 20 ft
Space types Sales floor, vestibule, stock room, office, meeting room, break room, restroom, corridor, mechanical room
Wall constructions Steel framed Steel framed Mass
Roof construction Insulation entirely above deck
Insulation entirely above deck
Insulation entirely above deck
Window area 22% (south façade only) 22% (south façade only) 22% (south façade only) Window sill height 3.6 ft 3.6 ft 3.6 ft Window height 4.4 ft 4.4 ft 4.4 ft Peak plug loads 0.35 W/ft² 0.54 W/ft² 0.36 W/ft² Percent conditioned Fully heated and cooled Fully heated and cooled Fully heated and cooled
2. Create baseline models that are minimally code compliant with Standard 90.1-2004 The baseline models for the medium and big box retail stores were developed by applying the criteria in Standard 90.1-2004 to the prototype models. The baseline energy modeling assumptions and methods were documented, including the building envelope characteristics, building internal loads and operating schedules, ventilation rates and schedules, HVAC equipment efficiency, operation, control and sizing, fan power assumptions, and SWH. The criteria in Standard 90.1-2004 were used as the baselines to calculate energy savings for the AEDG-MBBR recommendations.

v This report is available at no cost from the National Renewable Energy Laboratory (NREL) at www.nrel.gov/publications.
3. Create the low-energy models based on the recommended energy efficiency technologies in the AEDG-MBBR To quantify the potential energy savings from the proposed recommended energy efficiency measures in the AEDG-MBBR, the low-energy building models were developed by implementing the energy efficiency technologies listed here.
• Enhanced building opaque envelope insulation and window glazing; and the addition of overhangs
• Reduced lighting power density and installation of occupancy controls • Exterior lighting power density reductions • Plug load reductions and improved controls • Demand-controlled ventilation and energy recovery ventilators • Dedicated outdoor air systems (DOASs) • High-efficiency HVAC equipment • High-efficiency SWH equipment.
4. Verify the recommendations meet or exceed the 50% energy savings goal of the AEDG-MBBR The final recommendations included in the AEDG-MBBR were determined based on an iterative process using the PC’s expertise and results from modeling proposed recommendations. Energy savings associated with the final recommendations in the AEDG-MBBR are documented in this TSD. To verify savings over a range of design options, low-energy versions of the two medium and one big box retail store were modeled with four types of low-energy HVAC systems. The low-energy HVAC system types include:
• Packaged variable air volume (VAV) direct expansion (DX) air conditioner with a gas furnace (VAV)
• Packaged constant air volume (CAV) DX air conditioner with a gas furnace and a DOAS (CAV DOAS)
• Air source heat pump (ASHP) with electric resistance supplemental heat and a DOAS (ASHP DOAS)
• Water source heat pump (WSHP) with a DOAS (WSHP DOAS).
Recommendations in the AEDG-MBBR are provided based on the type of low-energy HVAC system used. This TSD also presents energy savings results by prototype model and HVAC system type. The recommendations in the AEDG-MBBR result in more than 50% savings in all climate zones, for both medium and the one big box retail store low-energy models, for all HVAC system types. Table ES–2 and Table ES–3 summarize the percent energy savings for each low-energy model in each climate zone. Figure ES–1 shows the process applied to determine energy savings.

vi This report is available at no cost from the National Renewable Energy Laboratory (NREL) at www.nrel.gov/publications.
Table ES–2 Medium Box Percent Energy Savings Over Standard 90.1-2004
Climate Zone
Representative City
Low Plug High Plug
VAV CAV DOAS
ASHP DOAS
WSHP DOAS VAV CAV
DOAS ASHP DOAS
WSHP DOAS
1A Miami, FL 58.2% 59.7% 59.3% 58.2% 57.0% 58.5% 58.1% 56.9% 2A Houston, TX 58.7% 59.5% 59.7% 58.9% 57.8% 58.5% 58.5% 57.7% 2B Phoenix, AZ 56.8% 58.7% 59.3% 58.6% 56.2% 57.9% 58.4% 57.7% 3A Atlanta, GA 56.6% 56.6% 57.5% 56.5% 56.0% 56.0% 56.6% 55.7%
3B:CA Los Angeles, CA 54.4% 54.4% 55.2% 54.6% 53.2% 53.9% 54.3% 53.8% 3B Las Vegas, NV 57.5% 57.5% 58.9% 57.6% 57.0% 57.0% 58.0% 57.0% 3C San Francisco, CA 54.0% 50.5% 52.9% 51.4% 53.5% 50.7% 52.3% 51.4% 4A Baltimore, MD 56.8% 55.8% 57.2% 56.3% 56.1% 55.4% 56.3% 55.6% 4B Albuquerque, NM 58.0% 58.1% 58.9% 58.7% 57.2% 57.6% 58.1% 57.9% 4C Seattle, WA 54.3% 51.7% 54.4% 52.8% 53.2% 51.9% 53.8% 52.6% 5A Chicago, IL 57.2% 55.5% 56.6% 56.1% 56.0% 55.1% 55.9% 55.5% 5B Denver, CO 57.4% 57.8% 58.6% 58.6% 56.8% 57.4% 57.9% 57.9% 6A Minneapolis, MN 58.1% 56.4% 56.9% 57.2% 56.8% 55.8% 56.1% 56.4% 6B Helena, MT 56.5% 55.2% 56.3% 56.3% 55.6% 55.0% 55.7% 55.9% 7 Duluth, MN 58.5% 56.3% 56.7% 57.6% 57.5% 55.9% 56.0% 56.9% 8 Fairbanks, AK 54.2% 52.9% 53.5% 55.1% 54.1% 52.9% 53.2% 54.8%
Table ES–3 Big Box Percent Energy Savings Over Standard 90.1-2004
Climate Zone Representative City
Big Box
VAV CAV DOAS
ASHP DOAS
WSHP DOAS
1A Miami, Florida 56.5% 58.8% 58.4% 56.9% 2A Houston, Texas 59.3% 59.7% 59.9% 59.0% 2B Phoenix, Arizona 57.9% 59.6% 60.2% 59.3% 3A Atlanta, Georgia 56.5% 55.9% 56.8% 55.5%
3B:CA Los Angeles, CA 54.0% 53.9% 54.5% 53.9% 3B Las Vegas, Nevada 57.1% 57.0% 58.2% 56.9% 3C San Francisco, California 53.9% 50.0% 52.1% 50.7% 4A Baltimore, Maryland 56.2% 55.0% 56.5% 55.3% 4B Albuquerque, New Mexico 57.7% 57.6% 58.6% 57.9% 4C Seattle, Washington 54.0% 51.0% 53.9% 51.9% 5A Chicago, Illinois 57.1% 55.3% 56.6% 55.7% 5B Denver, Colorado 57.4% 57.6% 58.7% 58.2% 6A Minneapolis, Minnesota 58.0% 56.1% 56.9% 56.8% 6B Helena, Montanta 56.4% 55.0% 56.4% 55.9% 7 Duluth, Minnesota 58.6% 56.3% 57.0% 57.4% 8 Fairbanks, Alaska 54.4% 53.0% 54.0% 55.2%

vii This report is available at no cost from the National Renewable Energy Laboratory (NREL) at www.nrel.gov/publications.
Figure ES–1 Flow diagram of modeling process
(Credit: Marjorie Schott/NREL)

viii This report is available at no cost from the National Renewable Energy Laboratory (NREL) at www.nrel.gov/publications.
Nomenclature AEDG Advanced Energy Design Guide AEDG-MBBR Advanced Energy Design Guide for Medium to Big Box Retail
Buildings: Achieving 50% Energy Savings Toward a Net Zero Energy Building
AIA American Institute of Architects ANSI American National Standards Institute ASHP air source heat pump ASHRAE American Society of Heating, Refrigerating and Air-
Conditioning Engineers Btu British thermal unit °C degree Celsius, centigrade CAV constant air volume cfm cubic foot per minute c.i. continuous insulation COP coefficient of performance d diameter DCV demand-controlled ventilation DOAS dedicated outdoor air system DOE U.S. Department of Energy DX direct expansion EER energy efficiency ratio EF energy factor EMS energy management system ERV energy recovery ventilator Et thermal efficiency EUI energy use intensity °F degree Fahrenheit ft foot ft² square foot ft³ cubic foot gal gallon h hour hp horsepower HVAC heating, ventilation, and air conditioning IEER integrated energy efficiency ratio IES, IESNA Illuminating Engineering Society of North America in. inch kW kilowatt lb pound LPD lighting power density Ls Linear System LZ lighting zone M&V measurement and verification min minute

ix This report is available at no cost from the National Renewable Energy Laboratory (NREL) at www.nrel.gov/publications.
NEMA National Electrical Manufacturers Association NREL National Renewable Energy Laboratory OA outdoor air O&M operations and maintenance Pa Pascal PC project committee QA quality assurance SC steering committee SEER seasonal energy efficiency ratio SHGC solar heat gain coefficient SWH service water heating TSD Technical Support Document USGBC U.S. Green Building Council V volt VAV variable air volume VFD variable frequency drive VLT visible light transmittance VOC volatile organic compound W watt w.c. water column WSHP water source heat pump

x This report is available at no cost from the National Renewable Energy Laboratory (NREL) at www.nrel.gov/publications.
Contents Acknowledgments............................................................................................................................ i
Executive Summary ........................................................................................................................ ii
Background ................................................................................................................................. ii
AEDG-MBBR Development Process ........................................................................................ iii
AEDG-MBBR Scope ................................................................................................................. iii
Evaluation Approach and Results .............................................................................................. iii
Nomenclature ............................................................................................................................... viii
Contents .......................................................................................................................................... x
Figures and Tables ....................................................................................................................... xiii
Figures ..................................................................................................................................... xiii
Tables ....................................................................................................................................... xiv
1. Introduction ............................................................................................................................. 1
1.1 Objectives ......................................................................................................................... 1
1.2 Scope of the AEDG and TSD .......................................................................................... 2
1.3 AEDG-MBBR Layout and Content ................................................................................. 3
1.3.1 Chapter 1 Introduction .............................................................................................. 3
1.3.2 Chapter 2 Integrated Design Process ........................................................................ 3
1.3.3 Chapter 3 Applying Energy Modeling and Benchmarking Strategies ...................... 3
1.3.4 Chapter 4 Design Strategies and Recommendations by Climate Zone .................... 3
1.3.5 Chapter 5 How to Implement Recommendations ..................................................... 4
1.4 Technical Support Document Organization ..................................................................... 5
2. AEDG-MBBR Development Process ..................................................................................... 6
2.1 Steering Committee .......................................................................................................... 6
2.1.1 Inclusion of Economics and Cost ............................................................................. 7
2.2 Approval Authority .......................................................................................................... 7
2.3 Project Committee Organization and Membership .......................................................... 7
2.4 Development Schedule and Process ................................................................................. 8
3. Evaluation Approach ............................................................................................................ 10
3.1 Determining Energy Savings ......................................................................................... 10
3.1.1 Site Energy Use....................................................................................................... 10
3.1.2 Whole-Building Energy Savings ............................................................................ 10

xi This report is available at no cost from the National Renewable Energy Laboratory (NREL) at www.nrel.gov/publications.
3.1.3 Modeling Methods .................................................................................................. 12
3.2 Prototype Model Overview ............................................................................................ 14
3.2.1 Geometry................................................................................................................. 14
3.2.2 Ventilation and Occupancy ..................................................................................... 18
3.2.3 Infiltration ............................................................................................................... 20
3.2.4 Thermostat Set Points ............................................................................................. 21
3.3 Baseline Model Development and Assumptions ........................................................... 21
3.3.1 Envelope ................................................................................................................. 22
3.3.2 Electric Lighting ..................................................................................................... 26
3.3.3 Plug and Process Loads .......................................................................................... 27
3.3.4 Heating, Ventilation, and Air-Conditioning ........................................................... 28
3.3.5 Service Water Heating ............................................................................................ 29
3.3.6 Baseline Simulation Results ................................................................................... 29
3.3.7 All-Electric Baseline ............................................................................................... 36
3.4 Low-Energy Model Development and Assumptions ..................................................... 42
3.4.1 Envelope ................................................................................................................. 42
3.4.2 Electric Lighting ..................................................................................................... 43
3.4.3 Plug and Process Loads .......................................................................................... 45
3.4.4 Heating, Ventilation, and Air-Conditioning ........................................................... 46
3.4.5 Service Water Heating ............................................................................................ 50
4. Energy Targets ...................................................................................................................... 51
5. Evaluation Results ................................................................................................................ 54
5.1 Recommendation Tables for 50% Energy Savings ........................................................ 54
5.2 Energy Savings Results .................................................................................................. 64
5.2.1 Packaged Variable Air Volume Direct Expansion ................................................. 65
5.2.2 Constant Air Volume Direct Expansion With Dedicated Outdoor Air System ...... 71
5.2.3 Air Source Heat Pump With Dedicated Outdoor Air System ................................. 77
5.2.4 Water Source Heat Pump With Dedicated Outdoor Air System ............................ 83
6. Conclusion ............................................................................................................................ 89
7. References ............................................................................................................................. 90
Appendix A. Scoping Document .............................................................................................. 92
Appendix B. Project Committee Meeting Agendas ................................................................. 95
B.1 Meeting 1 ........................................................................................................................ 95

xii This report is available at no cost from the National Renewable Energy Laboratory (NREL) at www.nrel.gov/publications.
B.2 Meeting 2 ........................................................................................................................ 97
B.3 Meeting 3 ........................................................................................................................ 99
B.4 Meeting 4 ...................................................................................................................... 101
Appendix C. Schedule Tabular Data ...................................................................................... 103
Appendix D. Energy Management System Code ................................................................... 105
D.1 VAV Supply Air Temperature Reset ........................................................................... 105
D.2 Energy Recovery Ventilator/Evaporative Cooler Selector .......................................... 108

xiii This report is available at no cost from the National Renewable Energy Laboratory (NREL) at www.nrel.gov/publications.
Figures and Tables Figures Figure ES–1 Flow diagram of modeling process .......................................................................... vii Figure 3–1 Flow diagram of modeling process .......................................................................... 11 Figure 3–2 U.S. climate zones .................................................................................................... 13 Figure 3–3 Medium box zone layout ......................................................................................... 16 Figure 3–4 Big box zone layout ................................................................................................. 17 Figure 3–5 Building occupancy schedule, January–November ................................................. 19 Figure 3–6 Building occupancy schedule, December ................................................................ 19 Figure 3–7 Infiltration schedule ................................................................................................. 20 Figure 3–8 Heating and cooling set point schedule ................................................................... 21 Figure 3–9 Medium box baseline models rendering .................................................................. 22 Figure 3–10 Big box baseline model rendering ........................................................................... 22 Figure 3–11 Baseline lighting schedule ....................................................................................... 27 Figure 3–12 Baseline plug and process load schedule ................................................................. 28 Figure 3–13 Medium box low plug baseline simulation results .................................................. 31 Figure 3–14 Medium box high plug baseline simulation results ................................................. 33 Figure 3–15 Big box baseline simulation results ......................................................................... 35 Figure 3–16 Medium box low plug all-electric baseline simulation results ................................ 37 Figure 3–17 Medium box high plug all-electric baseline simulation results ............................... 39 Figure 3–18 Big box all-electric baseline simulation results ....................................................... 41 Figure 3–19 Low-energy lighting schedule .................................................................................. 44 Figure 3–20 Low-energy plug and process load schedule ........................................................... 46 Figure 5–1 Medium box low plug VAV simulation results ....................................................... 66 Figure 5–2 Medium box high plug VAV simulation results ...................................................... 68 Figure 5–3 Big box VAV simulation results .............................................................................. 70 Figure 5–4 Medium box low plug CAV DOAS simulation results ........................................... 72 Figure 5–5 Medium box high plug CAV DOAS simulation results .......................................... 74 Figure 5–6 Big box CAV DOAS simulation results .................................................................. 76 Figure 5–7 Medium box low plug ASHP DOAS results ........................................................... 78 Figure 5–8 Medium box high plug ASHP DOAS results .......................................................... 80 Figure 5–9 Big box ASHP DOAS simulation results ................................................................ 82 Figure 5–10 Medium box low plug WSHP DOAS results .......................................................... 84 Figure 5–11 Medium box high plug WSHP DOAS results ......................................................... 86 Figure 5–12 Big box WSHP DOAS simulation results ............................................................... 88
All figures credit Eric Bonnema/NREL unless otherwise noted.

xiv This report is available at no cost from the National Renewable Energy Laboratory (NREL) at www.nrel.gov/publications.
Tables Table ES–1 AEDG-MBBR Prototype Characteristics ................................................................. iv Table ES–2 Medium Box Percent Energy Savings Over Standard 90.1-2004 ............................. vi Table ES–3 Big Box Percent Energy Savings Over Standard 90.1-2004 .................................... vi Table 2–1 AEDG-MBBR PC Organization Chart ...................................................................... 8 Table 3–1 Prototype Model Summary ...................................................................................... 14 Table 3–2 Medium Box Zone Area Breakdown ....................................................................... 15 Table 3–3 Big Box Zone Area Breakdown ............................................................................... 15 Table 3–4 Prototype Space Type Breakdown ........................................................................... 18 Table 3–5 Ventilation Rates by Space Type ............................................................................. 18 Table 3–6 Baseline Exterior Wall Constructions ...................................................................... 23 Table 3–7 Standard Air Film Coefficients ................................................................................ 24 Table 3–8 Baseline Roof Constructions .................................................................................... 24 Table 3–9 Simulated Monthly Ground Temperatures (°F), 1A–4A ......................................... 25 Table 3–10 Simulated Monthly Ground Temperatures (°F), 4B–8 ............................................ 25 Table 3–11 Baseline Window Constructions .............................................................................. 26 Table 3–12 LPD by Space Type ................................................................................................. 26 Table 3–13 Baseline Model Plug and Process Loads ................................................................. 28 Table 3–14 Medium Box Low Plug Baseline Simulation Results, 1A–4A ................................ 29 Table 3–15 Medium Box Low Plug Baseline Simulation Results, 4B–8 ................................... 30 Table 3–16 Medium Box High Plug Baseline Simulation Results, 1A–4A ............................... 32 Table 3–17 Medium Box High Plug Baseline Simulation Results, 4B–8 .................................. 32 Table 3–18 Big Box Baseline Simulation Results, 1A–4A ........................................................ 34 Table 3–19 Big Box Baseline Simulation Results, 4B–8 ........................................................... 34 Table 3–20 Medium Box Low Plug All-Electric Baseline Simulation Results, 1A–4A ............ 36 Table 3–21 Medium Box Low Plug All-Electric Baseline Simulation Results, 4B–8 ............... 36 Table 3–22 Medium Box High Plug All-Electric Baseline Simulation Results, 1A–4A ........... 38 Table 3–23 Medium Box High Plug All-Electric Baseline Simulation Results, 4B–8 .............. 38 Table 3–24 Big Box All-Electric Baseline Simulation Results, 1A–4A .................................... 40 Table 3–25 Big Box All-Electric Baseline Simulation Results, 4B–8 ....................................... 40 Table 3–26 Low-Energy Steel-Framed Exterior Wall Constructions ......................................... 42 Table 3–27 Low-Energy Mass Exterior Wall Constructions ...................................................... 42 Table 3–28 Low-Energy Roof Constructions ............................................................................. 43 Table 3–29 Low-Energy View Window Constructions .............................................................. 43 Table 3–30 Low-Energy LPD by Space Type ............................................................................ 44 Table 3–31 Low-Energy Model Plug and Process Loads ........................................................... 45 Table 4–1 Medium Box Retail Energy Targets ........................................................................ 52 Table 4–2 Big Box Retail Energy Targets ................................................................................ 53 Table 5–1 AEDG-MBBR Recommendations: Climate Zones 1–4 .......................................... 55 Table 5–2 AEDG-MBBR Recommendations: Climate Zones 5–8 .......................................... 60 Table 5–3 Medium Box Percent Energy Savings Over Standard 90.1-2004 ............................ 64 Table 5–4 Big Box Percent Energy Savings Over Standard 90.1-2004 ................................... 64 Table 5–5 Medium Box Low Plug VAV Simulation Results, 1A–4A ..................................... 65 Table 5–6 Medium Box Low Plug VAV Simulation Results, 4B–8 ........................................ 65 Table 5–7 Medium Box High Plug VAV Simulation Results, 1A–4A .................................... 67 Table 5–8 Medium Box High Plug VAV Simulation Results, 4B–8 ....................................... 67

xv This report is available at no cost from the National Renewable Energy Laboratory (NREL) at www.nrel.gov/publications.
Table 5–9 Big Box VAV Simulation Results, 1A–4A ............................................................. 69 Table 5–10 Big Box VAV Simulation Results, 4B–8 ................................................................ 69 Table 5–11 Medium Box Low Plug CAV DOAS Simulation Results, 1A–4A ......................... 71 Table 5–12 Medium Box Low Plug CAV DOAS Simulation Results, 4B–8 ............................ 71 Table 5–13 Medium Box High Plug CAV DOAS Simulation Results, 1A–4A......................... 73 Table 5–14 Medium Box High Plug CAV DOAS Simulation Results, 4B–8 ............................ 73 Table 5–15 Big Box CAV DOAS Simulation Results, 1A–4A .................................................. 75 Table 5–16 Big Box CAV DOAS Simulation Results, 4B–8 ..................................................... 75 Table 5–17 Medium Box Low Plug ASHP DOAS Simulation Results, 1A–4A ....................... 77 Table 5–18 Medium Box Low Plug ASHP DOAS Simulation Results, 4B–8........................... 77 Table 5–19 Medium Box High Plug ASHP DOAS Simulation Results, 1A–4A ....................... 79 Table 5–20 Medium Box High Plug ASHP DOAS Simulation Results, 4B–8 .......................... 79 Table 5–21 Big Box ASHP DOAS Simulation Results, 1A–4A ................................................ 81 Table 5–22 Big Box ASHP DOAS Simulation Results, 4B–8 ................................................... 81 Table 5–23 Medium Box Low Plug WSHP DOAS Simulation Results, 1A–4A ....................... 83 Table 5–24 Medium Box Low Plug WSHP DOAS Simulation Results, 4B–8 .......................... 83 Table 5–25 Medium Box High Plug WSHP DOAS Simulation Results, 1A–4A ...................... 85 Table 5–26 Medium Box High Plug WSHP DOAS Simulation Results, 4B–8 ......................... 85 Table 5–27 Big Box WSHP DOAS Simulation Results, 1A–4A ............................................... 87 Table 5–28 Big Box WSHP DOAS Simulation Results, 4B–8 .................................................. 87 Table C–1 Building Occupancy Schedule, January-November, Fraction of Peak .................. 103 Table C–2 Building Occupancy Schedule, December, Fraction of Peak ................................ 103 Table C–3 Infiltration Schedule, Fraction of Peak .................................................................. 103 Table C–4 Heating and Cooling Set Point Schedule, Degrees Fahrenheit .............................. 103 Table C–5 Baseline Lighting Schedule, Fraction of Peak ....................................................... 104 Table C–6 Baseline Electric Equipment Schedule, Fraction of Peak ...................................... 104 Table C–7 Low-Energy Lighting Schedule, Fraction of Peak ................................................ 104 Table C–8 Low-Energy Electric Equipment Schedule, Fraction of Peak ............................... 104

1 This report is available at no cost from the National Renewable Energy Laboratory (NREL) at www.nrel.gov/publications.
1. Introduction The Advanced Energy Design Guide for Medium to Big Box Retail Buildings: Achieving 50% Energy Savings Toward a Net Zero Energy Building (AEDG-MBBR) (ASHRAE et al. 2011b) was written to help owners and designers of retail stores achieve 50% whole-building energy savings compared to the minimum requirements of ANSI/ASHRAE/IESNA Standard 90.1-2004, Energy Standard for Buildings Except Low-Rise Residential Buildings (Standard 90.1-2004) (ASHRAE 2004b). Included in the AEDG-MBBR are prescriptive recommendations by climate zone for the design of the building envelope; fenestration; lighting systems (including electrical lights and daylighting); heating, ventilating, and air-conditioning (HVAC) systems; building automation and controls; outdoor air (OA) treatments; and service water heating (SWH). Additional savings recommendations are also included, but are not necessary to achieve the 50% energy savings goal. These recommendations are provided for additional HVAC strategies and renewable energy systems.
The AEDG-MBBR shows that the 50% target is not only possible, but easily achievable. Case studies show stores around the country that have achieved and surpassed this target. Best practices and cautions are also provided to demonstrate how to implement the recommendations. The recommendation tables in the AEDG-MBBR do not include all the components listed in Standard 90.1-2004, and instead focus only on the primary energy systems (lighting, HVAC, etc.). The underlying energy analysis presumes that all other components comply with the criteria in Standard 90.1-2004.
By specifying a goal and identifying paths to achieve it in each climate zone, the AEDG-MBBR provides design direction to build energy-efficient retail stores that use 50% less energy than those built to the minimum requirements of Standard 90.1-2004. There may be other means of achieving the target goal, and this guide strives to help generate ideas for continued innovation.
The AEDG-MBBR was developed by a project committee (PC) representing a diverse group of experienced professionals. Guidance and support were provided through a collaboration of ASHRAE, the American Institute of Architects (AIA), the Illuminating Engineering Society of North America (IES), the U.S. Green Building Council (USGBC), and the U.S. Department of Energy (DOE).
The AEDG-MBBR is part of a series of AEDGs targeting 50% energy savings over levels achieved by following ANSI/ASHRAE/IESNA Standard 90.1-2004. The other guides in the 50% energy savings series include:
• The Advanced Energy Design Guide for Small to Medium Office Buildings: Achieving 50% Energy Savings Toward a Net Zero Energy Building (ASHRAE et al. 2011c)
• The Advanced Energy Design Guide for K-12 School Buildings: Achieving 50% Energy Savings Toward a Net Zero Energy Building (ASHRAE et al. 2011a)
• The Advanced Energy Design Guide for Large Hospitals: Achieving 50% Energy Savings Toward a Net Zero Energy Building (ASHRAE et al. 2012)
1.1 Objectives One of the National Renewable Energy Laboratory’s (NREL) tasks in developing the AEDG-MBBR was to provide the analysis and modeling support to:

2 This report is available at no cost from the National Renewable Energy Laboratory (NREL) at www.nrel.gov/publications.
• Verify energy savings: the specific prescriptive recommendations that, in aggregate, yield at least 50% savings beyond a baseline building built to Standard 90.1-2004 for each climate region. The 50% savings value is measured based on the total energy consumption, not just regulated loads. It is not an average of the national energy savings; 50% savings were verified for each U.S. climate zones and corresponding subzone.
• Develop recommendations that meet a numeric goal value: the energy savings goal is a hard value as opposed to an approximate target. As in past AEDGs, the AEDG-MBBR is intended for use as an option in obtaining Energy and Atmosphere credits under the USGBC Leadership in Energy and Environmental Design rating system.
Separate from the AEDG-MBBR, this Technical Support Document (TSD) was written to document the process used to develop the AEDG-MBBR and the analysis and modeling performed to support that development. Its specific objectives include:
• Document the process and schedule used to develop the AEDG-MBBR. • Document prototypical medium and big box retail store characteristics. • Document the EnergyPlus (DOE 2011) modeling assumptions used to establish 50%
energy savings. • Document the baseline and low-energy EnergyPlus retail store models. • Present the recommendations for achieving at least 50% savings over Standard 90.1-
2004. • Demonstrate that the recommendations result in 50% or greater energy savings by
climate zone.
1.2 Scope of the AEDG and TSD Each guide in the AEDG series provides recommendations and user-friendly design assistance to designers, developers, and owners of commercial buildings to encourage setting and achieving energy-savings goals. The AEDGs provide prescriptive packages that enable energy savings targets for each climate zone to be reached.
The AEDG-MBBR applies primarily to box retail buildings with 20,000 ft² to 100,000 ft² of floor area with administrative and office areas; sales areas; hallways and restrooms; meeting and dining areas; storage spaces; and mechanical/electrical rooms. For this TSD, a box retail building is a large, free-standing, rectangular, single-floor structure built on a concrete slab. This guide does not consider commercial refrigeration, kitchens, or other atypical specialty spaces that generate extraordinary heat or pollution. Certain aspects of retail building design, including commercial refrigeration, domestic water well piping, and sewage disposal, are excluded, as they were too complex to include given the scope of the project. Significant energy efficiency opportunities may be available with these aspects, and AEDG-MBBR users are encouraged to take advantage of these opportunities.
The AEDG-MBBR is also not intended to substitute for rating systems or references that address the full range of sustainability issues in retail stores, such as acoustics, productivity, indoor air quality, water efficiency, landscaping, and transportation, except as they relate to operational energy consumption (ASHRAE et al. 2011b). The AEDG-MBBR contains recommendations only and is not a code or standard.
The guides in the AEDG series also do not provide detailed documentation for developing the recommendations or the energy savings details. This TSD describes the methodology for

3 This report is available at no cost from the National Renewable Energy Laboratory (NREL) at www.nrel.gov/publications.
developing the AEDG-MBBR and provides the technical details that were used to determine energy savings, including model inputs and assumptions.
1.3 AEDG-MBBR Layout and Content 1.3.1 Chapter 1 Introduction This chapter contains information about the project goal and scope, as well as instructions for use.
1.3.2 Chapter 2 Integrated Design Process This chapter provides resources for those who want to understand and adopt an overall, integrated process for designing, constructing, and operating energy-efficient retail stores. The guide presents an integrated process for achieving energy savings in these facilities and is valuable for designers who want to augment and improve their practices to ensure energy efficiency is deliberately considered at each stage of the development process, from project conception through building operation. Figures and checklists are included to aid in addressing energy goals in each phase of the design process. This chapter addresses the details and best practices of an integrated design process, and discusses the benefits and features of integrated design, specifics about the process, and step-by-step details about its phases. It also discusses store prototype development as it relates to continuous improvement for retailers who build across the country, as well as key design strategies for controlling capital costs to help the users overcome the notion that more efficient buildings must cost more than conventional ones.
1.3.3 Chapter 3 Applying Energy Modeling and Benchmarking Strategies This chapter discusses the application of energy modeling to retail store design and presents performance targets to better define the 50% energy savings goal. These targets are presented as annual absolute whole-building energy use intensity (EUI) values, and owners are encouraged to set their own EUI targets to provide focused and measurable 50% savings goals.
Throughout the first three chapters, five detailed case studies illustrate techniques discussed in the guide. EUIs are provided to benchmark future buildings against these buildings. All the case studies use some of the recommendations in the tables, but predate the publication of the AEDG-MBBR and were not developed explicitly using those tables. They provide motivation and examples for others to follow and validate the guide’s recommendations.
1.3.4 Chapter 4 Design Strategies and Recommendations by Climate Zone This chapter contains the climate-specific recommendation tables, a unique set of energy efficiency recommendations for each of the U.S. climate zones and corresponding subzones in the United States. Recommendations are organized by several categories: envelope, electric lighting, daylighting, plug loads, SWH, HVAC, and quality assurance (QA). The recommendations are simply one path to reach the 50% energy savings target over Standard 90.1-2004. Other approaches may also save energy; however, identifying all possible solutions is not in the scope of this guide; assurance of the savings from other approaches is left to the user. To achieve 50% energy savings, this guide assumes compliance with the more stringent of either the applicable edition of Standard 90.1 or the local code requirements in all areas not addressed in the climate-specific recommendation tables. Future editions of energy codes may have more stringent values.

4 This report is available at no cost from the National Renewable Energy Laboratory (NREL) at www.nrel.gov/publications.
1.3.5 Chapter 5 How to Implement Recommendations The final chapter provides guidance about good practices for implementing the recommendations, as well as tips to avoid known problems in energy-efficient construction. It includes sections that discuss the building envelope, daylighting, electric lighting, plug loads, SWH, HVAC, QA and commissioning, and additional bonus savings opportunities. The bonus savings section includes areas for additional good practice items that, if implemented properly, should achieve savings beyond the 50% level. Throughout the section, technology case studies giving in-depth review of various building component specific items are presented. This chapter includes the following how-to sections:
• The envelope how-to section contains climate zone-specific information about explicit types of walls, roofs, floors, doors (including vehicular dock doors), vestibules, insulation, infiltration, and vertical fenestration.
• The daylighting how-to section provides tips on general principles; analysis tool information; daylighting space types and layouts, including space type strategies; skylight information; controls; photosensor specification and placement; and system commissioning.
• The lighting how-to section details proper space planning, lighting by space type, best practices for interior finishes, specific lamp and ballast types, advanced controls, space type specific lighting layouts, control strategies, and exterior lighting (including parking lot lighting) power and control.
• The plug load how-to section provides methods to reduce the connected load, best practices for sales floors, offices, and security systems, ways to reduce the energy used by illuminated signs and graphics, methods to reduce parasitic loads, and plug load control strategies.
• The SWH how-to section discusses the types of systems that are well suited for the retail environment, proper sizing of the systems, choosing energy-efficient systems, and the best locations for the system components.
• The HVAC section includes best practices for four HVAC systems types:
o Packaged variable air volume (VAV) direct expansion (DX) air conditioner with a gas furnace (VAV)
o Packaged constant air volume (CAV) DX air conditioner with a gas furnace and a dedicated outdoor air system (DOAS) (CAV DOAS)
o Air source heat pump (ASHP) with electric resistance supplemental heat and a DOAS (ASHP DOAS)
o Water source heat pump (WSHP) with a DOAS (WSHP DOAS).
The HVAC section also contains recommendations for DOASs; evaporative condensers; exhaust air energy recovery; indirect evaporative cooling; hydronic heating systems; ventilation air and demand-controlled ventilation (DCV); economizers; system-level control strategies; thermal zoning; ductwork design and duct insulation/sealing; exhaust air systems; testing, adjusting, and balancing; air cleaning; relief versus return fans; zone controls; heating sources; noise control; and proper maintenance.
• The QA and commissioning section contains specific details about commissioning and its importance in every step of the design process, as well as information on measurement and verification (M&V).
5 This report is available at no cost from the National Renewable Energy Laboratory (NREL) at www.nrel.gov/publications.
• The bonus savings section includes best practices for ground-source heat pump systems, photovoltaic systems, wind turbine power, transpired solar collectors, and power purchase agreements.
1.4 Technical Support Document Organization This report is presented in five sections: Section 1 introduces the AEDG-MBBR and the supporting background information; Section 2 outlines the development process of the AEDG-MBBR; Section 3 provides the evaluation approach, including baseline and low-energy modeling methods and assumptions; Section 4 discusses the energy target section of the AEDG-MBBR; and Section 5 documents the final recommendations and energy savings.
The AEDG-MBBR scoping document can be found in Appendix A. Additional information on the PC development process is included in Appendix B. Appendix C contains tabular data about the schedules used in the energy models. Appendix D contains code used to control the HVAC systems in EnergyPlus.

6 This report is available at no cost from the National Renewable Energy Laboratory (NREL) at www.nrel.gov/publications.
2. AEDG-MBBR Development Process The AEDG-MBBR was developed by a PC representing a diverse group of professionals. Guidance and support were provided through collaboration between ASHRAE, AIA, IES, USGBC, and DOE. PC members were provided by these partner organizations, and the ASHRAE Project Committee 90.1 (SSPC 90.1). A steering committee (SC) was assembled to oversee the development process, composed of representatives of ASHRAE, AIA, IES, USGBC, and DOE. The SC issued a scoping document to the PC, including the timeline for the task, energy savings goal, intended target audience, space types to include, and desired design assistance characteristics.
The PC followed SC guidance to develop a plan for completing the AEDG-MBBR. Key milestones were determined based on a final publication date and used a schedule similar to those developed for previous guides, including two peer review periods corresponding with a 60% completion draft (technical refinement) and a 90% completion draft (final review). Four PC meetings were held at ASHRAE headquarters, Target Corporation headquarters, and NREL. Many conference calls with the full PC were also held to provide updates on the AEDG-MBBR’s progress toward the peer review and publication milestones.
2.1 Steering Committee The SC comprised representatives of the partner organizations and guided the PC in developing the AEDG-MBBR. The SC had a chair, one representative from each partner organization (AIA, IES, USGBC, ASHRAE, and DOE), a liaison from ASHRAE SSPC 90.1, and one ASHRAE staff member; for a total of eight people. The guidance included a timeline for the task, an energy savings goal, an intended target audience, and desired design assistance characteristics. The SC guidance points were to:
• Develop and document a process to achieve 50% savings over Standard 90.1-2004 in medium to big box retail buildings.
• Produce recommendations in a technically sound AEDG for medium to big box retail buildings.
• Constrain the scope and duration of the analysis to maintain the project schedule. • Rely on current knowledge of energy-efficient building design, supplemented with
energy design analysis.
Additional priorities identified by the SC were provided in a scoping document, which included:
• The baseline for energy use evaluation is annual site energy consumption. • Address the practical how-to, user-friendly information needs of the AEDG-MBBR’s
intended users, who are designers in medium to large firms, design/build contractors, and construction firms.
• The interaction of building components and systems will need to be considered rather than having all the savings come from individual parts (savings from systems integration is encouraged). Accommodate, to the extent practical, design flexibility through use of efficiency measure packages that users may choose from.
• Adopt a prescriptive recommendation approach with measure packages. This will include envelope, mechanical, lighting, and water heating measures. The document will be formatted for easy use, provide specific procedures, convey best practices, and avoid

7 This report is available at no cost from the National Renewable Energy Laboratory (NREL) at www.nrel.gov/publications.
the mandatory language that is typical of codes and standards to increase usability for the target audience.
• In addition to prescriptive energy efficiency measures, the AEDG-MBBR should contain “how to” guidance to help the designer/builder construct an energy-efficient retail building. The document should be presented in a very user-friendly manner to reduce design time. By focusing on user-friendly layouts and presentation, as well as prescriptive design recommendations, the AEDG-MBBR should ease the burden for the designers and give corporate decision-makers an overview of specific, easy-to-follow recommendations.
• The prescriptive recommendations presented should be sufficient to allow innovative firms to extend the information when designing facilities that might be evaluated using performance-based criteria. That is, some additional allowance or flexibility should be provided for people who are accustomed to performance-based documents.
• Several case studies should be included to illustrate the energy efficiency components identified. These case studies can focus on the geographic regions or illustrate particular items or recommended techniques.
The full scoping document can be found in Appendix A.
2.1.1 Inclusion of Economics and Cost The purpose of the AEDG-MBBR is to assist designers in the design of energy-efficient retail buildings. The guide focuses on the goal of 50% energy savings, rather than on installations that have a payback threshold.
The AEDG-MBBR does include numerous cost control strategies and best practices, and the case studies help to reinforce the claim that high-performance stores can be built within typical budgets.
2.2 Approval Authority The final approval for the AEDG-MBBR was the responsibility of the SC. Committee members were responsible for reflecting the opinions of the partner organization they represented. This included consulting with their organizations and getting buy-in during the process, as well as providing peer reviews. Efforts were made to agree on the content, as is done during the development of the ASHRAE Fundamentals Handbook (ASHRAE 2009); however, the AEDG-MBBR is not a consensus document.
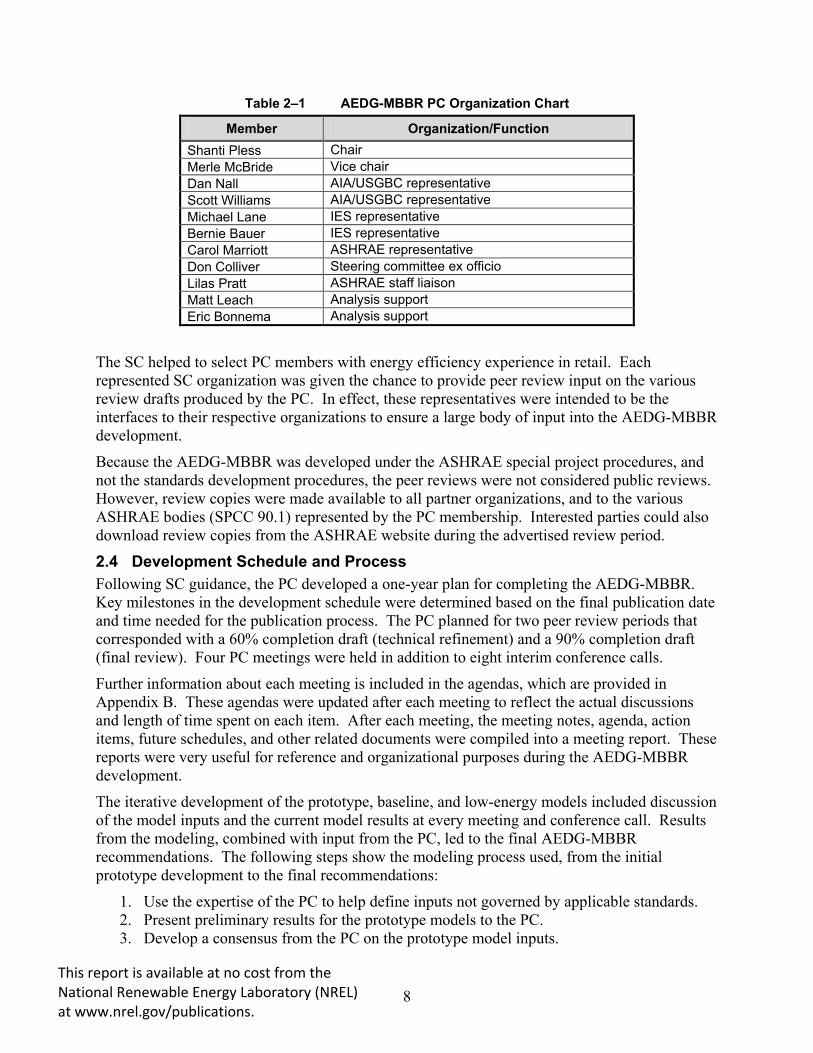
2.3 Project Committee Organization and Membership The AEDG-MBBR was developed by a PC administered under ASHRAE’s Special Project procedures. The AEDG-MBBR PC was designated as ASHRAE Special Project 135 (SP-135), and included membership from each partner organization. Table 2–1 lists the PC members and the organizations they represented. Some members were not affiliated with a partner organization. In these cases, the function of that member was listed instead.
8 This report is available at no cost from the National Renewable Energy Laboratory (NREL) at www.nrel.gov/publications.
Table 2–1 AEDG-MBBR PC Organization Chart
Member Organization/Function Shanti Pless Chair Merle McBride Vice chair Dan Nall AIA/USGBC representative Scott Williams AIA/USGBC representative Michael Lane IES representative Bernie Bauer IES representative Carol Marriott ASHRAE representative Don Colliver Steering committee ex officio Lilas Pratt ASHRAE staff liaison Matt Leach Analysis support Eric Bonnema Analysis support
The SC helped to select PC members with energy efficiency experience in retail. Each represented SC organization was given the chance to provide peer review input on the various review drafts produced by the PC. In effect, these representatives were intended to be the interfaces to their respective organizations to ensure a large body of input into the AEDG-MBBR development.
Because the AEDG-MBBR was developed under the ASHRAE special project procedures, and not the standards development procedures, the peer reviews were not considered public reviews. However, review copies were made available to all partner organizations, and to the various ASHRAE bodies (SPCC 90.1) represented by the PC membership. Interested parties could also download review copies from the ASHRAE website during the advertised review period.
2.4 Development Schedule and Process Following SC guidance, the PC developed a one-year plan for completing the AEDG-MBBR. Key milestones in the development schedule were determined based on the final publication date and time needed for the publication process. The PC planned for two peer review periods that corresponded with a 60% completion draft (technical refinement) and a 90% completion draft (final review). Four PC meetings were held in addition to eight interim conference calls.
Further information about each meeting is included in the agendas, which are provided in Appendix B. These agendas were updated after each meeting to reflect the actual discussions and length of time spent on each item. After each meeting, the meeting notes, agenda, action items, future schedules, and other related documents were compiled into a meeting report. These reports were very useful for reference and organizational purposes during the AEDG-MBBR development.
The iterative development of the prototype, baseline, and low-energy models included discussion of the model inputs and the current model results at every meeting and conference call. Results from the modeling, combined with input from the PC, led to the final AEDG-MBBR recommendations. The following steps show the modeling process used, from the initial prototype development to the final recommendations:
1. Use the expertise of the PC to help define inputs not governed by applicable standards. 2. Present preliminary results for the prototype models to the PC. 3. Develop a consensus from the PC on the prototype model inputs.

9 This report is available at no cost from the National Renewable Energy Laboratory (NREL) at www.nrel.gov/publications.
4. Generate baseline models by applying the climate-specific criteria in Standard 90.1-2004. 5. Investigate initial strategies by applying preliminary HVAC and envelope
recommendations to the prototype models. 6. Present the low-energy modeling results to the PC and identify recommendations that do
not meaningfully contribute to the 50% energy savings goal. 7. Fine-tune the recommendations to achieve at least 50% whole-building energy savings in
all climate zones for each store type. 8. Document final recommendations for the AEDG-MBBR that achieve at least 50%
savings.
The following sections of this TSD present the prototype development results from Step 3, the baseline model results from Step 4, and the final recommendations and energy savings results as documented in Step 8.
10 This report is available at no cost from the National Renewable Energy Laboratory (NREL) at www.nrel.gov/publications.
3. Evaluation Approach This chapter describes the analysis methods used to support development of the AEDG-MBBR. It explains how the prototype, baseline, and low-energy models were developed, and how the resultant energy savings were quantified.
3.1 Determining Energy Savings The purpose of the building energy simulation analysis is to assess and quantify the energy savings potential of the final AEDG-MBBR recommendations. All AEDGs contain a set of energy efficiency recommendations for all U.S. climate zones and their corresponding subzones. To provide the prescriptive recommendations necessary to achieve 50% energy savings, a specific, quantitative energy savings goal must be measured against Standard 90.1-2004.
The following steps were used to determine whether the 50% savings goal was met or exceeded:
1. Develop “typical” retail store prototype characteristics. 2. Create baseline models from the prototypes that are minimally compliant with Standard
90.1-2004. 3. Use energy modeling iteratively to help inform AEDG-MBBR recommendations and
ultimately create complete low-energy models based on the final recommended energy efficiency technologies in the AEDG-MBBR.
4. Verify 50% energy savings were achieved for each of the four investigated HVAC system types in the AEDG-MBBR across the U.S. climate zones and corresponding subzones.
These steps are presented in a linear fashion, but there was some iteration among the steps. The flowchart in Figure 3–1 presents a visual representation of the evaluation approach.
3.1.1 Site Energy Use The 50% energy savings goal of the AEDG series is based on site energy savings between a minimally code compliant building and a low-energy building that uses the AEDG recommendations. Other metrics, such as energy cost savings, source energy savings, and carbon savings could be used to determine energy savings. Each metric has advantages and disadvantages from an implementation and a calculation perspective, and each can favor different technologies and fuel types. The AEDG-MBBR uses site energy savings, as directed by the SC, to retain consistency with previous AEDGs.
3.1.2 Whole-Building Energy Savings Historically, energy savings have been expressed in two ways: those associated with regulated loads and those associated with the whole building. The “regulated loads” energy savings indicate the savings when only the code-regulated loads are included in the total energy use. Unregulated loads typically include plug and some process loads. The “whole-building” energy savings indicate the savings when all the loads (regulated and unregulated) are included in the energy savings calculations. In general, for the same level of percent savings, whole-building savings are more challenging to attain than regulated loads savings. The AEDG-MBBR uses the “whole-building” energy savings method for determining energy savings and contains recommendations for both regulated and unregulated loads.

11 This report is available at no cost from the National Renewable Energy Laboratory (NREL) at www.nrel.gov/publications.
Figure 3–1 Flow diagram of modeling process
(Credit: Marjorie Schott/NREL)

12 This report is available at no cost from the National Renewable Energy Laboratory (NREL) at www.nrel.gov/publications.
3.1.3 Modeling Methods EnergyPlus version 6.0 (DOE 2011) was used to complete the energy simulations in the AEDG-MBBR. This software was selected because it is the contemporary DOE tool, and accounts for the complicated interactions between climate, internal gains, building form and fabric, HVAC systems, and renewable energy systems. EnergyPlus is a heavily tested program with formal validation efforts repeated for every release (Judkoff et al. 1995). All simulations were completed with an NREL analysis platform called Opt-E-Plus (NREL 2010) that manages inputs and outputs of the EnergyPlus simulations. Opt-E-Plus’ core functionality is the user’s ability to pass high-level parameters (building area, internal gains per zone, HVAC system configuration, etc.) to generate a fully parameterized EnergyPlus input file. Such files are generated rapidly and can be easily changed to incorporate changes during the evolution of the model. The high-level parameter file is a structured text file written in Extensible Markup Language. Modifying the high-level parameters is preferred over modifying the EnergyPlus input file, because it greatly simplifies the modeling input development process. Modifying EnergyPlus input files can be time intensive when the high-level parameters have a one-to-many relationship with the corresponding objects in the low-level input file.
The AEDG-MBBR simulations were used to evaluate and vet suggested guide recommendations and to verify that the final set met the savings goal. There were one baseline (baseline HVAC system) and four low-energy (four low-energy HVAC system types) models for each prototype (medium box low plug, medium box high plug, and big box) for a total of 15 separate seed (starting point) energy models. The Opt-E-Plus software then took these 15 seed models and “swept” them across the 16 cities representing the U.S. climate zones and corresponding subzones. The Opt-E-Plus “sweep” took each seed energy model file, created 16 separate energy models, and applied climate zone-specific details such as weather data, economizer requirements, and building envelope specifications from Standard 90.1-2004 (for the baseline model) or the AEDG-MBBR recommendations (for the low-energy models). This resulted in 240 (48 baseline and 192 low-energy) energy models.
3.1.3.1 Climate Zones The AEDGs contain a unique set of energy efficiency recommendations for each of the climate zones and corresponding three subzones in the United States (see Figure 3–2). The zones are defined primarily by heating degree days and cooling degree days (Briggs et al. 2003), and range from very hot (Zone 1A) to very cold (Zone 8). Some climate zones are divided into subzones based on humidity levels. Humid subzones are “A” zones, dry subzones are “B” zones, and marine subzones are “C” zones. These climate zones may be mapped to other climate locations for international use.

13 This report is available at no cost from the National Renewable Energy Laboratory (NREL) at www.nrel.gov/publications.
Figure 3–2 U.S. climate zones
(Credit: DOE (2003))
The 16 specific locations for which analyses were performed are listed here and are designated as being representative of their climate zones. Large cities were chosen, as their weather data directly apply to a large fraction of the total U.S. building floor area. Energy savings were determined by running baseline and low-energy model simulations with the same typical meteorological weather file, TMY2 data (one set of simulations for each city).
• Zone 1A: Miami, Florida (very hot, humid) • Zone 2A: Houston, Texas (hot, humid) • Zone 2B: Phoenix, Arizona (hot, dry) • Zone 3A: Atlanta, Georgia (hot, humid) • Zone 3B: Las Vegas, Nevada (hot, dry) and Los Angeles, California (warm, dry) • Zone 3C: San Francisco, California (marine) • Zone 4A: Baltimore, Maryland (mild, humid) • Zone 4B: Albuquerque, New Mexico (mild, dry) • Zone 4C: Seattle, Washington (marine) • Zone 5A: Chicago, Illinois (cold, humid) • Zone 5B: Denver, Colorado (cold, dry) • Zone 6A: Minneapolis, Minnesota (cold, humid) • Zone 6B: Helena, Montana (cold, dry) • Zone 7: Duluth, Minnesota (very cold) • Zone 8: Fairbanks, Alaska (extremely cold)

14 This report is available at no cost from the National Renewable Energy Laboratory (NREL) at www.nrel.gov/publications.
There are two representative cities for climate zone 3B. Throughout this report, 3B will represent Las Vegas, Nevada and 3B:CA will be used to denote Los Angeles, California. See Deru et al. (2011) for more discussion on the location determination process.
3.2 Prototype Model Overview For the AEDG-MBBR, the models from Hale et al. (2009) were used as a starting point to help define certain building characteristics that were not code-regulated. Three prototype models were developed; two medium box and one big box. The two medium box stores were identical except for the plug loads; the low plug prototype was meant to represent a store that sells items such as clothing or books that have little plug-in merchandise; the high plug prototype was meant to represent an electronics retailer with a larger amount of plug-in merchandise. A larger big box prototype was developed to represent larger general merchandise stores. The prototype model characteristics remained consistent between the baseline and low-energy models. Table 3–1 presents a summary of the prototype models.
Table 3–1 Prototype Model Summary
Building Characteristic Medium Box Low Plug Medium Box High Plug Big Box
Size 40,500 ft² 40,500 ft² 99,225 ft² Aspect ratio 1.25 1.25 1.00 Sales floor area 32,400 ft² 32,400 ft² 79,380 ft² Back-of-house area 8,100 ft² 8,100 ft² 19,845 ft² Floor-to-ceiling height 20 ft 20 ft 20 ft
Space types Sales floor, vestibule, stock room, office, meeting room, break room, restroom, corridor, mechanical room
Wall constructions Steel framed Steel framed Mass
Roof construction Insulation entirely above deck
Insulation entirely above deck
Insulation entirely above deck
Window area 22% (south façade only) 22% (south façade only) 22% (south façade only)
Window sill height 3.6 ft 3.6 ft 3.6 ft Window height 4.4 ft 4.4 ft 4.4 ft Peak plug loads 0.35 W/ft² 0.54 W/ft² 0.36 W/ft² Percent conditioned Fully heated and cooled Fully heated and cooled Fully heated and cooled
3.2.1 Geometry Table 3–2 shows a tabular breakdown of zone area for the medium box prototypes and Figure 3–3 shows the zone layout for the models. Table 3–3 and Figure 3–4 and show the same information for the big box prototype model.
Table 3–2 and Table 3–3 also show a mapping of each zone to a space type. These space types are referenced throughout the rest of the TSD when describing other model inputs (lighting, plug loads, etc.).

15 This report is available at no cost from the National Renewable Energy Laboratory (NREL) at www.nrel.gov/publications.
Table 3–2 Medium Box Zone Area Breakdown
Zone Name Zone Type Quantity Dimensions (ft × ft)
Zone Area (ft²)
Total Area (ft²)
Main sales Sales floor 1 225.0 × 129.0 29,025.0 29,025 Vestibule Vestibule 1 20.0 × 15.0 300.0 300 Corridor Corridor 1 100.0 × 6.0 600.0 600 Restrooms Restroom 1 25.0 × 30.0 750.0 750 Stock room Stock room 1 125.0 × 36.0 4,500.0 4,500 Office Office 1 15.0 × 30.0 450.0 450 Meeting room Meeting room 1 25.0 × 30.0 750.0 750 Break room Break room 1 25.0 × 30.0 750.0 750 Mechanical room Mechanical room 1 10.0 × 30.0 300.0 300 Perimeter sales Sales floor 2 102.5 × 15.0 1,537.5 3,075
Table 3–3 Big Box Zone Area Breakdown
Zone Name Zone Type Quantity Dimensions (ft × ft)
Zone Area (ft²)
Total Area (ft²)
Main sales Sales floor 1 315.0 × 237.0 74,655.0 74,655 Vestibule Vestibule 1 20.0 × 15.0 300.0 300 Corridor Corridor 1 140.0 × 8.0 1,120.0 1,120 Restrooms Restroom 1 35.0 × 55.0 1,925.0 1,925 Stock room Stock room 1 175.0 × 63.0 11,025.0 11,025 Office Office 1 21.0 × 55.0 1,155.0 1,155 Meeting room Meeting room 1 35.0 × 55.0 1,925.0 1,925 Break room Break room 1 35.0 × 55.0 1,925.0 1,925 Mechanical room Mechanical room 1 14.0 × 55.0 770.0 770 Perimeter sales Sales floor 2 147.5 × 15.0 2,212.5 4,425

16
Figure 3–3 Medium box zone layout
This report is available at no cost from the National Renewable Energy Laboratory (NREL) at www.nrel.gov/publications.

17
Figure 3–4 Big box zone layout
This report is available at no cost from the National Renewable Energy Laboratory (NREL) at www.nrel.gov/publications.

18 This report is available at no cost from the National Renewable Energy Laboratory (NREL) at www.nrel.gov/publications.
Table 3–4 provides a breakdown of the prototype models by space type. Table 3–4 Prototype Space Type Breakdown
Zone Type Medium Box Big Box
Area (ft²)
Percent of Total
Area (ft²)
Percent of Total
Sales floor 32,100 79.3% 79,090 79.7% Vestibule 300 0.7% 300 0.3% Corridor 600 1.5% 1,120 1.1% Restroom 750 1.9% 1,925 1.9% Stock room 4,500 11.1% 11,025 11.1% Office 450 1.1% 1,155 1.2% Meeting room 750 1.9% 1,925 1.9% Break room 750 1.9% 1,925 1.9% Mechanical room 300 0.7% 770 0.8% Total 40,500 100% 99,235 100%
3.2.2 Ventilation and Occupancy Table 6-1 in Standard 62.1-2004 (ASHRAE 2004a) was used to determine the models’ ventilation requirements. Table 3–5 shows space types, their mapping to the “Occupancy Category” column in Standard 62.1-2004 Table 6-1, and the ventilation rates used in all models. The OA rate values and the peak occupant densities are from Standard 62.1-2004 Table 6-1. The double colon in Table 3–5 is a means for indicating the row headings and occupancy categories in Table 6-1 in Standard 62.1-2004 (ASHRAE 2004a). As a simplification, the restroom ventilation rate was set to the same as the sales floor.
Table 3–5 Ventilation Rates by Space Type
Zone Type Occupancy Category (From Table 6-1 in 62.1-2004)
People OA Rate
(cfm/person)
Area OA Rate
(cfm/ft²)
Peak Occupant Density
(#/1000 ft²) Sales floor Retail::Sales 7.5 0.12 15 Vestibule Retail::Sales 7.5 0.12 15 Corridor General::Corridors 0.0 0.06 0 Restroom Retail::Sales 7.5 0.12 15 Stock room General::Corridors 0.0 0.12 3.33* Office Office Buildings::Office space 5.0 0.06 5 Meeting room General::Conference/meeting 5.0 0.06 50
Break room Food and Beverage Service::Cafeteria/fast food dining 7.5 0.18 70
Mechanical room General::Corridors 0.0 0.06 0 * Value from (Deru et al. 2011) for back-of-house space in stand-alone retail model
The peak occupant densities in Table 3–5 are modified by schedules within EnergyPlus, which were adapted by the PC from those in Hale et al. (2009). The PC modified the schedules using their experience along with data collected from retail stores. The main modification was to add extended occupancy for the holiday season (the month of December). The occupancy schedules can be seen in Figure 3–5 and Figure 3–6.

19 This report is available at no cost from the National Renewable Energy Laboratory (NREL) at www.nrel.gov/publications.
Figure 3–5 Building occupancy schedule, January–November
Figure 3–6 Building occupancy schedule, December
0.0
0.1
0.2
0.3
0.4
0.5
0.6
0.7
0.8
0.9
1.0
1 2 3 4 5 6 7 8 9 10 11 12 13 14 15 16 17 18 19 20 21 22 23 24
Frac
tion
of P
eak
Hour
Weekday Saturday Sunday
0.0
0.1
0.2
0.3
0.4
0.5
0.6
0.7
0.8
0.9
1.0
1 2 3 4 5 6 7 8 9 10 11 12 13 14 15 16 17 18 19 20 21 22 23 24
Frac
tion
of P
eak
Hour
Weekday Saturday Sunday
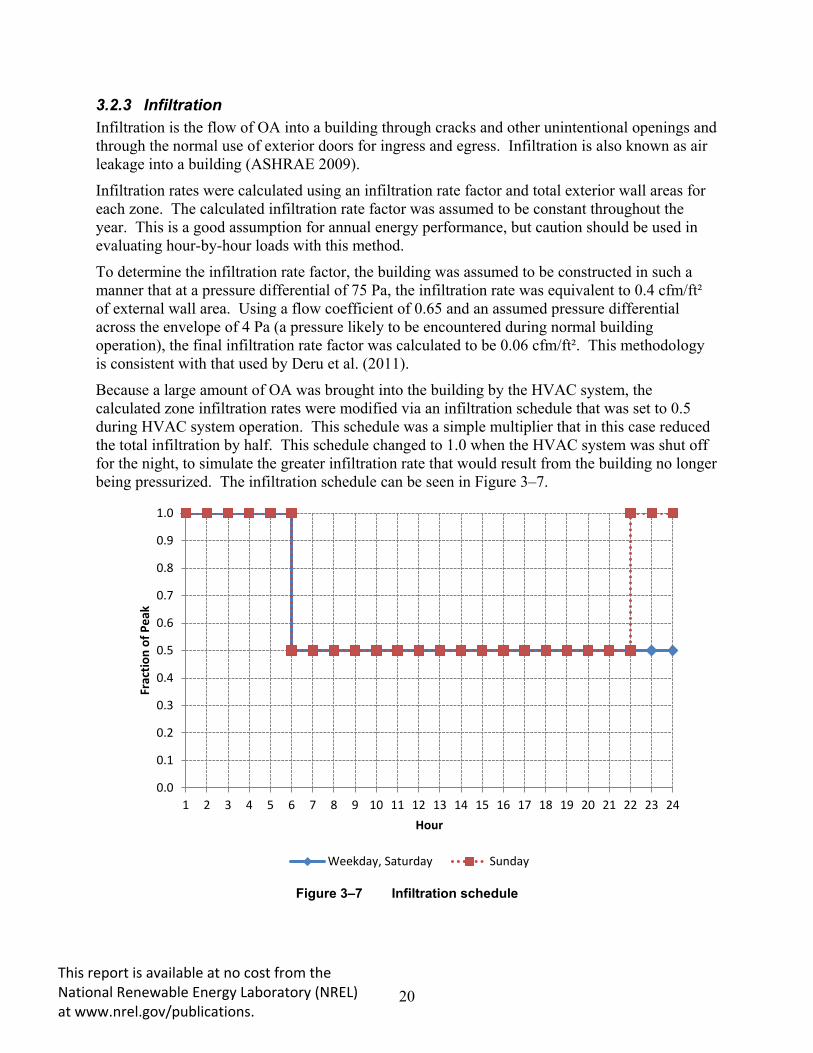
20 This report is available at no cost from the National Renewable Energy Laboratory (NREL) at www.nrel.gov/publications.
3.2.3 Infiltration Infiltration is the flow of OA into a building through cracks and other unintentional openings and through the normal use of exterior doors for ingress and egress. Infiltration is also known as air leakage into a building (ASHRAE 2009).
Infiltration rates were calculated using an infiltration rate factor and total exterior wall areas for each zone. The calculated infiltration rate factor was assumed to be constant throughout the year. This is a good assumption for annual energy performance, but caution should be used in evaluating hour-by-hour loads with this method.
To determine the infiltration rate factor, the building was assumed to be constructed in such a manner that at a pressure differential of 75 Pa, the infiltration rate was equivalent to 0.4 cfm/ft² of external wall area. Using a flow coefficient of 0.65 and an assumed pressure differential across the envelope of 4 Pa (a pressure likely to be encountered during normal building operation), the final infiltration rate factor was calculated to be 0.06 cfm/ft². This methodology is consistent with that used by Deru et al. (2011).
Because a large amount of OA was brought into the building by the HVAC system, the calculated zone infiltration rates were modified via an infiltration schedule that was set to 0.5 during HVAC system operation. This schedule was a simple multiplier that in this case reduced the total infiltration by half. This schedule changed to 1.0 when the HVAC system was shut off for the night, to simulate the greater infiltration rate that would result from the building no longer being pressurized. The infiltration schedule can be seen in Figure 3–7.
Figure 3–7 Infiltration schedule
0.0
0.1
0.2
0.3
0.4
0.5
0.6
0.7
0.8
0.9
1.0
1 2 3 4 5 6 7 8 9 10 11 12 13 14 15 16 17 18 19 20 21 22 23 24
Frac
tion
of P
eak
Hour
Weekday, Saturday Sunday

21 This report is available at no cost from the National Renewable Energy Laboratory (NREL) at www.nrel.gov/publications.
3.2.4 Thermostat Set Points The thermostat set points in the models were derived from those in Hale et al. (2009) and modified by the PC based on their experience. The occupied heating set point is 70°F and the unoccupied set point is 60°F. The occupied cooling set point is 75°F and the unoccupied set point is 86°F. The heating and cooling set point schedule is shown in Figure 3–8. This schedule remained consistent between the baseline and low-energy models.
Figure 3–8 Heating and cooling set point schedule
3.3 Baseline Model Development and Assumptions The baseline models were derived from the prototype models by applying the applicable criteria in Standard 90.1-2004. The PC used their expertise to help define items (such as lighting schedules) not specified by Standard 90.1-2004. Figure 3–9 shows a rendering of the medium box baseline models, and Figure 3–10 shows a rendering of the big box baseline model.
55
60
65
70
75
80
85
90
1 2 3 4 5 6 7 8 9 10 11 12 13 14 15 16 17 18 19 20 21 22 23 24
Degr
ees F
ahre
nhei
t
Hour
Heating Weekday, Saturday Heating Sunday
Cooling Weekday, Saturday Cooling Sunday

22 This report is available at no cost from the National Renewable Energy Laboratory (NREL) at www.nrel.gov/publications.
Figure 3–9 Medium box baseline models rendering
Figure 3–10 Big box baseline model rendering
3.3.1 Envelope The PC assumed, based on the experience of those in the retail construction industry, that facilities were typically constructed with steel-framed (for the medium box store) or mass (for the big box store) exterior walls, built-up roofs, and slab-on-grade floors. These constructions represent common practices. There are some regional variations, but the PC felt that steel-framed walls for the medium box store, mass walls for the big box store, built-up roofs, and slab-on-grade floors were the most common techniques.
The baseline retail store envelope characteristics were developed to meet the prescriptive design option requirements in accordance with Standard 90.1-2004 Section 5.2. For the Standard 90.1-2004 baselines, the prescriptive building envelope option in Section 5.5 was used. Layer-by-layer descriptions of the constructions were used to model the building thermal envelope in EnergyPlus.
3.3.1.1 Exterior Walls The baseline medium box stores were modeled with steel-framed wall constructions; the layers consisted of exterior sheathing, batt insulation between steel studs, and interior gypsum board. The baseline big box store was modeled with mass wall constructions; the layers consisted of stucco, concrete block, rigid insulation, and gypsum board. Insulation R-values were selected to meet the minimum wall insulation requirements in Tables 5.5-1 through 5.5-8 (Building

23 This report is available at no cost from the National Renewable Energy Laboratory (NREL) at www.nrel.gov/publications.
Envelope Requirements) of Standard 90.1-2004, as defined by climate zone. The baseline exterior wall R- and U-values are listed in Table 3–6.
Table 3–6 Baseline Exterior Wall Constructions
Climate Zone
Steel-Framed Exterior Walls (Medium Box Store)
Mass Exterior Walls (Big Box Store)
Assembly U-Factor
(Btu/h·ft²·°F)
Insulation R-Value, Nominal
(h·ft²·°F/Btu)
Assembly U-Factor
(Btu/h·ft²·°F)
Insulation R-Value, Nominal
(h·ft²·°F/Btu) 1 (A) U-0.124 R-13.0 U-0.580 NR*
2 (A,B) U-0.124 R-13.0 U-0.580 NR* 3 (A,B,C) U-0.124 R-13.0 U-0.151 R-5.7 c.i. 4 (A,B,C) U-0.124 R-13.0 U-0.151 R-5.7 c.i. 5 (A,B) U-0.084 R-13.0 + R-3.8 c.i. U-0.123 R-7.6 c.i. 6 (A,B) U-0.084 R-13.0 + R-3.8 c.i. U-0.104 R-9.5 c.i.
7 U-0.064 R-13.0 + R-7.5 c.i. U-0.090 R-11.4 c.i. 8 U-0.064 R-13.0 + R-7.5 c.i. U-0.080 R-13.3 c.i.
* No insulation requirement
The mass wall was assembled assuming 8-in. medium weight concrete blocks with a density of 140 lb/ft³ and solid grouted cores. The mass wall includes the following layers:
• Exterior air film (calculated by EnergyPlus) • 1-in exterior stucco • 8-in. concrete block, 140 lb/ft³ • 1-in. metal clips with rigid insulation (R-value varies by climate) • 0.5-in. thick gypsum board • Interior air film (calculated by EnergyPlus).
The steel-framed wall layer details are as follows:
• Exterior air film (calculated by EnergyPlus) • Nominally R-2 exterior sheathing • Batt wall insulation (R-value varies by climate) • 0.5-in. thick gypsum board • Interior air film (calculated by EnergyPlus).
To calculate the thermal performance of the interior air films, the “TARP” algorithm in EnergyPlus for surface heat transfer film coefficients was used. To calculate the thermal performance of the exterior air films, the “DOE-2” algorithm in EnergyPlus for surface heat transfer film coefficients was used. These algorithms are based on linearized radiation coefficients that are separate from the convection coefficients, as determined by surface roughness, wind speed, and terrain. However, standardized combined film coefficients were used to target assembly U-factors; these coefficients can be seen in Table 3–7 (DOE 2011).

24 This report is available at no cost from the National Renewable Energy Laboratory (NREL) at www.nrel.gov/publications.
Table 3–7 Standard Air Film Coefficients
Surface Class Interior Air Film Coefficient (h·ft²·°F/Btu)
Exterior Air Film Coefficient (h·ft²·°F/Btu)
Wall 0.68 0.17 Floor 0.92 0.46 Ceiling/roof 0.61 0.46
3.3.1.2 Roofs Built-up, rigid insulation above a structural metal deck roof was used in the baseline models. The layers consisted of the roof membrane, roof insulation, and metal decking. The U-factors varied based on the applicable climate zone. Added insulation was continuous and uninterrupted by framing. Roof insulation R-values were set to match the minimum roof insulation requirements in Tables 5.5-1 through 5.5-8 of Standard 90.1-2004, by climate. The baseline roof U-factors are summarized in Table 3–8.
Table 3–8 Baseline Roof Constructions
Climate Zone Assembly U-Factor (Btu/h·ft²·°F)
Insulation R-Value, Nominal (h·ft²·°F/Btu)
1 (A) U-0.063 R-15.0 c.i. 2 (A,B) U-0.063 R-15.0 c.i.
3 (A,B,C) U-0.063 R-15.0 c.i. 4 (A,B,C) U-0.063 R-15.0 c.i. 5 (A,B) U-0.063 R-15.0 c.i. 6 (A,B) U-0.063 R-15.0 c.i.
7 U-0.063 R-15.0 c.i. 8 U-0.048 R-20.0 c.i.
Standard 90.1-2004 does not specify absorptance or other surface assumptions. The roof exterior finish was assumed to be a single-ply roof membrane with gray ethylene propylene polymer membrane in the baseline models. Therefore, a solar reflectance of 0.3, a thermal absorption of 0.9, and a visible absorption of 0.7 were assumed.
3.3.1.3 Slab-on-Grade Floors The baseline buildings were modeled with slab-on-grade floors, which were composed of a carpet pad layer over an 8-in. thick heavyweight concrete layer.
A slab program that is packaged with EnergyPlus, which determines the temperature of the ground under the slab based on the area of the slab, the location of the building, and the type of insulation under or around the slab, was used to model the ground coupling. For the baseline models, the program was used to run a simple building in each location with the slab insulation requirements in Standard 90.1-2004. The program reports the perimeter ground monthly temperatures, the core ground monthly temperatures, and monthly averages of these temperatures. For this analysis, the average monthly temperatures were used as the input for the ground temperatures under the floor slab in the EnergyPlus input files, and can be found in Table 3–9 and Table 3–10.

25 This report is available at no cost from the National Renewable Energy Laboratory (NREL) at www.nrel.gov/publications.
Table 3–9 Simulated Monthly Ground Temperatures (°F), 1A–4A
Month 1A 2A 2B 3A 3B:CA 3B 3C 4A Jan 72.5 69.0 66.7 67.9 68.2 66.0 67.8 67.5 Feb 72.8 68.6 66.6 67.8 68.2 66.0 67.9 67.4 Mar 73.0 69.4 68.7 67.9 68.2 66.0 67.8 67.5 Apr 73.3 71.8 70.5 68.8 68.4 68.6 67.9 67.5 May 73.5 73.0 70.7 71.7 69.0 69.6 67.9 68.9 Jun 73.5 73.2 70.1 72.6 69.7 69.7 68.1 71.8 Jul 73.6 73.3 69.9 72.8 72.3 69.4 68.6 72.4 Aug 73.6 73.3 70.3 73.0 72.9 69.5 68.1 72.6 Sep 73.6 73.4 70.6 73.1 73.0 69.8 68.8 71.9 Oct 73.7 73.1 70.9 70.1 71.5 69.6 68.2 69.1 Nov 73.5 70.9 68.6 68.5 69.1 66.6 68.0 68.1 Dec 73.2 69.2 66.9 68.1 68.4 66.1 67.9 67.6
Table 3–10 Simulated Monthly Ground Temperatures (°F), 4B–8
Month 4B 4C 5A 5B 6A 6B 7 8 Jan 66.6 67.5 67.1 66.6 66.8 66.4 66.5 65.2 Feb 66.6 67.5 67.1 66.5 66.8 66.5 66.5 65.1 Mar 66.5 67.5 67.2 66.6 66.9 66.5 66.6 65.4 Apr 66.6 67.6 67.3 66.7 67.1 66.6 66.8 65.7 May 68.8 67.7 68.0 66.9 68.3 66.7 66.9 66.0 Jun 70.5 68.1 71.0 68.8 70.8 68.1 67.6 66.4 Jul 70.8 69.3 72.0 70.7 71.8 70.4 69.7 67.3 Aug 71.1 70.0 72.3 71.2 72.1 69.8 68.8 66.6 Sep 71.3 68.8 70.6 68.8 69.2 67.7 67.6 66.4 Oct 67.7 68.0 68.2 67.2 67.8 66.9 67.2 66.1 Nov 66.9 67.7 67.6 66.8 67.4 66.7 67.0 65.7 Dec 66.7 67.6 67.3 66.6 67.1 66.5 66.7 65.4
3.3.1.4 Fenestration Building fenestration includes all envelope penetrations used for ingress and egress or lighting, such as windows, doors, and skylights.
Standard 90.1-2004 (ASHRAE 2004b) specifies window properties as window systems and not as window frame and glass separately; thus, window frames were not explicitly modeled and only one window was modeled per exterior surface. This reduced the complexity and increased the speed of the EnergyPlus simulations. Only the south façade of the building was glazed, and had an overall fraction of fenestration to gross wall area of 22%, with individual fenestration objects distributed evenly on applicable exterior surfaces. Box retail stores usually do not have much glazing. For this model, only the front of the store (the south façade) was glazed.
The U-factors and solar heat gain coefficients (SHGCs) that were applied to the fenestration objects were whole-assembly values and included framing effects. The performance criteria listed in Table 3–11 were set to match the requirements of Table 5.5-1 through Table 5.5-8 in Standard 90.1-2004 (ASHRAE 2004b). The multipliers from the visible light transmittance (VLT) table, Table C3.5 in Standard 90.1-2004 Appendix C (ASHRAE 2004b), were used to calculate VLT values for the baseline windows.

26 This report is available at no cost from the National Renewable Energy Laboratory (NREL) at www.nrel.gov/publications.
Table 3–11 Baseline Window Constructions
Climate Zone U-Factor (Btu/h·ft²·°F) SHGC VLT
1 (A) 1.22 0.25 0.250 2 (A,B) 1.22 0.25 0.250 3 (A,B) 0.57 0.25 0.318 3 (C) 1.22 0.34 0.340
4 (A,B,C) 0.57 0.39 0.495 5 (A,B) 0.57 0.39 0.495 6 (A,B) 0.57 0.39 0.495
7 0.57 0.49 0.490 8 0.46 NR, 0.49 used NR, 0.490 used
3.3.2 Electric Lighting 3.3.2.1 Interior Lighting The lighting power densities (LPDs) used in the baseline models are listed in Table 3–12. These values were determined by using the space-by-space method in Standard 90.1-2004, Table 9.6.1 (ASHRAE 2004b). The double colon in Table 3–12 is a means for indicating the common space types and subspace types in Table 9.6.1 in Standard 90.1-2004 (ASHRAE 2004b).
Table 3–12 LPD by Space Type
Model Space Type 90.1-2004 Table 9.6.1 Space Type LPD (W/ft²)
Sales floor Retail::sales area 3.35* Vestibule Corridor/transition 0.50 Corridor Corridor/transition 0.50 Restroom Restrooms 0.90 Stock room Active storage 0.80 Office Office – enclosed 1.10 Meeting room Conference/meeting/multipurpose 1.17** (1.30) Break room Dining area 0.81** (0.90) Mechanical room Electrical/mechanical 1.50
* Includes 1.65 W/ft² of accent lighting ** 10% reduction applied in the models to account for occupancy sensors, the 90.1 value is in parenthesis
The peak values in Table 3–12 were modified with hour-by-hour multiplier schedules in EnergyPlus. Both the medium box and big box models used the schedules in Figure 3–11. The lighting schedules were adapted by the PC from those in Hale et al. (2009) based on their experience with retail stores.

27 This report is available at no cost from the National Renewable Energy Laboratory (NREL) at www.nrel.gov/publications.
Figure 3–11 Baseline lighting schedule
3.3.2.2 Exterior Lighting The exterior lighting in the models was meant to represent parking lot lighting. The parking lot area was assumed to be 2.5 times the building area (101,250 ft² for the medium box store, 248,088 ft² for the big box store). The LPD was 0.15 W/ft² of parking lot area (Standard 90.1-2004 Table 9.4.5), resulting in 15,188 W for the medium box store and 37,213 W for the big box store. In both models, the lights were controlled by an astronomical clock that turned the lights on when the sun set and off when the sun rose.
3.3.3 Plug and Process Loads The plug and process loads were adapted from Hale et al. (2009) based on PC input. Table 3–13 shows a summary of the plug and process loads used in the models.
0.0
0.1
0.2
0.3
0.4
0.5
0.6
0.7
0.8
0.9
1.0
1 2 3 4 5 6 7 8 9 10 11 12 13 14 15 16 17 18 19 20 21 22 23 24
Frac
tion
of P
eak
Hour
Weekday, Saturday Sunday
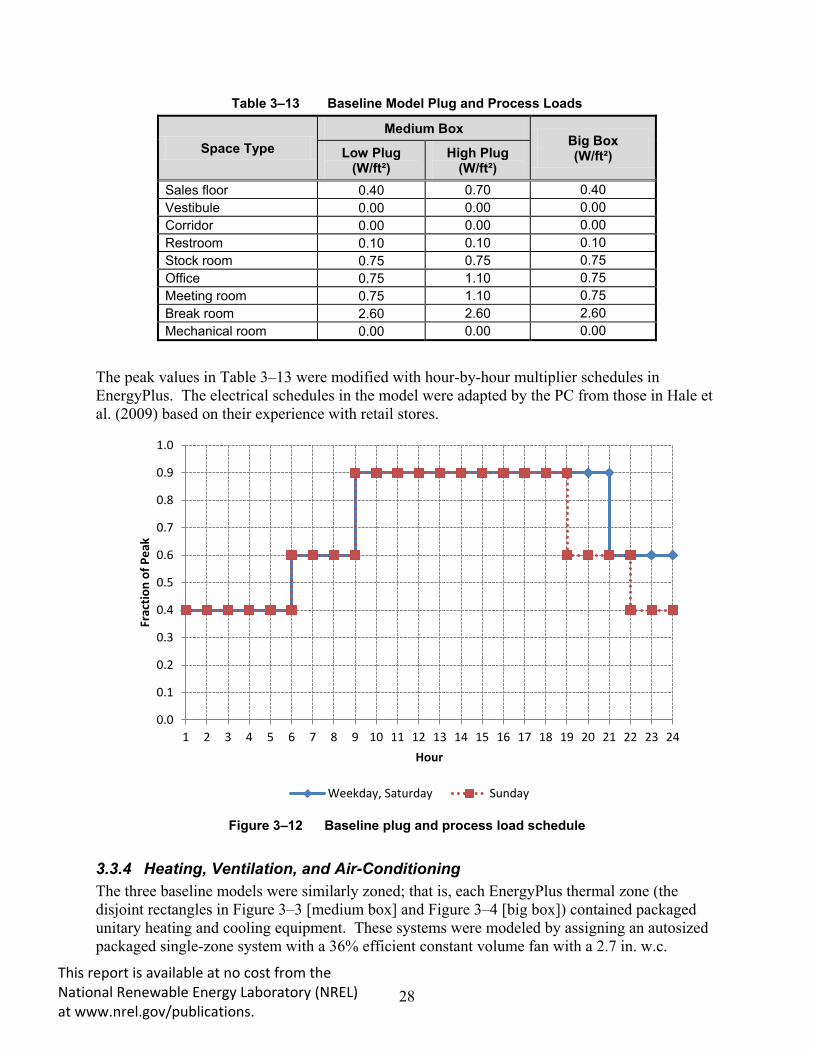
28 This report is available at no cost from the National Renewable Energy Laboratory (NREL) at www.nrel.gov/publications.
Table 3–13 Baseline Model Plug and Process Loads
Space Type Medium Box
Big Box (W/ft²) Low Plug
(W/ft²) High Plug
(W/ft²) Sales floor 0.40 0.70 0.40 Vestibule 0.00 0.00 0.00 Corridor 0.00 0.00 0.00 Restroom 0.10 0.10 0.10 Stock room 0.75 0.75 0.75 Office 0.75 1.10 0.75 Meeting room 0.75 1.10 0.75 Break room 2.60 2.60 2.60 Mechanical room 0.00 0.00 0.00
The peak values in Table 3–13 were modified with hour-by-hour multiplier schedules in EnergyPlus. The electrical schedules in the model were adapted by the PC from those in Hale et al. (2009) based on their experience with retail stores.
Figure 3–12 Baseline plug and process load schedule
3.3.4 Heating, Ventilation, and Air-Conditioning The three baseline models were similarly zoned; that is, each EnergyPlus thermal zone (the disjoint rectangles in Figure 3–3 [medium box] and Figure 3–4 [big box]) contained packaged unitary heating and cooling equipment. These systems were modeled by assigning an autosized packaged single-zone system with a 36% efficient constant volume fan with a 2.7 in. w.c.
0.0
0.1
0.2
0.3
0.4
0.5
0.6
0.7
0.8
0.9
1.0
1 2 3 4 5 6 7 8 9 10 11 12 13 14 15 16 17 18 19 20 21 22 23 24
Frac
tion
of P
eak
Hour
Weekday, Saturday Sunday

29 This report is available at no cost from the National Renewable Energy Laboratory (NREL) at www.nrel.gov/publications.
pressure drop, a 3.69 coefficient of performance (COP) DX cooling coil, and an 80% efficient natural gas-fired furnace to each thermal zone. The units contained desuperheat coils to help control humidity. Not all retailers can control humidity in their stores, but a conservative approach from an energy consumption standpoint was taken to model humidity control. Hot gas reheat coils are passive and proper humidity levels may be achieved at the expense of overcooling of the space. To overcome this problem, active electric heating coils were modeled in EnergyPlus to maintain comfort by adding electric baseboard heat to each zone. We assumed that the larger zones would be served by multiple such units, even though EnergyPlus assigned only one HVAC system, which was meant to represent multiple, identical smaller packaged units that operated in tandem to condition the space. This is acceptable because normalized performance curves for the smaller unit were used. For purposes of specifying efficiency, we assumed 10-ton units in all cases, with multiple 10 -on units serving larger spaces.
3.3.5 Service Water Heating The baseline SWH system remained unchanged from Hale et al. (2009). The system included an electric storage water heater with a thermal efficiency (Et) of 86.4%. The consumption rates of hot water were determined using ASHRAE (2003), specifically Chapter 49, Table 8. That table does not have an entry for retail, so we assumed that the retail hot water use was similar to that in an office building. The peak hot water consumption rate for all baseline models was 18 gal/h, based on 40 gal/h for sinks and 20 gal/h for public lavatories, multiplied by a demand factor of 0.3. The water heater storage tank had a volume of 50 gal based on a storage capacity factor of 2.0 and 71.4% usable volume percentage. The consumption schedule as a fraction of peak load was the same as the occupancy schedule (see Figure 3–5 and Figure 3–6). The delivered hot water outlet temperature at the fixture was assumed to be 104ºF and the water heater set point was 140ºF.
3.3.6 Baseline Simulation Results Table 3–14 and Table 3–15 present the simulation results for the medium box low plug load baseline model. These results are presented graphically in Figure 3–13. Table 3–16, Table 3–17, and Figure 3–14 present the same for the medium box high plug load baseline model, while Table 3–18, Table 3–19, and Figure 3–15 present the same for the big box baseline model.
Table 3–14 Medium Box Low Plug Baseline Simulation Results, 1A–4A
End Use (kBtu/ft²yr) 1A 2A 2B 3A 3B:CA 3B 3C 4A
Interior equipment (electric) 9.5 9.5 9.5 9.5 9.5 9.5 9.5 9.5 Interior lighting (electric) 48.6 48.6 48.6 48.6 48.6 48.6 48.6 48.6 Exterior lighting (electric) 5.6 5.6 5.6 5.6 5.6 5.6 5.6 5.6 Heating (gas) 0.0 1.2 0.8 2.6 0.3 1.5 1.4 6.0 Heating (electric) 0.1 0.4 0.0 0.2 0.1 0.0 0.1 0.2 Cooling (electric) 32.5 25.2 18.9 14.1 7.9 14.0 2.5 11.2 Fans (electric) 19.0 19.9 20.7 19.9 18.1 20.5 16.2 19.3 SWH (electric) 0.5 0.6 0.5 0.7 0.6 0.6 0.7 0.7 Total 115.7 111.0 104.6 101.3 90.7 100.3 84.6 101.2

30 This report is available at no cost from the National Renewable Energy Laboratory (NREL) at www.nrel.gov/publications.
Table 3–15 Medium Box Low Plug Baseline Simulation Results, 4B–8
End Use (kBtu/ft²yr) 4B 4C 5A 5B 6A 6B 7 8
Interior equipment (electric) 9.5 9.5 9.5 9.5 9.5 9.5 9.5 9.5 Interior lighting (electric) 48.6 48.6 48.6 48.6 48.6 48.6 48.6 48.6 Exterior lighting (electric) 5.6 5.6 5.6 5.6 5.6 5.6 5.6 5.5 Heating (gas) 3.5 3.7 8.9 5.7 15.3 10.6 19.2 40.8 Heating (electric) 0.0 0.1 0.2 0.1 0.2 0.1 0.2 0.2 Cooling (electric) 8.9 2.7 7.9 6.4 6.7 3.9 2.7 1.2 Fans (electric) 22.3 17.5 18.5 20.9 18.5 19.9 17.4 15.8 SWH (electric) 0.7 0.8 0.8 0.8 0.8 0.9 0.9 1.0 Total 99.1 88.6 100.0 97.5 105.1 99.1 104.2 122.8
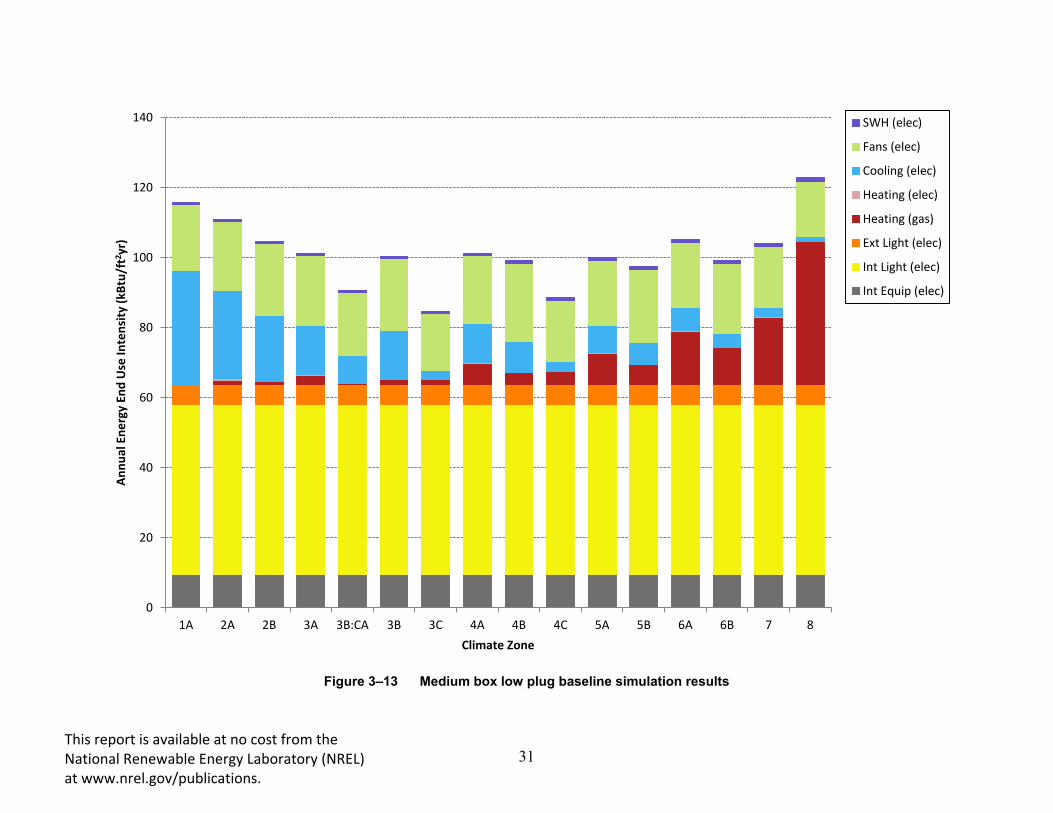
31
Figure 3–13 Medium box low plug baseline simulation results
0
20
40
60
80
100
120
140
1A 2A 2B 3A 3B:CA 3B 3C 4A 4B 4C 5A 5B 6A 6B 7 8
Annu
al E
nerg
y En
d U
se In
tens
ity (k
Btu/
ft2 y
r)
Climate Zone
SWH (elec)
Fans (elec)
Cooling (elec)
Heating (elec)
Heating (gas)
Ext Light (elec)
Int Light (elec)
Int Equip (elec)
This report is available at no cost from the National Renewable Energy Laboratory (NREL) at www.nrel.gov/publications.

32 This report is available at no cost from the National Renewable Energy Laboratory (NREL) at www.nrel.gov/publications.
Table 3–16 Medium Box High Plug Baseline Simulation Results, 1A–4A
End Use (kBtu/ft²yr) 1A 2A 2B 3A 3B:CA 3B 3C 4A
Interior equipment (electric) 14.5 14.5 14.5 14.5 14.5 14.5 14.5 14.5 Interior lighting (electric) 48.6 48.6 48.6 48.6 48.6 48.6 48.6 48.6 Exterior lighting (electric) 5.6 5.6 5.6 5.6 5.6 5.6 5.6 5.6 Heating (gas) 0.0 1.1 0.7 2.3 0.3 1.3 1.3 5.3 Heating (electric) 0.1 0.3 0.0 0.2 0.1 0.0 0.1 0.2 Cooling (electric) 33.4 25.8 20.0 14.7 8.4 14.9 2.8 11.6 Fans (electric) 19.9 20.8 21.6 20.8 19.0 21.5 17.0 20.2 SWH (electric) 0.5 0.6 0.5 0.7 0.6 0.6 0.7 0.7 Total 122.5 117.3 111.5 107.4 97.1 107.0 90.6 106.8
Table 3–17 Medium Box High Plug Baseline Simulation Results, 4B–8
End Use (kBtu/ft²yr) 4B 4C 5A 5B 6A 6B 7 8
Interior equipment (electric) 14.5 14.5 14.5 14.5 14.5 14.5 14.5 14.5 Interior lighting (electric) 48.6 48.6 48.6 48.6 48.6 48.6 48.6 48.6 Exterior lighting (electric) 5.6 5.6 5.6 5.6 5.6 5.6 5.6 5.5 Heating (gas) 3.0 3.2 7.9 5.0 13.7 9.5 17.3 37.9 Heating (electric) 0.0 0.1 0.1 0.1 0.1 0.1 0.2 0.2 Cooling (electric) 9.6 3.0 8.3 6.9 7.1 4.3 2.9 1.3 Fans (electric) 23.3 18.4 19.4 22.0 19.4 20.9 18.3 16.7 SWH (electric) 0.7 0.8 0.8 0.8 0.8 0.9 0.9 1.0 Total 105.4 94.2 105.3 103.4 109.8 104.3 108.3 125.9

33
Figure 3–14 Medium box high plug baseline simulation results
0
20
40
60
80
100
120
140
1A 2A 2B 3A 3B:CA 3B 3C 4A 4B 4C 5A 5B 6A 6B 7 8
Annu
al E
nerg
y En
d U
se In
tens
ity (k
Btu/
ft2 y
r)
Climate Zone
SWH (elec)
Fans (elec)
Cooling (elec)
Heating (elec)
Heating (gas)
Ext Light (elec)
Int Light (elec)
Int Equip (elec)
This report is available at no cost from the National Renewable Energy Laboratory (NREL) at www.nrel.gov/publications.

34 This report is available at no cost from the National Renewable Energy Laboratory (NREL) at www.nrel.gov/publications.
Table 3–18 Big Box Baseline Simulation Results, 1A–4A
End Use (kBtu/ft²yr) 1A 2A 2B 3A 3B:CA 3B 3C 4A
Interior equipment (electric) 9.6 9.6 9.6 9.6 9.6 9.6 9.6 9.6 Interior lighting (electric) 48.8 48.8 48.8 48.8 48.8 48.8 48.8 48.8 Exterior lighting (electric) 5.6 5.6 5.6 5.6 5.6 5.6 5.6 5.6 Heating (gas) 0.0 1.2 0.6 1.8 0.1 0.9 0.8 4.5 Heating (electric) 0.0 0.3 0.0 0.1 0.0 0.0 0.0 0.1 Cooling (electric) 32.2 24.6 20.0 13.2 7.4 13.4 2.4 10.4 Fans (electric) 19.5 20.2 21.5 18.4 16.8 18.6 14.5 17.7 SWH (electric) 0.2 0.2 0.2 0.3 0.3 0.2 0.3 0.3 Total 116.0 110.6 106.3 97.8 88.7 97.2 82.0 97.0
Table 3–19 Big Box Baseline Simulation Results, 4B–8
End Use (kBtu/ft²yr) 4B 4C 5A 5B 6A 6B 7 8
Interior equipment (electric) 9.6 9.6 9.6 9.6 9.6 9.6 9.6 9.6 Interior lighting (electric) 48.8 48.8 48.8 48.8 48.8 48.8 48.8 48.8 Exterior lighting (electric) 5.6 5.6 5.6 5.6 5.6 5.6 5.6 5.5 Heating (gas) 2.2 2.8 7.6 4.5 13.0 8.7 17.2 37.0 Heating (electric) 0.0 0.1 0.1 0.0 0.1 0.1 0.1 0.1 Cooling (electric) 8.6 2.5 7.5 6.1 6.3 3.8 2.6 1.1 Fans (electric) 20.3 15.7 17.3 19.5 17.2 18.3 16.3 14.3 SWH (electric) 0.3 0.3 0.3 0.3 0.3 0.3 0.4 0.4 Total 95.5 85.5 96.9 94.6 101.0 95.3 100.6 117.1

35
Figure 3–15 Big box baseline simulation results
0
20
40
60
80
100
120
140
1A 2A 2B 3A 3B:CA 3B 3C 4A 4B 4C 5A 5B 6A 6B 7 8
Annu
al E
nerg
y En
d U
se In
tens
ity (k
Btu/
ft2 y
r)
Climate Zone
SWH (elec)
Fans (elec)
Cooling (elec)
Heating (elec)
Heating (gas)
Ext Light (elec)
Int Light (elec)
Int Equip (elec)
This report is available at no cost from the National Renewable Energy Laboratory (NREL) at www.nrel.gov/publications.

36 This report is available at no cost from the National Renewable Energy Laboratory (NREL) at www.nrel.gov/publications.
3.3.7 All-Electric Baseline The ASHP low-energy HVAC system (see Section 3.4.4.4) is all electric; that is, there is no on-site combustion for heating. To eliminate fuel switching and enable a fair comparison of energy use, an all-electric baseline was created for each prototype model. This model was used for comparison to the ASHP HVAC system. The only difference in the all-electric baseline models was that the natural gas-fired furnace in the HVAC units was replaced with an electric resistance coil. The results from these baselines formed the basis for comparison for the ASHP low-energy model variation.
Table 3–20 and Table 3–21 present the simulation results for the medium box low plug load electric baseline model. These results are presented graphically in Figure 3–16. Table 3–22, Table 3–23, and Figure 3–17 present the same for the medium box high plug load all-electric baseline model, while Table 3–24, Table 3–25, and Figure 3–18 present the same for the big box all-electric baseline model.
Table 3–20 Medium Box Low Plug All-Electric Baseline Simulation Results, 1A–4A
End Use (kBtu/ft²yr) 1A 2A 2B 3A 3B:CA 3B 3C 4A
Interior equipment (electric) 9.5 9.5 9.5 9.5 9.5 9.5 9.5 9.5 Interior lighting (electric) 48.6 48.6 48.6 48.6 48.6 48.6 48.6 48.6 Exterior lighting (electric) 5.6 5.6 5.6 5.6 5.6 5.6 5.6 5.6 Heating (electric) 0.1 1.4 0.7 2.4 0.4 1.2 1.3 5.0 Cooling (electric) 32.5 25.2 18.9 14.1 7.9 14.0 2.5 11.2 Fans (electric) 19.0 19.9 20.7 19.9 18.1 20.5 16.2 19.3 SWH (electric) 0.5 0.6 0.5 0.7 0.6 0.6 0.7 0.7 Total 115.7 110.7 104.5 100.8 90.7 100.0 84.4 100.0
Table 3–21 Medium Box Low Plug All-Electric Baseline Simulation Results, 4B–8
End Use (kBtu/ft²yr) 4B 4C 5A 5B 6A 6B 7 8
Interior equipment (electric) 9.5 9.5 9.5 9.5 9.5 9.5 9.5 9.5 Interior lighting (electric) 48.6 48.6 48.6 48.6 48.6 48.6 48.6 48.6 Exterior lighting (electric) 5.6 5.6 5.6 5.6 5.6 5.6 5.6 5.5 Heating (electric) 2.8 3.1 7.3 4.6 12.4 8.6 15.6 32.9 Cooling (electric) 8.9 2.7 7.9 6.4 6.7 3.9 2.7 1.2 Fans (electric) 22.3 17.5 18.5 20.9 18.5 19.9 17.4 15.8 SWH (electric) 0.7 0.8 0.8 0.8 0.8 0.9 0.9 1.0 Total 98.4 87.8 98.2 96.4 102.1 97.0 100.3 114.6

37
Figure 3–16 Medium box low plug all-electric baseline simulation results
0
20
40
60
80
100
120
140
1A 2A 2B 3A 3B:CA 3B 3C 4A 4B 4C 5A 5B 6A 6B 7 8
Annu
al E
nerg
y En
d U
se In
tens
ity (k
Btu/
ft2 y
r)
Climate Zone
SWH (elec)
Fans (elec)
Cooling (elec)
Heating (elec)
Ext Light (elec)
Int Light (elec)
Int Equip (elec)
This report is available at no cost from the National Renewable Energy Laboratory (NREL) at www.nrel.gov/publications.

38 This report is available at no cost from the National Renewable Energy Laboratory (NREL) at www.nrel.gov/publications.
Table 3–22 Medium Box High Plug All-Electric Baseline Simulation Results, 1A–4A
End Use (kBtu/ft²yr) 1A 2A 2B 3A 3B:CA 3B 3C 4A
Interior equipment (electric) 14.5 14.5 14.5 14.5 14.5 14.5 14.5 14.5 Interior lighting (electric) 48.6 48.6 48.6 48.6 48.6 48.6 48.6 48.6 Exterior lighting (electric) 5.6 5.6 5.6 5.6 5.6 5.6 5.6 5.6 Heating (electric) 0.1 1.2 0.6 2.1 0.3 1.1 1.1 4.4 Cooling (electric) 33.4 25.8 20.0 14.7 8.4 14.9 2.8 11.6 Fans (electric) 19.9 20.8 21.6 20.8 19.0 21.5 17.0 20.2 SWH (electric) 0.5 0.6 0.5 0.7 0.6 0.6 0.7 0.7 Total 122.5 117.1 111.4 107.0 97.1 106.7 90.4 105.7
Table 3–23 Medium Box High Plug All-Electric Baseline Simulation Results, 4B–8
End Use (kBtu/ft²yr) 4B 4C 5A 5B 6A 6B 7 8
Interior equipment (electric) 14.5 14.5 14.5 14.5 14.5 14.5 14.5 14.5 Interior lighting (electric) 48.6 48.6 48.6 48.6 48.6 48.6 48.6 48.6 Exterior lighting (electric) 5.6 5.6 5.6 5.6 5.6 5.6 5.6 5.5 Heating (electric) 2.5 2.7 6.5 4.1 11.1 7.7 14.0 30.5 Cooling (electric) 9.6 3.0 8.3 6.9 7.1 4.3 2.9 1.3 Fans (electric) 23.3 18.4 19.4 22.0 19.4 20.9 18.3 16.7 SWH (electric) 0.7 0.8 0.8 0.8 0.8 0.9 0.9 1.0 Total 104.8 93.5 103.7 102.4 107.1 102.4 104.9 118.3

39
Figure 3–17 Medium box high plug all-electric baseline simulation results
0
20
40
60
80
100
120
140
1A 2A 2B 3A 3B:CA 3B 3C 4A 4B 4C 5A 5B 6A 6B 7 8
Annu
al E
nerg
y En
d U
se In
tens
ity (k
Btu/
ft2 y
r)
Climate Zone
SWH (elec)
Fans (elec)
Cooling (elec)
Heating (elec)
Ext Light (elec)
Int Light (elec)
Int Equip (elec)
This report is available at no cost from the National Renewable Energy Laboratory (NREL) at www.nrel.gov/publications.

40 This report is available at no cost from the National Renewable Energy Laboratory (NREL) at www.nrel.gov/publications.
Table 3–24 Big Box All-Electric Baseline Simulation Results, 1A–4A
End Use (kBtu/ft²yr) 1A 2A 2B 3A 3B:CA 3B 3C 4A
Interior equipment (electric) 9.6 9.6 9.6 9.6 9.6 9.6 9.6 9.6 Interior lighting (electric) 48.8 48.8 48.8 48.8 48.8 48.8 48.8 48.8 Exterior lighting (electric) 5.6 5.6 5.6 5.6 5.6 5.6 5.6 5.6 Heating (electric) 0.1 1.3 0.5 1.5 0.1 0.7 0.7 3.7 Cooling (electric) 32.2 24.6 20.0 13.2 7.4 13.4 2.4 10.4 Fans (electric) 19.5 20.2 21.5 18.4 16.8 18.6 14.5 17.7 SWH (electric) 0.2 0.2 0.2 0.3 0.3 0.2 0.3 0.3 Total 116.0 110.4 106.2 97.5 88.6 97.0 81.9 96.1
Table 3–25 Big Box All-Electric Baseline Simulation Results, 4B–8
End Use (kBtu/ft²yr) 4B 4C 5A 5B 6A 6B 7 8
Interior equipment (electric) 9.6 9.6 9.6 9.6 9.6 9.6 9.6 9.6 Interior lighting (electric) 48.8 48.8 48.8 48.8 48.8 48.8 48.8 48.8 Exterior lighting (electric) 5.6 5.6 5.6 5.6 5.6 5.6 5.6 5.5 Heating (electric) 1.8 2.3 6.2 3.7 10.5 7.0 13.9 29.8 Cooling (electric) 8.6 2.5 7.5 6.1 6.3 3.8 2.6 1.1 Fans (electric) 20.3 15.7 17.3 19.5 17.2 18.3 16.3 14.3 SWH (electric) 0.3 0.3 0.3 0.3 0.3 0.3 0.4 0.4 Total 95.1 84.9 95.4 93.7 98.4 93.6 97.1 109.7

41
Figure 3–18 Big box all-electric baseline simulation results
0
20
40
60
80
100
120
140
1A 2A 2B 3A 3B:CA 3B 3C 4A 4B 4C 5A 5B 6A 6B 7 8
Annu
al E
nerg
y En
d U
se In
tens
ity (k
Btu/
ft2 y
r)
Climate Zone
SWH (elec)
Fans (elec)
Cooling (elec)
Heating (elec)
Ext Light (elec)
Int Light (elec)
Int Equip (elec)
This report is available at no cost from the National Renewable Energy Laboratory (NREL) at www.nrel.gov/publications.

42 This report is available at no cost from the National Renewable Energy Laboratory (NREL) at www.nrel.gov/publications.
3.4 Low-Energy Model Development and Assumptions Extensive modeling was used to determine the effectiveness of all considered AEDG-MBBR recommendations. This section documents the energy models that incorporated the final set of AEDG-MBBR recommendations.
3.4.1 Envelope 3.4.1.1 Exterior Walls The exterior walls in all three low-energy models were modeled exactly as in the baseline models, except for the insulation layer. The low-energy exterior wall R- and U-values are shown in Table 3–26 (steel-framed walls) and Table 3–27 (mass walls), with the baseline values included for easy comparison.
Table 3–26 Low-Energy Steel-Framed Exterior Wall Constructions
Climate Zone
Assembly U-Factor (Btu/h·ft²·°F)
Insulation R-Value, Nominal (h·ft²·°F/Btu)
Baseline Models Low-Energy Models Baseline Models Low-Energy Models 1 (A) U-0.124 U-0.064 R-13.0 R-13.0 + R-7.5 c.i.
2 (A,B) U-0.124 U-0.064 R-13.0 R-13.0 + R-7.5 c.i. 3 (A,B,C) U-0.124 U-0.064 R-13.0 R-13.0 + R-7.5 c.i. 4 (A,B,C) U-0.124 U-0.057 R-13.0 R-13.0 + R-10.0 c.i. 5 (A,B) U-0.084 U-0.049 R-13.0 + R-3.8 c.i. R-13.0 + R-12.5 c.i. 6 (A,B) U-0.084 U-0.043 R-13.0 + R-3.8 c.i. R-13.0 + R-15.0 c.i.
7 U-0.064 U-0.037 R-13.0 + R-7.5 c.i. R-13.0 + R-18.8 c.i. 8 U-0.064 U-0.037 R-13.0 + R-7.5 c.i. R-13.0 + R-18.8 c.i.
Table 3–27 Low-Energy Mass Exterior Wall Constructions
Climate Zone
Assembly U-Factor (Btu/h·ft²·°F)
Insulation R-Value, Nominal (h·ft²·°F/Btu)
Baseline Models Low-Energy Models Baseline Models Low-Energy Models 1 (A) U-0.580 U-0.580 NR* NR*
2 (A,B) U-0.580 U-0.151 NR* R-5.7 c.i. 3 (A,B,C) U-0.151 U-0.123 R-5.7 c.i. R-7.6 c.i. 4 (A,B,C) U-0.151 U-0.104 R-5.7 c.i. R-9.5 c.i. 5 (A,B) U-0.123 U-0.090 R-7.6 c.i. R-11.4 c.i. 6 (A,B) U-0.104 U-0.071 R-9.5 c.i. R-15.4 c.i.
7 U-0.090 U-0.067 R-11.4 c.i. R-17.0 c.i. 8 U-0.080 U-0.063 R-13.3 c.i. R-19.0 c.i.
* No insulation requirement
3.4.1.2 Roofs The roofs in the low-energy models were modeled exactly as in the baseline models, except for the insulation layer. The low-energy roof R- and U-values used are provided in Table 3–28, with the baseline values included for easy comparison.

43 This report is available at no cost from the National Renewable Energy Laboratory (NREL) at www.nrel.gov/publications.
Table 3–28 Low-Energy Roof Constructions
Climate Zone
Assembly U-Factor (Btu/h·ft²·°F)
Insulation R-Value, Nominal (h·ft²·°F/Btu)
Baseline Models Low-Energy Models Baseline Models Low-Energy Models 1 (A) U-0.063 U-0.048 R-15.0 c.i. R-20.0 c.i.
2 (A,B) U-0.063 U-0.039 R-15.0 c.i. R-25.0 c.i. 3 (A,B,C) U-0.063 U-0.039 R-15.0 c.i. R-25.0 c.i. 4 (A,B,C) U-0.063 U-0.039 R-15.0 c.i. R-25.0 c.i. 5 (A,B) U-0.063 U-0.032 R-15.0 c.i. R-30.0 c.i. 6 (A,B) U-0.063 U-0.032 R-15.0 c.i. R-30.0 c.i.
7 U-0.063 U-0.028 R-15.0 c.i. R-35.0 c.i. 8 U-0.048 U-0.028 R-20.0 c.i. R-35.0 c.i.
3.4.1.3 Slab-on-Grade Floors The floors in the low-energy models were modeled exactly as those in the baseline models.
3.4.1.4 View Fenestration The U-factors, SHGCs, and VLTs that were used in the low-energy models are shown in Table 3–29, with the baseline values included for easy comparison.
Table 3–29 Low-Energy View Window Constructions
Climate Zone
U-Factor (Btu/h·ft²·°F) SHGC VLT
Baseline Models
Low-Energy Models
Baseline Models
Low-Energy Models
Baseline Models
Low-Energy Models
1 (A) 1.22 1.20 0.25 0.25 0.250 0.250 2 (A,B) 1.22 0.70 0.25 0.25 0.250 0.250 3 (A,B) 0.57 0.60 0.25 0.25 0.318 0.320 3 (C) 1.22 0.60 0.34 0.25 0.340 0.320
4 (A,B,C) 0.57 0.50 0.39 0.40 0.495 0.510 5 (A,B) 0.57 0.45 0.39 0.40 0.495 0.510 6 (A,B) 0.57 0.45 0.39 0.40 0.495 0.510
7 0.57 0.40 0.49 0.45 0.490 0.450 8 0.46 0.40 0.49 0.45 0.490 0.450
3.4.2 Electric Lighting 3.4.2.1 Interior Lighting The LPDs used in the low-energy models are listed in Table 3–30, with the baseline values included for easy comparison. The peak values in Table 3–30 were modified with hour-by-hour multiplier schedules in EnergyPlus. Both the medium box and big box stores used the schedules in Figure 3–19. The lighting schedule is similar to that used in the baseline models (Figure 3–11), except for after-hours control. In the low-energy models, the lights are completely shut off during unoccupied periods (versus 10% on in the baseline), and during staff stocking time the lights are at 16% on (versus 50% on in the baseline).

44 This report is available at no cost from the National Renewable Energy Laboratory (NREL) at www.nrel.gov/publications.
Table 3–30 Low-Energy LPD by Space Type
Space Type Baseline LPD (W/ft²)
Low-Energy LPD (W/ft²)
Sales floor 3.35* 1.90*** Vestibule 0.50 0.45** (0.50) Corridor 0.50 0.54** (0.60) Restroom 0.90 0.86** (0.95) Stock room 0.80 0.86** (0.95) Office 1.10 0.81** (0.90) Meeting room 1.17** (1.30) 0.81** (0.90) Break room 0.81** (0.90) 0.45** (0.50) Mechanical room 1.50 0.86** (0.95)
* Includes 1.65 W/ft² of accent lighting ** 10% reduction applied in the models to account for occupancy sensors; the value without occupancy sensors is in parenthesis *** Includes 0.75 W/ft² of accent lighting
Figure 3–19 Low-energy lighting schedule
3.4.2.2 Exterior Lighting As in the baseline models, the exterior lighting in the low-energy models is meant to represent parking lot lighting. The parking lot area assumption remained the same (2.5 times the building area [101,250 ft² for the medium box stores, 248,088 ft² for the big box store]). The LPD was 0.10 W/ft² of parking lot area (from the AEDG-MBBR recommendation tables, see Table 5–1 and Table 5–2), resulting in 10,125 W for the medium box stores and 24,809 W for the big box store. In both models, the lights were controlled by an astronomical clock that turned the lights
0.0
0.1
0.2
0.3
0.4
0.5
0.6
0.7
0.8
0.9
1.0
1 2 3 4 5 6 7 8 9 10 11 12 13 14 15 16 17 18 19 20 21 22 23 24
Frac
tion
of P
eak
Hour
Weekday, Saturday Sunday

45 This report is available at no cost from the National Renewable Energy Laboratory (NREL) at www.nrel.gov/publications.
on when the sun set and off when the sun rose. The low-energy models also employed an energy-saving feature that turned the lights to quarter power from midnight to 6:00 a.m.
3.4.2.3 Daylighting Daylighting in a box retail environment is highly situation and retailer specific. Often, retailers can successfully daylight only front entry and back-of-house spaces, which make up a small fraction of the store. Although there are many ways to successfully daylight a retail space, for this analysis, a conservative approach was taken to model no daylighting. The AEDG-MBBR contains many case studies and how-to tips. Daylighting is not discouraged in any way, but for this analysis we showed that daylighting is not always required to achieve the 50% energy savings goal.
3.4.3 Plug and Process Loads The modeled low-energy model plug and process loads represented a 25% reduction over the baseline models. This reduction can be accomplished by installing ENERGY STAR® equipment, consolidating or removing equipment, etc.; more details can be found in the AEDG-MBBR. Table 3–31 shows a summary of the plug and process loads used in the low-energy models.
Table 3–31 Low-Energy Model Plug and Process Loads
Space Type Medium Box
Big Box (W/ft²) Low Plug
(W/ft²) High Plug
(W/ft²) Sales floor 0.30 0.53 0.30 Vestibule 0.00 0.00 0.00 Corridor 0.00 0.00 0.00 Restroom 0.08 0.08 0.08 Stock room 0.56 0.56 0.56 Office 0.56 0.83 0.56 Meeting room 0.56 0.83 0.56 Break room 1.95 1.95 1.95 Mechanical room 0.00 0.00 0.00
The peak values in Table 3–31 were modified with hour-by-hour multiplier schedules in EnergyPlus. The electric equipment schedules in the low-energy models had the same values during operating hours as the baseline models; however, for the low-energy models, the schedule values during nonoperating hours were lowered from 0.4 to 0.1 to simulate the improved plug load control recommendations in the AEDG-MBBR. This schedule modification was meant to represent items such as computer power management and plug strip controls, and is in addition to the plug load reductions detailed in Table 3–31. (See the AEDG-MBBR for more details on plug load reduction strategies.)

46 This report is available at no cost from the National Renewable Energy Laboratory (NREL) at www.nrel.gov/publications.
Figure 3–20 Low-energy plug and process load schedule
3.4.4 Heating, Ventilation, and Air-Conditioning Although many types of HVAC systems could be used in retail stores, the AEDG-MBBR provides recommendations for each of the following four system types:
• Packaged VAV DX air conditioner with a gas furnace (VAV) • Packaged CAV DX air conditioner with a gas furnace and a DOAS (CAV DOAS) • ASHP with electric resistance supplemental heat and a DOAS (ASHP DOAS) • WSHP with a DOAS (WSHP DOAS)
More than one HVAC system type is provided to give AEDG-MBBR users flexibility in designing high-performance retail buildings. The PC used their experience in designing retail stores to determine the HVAC system types to include in the AEDG-MBBR, and they felt these four types were widely applicable, readily available, and comparatively common. Energy modeling showed that all four system types (when coupled with the other recommendations) met or exceeded the 50% energy savings goals. The AEDG-MBBR discusses more variations among the modeled system types, but the PC members decided to model only the most common configurations.
The HVAC zoning for the low-energy models was the same as the baseline models; that is, each EnergyPlus thermal zone (the disjointed rectangles in Figure 3–3 [medium box] and Figure 3–4 [big box]) was served by the heating and cooling equipment described in detail in the following sections. For this analysis we assumed all units were 10 tons.
0.0
0.1
0.2
0.3
0.4
0.5
0.6
0.7
0.8
0.9
1.0
1 2 3 4 5 6 7 8 9 10 11 12 13 14 15 16 17 18 19 20 21 22 23 24
Frac
tion
of P
eak
Hour
Weekday, Saturday Sunday

47 This report is available at no cost from the National Renewable Energy Laboratory (NREL) at www.nrel.gov/publications.
3.4.4.1 Packaged Variable Air Volume Direct Expansion System In this low-energy model variation, each thermal zone was ventilated and conditioned via a packaged VAV system with electric reheat at the zone terminal boxes. The AEDG-MBBR specifies an energy efficiency ratio (EER) of 11.5 for a 10-ton unit. In EnergyPlus, the efficiency of DX cooling systems is specified by entering a COP. The COP input in EnergyPlus does not include the rated power consumption of the supply air fan, so the EER needs to be adjusted to remove the supply air fan energy. The procedure in Section 3.3.4.2.5 of Hale et al. (2009) was followed to determine the modeling inputs for EnergyPlus. The procedure is quickly outlined as follows; see Hale et al. (2009) for more details. The kW/ton of the unit can be determined by converting the 11.5 EER with an assumed COP of 4.0. This yields 0.1645 kW/ton, and assuming 400 cfm/ton this results in 0.551 hp/1000 cfm. Then assuming 1.5 in. w.c. for internal pressure drop and the ARI Standard 340/360 minimum external pressure drop of 0.3 in. w.c. for a 10-ton unit results in a total rated pressure drop of 1.8 in. w.c. This pressure drop is used only for the fan efficiency calculation. The ratio of 1.8 in. w.c. to 0.551 hp/1000 cfm (with proper unit conversions) results in a fan efficiency of 51.6%. The electrical efficiency of the motor was assumed to be 93% and the unit also had an 80% efficient natural gas fired furnace.
The VAV systems in the office, break room, corridor, stock room, meeting room, restroom, and mechanical room zones of Figure 3–3 (medium box) and Figure 3–4 (big box) had a pressure drop of 3.3 in. w.c. The systems in the main sales, perimeter sales, and vestibule zones of Figure 3–3 (medium box) and Figure 3–4 (big box) had a pressure drop of 2.2 in. w.c. The difference in pressure drop was to account for the more complex ductwork layout in the back-of-house areas. Each VAV system used a differential enthalpy controlled economizer. The supply air temperature of the systems was varied according to the EnergyPlus Energy Management System (EMS) code in Appendix D.1. The VAV systems also included DCV capability (in zones that had a per-person ventilation requirement), and energy recovery ventilators (ERVs) or indirect evaporative cooling (depending on climate zone).
The indirect evaporative coolers were modeled in climate zones 2B, 3B, 4B, and 5B and operated in the late spring through early fall (April 16 through September 30). In the later fall through early spring (October 1 through April 15) the coolers were used as sensible heat exchangers (with 65% heat exchanger effectiveness) for energy recovery. This scheme was modeled in EnergyPlus by alternating between an ERV and an evaporative cooler using the EMS code (see Appendix D.2). Each evaporative cooler had a wet bulb effectiveness of 58.5%, a dew point effectiveness of 90%, a blowdown ratio of 3, a wetted pressure drop of 1.18 in. w.c., and a dry pressure drop of 1.01 in. w.c.
The wetted pressure drop was calculated by summing the pressure drop of the components: 0.5 in. w.c. for the inlet path and 0.85 in. w.c. for the return path at 80% of the full flow rate (it was assumed that the restrooms exhausted 20% of the available exhaust air) (0.5 in. w.c. + 0.85 in. w.c. × 0.8 = 1.18 in. w.c.). The dry pressure drop was determined the same way, with 0.5 in. w.c. for the inlet path and 0.64 in. w.c. (at full flow) for the return path at 80% of the full flow rate (it was assumed that the restrooms exhausted 20% of the available exhaust air) (0.5 in w.c. + 0.64 in. w.c. × 0.8 = 1.01 in. w.c.).
In climate zones 1A, 2A, 3A, 4A, 5A, and 6A the ERVs were modeled as sensible and latent rotary heat exchangers with an 82.6% sensible effectiveness, 76.1% latent effectiveness, and a 1.34 in. w.c. pressure drop. The pressure drop was calculated by combining the pressure drop of

48 This report is available at no cost from the National Renewable Energy Laboratory (NREL) at www.nrel.gov/publications.
the components: 0.7 in. w.c. for the inlet path and 0.8 in. w.c. for the return path at 80% of the full flow rate (it was assumed that the restrooms exhausted 20% of the available exhaust air) (0.7 in. w.c. + 0.8 in. w.c. × 0.8 = 1.34 in. w.c.).
In climate zones 4C, 6B, 7, and 8 the ERVs were modeled as sensible rotary heat exchangers with an 82.6% sensible effectiveness and a 1.01 in. w.c. pressure drop. The pressure drop was calculated by summing the pressure drop of the components: 0.5 in. w.c. for the inlet path and 0.64 in. w.c. (at full flow) for the return path at 80% of the full flow rate (it was assumed that the restrooms exhausted 20% of the available exhaust air) (0.5 in. w.c. + 0.64 in. w.c. × 0.8 = 1.01 in. w.c.).
All ERVs were equipped with exhaust-only frost control (with a threshold temperature of 10°F in climate zones with sensible-only ERVs and –10°F in climate zones with sensible and latent ERVs), an initial defrost time fraction of 0.167 min/min, and a defrost time increase rate of 0.024 (min/min)/°C. Climate zone 3C did not contain an ERV or evaporative cooler.
In EnergyPlus, DCV was modeled by varying the per-person ventilation requirement (see Table 3–5) based on the occupancy schedule for that zone (see Figure 3–5 and Figure 3–6). For example, the per-person ventilation requirement in the sales zone is 7.5 cfm/person and the peak occupant density is 15 people per 1000 ft². The sales zone is 32,100 ft², which results in a peak occupant value of about 480. The occupancy schedule value on January 1 at noon is 0.25, which means the occupant value is about 120. At 7.5 cfm/person, the ventilation rate would be approximately 900 cfm. This ventilation rate value fluctuates in this manner as the occupancy schedule changes. DCV was modeled in all spaces with a per-person ventilation requirement in Table 3–5, and there was no threshold of occupancy driving OA rates.
3.4.4.2 DOAS The three other low-energy model variations used a DOAS to supply ventilation air to the space; space conditioning was handled through other means. Each model contained two multizone DOAS, one serving the sales area and another serving the back-of-house areas. The sales area DOAS served the vestibule, perimeter sales, and main sales areas; the back-of-house DOAS served the hallway, office, meeting room, break room, restroom, mechanical room, and stock room zones, illustrated in Figure 3–3 (medium box) and Figure 3–4 (big box).
The DOASs were modeled with an 80% efficient natural gas-fired furnace, a 4.0 COP DX cooling coil, and a VAV fan. The DOAS supplied air at 53°F year-round. The VAV fan had an efficiency of 51.6%; the fan motor had an efficiency of 93%; and the system pressure drop at full flow was 2.5 in. w.c. for the sales DOAS and 3.3 in. w.c. for the back-of-house DOAS. The difference in pressure drop was to account for the more complex ductwork layout that would exist in the back-of-house areas. The DOAS also included DCV capability (in zones that had a per-person ventilation requirement), and ERVs or indirect evaporative cooling (depending on climate zone).
The indirect evaporative coolers were modeled in climate zones 2B, 3B, 4B, and 5B and operated in the late spring through early fall (April 16 through September 30). In the later fall through early spring (October 1 through April 15) the coolers were used as sensible heat exchangers (with 65% heat exchanger effectiveness) for energy recovery. This scheme was modeled in EnergyPlus by alternating between an ERV and an evaporative cooler using EMS code (see Appendix D.2). Each evaporative cooler had a wet bulb effectiveness of 58.5%, a dew

49 This report is available at no cost from the National Renewable Energy Laboratory (NREL) at www.nrel.gov/publications.
point effectiveness of 90%, a blowdown ratio of 3, a wetted pressure drop of 1.18 in. w.c., and a dry pressure drop of 1.01 in. w.c.
The wetted pressure drop was calculated by summing the pressure drop of the components: 0.5 in. w.c. for the inlet path and 0.85 in. w.c. for the return path at 80% of the full flow rate (we assumed that the restrooms exhausted 20% of the available exhaust air) (0.5 in. w.c. + 0.85 in. w.c. × 0.8 = 1.18 in. w.c.). The dry pressure drop was determined the same way, with 0.5 in. w.c. for the inlet path and 0.64 in. w.c. (at full flow) for the return path at 80% of the full flow rate. We assumed that the restrooms exhausted 20% of the available exhaust air (0.5 in. w.c. + 0.64 in. w.c. × 0.8 = 1.01 in. w.c.).
In climate zones 1A, 2A, 3A, 4A, 5A, and 6A the ERVs were modeled as sensible and latent rotary heat exchangers with an 82.6% sensible effectiveness, 76.1% latent effectiveness, and a 1.34 in. w.c. pressure drop. The pressure drop was calculated by summing the pressure drop of the components: 0.7 in. w.c. for the inlet path and 0.8 in. w.c. for the return path at 80% of the full flow rate. We assumed that the restrooms exhausted 20% of the available exhaust air (0.7 in. w.c. + 0.8 in. w.c. × 0.8 = 1.34 in. w.c.).
In climate zones 3C, 4C, 6B, 7, and 8 the ERVs were modeled as sensible rotary heat exchangers with an 82.6% sensible effectiveness and a 1.01 in. w.c. pressure drop. The pressure drop was calculated by summing the pressure drop of the components: 0.5 in. w.c. for the inlet path and 0.64 in. w.c. (at full flow) for the return path at 80% of the full flow rate. We assumed that the restrooms exhausted 20% of the available exhaust air (0.5 in. w.c. + 0.64 in. w.c. × 0.8 = 1.01 in. w.c.).
All ERVs were equipped with exhaust-only frost control (with a threshold temperature of 10°F in climate zones with sensible-only ERVs and –10°F in climate zones with sensible and latent ERVs), an initial defrost time fraction of 0.167 min/min, and a defrost time increase rate of 0.024 (min/min)/°C. The ventilation air from the DOAS was delivered to the zone via a VAV terminal unit that was capable of varying the ventilation rate.
DCV in the DOAS was modeled exactly as in the packaged VAV DX system. (See Section 3.4.4.1 for more details on how DCV was modeled in the DOAS.)
3.4.4.3 Packaged Constant Air Volume Direct Exchange With a Dedicated Outdoor Air System
In this low-energy model variation, ventilation was handled by the DOAS described in Section 3.4.4.2 and each thermal zone contained unitary heating and cooling equipment to handle space conditioning. These systems were modeled by placing an autosized system with a 51.6% efficient constant volume fan, a 2.2 in. w.c. pressure drop, a 4.0 COP DX cooling coil, and an 80% efficient gas-fired furnace in each thermal zone. The same procedure as in Section 3.4.4.1 was followed to convert the 11.5 EER specified by the AEDG-MBBR into the proper EnergyPlus inputs. These systems cycled with the load in each zone. We assumed that that the larger zones would be served by multiple such units, even though EnergyPlus assigned only one HVAC system; that system was meant to represent multiple, identical smaller packaged units that operated in tandem to condition the space. This is acceptable because normalized performance curves for the smaller unit were used.

50 This report is available at no cost from the National Renewable Energy Laboratory (NREL) at www.nrel.gov/publications.
3.4.4.4 Air Source Heat Pump With a Dedicated Outdoor Air System In this low-energy model variation, ventilation was handled by the DOAS described in Section 3.4.4.2 and each thermal zone contained an ASHP to handle space conditioning. These systems were modeled by placing an autosized ASHP with a 51.6% efficient constant volume fan, a 2.2 in. w.c. pressure drop, 11.5 EER (3.4 cooling COP)/3.4 heating COP (at 47°F) DX coils, and an electric supplemental heating coil. These systems cycled with the load in each zone. We assumed that that the larger zones would be served by multiple such units, even though EnergyPlus assigned only one HVAC system; that system was meant to represent multiple, identical smaller packaged units that operated in tandem to condition the space. This is acceptable because normalized performance curves for the smaller unit were used. This system was compared to the all-electric baseline (Section 3.3.7) when results were generated (Section 5.2.3).
3.4.4.5 Water-Source Heat Pump With a Dedicated Outdoor Air System In this low-energy model variation, ventilation was handled by the DOAS described in Section 3.4.4.2 and each thermal zone contained a WSHP to handle space conditioning. These systems were modeled by placing an autosized WSHP with a 51.6% efficient constant volume fan, a 2.2 in. w.c. pressure drop, 5.0 cooling COP/15.0 EER heating COP DX coils (efficiency values from the AEDG-MBBR), and an electric supplemental heating coil. These systems cycled with the load in each zone. We assumed that the larger zones would be served by multiple such units, even though EnergyPlus assigned only one HVAC system; that system was meant to represent multiple, identical smaller packaged units that operated in tandem to condition the space. This is acceptable because normalized performance curves for the smaller unit were used.
The heat pumps drew or rejected energy from or to a single plant water loop that was served by an 80% efficient variable-speed pump with 60 ft of head. The plant water loop included a boiler to maintain loop temperature above 68°F and an evaporative fluid cooler to maintain loop temperature below 86°F. The fluid cooler was modeled as a single-speed unit that cycled the van to control capacity. It had a 0.2 evaporation loss factor, a 0.008% drift loss, and a 3.0 blowdown concentration ratio. The boiler on the loop was a 90% efficient natural gas-fired condensing boiler.
3.4.5 Service Water Heating The SWH in both the medium box and big box low-energy models was modeled exactly as in the baseline, except that the water heaters were modeled as 90% efficient instead of 86.4% efficient. The hot water consumption rates were determined using ASHRAE (2003), specifically Chapter 49, Table 8. That table does not have an entry for retail, so we assumed that the retail hot water use was similar to that in an office building. The peak hot water consumption rate for all baseline models was 18 gal/h, based on 40 gal/h for sinks and 20 gal/h for public lavatories, multiplied by a demand factor of 0.3. The water heater storage tank had a volume of 50 gal based on a storage capacity factor of 2.0 and 71.4% usable volume percentage. The consumption schedule as a fraction of peak load was the same as the occupancy schedule (see Figure 3–5 and Figure 3–6). The delivered hot water outlet temperature at the fixture was assumed to be 104ºF and the water heater set point was 140ºF.

51 This report is available at no cost from the National Renewable Energy Laboratory (NREL) at www.nrel.gov/publications.
4. Energy Targets Careful goal setting is required to design and construct high-performance buildings. The goal of the AEDG-MBBR was to provide guidance to procure a building that consumed at least 50% less energy than a computer-modeled Standard 90.1-2004 (ASHRAE 2004b) compliant baseline. To better define this goal, an absolute whole-building energy target—a single number that defines the energy performance of a building—should be set as a best practice. The lower the number is, the more energy efficient the building is. The AEDG-MBBR provides these targets to help users set goals for their design. These targets can be used to select design teams as part of a procurement strategy, to set early design goals, to track design development progress, and to help designers and owners ensure that the desired level of performance for a project is achieved. In general, the energy targets in the AEDG-MBBR are applicable to most retail stores.
The AEDG-MBBR energy targets were designed to simplify the process of setting whole-building absolute energy use targets. The prescriptive path represents one way, but not the only way, to achieve industry best practice energy performance. Specification of whole-building absolute energy use targets gives freedom to reach the performance goal with an approach that best fits the overall goals and constraints (including those not related to energy performance) of the project. Specification of the AEDG-MBBR whole-building absolute energy targets can eliminate most analysis that may otherwise be required to specify energy performance goals, because the guide values embody the knowledge required to set practical, aggressive energy performance targets in the medium and big-box retail environment.
One can specify an absolute energy target based on the AEDG-MBBR energy target and then focus analysis efforts toward achieving industry best practice energy performance rather than trying to define a reference point against which to measure performance. For a more detailed discussion see Leach et al. (2012).
The whole-building absolute energy targets for the AEDG-MBBR were developed in accordance with the following approach:
1. Start with the models from Hale et al. (2009); these models were minimally compliant with Standard 90.1-2004 (ASHRAE 2004b). The models vary according to building size and plug load density.
2. Update the models according to the AEDG-MBBR PC’s expert guidance. Give special care to aspects of the model that are not prescribed by Standard 90.1-2004, including schedules and unregulated plug and process loads. The goal was to develop Standard 90.1-2004 compliant models that accurately captured typical (common practice) whole-building energy use for retail stores. The final models used for the analyses are defined in Section 3.3 of this report.
3. Simulate the industry-vetted baseline models across a set of climate zones that fully represent the variations in the U.S. climate zones (Figure 3–2). Benchmark modeling results against available sector data and solicit input from the PC. Make any necessary corrections to the model inputs and resimulate. Iterations continue until results are in line with sector data and industry expectations for baseline energy performance by climate zone.
4. Set climate-specific absolute targets representing 50% savings beyond Standard 90.1-2004 by halving baseline whole-building energy performance results. Confirm through

52 This report is available at no cost from the National Renewable Energy Laboratory (NREL) at www.nrel.gov/publications.
whole-building energy simulation and a case study survey (including committee member projects) that the 50% savings targets are feasible and representative of industry best practice energy performance.
The outcomes of this process can be seen in Table 4–1 and Table 4–2. The values in these tables represent 50% savings over the baseline models, which were compliant with Standard 90.1-2004 (ASHRAE 2004b). The PC confirmed that these results were in line with their expectations for 50% savings.
Table 4–1 Medium Box Retail Energy Targets
Climate Zone
Low Plug High Plug
Low Accent (kBtu/ft²yr)
Med Accent (kBtu/ft²yr)
High Accent (kBtu/ft²yr)
Low Accent (kBtu/ft²yr)
Med Accent (kBtu/ft²yr)
High Accent (kBtu/ft²yr)
1A 42 58 81 45 61 85 2A 41 56 77 44 59 80 2B 37 53 75 40 56 79 3A 38 51 70 40 53 73
3B:CA 31 46 67 34 49 69 3B 36 50 72 38 53 75 3C 29 43 61 32 45 64 4A 39 51 68 41 53 70 4B 36 50 70 39 53 72 4C 33 44 61 35 47 63 5A 40 50 65 42 52 67 5B 36 49 67 39 51 69 6A 43 53 66 45 54 68 6B 39 50 65 41 52 67 7 44 52 63 46 54 65 8 56 61 69 57 62 71

53 This report is available at no cost from the National Renewable Energy Laboratory (NREL) at www.nrel.gov/publications.
Table 4–2 Big Box Retail Energy Targets
Climate Zone
Low Plug High Plug
Low Accent (kBtu/ft²yr)
Med Accent (kBtu/ft²yr)
High Accent (kBtu/ft²yr)
Low Accent (kBtu/ft²yr)
Med Accent (kBtu/ft²yr)
High Accent (kBtu/ft²yr)
1A 42 58 82 45 62 85 2A 41 56 77 44 58 80 2B 38 54 77 41 57 80 3A 35 49 69 38 52 72
3B:CA 30 45 66 33 48 69 3B 34 49 71 37 52 74 3C 28 41 61 30 44 63 4A 37 49 66 39 51 68 4B 34 48 68 37 51 71 4C 31 43 60 33 45 62 5A 38 49 64 40 51 66 5B 35 47 66 37 50 68 6A 41 51 64 43 52 66 6B 37 48 63 39 50 65 7 42 50 62 44 52 63 8 53 58 67 54 60 68
Programmatic requirements can vary greatly from one application to another. A high-end retailer may use high-wattage accent lighting to display merchandise with a particular style; a discount retailer may use little or no accent lighting. Similarly, an electronics retailer may have significantly higher installed plug loads than a clothing retailer. Because plug loads and accent lighting can vary significantly according to project-specific requirements, the AEDG-MBBR energy targets were determined for a range of plug load and accent lighting levels. Energy targets are provided for two levels of baseline plug load requirements: Low and High, representing whole-building average installed plug load densities of 0.5 W/ft² and 0.7 W/ft², respectively. A general merchandise store would be a typical low-plug load case, whereas a dedicated electronics store would be a typical high-plug load case. Within each category of installed plug loads, energy targets are provided for three levels of baseline accent lighting requirements: (1) little or no accent lighting (Low), with a value of 0.0 W/ft²; (2) a typical level of accent lighting (Med), 1.6 W/ft² for sales areas; and (3) a high level of accent lighting (High), representative of retail applications with specialty accent lighting requirements, such as jewelry sales, with a value of 3.9 W/ft² for sales areas, the maximum allowed for a sales area by Standard 90.1-2004.

54 This report is available at no cost from the National Renewable Energy Laboratory (NREL) at www.nrel.gov/publications.
5. Evaluation Results This section contains the PC-approved energy efficiency recommendations for the AEDG-MBBR. The simulated energy savings that are achieved as a result of applying these recommendations are also presented. End-use comparison figures are provided; the end-use data are also presented in tabular format.
The guide recommendations represent a way to achieve 50% energy savings over Standard 90.1-2004 in a typical retail building. The PC recognizes that there are other ways of achieving the 50% energy savings, and offers these recommendations as one way, but not the only way, of meeting the energy savings target. When a recommendation contains the designation “Comply with 90.1,” the AEDG-MBBR provides no recommendation for this component or system. In these cases, the user must meet the more stringent of either the applicable version of Standard 90.1 or the local code requirements.
5.1 Recommendation Tables for 50% Energy Savings This section provides the recommendation tables in the AEDG-MBBR. The opaque envelope recommendations are presented for different climate zones by roof type, wall type, floor type, slab type, and door type. Recommendations for the thermal and optical characteristics of the vertical fenestration are provided. Interior lighting recommendations, including LPD, lamp efficacy, ballast specification, and controls; as well as exterior LPDs and controls, are presented. Plug and process load recommendations are provided. SWH efficiency recommendations are provided for electric and gas storage water heaters, as well as instantaneous units. Many types of HVAC systems could be used in retail stores, but the AEDG-MBBR provides recommendations for each of the following four system types:
• Packaged VAV DX air conditioner with a gas furnace (VAV) • Packaged CAV DX air conditioner with a gas furnace and a DOAS (CAV DOAS) • ASHP with electric resistance supplemental heat and a DOAS (ASHP DOAS) • WSHP with a DOAS (WSHP DOAS)
Unique recommendations for cooling, heating, and fan efficiencies are included for each HVAC system type in the climate-specific recommendations. Either DCV or ERVs are also recommended, along with economizers (where applicable) for each HVAC system type.
The recommendation tables for the AEDG-MBBR (ASHRAE et al. 2011b) are shown in Table 5–1 and Table 5–2.

55
Table 5–1 AEDG-MBBR Recommendations: Climate Zones 1–4
Item Component Climate Zone 1 Recommendation
Climate Zone 2 Recommendation
Climate Zone 3 Recommendation
Climate Zone 4 Recommendation
Enve
lope
Roofs
Insulation entirely above deck R-20.0 c.i. R-25.0 c.i.
Metal building R-19.0 + R-10.0 filled cavity R-19.0 + R-11.0 Linear System (Ls)
Solar reflectance index 78 No recommendation
Walls
Mass (heat capacity > 7 Btu/ft²)
No recommendation R-5.7 c.i. R-7.6 c.i. R-9.5 c.i.
Metal building R-0.0 + R-9.8 c.i. R-0.0 + R-13.0 c.i. R-0.0 + R-15.8 c.i. Steel framed R-13.0 + R-7.5 c.i. R-13.0 + R-10.0 c.i.
Floors Mass No
recommendation R-10.4 c.i. R-12.5 c.i. R-14.6 c.i.
Steel framed No recommendation R-30.0 R-38.0
Slabs Unheated No recommendation R-15 for 24 in. Heated R-7.5 for 12 in. R-10.0 for 24 in. R-15.0 for 24 in R-20 for 24 in.
Doors
Swinging U-0.70 U-0.50 Nonswinging Roll-up = U-0.25; All other = U-0.07 Vehicular/dock infiltration–door closed 0.28 cfm/ft² of door area
Vehicular/dock infiltration–door open, truck in place
Weather seals for dock, levelers, trailer hinges
Vestibules At building entrance Yes
View fenestration—all orientations
Thermal transmittance U-1.20 U-0.70 U-0.60 U-0.50 SHGC 0.25 0.40 VLT 0.25 0.32 0.51
Day
light
ing/
Li
ghtin
g
Interior lighting
LPD–ambient lighting Sales floor = 1.15 W/ft² Stock room = 0.6 W/ft² Average of all other = 0.9 W/ft²
LPD–additional specialty sales floor lighting
Sporting goods, small electronics = 0.6 W/ft² Furniture, clothing, cosmetics, art = 0.95 W/ft² Jewelry, crystal, china = 1.5 W/ft²
This report is available at no cost from the National Renewable Energy Laboratory (NREL) at www.nrel.gov/publications.
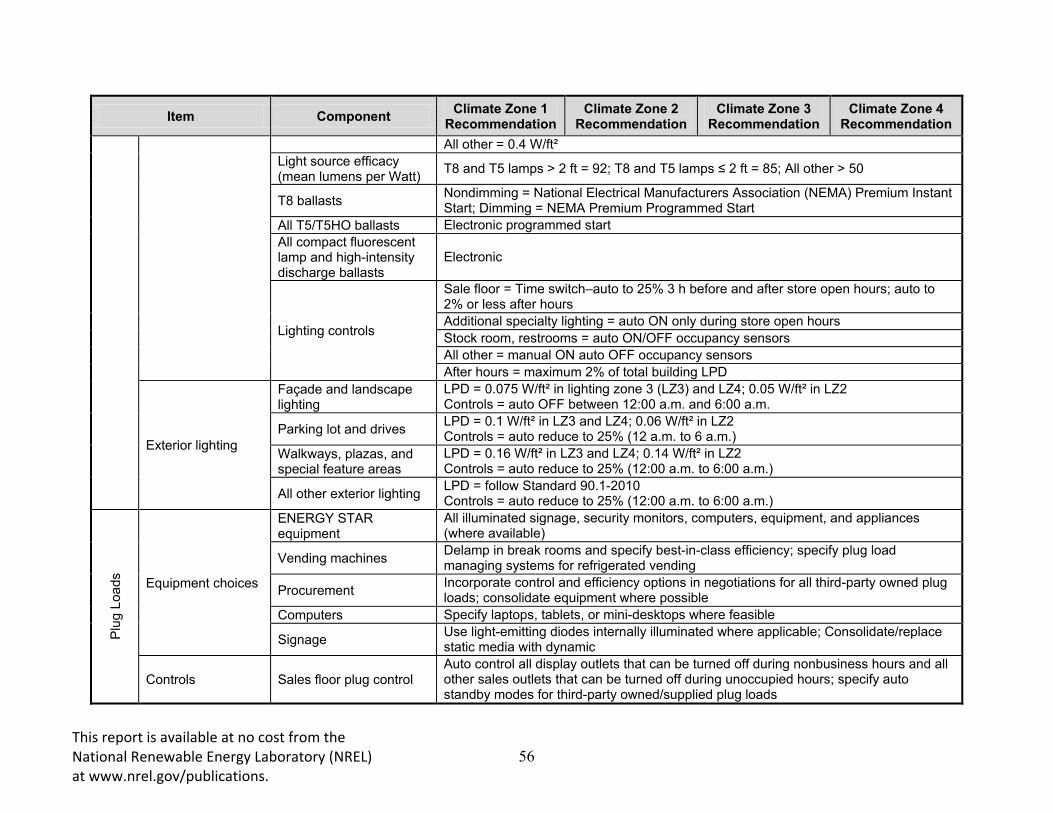
56
Item Component Climate Zone 1 Recommendation
Climate Zone 2 Recommendation
Climate Zone 3 Recommendation
Climate Zone 4 Recommendation
All other = 0.4 W/ft² Light source efficacy (mean lumens per Watt) T8 and T5 lamps > 2 ft = 92; T8 and T5 lamps ≤ 2 ft = 85; All other > 50
T8 ballasts Nondimming = National Electrical Manufacturers Association (NEMA) Premium Instant Start; Dimming = NEMA Premium Programmed Start
All T5/T5HO ballasts Electronic programmed start All compact fluorescent lamp and high-intensity discharge ballasts
Electronic
Lighting controls
Sale floor = Time switch–auto to 25% 3 h before and after store open hours; auto to 2% or less after hours Additional specialty lighting = auto ON only during store open hours Stock room, restrooms = auto ON/OFF occupancy sensors All other = manual ON auto OFF occupancy sensors After hours = maximum 2% of total building LPD
Exterior lighting
Façade and landscape lighting
LPD = 0.075 W/ft² in lighting zone 3 (LZ3) and LZ4; 0.05 W/ft² in LZ2 Controls = auto OFF between 12:00 a.m. and 6:00 a.m.
Parking lot and drives LPD = 0.1 W/ft² in LZ3 and LZ4; 0.06 W/ft² in LZ2 Controls = auto reduce to 25% (12 a.m. to 6 a.m.)
Walkways, plazas, and special feature areas
LPD = 0.16 W/ft² in LZ3 and LZ4; 0.14 W/ft² in LZ2 Controls = auto reduce to 25% (12:00 a.m. to 6:00 a.m.)
All other exterior lighting LPD = follow Standard 90.1-2010 Controls = auto reduce to 25% (12:00 a.m. to 6:00 a.m.)
Plug
Loa
ds
Equipment choices
ENERGY STAR equipment
All illuminated signage, security monitors, computers, equipment, and appliances (where available)
Vending machines Delamp in break rooms and specify best-in-class efficiency; specify plug load managing systems for refrigerated vending
Procurement Incorporate control and efficiency options in negotiations for all third-party owned plug loads; consolidate equipment where possible
Computers Specify laptops, tablets, or mini-desktops where feasible
Signage Use light-emitting diodes internally illuminated where applicable; Consolidate/replace static media with dynamic
Controls Sales floor plug control Auto control all display outlets that can be turned off during nonbusiness hours and all other sales outlets that can be turned off during unoccupied hours; specify auto standby modes for third-party owned/supplied plug loads
This report is available at no cost from the National Renewable Energy Laboratory (NREL) at www.nrel.gov/publications.

57
Item Component Climate Zone 1 Recommendation
Climate Zone 2 Recommendation
Climate Zone 3 Recommendation
Climate Zone 4 Recommendation
Computer power control Network control with power-saving modes and control during unoccupied hours
Occupancy sensors Office/break/security room plug strip occupancy sensors; other equipment as applicable
Timer switches Water coolers, coffee makers, other small appliances auto shut-off during unoccupied hours
Policies Store policy on allowed equipment
SWH
SWH
Gas water heater efficiency Condensing water heaters = 95% efficiency
Electric storage energy factor (EF) (≤12 kW, ≤20 gal)
EF > 0.99 – 0.0012 × volume (gal)
Point-of-use heater selection 0.81 EF or 81% Et
Electric heat pump water heater COP 3.0 (interior heat source)
Pipe insulation (d < 1.5 in./d ≥ 1.5 in.) 1 in./1.5 in.
HVA
C
Packaged variable-volume DX air conditioner
Heating efficiency 80%
Cooling efficiency
< 65 kBtu/h = 15.0 seasonal energy efficiency ratio (SEER) 65–135 kBtu/h = 11.5 EER, 12.8 integrated energy efficiency ratio (IEER) 135–240 kBtu/h = 11.5 EER, 12.3 IEER 240–760 kBtu/h = 10.5 EER, 11.3 IEER ≥ 760 kBtu/h = 9.7 EER, 10.9 IEER
Maximum external static pressure
Single zone = 0.7 in. w.c. Multizone = 1.8 in. w.c.
Packaged constant-volume DX air conditioner with DOAS
Heating efficiency 80%
Cooling efficiency
< 65 kBtu/h = 15.0 SEER 65–135 kBtu/h = 11.5 EER, 12.8 IEER 135–240 kBtu/h = 11.5 EER, 12.3 IEER 240–760 kBtu/h = 10.5 EER, 11.3 IEER; ≥ 760 kBtu/h = 9.7 EER, 10.9 IEER
Maximum external static pressure 0.7 in. w.c.
Packaged single-zone ASHP with DOAS
Heating efficiency < 65 kBtu/h = 9.0 heating seasonal performance factor 65–135 kBtu/h = 3.4 COP at 47°F; 2.4 COP at 17°F 135–240 kBtu/h = 3.2 COP at 47°F; 2.1 COP at 17°F
This report is available at no cost from the National Renewable Energy Laboratory (NREL) at www.nrel.gov/publications.

58
Item Component Climate Zone 1 Recommendation
Climate Zone 2 Recommendation
Climate Zone 3 Recommendation
Climate Zone 4 Recommendation
≥ 240 kBtu/h = 3.2 COP at 47°F; 2.1 COP at 17°F
Cooling efficiency
< 65 kBtu/h = 15.0 SEER, 12.0 EER 65–135 kBtu/h = 11.5 EER, 12.8 IEER 135–240 kBtu/h = 11.5 EER, 12.3 IEER ≥ 240 kBtu/h = 10.5 EER, 11.3 IEER
Maximum external static pressure 0.7 in. w.c.
Maximum fan power 0.4 W/cfm
Packaged single-zone WSHP with DOAS
Heating efficiency Full load =15.0 EER; part load= 17.6 EER Cooling efficiency Full load = 5.0 COP; part load = 5.7 COP Maximum external static pressure 0.7 in. w.c.
Maximum fan power 0.4 W/cfm Water circulation pumps Variable frequency drive (VFD) and NEMA premium efficiency Cooling tower/fluid cooler VFD on fans Boiler efficiency 90% combustion efficiency
DOAS
Heating efficiency See Table 5-10 in AEDG-MBBR Cooling efficiency See Table 5-10 in AEDG-MBBR Fan external static pressure
Constant volume = 1.0 in. w.c. Variable volume (DCV) = 1.8 in. w.c.
Fan and motor 65% mechanical/motor efficiency in absence of whole unit EER rating; motor efficiency as per Standard 90.1-2010 Table 10.8B
Ventilation/exhaust
Cooling capacity for which an economizer is required
No economizer ≥ 54,000 Btu/h
DCV/performance-based ventilation
Control ventilation air based on pollutant concentrations in space (carbon dioxide, VOCs, etc.)
Exhaust air energy recovery
A (humid) zones = 75% total effectiveness; B (dry) zones = 75% sensible effectiveness; Capture minimum 80% available exhaust air, including general and bathroom, for energy recovery
Exhaust airflow control Control based on occupancy using time clock or occupancy sensor
Ducts and dampers OA air damper Motorized damper Duct seal class Seal class A Insulation level R-6
Q A M&V/Benchmarking Electrical submeters Design and circuit for separate submeters for lighting, HVAC, general 120V, SWH,
This report is available at no cost from the National Renewable Energy Laboratory (NREL) at www.nrel.gov/publications.

59
Item Component Climate Zone 1 Recommendation
Climate Zone 2 Recommendation
Climate Zone 3 Recommendation
Climate Zone 4 Recommendation
renewables, and whole building Benchmarks Benchmark monthly energy use Training Facility operator or continuous benchmarking
This report is available at no cost from the National Renewable Energy Laboratory (NREL) at www.nrel.gov/publications.

60
Table 5–2 AEDG-MBBR Recommendations: Climate Zones 5–8
Item Component Climate Zone 5 Recommendation
Climate Zone 6 Recommendation
Climate Zone 7 Recommendation
Climate Zone 8 Recommendation
Enve
lope
Roofs
Insulation entirely above deck R-30.0 c.i. R-35.0 c.i.
Metal building R-19.0 + R-11.0 Ls R-25.0 + R-11.0 Ls R-30.0 + R-11.0 Ls R-25.0 + R-11.0 + R-11.0 Ls
Solar reflectance index No recommendation
Walls
Mass (heat capacity > 7 Btu/ft²) R-11.4 c.i. R-15.4 c.i. R-17.0 c.i. R-19.0 c.i.
Metal building R-0.0 + R-19.0 c.i. R-0.0 + R-22.1 c.i. R-0.0 + R-25.0 c.i. Steel framed R-13.0 + R-12.5 c.i. R-13.0 + R-15.0 c.i. R-13.0 + R-18.8 c.i.
Floors Mass R-14.6 c.i. R-16.7 c.i. R-20.9 c.i. R-23.0 c.i. Steel framed R-38.0 R-49.0 R-60.0
Slabs Unheated R-15 for 24 in. R-20 for 24 in. Heated R-20 for 24 in. R-20 for 48 in. R-25 for 48 in.
Doors
Swinging U-0.50 U-0.50 Nonswinging Roll-up = U-0.25; All other = U-0.07 Vehicular/dock infiltration–door closed 0.28 cfm/ft² of door area
Vehicular/dock infiltration–door open, truck in place
Weather seals for dock, levelers, trailer hinges
Vestibules At building entrance Yes
View fenestration—all orientations
Thermal transmittance U-0.45 U-0.40 SHGC 0.40 0.45 VLT 0.51 0.45
Day
light
ing/
Ligh
ting
Interior lighting
LPD–ambient lighting Sales floor = 1.15 W/ft² Stock room = 0.6 W/ft² Average of all other = 0.9 W/ft²
LPD–additional specialty sales floor lighting
Sporting goods, small electronics = 0.6 W/ft² Furniture, clothing, cosmetics, art = 0.95 W/ft² Jewelry, crystal, china = 1.5 W/ft² All other = 0.4 W/ft²
Light source efficacy (mean lumens per Watt) T8 and T5 lamps > 2 ft = 92; T8 and T5 lamps ≤ 2 ft = 85; All other > 50
This report is available at no cost from the National Renewable Energy Laboratory (NREL) at www.nrel.gov/publications.

61
Item Component Climate Zone 5 Recommendation
Climate Zone 6 Recommendation
Climate Zone 7 Recommendation
Climate Zone 8 Recommendation
T8 ballasts Nondimming = NEMA Premium Instant Start; Dimming = NEMA Premium Programmed Start
All T5/T5HO ballasts Electronic programmed start All compact fluorescent lamp and high-intensity discharge ballasts
Electronic
Lighting controls
Sale floor = Time switch–auto to 25% 3 h before and after store open hours; auto to 2% or less after hours Additional specialty lighting = auto ON only during store open hours Stock room, restrooms = auto ON/OFF occupancy sensors All other = manual ON auto OFF occupancy sensors After hours = max 2% of total building LPD
Exterior lighting
Façade and landscape lighting
LPD = 0.075 W/ft² in LZ3 and LZ4; 0.05 W/ft² in LZ2 Controls = auto OFF between 12 a.m. and 6 a.m.
Parking lot and drives LPD = 0.1 W/ft² in LZ3 and LZ4; 0.06 W/ft² in LZ2 Controls = auto reduce to 25% (12:00 a.m. to 6:00 a.m.)
Walkways, plazas, and special feature areas
LPD = 0.16 W/ft² in LZ3 and LZ4; 0.14 W/ft² in LZ2 Controls = auto reduce to 25% (12:00 a.m. to 6:00 a.m.)
All other exterior lighting LPD = follow Standard 90.1-2010 Controls = auto reduce to 25% (12:00 a.m. to 6:00 a.m.)
Plug
Loa
ds
Equipment choices
ENERGY STAR equipment
All illuminated signage, security monitors, computers, equipment, and appliances (where available)
Vending machines Delamp in break rooms and specify best-in-class efficiency; specify plug load managing systems for refrigerated vending
Procurement Incorporate control and efficiency options in negotiations for all third-party owned plug loads; consolidate equipment where possible
Computers Specify laptops, tablets, or mini-desktops where feasible
Signage Use light-emitting diodes internally illuminated where applicable; Consolidate/replace static media with dynamic
Controls
Sales floor plug control Auto control all display outlets that can be turned off during nonbusiness hours and all other sales outlets that can be turned off during unoccupied hours; specify auto standby modes for third-party owned/supplied plug loads
Computer power control Network control with power-saving modes and control during unoccupied hours Occupancy sensors Office/break/security room plug strip occupancy sensors; other equipment as applicable Timer switches Water coolers, coffee makers, other small appliances auto shut-off during unoccupied
This report is available at no cost from the National Renewable Energy Laboratory (NREL) at www.nrel.gov/publications.
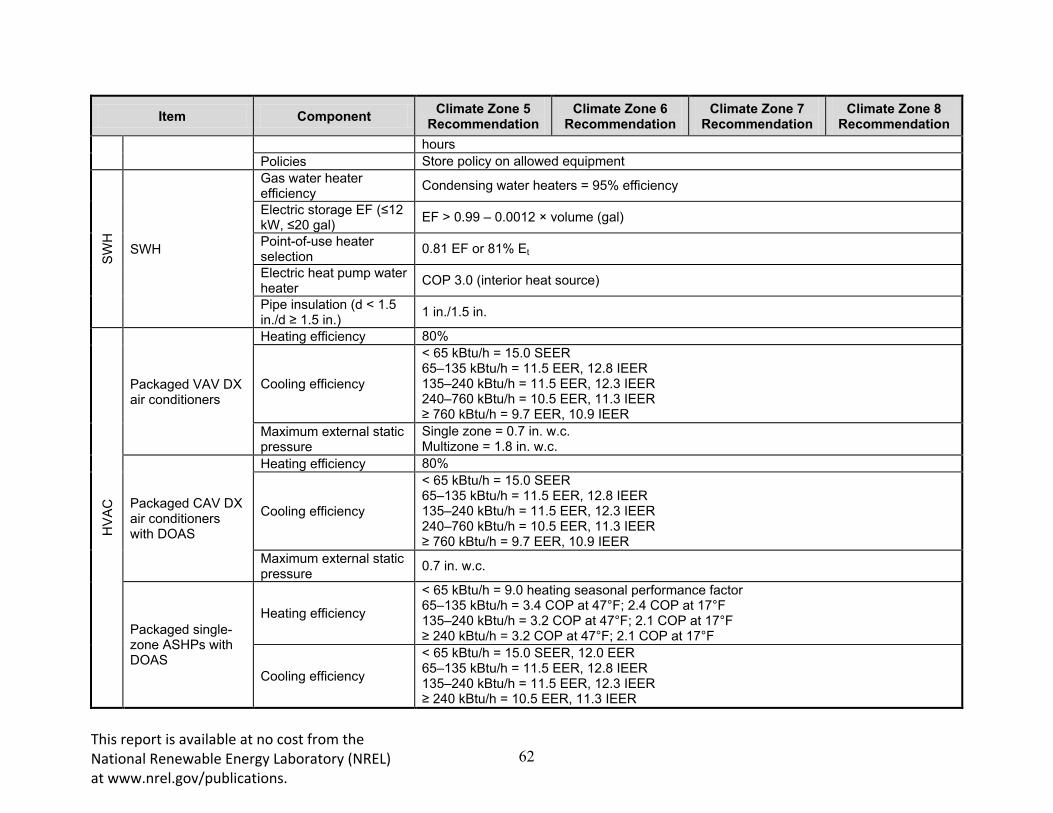
62
Item Component Climate Zone 5 Recommendation
Climate Zone 6 Recommendation
Climate Zone 7 Recommendation
Climate Zone 8 Recommendation
hours Policies Store policy on allowed equipment
SWH
SWH
Gas water heater efficiency Condensing water heaters = 95% efficiency
Electric storage EF (≤12 kW, ≤20 gal) EF > 0.99 – 0.0012 × volume (gal)
Point-of-use heater selection 0.81 EF or 81% Et
Electric heat pump water heater COP 3.0 (interior heat source)
Pipe insulation (d < 1.5 in./d ≥ 1.5 in.) 1 in./1.5 in.
HVA
C
Packaged VAV DX air conditioners
Heating efficiency 80%
Cooling efficiency
< 65 kBtu/h = 15.0 SEER 65–135 kBtu/h = 11.5 EER, 12.8 IEER 135–240 kBtu/h = 11.5 EER, 12.3 IEER 240–760 kBtu/h = 10.5 EER, 11.3 IEER ≥ 760 kBtu/h = 9.7 EER, 10.9 IEER
Maximum external static pressure
Single zone = 0.7 in. w.c. Multizone = 1.8 in. w.c.
Packaged CAV DX air conditioners with DOAS
Heating efficiency 80%
Cooling efficiency
< 65 kBtu/h = 15.0 SEER 65–135 kBtu/h = 11.5 EER, 12.8 IEER 135–240 kBtu/h = 11.5 EER, 12.3 IEER 240–760 kBtu/h = 10.5 EER, 11.3 IEER ≥ 760 kBtu/h = 9.7 EER, 10.9 IEER
Maximum external static pressure 0.7 in. w.c.
Packaged single-zone ASHPs with DOAS
Heating efficiency
< 65 kBtu/h = 9.0 heating seasonal performance factor 65–135 kBtu/h = 3.4 COP at 47°F; 2.4 COP at 17°F 135–240 kBtu/h = 3.2 COP at 47°F; 2.1 COP at 17°F ≥ 240 kBtu/h = 3.2 COP at 47°F; 2.1 COP at 17°F
Cooling efficiency
< 65 kBtu/h = 15.0 SEER, 12.0 EER 65–135 kBtu/h = 11.5 EER, 12.8 IEER 135–240 kBtu/h = 11.5 EER, 12.3 IEER ≥ 240 kBtu/h = 10.5 EER, 11.3 IEER
This report is available at no cost from the National Renewable Energy Laboratory (NREL) at www.nrel.gov/publications.

63
Item Component Climate Zone 5 Recommendation
Climate Zone 6 Recommendation
Climate Zone 7 Recommendation
Climate Zone 8 Recommendation
Maximum external static pressure 0.7 in. w.c.
Maximum fan power 0.4 W/cfm
Packaged single-zone WSHPs with DOAS
Heating efficiency Full load =15.0 EER; part load= 17.6 EER Cooling efficiency Full load = 5.0 COP; part load = 5.7 COP Maximum external static pressure 0.7 in. w.c.
Maximum fan power 0.4 W/cfm Water circulation pumps VFD and NEMA premium efficiency Cooling tower/fluid cooler VFD on fans
Boiler efficiency 90% combustion efficiency
DOAS
Heating efficiency See Table 5-10 in AEDG-MBBR Cooling efficiency See Table 5-10 in AEDG-MBBR Fan external static pressure
Constant volume = 1.0 in. w.c. Variable volume (DCV) = 1.8 in. w.c.
Fan and motor 65% mechanical/motor efficiency in absence of whole unit EER rating; motor efficiency as per Standard 90.1-2010 Table 10.8B
Ventilation/exhaust
Cooling capacity for which an economizer is required
≥54,000 Btu/h
DCV/performance-based ventilation
Control ventilation air based on pollutant concentrations in space (carbon dioxide, VOCs, etc.)
Exhaust air energy recovery
A (humid) zones= 75% total effectiveness; B (dry) zones = 75% sensible effectiveness; Capture min. 80% available exhaust air, including general and bathroom, for energy recovery
Exhaust airflow control Control based on occupancy using time clock or occupancy sensor
Ducts and dampers OA damper Motorized damper Duct seal class Seal class A Insulation level R-6
QA M&V/benchmarking
Electrical submeters Design and circuit for separate submeters for lighting, HVAC, general 120V, service water heater, renewables, and whole building
Benchmarks Benchmark monthly energy use Training Facility operator or continuous benchmarking
This report is available at no cost from the National Renewable Energy Laboratory (NREL) at www.nrel.gov/publications.

64 This report is available at no cost from the National Renewable Energy Laboratory (NREL) at www.nrel.gov/publications.
5.2 Energy Savings Results When the AEDG-MBBR recommendations were compiled and the final low-energy models simulated, the 50% or greater energy savings goal was met or exceeded in all climate zones for all HVAC system types. Table 5–3 and Table 5–4 illustrate the energy savings results.
Table 5–3 Medium Box Percent Energy Savings Over Standard 90.1-2004
Climate Zone
Representative City
Low Plug High Plug
VAV CAV DOAS
ASHP DOAS
WSHP DOAS VAV CAV
DOAS ASHP DOAS
WSHP DOAS
1A Miami, FL 58.2% 59.7% 59.3% 58.2% 57.0% 58.5% 58.1% 56.9% 2A Houston, TX 58.7% 59.5% 59.7% 58.9% 57.8% 58.5% 58.5% 57.7% 2B Phoenix, AZ 56.8% 58.7% 59.3% 58.6% 56.2% 57.9% 58.4% 57.7% 3A Atlanta, GA 56.6% 56.6% 57.5% 56.5% 56.0% 56.0% 56.6% 55.7%
3B:CA Los Angeles, CA 54.4% 54.4% 55.2% 54.6% 53.2% 53.9% 54.3% 53.8% 3B Las Vegas, NV 57.5% 57.5% 58.9% 57.6% 57.0% 57.0% 58.0% 57.0% 3C San Francisco, CA 54.0% 50.5% 52.9% 51.4% 53.5% 50.7% 52.3% 51.4% 4A Baltimore, MD 56.8% 55.8% 57.2% 56.3% 56.1% 55.4% 56.3% 55.6% 4B Albuquerque, NM 58.0% 58.1% 58.9% 58.7% 57.2% 57.6% 58.1% 57.9% 4C Seattle, WA 54.3% 51.7% 54.4% 52.8% 53.2% 51.9% 53.8% 52.6% 5A Chicago, IL 57.2% 55.5% 56.6% 56.1% 56.0% 55.1% 55.9% 55.5% 5B Denver, CO 57.4% 57.8% 58.6% 58.6% 56.8% 57.4% 57.9% 57.9% 6A Minneapolis, MN 58.1% 56.4% 56.9% 57.2% 56.8% 55.8% 56.1% 56.4% 6B Helena, MT 56.5% 55.2% 56.3% 56.3% 55.6% 55.0% 55.7% 55.9% 7 Duluth, MN 58.5% 56.3% 56.7% 57.6% 57.5% 55.9% 56.0% 56.9% 8 Fairbanks, AK 54.2% 52.9% 53.5% 55.1% 54.1% 52.9% 53.2% 54.8%
Table 5–4 Big Box Percent Energy Savings Over Standard 90.1-2004
Climate Zone
Representative City
Big Box
VAV CAV DOAS
ASHP DOAS
WSHP DOAS
1A Miami, FL 56.5% 58.8% 58.4% 56.9% 2A Houston, TX 59.3% 59.7% 59.9% 59.0% 2B Phoenix, AZ 57.9% 59.6% 60.2% 59.3% 3A Atlanta, GA 56.5% 55.9% 56.8% 55.5%
3B:CA Los Angeles, CA 54.0% 53.9% 54.5% 53.9% 3B Las Vegas, NV 57.1% 57.0% 58.2% 56.9% 3C San Francisco, CA 53.9% 50.0% 52.1% 50.7% 4A Baltimore, MD 56.2% 55.0% 56.5% 55.3% 4B Albuquerque, NM 57.7% 57.6% 58.6% 57.9% 4C Seattle, WA 54.0% 51.0% 53.9% 51.9% 5A Chicago, IL 57.1% 55.3% 56.6% 55.7% 5B Denver, CO 57.4% 57.6% 58.7% 58.2% 6A Minneapolis, MN 58.0% 56.1% 56.9% 56.8% 6B Helena, MT 56.4% 55.0% 56.4% 55.9% 7 Duluth, MN 58.6% 56.3% 57.0% 57.4% 8 Fairbanks, AK 54.4% 53.0% 54.0% 55.2%

65 This report is available at no cost from the National Renewable Energy Laboratory (NREL) at www.nrel.gov/publications.
Energy savings are relative to the Standard 90.1-2004 (ASHRAE 2004b) baseline energy use, and included unregulated loads in the energy use of the baseline and low-energy models. The analysis shows that the AEDG-MBBR recommendations met the goal of 50% or greater energy savings and that this goal can be met with a range of HVAC system types.
The simulation results are presented in Table 5–5 through Table 5–28, broken out by low-energy model HVAC system type (see Section 3.4.4 for details about the different HVAC system types).
5.2.1 Packaged Variable Air Volume Direct Expansion Table 5–5 Medium Box Low Plug VAV Simulation Results, 1A–4A
End Use (kBtu/ft²yr) 1A 2A 2B 3A 3B:CA 3B 3C 4A
Interior equipment (electric) 6.3 6.3 6.3 6.3 6.3 6.3 6.3 6.3 Interior lighting (electric) 21.8 21.8 21.8 21.8 21.8 21.8 21.8 21.8 Exterior lighting (electric) 2.3 2.3 2.3 2.3 2.3 2.4 2.3 2.3 Heating (electric) 0.0 0.3 0.5 0.6 0.4 0.7 0.7 0.9 Heating (gas) 0.0 0.4 0.5 1.0 0.2 1.1 2.9 2.0 Cooling (electric) 14.3 10.9 10.2 7.8 7.0 6.6 2.4 6.0 Fans (electric) 3.1 3.2 3.1 3.4 2.7 3.2 1.8 3.6 SWH (electric) 0.4 0.5 0.5 0.6 0.6 0.6 0.7 0.7 Total 48.4 45.8 45.2 44.0 41.4 42.7 38.9 43.7 Percent Savings 58.2% 58.7% 56.8% 56.6% 54.4% 57.5% 54.0% 56.8%
Table 5–6 Medium Box Low Plug VAV Simulation Results, 4B–8
End Use (kBtu/ft²yr) 4B 4C 5A 5B 6A 6B 7 8
Interior equipment (electric) 6.3 6.3 6.3 6.3 6.3 6.3 6.3 6.3 Interior lighting (electric) 21.8 21.8 21.8 21.8 21.8 21.8 21.8 21.8 Exterior lighting (electric) 2.3 2.3 2.4 2.3 2.3 2.3 2.3 2.4 Heating (electric) 0.7 1.3 0.9 0.7 0.8 0.9 0.9 1.0 Heating (gas) 2.0 1.6 2.5 3.2 3.9 4.2 4.9 17.9 Cooling (electric) 4.2 3.4 4.7 2.9 4.4 3.1 2.5 1.7 Fans (electric) 3.6 3.0 3.4 3.5 3.6 3.6 3.5 4.1 SWH (electric) 0.7 0.7 0.8 0.8 0.8 0.8 0.9 1.0 Total 41.6 40.5 42.9 41.5 44.0 43.1 43.2 56.3 Percent Savings 58.0% 54.3% 57.2% 57.4% 58.1% 56.5% 58.5% 54.2%
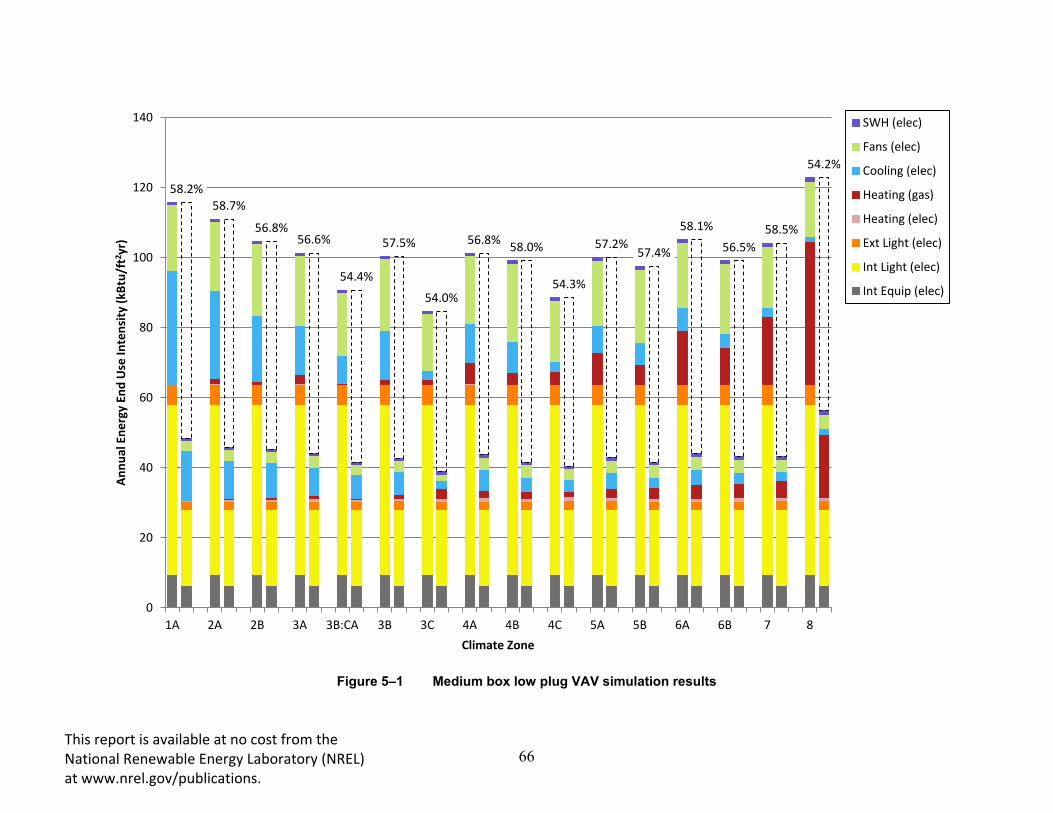
66
Figure 5–1 Medium box low plug VAV simulation results
58.2% 58.7%
56.8% 56.6%
54.4%
57.5%
54.0%
56.8% 58.0%
54.3%
57.2% 57.4%
58.1%
56.5% 58.5%
54.2%
0
20
40
60
80
100
120
140
1A 2A 2B 3A 3B:CA 3B 3C 4A 4B 4C 5A 5B 6A 6B 7 8
Annu
al E
nerg
y En
d U
se In
tens
ity (k
Btu/
ft2 y
r)
Climate Zone
SWH (elec)
Fans (elec)
Cooling (elec)
Heating (gas)
Heating (elec)
Ext Light (elec)
Int Light (elec)
Int Equip (elec)
This report is available at no cost from the National Renewable Energy Laboratory (NREL) at www.nrel.gov/publications.
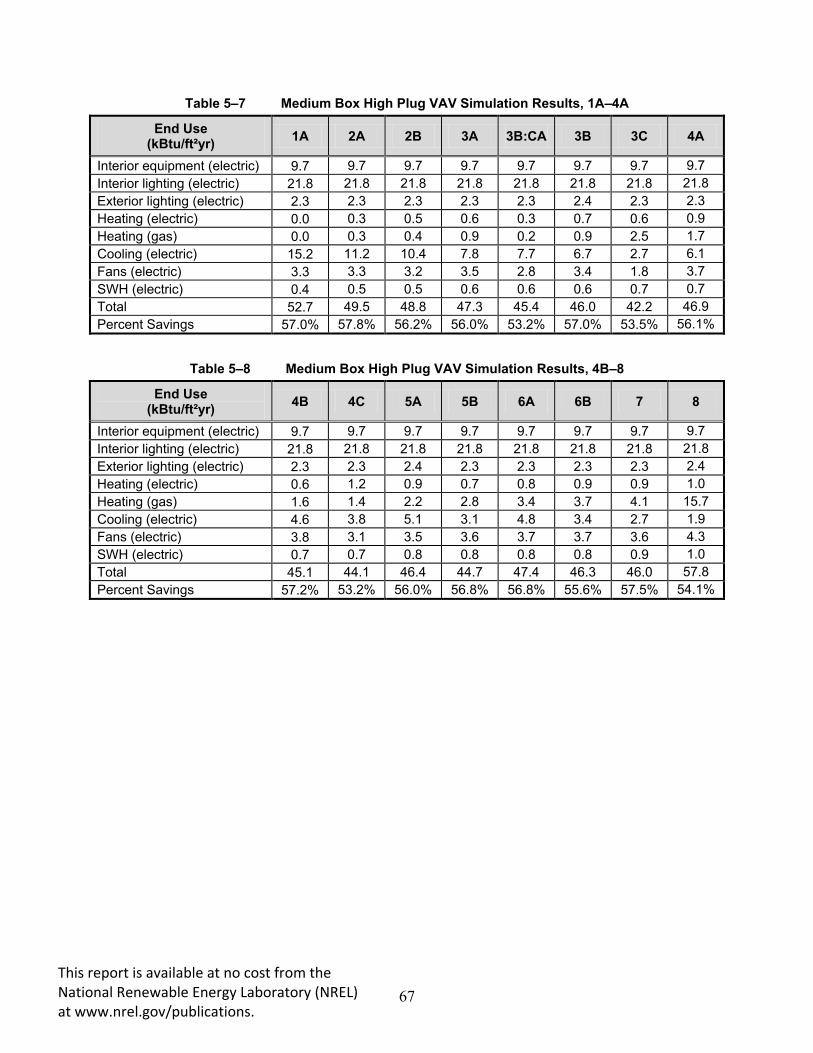
67 This report is available at no cost from the National Renewable Energy Laboratory (NREL) at www.nrel.gov/publications.
Table 5–7 Medium Box High Plug VAV Simulation Results, 1A–4A
End Use (kBtu/ft²yr) 1A 2A 2B 3A 3B:CA 3B 3C 4A
Interior equipment (electric) 9.7 9.7 9.7 9.7 9.7 9.7 9.7 9.7 Interior lighting (electric) 21.8 21.8 21.8 21.8 21.8 21.8 21.8 21.8 Exterior lighting (electric) 2.3 2.3 2.3 2.3 2.3 2.4 2.3 2.3 Heating (electric) 0.0 0.3 0.5 0.6 0.3 0.7 0.6 0.9 Heating (gas) 0.0 0.3 0.4 0.9 0.2 0.9 2.5 1.7 Cooling (electric) 15.2 11.2 10.4 7.8 7.7 6.7 2.7 6.1 Fans (electric) 3.3 3.3 3.2 3.5 2.8 3.4 1.8 3.7 SWH (electric) 0.4 0.5 0.5 0.6 0.6 0.6 0.7 0.7 Total 52.7 49.5 48.8 47.3 45.4 46.0 42.2 46.9 Percent Savings 57.0% 57.8% 56.2% 56.0% 53.2% 57.0% 53.5% 56.1%
Table 5–8 Medium Box High Plug VAV Simulation Results, 4B–8
End Use (kBtu/ft²yr) 4B 4C 5A 5B 6A 6B 7 8
Interior equipment (electric) 9.7 9.7 9.7 9.7 9.7 9.7 9.7 9.7 Interior lighting (electric) 21.8 21.8 21.8 21.8 21.8 21.8 21.8 21.8 Exterior lighting (electric) 2.3 2.3 2.4 2.3 2.3 2.3 2.3 2.4 Heating (electric) 0.6 1.2 0.9 0.7 0.8 0.9 0.9 1.0 Heating (gas) 1.6 1.4 2.2 2.8 3.4 3.7 4.1 15.7 Cooling (electric) 4.6 3.8 5.1 3.1 4.8 3.4 2.7 1.9 Fans (electric) 3.8 3.1 3.5 3.6 3.7 3.7 3.6 4.3 SWH (electric) 0.7 0.7 0.8 0.8 0.8 0.8 0.9 1.0 Total 45.1 44.1 46.4 44.7 47.4 46.3 46.0 57.8 Percent Savings 57.2% 53.2% 56.0% 56.8% 56.8% 55.6% 57.5% 54.1%

68
Figure 5–2 Medium box high plug VAV simulation results
57.0% 57.8%
56.2% 56.0%
53.2%
57.0%
53.5%
56.1% 57.2%
53.2%
56.0% 56.8%
56.8% 55.6%
57.5%
54.1%
0
20
40
60
80
100
120
140
1A 2A 2B 3A 3B:CA 3B 3C 4A 4B 4C 5A 5B 6A 6B 7 8
Annu
al E
nerg
y En
d U
se In
tens
ity (k
Btu/
ft2 y
r)
Climate Zone
SWH (elec)
Fans (elec)
Cooling (elec)
Heating (gas)
Heating (elec)
Ext Light (elec)
Int Light (elec)
Int Equip (elec)
This report is available at no cost from the National Renewable Energy Laboratory (NREL) at www.nrel.gov/publications.

69 This report is available at no cost from the National Renewable Energy Laboratory (NREL) at www.nrel.gov/publications.
Table 5–9 Big Box VAV Simulation Results, 1A–4A
End Use (kBtu/ft²yr) 1A 2A 2B 3A 3B:CA 3B 3C 4A
Interior equipment (electric) 6.4 6.4 6.4 6.4 6.4 6.4 6.4 6.4 Interior lighting (electric) 21.9 21.9 21.9 21.9 21.9 21.9 21.9 21.9 Exterior lighting (electric) 2.3 2.3 2.3 2.3 2.3 2.4 2.3 2.3 Heating (electric) 0.0 0.3 0.4 0.6 0.3 0.6 0.4 0.8 Heating (gas) 0.0 0.2 0.3 0.7 0.1 0.7 2.5 1.5 Cooling (electric) 15.9 10.5 10.2 7.2 7.0 6.5 2.4 5.9 Fans (electric) 3.7 3.1 3.0 3.2 2.5 3.0 1.6 3.3 SWH (electric) 0.2 0.2 0.2 0.3 0.2 0.2 0.3 0.3 Total 50.4 45.0 44.8 42.6 40.8 41.8 37.8 42.5 Percent Savings 56.5% 59.3% 57.9% 56.5% 54.0% 57.1% 53.9% 56.2%
Table 5–10 Big Box VAV Simulation Results, 4B–8
End Use (kBtu/ft²yr) 4B 4C 5A 5B 6A 6B 7 8
Interior equipment (electric) 6.4 6.4 6.4 6.4 6.4 6.4 6.4 6.4 Interior lighting (electric) 21.9 21.9 21.9 21.9 21.9 21.9 21.9 21.9 Exterior lighting (electric) 2.3 2.3 2.4 2.3 2.3 2.3 2.3 2.4 Heating (electric) 0.6 1.0 0.8 0.6 0.7 0.8 0.8 0.8 Heating (gas) 1.5 1.3 2.0 2.6 3.2 3.5 4.2 16.2 Cooling (electric) 4.1 3.4 4.6 2.8 4.3 3.0 2.4 1.6 Fans (electric) 3.4 2.7 3.2 3.2 3.3 3.2 3.1 3.6 SWH (electric) 0.3 0.3 0.3 0.3 0.3 0.3 0.4 0.4 Total 40.4 39.3 41.6 40.3 42.4 41.5 41.6 53.4 Percent Savings 57.7% 54.0% 57.1% 57.4% 58.0% 56.4% 58.6% 54.4%

70
Figure 5–3 Big box VAV simulation results
56.5% 59.3%
57.9%
56.5%
54.0%
57.1%
53.9%
56.2% 57.7%
54.0%
57.1% 57.4%
58.0% 56.4%
58.6%
54.4%
0
20
40
60
80
100
120
140
1A 2A 2B 3A 3B:CA 3B 3C 4A 4B 4C 5A 5B 6A 6B 7 8
Annu
al E
nerg
y En
d U
se In
tens
ity (k
Btu/
ft2 y
r)
Climate Zone
SWH (elec)
Fans (elec)
Cooling (elec)
Heating (gas)
Heating (elec)
Ext Light (elec)
Int Light (elec)
Int Equip (elec)
This report is available at no cost from the National Renewable Energy Laboratory (NREL) at www.nrel.gov/publications.

71 This report is available at no cost from the National Renewable Energy Laboratory (NREL) at www.nrel.gov/publications.
5.2.2 Constant Air Volume Direct Expansion With Dedicated Outdoor Air System Table 5–11 Medium Box Low Plug CAV DOAS Simulation Results, 1A–4A
End Use (kBtu/ft²yr) 1A 2A 2B 3A 3B:CA 3B 3C 4A
Interior equipment (electric) 6.3 6.3 6.3 6.3 6.3 6.3 6.3 6.3 Interior lighting (electric) 21.8 21.8 21.8 21.8 21.8 21.8 21.8 21.8 Exterior lighting (electric) 2.3 2.3 2.3 2.3 2.3 2.4 2.3 2.3 Heating (electric) 0.0 0.0 0.0 0.0 0.0 0.0 0.0 0.0 Heating (gas) 0.0 1.3 1.6 3.1 1.2 3.0 3.4 5.3 Cooling (electric) 12.9 10.0 8.0 7.2 6.8 6.0 5.2 5.6 Fans (electric) 2.9 2.7 2.6 2.6 2.3 2.6 2.2 2.6 SWH (electric) 0.4 0.5 0.5 0.6 0.6 0.6 0.7 0.7 Total 46.7 45.0 43.2 44.0 41.4 42.6 41.9 44.7 Percent Savings 59.7% 59.5% 58.7% 56.6% 54.4% 57.5% 50.5% 55.8%
Table 5–12 Medium Box Low Plug CAV DOAS Simulation Results, 4B–8
End Use (kBtu/ft²yr) 4B 4C 5A 5B 6A 6B 7 8
Interior equipment (electric) 6.3 6.3 6.3 6.3 6.3 6.3 6.3 6.3 Interior lighting (electric) 21.8 21.8 21.8 21.8 21.8 21.8 21.8 21.8 Exterior lighting (electric) 2.3 2.3 2.4 2.3 2.3 2.3 2.3 2.4 Heating (electric) 0.0 0.0 0.0 0.0 0.0 0.0 0.0 0.0 Heating (gas) 3.8 5.5 6.2 4.8 7.8 7.8 9.0 21.7 Cooling (electric) 4.0 3.7 4.5 2.7 4.2 2.9 2.6 1.9 Fans (electric) 2.6 2.3 2.5 2.4 2.6 2.4 2.5 2.6 SWH (electric) 0.7 0.7 0.8 0.8 0.8 0.8 0.9 1.0 Total 41.6 42.8 44.5 41.2 45.9 44.4 45.5 57.8 Percent Savings 58.1% 51.7% 55.5% 57.8% 56.4% 55.2% 56.3% 52.9%

72
Figure 5–4 Medium box low plug CAV DOAS simulation results
59.7% 59.5%
58.7% 56.6%
54.4%
57.5%
50.5%
55.8% 58.1%
51.7%
55.5% 57.8%
56.4%
55.2% 56.3%
52.9%
0
20
40
60
80
100
120
140
1A 2A 2B 3A 3B:CA 3B 3C 4A 4B 4C 5A 5B 6A 6B 7 8
Annu
al E
nerg
y En
d U
se In
tens
ity (k
Btu/
ft2 y
r)
Climate Zone
SWH (elec)
Fans (elec)
Cooling (elec)
Heating (gas)
Heating (elec)
Ext Light (elec)
Int Light (elec)
Int Equip (elec)
This report is available at no cost from the National Renewable Energy Laboratory (NREL) at www.nrel.gov/publications.

73 This report is available at no cost from the National Renewable Energy Laboratory (NREL) at www.nrel.gov/publications.
Table 5–13 Medium Box High Plug CAV DOAS Simulation Results, 1A–4A
End Use (kBtu/ft²yr) 1A 2A 2B 3A 3B:CA 3B 3C 4A
Interior equipment (electric) 9.7 9.7 9.7 9.7 9.7 9.7 9.7 9.7 Interior lighting (electric) 21.8 21.8 21.8 21.8 21.8 21.8 21.8 21.8 Exterior lighting (electric) 2.3 2.3 2.3 2.3 2.3 2.4 2.3 2.3 Heating (electric) 0.0 0.0 0.0 0.0 0.0 0.0 0.0 0.0 Heating (gas) 0.0 1.1 1.3 2.6 0.9 2.5 2.7 4.5 Cooling (electric) 13.5 10.5 8.5 7.5 7.1 6.4 5.4 5.9 Fans (electric) 3.0 2.8 2.8 2.7 2.4 2.7 2.2 2.7 SWH (electric) 0.4 0.5 0.5 0.6 0.6 0.6 0.7 0.7 Total 50.9 48.7 46.9 47.3 44.8 46.0 44.7 47.7 Percent Savings 58.5% 58.5% 57.9% 56.0% 53.9% 57.0% 50.7% 55.4%
Table 5–14 Medium Box High Plug CAV DOAS Simulation Results, 4B–8
End Use (kBtu/ft²yr) 4B 4C 5A 5B 6A 6B 7 8
Interior equipment (electric) 9.7 9.7 9.7 9.7 9.7 9.7 9.7 9.7 Interior lighting (electric) 21.8 21.8 21.8 21.8 21.8 21.8 21.8 21.8 Exterior lighting (electric) 2.3 2.3 2.4 2.3 2.3 2.3 2.3 2.4 Heating (electric) 0.0 0.0 0.0 0.0 0.0 0.0 0.0 0.0 Heating (gas) 3.2 4.6 5.3 4.1 6.9 6.8 7.9 19.8 Cooling (electric) 4.4 3.9 4.7 2.9 4.4 3.1 2.7 2.0 Fans (electric) 2.7 2.3 2.6 2.5 2.6 2.4 2.5 2.6 SWH (electric) 0.7 0.7 0.8 0.8 0.8 0.8 0.9 1.0 Total 44.7 45.3 47.2 44.1 48.5 46.9 47.8 59.3 Percent Savings 57.6% 51.9% 55.1% 57.4% 55.8% 55.0% 55.9% 52.9%

74
Figure 5–5 Medium box high plug CAV DOAS simulation results
58.5% 58.5%
57.9% 56.0%
53.9%
57.0%
50.7%
55.4% 57.6%
51.9%
55.1% 57.4%
55.8% 55.0%
55.9%
52.9%
0
20
40
60
80
100
120
140
1A 2A 2B 3A 3B:CA 3B 3C 4A 4B 4C 5A 5B 6A 6B 7 8
Annu
al E
nerg
y En
d U
se In
tens
ity (k
Btu/
ft2 y
r)
Climate Zone
SWH (elec)
Fans (elec)
Cooling (elec)
Heating (gas)
Heating (elec)
Ext Light (elec)
Int Light (elec)
Int Equip (elec)
This report is available at no cost from the National Renewable Energy Laboratory (NREL) at www.nrel.gov/publications.

75 This report is available at no cost from the National Renewable Energy Laboratory (NREL) at www.nrel.gov/publications.
Table 5–15 Big Box CAV DOAS Simulation Results, 1A–4A
End Use (kBtu/ft²yr) 1A 2A 2B 3A 3B:CA 3B 3C 4A
Interior equipment (electric) 6.4 6.4 6.4 6.4 6.4 6.4 6.4 6.4 Interior lighting (electric) 21.9 21.9 21.9 21.9 21.9 21.9 21.9 21.9 Exterior lighting (electric) 2.3 2.3 2.3 2.3 2.3 2.4 2.3 2.3 Heating (electric) 0.0 0.0 0.0 0.0 0.0 0.0 0.0 0.0 Heating (gas) 0.0 1.1 1.4 2.6 1.0 2.4 2.7 4.6 Cooling (electric) 13.8 9.9 8.1 7.1 6.7 6.0 5.2 5.5 Fans (electric) 3.2 2.7 2.6 2.6 2.3 2.5 2.1 2.6 SWH (electric) 0.2 0.2 0.2 0.3 0.2 0.2 0.3 0.3 Total 47.8 44.6 42.9 43.2 40.9 41.8 41.0 43.6 Percent Savings 58.8% 59.7% 59.6% 55.9% 53.9% 57.0% 50.0% 55.0%
Table 5–16 Big Box CAV DOAS Simulation Results, 4B–8
End Use (kBtu/ft²yr) 4B 4C 5A 5B 6A 6B 7 8
Interior equipment (electric) 6.4 6.4 6.4 6.4 6.4 6.4 6.4 6.4 Interior lighting (electric) 21.9 21.9 21.9 21.9 21.9 21.9 21.9 21.9 Exterior lighting (electric) 2.3 2.3 2.4 2.3 2.3 2.3 2.3 2.4 Heating (electric) 0.0 0.0 0.0 0.0 0.0 0.0 0.0 0.0 Heating (gas) 3.2 5.0 5.5 4.1 6.7 6.8 8.0 19.5 Cooling (electric) 3.9 3.7 4.4 2.6 4.1 2.9 2.6 1.9 Fans (electric) 2.5 2.2 2.5 2.4 2.5 2.3 2.4 2.5 SWH (electric) 0.3 0.3 0.3 0.3 0.3 0.3 0.4 0.4 Total 40.5 41.8 43.3 40.1 44.3 42.9 44.0 55.0 Percent Savings 57.6% 51.0% 55.3% 57.6% 56.1% 55.0% 56.3% 53.0%

76
Figure 5–6 Big box CAV DOAS simulation results
58.8% 59.7%
59.6%
55.9%
53.9%
57.0%
50.0%
55.0% 57.6%
51.0%
55.3% 57.6%
56.1% 55.0%
56.3%
53.0%
0
20
40
60
80
100
120
140
1A 2A 2B 3A 3B:CA 3B 3C 4A 4B 4C 5A 5B 6A 6B 7 8
Annu
al E
nerg
y En
d U
se In
tens
ity (k
Btu/
ft2 y
r)
Climate Zone
SWH (elec)
Fans (elec)
Cooling (elec)
Heating (gas)
Heating (elec)
Ext Light (elec)
Int Light (elec)
Int Equip (elec)
This report is available at no cost from the National Renewable Energy Laboratory (NREL) at www.nrel.gov/publications.

77 This report is available at no cost from the National Renewable Energy Laboratory (NREL) at www.nrel.gov/publications.
5.2.3 Air Source Heat Pump With Dedicated Outdoor Air System This model used the all-electric baseline for energy savings comparisons.
Table 5–17 Medium Box Low Plug ASHP DOAS Simulation Results, 1A–4A
End Use (kBtu/ft²yr) 1A 2A 2B 3A 3B:CA 3B 3C 4A
Interior equipment (electric) 6.3 6.3 6.3 6.3 6.3 6.3 6.3 6.3 Interior lighting (electric) 21.8 21.8 21.8 21.8 21.8 21.8 21.8 21.8 Exterior lighting (electric) 2.3 2.3 2.3 2.3 2.3 2.4 2.3 2.3 Heating (electric) 0.0 0.7 0.7 1.7 0.4 1.3 1.1 3.0 Cooling (electric) 13.2 10.2 8.2 7.3 6.9 6.2 5.2 5.8 Fans (electric) 2.9 2.7 2.6 2.7 2.3 2.6 2.2 2.9 SWH (electric) 0.4 0.5 0.5 0.6 0.6 0.6 0.7 0.7 Total 47.1 44.6 42.5 42.8 40.6 41.2 39.8 42.8 Percent Savings 59.3% 59.7% 59.3% 57.5% 55.2% 58.9% 52.9% 57.2%
Table 5–18 Medium Box Low Plug ASHP DOAS Simulation Results, 4B–8
End Use (kBtu/ft²yr) 4B 4C 5A 5B 6A 6B 7 8
Interior equipment (electric) 6.3 6.3 6.3 6.3 6.3 6.3 6.3 6.3 Interior lighting (electric) 21.8 21.8 21.8 21.8 21.8 21.8 21.8 21.8 Exterior lighting (electric) 2.3 2.3 2.4 2.3 2.3 2.3 2.3 2.4 Heating (electric) 2.3 2.6 3.8 3.1 5.1 5.1 6.1 15.3 Cooling (electric) 4.2 3.8 4.6 2.8 4.3 3.0 2.6 1.9 Fans (electric) 2.7 2.5 3.0 2.8 3.3 3.0 3.3 4.5 SWH (electric) 0.7 0.7 0.8 0.8 0.8 0.8 0.9 1.0 Total 40.4 40.1 42.6 39.9 44.0 42.4 43.4 53.3 Percent Savings 58.9% 54.4% 56.6% 58.6% 56.9% 56.3% 56.7% 53.5%

78
Figure 5–7 Medium box low plug ASHP DOAS results
59.3% 59.7%
59.3% 57.5%
55.2%
58.9%
52.9%
57.2% 58.9%
54.4%
56.6% 58.6% 56.9%
56.3% 56.7%
53.5%
0
20
40
60
80
100
120
140
1A 2A 2B 3A 3B:CA 3B 3C 4A 4B 4C 5A 5B 6A 6B 7 8
Annu
al E
nerg
y En
d U
se In
tens
ity (k
Btu/
ft2 y
r)
Climate Zone
SWH (elec)
Fans (elec)
Cooling (elec)
Heating (elec)
Ext Light (elec)
Int Light (elec)
Int Equip (elec)
This report is available at no cost from the National Renewable Energy Laboratory (NREL) at www.nrel.gov/publications.
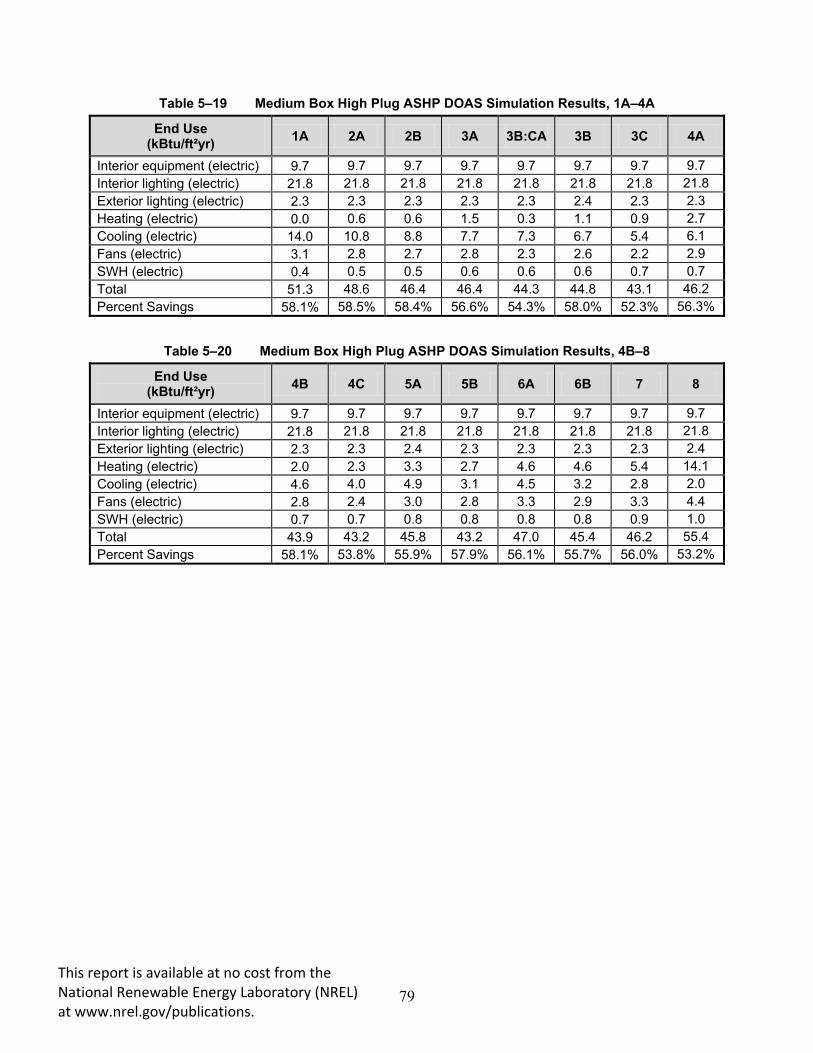
79 This report is available at no cost from the National Renewable Energy Laboratory (NREL) at www.nrel.gov/publications.
Table 5–19 Medium Box High Plug ASHP DOAS Simulation Results, 1A–4A
End Use (kBtu/ft²yr) 1A 2A 2B 3A 3B:CA 3B 3C 4A
Interior equipment (electric) 9.7 9.7 9.7 9.7 9.7 9.7 9.7 9.7 Interior lighting (electric) 21.8 21.8 21.8 21.8 21.8 21.8 21.8 21.8 Exterior lighting (electric) 2.3 2.3 2.3 2.3 2.3 2.4 2.3 2.3 Heating (electric) 0.0 0.6 0.6 1.5 0.3 1.1 0.9 2.7 Cooling (electric) 14.0 10.8 8.8 7.7 7.3 6.7 5.4 6.1 Fans (electric) 3.1 2.8 2.7 2.8 2.3 2.6 2.2 2.9 SWH (electric) 0.4 0.5 0.5 0.6 0.6 0.6 0.7 0.7 Total 51.3 48.6 46.4 46.4 44.3 44.8 43.1 46.2 Percent Savings 58.1% 58.5% 58.4% 56.6% 54.3% 58.0% 52.3% 56.3%
Table 5–20 Medium Box High Plug ASHP DOAS Simulation Results, 4B–8
End Use (kBtu/ft²yr) 4B 4C 5A 5B 6A 6B 7 8
Interior equipment (electric) 9.7 9.7 9.7 9.7 9.7 9.7 9.7 9.7 Interior lighting (electric) 21.8 21.8 21.8 21.8 21.8 21.8 21.8 21.8 Exterior lighting (electric) 2.3 2.3 2.4 2.3 2.3 2.3 2.3 2.4 Heating (electric) 2.0 2.3 3.3 2.7 4.6 4.6 5.4 14.1 Cooling (electric) 4.6 4.0 4.9 3.1 4.5 3.2 2.8 2.0 Fans (electric) 2.8 2.4 3.0 2.8 3.3 2.9 3.3 4.4 SWH (electric) 0.7 0.7 0.8 0.8 0.8 0.8 0.9 1.0 Total 43.9 43.2 45.8 43.2 47.0 45.4 46.2 55.4 Percent Savings 58.1% 53.8% 55.9% 57.9% 56.1% 55.7% 56.0% 53.2%

80
Figure 5–8 Medium box high plug ASHP DOAS results
58.1% 58.5%
58.4% 56.6%
54.3%
58.0%
52.3%
56.3% 58.1%
53.8%
55.9% 57.9% 56.1%
55.7% 56.0%
53.2%
0
20
40
60
80
100
120
140
1A 2A 2B 3A 3B:CA 3B 3C 4A 4B 4C 5A 5B 6A 6B 7 8
Annu
al E
nerg
y En
d U
se In
tens
ity (k
Btu/
ft2 y
r)
Climate Zone
SWH (elec)
Fans (elec)
Cooling (elec)
Heating (elec)
Ext Light (elec)
Int Light (elec)
Int Equip (elec)
This report is available at no cost from the National Renewable Energy Laboratory (NREL) at www.nrel.gov/publications.
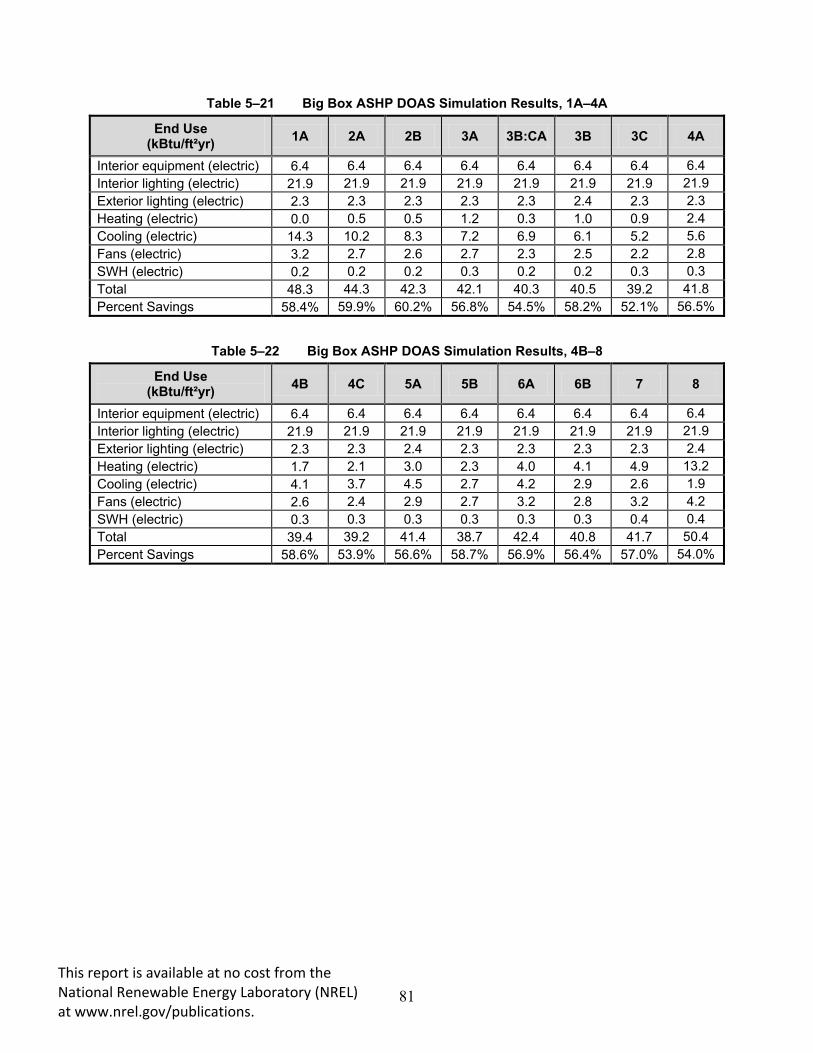
81 This report is available at no cost from the National Renewable Energy Laboratory (NREL) at www.nrel.gov/publications.
Table 5–21 Big Box ASHP DOAS Simulation Results, 1A–4A
End Use (kBtu/ft²yr) 1A 2A 2B 3A 3B:CA 3B 3C 4A
Interior equipment (electric) 6.4 6.4 6.4 6.4 6.4 6.4 6.4 6.4 Interior lighting (electric) 21.9 21.9 21.9 21.9 21.9 21.9 21.9 21.9 Exterior lighting (electric) 2.3 2.3 2.3 2.3 2.3 2.4 2.3 2.3 Heating (electric) 0.0 0.5 0.5 1.2 0.3 1.0 0.9 2.4 Cooling (electric) 14.3 10.2 8.3 7.2 6.9 6.1 5.2 5.6 Fans (electric) 3.2 2.7 2.6 2.7 2.3 2.5 2.2 2.8 SWH (electric) 0.2 0.2 0.2 0.3 0.2 0.2 0.3 0.3 Total 48.3 44.3 42.3 42.1 40.3 40.5 39.2 41.8 Percent Savings 58.4% 59.9% 60.2% 56.8% 54.5% 58.2% 52.1% 56.5%
Table 5–22 Big Box ASHP DOAS Simulation Results, 4B–8
End Use (kBtu/ft²yr) 4B 4C 5A 5B 6A 6B 7 8
Interior equipment (electric) 6.4 6.4 6.4 6.4 6.4 6.4 6.4 6.4 Interior lighting (electric) 21.9 21.9 21.9 21.9 21.9 21.9 21.9 21.9 Exterior lighting (electric) 2.3 2.3 2.4 2.3 2.3 2.3 2.3 2.4 Heating (electric) 1.7 2.1 3.0 2.3 4.0 4.1 4.9 13.2 Cooling (electric) 4.1 3.7 4.5 2.7 4.2 2.9 2.6 1.9 Fans (electric) 2.6 2.4 2.9 2.7 3.2 2.8 3.2 4.2 SWH (electric) 0.3 0.3 0.3 0.3 0.3 0.3 0.4 0.4 Total 39.4 39.2 41.4 38.7 42.4 40.8 41.7 50.4 Percent Savings 58.6% 53.9% 56.6% 58.7% 56.9% 56.4% 57.0% 54.0%

82
Figure 5–9 Big box ASHP DOAS simulation results
58.4% 59.9%
60.2%
56.8%
54.5%
58.2%
52.1%
56.5% 58.6%
53.9%
56.6% 58.7% 56.9%
56.4% 57.0%
54.0%
0
20
40
60
80
100
120
140
1A 2A 2B 3A 3B:CA 3B 3C 4A 4B 4C 5A 5B 6A 6B 7 8
Annu
al E
nerg
y En
d U
se In
tens
ity (k
Btu/
ft2 y
r)
Climate Zone
SWH (elec)
Fans (elec)
Cooling (elec)
Heating (elec)
Ext Light (elec)
Int Light (elec)
Int Equip (elec)
This report is available at no cost from the National Renewable Energy Laboratory (NREL) at www.nrel.gov/publications.

83 This report is available at no cost from the National Renewable Energy Laboratory (NREL) at www.nrel.gov/publications.
5.2.4 Water Source Heat Pump With Dedicated Outdoor Air System Table 5–23 Medium Box Low Plug WSHP DOAS Simulation Results, 1A–4A
End Use (kBtu/ft²yr) 1A 2A 2B 3A 3B:CA 3B 3C 4A
Interior equipment (electric) 6.3 6.3 6.3 6.3 6.3 6.3 6.3 6.3 Interior lighting (electric) 21.8 21.8 21.8 21.8 21.8 21.8 21.8 21.8 Exterior lighting (electric) 2.3 2.3 2.3 2.3 2.3 2.4 2.3 2.3 Heating (electric) 0.0 0.3 0.4 0.7 0.3 0.6 0.7 1.1 Heating (gas) 0.0 0.5 0.6 1.5 0.3 1.4 1.5 2.7 Cooling (electric) 13.4 10.2 8.0 7.4 6.8 6.1 5.2 5.8 Fans (electric) 2.9 2.6 2.6 2.6 2.3 2.6 2.2 2.6 Pumps (electric) 1.2 0.9 0.8 0.8 0.4 0.7 0.3 0.8 SWH (electric) 0.4 0.5 0.5 0.6 0.6 0.6 0.7 0.7 Total 48.4 45.6 43.4 44.1 41.2 42.5 41.1 44.2 Percent Savings 58.2% 58.9% 58.6% 56.5% 54.6% 57.6% 51.4% 56.3%
Table 5–24 Medium Box Low Plug WSHP DOAS Simulation Results, 4B–8
End Use (kBtu/ft²yr) 4B 4C 5A 5B 6A 6B 7 8
Interior equipment (electric) 6.3 6.3 6.3 6.3 6.3 6.3 6.3 6.3 Interior lighting (electric) 21.8 21.8 21.8 21.8 21.8 21.8 21.8 21.8 Exterior lighting (electric) 2.3 2.3 2.4 2.3 2.3 2.3 2.3 2.4 Heating (electric) 0.8 1.2 1.3 1.0 1.6 1.5 1.8 3.9 Heating (gas) 1.4 2.9 3.3 2.2 4.4 4.4 5.1 13.8 Cooling (electric) 4.2 3.8 4.6 2.8 4.3 3.0 2.6 1.9 Fans (electric) 2.8 2.4 2.6 2.7 2.6 2.7 2.6 3.4 Pumps (electric) 0.6 0.4 0.8 0.5 0.8 0.4 0.6 0.5 SWH (electric) 0.7 0.7 0.8 0.8 0.8 0.8 0.9 1.0 Total 40.9 41.8 43.9 40.4 45.0 43.3 44.2 55.2 Percent Savings 58.7% 52.8% 56.1% 58.6% 57.2% 56.3% 57.6% 55.1%

84
Figure 5–10 Medium box low plug WSHP DOAS results
58.2% 58.9%
58.6% 56.5%
54.6%
57.6%
51.4%
56.3% 58.7%
52.8%
56.1% 58.6%
57.2%
56.3% 57.6%
55.1%
0
20
40
60
80
100
120
140
1A 2A 2B 3A 3B:CA 3B 3C 4A 4B 4C 5A 5B 6A 6B 7 8
Annu
al E
nerg
y En
d U
se In
tens
ity (k
Btu/
ft2 y
r)
Climate Zone
SWH (elec)
Pumps (elec)
Fans (elec)
Cooling (elec)
Heating (gas)
Heating (elec)
Ext Light (elec)
Int Light (elec)
Int Equip (elec)
This report is available at no cost from the National Renewable Energy Laboratory (NREL) at www.nrel.gov/publications.
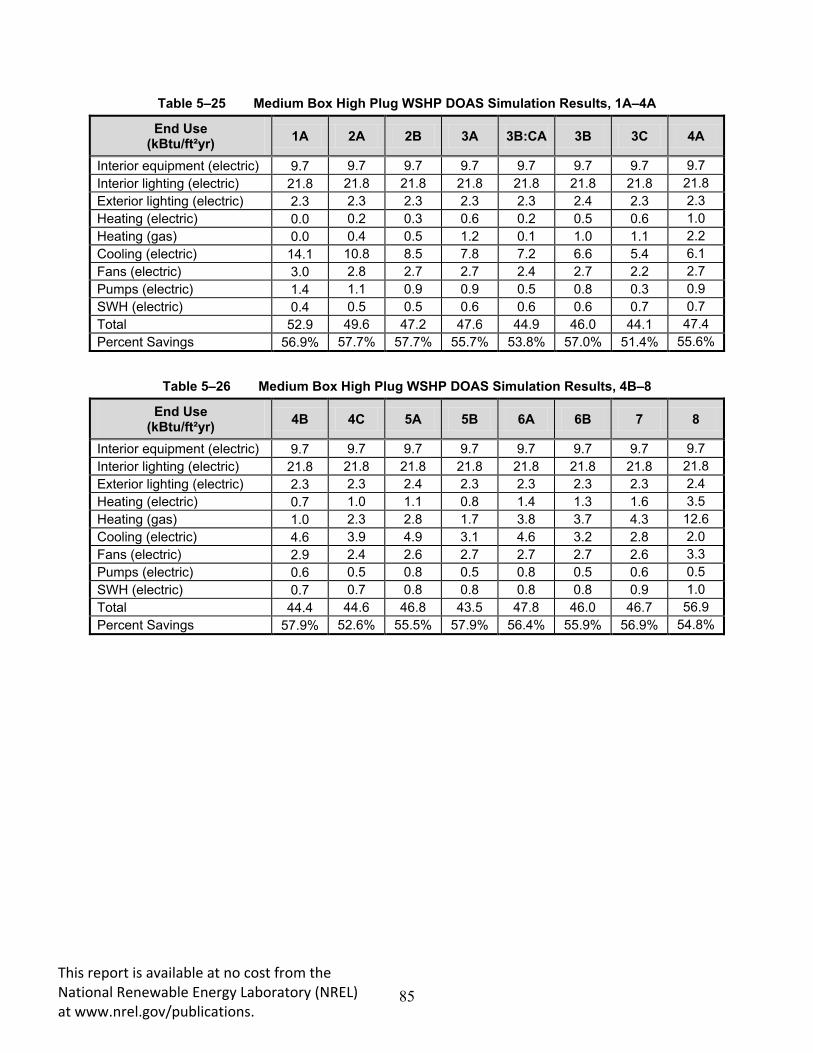
85 This report is available at no cost from the National Renewable Energy Laboratory (NREL) at www.nrel.gov/publications.
Table 5–25 Medium Box High Plug WSHP DOAS Simulation Results, 1A–4A
End Use (kBtu/ft²yr) 1A 2A 2B 3A 3B:CA 3B 3C 4A
Interior equipment (electric) 9.7 9.7 9.7 9.7 9.7 9.7 9.7 9.7 Interior lighting (electric) 21.8 21.8 21.8 21.8 21.8 21.8 21.8 21.8 Exterior lighting (electric) 2.3 2.3 2.3 2.3 2.3 2.4 2.3 2.3 Heating (electric) 0.0 0.2 0.3 0.6 0.2 0.5 0.6 1.0 Heating (gas) 0.0 0.4 0.5 1.2 0.1 1.0 1.1 2.2 Cooling (electric) 14.1 10.8 8.5 7.8 7.2 6.6 5.4 6.1 Fans (electric) 3.0 2.8 2.7 2.7 2.4 2.7 2.2 2.7 Pumps (electric) 1.4 1.1 0.9 0.9 0.5 0.8 0.3 0.9 SWH (electric) 0.4 0.5 0.5 0.6 0.6 0.6 0.7 0.7 Total 52.9 49.6 47.2 47.6 44.9 46.0 44.1 47.4 Percent Savings 56.9% 57.7% 57.7% 55.7% 53.8% 57.0% 51.4% 55.6%
Table 5–26 Medium Box High Plug WSHP DOAS Simulation Results, 4B–8
End Use (kBtu/ft²yr) 4B 4C 5A 5B 6A 6B 7 8
Interior equipment (electric) 9.7 9.7 9.7 9.7 9.7 9.7 9.7 9.7 Interior lighting (electric) 21.8 21.8 21.8 21.8 21.8 21.8 21.8 21.8 Exterior lighting (electric) 2.3 2.3 2.4 2.3 2.3 2.3 2.3 2.4 Heating (electric) 0.7 1.0 1.1 0.8 1.4 1.3 1.6 3.5 Heating (gas) 1.0 2.3 2.8 1.7 3.8 3.7 4.3 12.6 Cooling (electric) 4.6 3.9 4.9 3.1 4.6 3.2 2.8 2.0 Fans (electric) 2.9 2.4 2.6 2.7 2.7 2.7 2.6 3.3 Pumps (electric) 0.6 0.5 0.8 0.5 0.8 0.5 0.6 0.5 SWH (electric) 0.7 0.7 0.8 0.8 0.8 0.8 0.9 1.0 Total 44.4 44.6 46.8 43.5 47.8 46.0 46.7 56.9 Percent Savings 57.9% 52.6% 55.5% 57.9% 56.4% 55.9% 56.9% 54.8%

86
Figure 5–11 Medium box high plug WSHP DOAS results
56.9% 57.7%
57.7% 55.7%
53.8%
57.0%
51.4%
55.6% 57.9%
52.6%
55.5% 57.9%
56.4% 55.9%
56.9%
54.8%
0
20
40
60
80
100
120
140
1A 2A 2B 3A 3B:CA 3B 3C 4A 4B 4C 5A 5B 6A 6B 7 8
Annu
al E
nerg
y En
d U
se In
tens
ity (k
Btu/
ft2 y
r)
Climate Zone
SWH (elec)
Pumps (elec)
Fans (elec)
Cooling (elec)
Heating (gas)
Heating (elec)
Ext Light (elec)
Int Light (elec)
Int Equip (elec)
This report is available at no cost from the National Renewable Energy Laboratory (NREL) at www.nrel.gov/publications.

87 This report is available at no cost from the National Renewable Energy Laboratory (NREL) at www.nrel.gov/publications.
Table 5–27 Big Box WSHP DOAS Simulation Results, 1A–4A
End Use (kBtu/ft²yr) 1A 2A 2B 3A 3B:CA 3B 3C 4A
Interior equipment (electric) 6.4 6.4 6.4 6.4 6.4 6.4 6.4 6.4 Interior lighting (electric) 21.9 21.9 21.9 21.9 21.9 21.9 21.9 21.9 Exterior lighting (electric) 2.3 2.3 2.3 2.3 2.3 2.4 2.3 2.3 Heating (electric) 0.0 0.3 0.3 0.6 0.2 0.5 0.6 1.0 Heating (gas) 0.0 0.5 0.6 1.3 0.3 1.2 1.3 2.5 Cooling (electric) 14.5 10.2 8.1 7.3 6.8 6.1 5.2 5.7 Fans (electric) 3.2 2.6 2.6 2.6 2.3 2.6 2.2 2.6 Pumps (electric) 1.6 0.9 0.8 0.8 0.4 0.6 0.2 0.8 SWH (electric) 0.2 0.2 0.2 0.3 0.2 0.2 0.3 0.3 Total 50.0 45.4 43.3 43.5 40.9 41.9 40.4 43.4 Percent Savings 56.9% 59.0% 59.3% 55.5% 53.9% 56.9% 50.7% 55.3%
Table 5–28 Big Box WSHP DOAS Simulation Results, 4B–8
End Use (kBtu/ft²yr) 4B 4C 5A 5B 6A 6B 7 8
Interior equipment (electric) 6.4 6.4 6.4 6.4 6.4 6.4 6.4 6.4 Interior lighting (electric) 21.9 21.9 21.9 21.9 21.9 21.9 21.9 21.9 Exterior lighting (electric) 2.3 2.3 2.4 2.3 2.3 2.3 2.3 2.4 Heating (electric) 0.7 1.0 1.1 0.9 1.4 1.3 1.6 4.8 Heating (gas) 1.4 2.7 3.0 2.0 3.8 3.8 4.6 10.9 Cooling (electric) 4.1 3.7 4.5 2.7 4.2 2.9 2.6 1.9 Fans (electric) 2.7 2.3 2.5 2.6 2.6 2.6 2.6 3.4 Pumps (electric) 0.5 0.4 0.7 0.4 0.7 0.4 0.5 0.4 SWH (electric) 0.3 0.3 0.3 0.3 0.3 0.3 0.4 0.4 Total 40.3 41.1 42.9 39.5 43.6 42.0 42.9 52.5 Percent Savings 57.9% 51.9% 55.7% 58.2% 56.8% 55.9% 57.4% 55.2%

88
Figure 5–12 Big box WSHP DOAS simulation results
56.9% 59.0%
59.3%
55.5%
53.9%
56.9%
50.7%
55.3% 57.9%
51.9%
55.7% 58.2%
56.8% 55.9%
57.4%
55.2%
0
20
40
60
80
100
120
140
1A 2A 2B 3A 3B:CA 3B 3C 4A 4B 4C 5A 5B 6A 6B 7 8
Annu
al E
nerg
y En
d U
se In
tens
ity (k
Btu/
ft2 y
r)
Climate Zone
SWH (elec)
Pumps (elec)
Fans (elec)
Cooling (elec)
Heating (gas)
Heating (elec)
Ext Light (elec)
Int Light (elec)
Int Equip (elec)
This report is available at no cost from the National Renewable Energy Laboratory (NREL) at www.nrel.gov/publications.

89 This report is available at no cost from the National Renewable Energy Laboratory (NREL) at www.nrel.gov/publications.
6. Conclusion This TSD describes the process and methodology used to develop the AEDG-MBBR, which is intended to provide recommendations for achieving 50% whole-building energy savings in retail facilities over levels achieved by following Standard 90.1-2004. The AEDG-MBBR was developed in collaboration with ASHRAE, AIA, IES, USGBC, and DOE. One of NREL’s tasks was to provide the analysis and modeling support to verify energy savings and develop recommendations that met the 50% savings goal. The 50% energy savings target represents a step toward achieving net-zero energy retail facilities. Net-zero energy buildings draw equal (or less) energy from outside sources than they generate on site from renewable energy sources during a given year. The AEDG-MBBR provides user-friendly design assistance and recommendations to design, architectural, and engineering firms to help achieve energy savings. It includes prescriptive recommendations by climate zone for designing the building envelope, fenestration lighting systems (including electrical lights and daylighting), HVAC systems, building automation and controls, OA treatment, and the SWH system. Additional savings recommendations are also included, but are not necessary for 50% savings. These are provided for alternative HVAC systems and renewable energy systems. The AEDG-MBBR contains recommendations only and is not a code or standard.
The AEDG-MBBR provides a simple, easy-to-use guide to help the building designer, contractor, and owner identify a clear, prescriptive path to 50% energy savings over Standard 90.1-2004. In many ways, it is a simple interface to a complex analysis performed using EnergyPlus. The combination of a set of recommendations contained on a single page, along with numerous how-to tips to help the construction team complete the project successfully, should help facilitate increased energy efficiency in new buildings. Case studies of actual retail applications add to the resources of energy efficiency opportunities. The ultimate goal of the AEDG partner organizations is to achieve net-zero energy buildings, and the 50% savings guides represent a step in reaching this goal.
Separate from the AEDG-MBBR, this TSD was created to document the process used to develop the guide and the analysis performed to support that development. The specific objectives were to:
• Document the process and schedule used to develop the AEDG-MBBR. • Document prototypical medium and big box retail store characteristics. • Document the EnergyPlus modeling assumptions used to establish 50% energy savings. • Document the baseline and low-energy EnergyPlus retail store models. • Present the recommendations for achieving at least 50% savings over Standard 90.1-
2004. • Demonstrate that the recommendations result in 50% or greater energy savings by
climate zone.
A partial subset of the information contained in this TSD is included in the AEDG-MBBR, but the information is too extensive for full inclusion. This TSD provides complete documentation of all the simulation results for each climate zone and HVAC system type covered by the guide. It also provides a technical resource to industry members who are looking to implement AEDG recommendations in real projects.

90 This report is available at no cost from the National Renewable Energy Laboratory (NREL) at www.nrel.gov/publications.
7. References ASHRAE (1999). ANSI/ASHRAE/IESNA Standard 90.1-1999, Energy Standard for Buildings Except Low-Rise Residential Buildings. Atlanta, Georgia, American Society of Heating, Refrigerating, and Air-Conditioning Engineers, Inc.
ASHRAE (2003). HVAC Applications Handbook. Atlanta, GA, American Society of Heating, Refrigerating and Air-Conditioning Engineers, Inc.
ASHRAE (2004a). ANSI/ASHRAE Standard 62.1-2004, Ventilation for Acceptable Indoor Air Quality. Atlanta, Georgia, American Society of Heating, Refrigerating, and Air-Conditioning Engineers, Inc.
ASHRAE (2004b). ANSI/ASHRAE/IESNA Standard 90.1-2004, Energy Standard for Buildings Except Low-Rise Residential Buildings. Atlanta, Georgia, American Society of Heating, Refrigerating, and Air-Conditioning Engineers, Inc.
ASHRAE (2009). Fundamentals Handbook. Atlanta, GA, American Society of Heating, Refrigerating and Air-Conditioning Engineers, Inc.
ASHRAE, AIA, IESNA, NBI and DOE (2004). Advanced Energy Design Guide for Small Office Buildings: Achieving 30% Energy Savings Toward a Net Zero Energy Building, American Society of Heating, Refrigerating and Air-Conditioning Engineers, Inc.
ASHRAE, AIA, IESNA, USGBC and DOE (2006). Advanced Energy Design Guide for Small Retail Buildings: Achieving 30% Energy Savings Toward a Net Zero Energy Building, American Society of Heating, Refrigerating and Air-Conditioning Engineers, Inc.
ASHRAE, AIA, IESNA, USGBC and DOE (2008a). Advanced Energy Design Guide for K-12 School Buildings: Achieving 30% Energy Savings Toward a Net Zero Energy Building, American Society of Heating, Refrigerating and Air-Conditioning Engineers, Inc.
ASHRAE, AIA, IESNA, USGBC and DOE (2008b). Advanced Energy Design Guide for Small Warehouses and Self-Storage Buildings: Achieving 30% Energy Savings Toward a Net Zero Energy Building, American Society of Heating, Refrigerating and Air-Conditioning Engineers, Inc.
ASHRAE, AIA, IESNA, USGBC and DOE (2009a). Advanced Energy Design Guide for Highway Lodging: Achieving 30% Energy Savings Toward a Net Zero Energy Building. Atlanta, American Society of Heating, Refrigerating and Air-Conditioning Engineers, Inc.
ASHRAE, AIA, IESNA, USGBC and DOE (2009b). Advanced Energy Design Guide for Small Hospitals and Healthcare Facilities: Achieving 30% Energy Savings Toward a Net Zero Energy Building. Atlanta, American Society of Heating, Refrigerating and Air-Conditioning Engineers, Inc.
ASHRAE, AIA, IESNA, USGBC and DOE (2011a). Advanced Energy Design Guide for K-12 School Buildings: Achieving 50% Energy Savings Toward a Net Zero Energy Building, American Society of Heating, Refrigerating and Air-Conditioning Engineers, Inc.
ASHRAE, AIA, IESNA, USGBC and DOE (2011b). Advanced Energy Design Guide for Medium to Big Box Retail Buildings: Achieving 50% Energy Savings Toward a Net Zero
91 This report is available at no cost from the National Renewable Energy Laboratory (NREL) at www.nrel.gov/publications.
Energy Building, American Society of Heating, Refrigerating and Air-Conditioning Engineers, Inc.
ASHRAE, AIA, IESNA, USGBC and DOE (2011c). Advanced Energy Design Guide for Small to Medium Office Buildings: Achieving 50% Energy Savings Toward a Net Zero Energy Building. Atlanta, American Society of Heating, Refrigerating and Air-Conditioning Engineers, Inc.
ASHRAE, AIA, IESNA, USGBC and DOE (2012). Advanced Energy Design Guide for Large Hospitals: Achieving 50% Energy Savings Toward a Net Zero Energy Building, American Society of Heating, Refrigerating and Air-Conditioning Engineers, Inc.
Briggs, R. S., R. G. Lucas and Z. T. Taylor (2003). Climate Classification for Building Energy Codes and Standards: Part 1- Development Process. Richland, WA.
Deru, M., K. Field, D. Studer, K. Benne, B. Griffith, P. Torcellini, B. Liu, M. Halverson, D. Winiarski, M. Rosenberg, M. Yazdanian, J. Huang and D. Crawley (2011). U.S. Department of Energy Commercial Reference Building Models of the National Building Stock. Golden, CO, National Renewable Energy Laboratory.
DOE. (2003). "Map of DOE's Proposed Climate Zones." U.S. Department of Energy Building Energy Codes Program. www.energycodes.gov.
DOE (2011). EnergyPlus Energy Simulation Software, Version 6.0. Washington, D.C., U.S. Department of Energy.
Hale, E. T., M. Leach, A. Hirsch and P. A. Torcellini (2009). General Merchandise 50% Energy Savings Technical Support Document. Golden, CO, National Renewable Energy Laboratory.
Judkoff, R. and J. Neymark (1995). International Energy Agency Building Energy Simulation Test (BESTEST) and Diagnostic Method. Golden, CO, National Renewable Energy Laboratory.
Leach, M., E. Bonnema, S. Pless and P. Torcellini (2012). Setting Whole-Building Absolute Energy Use Targets for the K-12 School, Retail, and Healthcare Sectors: Preprint. : 20 pp.
NREL (2010). Opt-E-Plus Software for Commercial Building Optimization. Golden, CO, National Renewable Energy Laboratory. FS-550-45620.

92 This report is available at no cost from the National Renewable Energy Laboratory (NREL) at www.nrel.gov/publications.
Appendix A. Scoping Document This appendix contains an exact copy of the scoping document for the AEDG-MBBR.
Purpose To significantly transform the marketplace with speed and scale by providing user-friendly, “how-to” design guidance and efficiency recommendations to owners, builders, energy modelers, and designers of medium-box retail buildings in order to achieve energy savings of 50% over ASHRAE Standard 90.1-2004. To install skills and knowledge in practitioners that can be used in a wide variety of buildings.
Background The ASHRAE Advanced Energy Design Guides (AEDGs) are a series of publications designed to provide recommendations for achieving energy savings over the minimum code requirements of ANSI/ASHRAE/IESNA Standard 90.1-1999. Designers, while complying with minimum energy code requirements, often lack the opportunity or have insufficient design fees to pursue innovative, energy efficient concepts in the design of retail buildings. The 50% AEDG for medium-box retail buildings will provide prescriptive design assistance in a user-friendly presentation to owners and designers who want to achieve greater energy savings than obtained through minimum code compliance. In a departure from 30% AEDG work, the intent of this work is not to replace energy modeling entirely, but to supplement the recommendations of the guide with user-friendly modeling tools to help owners and designers predict project-specific energy savings achievable through design recommendation implementation.
Goal To provide owners and designers of medium-box retail buildings design recommendations and user-friendly modeling tools that will enable them to achieve 50% site energy savings beyond a Standard 90.1-2004 minimally-compliant baseline.
• The recommendations of the guide will meet the 50% savings goal for each of the climate zones covered by the guide. The list of representative cities for each climate zone will be consistent with that for the 50% Technical Support Document (TSD) for General Merchandise (Hale et al. 2009).
• The 50% savings goal is a hard goal as opposed to an approximate target, and represents a significant step towards increased energy-efficiency from the goal of the 30% AEDG.
• Energy savings will be achieved through the identification of packages of design measures and state-of-the-art building systems and design concepts that result in energy-efficient spaces.
Audience
• Owners and design teams of medium-box retail buildings interested in 50% energy savings and supported by energy modeling expertise. This is typically a more sophisticated design team capable of using modeling to evaluate prospective designs to ensure they meet AEDG recommendations.
• Engineers and designers interested in developing the skills needed to produce 50% energy savings in medium-box retail buildings.

93 This report is available at no cost from the National Renewable Energy Laboratory (NREL) at www.nrel.gov/publications.
Recommendation Development Guidelines
• Recommendations are divided into two distinct paths: (1) a prescriptive path, for which tables of recommendations will be provided for the most common 50% design strategies and alternative design strategy subsystem performance and (2) a performance-based path based on whole-building energy use. Prescriptive measures will be assigned performance-based benchmarks. The performance-based path will allow increased design freedom, requiring adherence to a performance-based benchmark only with respect to whole-building energy use intensity.
• Recommendations will be presented in a user-friendly, “how-to” format to ease the burden for the designers and give decision-makers an easy-to-follow overview of the design process. Modeling tools designed to enhance the speed and scope of recommendation deployment and adoption will be packaged in a similarly user-friendly manner that minimizes energy modeling experience requirements insofar as possible. Design recommendations need to contain practical design information that can be used within the constraints of typical construction and design fees.
• Recommendations will not specify the implementation of unique products – we will require that all recommended products be available from at least two manufacturers.
• Recommendations will be developed using best practice examples of design and technology, modeled using up-to-date performance and cost inputs.
• Focus will be given to illustrate how to use integrated design concepts, design process, and team working relationships to minimize the cost of implementation for AEDG recommendations.
Case Studies A number of case studies will be included to provide examples of both whole-building integrated design concepts and the implementation of energy-efficient components or techniques. In many instances, case studies will be specific to particular geographic regions (as in the 30% AEDG).
Scope The 50% AEDG for medium-box retail buildings, representing a progression of the 30% AEDG series with respect to energy-efficient design guidelines, will provide prescriptive and performance-based paths to achieving 50% site energy savings in medium-box retail buildings. Energy savings will be measured against “baseline” or “reference” buildings for each climate that are minimally code-compliant with respect to ASHRAE Standard 90.1-2004.
For the purposes of this 50% AEDG, we define a medium-box retail building as having the following common space types:
• Sales areas • Administrative and office areas • Meeting and dining areas • Hallways and restrooms • Storage spaces and mechanical/electrical rooms
The 50% AEDG for medium-box retail buildings will apply primarily to retail buildings with 20,000 ft² to 100,000 ft² of floor area; however, many of the recommendations will apply to smaller and larger retail buildings as well. Recommendations will be based on the medium-box

94 This report is available at no cost from the National Renewable Energy Laboratory (NREL) at www.nrel.gov/publications.
retail prototype design from the 50% General Merchandise TSD (Hale et al. 2009). Whole-building models adapted from the prototype designs will be equipped with HVAC systems designed to meet minimum ventilation requirements and maintain ASHRAE comfort standards year-round.
Design recommendations will apply to the following building aspects:
• Opaque envelope and exterior glazing • Lighting and daylighting systems • HVAC system design and components • Building automation and control systems • Treatment of outside air, including energy recovery systems, and dehumidification
systems • Service water heating (SWH) for bathrooms and dining areas • Plug and process loads • Commissioning
Design recommendations will not be provided for building aspects considered out of the scope of this task, including:
• Commercial refrigeration equipment • Domestic water well pumping • Sewage disposal
The guide is not intended to substitute for rating systems or references that address the full range of sustainable issues in retail buildings, such as acoustics, productivity, indoor air quality, water efficiency, landscaping, and transportation, except as they relate to operational energy consumption. Nor will this guide be a design text; we assume that good design skills and expertise in retail building design, in particular, will be required to successfully apply the design recommendations of the guide.

95 This report is available at no cost from the National Renewable Energy Laboratory (NREL) at www.nrel.gov/publications.
Appendix B. Project Committee Meeting Agendas B.1 Meeting 1
Medium-Big Box Retail Advanced Energy Design Guide 50% Energy Savings
Project Committee Meeting 1 Agenda
ASHRAE Headquarters 1791 Tullie Circle Atlanta, GA 30329
404-636-8400
Friday, April 15, 2011, 8:00AM – 5:00PM Saturday, April 16, 2011, 8:00AM – 1:30PM
The Marriott Courtyard serves breakfast to guests. You should have received a breakfast coupon when you checked in with your ASHRAE rate. We can meet in the breakfast area informally at 7:00AM for breakfast. We will identify a place to have dinner as a group on Friday night. Lunches will be brought in by ASHRAE.
Pre meeting action items
• Review scoping document • Review 30% AEDGs • Be prepared to share the energy efficiency strategies that you have used in retail stores • Bring calendars for this summer/fall • Bring case studies to share
Meeting objectives
• Common understanding of the scope • Define development process and integration with energy modeling • Identify team member experiences and roles • Define general concept on what it takes to get to 50% savings in a retail store • Form working groups and section assignments
Agenda Friday, April 15, 2011
1 Welcome/review agenda Pless 8:00 2 Introductions
• Give name/affiliation and experience • Be ready to share the energy efficiency strategies that
you have used (what do you think it takes to get to 50% energy savings)
All 8:15
3 AEDG-MBBR overview • Organization of AEDG series • Committee makeup structure/partnering organization • Scoping document formation • Reference case determination
Pratt/Pless 9:15

96 This report is available at no cost from the National Renewable Energy Laboratory (NREL) at www.nrel.gov/publications.
4 Review and questions on scoping document • Context of the other AEDGs • Goals and objectives of the AEDG-MBBR • Target audience • Review of scoping document • Peer review process
Pratt/Pless 9:30
5 Break All 10:00 6 AEDG-MBBR development schedule
Future meeting schedule • Bring your calendars for this summer/fall
Pratt/Pless 10:15
7 Outline of AEDG-MBBR • Review outline of previous guides • Discuss possible modifications/changes
How will this guide be unique? • What will be different about this guide? • What new information will be provided?
Assignments of staff to guide sections • Identify section leaders and section contributors
Pratt/Pless 10:45
8 Lunch All 12:00 9 ASHRAE headquarters tour All 12:45 10 Energy modeling
• Analysis engine and modeling background • Baseline building discussion • Preliminary modeling results • Plans for modeling going forward
How to use model results to develop the guide? What additional modeling can we do?
Bonnema 1:30
11 Break All 3:00 12 Group breakout
• Lighting/daylighting • Architecture, envelope, and integrated design • HVAC • O&M, commissioning
All 3:15
Saturday, April 16, 2011
1 Group breakout Groups 8:00 2 Break All 10:15 3 Group breakout Groups 10:45 4 Working lunch (discuss case studies)
• Bring case studies to share All 12:00
5 Review • Group breakout sessions • Action items for next meeting
All 1:00
6 Adjourn All 1:30

97 This report is available at no cost from the National Renewable Energy Laboratory (NREL) at www.nrel.gov/publications.
B.2 Meeting 2 Medium-Big Box Retail Advanced Energy Design Guide
50% Energy Savings Project Committee Meeting 2 Agenda
ASHRAE Headquarters 1791 Tullie Circle Atlanta, GA 30329
404-636-8400
Sunday, May 15, 2011, 8:00AM – 5:00PM Monday, May 16, 2011, 8:00AM – 2:00PM
The Marriott Courtyard serves breakfast to guests. You should have received a breakfast coupon when you checked in with your ASHRAE rate. We can meet in the breakfast area informally at 7:00AM for breakfast. We will identify a place to have dinner as a group on Sunday night. Lunches will be brought in by ASHRAE.
Pre meeting action items
• Complete action items from 4/29/11 conference call • Bring case studies to share
Meeting objectives
• Everyone should have all the information they need to complete the first draft by May 30.
Agenda Sunday, May 15, 2011
1 Welcome/review agenda Pless 8:00 2 Review action items from 4/29/11 conference call All 8:15 3 Section updates
• Foreword – Williams • Integrated design – Pless • Lighting – Lane, Bauer • HVAC – Nall, Marriott • Envelope – McBride
All 8:30
4 Recommendation table review • Any changes to the content or structure?
Leach 9:00
5 Modeling Update Leach 9:15 6 Break All 10:00 7 Group breakout
• Lighting/daylighting • Architecture, envelope, and integrated design • HVAC • O&M, commissioning
Pratt/Pless 10:15
8 Lunch All 12:00 9 Group breakout
• Lighting/daylighting All 1:00
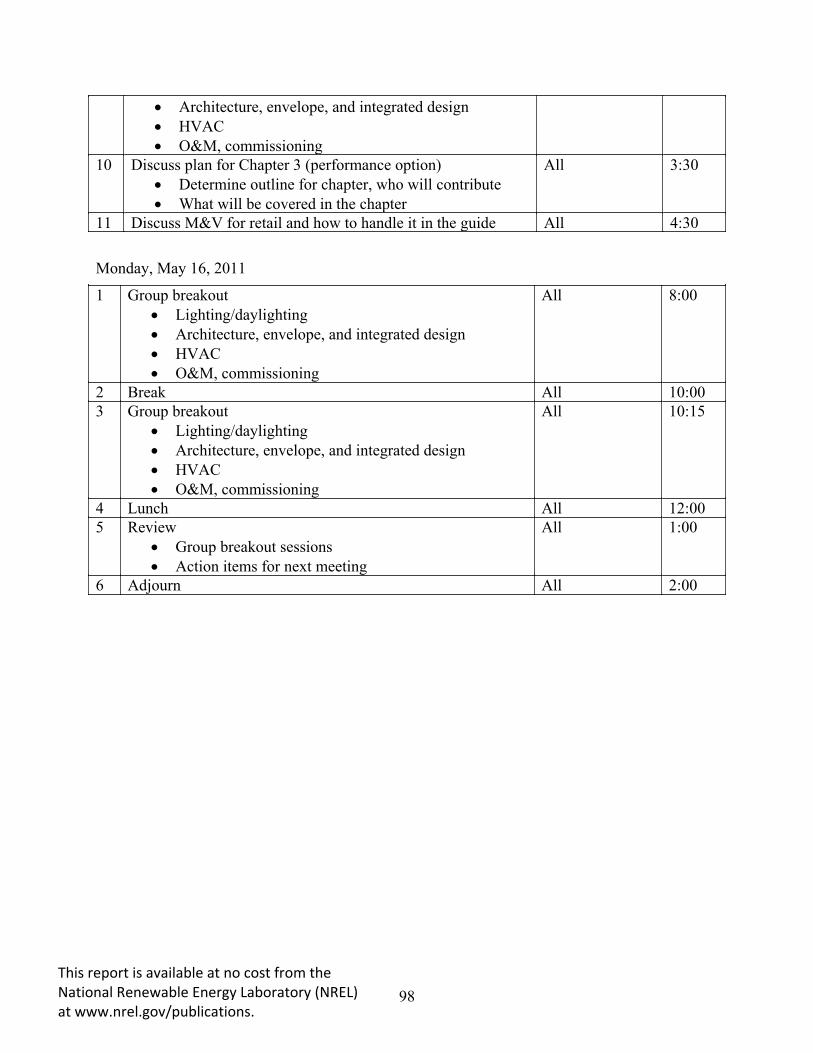
98 This report is available at no cost from the National Renewable Energy Laboratory (NREL) at www.nrel.gov/publications.
• Architecture, envelope, and integrated design • HVAC • O&M, commissioning
10 Discuss plan for Chapter 3 (performance option) • Determine outline for chapter, who will contribute • What will be covered in the chapter
All 3:30
11 Discuss M&V for retail and how to handle it in the guide All 4:30
Monday, May 16, 2011
1 Group breakout • Lighting/daylighting • Architecture, envelope, and integrated design • HVAC • O&M, commissioning
All 8:00
2 Break All 10:00 3 Group breakout
• Lighting/daylighting • Architecture, envelope, and integrated design • HVAC • O&M, commissioning
All 10:15
4 Lunch All 12:00 5 Review
• Group breakout sessions • Action items for next meeting
All 1:00
6 Adjourn All 2:00

99 This report is available at no cost from the National Renewable Energy Laboratory (NREL) at www.nrel.gov/publications.
B.3 Meeting 3 Medium-Big Box Retail Advanced Energy Design Guide
50% Energy Savings Project Committee Meeting 3 Agenda
Target® Headquarters 1000 Nicollet Mall
Minneapolis, MN 55403 612-304-6073
Friday, July 15, 2011, 8:00AM – 5:00PM Saturday, July 16, 2011, 8:00AM – 4:00PM
The hotels that folks are staying at have restaurants nearby or on site, please get whatever level of breakfast you would like on your own. We will meet in the lobby of the Double Tree at 7:45AM and walk to Target Headquarters together both days. Since this is a small group, we are going to go to the Target Headquarters cafe for lunch on Friday and someplace close by for lunch on Saturday. We will identify a place to have dinner as a group on Friday night.
Pre meeting action items
• Review comments assigned to each member and prepare responses to discuss at the meeting
• Conduct detailed review of the first draft • Bring case studies that you would like to include in the guide
Meeting objectives
• Address and document responses to remarks • Identify holes in the draft
• Assign case studies to PC members • Develop action item list to get next draft completed by COB Wednesday July 20
• Conference call Friday July 22, 2:30 pm EDT to discuss progress • “Final” deadline COB Wednesday July 27 • Draft posted August 1
Agenda Friday, July 15, 2011
1 Welcome/review agenda • Next meeting in Denver August 29-30 • Conference call Friday August 19, 2:30 pm EDT to
discuss progress for the meeting • Revisions due COB Wednesday September 7 for
action items generated during the second meeting • Conference call Friday September 9, 2:30 pm EDT to
discuss progress towards final draft
Pless 8:00
2 Review general draft remarks and determine responses • Overall observations
Pratt 8:15

100 This report is available at no cost from the National Renewable Energy Laboratory (NREL) at www.nrel.gov/publications.
• Problems based on first look? • Major holes in draft? • Major additions needed?
3 Break All 9:45 4 Break into chapter groups and talk with Target subject matter
experts (Cheryl Penkivech: Lighting, Ed Doyle: Architecture) • Are there any issues with our recommendations that
we may be overlooking? • Real-life problems they run into? • Other discussion topics?
All 10:00
5 Review recommendation table as a group • Any oversights? Additions necessary?
Pless/Leach 11:30
6 Lunch All 12:00 7 Comments on Meeting 2 minutes All 1:00 8 Old action items review and update Pratt 1:15 9 Retail store and technology case study assignments Pless 1:45 10 Discuss simulation results Leach 2:00 11 Break – Tour Target® store All interested 2:30 12 Break into chapter groups to address specific remarks and
work on solutions to remarks All 3:30
13 Break for the day All 4:00
Saturday, July 16, 2011
1 Break into chapter groups to address specific remarks and work on solutions to remarks
All 8:00
2 Break All 10:00 3 Break into chapter groups to address specific remarks and
work on solutions to remarks All 10:15
4 Lunch All 12:00 5 Break into chapter groups to address specific remarks and
work on solutions to remarks All 1:00
6 Adjourn All 4:00

101 This report is available at no cost from the National Renewable Energy Laboratory (NREL) at www.nrel.gov/publications.
B.4 Meeting 4 Medium-Big Box Retail Advanced Energy Design Guide
50% Energy Savings Project Committee Meeting 4 Agenda
NREL Research Support Facility 15301 Denver West Parkway
Golden, CO 80401 303-275-3000
Monday, August 29, 2011, 8:00AM – 5:00PM Tuesday, August 30, 2011, 8:00AM – 2:00PM
Continental breakfast will be served each morning at 7:45 at NREL. On Monday, please meet in the hotel lobby at 7:30 to ride in a shuttle to the NREL visitor’s center to be badged. The badges are good for two days, so we can leave the hotel at 7:45 on Tuesday. We will identify a place to have dinner as a group on Monday night. Lunches will be brought in by NREL.
Pre meeting action items
• Conduct detailed review of the second draft • Review comments assigned to each member and prepare responses to discuss at the
meeting • Bring any additional case studies that you would like to include in the guide
Meeting objectives
• Address and document responses to remarks • Identify holes in the draft
• Acknowledgements • Adding how-to tips references to the tables • Complete all bibliographical reference information
• Develop action item list to get 95% draft completed by September 7
Agenda Monday, August 29, 2011
1 Welcome/review agenda Pless 8:00 2 Cover pictures (decide on 2-3 for front, 12 or so for back)
• One shot on the front of whole building • Three shots on the back, more freedom here
Pratt/All 8:15
3 Graphics – schedule, content, and process Pratt 8:30 4 Old action item review and update Pratt 8:45 5 Case studies
• More whole building case studies • Technology examples (daylighting, HVAC, others?)
Bonnema 9:15
6 Break All 9:45 7 Final energy modeling results Leach 10:00 8 Review general draft remarks and determine responses
• Overall observations Pratt 10:30

102 This report is available at no cost from the National Renewable Energy Laboratory (NREL) at www.nrel.gov/publications.
• Problems based on first look? Major holes in draft? 9 Lunch All 12:00 10 Break into chapter groups to address specific remarks and
work on solutions to remarks All 1:00
11 Break All 3:00 12 Break into chapter groups to address specific remarks and
work on solutions to remarks All 3:15
13 Break for the day All 5:00
Tuesday, August 30, 2011
1 Review final schedule for completion of the document • Schedule conference call times
Pratt 8:00
2 Galley proof review process Pratt 9:00 3 Break All 10:00 4 Break into chapter groups to address specific remarks and
work on solutions to remarks All 10:15
5 Meeting summary review • Define the work that will need to be done • Define the timing for getting everything done
All 11:00
6 Lunch All 12:00 7 Break into chapter groups to address specific remarks and
work on solutions to remarks All 1:00
8 Adjourn All 2:00
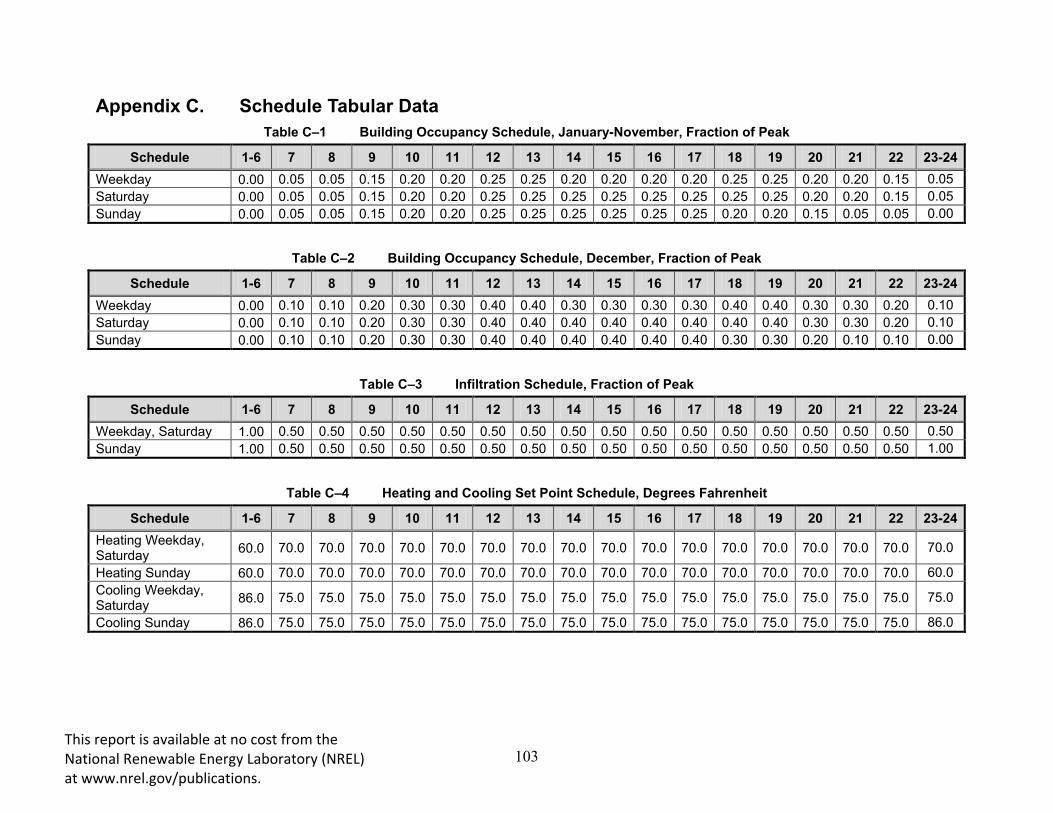
103
Appendix C. Schedule Tabular Data Table C–1 Building Occupancy Schedule, January-November, Fraction of Peak
Schedule 1-6 7 8 9 10 11 12 13 14 15 16 17 18 19 20 21 22 23-24 Weekday 0.00 0.05 0.05 0.15 0.20 0.20 0.25 0.25 0.20 0.20 0.20 0.20 0.25 0.25 0.20 0.20 0.15 0.05 Saturday 0.00 0.05 0.05 0.15 0.20 0.20 0.25 0.25 0.25 0.25 0.25 0.25 0.25 0.25 0.20 0.20 0.15 0.05 Sunday 0.00 0.05 0.05 0.15 0.20 0.20 0.25 0.25 0.25 0.25 0.25 0.25 0.20 0.20 0.15 0.05 0.05 0.00
Table C–2 Building Occupancy Schedule, December, Fraction of Peak
Schedule 1-6 7 8 9 10 11 12 13 14 15 16 17 18 19 20 21 22 23-24 Weekday 0.00 0.10 0.10 0.20 0.30 0.30 0.40 0.40 0.30 0.30 0.30 0.30 0.40 0.40 0.30 0.30 0.20 0.10 Saturday 0.00 0.10 0.10 0.20 0.30 0.30 0.40 0.40 0.40 0.40 0.40 0.40 0.40 0.40 0.30 0.30 0.20 0.10 Sunday 0.00 0.10 0.10 0.20 0.30 0.30 0.40 0.40 0.40 0.40 0.40 0.40 0.30 0.30 0.20 0.10 0.10 0.00
Table C–3 Infiltration Schedule, Fraction of Peak
Schedule 1-6 7 8 9 10 11 12 13 14 15 16 17 18 19 20 21 22 23-24 Weekday, Saturday 1.00 0.50 0.50 0.50 0.50 0.50 0.50 0.50 0.50 0.50 0.50 0.50 0.50 0.50 0.50 0.50 0.50 0.50 Sunday 1.00 0.50 0.50 0.50 0.50 0.50 0.50 0.50 0.50 0.50 0.50 0.50 0.50 0.50 0.50 0.50 0.50 1.00
Table C–4 Heating and Cooling Set Point Schedule, Degrees Fahrenheit
Schedule 1-6 7 8 9 10 11 12 13 14 15 16 17 18 19 20 21 22 23-24 Heating Weekday, Saturday 60.0 70.0 70.0 70.0 70.0 70.0 70.0 70.0 70.0 70.0 70.0 70.0 70.0 70.0 70.0 70.0 70.0 70.0
Heating Sunday 60.0 70.0 70.0 70.0 70.0 70.0 70.0 70.0 70.0 70.0 70.0 70.0 70.0 70.0 70.0 70.0 70.0 60.0 Cooling Weekday, Saturday 86.0 75.0 75.0 75.0 75.0 75.0 75.0 75.0 75.0 75.0 75.0 75.0 75.0 75.0 75.0 75.0 75.0 75.0
Cooling Sunday 86.0 75.0 75.0 75.0 75.0 75.0 75.0 75.0 75.0 75.0 75.0 75.0 75.0 75.0 75.0 75.0 75.0 86.0
This report is available at no cost from the National Renewable Energy Laboratory (NREL) at www.nrel.gov/publications.

104
Table C–5 Baseline Lighting Schedule, Fraction of Peak
Schedule 1-6 7 8 9 10 11 12 13 14 15 16 17 18 19 20 21 22 23-24 Weekday, Saturday 0.10 0.50 0.50 0.50 0.90 0.90 0.90 0.90 0.90 0.90 0.90 0.90 0.90 0.90 0.90 0.90 0.50 0.10 Sunday 0.10 0.50 0.50 0.50 0.90 0.90 0.90 0.90 0.90 0.90 0.90 0.90 0.90 0.90 0.50 0.50 0.50 0.10
Table C–6 Baseline Electric Equipment Schedule, Fraction of Peak
Schedule 1-6 7 8 9 10 11 12 13 14 15 16 17 18 19 20 21 22 23-24 Weekday, Saturday 0.40 0.60 0.60 0.60 0.90 0.90 0.90 0.90 0.90 0.90 0.90 0.90 0.90 0.90 0.90 0.90 0.60 0.60 Sunday 0.40 0.60 0.60 0.60 0.90 0.90 0.90 0.90 0.90 0.90 0.90 0.90 0.90 0.90 0.60 0.60 0.60 0.40
Table C–7 Low-Energy Lighting Schedule, Fraction of Peak
Schedule 1-6 7 8 9 10 11 12 13 14 15 16 17 18 19 20 21 22 23-24 Weekday, Saturday 0.00 0.16 0.16 0.16 0.90 0.90 0.90 0.90 0.90 0.90 0.90 0.90 0.90 0.90 0.90 0.90 0.16 0.16 Sunday 0.00 0.16 0.16 0.16 0.90 0.90 0.90 0.90 0.90 0.90 0.90 0.90 0.90 0.90 0.90 0.90 0.16 0.00
Table C–8 Low-Energy Electric Equipment Schedule, Fraction of Peak
Schedule 1-6 7 8 9 10 11 12 13 14 15 16 17 18 19 20 21 22 23-24 Weekday, Saturday 0.10 0.60 0.60 0.60 0.90 0.90 0.90 0.90 0.90 0.90 0.90 0.90 0.90 0.90 0.90 0.90 0.60 0.60 Sunday 0.10 0.60 0.60 0.60 0.90 0.90 0.90 0.90 0.90 0.90 0.90 0.90 0.90 0.90 0.60 0.60 0.60 0.10
This report is available at no cost from the National Renewable Energy Laboratory (NREL) at www.nrel.gov/publications.

105 This report is available at no cost from the National Renewable Energy Laboratory (NREL) at www.nrel.gov/publications.
Appendix D. Energy Management System Code The EnergyPlus EMS code in this section uses the following variables:
• CleanSystemName: this refers to the name of the air system serving the zone. This is the same as the system name, except all illegal characters (spaces, etc.) are removed so that the system name can be used as a variable
• SystemName: this refers to the name of the air system serving the zone • ZoneName: the name of the zone being served by the system
D.1 VAV Supply Air Temperature Reset This EMS code determined the supply air temperature of the VAV system. !- Sensors EnergyManagementSystem:Sensor, #(CleanSystemName)_OA_Enth, Environment, Outdoor Enthalpy; EnergyManagementSystem:Sensor, #(CleanSystemName)_OA_Tdb, Environment, Outdoor Dry Bulb; EnergyManagementSystem:Sensor, #(CleanSystemName)_Pb, Environment, Outdoor Barometric Pressure; EnergyManagementSystem:Sensor, #(CleanSystemName)_RA_Enth, #(SystemName) Supply Equipment Inlet Node, System Node Enthalpy; EnergyManagementSystem:Sensor, #(CleanSystemName)_Heat_Load, #(ZoneName), Zone/Sys Sensible Load to Heating Setpoint Predicted; EnergyManagementSystem:Sensor, #(CleanSystemName)_FanFraction, #(ZoneName) VAV Box Component, VAV Terminal Damper Position; EnergyManagementSystem:Sensor, #(CleanSystemName)_MinFlowFraction, #(ZoneName) VAV Box Component, VAV Terminal Minimum Air Flow Fraction; EnergyManagementSystem:Sensor, #(CleanZoneName)_RH, #(ZoneName), Zone Air Relative Humidity; EnergyManagementSystem:Sensor, #(CleanZoneName)_Tdb,

106 This report is available at no cost from the National Renewable Energy Laboratory (NREL) at www.nrel.gov/publications.
#(ZoneName), Zone/Sys Air Temperature; EnergyManagementSystem:Sensor, #(CleanSystemName)_ClgSetP, ClgSetP_Sch, Schedule Value; EnergyManagementSystem:Sensor, #(CleanSystemName)_SAT, VAV_SAT_Schedule, Schedule Value; EnergyManagementSystem:Sensor, #(CleanSystemName)_SAT_Econ, VAV_Econ_SAT_Schedule, Schedule Value; !- Trend Variables EnergyManagementSystem:TrendVariable, #(CleanSystemName)_FanFractionLog, #(CleanSystemName)_FanFraction, 4; !- Global Variables EnergyManagementSystem:GlobalVariable, #(CleanSystemName)_SAT_Value; !- Actuators EnergyManagementSystem:Actuator, #(CleanSystemName)_SAT_Sch_Act, #(SystemName)_SAT_Sch, Schedule:Compact, Schedule Value; EnergyManagementSystem:Actuator, #(CleanSystemName)_Fan_Sch_Act, #(SystemName)_Fan_Sch, Schedule:Compact, Schedule Value; EnergyManagementSystem:Actuator, #(CleanZoneName)_PTAC_Fan_Sch_Act, #(ZoneName)_PTAC_Fan_Sch, Schedule:Compact, Schedule Value; !- Calling Managers EnergyManagementSystem:ProgramCallingManager, #(CleanSystemName)_Initialize_Globals_Call, BeginNewEnvironment, #(CleanSystemName)_Initialize_Globals; EnergyManagementSystem:ProgramCallingManager, #(CleanSystemName)_SAT_Reset_Call, AfterPredictorBeforeHVACManagers, #(CleanSystemName)_SAT_Reset;
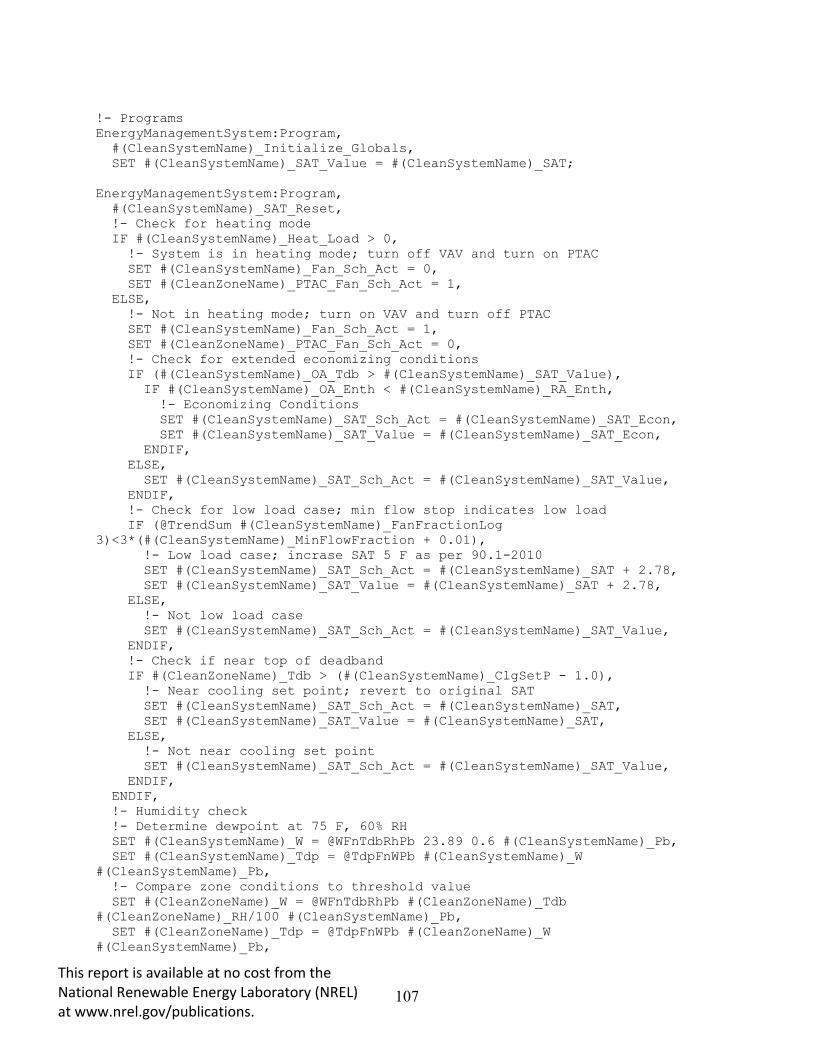
107 This report is available at no cost from the National Renewable Energy Laboratory (NREL) at www.nrel.gov/publications.
!- Programs EnergyManagementSystem:Program, #(CleanSystemName)_Initialize_Globals, SET #(CleanSystemName)_SAT_Value = #(CleanSystemName)_SAT; EnergyManagementSystem:Program, #(CleanSystemName)_SAT_Reset, !- Check for heating mode IF #(CleanSystemName)_Heat_Load > 0, !- System is in heating mode; turn off VAV and turn on PTAC SET #(CleanSystemName)_Fan_Sch_Act = 0, SET #(CleanZoneName)_PTAC_Fan_Sch_Act = 1, ELSE, !- Not in heating mode; turn on VAV and turn off PTAC SET #(CleanSystemName)_Fan_Sch_Act = 1, SET #(CleanZoneName)_PTAC_Fan_Sch_Act = 0, !- Check for extended economizing conditions IF (#(CleanSystemName)_OA_Tdb > #(CleanSystemName)_SAT_Value), IF #(CleanSystemName)_OA_Enth < #(CleanSystemName)_RA_Enth, !- Economizing Conditions SET #(CleanSystemName)_SAT_Sch_Act = #(CleanSystemName)_SAT_Econ, SET #(CleanSystemName)_SAT_Value = #(CleanSystemName)_SAT_Econ, ENDIF, ELSE, SET #(CleanSystemName)_SAT_Sch_Act = #(CleanSystemName)_SAT_Value, ENDIF, !- Check for low load case; min flow stop indicates low load IF (@TrendSum #(CleanSystemName)_FanFractionLog 3)<3*(#(CleanSystemName)_MinFlowFraction + 0.01), !- Low load case; incrase SAT 5 F as per 90.1-2010 SET #(CleanSystemName)_SAT_Sch_Act = #(CleanSystemName)_SAT + 2.78, SET #(CleanSystemName)_SAT_Value = #(CleanSystemName)_SAT + 2.78, ELSE, !- Not low load case SET #(CleanSystemName)_SAT_Sch_Act = #(CleanSystemName)_SAT_Value, ENDIF, !- Check if near top of deadband IF #(CleanZoneName)_Tdb > (#(CleanSystemName)_ClgSetP - 1.0), !- Near cooling set point; revert to original SAT SET #(CleanSystemName)_SAT_Sch_Act = #(CleanSystemName)_SAT, SET #(CleanSystemName)_SAT_Value = #(CleanSystemName)_SAT, ELSE, !- Not near cooling set point SET #(CleanSystemName)_SAT_Sch_Act = #(CleanSystemName)_SAT_Value, ENDIF, ENDIF, !- Humidity check !- Determine dewpoint at 75 F, 60% RH SET #(CleanSystemName)_W = @WFnTdbRhPb 23.89 0.6 #(CleanSystemName)_Pb, SET #(CleanSystemName)_Tdp = @TdpFnWPb #(CleanSystemName)_W #(CleanSystemName)_Pb, !- Compare zone conditions to threshold value SET #(CleanZoneName)_W = @WFnTdbRhPb #(CleanZoneName)_Tdb #(CleanZoneName)_RH/100 #(CleanSystemName)_Pb, SET #(CleanZoneName)_Tdp = @TdpFnWPb #(CleanZoneName)_W #(CleanSystemName)_Pb,

108 This report is available at no cost from the National Renewable Energy Laboratory (NREL) at www.nrel.gov/publications.
IF #(CleanZoneName)_Tdp > #(CleanSystemName)_Tdp, !- High humidity case; set SAT to default SET #(CleanSystemName)_SAT_Sch_Act = #(CleanSystemName)_SAT, SET #(CleanSystemName)_SAT_Value = #(CleanSystemName)_SAT, ELSE, !- Not high humidity SET #(CleanSystemName)_SAT_Sch_Act = #(CleanSystemName)_SAT_Value, ENDIF;
D.2 Energy Recovery Ventilator/Evaporative Cooler Selector This EMS code switched between an ERV and an evaporative cooler to model using an evaporative cooler and a sensible heat exchanger. !- Sensors EnergyManagementSystem:Sensor, #(CleanSystemName)_Warm_Season, Warm_Season_Sch, Schedule Value; EnergyManagementSystem:Sensor, #(CleanSystemName)_Cold_Season, Cold_Season_Sch, Schedule Value; !- Internal Variables EnergyManagementSystem:InternalVariable, #(CleanSystemName)_FanSP, #(SystemName)_Fan, Fan Nominal Pressure Rise; !- Actuators EnergyManagementSystem:Actuator, #(CleanSystemName)_FanSP_Act, #(SystemName)_Fan, Fan, Fan Pressure Rise; !- Calling Manager EnergyManagementSystem:ProgramCallingManager, #(CleanSystemName)_ERV_IDEC_Control_Call, AfterPredictorBeforeHVACManagers, #(CleanSystemName)_ERV_IDEC_Control; !- Program EnergyManagementSystem:Program, #(CleanSystemName)_ERV_IDEC_Control, !- Name SET #(CleanSystemName)_ERV_SP = #(CleanSystemName)_Cold_Season * 253, SET #(CleanSystemName)_IDEC_SP = #(CleanSystemName)_Warm_Season * 295, SET #(CleanSystemName)_FanSP_Act = #(CleanSystemName)_FanSP + #(CleanSystemName)_ERV_SP, SET #(CleanSystemName)_FanSP_Act = #(CleanSystemName)_FanSP_Act + #(CleanSystemName)_IDEC_SP;