technical seminar on outsourcing sweeteners testing validation... · 2017-09-12 · initial method...
TRANSCRIPT

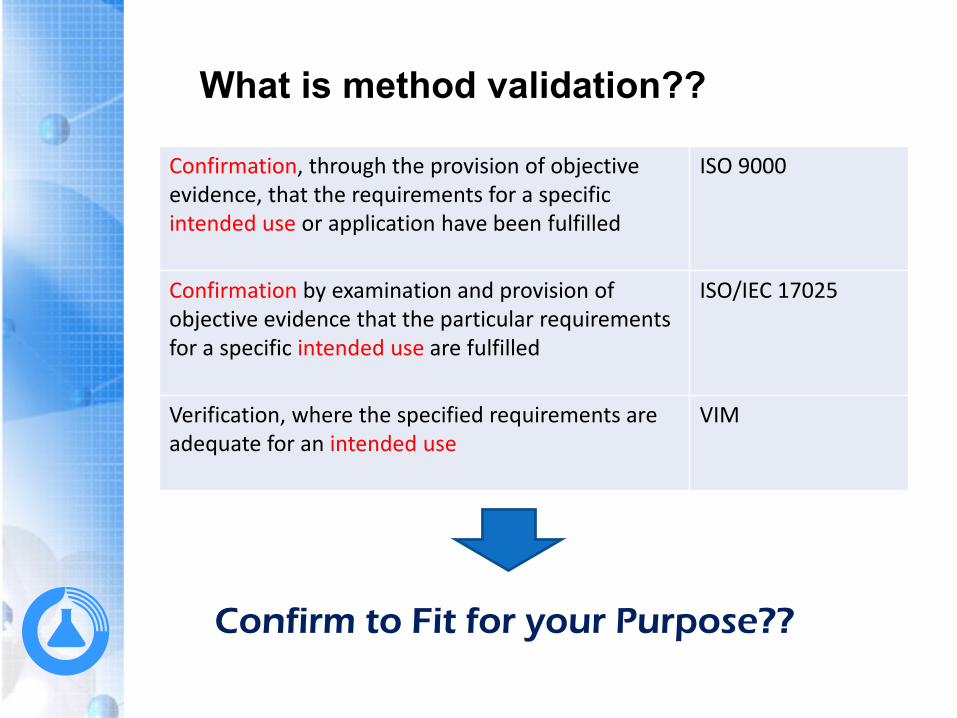
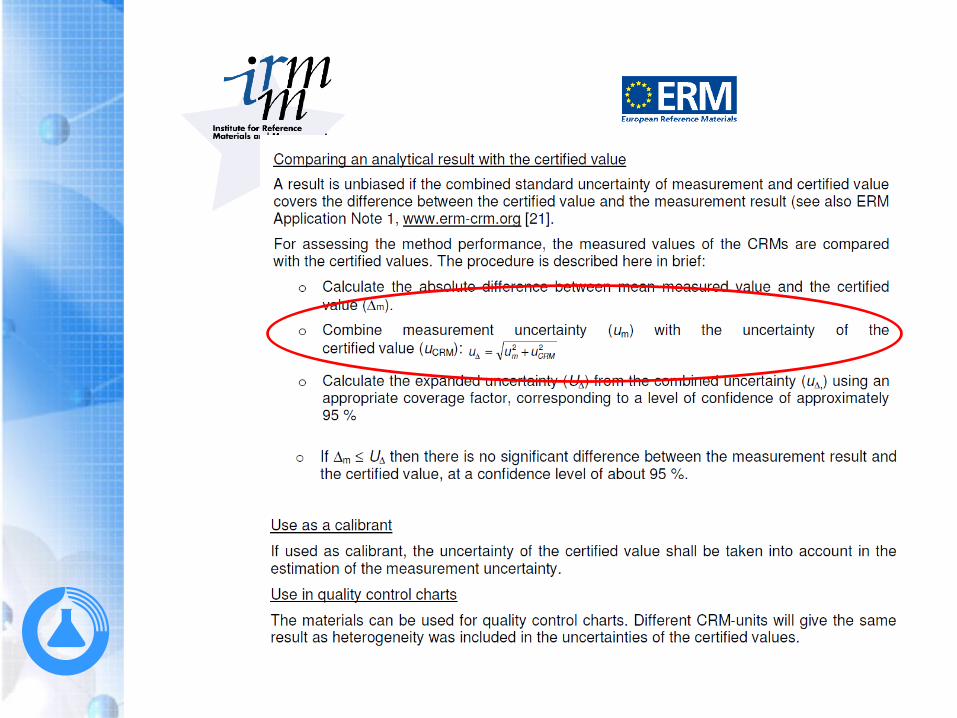
Confirm to Fit for your Purpose??
What is method validation??
Confirmation, through the provision of objective evidence, that the requirements for a specific intended use or application have been fulfilled
ISO 9000
Confirmation by examination and provision of objective evidence that the particular requirementsfor a specific intended use are fulfilled
ISO/IEC 17025
Verification, where the specified requirements are adequate for an intended use
VIM
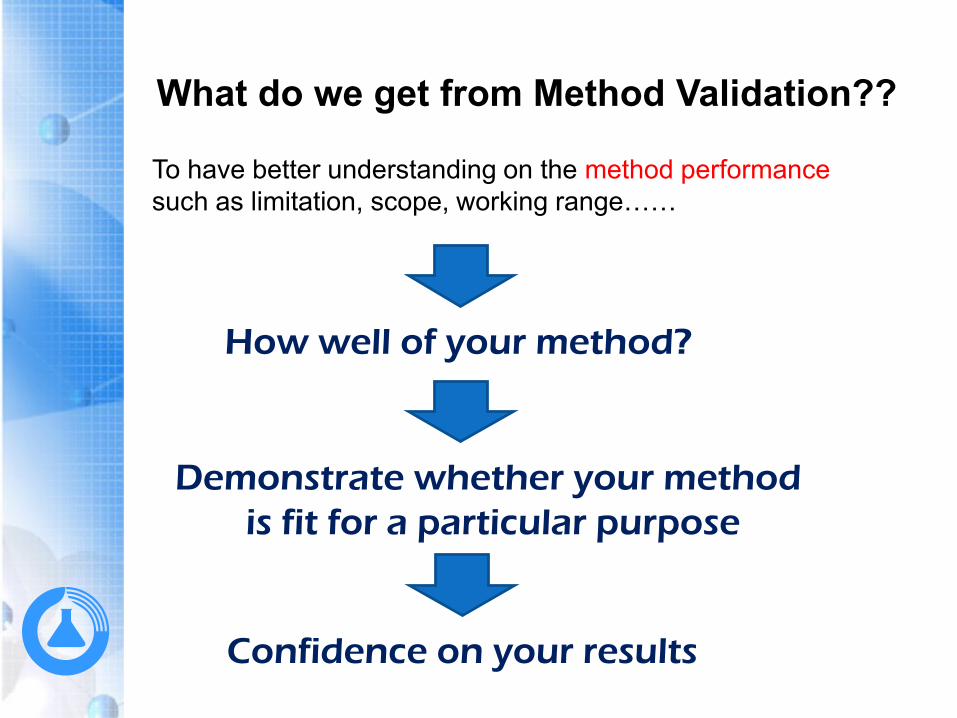
What do we get from Method Validation??
To have better understanding on the method performance
such as limitation, scope, working range……
How well of your method?
Demonstrate whether your method
is fit for a particular purpose
Confidence on your results

When I need to have Method Validation??
ISO/IEC 17025
Non-standard methods;
Laboratory-designed /developed methods;
Standard methods used outside their intended scope;
Amplifications and modifications of standard methods.
NATA Technical Note 17
For facilities involved in medical testing, elements of methods
endorsed “research use only” or “not for diagnostic”.
Eurachem
Validation is also required when it is necessary to demonstrate
the equivalence of results obtained by two methods, e.g. a
newly developed method and an existing standard / regulatory
method.
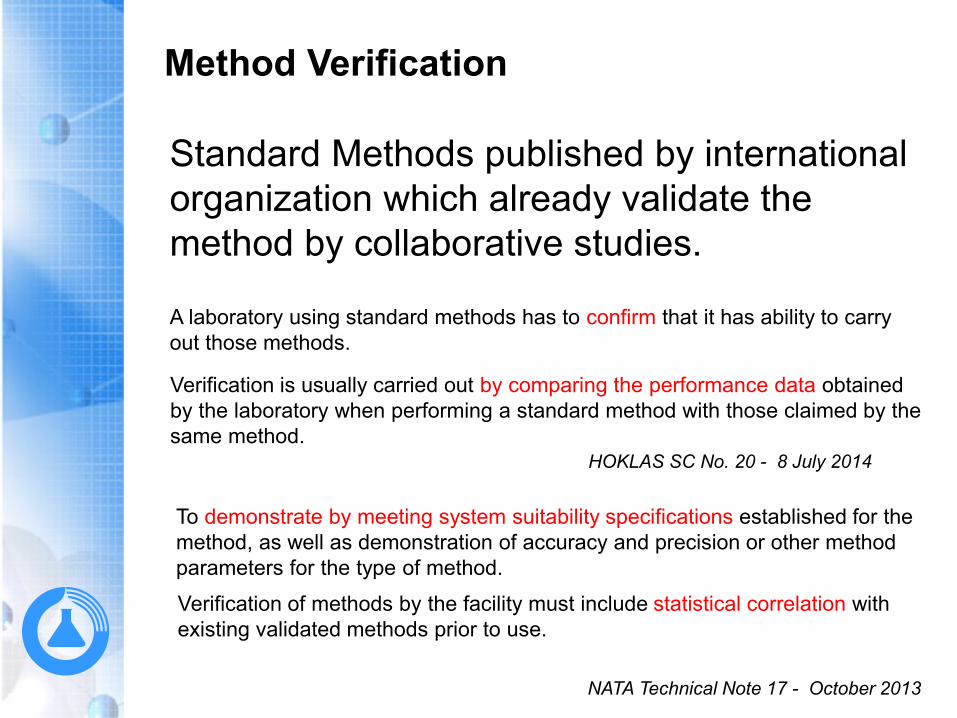
Method Verification
NATA Technical Note 17 - October 2013
To demonstrate by meeting system suitability specifications established for the
method, as well as demonstration of accuracy and precision or other method
parameters for the type of method.
Standard Methods published by international
organization which already validate the
method by collaborative studies.
Verification of methods by the facility must include statistical correlation with
existing validated methods prior to use.
A laboratory using standard methods has to confirm that it has ability to carry
out those methods.
Verification is usually carried out by comparing the performance data obtained
by the laboratory when performing a standard method with those claimed by the
same method.HOKLAS SC No. 20 - 8 July 2014
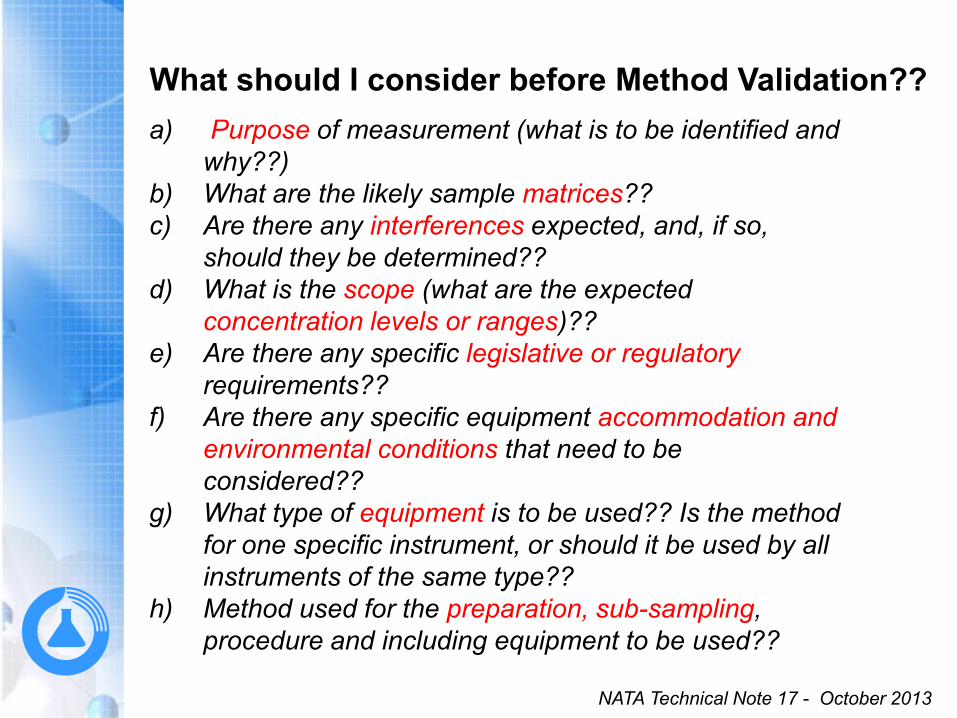
What should I consider before Method Validation??
a) Purpose of measurement (what is to be identified and
why??)
b) What are the likely sample matrices??
c) Are there any interferences expected, and, if so,
should they be determined??
d) What is the scope (what are the expected
concentration levels or ranges)??
e) Are there any specific legislative or regulatory
requirements??
f) Are there any specific equipment accommodation and
environmental conditions that need to be
considered??
g) What type of equipment is to be used?? Is the method
for one specific instrument, or should it be used by all
instruments of the same type??
h) Method used for the preparation, sub-sampling,
procedure and including equipment to be used??
NATA Technical Note 17 - October 2013
Detection Limit / Quantitation Limit
Linearity and Range
Sensitivity
Selectivity
Accuracy
Precision
Ruggedness
Measurement Uncertainty
Method Performance Characteristics
NATA Technical Note 17 - October 2013
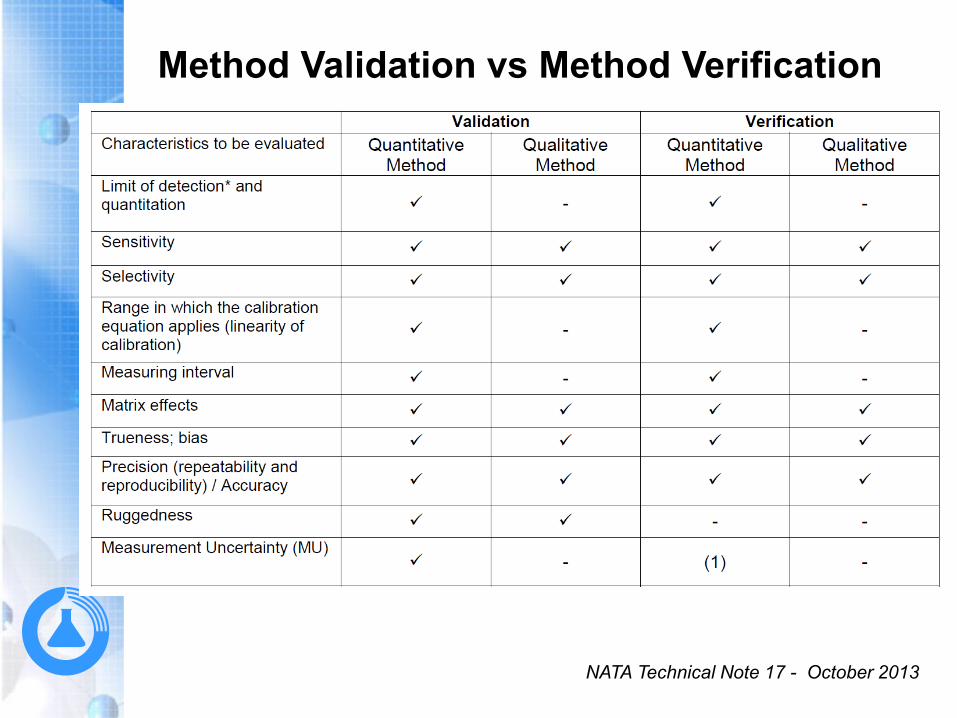
Method Validation vs Method Verification
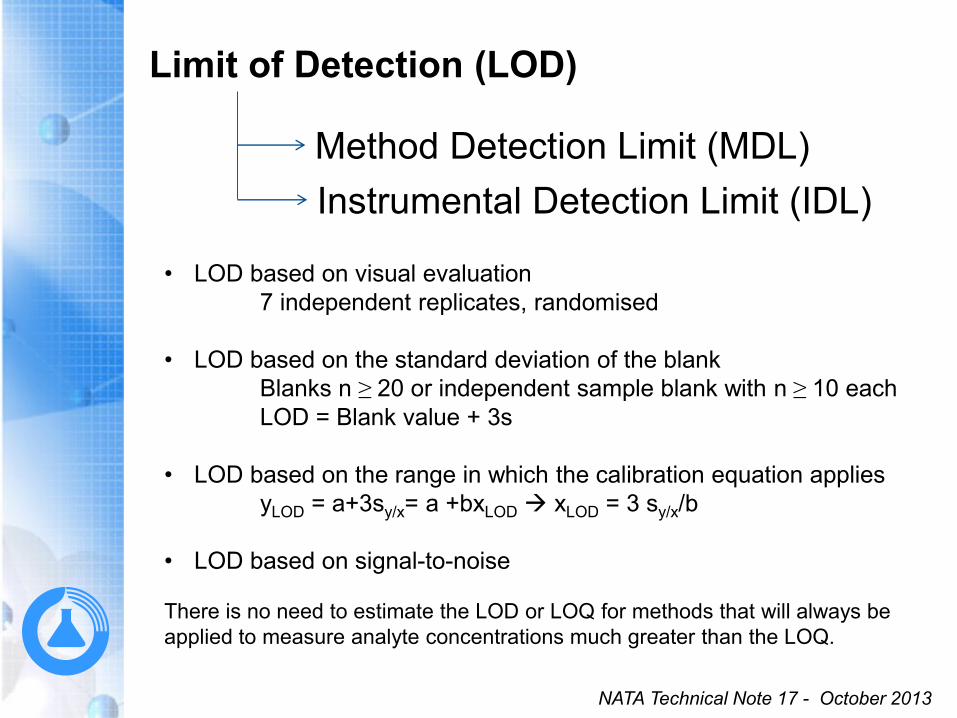
Limit of Detection (LOD)
Method Detection Limit (MDL)
Instrumental Detection Limit (IDL)
• LOD based on visual evaluation
7 independent replicates, randomised
• LOD based on the standard deviation of the blank
Blanks n ≥ 20 or independent sample blank with n ≥ 10 each
LOD = Blank value + 3s
• LOD based on the range in which the calibration equation applies
yLOD = a+3sy/x= a +bxLOD xLOD = 3 sy/x/b
• LOD based on signal-to-noise
There is no need to estimate the LOD or LOQ for methods that will always be
applied to measure analyte concentrations much greater than the LOQ.
NATA Technical Note 17 - October 2013
Eurachem -The Fitness for Purpose of Analytical Methods, 2014
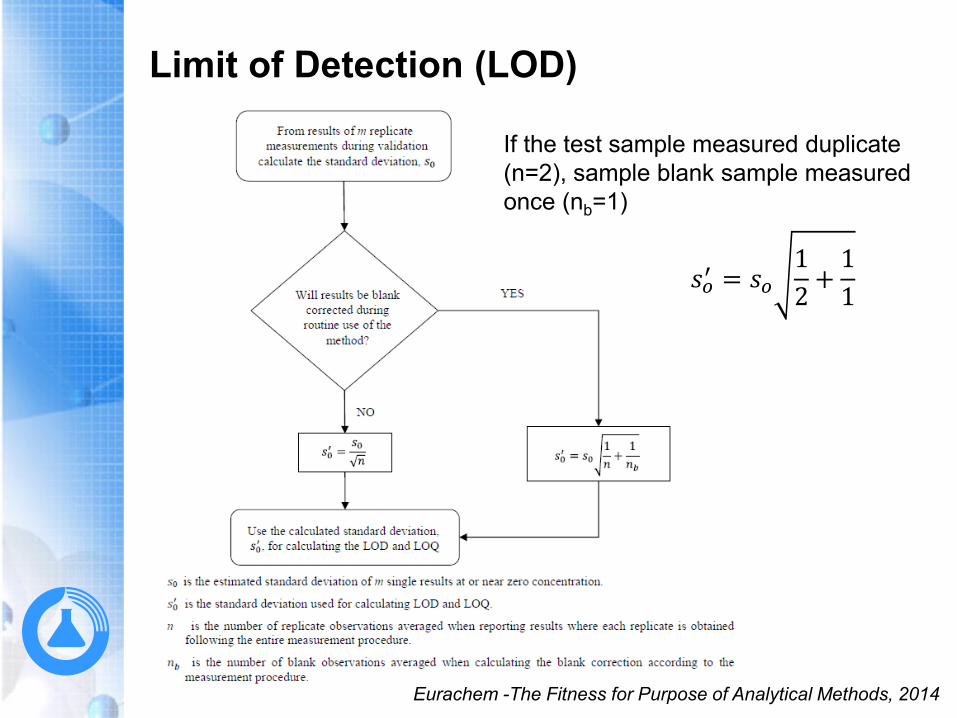
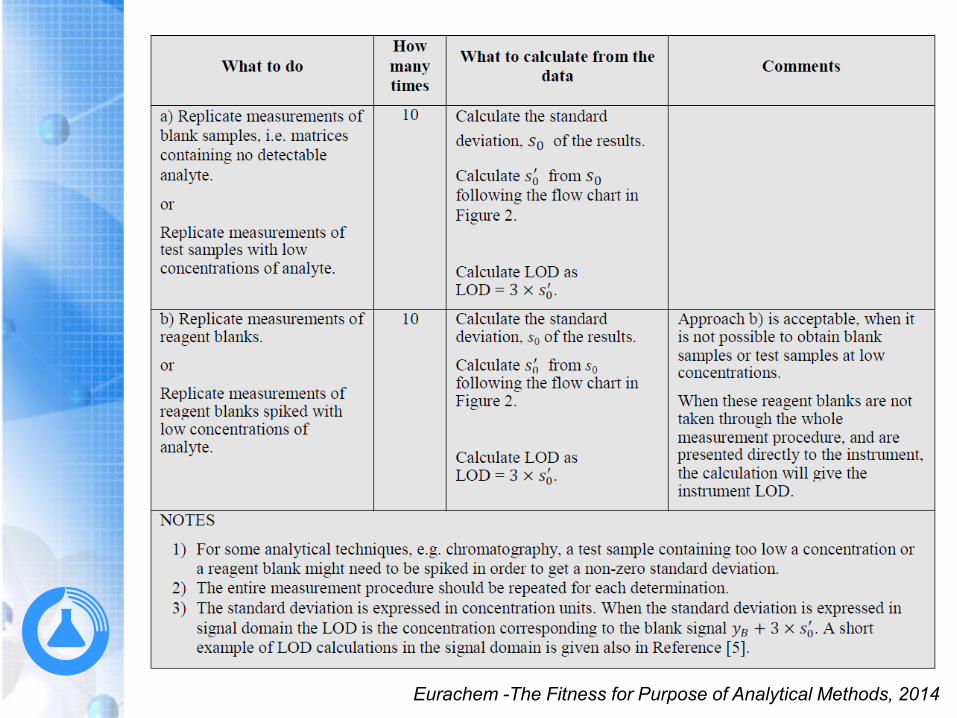
Limit of Detection (LOD)
Eurachem -The Fitness for Purpose of Analytical Methods, 2014
If the test sample measured duplicate
(n=2), sample blank sample measured
once (nb=1)
𝑠𝑜′ = 𝑠𝑜
1
2+1
1

False Positive Rate and False Negative Rate
Limit of Detection (LOD) for qualitative test
Eurachem -The Fitness for Purpose of Analytical Methods, 2014
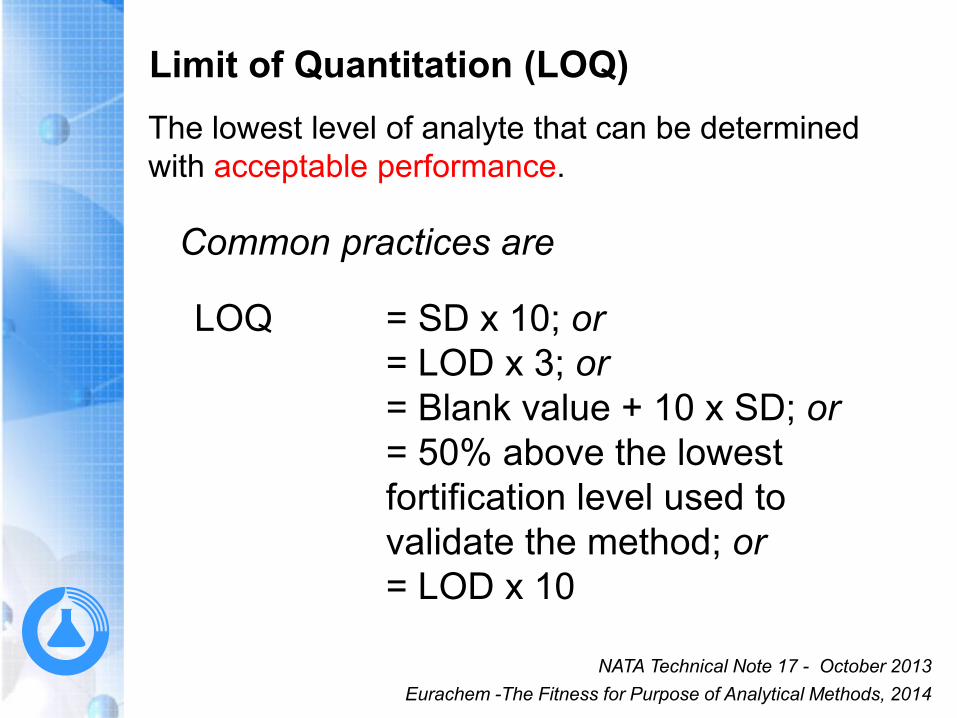
Limit of Quantitation (LOQ)
Common practices are
LOQ = SD x 10; or
= LOD x 3; or
= Blank value + 10 x SD; or
= 50% above the lowest
fortification level used to
validate the method; or
= LOD x 10
Eurachem -The Fitness for Purpose of Analytical Methods, 2014
NATA Technical Note 17 - October 2013
The lowest level of analyte that can be determined
with acceptable performance.
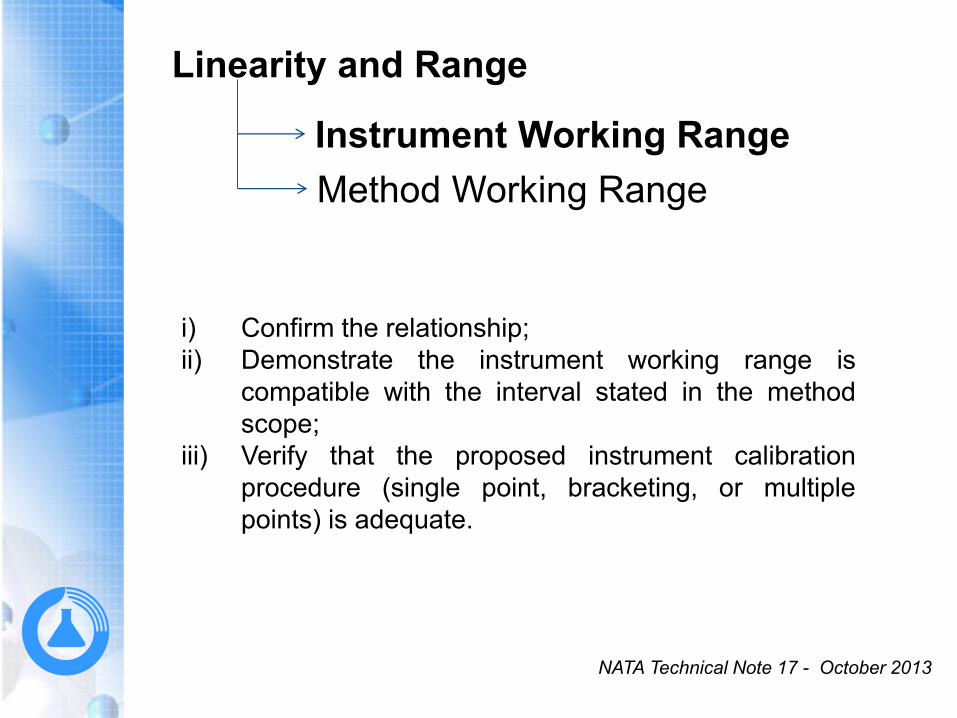
Linearity and Range
i) Confirm the relationship;
ii) Demonstrate the instrument working range is
compatible with the interval stated in the method
scope;
iii) Verify that the proposed instrument calibration
procedure (single point, bracketing, or multiple
points) is adequate.
Instrument Working Range
Method Working Range
NATA Technical Note 17 - October 2013

The following parameters should be considered:
Correlation coefficient (r)
Residual plot
Calibration Curve
- Six calibration solution including blank or close to blank
- Evenly spaced over the range of interest
- The range should encompress 0-150% or 50-150% of the
concentration likely to be encountered (or concentration span
that exceeds the expected concentration range by ± 10% or
even ± 20%)
- The calibration standards should be run at least in duplicate
and preferably triplicate or more, in random order.
y = 1.112x + 0.0435R² = 0.9995
0
0.1
0.2
0.3
0.4
0.5
0.6
0.7
0.8
0.9
0.00 0.20 0.40 0.60 0.80
-0.015
-0.01
-0.005
0
0.005
0.01
0.00 0.20 0.40 0.60 0.80Residuals
X Variable 1
X Variable 1 Residual Plot
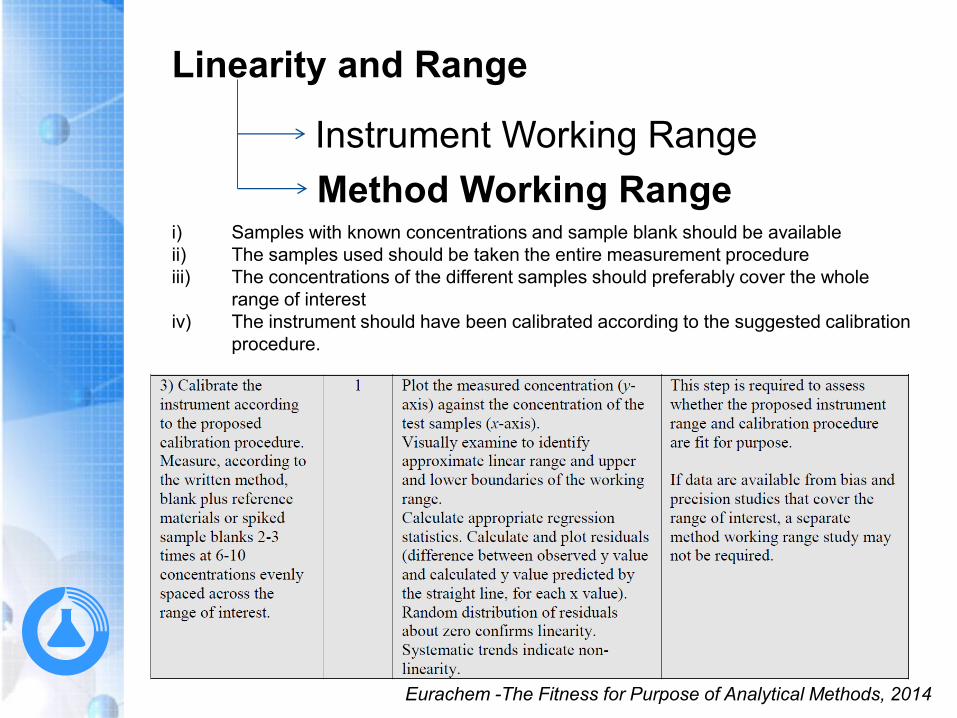
Linearity and Range
Instrument Working Range
Method Working Rangei) Samples with known concentrations and sample blank should be available
ii) The samples used should be taken the entire measurement procedure
iii) The concentrations of the different samples should preferably cover the whole
range of interest
iv) The instrument should have been calibrated according to the suggested calibration
procedure.
Eurachem -The Fitness for Purpose of Analytical Methods, 2014
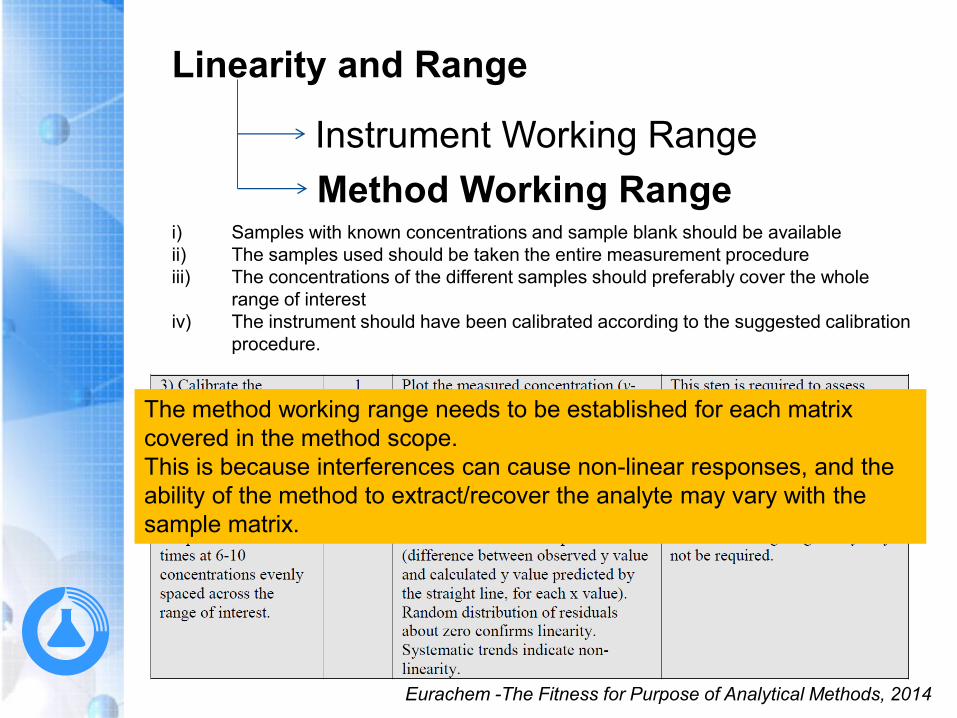
Linearity and Range
Instrument Working Range
Method Working Rangei) Samples with known concentrations and sample blank should be available
ii) The samples used should be taken the entire measurement procedure
iii) The concentrations of the different samples should preferably cover the whole
range of interest
iv) The instrument should have been calibrated according to the suggested calibration
procedure.
The method working range needs to be established for each matrix
covered in the method scope.
This is because interferences can cause non-linear responses, and the
ability of the method to extract/recover the analyte may vary with the
sample matrix.
Eurachem -The Fitness for Purpose of Analytical Methods, 2014
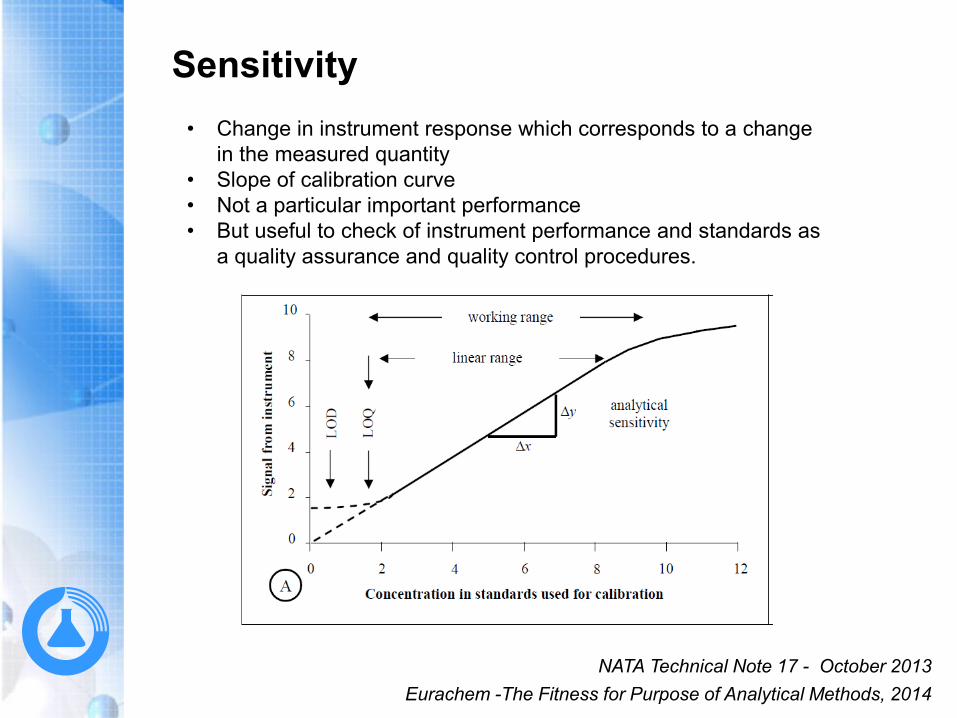
Sensitivity
• Change in instrument response which corresponds to a change
in the measured quantity
• Slope of calibration curve
• Not a particular important performance
• But useful to check of instrument performance and standards as
a quality assurance and quality control procedures.
Eurachem -The Fitness for Purpose of Analytical Methods, 2014
NATA Technical Note 17 - October 2013
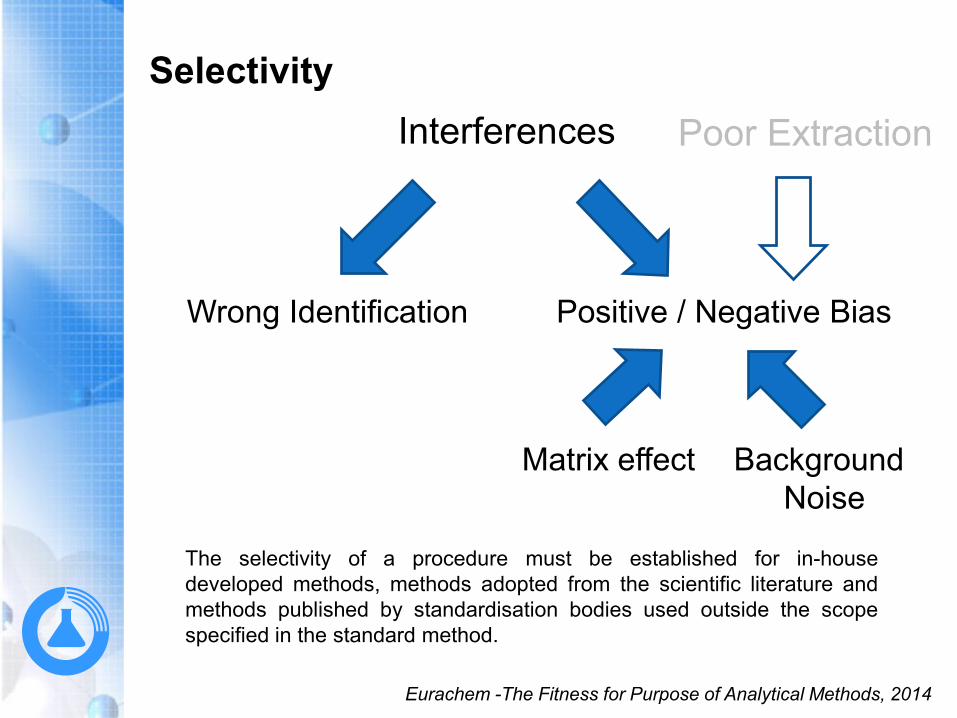
Interferences
Wrong Identification Positive / Negative Bias
Matrix effect Background
Noise
Selectivity
The selectivity of a procedure must be established for in-house
developed methods, methods adopted from the scientific literature and
methods published by standardisation bodies used outside the scope
specified in the standard method.
Eurachem -The Fitness for Purpose of Analytical Methods, 2014
Poor Extraction
Selectivity
Eurachem -The Fitness for Purpose of Analytical Methods, 2014
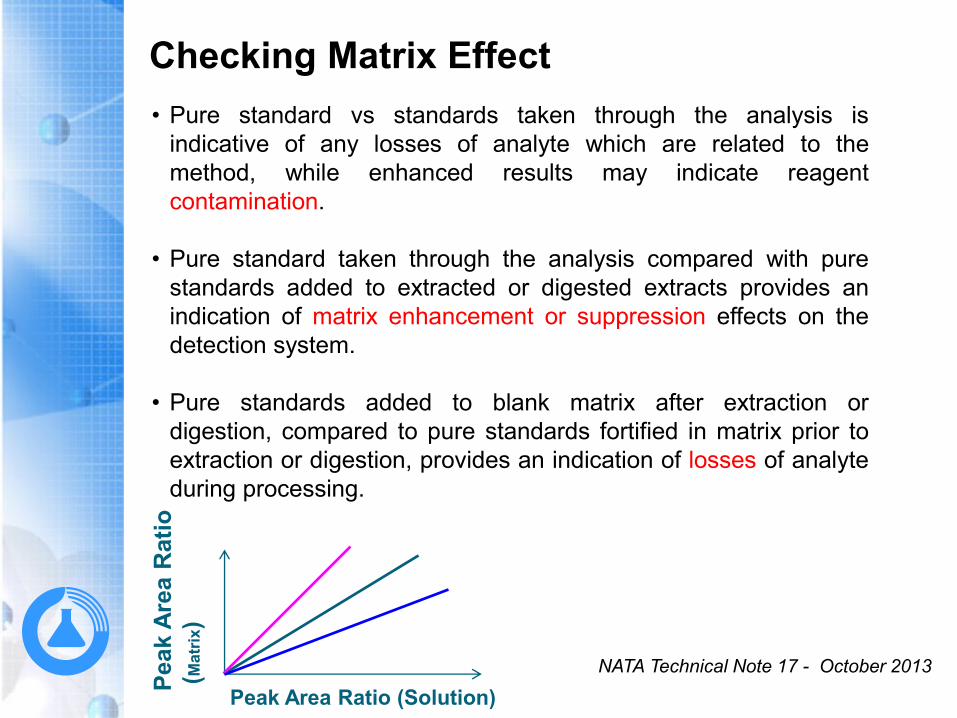
Checking Matrix Effect
• Pure standard vs standards taken through the analysis is
indicative of any losses of analyte which are related to the
method, while enhanced results may indicate reagent
contamination.
• Pure standard taken through the analysis compared with pure
standards added to extracted or digested extracts provides an
indication of matrix enhancement or suppression effects on the
detection system.
• Pure standards added to blank matrix after extraction or
digestion, compared to pure standards fortified in matrix prior to
extraction or digestion, provides an indication of losses of analyte
during processing.
NATA Technical Note 17 - October 2013
Peak A
rea R
ati
o
(Ma
trix
)
Peak Area Ratio (Solution)
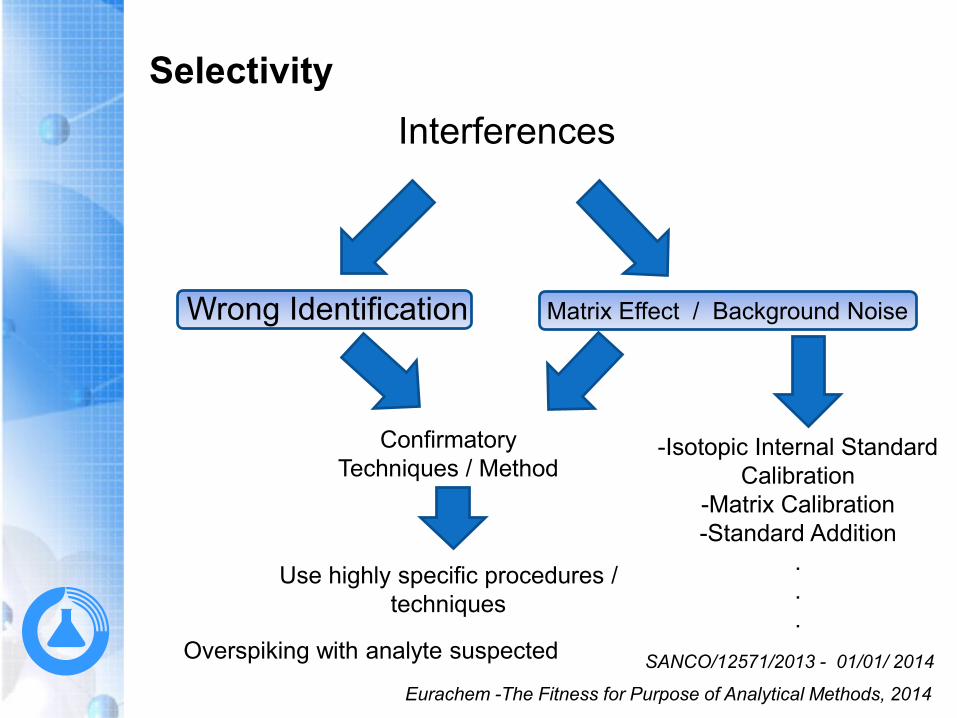
Interferences
Wrong Identification
Use highly specific procedures /
techniques
Confirmatory
Techniques / Method
Matrix Effect / Background Noise
Selectivity
Eurachem -The Fitness for Purpose of Analytical Methods, 2014
-Isotopic Internal Standard
Calibration
-Matrix Calibration
-Standard Addition
.
.
.
Overspiking with analyte suspectedSANCO/12571/2013 - 01/01/ 2014
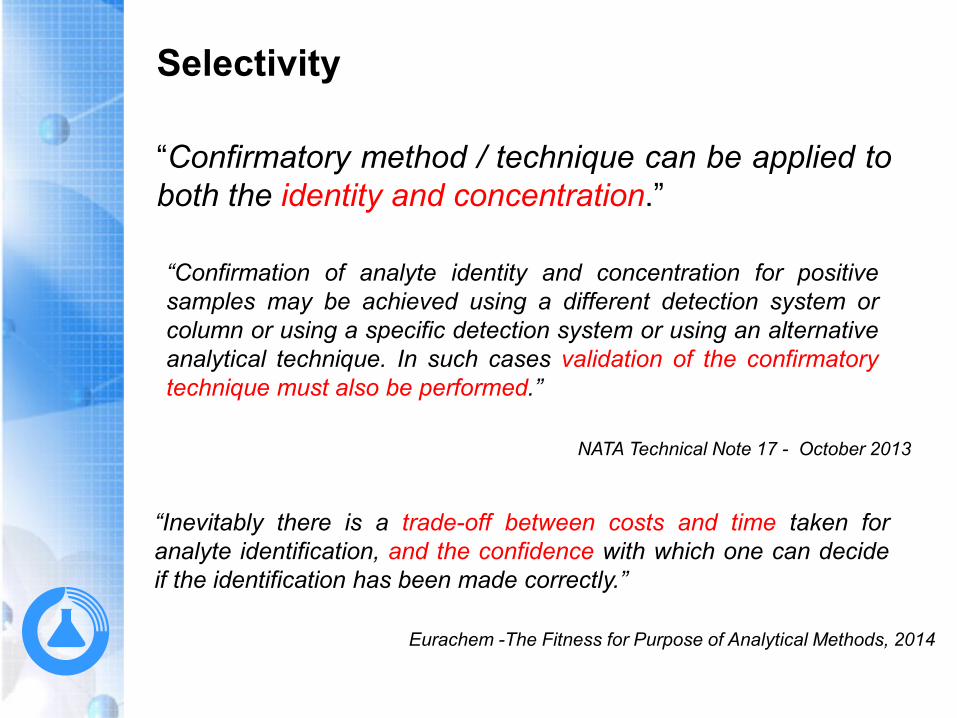
Selectivity
“Confirmatory method / technique can be applied to
both the identity and concentration.”
“Inevitably there is a trade-off between costs and time taken for
analyte identification, and the confidence with which one can decide
if the identification has been made correctly.”
Eurachem -The Fitness for Purpose of Analytical Methods, 2014
NATA Technical Note 17 - October 2013
“Confirmation of analyte identity and concentration for positive
samples may be achieved using a different detection system or
column or using a specific detection system or using an alternative
analytical technique. In such cases validation of the confirmatory
technique must also be performed.”

• EU (2002/657/EC)
• Requirement
• ID point (Identification Point) and Ion Ratio.
Selectivity
The variability of ion ratios should preferably be determined from calibration standards during the
initial method validation and subsequently during routine analysis. In certain cases, these data may
be used to set performance-based criterial, for individual analyte, rater than applying the fixed,
generic criteria given in Table 5.SANCO/12571/2013 - 01/01/ 2014

Selectivity
Clenbuterol in Pork LC-MS/MS analysis
Ion ratio determined by
277203 (q) and 277132
Standards Ion ration 0.328
with %RSD 2.95%
Method A by enzymatic digestion
with column A
Ion ratio 0.380
(within 30% of tolerance)
Results by quantifying 277203 7.94 ppb
Method B by perchlorate digestion
with column A
Ion ratio 0.331
Results by quantifying 227203 5.49 ppb
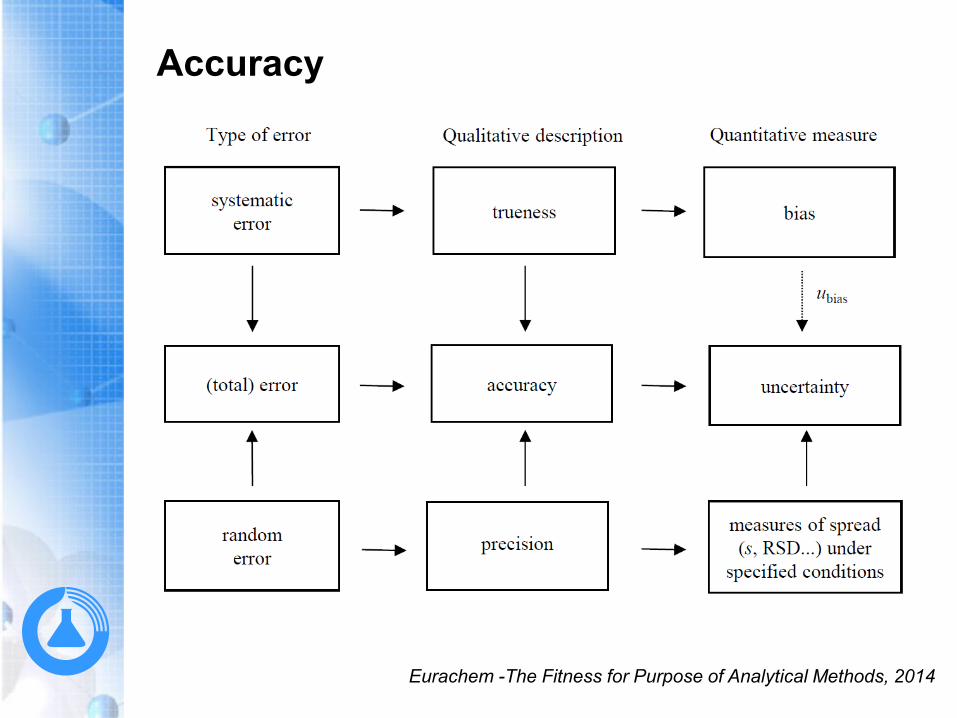
Accuracy
Eurachem -The Fitness for Purpose of Analytical Methods, 2014

Bias
Three general approaches:
i) Analysis of certified reference materials /
reference materials
ii) Recovery experiments using spiked samples
iii) Comparison with results obtained with another
method
To take account any variation between runs, bias must be determined
over several days and preferably throughout the measuring range
and, if applicable, through the use of a suitable combination of
different specimens.
Several concentration levels must be incorporated in the
determination of bias. Otherwise the facility must be able to prove
that the method of analysis employed has the same trueness
throughout the measuring range.
Eurachem -The Fitness for Purpose of Analytical Methods, 2014
NATA Technical Note 17 - October 2013
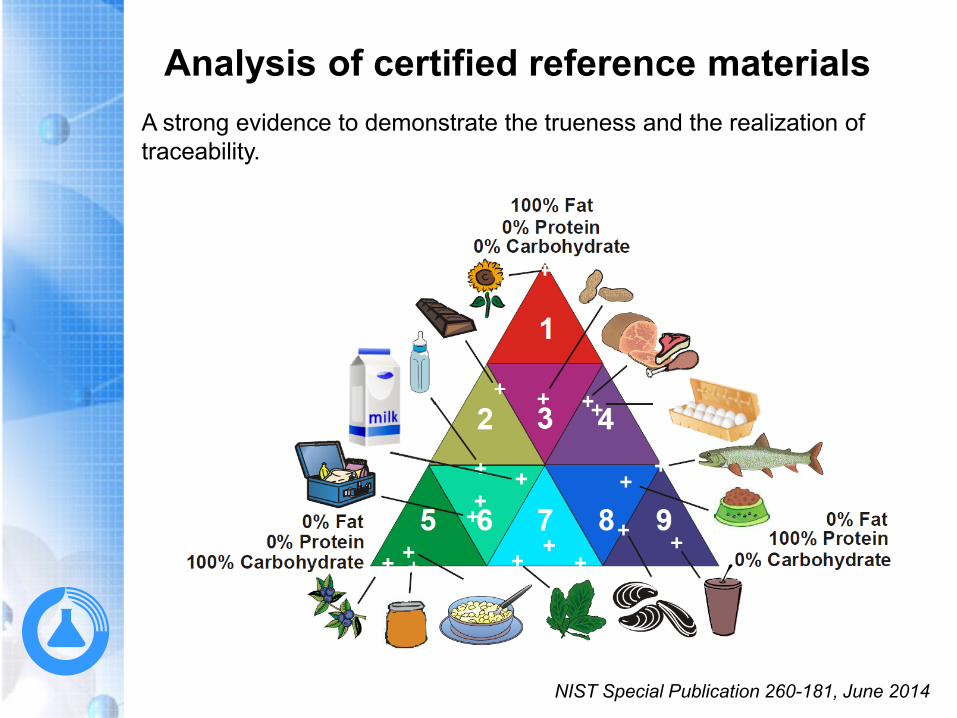
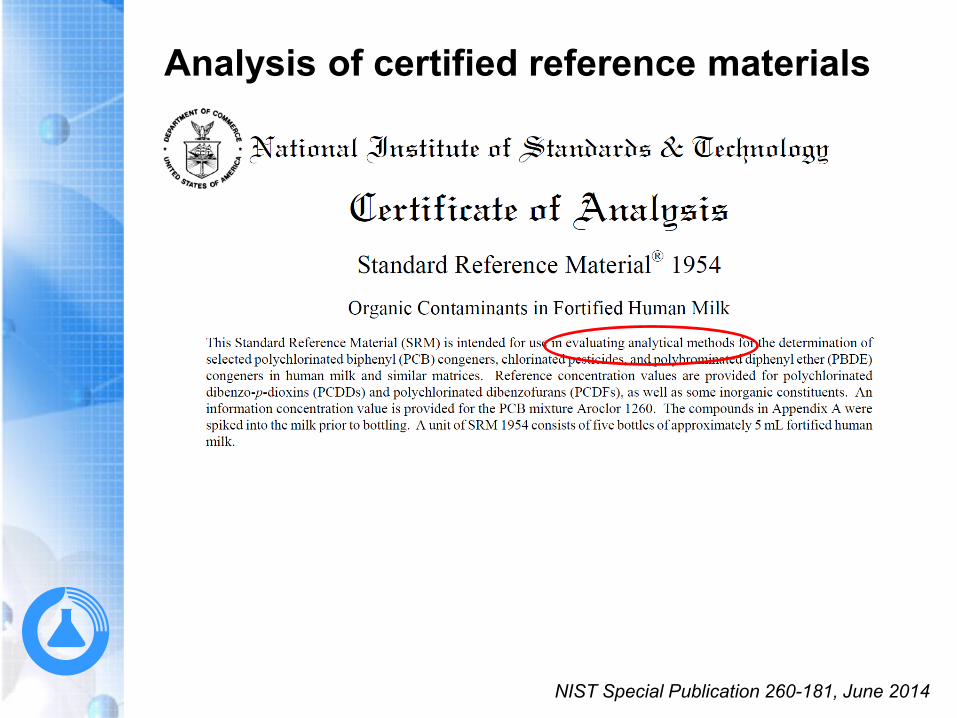
Analysis of certified reference materials
NIST Special Publication 260-181, June 2014
A strong evidence to demonstrate the trueness and the realization of
traceability.
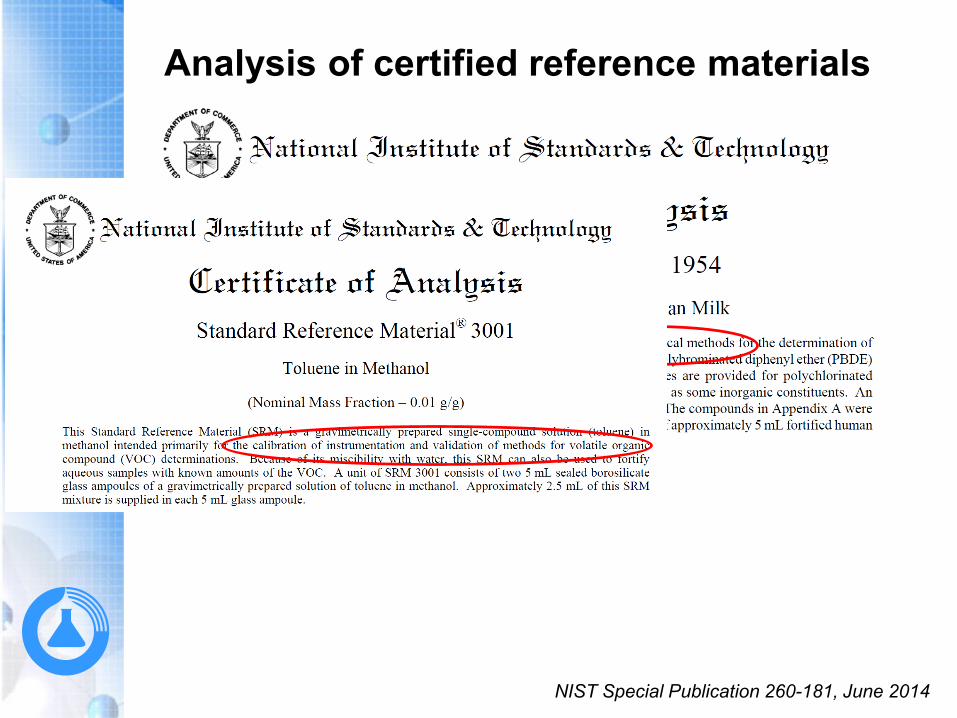
Analysis of certified reference materials
NIST Special Publication 260-181, June 2014
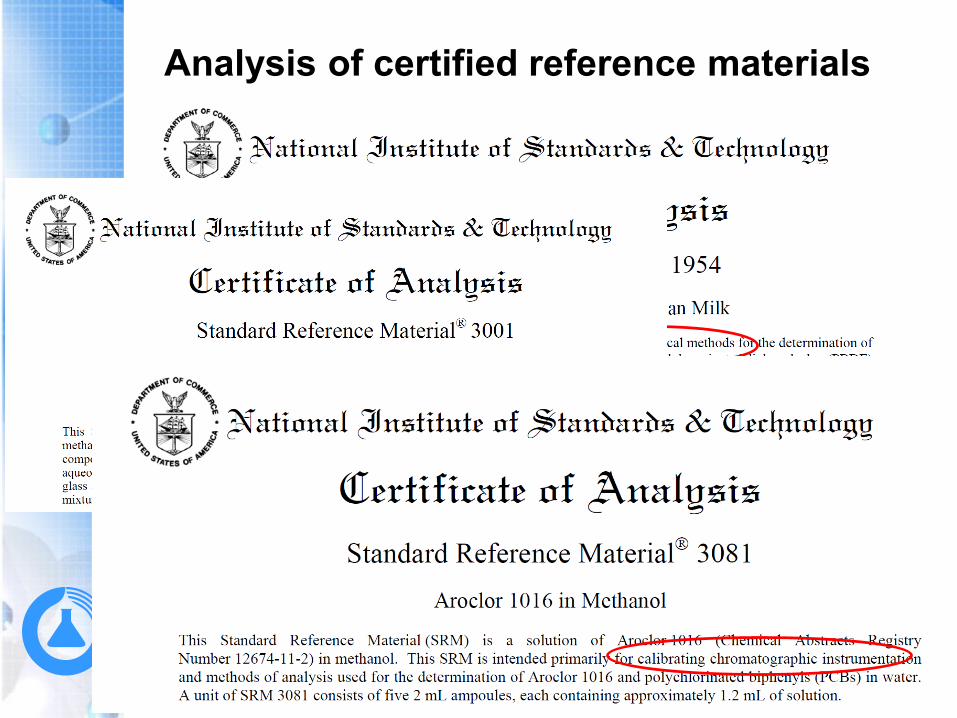
Analysis of certified reference materials
NIST Special Publication 260-181, June 2014
Analysis of certified reference materials
NIST Special Publication 260-181, June 2014
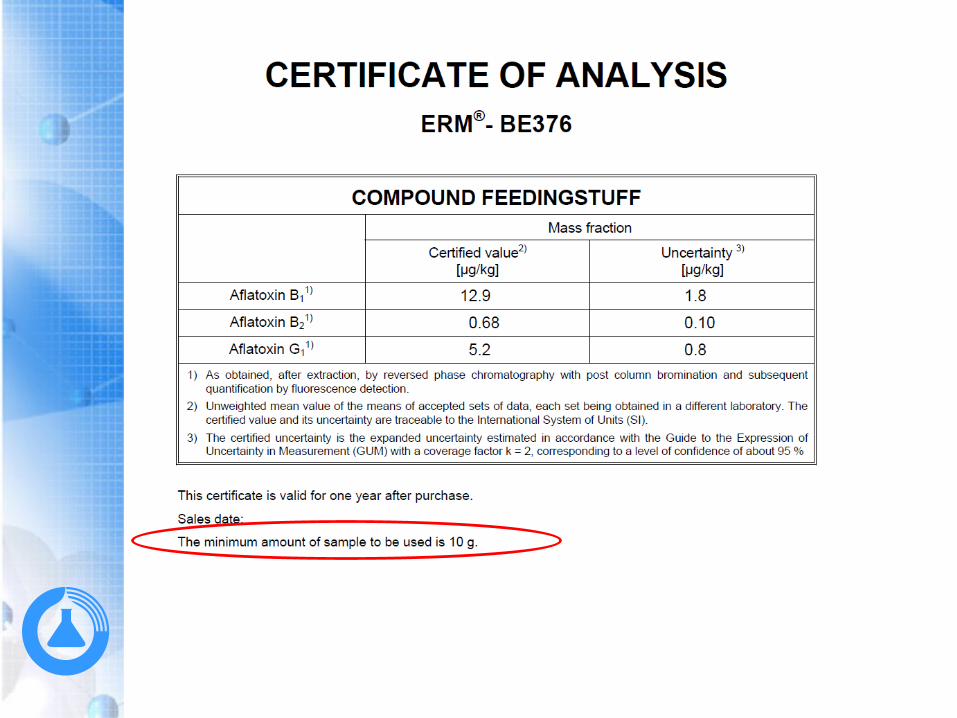

RM should only be used for one purpose
during a validation study.
For example, an RM used for calibration
shall not also be used to evaluate bias.
Eurachem -The Fitness for Purpose of Analytical Methods, 2014

Recovery experiments using spiked samples
Matrix selection
At least five different common food matrixes (protein, carbohydrate,
oil, dietary fibre and water), and at least three food types
representative of each food matrix.HOKLAS SC-37- 8/07/ 2014
NIST Special Publication 260-181, June 2014

SANCO/12571/2013 - 01/01/ 2014
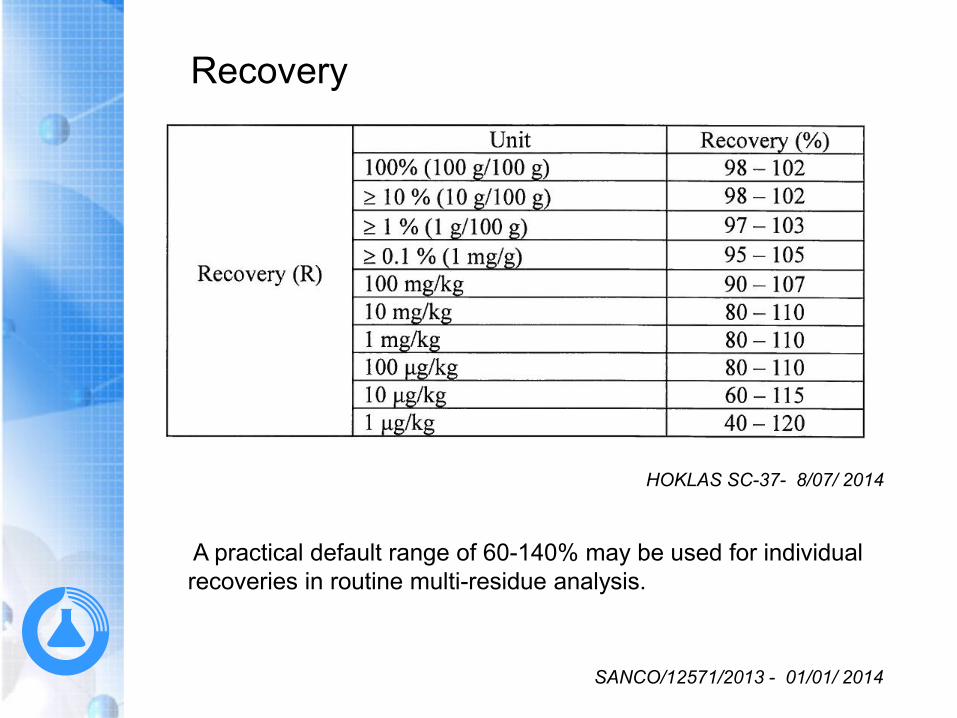
A practical default range of 60-140% may be used for individual
recoveries in routine multi-residue analysis.
SANCO/12571/2013 - 01/01/ 2014
HOKLAS SC-37- 8/07/ 2014
Recovery

Limitation by using spiked samples
The inherent problem with spike samples is that analyte introduced in such
a way will probably not be bound as strongly as that which is naturally
present in the test portion matrix and so the technique will give an
unrealistically high impression of the extraction efficiency.
Eurachem -The Fitness for Purpose of Analytical Methods, 2014

Incurred tea leaves
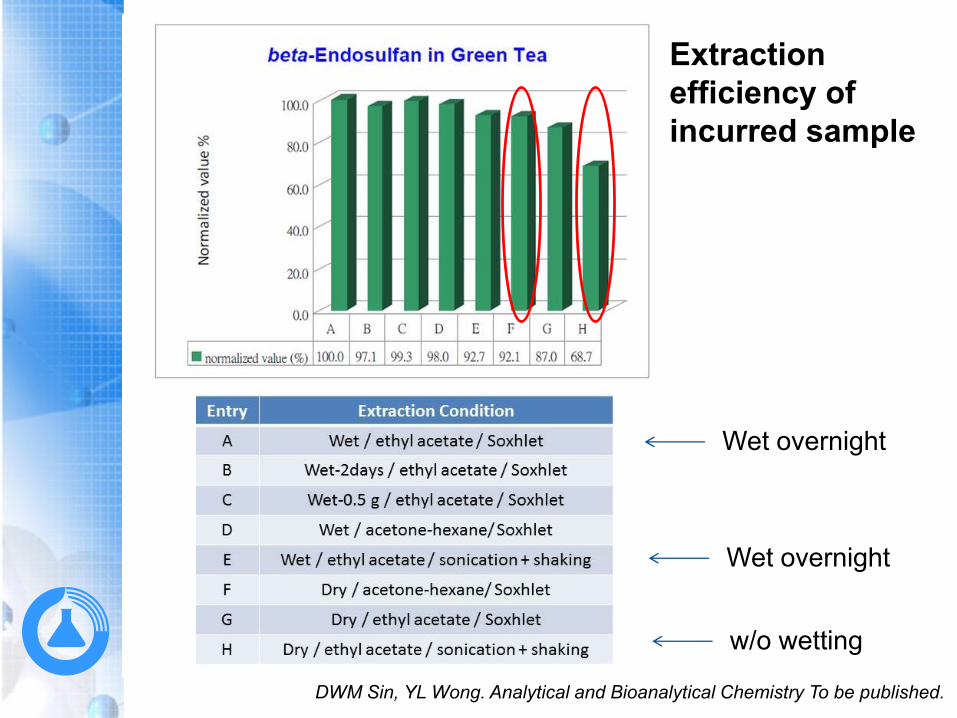
DWM Sin, YL Wong. Analytical and Bioanalytical Chemistry To be published.
Wet overnight
Wet overnight
Extraction
efficiency of
incurred sample
w/o wetting

Comparison with results with another method
Reference method, such as standard method or
primary method, with smaller uncertainty than
candidate method
Method currently in routine use in the laboratory.
The significance of the bias may be estimated by
statistical analysis (t-test) of the results obtained.
Eurachem -The Fitness for Purpose of Analytical Methods, 2014
NATA Technical Note 17 - October 2013
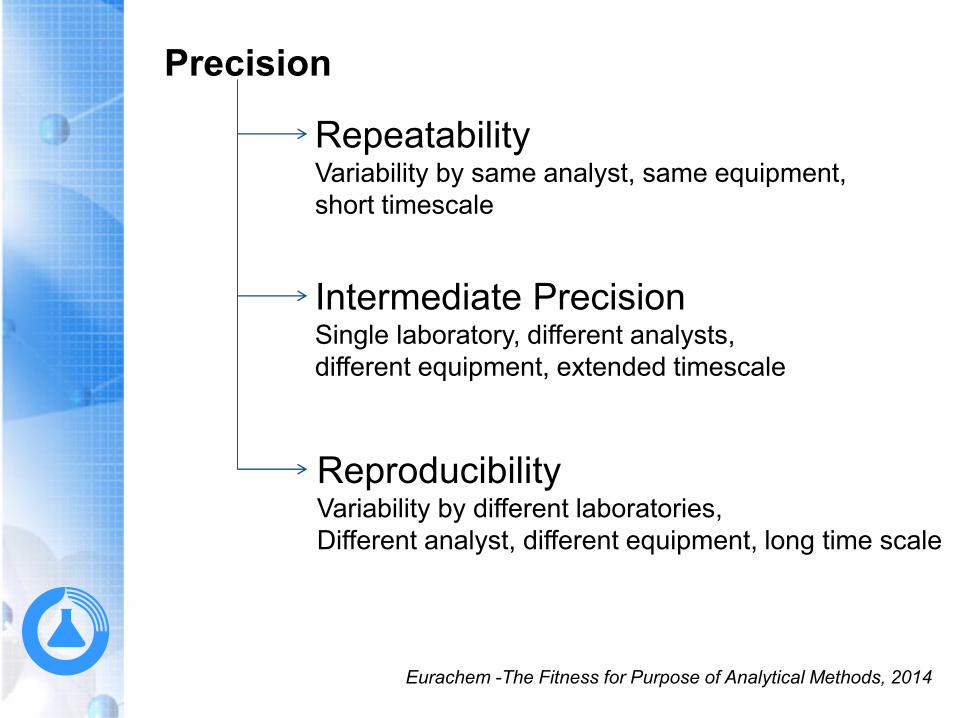
Precision
RepeatabilityVariability by same analyst, same equipment,
short timescale
ReproducibilityVariability by different laboratories,
Different analyst, different equipment, long time scale
Intermediate PrecisionSingle laboratory, different analysts,
different equipment, extended timescale
Eurachem -The Fitness for Purpose of Analytical Methods, 2014
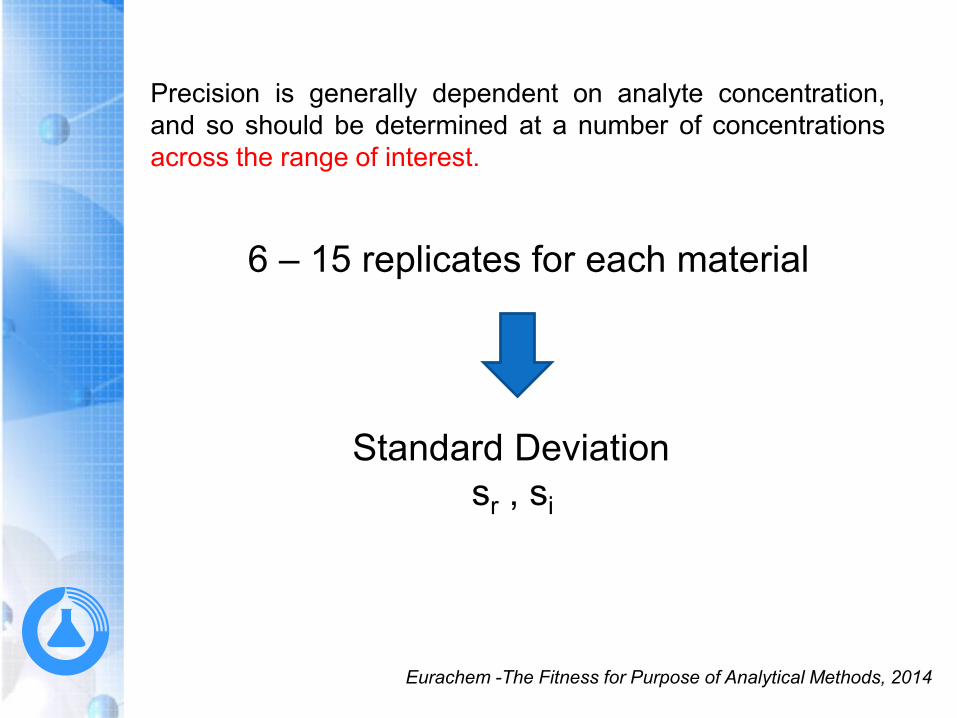
Precision is generally dependent on analyte concentration,
and so should be determined at a number of concentrations
across the range of interest.
6 – 15 replicates for each material
Standard Deviation
sr , si
Eurachem -The Fitness for Purpose of Analytical Methods, 2014
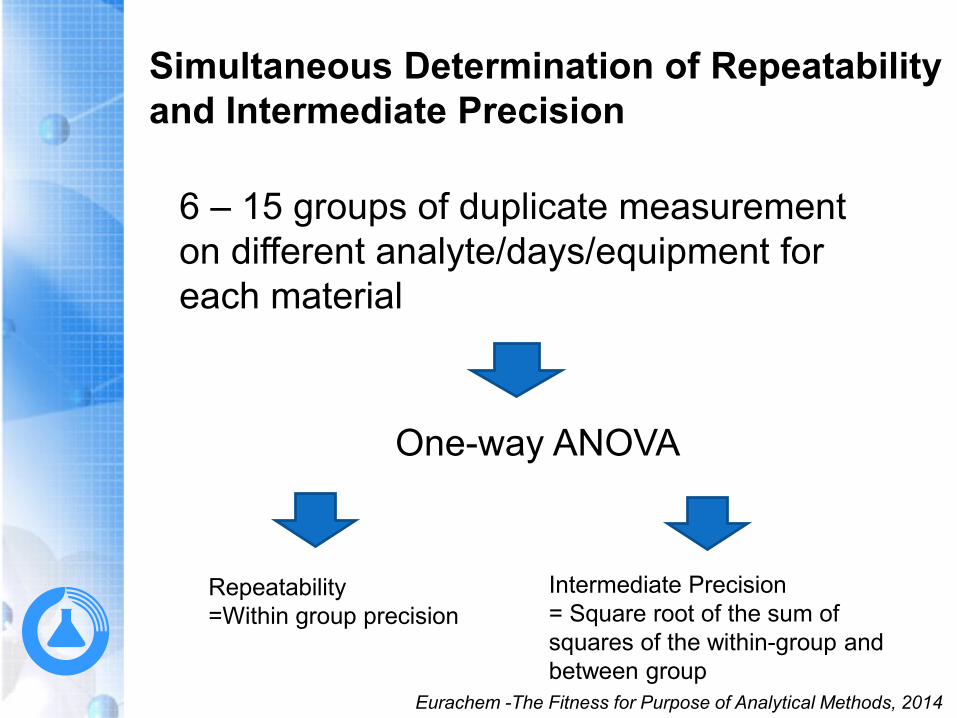
Simultaneous Determination of Repeatability
and Intermediate Precision
6 – 15 groups of duplicate measurement
on different analyte/days/equipment for
each material
One-way ANOVA
Repeatability
=Within group precision
Intermediate Precision
= Square root of the sum of
squares of the within-group and
between group
Eurachem -The Fitness for Purpose of Analytical Methods, 2014
Eurachem -The Fitness for Purpose of Analytical Methods, 2014
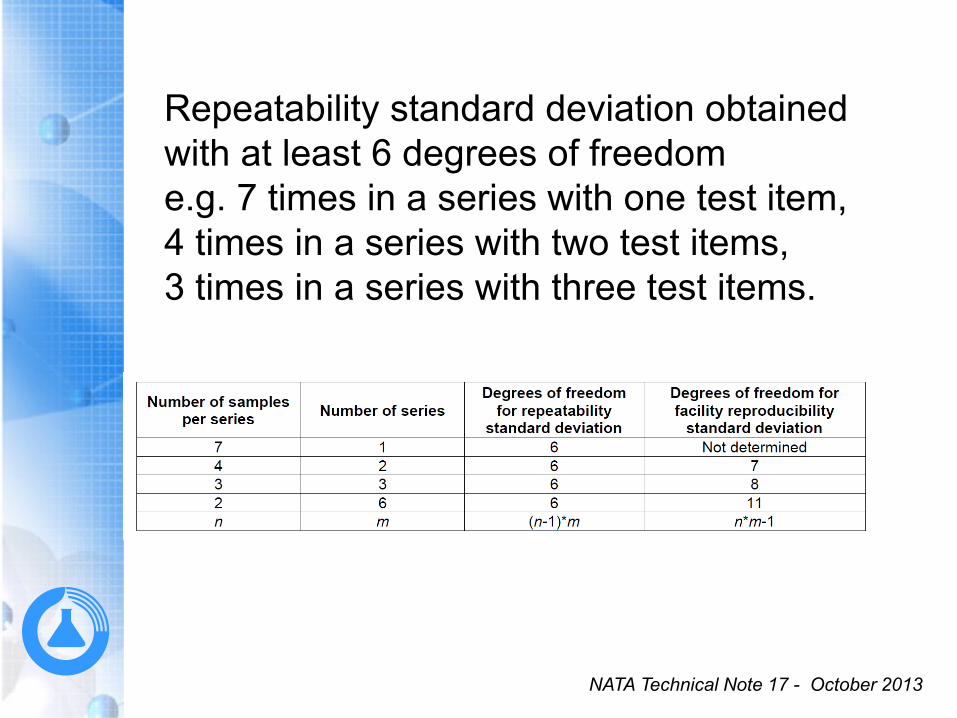
Repeatability standard deviation obtained
with at least 6 degrees of freedom
e.g. 7 times in a series with one test item,
4 times in a series with two test items,
3 times in a series with three test items.
NATA Technical Note 17 - October 2013

Precision Limits
enables the analyst to decide whether there is a significant
difference, at a specified level of confidence, between results
from duplicate analyses of a sample obtained under specified
conditions.
Repeatability Limit (r) = 2.8 x sr
Reproducibility Limit (R) = 2.8 x sR
Eurachem -The Fitness for Purpose of Analytical Methods, 2014
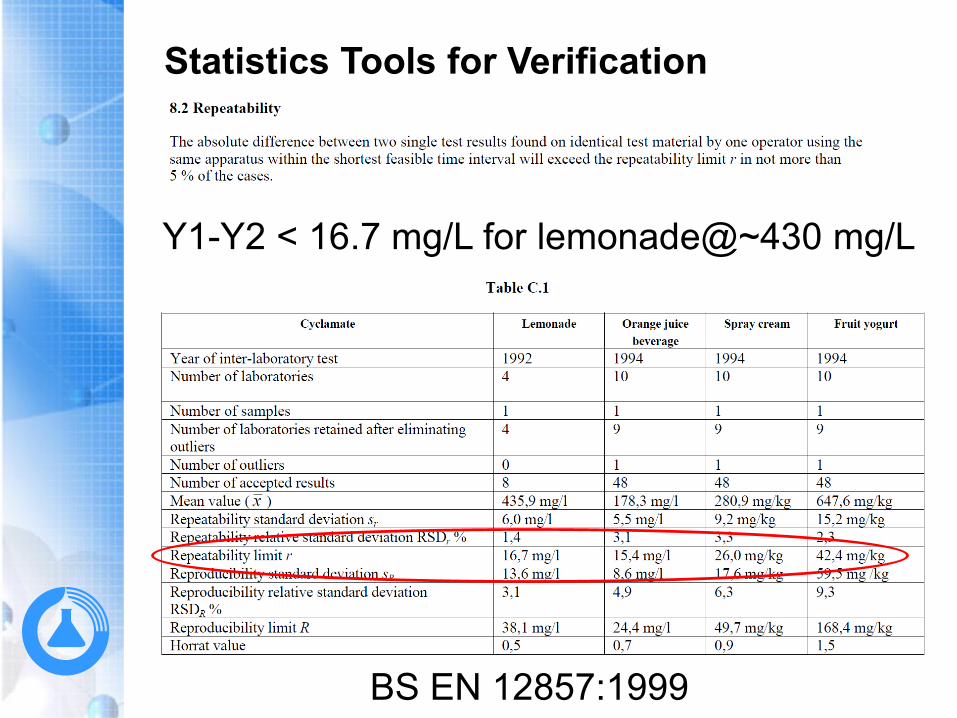
Y1-Y2 < 16.7 mg/L for lemonade@~430 mg/L
Statistics Tools for Verification
BS EN 12857:1999
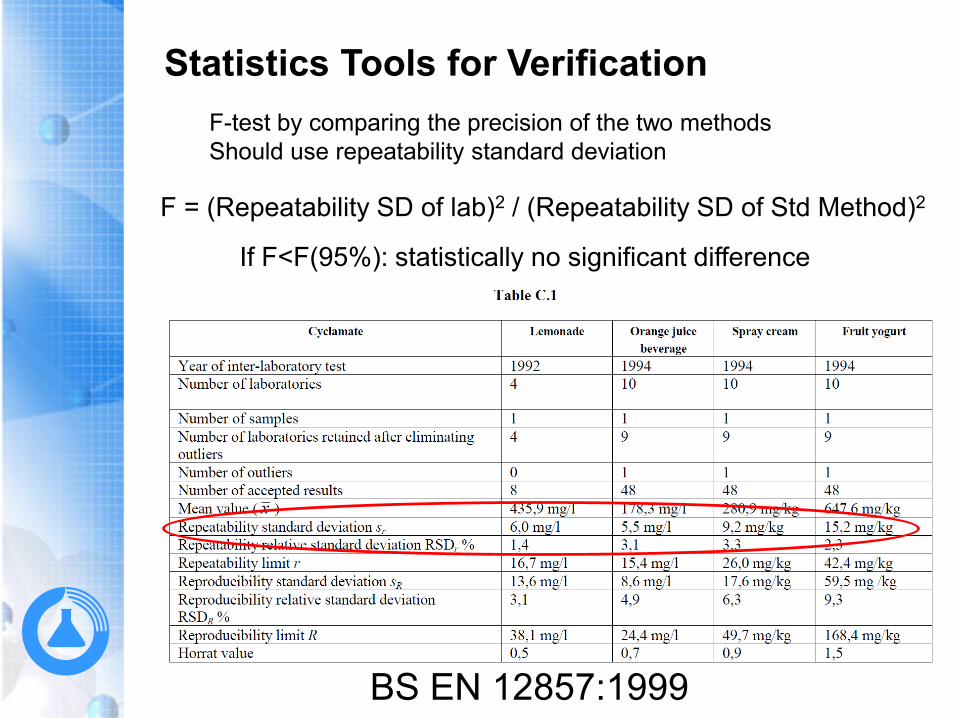
Statistics Tools for Verification
F-test by comparing the precision of the two methods
Should use repeatability standard deviation
F = (Repeatability SD of lab)2 / (Repeatability SD of Std Method)2
If F<F(95%): statistically no significant difference
BS EN 12857:1999
Ruggedness
A measure of its capacity to remain unaffected by small,
but deliberate variations in method parameters.
Ruggedness provides an indication of the method’s
reliability during normal usage.
To know which procedures / factors affect the
analytical results significantly.
In some cases, information may be available during in-house
method development. Intermediate precision, by their
nature, take into account some aspects of a method’s
ruggedness.
NATA Technical Note 17 - October 2013

Validation is always a balance
between costs, risks and technical
possibilities.
ISO/IEC 17025