technical review and evaluation -...
TRANSCRIPT
Air Quality Control General Permit Page 1 of 35 4/23/2012 for Crushing and Screening Plants
TECHNICAL REVIEW AND EVALUATION OF THE CRUSHING AND SCREENING GENERAL PERMIT
I. INTRODUCTION
The Crushing and Screening General Permit is a permit for a facility class (crushing and screening plants) that contains 10 or more facilities that are similar in nature, have substantially similar emissions, and would be subject to the same or substantially similar requirements. The general permit will last for 5 years from the date of its issuance. Equipment that is covered under the general permit will be required to have an “Authorization to Operate” (ATO). The ATO will identify the piece of equipment by having the manufacture, date of manufacture, maximum capacity, and serial number and /or equipment number along with the hours of operation limitation depending on the equipment and the county it is operating in. This general permit allows for portable crushing and screening plants to move to other locations statewide. This general permit also allows the Permittee to co-locate a concrete batch plant with the crushing and screening plant.
The Permittee that applies for an ATO under the general permit shall pay to the Department a flat permit processing fee of $500 with the submittal of the permit application. The Permittee must also pay, for each calendar year, the applicable administrative or inspection fees as described in the Arizona Administrative Code Title 18, Chapter 2, Article 5, section 511 (A.A.C. R18-2-511).
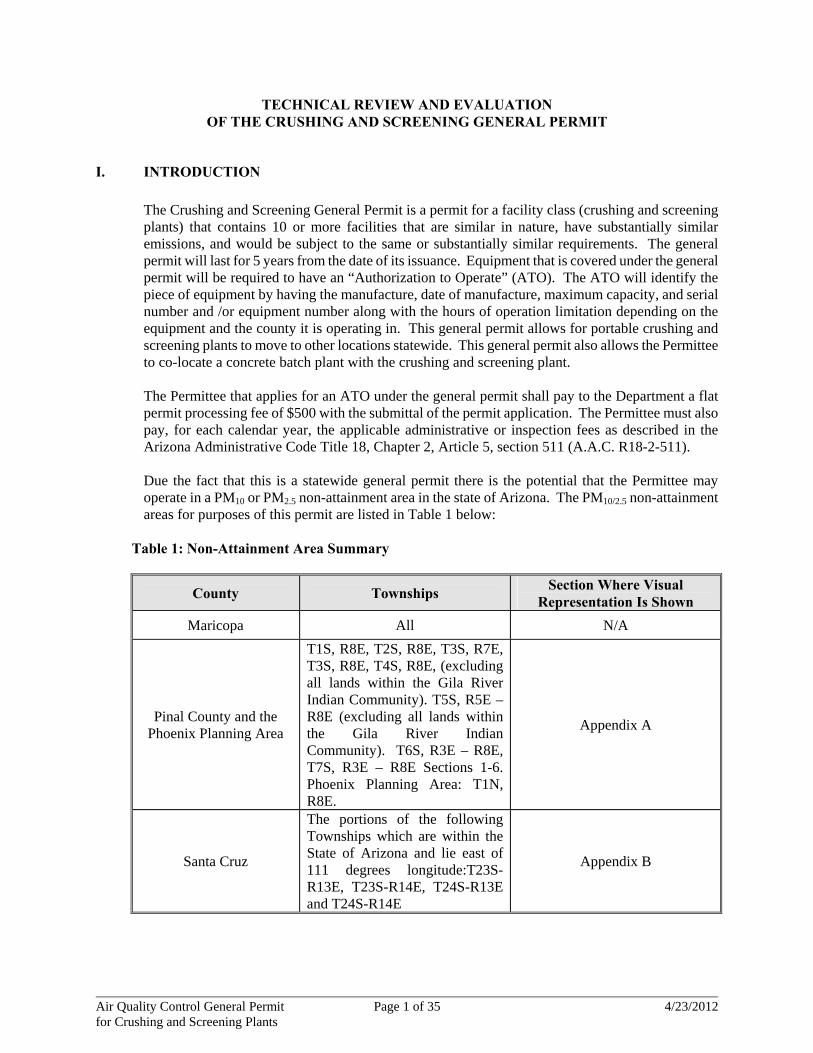
Due the fact that this is a statewide general permit there is the potential that the Permittee may operate in a PM10 or PM2.5 non-attainment area in the state of Arizona. The PM10/2.5 non-attainment areas for purposes of this permit are listed in Table 1 below:
Table 1: Non-Attainment Area Summary
County Townships Section Where Visual
Representation Is Shown
Maricopa All N/A
Pinal County and the Phoenix Planning Area
T1S, R8E, T2S, R8E, T3S, R7E, T3S, R8E, T4S, R8E, (excluding all lands within the Gila River Indian Community). T5S, R5E – R8E (excluding all lands within the Gila River Indian Community). T6S, R3E – R8E, T7S, R3E – R8E Sections 1-6. Phoenix Planning Area: T1N, R8E.
Appendix A
Santa Cruz
The portions of the following Townships which are within the State of Arizona and lie east of 111 degrees longitude:T23S-R13E, T23S-R14E, T24S-R13E and T24S-R14E
Appendix B

Air Quality Control General Permit Page 2 of 35 4/23/2012 for Crushing and Screening Plants
County Townships Section Where Visual
Representation Is Shown
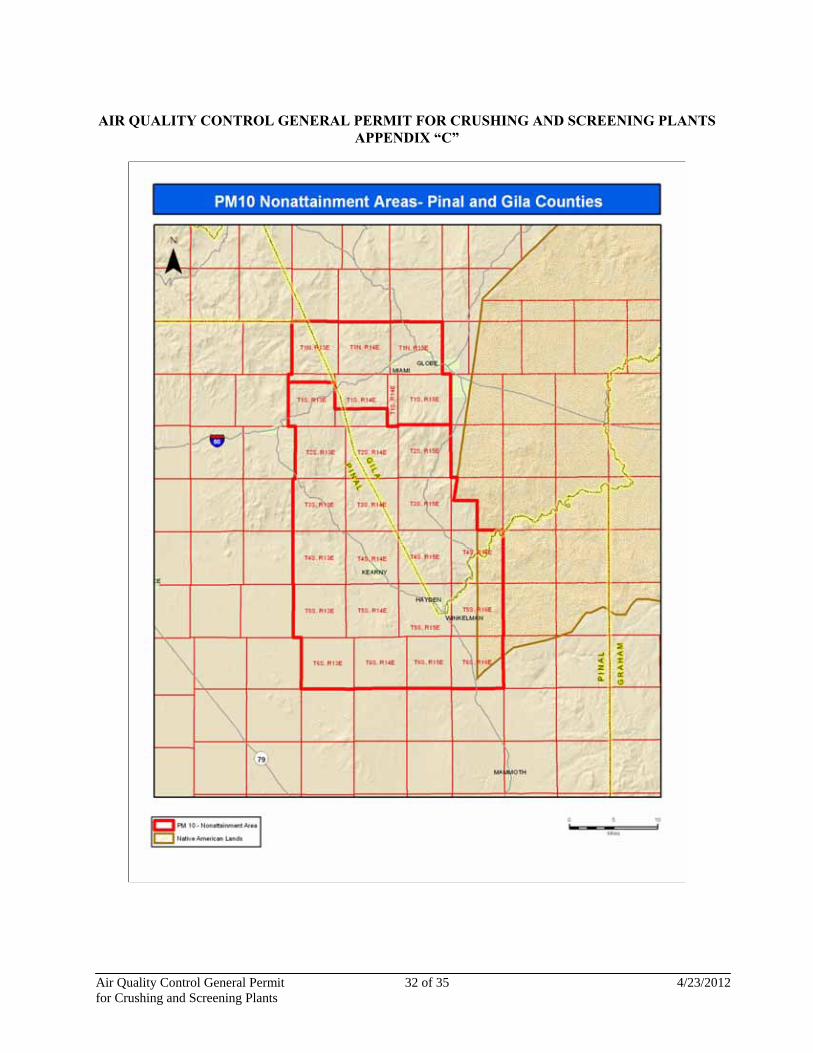
Gila and Pinal
T1S-R13E (sections 7–36); T1S- R14E (sections 25–36);T2S- R13E; T2S-R14E; T2S-R15E; T3S-R13E; T3S-R14E; T3S- R15E; T3S-R16E (except that portion in the San Carlos Apache Indian Reservation); T4S-R13E; T4S-R14E; T4S-R15E; T4S- R16E; T5S-R13E; T5S-R14E; T5S-R15E; T5S-R16E; T6S- R13E; T6S-R14E; T6S-R15E; and T6S-R16E. Miami planning area T1N-R13E; T1N-R14E; T1N- R15E; T1S-R13E (sections 1–6); T1S-R14E (sections 1-24); T1S- R14 1/2E; and T1S-R15E.
Appendix C
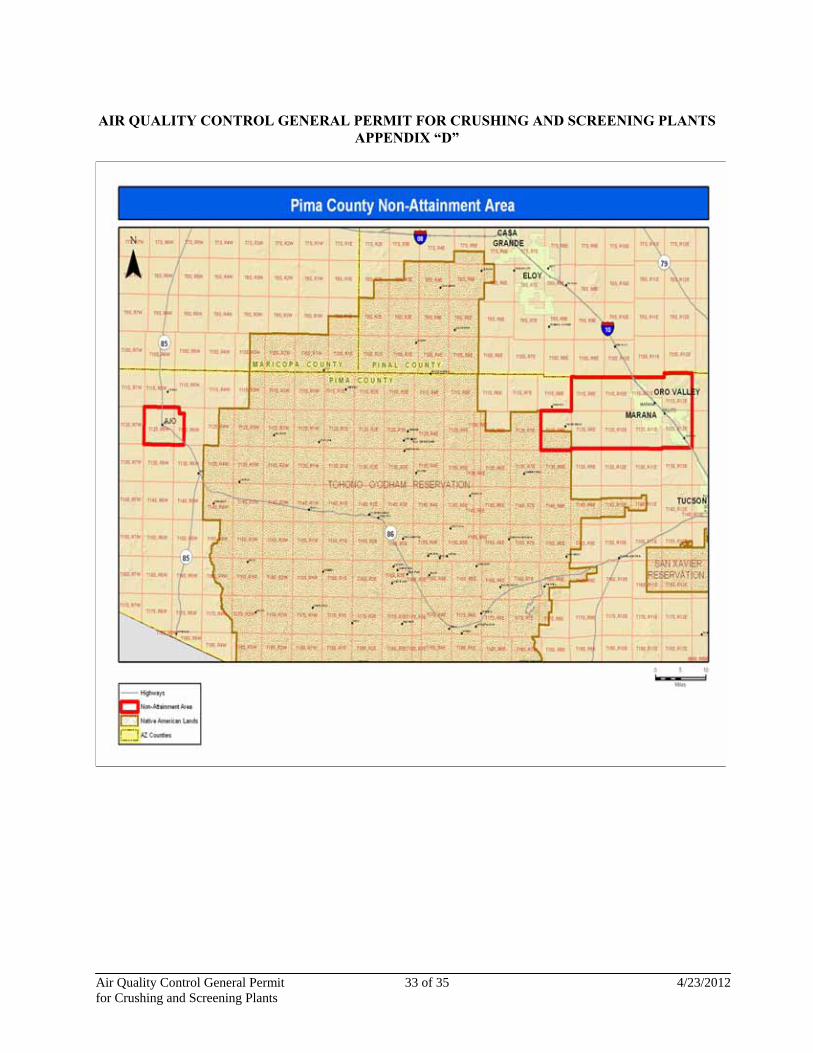
Pima
T11S-R9E, T11S-R10E, T11S-R11E, T11S-R12E, T12S-R8E, T12S-R9E, T12S-R10E, T12S-R11E and T12S-R12E. The Ajo planning area Township T12S, R6W, T12S, R5W (Sections 6–8, 17-20, and 29-32).
Appendix D
Yuma
T7S-R21W, T7S-R22W, T8S-R21W, T8S-R22W, T8S-R23W, T8S-R24W, T9S-R21W, T9S-R22W, T9S-R23W, T9S-R24W, T9S-R25W, T10S-R21W, T10S-R22W, T10S-R23W, T10S-R24W, and T10S-R25W
Appendix E
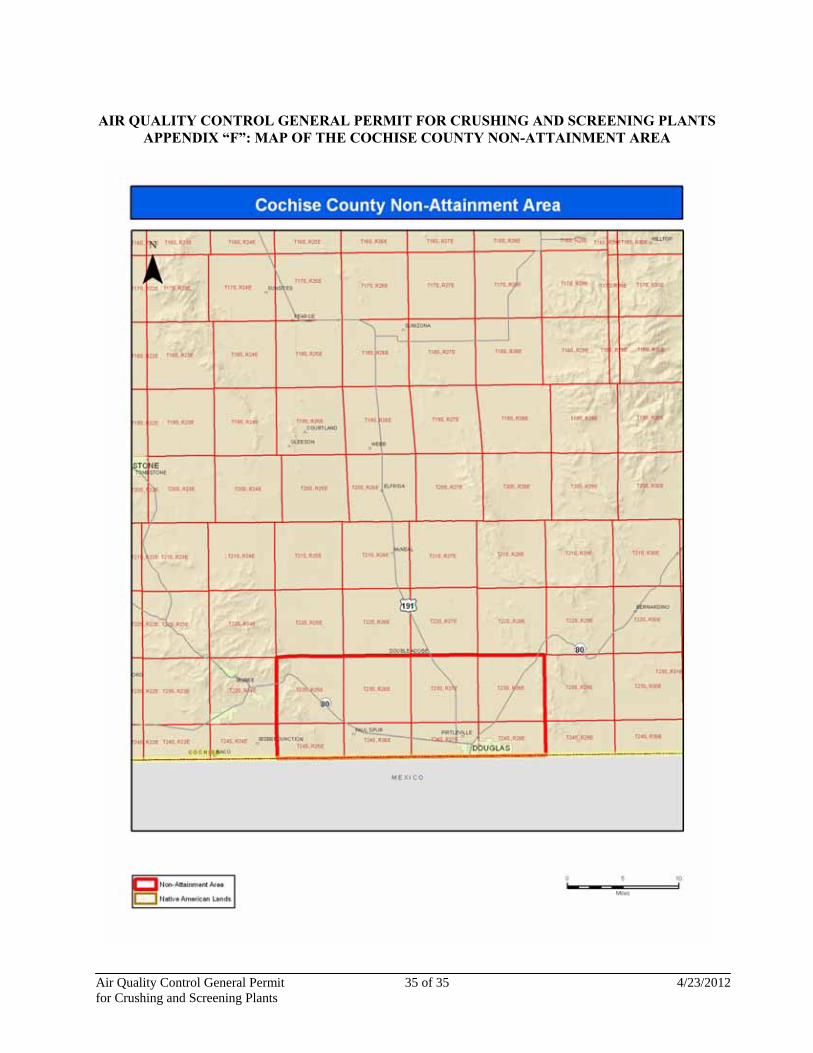
Cochise
T23S, R25E, T23S-R26E, T23S-R27E, T23S-R28E, T24S-R25E, T24S-R26E, T24S-R27E, and T24S-R28E
Appendix F
Notes: 1. No operations are permitted within the portion of Pinal County: T4S, R3E – R4E, T5S, R3E – R4E (excluding sections 12, 13, 24, and 25) identified as “Prohibited Area” in Appendix “A” of the general permit.
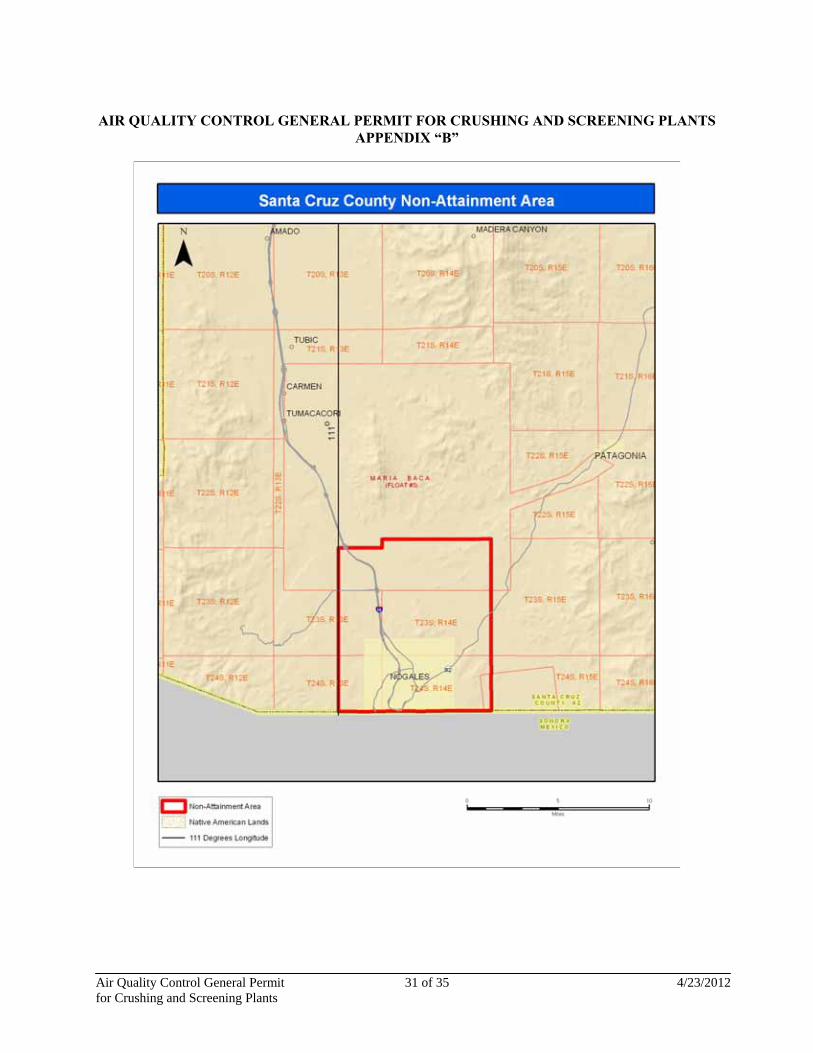
2. No operations are permitted in the portions of Santa Cruz County, identified as a
non-attainment area in Appendix “B”, on any day that the Nogales particle pollution risk forecast at http://www.azdeq.gov/environ/air/ozone/nogales.pdf shows the risk of unhealthy particulate matter concentration to be High or if the Air Quality Index (AQI) for PM2.5 is forecast as Unhealthy for Sensitive Groups.

Air Quality Control General Permit Page 3 of 35 4/23/2012 for Crushing and Screening Plants
II. OPERATING LIMITS AND ASSOCIATED EMISSIONS
Based on the modeled results (refer to Section V for detailed modeling analysis), the production
limitations for crushing and screening plants along with collocated concrete batch plants have been established. Table 2 on the following page below summarizes the production limitations:
Table 2: Modeling - Based Production Limitations
Maximum Daily Operation
Facility PM10 Attainment Area
PM10 Nonattainment Area
Stand-alone crushing and screening plant
6,500 tons per day
4,410 tons per day
Crushing and screening plant collocated with concrete batch plants
C&S: 6,500 tons per day CBP: 1,275 yd3 per day
C&S: 4,095 tons per day CBP: 1,275 yd3 per day
In addition to the above limitations, the Permittee may also be subject to operating hour limitations in the ATOs. These limits shall be calculated based on the potential to emit calculations. In no case shall the emissions from the facility exceed the statewide emission limits required to stay below major source thresholds, or the Maricopa County emissions limits which is required to avoid BACT review under Maricopa County Rule 241. These limitations are identified in Table 3 below:
Table 3: Emission Limitations
Statewide Emission limit (excluding Maricopa County)
Emission Limit in Maricopa County Pollutants
(ton/yr) (lb/day) (ton/yr)
PM 90 135 22.5
PM10 90 76.5 13.5
CO 90 495 90
NOx 90 135 22.5
SO2 90 135 22.5
VOC 90 135 22.5
III. APPLICABLE REGULATIONS

Air Quality Control General Permit Page 4 of 35 4/23/2012 for Crushing and Screening Plants
The Department has identified the applicable regulations that apply to each unit at a crushing and screening facility. Table 4 on the following page summarizes the findings of the Department with respect to the regulations that are applicable to each emissions unit.
Table 4: Applicable Regulations Statewide
Unit ID Control
Equipment Applicable Regulations Verification
Crushing and Screening Plants (NSPS)
Wet Scrubbers, Spray Bars,
wet suppressant,
and enclosures.
40 CFR 60 Subpart OOO
New Source Performance Standards Subpart OOO – Standards of Performance for Nonmetallic Mineral Processing Plants. Affected facilities include crushers, grinding mill, screening operation, bucket elevators, belt conveyors, bagging operations, storage bins, and enclosed truck or railcar loading stations built or reconstructed after August 31, 1983.
Crushing and Screening Plants (Non-NSPS)
Wet Scrubbers, Spray Bars,
wet suppressant,
and enclosures
A.A.C. R18-2-722 Standards of Performance for Existing or Crushed Stone Processing Plants.
Internal Combustion Engines
None A.A.C. R18-2-719 40 CFR 63 Subpart ZZZZ
Standards of Performance for Existing Stationary Rotating Machinery.
Internal Combustion Engines (NSPS)
None 40 CFR 60 Subpart IIII Standards of Performance for Stationary Compression Ignition Internal Combustion Engines.
Internal Combustion Engines (NSPS)
None 40 CFR 60 Subpart JJJJ Standards of Performance for Stationary Spark Ignition Internal Combustion Engines.
Concrete Batch Plants
Baghouses and wet
suppressants
A.A.C. R18-2-702.B A.A.C. R18-2-723
The conditions stated here are the opacity limitations.
Boilers Not Applicable
A.A.C. R18-2-724
Standards of Performance for Fossil-fuel Fired Industrial and Commercial Equipment.
Fugitive Dust
Control Measures
A.A.C. R18-2-604 through R18-2-607.
Emissions from Fugitive Dust Sources.
Mobile Sources
None A.A.C. R18-2-801 through A.A.C R18-2-806
Emissions from Mobile Source

Air Quality Control General Permit Page 5 of 35 4/23/2012 for Crushing and Screening Plants
Table 5: Applicable Regulations for Maricopa County
Unit ID Start-up
date Control
Equipment Applicable Regulations Verification
Facility Wide Requirements
Not Applicable
None Maricopa County Rule 100 Maricopa County Rule 200 Maricopa County Rule 220 Maricopa County Rule 230 Maricopa County Rule 300 Maricopa County Rule 310 Maricopa County Rule 312 Maricopa County Rule 315 Maricopa County Rule 320
General Provisions and Definitions Permit Requirements Non-Title V Permit Provisions General Permits Visible Emissions Fugitive Dust from Dust-Generating Operations Abrasive Blasting Spray Coating Operations Odors And Gaseous Air Contaminants
Crushing and Screening Operation Concrete Batch Plants Fugitive Dust
Not Applicable
Wet Scrubbers, Spray Bars,
wet suppressants,
and enclosures
Maricopa County Rule 316
Nonmetallic Mineral Processing located in Maricopa County
Internal Combustion Engines
Not Applicable
None Maricopa County Rule 324
Stationary Rotating Machinery subject to State rules located in Maricopa County.
Table 6: Regulations for Pima and Pinal Counties

Air Quality Control General Permit Page 6 of 35 4/23/2012 for Crushing and Screening Plants
Unit ID Start-up
date
Control Equipmen
t
Applicable Regulations
Verification
Crushing and Screening Plants in Pima
Not Applicable
Spray Bars P.C.C. §§17.16.010.C P.C.C. §§17.16.040 P.C.C. §§17.16.050 P.C.C. §§17.16.060 P.C.C. §§17.16.070 P.C.C. §§17.16.080 P.C.C. §§17.16.090 P.C.C. §§17.16.100 P.C.C. §§17.16.360 P.C.C. §§17.16.370 P.C.C. §§17.16.380 P.C.C. §§17.16.710 SIP Rule 343
The regulations listed are applicable to Crushing and Screening Plants located in Pima County.
Crushing and Screening Plants in Pinal
Not Applicable
Spray Bars Pinal Code §4-2-040 Pinal Code §4-2-050 Pinal Code §5-5-180 Pinal Code §5-5-190 Pinal Code §5-5-200
The regulations listed are applicable to Crushing and Screening Plants located in Pinal County.
Air Quality Control General Permit Page 7 of 35 4/23/2012 for Crushing and Screening Plants
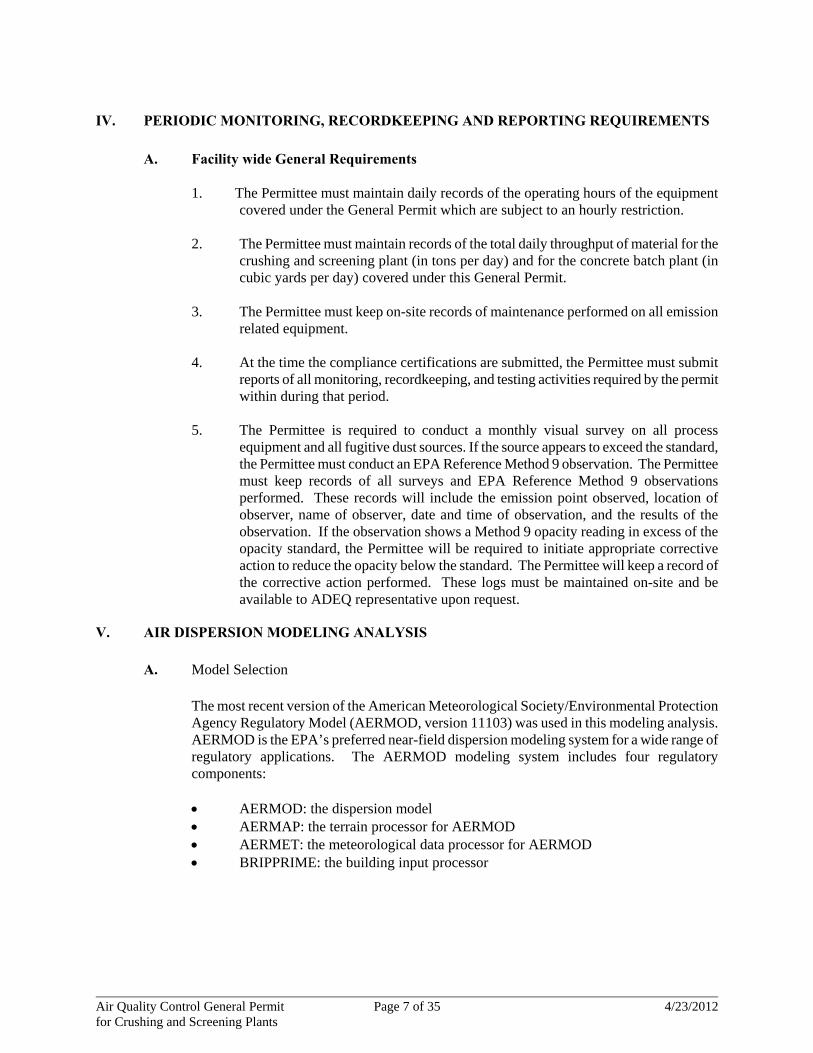
IV. PERIODIC MONITORING, RECORDKEEPING AND REPORTING REQUIREMENTS
A. Facility wide General Requirements
1. The Permittee must maintain daily records of the operating hours of the equipment
covered under the General Permit which are subject to an hourly restriction. 2. The Permittee must maintain records of the total daily throughput of material for the
crushing and screening plant (in tons per day) and for the concrete batch plant (in cubic yards per day) covered under this General Permit.
3. The Permittee must keep on-site records of maintenance performed on all emission
related equipment. 4. At the time the compliance certifications are submitted, the Permittee must submit
reports of all monitoring, recordkeeping, and testing activities required by the permit within during that period.
5. The Permittee is required to conduct a monthly visual survey on all process
equipment and all fugitive dust sources. If the source appears to exceed the standard, the Permittee must conduct an EPA Reference Method 9 observation. The Permittee must keep records of all surveys and EPA Reference Method 9 observations performed. These records will include the emission point observed, location of observer, name of observer, date and time of observation, and the results of the observation. If the observation shows a Method 9 opacity reading in excess of the opacity standard, the Permittee will be required to initiate appropriate corrective action to reduce the opacity below the standard. The Permittee will keep a record of the corrective action performed. These logs must be maintained on-site and be available to ADEQ representative upon request.
V. AIR DISPERSION MODELING ANALYSIS
A. Model Selection
The most recent version of the American Meteorological Society/Environmental Protection Agency Regulatory Model (AERMOD, version 11103) was used in this modeling analysis. AERMOD is the EPA’s preferred near-field dispersion modeling system for a wide range of regulatory applications. The AERMOD modeling system includes four regulatory components:
AERMOD: the dispersion model AERMAP: the terrain processor for AERMOD AERMET: the meteorological data processor for AERMOD BRIPPRIME: the building input processor
Air Quality Control General Permit Page 8 of 35 4/23/2012 for Crushing and Screening Plants
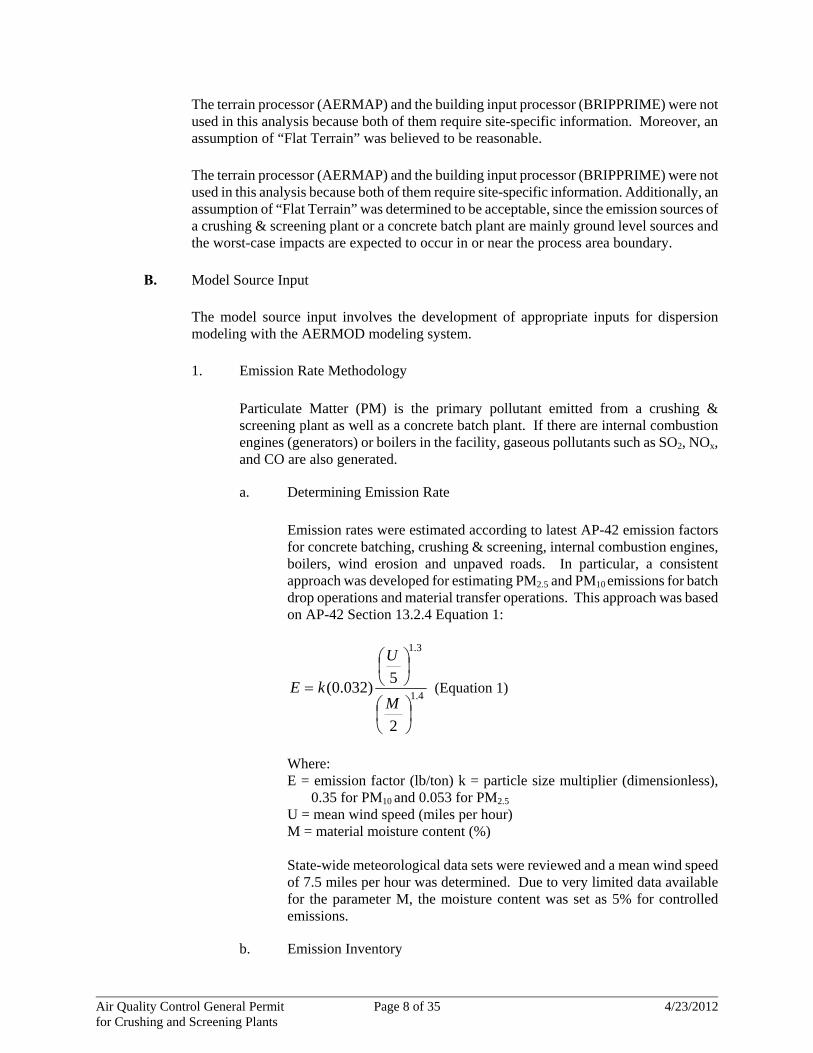
The terrain processor (AERMAP) and the building input processor (BRIPPRIME) were not used in this analysis because both of them require site-specific information. Moreover, an assumption of “Flat Terrain” was believed to be reasonable.
The terrain processor (AERMAP) and the building input processor (BRIPPRIME) were not used in this analysis because both of them require site-specific information. Additionally, an assumption of “Flat Terrain” was determined to be acceptable, since the emission sources of a crushing & screening plant or a concrete batch plant are mainly ground level sources and the worst-case impacts are expected to occur in or near the process area boundary.
B. Model Source Input
The model source input involves the development of appropriate inputs for dispersion modeling with the AERMOD modeling system.
1. Emission Rate Methodology
Particulate Matter (PM) is the primary pollutant emitted from a crushing & screening plant as well as a concrete batch plant. If there are internal combustion engines (generators) or boilers in the facility, gaseous pollutants such as SO2, NOx, and CO are also generated.
a. Determining Emission Rate
Emission rates were estimated according to latest AP-42 emission factors for concrete batching, crushing & screening, internal combustion engines, boilers, wind erosion and unpaved roads. In particular, a consistent approach was developed for estimating PM2.5 and PM10 emissions for batch drop operations and material transfer operations. This approach was based on AP-42 Section 13.2.4 Equation 1:
4.1
3.1
2
5)032.0(
M
U
kE (Equation 1)
Where: E = emission factor (lb/ton) k = particle size multiplier (dimensionless),
0.35 for PM10 and 0.053 for PM2.5 U = mean wind speed (miles per hour) M = material moisture content (%)
State-wide meteorological data sets were reviewed and a mean wind speed of 7.5 miles per hour was determined. Due to very limited data available for the parameter M, the moisture content was set as 5% for controlled emissions.
b. Emission Inventory
Air Quality Control General Permit Page 9 of 35 4/23/2012 for Crushing and Screening Plants
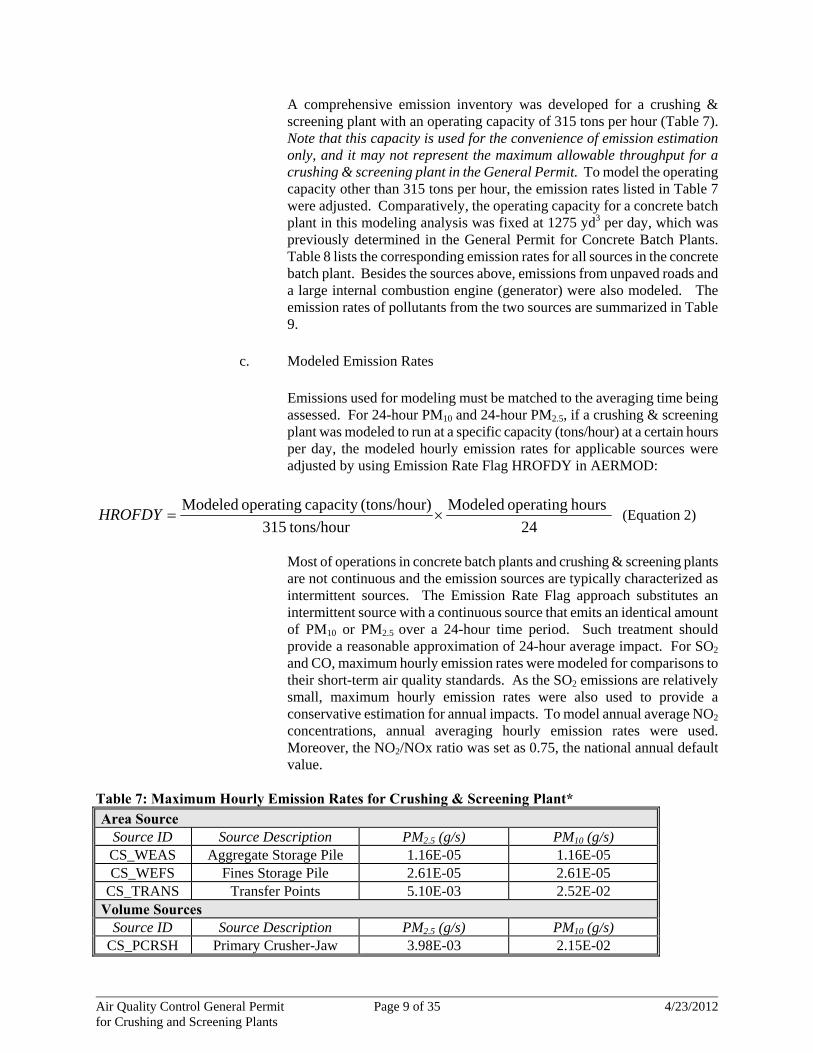
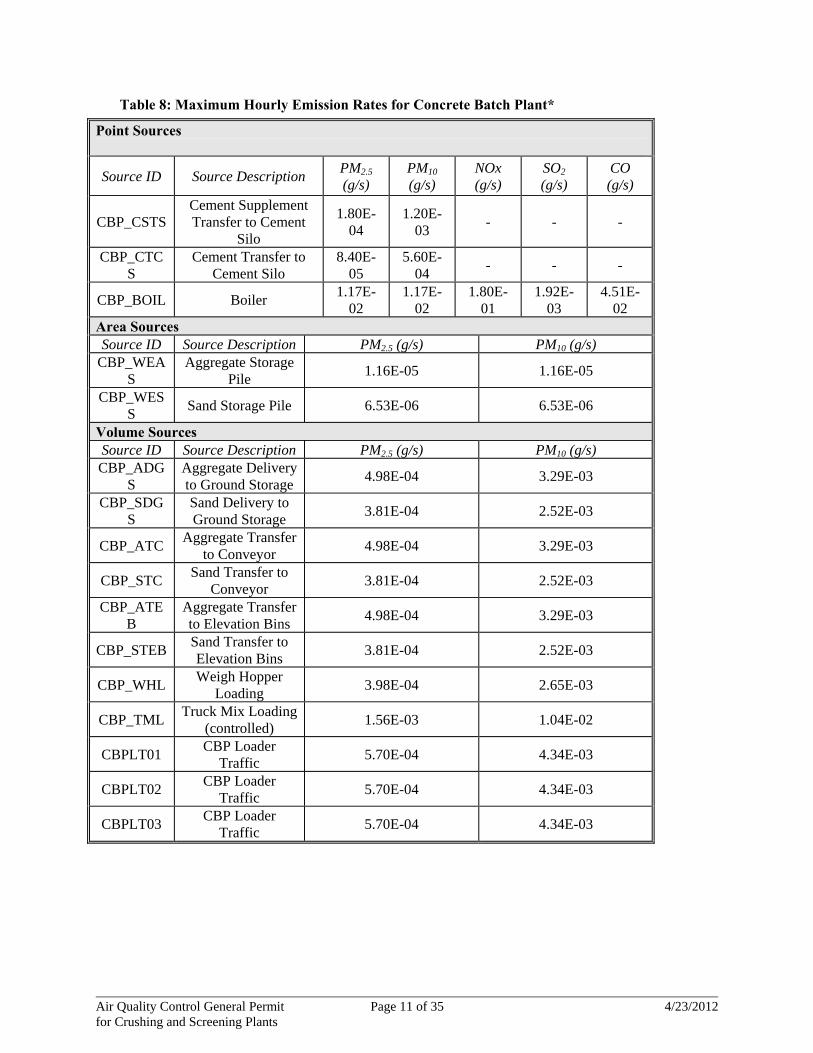
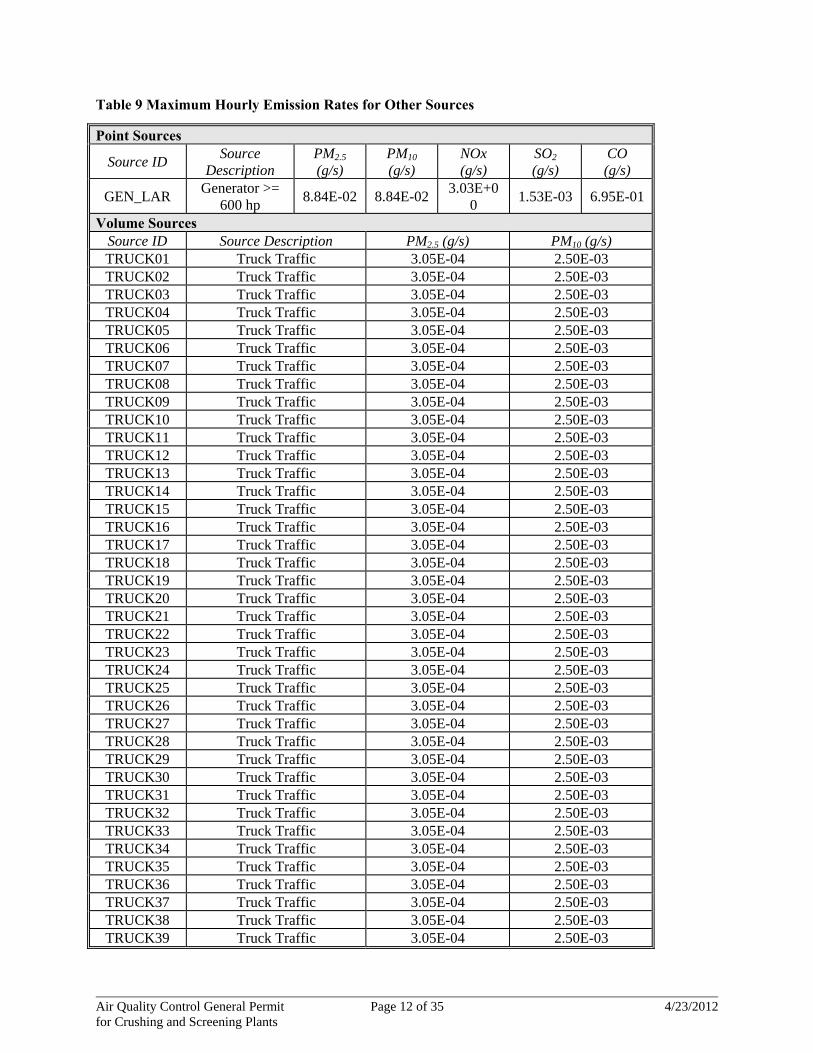
A comprehensive emission inventory was developed for a crushing & screening plant with an operating capacity of 315 tons per hour (Table 7). Note that this capacity is used for the convenience of emission estimation only, and it may not represent the maximum allowable throughput for a crushing & screening plant in the General Permit. To model the operating capacity other than 315 tons per hour, the emission rates listed in Table 7 were adjusted. Comparatively, the operating capacity for a concrete batch plant in this modeling analysis was fixed at 1275 yd3 per day, which was previously determined in the General Permit for Concrete Batch Plants. Table 8 lists the corresponding emission rates for all sources in the concrete batch plant. Besides the sources above, emissions from unpaved roads and a large internal combustion engine (generator) were also modeled. The emission rates of pollutants from the two sources are summarized in Table 9.
c. Modeled Emission Rates
Emissions used for modeling must be matched to the averaging time being assessed. For 24-hour PM10 and 24-hour PM2.5, if a crushing & screening plant was modeled to run at a specific capacity (tons/hour) at a certain hours per day, the modeled hourly emission rates for applicable sources were adjusted by using Emission Rate Flag HROFDY in AERMOD:
24
hours operating Modeled
tons/hour315
)(tons/hourcapacity operating ModeledHROFDY (Equation 2)
Most of operations in concrete batch plants and crushing & screening plants are not continuous and the emission sources are typically characterized as intermittent sources. The Emission Rate Flag approach substitutes an intermittent source with a continuous source that emits an identical amount of PM10 or PM2.5 over a 24-hour time period. Such treatment should provide a reasonable approximation of 24-hour average impact. For SO2 and CO, maximum hourly emission rates were modeled for comparisons to their short-term air quality standards. As the SO2 emissions are relatively small, maximum hourly emission rates were also used to provide a conservative estimation for annual impacts. To model annual average NO2 concentrations, annual averaging hourly emission rates were used. Moreover, the NO2/NOx ratio was set as 0.75, the national annual default value.
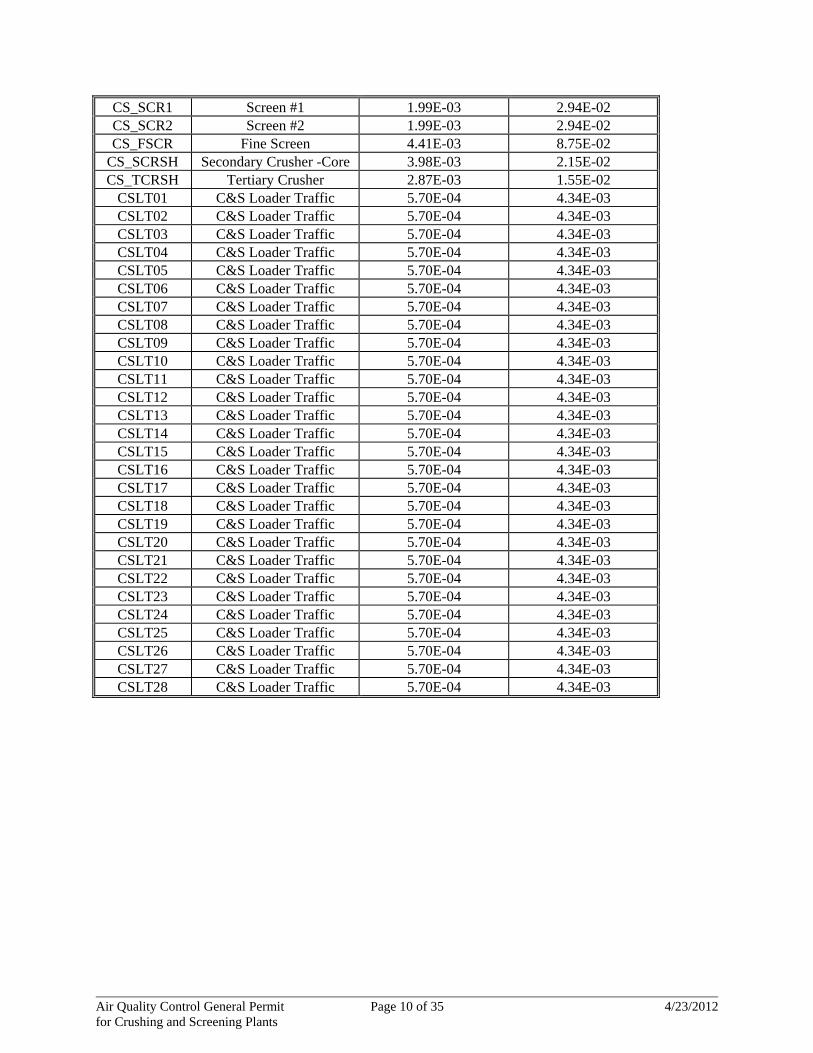
Table 7: Maximum Hourly Emission Rates for Crushing & Screening Plant* Area Source
Source ID Source Description PM2.5 (g/s) PM10 (g/s) CS_WEAS Aggregate Storage Pile 1.16E-05 1.16E-05 CS_WEFS Fines Storage Pile 2.61E-05 2.61E-05
CS_TRANS Transfer Points 5.10E-03 2.52E-02 Volume Sources
Source ID Source Description PM2.5 (g/s) PM10 (g/s) CS_PCRSH Primary Crusher-Jaw 3.98E-03 2.15E-02
Air Quality Control General Permit Page 10 of 35 4/23/2012 for Crushing and Screening Plants
CS_SCR1 Screen #1 1.99E-03 2.94E-02 CS_SCR2 Screen #2 1.99E-03 2.94E-02 CS_FSCR Fine Screen 4.41E-03 8.75E-02
CS_SCRSH Secondary Crusher -Core 3.98E-03 2.15E-02 CS_TCRSH Tertiary Crusher 2.87E-03 1.55E-02
CSLT01 C&S Loader Traffic 5.70E-04 4.34E-03 CSLT02 C&S Loader Traffic 5.70E-04 4.34E-03 CSLT03 C&S Loader Traffic 5.70E-04 4.34E-03 CSLT04 C&S Loader Traffic 5.70E-04 4.34E-03 CSLT05 C&S Loader Traffic 5.70E-04 4.34E-03 CSLT06 C&S Loader Traffic 5.70E-04 4.34E-03 CSLT07 C&S Loader Traffic 5.70E-04 4.34E-03 CSLT08 C&S Loader Traffic 5.70E-04 4.34E-03 CSLT09 C&S Loader Traffic 5.70E-04 4.34E-03 CSLT10 C&S Loader Traffic 5.70E-04 4.34E-03 CSLT11 C&S Loader Traffic 5.70E-04 4.34E-03 CSLT12 C&S Loader Traffic 5.70E-04 4.34E-03 CSLT13 C&S Loader Traffic 5.70E-04 4.34E-03 CSLT14 C&S Loader Traffic 5.70E-04 4.34E-03 CSLT15 C&S Loader Traffic 5.70E-04 4.34E-03 CSLT16 C&S Loader Traffic 5.70E-04 4.34E-03 CSLT17 C&S Loader Traffic 5.70E-04 4.34E-03 CSLT18 C&S Loader Traffic 5.70E-04 4.34E-03 CSLT19 C&S Loader Traffic 5.70E-04 4.34E-03 CSLT20 C&S Loader Traffic 5.70E-04 4.34E-03 CSLT21 C&S Loader Traffic 5.70E-04 4.34E-03 CSLT22 C&S Loader Traffic 5.70E-04 4.34E-03 CSLT23 C&S Loader Traffic 5.70E-04 4.34E-03 CSLT24 C&S Loader Traffic 5.70E-04 4.34E-03 CSLT25 C&S Loader Traffic 5.70E-04 4.34E-03 CSLT26 C&S Loader Traffic 5.70E-04 4.34E-03 CSLT27 C&S Loader Traffic 5.70E-04 4.34E-03 CSLT28 C&S Loader Traffic 5.70E-04 4.34E-03
Air Quality Control General Permit Page 11 of 35 4/23/2012 for Crushing and Screening Plants
Table 8: Maximum Hourly Emission Rates for Concrete Batch Plant*
Point Sources
Source ID Source Description PM2.5 (g/s)
PM10 (g/s)
NOx (g/s)
SO2 (g/s)
CO (g/s)
CBP_CSTS Cement Supplement Transfer to Cement
Silo
1.80E-04
1.20E-03
- - -
CBP_CTCS
Cement Transfer to Cement Silo
8.40E-05
5.60E-04
- - -
CBP_BOIL Boiler 1.17E-
02 1.17E-
02 1.80E-
01 1.92E-
03 4.51E-
02 Area Sources Source ID Source Description PM2.5 (g/s) PM10 (g/s)
CBP_WEAS
Aggregate Storage Pile
1.16E-05 1.16E-05
CBP_WESS
Sand Storage Pile 6.53E-06 6.53E-06
Volume Sources Source ID Source Description PM2.5 (g/s) PM10 (g/s) CBP_ADG
S Aggregate Delivery to Ground Storage
4.98E-04 3.29E-03
CBP_SDGS
Sand Delivery to Ground Storage
3.81E-04 2.52E-03
CBP_ATC Aggregate Transfer
to Conveyor 4.98E-04 3.29E-03
CBP_STC Sand Transfer to
Conveyor 3.81E-04 2.52E-03
CBP_ATEB
Aggregate Transfer to Elevation Bins
4.98E-04 3.29E-03
CBP_STEB Sand Transfer to Elevation Bins
3.81E-04 2.52E-03
CBP_WHL Weigh Hopper
Loading 3.98E-04 2.65E-03
CBP_TML Truck Mix Loading
(controlled) 1.56E-03 1.04E-02
CBPLT01 CBP Loader
Traffic 5.70E-04 4.34E-03
CBPLT02 CBP Loader
Traffic 5.70E-04 4.34E-03
CBPLT03 CBP Loader
Traffic 5.70E-04 4.34E-03
Air Quality Control General Permit Page 12 of 35 4/23/2012 for Crushing and Screening Plants
Table 9 Maximum Hourly Emission Rates for Other Sources
Point Sources
Source ID Source
Description PM2.5 (g/s)
PM10 (g/s)
NOx (g/s)
SO2 (g/s)
CO (g/s)
GEN_LAR Generator >=
600 hp 8.84E-02 8.84E-02
3.03E+00
1.53E-03 6.95E-01
Volume Sources Source ID Source Description PM2.5 (g/s) PM10 (g/s) TRUCK01 Truck Traffic 3.05E-04 2.50E-03 TRUCK02 Truck Traffic 3.05E-04 2.50E-03 TRUCK03 Truck Traffic 3.05E-04 2.50E-03 TRUCK04 Truck Traffic 3.05E-04 2.50E-03 TRUCK05 Truck Traffic 3.05E-04 2.50E-03 TRUCK06 Truck Traffic 3.05E-04 2.50E-03 TRUCK07 Truck Traffic 3.05E-04 2.50E-03 TRUCK08 Truck Traffic 3.05E-04 2.50E-03 TRUCK09 Truck Traffic 3.05E-04 2.50E-03 TRUCK10 Truck Traffic 3.05E-04 2.50E-03 TRUCK11 Truck Traffic 3.05E-04 2.50E-03 TRUCK12 Truck Traffic 3.05E-04 2.50E-03 TRUCK13 Truck Traffic 3.05E-04 2.50E-03 TRUCK14 Truck Traffic 3.05E-04 2.50E-03 TRUCK15 Truck Traffic 3.05E-04 2.50E-03 TRUCK16 Truck Traffic 3.05E-04 2.50E-03 TRUCK17 Truck Traffic 3.05E-04 2.50E-03 TRUCK18 Truck Traffic 3.05E-04 2.50E-03 TRUCK19 Truck Traffic 3.05E-04 2.50E-03 TRUCK20 Truck Traffic 3.05E-04 2.50E-03 TRUCK21 Truck Traffic 3.05E-04 2.50E-03 TRUCK22 Truck Traffic 3.05E-04 2.50E-03 TRUCK23 Truck Traffic 3.05E-04 2.50E-03 TRUCK24 Truck Traffic 3.05E-04 2.50E-03 TRUCK25 Truck Traffic 3.05E-04 2.50E-03 TRUCK26 Truck Traffic 3.05E-04 2.50E-03 TRUCK27 Truck Traffic 3.05E-04 2.50E-03 TRUCK28 Truck Traffic 3.05E-04 2.50E-03 TRUCK29 Truck Traffic 3.05E-04 2.50E-03 TRUCK30 Truck Traffic 3.05E-04 2.50E-03 TRUCK31 Truck Traffic 3.05E-04 2.50E-03 TRUCK32 Truck Traffic 3.05E-04 2.50E-03 TRUCK33 Truck Traffic 3.05E-04 2.50E-03 TRUCK34 Truck Traffic 3.05E-04 2.50E-03 TRUCK35 Truck Traffic 3.05E-04 2.50E-03 TRUCK36 Truck Traffic 3.05E-04 2.50E-03 TRUCK37 Truck Traffic 3.05E-04 2.50E-03 TRUCK38 Truck Traffic 3.05E-04 2.50E-03 TRUCK39 Truck Traffic 3.05E-04 2.50E-03
Air Quality Control General Permit Page 13 of 35 4/23/2012 for Crushing and Screening Plants
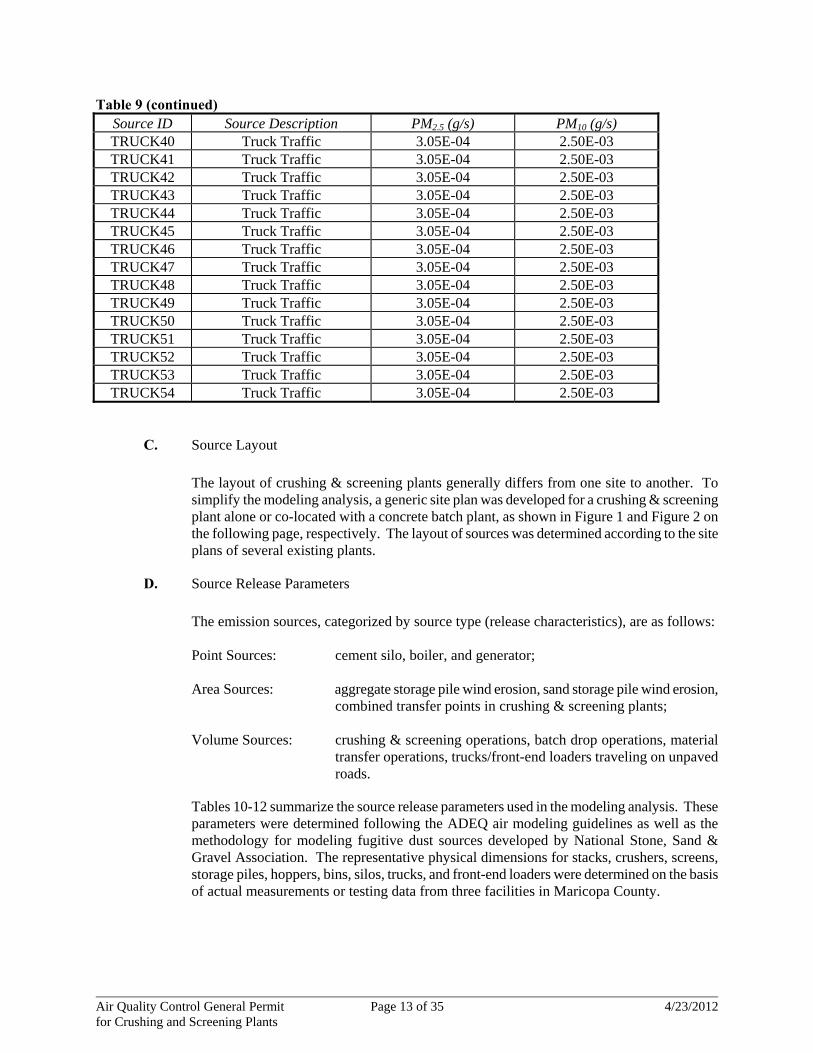
Table 9 (continued) Source ID Source Description PM2.5 (g/s) PM10 (g/s) TRUCK40 Truck Traffic 3.05E-04 2.50E-03 TRUCK41 Truck Traffic 3.05E-04 2.50E-03 TRUCK42 Truck Traffic 3.05E-04 2.50E-03 TRUCK43 Truck Traffic 3.05E-04 2.50E-03 TRUCK44 Truck Traffic 3.05E-04 2.50E-03 TRUCK45 Truck Traffic 3.05E-04 2.50E-03 TRUCK46 Truck Traffic 3.05E-04 2.50E-03 TRUCK47 Truck Traffic 3.05E-04 2.50E-03 TRUCK48 Truck Traffic 3.05E-04 2.50E-03 TRUCK49 Truck Traffic 3.05E-04 2.50E-03 TRUCK50 Truck Traffic 3.05E-04 2.50E-03 TRUCK51 Truck Traffic 3.05E-04 2.50E-03 TRUCK52 Truck Traffic 3.05E-04 2.50E-03 TRUCK53 Truck Traffic 3.05E-04 2.50E-03 TRUCK54 Truck Traffic 3.05E-04 2.50E-03
C. Source Layout
The layout of crushing & screening plants generally differs from one site to another. To simplify the modeling analysis, a generic site plan was developed for a crushing & screening plant alone or co-located with a concrete batch plant, as shown in Figure 1 and Figure 2 on the following page, respectively. The layout of sources was determined according to the site plans of several existing plants.
D. Source Release Parameters
The emission sources, categorized by source type (release characteristics), are as follows:
Point Sources: cement silo, boiler, and generator; Area Sources: aggregate storage pile wind erosion, sand storage pile wind erosion,
combined transfer points in crushing & screening plants; Volume Sources: crushing & screening operations, batch drop operations, material
transfer operations, trucks/front-end loaders traveling on unpaved roads.
Tables 10-12 summarize the source release parameters used in the modeling analysis. These parameters were determined following the ADEQ air modeling guidelines as well as the methodology for modeling fugitive dust sources developed by National Stone, Sand & Gravel Association. The representative physical dimensions for stacks, crushers, screens, storage piles, hoppers, bins, silos, trucks, and front-end loaders were determined on the basis of actual measurements or testing data from three facilities in Maricopa County.

Air Quality Control General Permit Page 14 of 35 4/23/2012 for Crushing and Screening Plants
Figure 1: Source Layout of a Generic Crushing & Screening Plant (refer to Table 8 and Table 9 for
detailed source descriptions)
CS_WEFS
CS_WEAS
CS_TRANS
CSLT01-28
CS_PCRSH
CS_SCRSH
CS_TCRSH
CS_FSCR
TRUCK01-45
GEN_LRG
CS_SCR2 CS_SCR1

Air Quality Control General Permit Page 15 of 35 4/23/2012 for Crushing and Screening Plants
Figure 2: Source Layout of a Generic Crushing and Screening Plant Co-located with a Concrete Batch Plant (refer to Tables 7-9 for detailed source descriptions)
GEN_LRG
CBP_BOIL
CS_WEFS
CS_TRANS
CS_WEAS
CSLT01-28
CS_SCR1 CS_SCR2
CS_PCRSH
CS_SCRSH
CS_FSCR
CS_TCRSH
CBP_SDGS
CBP_WEAS CBP_WESS
CBP_ADGS
CBP_ATCCBP_STC
CBP_CSTS/CTCS
CBP_ATEB
CBP_TML
CBP_STEB
TRUCK01-54
CBP_WHL
CBPLT01-03

Air Quality Control General Permit Page 16 of 35 4/23/2012 for Crushing and Screening Plants
Table 10: Modeling Source Parameters for Crushing & Screening Plant Area Source
Source ID Source
Description
Release Height
(m)
X-Length (m)
Y-Length (m)
Angel (degree)
CS_WEAS Aggregate
Storage Pile 1.83 60.96 60.96 0.00
CS_WEFS Fines Storage
Pile 1.83 182.88 45.72 0.00
CS_TRANS Transfer Points 1.52 192.02 192.02 0.00 Volume Sources
Source ID Source Description Release Height
(m)
Initial Horizontal Dimensions
(m)
Initial Vertical Dimensions
(m)
CS_PCRSH Primary Crusher-Jaw 5.18 0.43 2.41 CS_SCR1 Screen #1 7.62 0.85 3.54 CS_SCR2 Screen #2 7.62 0.85 3.54 CS_FSCR Fine Screen 7.62 0.85 3.54
CS_SCRSH Secondary Crusher -Core 7.62 0.37 3.54 CS_TCRSH Tertiary Crusher 6.10 0.27 2.83
CSLT01 C&S Loader Traffic 3.00 7.00 2.80 CSLT02 C&S Loader Traffic 3.00 7.00 2.80 CSLT03 C&S Loader Traffic 3.00 7.00 2.80 CSLT04 C&S Loader Traffic 3.00 7.00 2.80 CSLT05 C&S Loader Traffic 3.00 7.00 2.80 CSLT06 C&S Loader Traffic 3.00 7.00 2.80 CSLT07 C&S Loader Traffic 3.00 7.00 2.80 CSLT08 C&S Loader Traffic 3.00 7.00 2.80 CSLT09 C&S Loader Traffic 3.00 7.00 2.80 CSLT10 C&S Loader Traffic 3.00 7.00 2.80 CSLT11 C&S Loader Traffic 3.00 7.00 2.80 CSLT12 C&S Loader Traffic 3.00 7.00 2.80 CSLT13 C&S Loader Traffic 3.00 7.00 2.80 CSLT14 C&S Loader Traffic 3.00 7.00 2.80 CSLT15 C&S Loader Traffic 3.00 7.00 2.80 CSLT16 C&S Loader Traffic 3.00 7.00 2.80 CSLT17 C&S Loader Traffic 3.00 7.00 2.80 CSLT18 C&S Loader Traffic 3.00 7.00 2.80 CSLT19 C&S Loader Traffic 3.00 7.00 2.80 CSLT20 C&S Loader Traffic 3.00 7.00 2.80 CSLT21 C&S Loader Traffic 3.00 7.00 2.80 CSLT22 C&S Loader Traffic 3.00 7.00 2.80 CSLT23 C&S Loader Traffic 3.00 7.00 2.80 CSLT24 C&S Loader Traffic 3.00 7.00 2.80 CSLT25 C&S Loader Traffic 3.00 7.00 2.80 CSLT26 C&S Loader Traffic 3.00 7.00 2.80
Air Quality Control General Permit Page 17 of 35 4/23/2012 for Crushing and Screening Plants
CSLT27 C&S Loader Traffic 3.00 7.00 2.80 CSLT28 C&S Loader Traffic 3.00 7.00 2.80
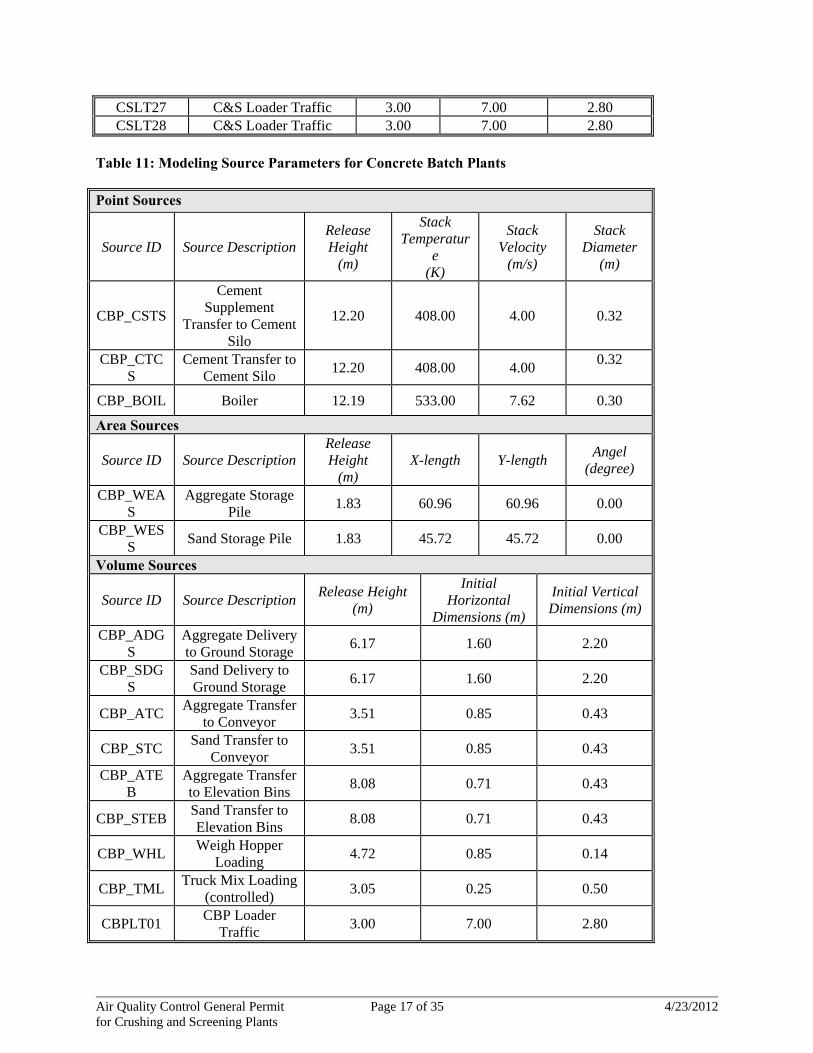
Table 11: Modeling Source Parameters for Concrete Batch Plants Point Sources
Source ID Source Description Release Height
(m)
Stack Temperatur
e (K)
Stack Velocity
(m/s)
Stack Diameter
(m)
CBP_CSTS
Cement Supplement
Transfer to Cement Silo
12.20 408.00 4.00 0.32
CBP_CTCS
Cement Transfer to Cement Silo
12.20 408.00 4.00 0.32
CBP_BOIL Boiler 12.19 533.00 7.62 0.30
Area Sources
Source ID Source Description Release Height
(m) X-length Y-length
Angel (degree)
CBP_WEAS
Aggregate Storage Pile
1.83 60.96 60.96 0.00
CBP_WESS
Sand Storage Pile 1.83 45.72 45.72 0.00
Volume Sources
Source ID Source Description Release Height
(m)
Initial Horizontal
Dimensions (m)
Initial Vertical Dimensions (m)
CBP_ADGS
Aggregate Delivery to Ground Storage
6.17 1.60 2.20
CBP_SDGS
Sand Delivery to Ground Storage
6.17 1.60 2.20
CBP_ATC Aggregate Transfer
to Conveyor 3.51 0.85 0.43
CBP_STC Sand Transfer to
Conveyor 3.51 0.85 0.43
CBP_ATEB
Aggregate Transfer to Elevation Bins
8.08 0.71 0.43
CBP_STEB Sand Transfer to Elevation Bins
8.08 0.71 0.43
CBP_WHL Weigh Hopper
Loading 4.72 0.85 0.14
CBP_TML Truck Mix Loading
(controlled) 3.05 0.25 0.50
CBPLT01 CBP Loader
Traffic 3.00 7.00 2.80

Air Quality Control General Permit Page 18 of 35 4/23/2012 for Crushing and Screening Plants
CBPLT02 CBP Loader
Traffic 3.00 7.00 2.80
CBPLT03 CBP Loader
Traffic 3.00 7.00 2.80
Table 12: Modeling Source Parameters for Other Sources Point Sources
Source ID Source
Description
Release Height
(m)
Stack Temperatur
e (K)
Stack Velocity
(m/s)
Stack Diameter
(m)
GEN_LAR Generator >=
600 hp 6.71 783.00 30.50 0.20
Volume Sources
Source ID Source Description Release Height
(m)
Initial Horizontal Dimensions
(m)
Initial Vertical Dimensions
(m)
TRUCK01 Truck Traffic 3.00 7.00 2.80 TRUCK02 Truck Traffic 3.00 7.00 2.80 TRUCK03 Truck Traffic 3.00 7.00 2.80 TRUCK04 Truck Traffic 3.00 7.00 2.80 TRUCK05 Truck Traffic 3.00 7.00 2.80 TRUCK06 Truck Traffic 3.00 7.00 2.80 TRUCK07 Truck Traffic 3.00 7.00 2.80 TRUCK08 Truck Traffic 3.00 7.00 2.80 TRUCK09 Truck Traffic 3.00 7.00 2.80 TRUCK10 Truck Traffic 3.00 7.00 2.80 TRUCK11 Truck Traffic 3.00 7.00 2.80 TRUCK12 Truck Traffic 3.00 7.00 2.80 TRUCK13 Truck Traffic 3.00 7.00 2.80 TRUCK14 Truck Traffic 3.00 7.00 2.80 TRUCK15 Truck Traffic 3.00 7.00 2.80 TRUCK16 Truck Traffic 3.00 7.00 2.80 TRUCK17 Truck Traffic 3.00 7.00 2.80 TRUCK18 Truck Traffic 3.00 7.00 2.80 TRUCK19 Truck Traffic 3.00 7.00 2.80 TRUCK20 Truck Traffic 3.00 7.00 2.80 TRUCK21 Truck Traffic 3.00 7.00 2.80 TRUCK22 Truck Traffic 3.00 7.00 2.80 TRUCK23 Truck Traffic 3.00 7.00 2.80 TRUCK24 Truck Traffic 3.00 7.00 2.80 TRUCK25 Truck Traffic 3.00 7.00 2.80 TRUCK26 Truck Traffic 3.00 7.00 2.80 TRUCK27 Truck Traffic 3.00 7.00 2.80 TRUCK28 Truck Traffic 3.00 7.00 2.80 TRUCK29 Truck Traffic 3.00 7.00 2.80

Air Quality Control General Permit Page 19 of 35 4/23/2012 for Crushing and Screening Plants
TRUCK30 Truck Traffic 3.00 7.00 2.80 TRUCK31 Truck Traffic 3.00 7.00 2.80 TRUCK32 Truck Traffic 3.00 7.00 2.80 TRUCK33 Truck Traffic 3.00 7.00 2.80 TRUCK34 Truck Traffic 3.00 7.00 2.80 TRUCK35 Truck Traffic 3.00 7.00 2.80 TRUCK36 Truck Traffic 3.00 7.00 2.80 TRUCK37 Truck Traffic 3.00 7.00 2.80 TRUCK38 Truck Traffic 3.00 7.00 2.80 TRUCK39 Truck Traffic 3.00 7.00 2.80 TRUCK40 Truck Traffic 3.00 7.00 2.80 TRUCK41 Truck Traffic 3.00 7.00 2.80 TRUCK42 Truck Traffic 3.00 7.00 2.80 TRUCK43 Truck Traffic 3.00 7.00 2.80 TRUCK44 Truck Traffic 3.00 7.00 2.80 TRUCK45 Truck Traffic 3.00 7.00 2.80 TRUCK46 Truck Traffic 3.00 7.00 2.80 TRUCK47 Truck Traffic 3.00 7.00 2.80 TRUCK48 Truck Traffic 3.00 7.00 2.80 TRUCK49 Truck Traffic 3.00 7.00 2.80 TRUCK50 Truck Traffic 3.00 7.00 2.80 TRUCK51 Truck Traffic 3.00 7.00 2.80 TRUCK52 Truck Traffic 3.00 7.00 2.80 TRUCK53 Truck Traffic 3.00 7.00 2.80 TRUCK54 Truck Traffic 3.00 7.00 2.80
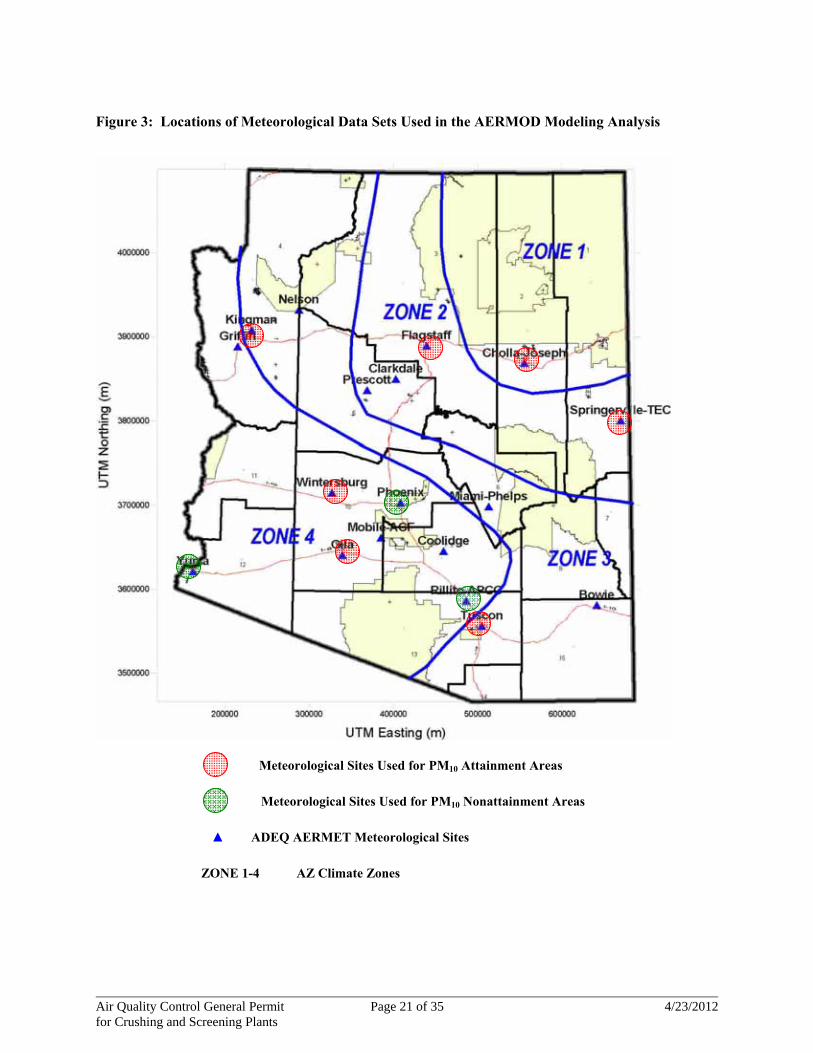
E. Meteorological Data
As shown in Table 13 below, seven meteorological data sets were used to represent the meteorological conditions for PM10 attainment areas and three meteorological data sets for PM10 non-attainment areas, respectively. All meteorological data are ADEQ AERMET pre-processed data sets, which have been widely used by air permit applicants for regulatory air quality dispersion modeling. The locations of meteorological data sets are shown in Figure 3.

Air Quality Control General Permit Page 20 of 35 4/23/2012 for Crushing and Screening Plants
Table 13:Meteorological Data Sets used for AERMOD Modeling Analysis
Data Set Name Climate
Zone Data Period
For PM10 attainment areas or non-attainment areas?
Joseph city 1 04/01/2005-03/31/2006
Attainment areas
Flagstaff NWS 2 01/01/2001-12/31/2005
Attainment areas
Springerville 2 01/01/1995-12/31/1999
Attainment areas
Kingman NWS 3 01/01/2001-12/31/2005
Attainment areas
Tucson NWS 3 01/01/2001-12/31/2005
Attainment areas
Gila Bend 4 01/01/1994-12/31/1995
Attainment areas
Wintersburg 4 01/01/1994-12/31/1998
Attainment areas
Phoenix NWS 4 01/01/2001-12/31/2005
Non-attainment areas
Yuma 4 01/01/2001-12/31/2005
Non-attainment areas
Rillito 4 06/01/2000-05/31/2005
Non-attainment areas
Air Quality Control General Permit Page 21 of 35 4/23/2012 for Crushing and Screening Plants
Figure 3: Locations of Meteorological Data Sets Used in the AERMOD Modeling Analysis
Meteorological Sites Used for PM10 Attainment Areas
ZONE 1-4 AZ Climate Zones
▲ ADEQ AERMET Meteorological Sites
Meteorological Sites Used for PM10 Nonattainment Areas

Air Quality Control General Permit Page 22 of 35 4/23/2012 for Crushing and Screening Plants
F. Background Concentrations
Table 14 presents the state-level background concentrations that were used in the modeling analysis. Note that the background concentrations used for PM10, SO2, NO2 and CO are identical to those shown in the General Permit for Concrete Batch Plant. The background concentrations of PM2.5 were determined in accordance with language in EPA’s March 23, 2010 memorandum, “Modeling Procedures for Demonstrating Compliance with PM2.5 NAAQS”. For the annual averaging period, the 3-year average of the annual average PM2.5 concentrations was used as the background concentration. For the 24-hour averaging period, the 3-year average of the 98th percentile 24-hour average PM2.5 concentrations was used as the background concentration. Based on the available monitoring data and attainment/non-attainment classification, the state was classified into four different zones:
1. Pinal County PM2.5 Non-Attainment Area
The monitoring data in this area shows a significant violation for the PM2.5 NAAQS, for both the annual and 24-hour standards. Because a modeling compliance demonstration for this area is not possible, the area will be excluded from the applicable coverage in this General Permit. EPA has finalized a Pinal County PM2.5 non-attainment area, which is larger than Arizona’s recommended area. A modeling analysis was performed to evaluate whether the EPA’s final area or Arizona’s recommended area should be prohibited from this General Permit. The results indicate that the use of Arizona’s recommended area is more appropriate, mainly due to the fact that the impacts from crushing & screening plants are limited to near-source areas (less than 1 km).
2. Santa Cruz County PM2.5 Non-Attainment Area
The PM2.5 exceedance in this area is mainly due to the emissions transported from Nogales, Sonora, Mexico, via nighttime drainage flows. Wood burning, food cooking, open burning, dust emissions, and tailpipe emissions from on-road and off-road vehicles on the Mexico side have been identified as the primary sources for PM2.5. Since the exceedance caused by international transport of emissions is not controllable or preventable, this General Permit may be still applicable to the Santa Cruz County PM2.5 non-attainment area. However, to protect the public health, operations in this area, the Permittee is required to comply with the Department’s PM risk forecasts for the Nogales area..
3. Maricopa County
Maricopa County is a PM2.5 attainment area; however, the monitoring data indicate that the PM2.5 concentrations in this area are significantly higher than other attainment areas. The background concentrations were determined based on the monitoring data collected from four monitors, including JLG Supersite, South
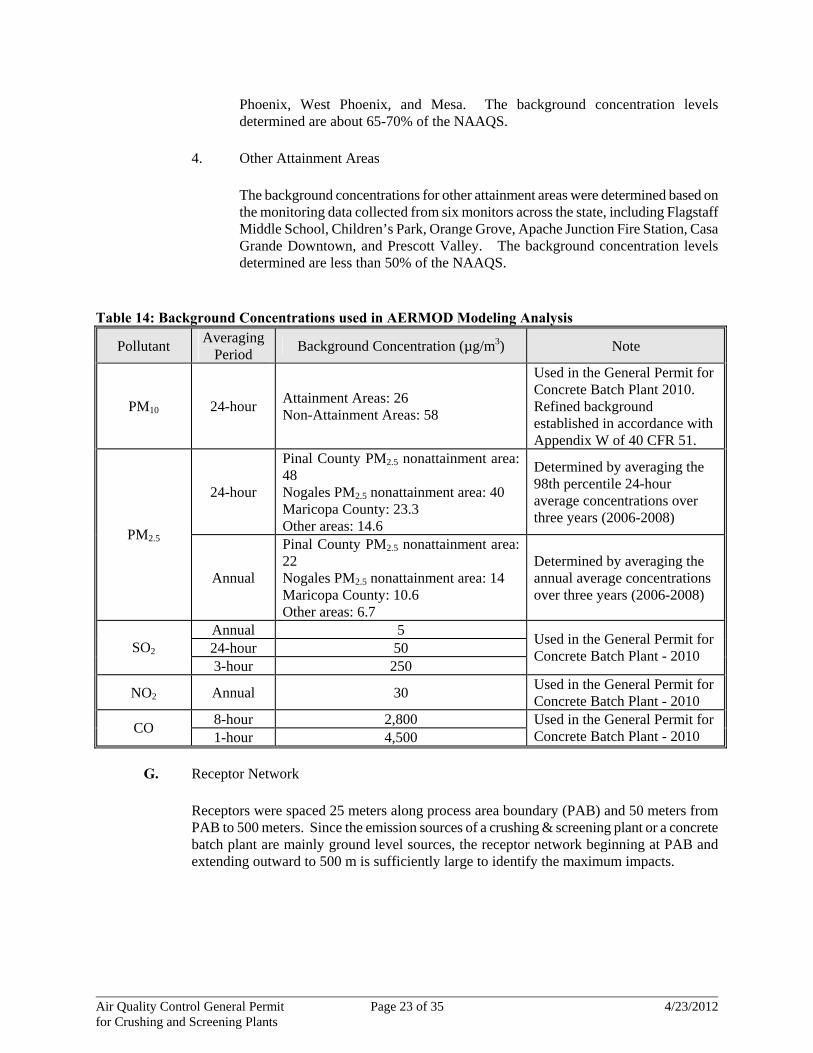
Air Quality Control General Permit Page 23 of 35 4/23/2012 for Crushing and Screening Plants
Phoenix, West Phoenix, and Mesa. The background concentration levels determined are about 65-70% of the NAAQS.
4. Other Attainment Areas
The background concentrations for other attainment areas were determined based on the monitoring data collected from six monitors across the state, including Flagstaff Middle School, Children’s Park, Orange Grove, Apache Junction Fire Station, Casa Grande Downtown, and Prescott Valley. The background concentration levels determined are less than 50% of the NAAQS.
Table 14: Background Concentrations used in AERMOD Modeling Analysis
Pollutant Averaging
Period Background Concentration (µg/m3) Note
PM10 24-hour Attainment Areas: 26 Non-Attainment Areas: 58
Used in the General Permit for Concrete Batch Plant 2010. Refined background established in accordance with Appendix W of 40 CFR 51.
24-hour
Pinal County PM2.5 nonattainment area: 48 Nogales PM2.5 nonattainment area: 40 Maricopa County: 23.3 Other areas: 14.6
Determined by averaging the 98th percentile 24-hour average concentrations over three years (2006-2008)
PM2.5
Annual
Pinal County PM2.5 nonattainment area: 22 Nogales PM2.5 nonattainment area: 14 Maricopa County: 10.6 Other areas: 6.7
Determined by averaging the annual average concentrations over three years (2006-2008)
Annual 5 24-hour 50 SO2 3-hour 250
Used in the General Permit for Concrete Batch Plant - 2010
NO2 Annual 30 Used in the General Permit for Concrete Batch Plant - 2010
8-hour 2,800 CO
1-hour 4,500 Used in the General Permit for Concrete Batch Plant - 2010
G. Receptor Network
Receptors were spaced 25 meters along process area boundary (PAB) and 50 meters from PAB to 500 meters. Since the emission sources of a crushing & screening plant or a concrete batch plant are mainly ground level sources, the receptor network beginning at PAB and extending outward to 500 m is sufficiently large to identify the maximum impacts.

Air Quality Control General Permit Page 24 of 35 4/23/2012 for Crushing and Screening Plants
H. Modeled Scenarios
Table 15: Modeling scenarios for Crushing & Screening Plants
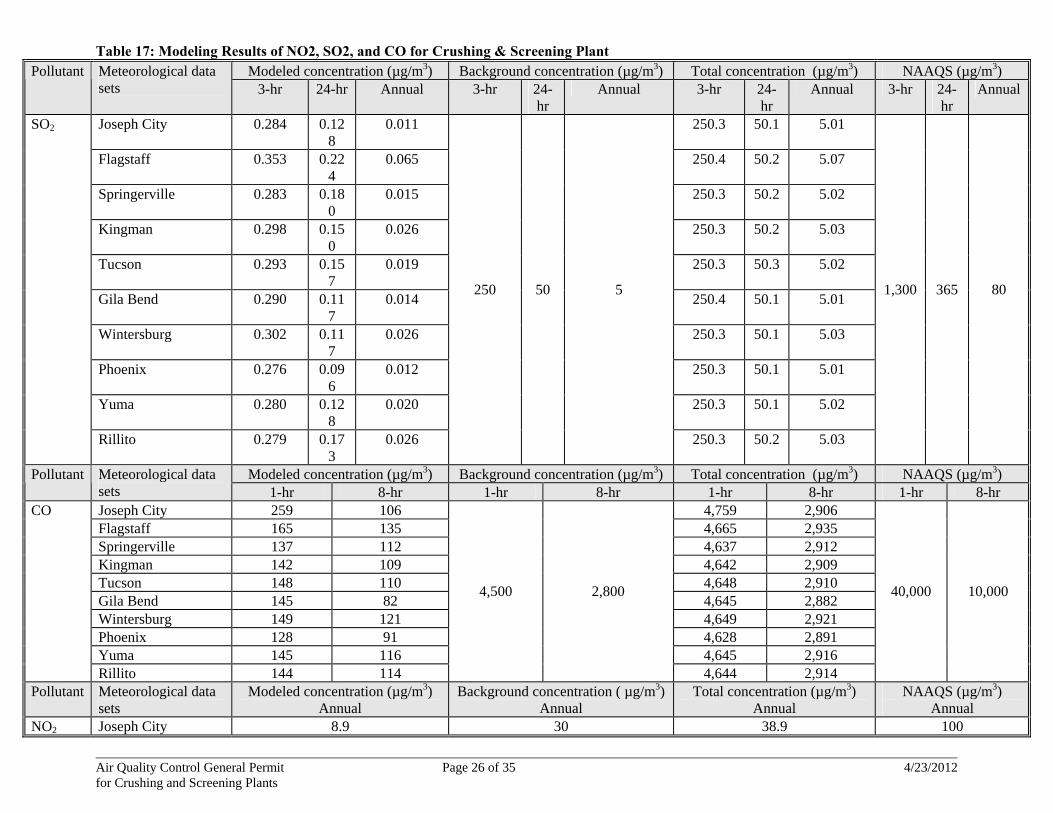
I. Modeled Results
The modeled results for an individual crushing & screening plant are summarized in Table 16 for PM10/PM2.5 and Table 17 for gaseous pollutants, respectively. The modeled results for the co-location of a crushing & screening plant and a concrete batch plant are summarized in Table 18 for PM10/PM2.5 and Table 19 for gaseous pollutants, respectively. Representative background concentrations were added to modeled impacts and the total concentrations were then compared to the NAAQS. As shown in the tables, emissions from a crushing & screening plant and a collocated concrete batch plant will not cause or contribute to a violation of the NAAQS under the operational limits and conditions contained in the General Permit..
The AERMOD modeling analysis also revealed that the modeled impacts from crushing & screening plants were limited to near-field areas. All modeled maximum concentrations for all pollutants under varied meteorological conditions occurred in or near the process area boundary.
Modeling Scenario for Demonstrating the Compliance of NAAQS
Maximum Daily Operation
Facility PM10 Attainment
Area
PM10 Nonattainment Area
PM10 Attainment
Area
PM10 Nonattainment
Area Crushing and
screening plant (C&S)
alone
500 tons/hour 13 hours/day
A large generator
rated 1000 horsepower
315 tons/hour 14 hours/day
A large generator
rated 1000 horsepower
6500 tons/day 4410 tons/day
Co-location of crushing and
screening plant (C&S) and concrete batch plant
(CBP)
C&S: 500 tons/hour 13 hours/day
CBP:
1275 yd3/day
A large generator rated 1000 horsepower
C&S: 315 tons/hour 14 hours/day
CBP:
1275 yd3/day
A large generator rated 1000 horsepower
C&S: 6500 tons/day
CBP: 1275 yd3/day
C&S: 4410 tons/day
CBP: 1275 yd3/day

Air Quality Control General Permit Page 25 of 35 4/23/2012 for Crushing and Screening Plants
Table 16 Modeling Results of PM2.5 and PM10 for Crushing & Screening Plant
aPer EPA’s March 23, 2010 memorandum, “Modeling Procedures for Demonstrating Compliance with PM2.5 NAAQS”, the highest average of the modeled annual averages across five years of National Weather Service (NWS) meteorological data or the highest modeled annual average for one year of site-specific meteorological data was used as the design value. The highest average of the maximum 24-hour averages across five years of NWS meteorological data or the highest modeled 24-hour average for one year of site specific meteorological data was used as the design value. bPer 40 CFR Part 51, “…when n years are modeled, the (n+1)th highest concentration over the n-year period is the design value, since this represents an average or expected exceedance rate of one per year”. For one-year Joseph city data, the H2H (highest second highest) value was used as the design concentration. For two-year Gila Bend data, the H3H (highest third highest) value was used as the design concentration. Since other meteorological data sets include five-year data, the H6H (highest sixth highest) value was used as the design concentration.
Modeled concentration (µg/m3)a
Background concentration (µg/m3) Total concentration (µg/m3)
NAAQS (µg/m3) Pollutant Meteorological data sets
24-hr Annual 24-hr Annual 24-hr Annual 24-hr Annual
Joseph City 15.5 4.6 30.1 11.3 Flagstaff 12.0 4.6 26.6 11.3 Springerville 14.3 4.1 28.9 10.8 Kingman 12.0 3.7 26.6 10.4 Tucson 10.1 4.4 24.7 11.1 Gila Bend 14.0 4.1 28.6 10.8 Wintersburg 11.0 3.2 25.6 9.9 Rillito 9.6 4.0 24.2 10.7 Yuma 7.0 1.7
14.6 6.7
21.6 8.4
PM2.5
Phoenix 10.6 3.5 23.3 10.6 33.9 14.1
35 15
Pollutant Meteorological data sets
Modeled concentration (µg/m3)b 24-hr
Background concentration ( µg/m3) 24-hr
Total concentration (µg/m3) 24-hr
NAAQS (µg/m3) 24-hr
Joseph City 119.3 145.3 Flagstaff 54.5 80.5 Springerville 101.8 127.8 Kingman 92.7 118.7 Tucson 73.7 99.7 Gila Bend 101.4 127.4 Wintersburg 81.6
26
107.6 Phoenix 83.2 141.2 Yuma 34.1 92.1
PM10
Rillito 67.2 58
125.2
150
Air Quality Control General Permit Page 26 of 35 4/23/2012 for Crushing and Screening Plants
Table 17: Modeling Results of NO2, SO2, and CO for Crushing & Screening Plant Modeled concentration (µg/m3) Background concentration (µg/m3) Total concentration (µg/m3) NAAQS (µg/m3) Pollutant Meteorological data
sets 3-hr 24-hr Annual 3-hr 24-hr
Annual 3-hr 24-hr
Annual 3-hr 24-hr
Annual
Joseph City 0.284 0.128
0.011 250.3 50.1 5.01
Flagstaff 0.353 0.224
0.065 250.4 50.2 5.07
Springerville 0.283 0.180
0.015 250.3 50.2 5.02
Kingman 0.298 0.150
0.026 250.3 50.2 5.03
Tucson 0.293 0.157
0.019 250.3 50.3 5.02
Gila Bend 0.290 0.117
0.014 250.4 50.1 5.01
Wintersburg 0.302 0.117
0.026 250.3 50.1 5.03
Phoenix 0.276 0.096
0.012 250.3 50.1 5.01
Yuma 0.280 0.128
0.020 250.3 50.1 5.02
SO2
Rillito 0.279 0.173
0.026
250 50 5
250.3 50.2 5.03
1,300 365 80
Modeled concentration (µg/m3) Background concentration (µg/m3) Total concentration (µg/m3) NAAQS (µg/m3) Pollutant Meteorological data sets 1-hr 8-hr 1-hr 8-hr 1-hr 8-hr 1-hr 8-hr Joseph City 259 106 4,759 2,906 Flagstaff 165 135 4,665 2,935 Springerville 137 112 4,637 2,912 Kingman 142 109 4,642 2,909 Tucson 148 110 4,648 2,910 Gila Bend 145 82 4,645 2,882 Wintersburg 149 121 4,649 2,921 Phoenix 128 91 4,628 2,891 Yuma 145 116 4,645 2,916
CO
Rillito 144 114
4,500 2,800
4,644 2,914
40,000 10,000
Pollutant Meteorological data sets
Modeled concentration (µg/m3) Annual
Background concentration ( µg/m3) Annual
Total concentration (µg/m3) Annual
NAAQS (µg/m3) Annual
NO2 Joseph City 8.9 30 38.9 100
Air Quality Control General Permit Page 27 of 35 4/23/2012 for Crushing and Screening Plants
Flagstaff 52.2 82.2 Springerville 12.0 42.0 Kingman 20.8 50.8 Tucson 15.5 45.5 Gila Bend 11.1 41.1 Wintersburg 20.9 50.9 Phoenix 10.4 40.4 Yuma 17.0 47.0 Rillito 22.3 52.3
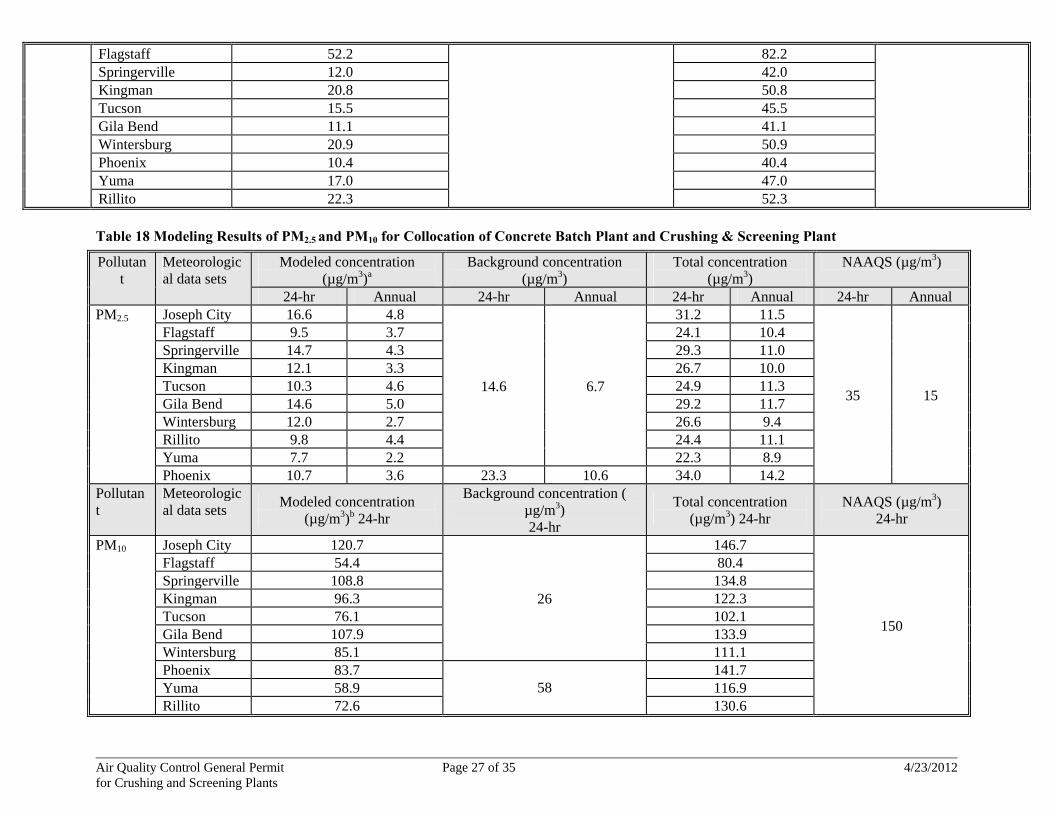
Table 18 Modeling Results of PM2.5 and PM10 for Collocation of Concrete Batch Plant and Crushing & Screening Plant
Modeled concentration (µg/m3)a
Background concentration (µg/m3)
Total concentration (µg/m3)
NAAQS (µg/m3) Pollutant
Meteorological data sets
24-hr Annual 24-hr Annual 24-hr Annual 24-hr Annual Joseph City 16.6 4.8 31.2 11.5 Flagstaff 9.5 3.7 24.1 10.4 Springerville 14.7 4.3 29.3 11.0 Kingman 12.1 3.3 26.7 10.0 Tucson 10.3 4.6 24.9 11.3 Gila Bend 14.6 5.0 29.2 11.7 Wintersburg 12.0 2.7 26.6 9.4 Rillito 9.8 4.4 24.4 11.1 Yuma 7.7 2.2
14.6 6.7
22.3 8.9
PM2.5
Phoenix 10.7 3.6 23.3 10.6 34.0 14.2
35 15
Pollutant
Meteorological data sets
Modeled concentration (µg/m3)b 24-hr
Background concentration ( µg/m3) 24-hr
Total concentration (µg/m3) 24-hr
NAAQS (µg/m3) 24-hr
Joseph City 120.7 146.7 Flagstaff 54.4 80.4 Springerville 108.8 134.8 Kingman 96.3 122.3 Tucson 76.1 102.1 Gila Bend 107.9 133.9 Wintersburg 85.1
26
111.1 Phoenix 83.7 141.7 Yuma 58.9 116.9
PM10
Rillito 72.6 58
130.6
150

Air Quality Control General Permit Page 28 of 35 4/23/2012 for Crushing and Screening Plants
aPer EPA’s March 23, 2010 memorandum, “Modeling Procedures for Demonstrating Compliance with PM2.5 NAAQS”, the highest average of the modeled annual averages across five years of National Weather Service (NWS) meteorological data or the highest modeled annual average for one year of site-specific meteorological data was used as the design value. The highest average of the maximum 24-hour averages across five years of NWS meteorological data or the highest modeled 24-hour average for one year of site specific meteorological data was used as the design value. bPer 40 CFR Part 51, “…when n years are modeled, the (n+1)th highest concentration over the n-year period is the design value, since this represents an average or expected exceedance rate of one per year”. For one-year Joseph city data, the H2H (highest second highest) value was used as the design concentration. For two-year Gila Bend data, the H3H (highest third highest) value was used as the design concentration. Since other meteorological data sets include five-year data, the H6H (highest sixth highest) value was used as the design concentration. Table 19 Modeling Results of NO2, SO2, and CO for Collocation of Concrete Batch Plant and Crushing & Screening Plant
Modeled concentration (µg/m3) Background concentration (µg/m3) Total concentration (µg/m3) NAAQS (µg/m3) Pollutant Meteorological data sets 3-hr 24-hr Annual 3-hr 24-hr Annual 3-hr 24-hr Annual 3-hr 24-hr Annual Joseph City 0.343 0.079 0.012 250.3 50.1 5.01 Flagstaff 0.351 0.181 0.057 250.4 50.2 5.06 Springerville 0.279 0.142 0.017 250.3 50.1 5.02 Kingman 0.286 0.158 0.025 250.3 50.2 5.03 Tucson 0.304 0.164 0.023 250.3 50.2 5.02 Gila Bend 0.255 0.129 0.016 250.3 50.1 5.02 Wintersburg 0.300 0.126 0.027 250.3 50.1 5.03 Phoenix 0.258 0.115 0.019 250.3 50.1 5.02 Yuma 0.298 0.132 0.022 250.3 50.1 5.02
SO2
Rillito 0.279 0.174 0.028
250 50 5
250.3 50.2 5.03
1,300 365 80
Modeled concentration (µg/m3) Background concentration (µg/m3) Total concentration (µg/m3) NAAQS (µg/m3) Pollutant Meteorological data sets 1-hr 8-hr 1-hr 8-hr 1-hr 8-hr 1-hr 8-hr Joseph City 274 86 4,774 2,886 Flagstaff 168 139 4,668 2,939 Springerville 135 100 4,635 2,900 Kingman 139 107 4,639 2,907 Tucson 148 117 4,648 2,917 Gila Bend 139 77 4,639 2,877 Wintersburg 149 102 4,649 2,902 Phoenix 128 90 4,628 2,890 Yuma 150 116 4,650 2,916
CO
Rillito 140 114
4,500 2,800
4,640 2,914
40,000 10,000
Pollutant Meteorological data sets
Modeled concentration (µg/m3) Annual
Background concentration ( µg/m3) Annual
Total concentration (µg/m3) Annual
NAAQS (µg/m3) Annual
Joseph City 5.5 35.5 Flagstaff 36.5 66.5
NO2
Springerville 10.2
30
40.2
100
Air Quality Control General Permit Page 29 of 35 4/23/2012 for Crushing and Screening Plants
Kingman 11.5 41.5 Tucson 15.8 45.8 Gila Bend 5.0 35.0 Wintersburg 10.2 40.2 Phoenix 10.7 40.7 Yuma 17.1 47.1 Rillito 22.5 52.5
VI. LIST OF ABBREVIATIONS
A.A.C. .................................................................................................................................................................. Arizona Administrative Code ADEQ .......................................................................................................................................Arizona Department of Environmental Quality ATO .............................................................................................................................................................................Authorization to Operate BACT..........................................................................................................................................................Best Available Control Technology C&S .............................................................................................................................................................................. Crushing and Screening CBP....................................................................................................................................................................................Concrete Batch Plant CFR........................................................................................................................................................................Code of Federal Regulations CO.......................................................................................................................................................................................... Carbon Monoxide EPA ..............................................................................................................................................................Environmental Protection Agency HAP ..............................................................................................................................................................................Hazardous Air Pollutant MMBtu/hr ...................................................................................................................................Million British Thermal Units per Cubic Foot lb/hr ...........................................................................................................................................................................................Pound per Hour µg/m3...................................................................................................................................................................... Microgram per Cubic Meter NAAQS...............................................................................................................................................National Ambient Air Quality Standards NOV..................................................................................................................................................................................... Notice of Violation NOx .........................................................................................................................................................................................Nitrogen Oxides NSPS..........................................................................................................................................................New Source Performance Standards PAB................................................................................................................................................................................Process Area Boundary PM ..........................................................................................................................................................................................Particulate Matter PM10 .............................................................................................................................Particulate Matter Nominally less than 10 Micrometers PM2.5 ...........................................................................................................................Particulate Matter Nominally less than 2.5 Micrometers PTE ......................................................................................................................................................................... Permanent Total Enclosure SIP ................................................................................................................................................................................. State Implantation Plan SO2 ...............................................................................................................................................................................................Sulfur Dioxide VOC....................................................................................................................................................................... Volatile Organic Compound

Air Quality Control General Permit 30 of 35 4/23/2012 for Crushing and Screening Plants
AIR QUALITY CONTROL GENERAL PERMIT FOR CRUSHING AND SCREENING PLANTS APPENDIX “A”
Air Quality Control General Permit 31 of 35 4/23/2012 for Crushing and Screening Plants
AIR QUALITY CONTROL GENERAL PERMIT FOR CRUSHING AND SCREENING PLANTS APPENDIX “B”
Air Quality Control General Permit 32 of 35 4/23/2012 for Crushing and Screening Plants
AIR QUALITY CONTROL GENERAL PERMIT FOR CRUSHING AND SCREENING PLANTS APPENDIX “C”
Air Quality Control General Permit 33 of 35 4/23/2012 for Crushing and Screening Plants
AIR QUALITY CONTROL GENERAL PERMIT FOR CRUSHING AND SCREENING PLANTS APPENDIX “D”

Air Quality Control General Permit 34 of 35 4/23/2012 for Crushing and Screening Plants
AIR QUALITY CONTROL GENERAL PERMIT FOR CRUSHING AND SCREENING PLANTS APPENDIX “E”
Air Quality Control General Permit 35 of 35 4/23/2012 for Crushing and Screening Plants
AIR QUALITY CONTROL GENERAL PERMIT FOR CRUSHING AND SCREENING PLANTS APPENDIX “F”: MAP OF THE COCHISE COUNTY NON-ATTAINMENT AREA