technical report udc 543 . 5 : 549 . 1 : 622 . 785 ... xrd-rietveld method ... these values are...
TRANSCRIPT

NIPPON STEEL & SUMITOMO METAL TECHNICAL REPORT No. 118 MARCH 2018
- 65 -
UDC 543 . 5 : 549 . 1 : 622 . 785Technical Report
Quantitative Analysis of Mineral Phases in Sinter Ore by XRD-Rietveld Method
Toru TAKAYAMA* Reiko MURAO
AbstractQuantitative analysis of mineral phases in sinter ore by micro-texture observation is dif-
ficult, due to inhomogeneous distribution of multi phases. Although powder X-ray diffrac-tion is one solution, other options include identification of calcium ferrite phases with com-plex and similar crystal structure. In this study, the Rietveld method was applied for the quantification of sinter ore, which is based on the least-square fitting of the entire XRD pattern using crystal structure models and refinements of the crystal structure parameters. As a result, identification of several calcium-ferrite phases in sinter ore and quantification of mineral phases including calcium-ferrites in sinter ore were successfully conducted. These values are influenced by the history of the sintering reaction.
1. IntroductionDeterioration in the quality of sinter ore due to the influence of
degradation in the quality of the iron ore resource is an issue in the iron-making process. Since the characteristics of sinter ore (strength, reducibility, reduction of degradation etc.) are influenced by sinter microstructures such as mineral phase, particle size, pore etc., accu-rate estimation of the influence of raw iron ore variation on sinter quality is required. In the case of a sinter ore which has inhomoge-neous microstructure, it is difficult to obtain representative data by microscopic observation.
This study investigated the quantification of the crystalline phase in sinter ore by powder X-ray diffraction through the development of quantitative analysis techniques for the mineral phase. The major mineral phases that are composed of sinter ore microstructure are: hematite (α-Fe2O3), magnetite (Fe3O4), calcium ferrite and silicate slag. These phases are complexly distributed together with pores, and are responsible for the development of sinter ore characteristics. In particular, understanding the calcium-ferrite phase that is formed from calcium ferrite melt and bonds the nucleus particles of iron ore is important to clarify the quality and the formation reaction kinetics of sinter ore. 1–10) The calcium-ferrites in sinter ore are multi-compo-nent continuous solid solutions containing gangue compositions such as silica and alumina. The silico-ferrite of calcium and alumi-num (SFCA) {Ca2(Ca, Fe, Al)6(Fe, Al, Si)6O20} and its homolog as SFCA-I {Ca3(Ca, Fe) (Fe, Al)16O28} and SFCA-II {Ca4(Fe, Al)20O36}
have chemical compositions and crystalline structures that are dif-ferent from those of SFCA. 4, 5)
The crystalline structures of these phases are complicated, re-semble each other, and their compositions in sinter ore (type and volume of dissolved element) are wide-ranging, thus rendering them different from the materials registered in the crystalline structure da-tabase. Accordingly, it is difficult to identify and determine the quantity of these calcium ferrites in sinter ore by the conventional powder X-ray diffraction method. Therefore, little quantitative anal-ysis of mineral phases that contained multicomponent calcium fer-rites in actual sinter ore has been conducted.
Therefore, in this study, the Rietveld method, 11, 12) an analysis technique that uses powder XRD patterns to determine the crystal structure and quantify the co-existing crystalline phases, is per-formed to evaluate the sinter microstructure. The Rietveld method calculates the crystal structure parameters of mineral phases based on initial crystalline structure models including lattice constants, atomic coordinates and their mass fractions. Then the entire simulat-ed XRD patterns is compared with the calculated one, and these pa-rameters are determined by the least square method so that the re-sidual of them is minimum. This method is characterized by its abil-ity to accurately determine the quantity of the mass fraction of the respective mineral phase in a material with multi phases, the diffrac-tion peaks of which overlap each other. Furthermore, this method can determine the crystalline structure of materials that are continu-
* Researcher, Materials Characterization Research Lab., Advanced Technology Research Laboratories 20-1 Shintomi, Futtsu City, Chiba Pref. 293-8511

- 66 -
NIPPON STEEL & SUMITOMO METAL TECHNICAL REPORT No. 118 MARCH 2018
ous solid solutions having a complicated crystalline structure and a wide solid solution range such as multi-component calcium ferrites by refining the crystalline structure factors such as the lattice con-stant and atomic coordinates of a mineral phase. In addition, the re-sults of the Rietveld method exhibit high repeatability and low arbi-trariness as far as using the same initial model and the fitting proce-dure.
In this study, the effectiveness of Rietveld analysis for the quan-titative evaluation of mineral phases in sinter ore was verified by analysis of the sinter ore samples with different mechanical strengths. Then, the mass fraction or crystal structure parameters of mineral phases in sinter ore was conducted to compare the chemical composition or the mechanical strength with them.
2. Experiment2.1 Preparation of sample
The sinter ore sample was prepared by charging materials to a cylindrical sintering pot of 300 mm in diameter and 600 mm in height carefully to avoid grain size segregation, and then by burning (Fig. 1 (a)). The quasiparticles of the starting material were prepared in the following manner. Lime stone was blended so that CaO is contained by 8.2 mass%, silica stone and olivine were added so that the basicity of CaO/SiO2 becomes 1.6 (weight ratio), and coke of 4.5 mass% and water of 7.0 mass% were added outside the above figures. These materials were granulated in a five-minute drum-mix-er operation. The weight and density of the quasiparticle were 60 kg and 1.62 t/m3, respectively. The top surface layer of the sample in the sinter pot was heated for 90 seconds by burners and the exhaust gas was suctioned by a blower at a constant negative pressure of 8 kPa. The heating patterns of the sinter ore at the top layer (Sample A), middle layer (Sample B) and the bottom layer (Sample C) meas-ured by thermocouples are shown in Fig. 1 (b).
After burning, the sinter cake was removed from the sintering pot and was divided into three layers evenly in the height direction, and a shatter index test (JIS M 8711) was performed using each lay-er sample (Table 1). Samples with particle sizes of 5 mm or above were taken from each layer and were pulverized to particles of an average 10 μm in size by a vibration mill. The powder sinter ore samples were subjected to powder XRD measurement and chemical composition analysis. The chemical composition was determined by the following methods: Iron ores-Determination of the total iron content (JIS M 8212), Iron ores-Method for determination of the acid soluble iron (II) content (JIS M 8213), Iron ores-Method for determination of the calcium content (JIS M 8221), Iron ores-Meth-od for determination of the silicon content (JIS M 8214) and Iron ores-Method for determination of the aluminum content (JIS M
8220).Additionally, the standard specimens of calcium ferrite single-
phase used for verification of analytical accuracy of the Rietveld method were synthesized by the conventional powder sintering method.2.2 X-ray diffraction (XRD) measurement
The sinter ore powder was filled into a sample holder made of glass plate (sample section: 20 mm width × 18 mm height × 0.2 mm depth), and the XRD measurement was conducted by an XRD meas urement device (Ultima-III manufactured by Rigaku Corpora-tion). The X-ray source was a Cu Kα radiation. The tube current and the tube voltage were set at 40 mA and 40 kV, respectively. The one-dimensional detector (D/teX Ultra, Rigaku) was used with a Kβ filter and the measurement was conducted by a concentrated optical system.
The measurement was conducted using a stepped scanning method under the condition of a measuring angle range of 2θ = 10–140°, step width of (Δ2θ) = 0.020° and scanning speed = 1°/min. The divergence slit (DS) was 2/3° and the vertical divergence limitation slit was10 mm. Under this condition, the width of the radiation range becomes larger than the width of the sample in the range of low an-gle of 2θ = 10–19° (20 mm). However, it was prioritized and deter-mined to obtain a sufficient radiation range area in a high angle range because of the high mineral phase distribution inhomogeneity in the sinter ore sample. All X-rays out of the sample were consid-ered as radiated to the sample and diffracted, and a correction of 1.66 × 10⁻¹/sin θ times was rendered to the diffracted ray intensity in the range.2.3 Rietveld analysis2.3.1 Outline of Rietveld analysis 11, 12)
The Rietveld analysis, which is the least square refreshment technique of powder XRD, optimizes scale factor (S), crystal struc-ture factor (FK), preferred orientations (PK), and other parameters of each mineral phase by calculating the diffraction intensities in the i-th step ( fi (x)) of each phase, as given by Eq. (1) 11, 12); this analysis is performed until the best fit is obtained between the observed pow-der diffraction pattern and the sum of the calculated patterns of each phase. 11, 12)
Fi (x) = sSR(θi) A (θi) D (θi) ∑K mK |FK|2 PK L (θi,K) Φ (Δ2θi,K) + yb (2θi) (1)Where
x: structural parameters (lattice constant, atomic coordinate, atom displacement parameter etc.) used when diffraction an-gle 2θ and crystalline structure factor are calculated
s: scale factorSR (θi): correction factor for sample surface roughnessA (θi): absorption factorD (θi): constant radiation correction factorK: numerical value indicating the type of reflection contributing
to Bragg reflection intensityFig. 1 (a) Schematic illustration of the sinter pot test, and (b) Heating
patterns of each layer in the pot 19)
Table 1 Results of a shutter test of each layer 19)
Sample SI /mass%Sample A 73.3Sample B 85.9Sample C 89.7
* SI: Weight of grains over + 5 mm after shatter test / total sample weight

NIPPON STEEL & SUMITOMO METAL TECHNICAL REPORT No. 118 MARCH 2018
- 67 -
mK: multiplicity of Bragg reflection at the K th stepFK: crystalline structure factorPK: preferred orientation functionL (θi,K): Lorentz polarization factorθi,K: Bragg angleΦ (Δ2θi,K): profile functionyb (2θi): background function.The mass fraction Rh of the h th phase is given by Formula (2).
Rh = (sh Zh Mh Vh ) / (∑j sj Zj Mj Vj ) (2)
Wheresj, sh: scale factor of the phases j and hZj, Zh: chemical formula number of phase j and h in a unit cellMj, Mh: chemical formula mass of phase j and hVj, Vh: unit cell volume of component j and h.For background correction, B-spline method, and for peak pro-
file function, divided pseudo-Voigt function were used, respectively. In addition, preferred orientation was corrected by the March-Dol-lase function.
Parameters to be refined in this analysis are the background function, lattice constant, profile function and crystalline structure factor of the respective mineral phase. The secondary profile param-eters V and W of the profile function, which are the values that de-pend on the optical system, were not optimized in this refinement. Similarly, the isotropic temperature factor T of the crystalline struc-ture factors was also not refined. Furthermore, as the number of at-oms that constitute SFCA and SFCA-I is large, and the influence of oxygen on the crystalline structure is considered small as compared with positive ions, the coordinate of oxygen atoms was fixed. The
fixation of the oxygen atomic coordinate was confirmed as exerting no influence on the phase fraction and other parameters in a separate manner.
The acceptability of the analysis result was judged by the weighted reliability factor Rwp and an indicator S (goodness-of-fit in-dicator). These indicators were given by the following formulae of (3) and (4).
Rwp = (3)
S = (4)
Wherewi: statistical weightyi: observed intensityN: the number of observation pointsP: number of parameters adjusted.For Rietveld analysis, Rigaku-manufactured powder X-ray anal-
ysis software PDXL ver.2.1 was used.2.3.2 Selection of crystalline structural model to be applied to sinter
oreTo execute profile-fitting in Rietveld analysis, the major mineral
phases and their initial models of crystalline structure factors con-tained in the sample are to be determined. The mineral phases and the crystalline structure database number (ICDD) of the crystalline structure factors determined for the initial model are shown in Table 2.
α-Fe2O3 13), Fe3O4
14), SFCA phase 3) and SFCA-I phase 4) of multi-
∑ iwi {yi − fi (x)}2
∑ iwi yi
2
12
∑ iwi {yi − fi (x)}2
N − P
12
Table 2-1 Crystal lattice constants of major mineral phases used for initial structural models 19)
Crystal phaseMajor phases
α-Fe2O3 Fe3O4
Ca2.8Fe8.7Al1.2Si0.8O20
(SFCA)Ca3.14Fe15.48Al1.34O28
(SFCA-I)Ca2SiO4
Crystal structure
Space Group: R-3c,a = 0.50352 nm, b = 0.50352 nm,c = 1.37508 nm,α = 90.000°, β = 90.000°,γ = 120.000°,V = 0.301921 nm3
Space Group: Fd-3m,a = 0.84045 nm, b = 0.84045 nm,c = 0.84045 nm,α = 90.000°, β = 90.000°,γ = 90.000°,V = 0.593657 nm3
Space Group: P1_
,a = 0.90610 nm, b = 1.00200 nm,c = 1.09200 nm,α = 60.300°, β = 73.680°,γ = 65.810°,V = 0.781762 nm3
Space Group: P1_
,a = 1.03922 nm, b = 1.05945 nm,c = 1.17452 nm,α = 94.308°, β = 111.293°,γ = 109.647°,V = 1.105700 nm3
Space Group: P21/n,a = 0.55160 nm, b = 0.67620 nm,c = 0.93292 nm,α = 90.000°, β = 94.313°,γ = 90.000°,V = 0.346991 nm3
ReferencesPerkins et al. 13)
(ICDD:01-080-2377)Fjellvåg et al. 14)
(ICDD: 01-089-0688)Hamilton et al. 3)
(ICDD: 01-080-0850)Mumme et al. 4)
(ICDD: 00-052-1258)Mori et al. 15)
(ICDD: 01-076-3608)
Table 2-2 Crystal lattice constants of miner mineral phases used for initial structural models 19)
Crystal phaseMiner phases
Fe0.925O(FeO)
Ca2Fe15.51O25
(CFF)Ca2Fe2O5 α-SiO2
Crystal structure
Space Group: Fm-3m,a = 0.43064 nm, b = 0.43064 nm,c = 0.43064 nm,α = 90.000°, β = 90.000°, γ = 90.000°,V = 0.079863 nm3
Space Group: R32,a = 0.60110 nm, b = 0.60110 nm,c = 9.46900 nm,α = 90.000°, β = 90.000°, γ = 120.000°,V = 2.962977 nm3
Space Group: Icmm,a = 0.56432 nm, b = 1.50701 nm,c = 0.54859 nm,α = 90.000°, β = 90.000°, γ = 90.000°,V = 0.466541 nm3
Space Group: P1,a = 0.49160 nm, b = 0.49170 nm,c = 0.54070 nm,α = 90.000°, β = 90.000°, γ = 120.000°,V = 0.113118 nm3
ReferencesFjellvåg et al. 14)
(ICDD: 01-089-0686)Karpinskii et al. 16)
(ICDD: 01-078-2301)Berastegui et al. 17)
(ICDD: 01-089-8668)Pakhomov et al. 18)
(ICDD: 01-077-1060)

- 68 -
NIPPON STEEL & SUMITOMO METAL TECHNICAL REPORT No. 118 MARCH 2018
component calcium ferrites and dicalcium silicate (Ca2SiO4) 15) of sili-
cate slag were selected as the major composition phases in sinter ore.Furthermore, although not clearly observed in microstructure
observation by using XRD and/or a microscope, the following phases were added as minor mineral phases. They are: wustite (FeOx)
14) that may be formed in the neighborhood of coke in a strong reducing atmosphere, dicalcium ferrite (Ca2Fe2O5)
16) and CFF (Ca2Fe15.51O25)
17) of pseudo two composition systems that may be formed under a condition wherein gangue scarcely dissolves into the melt of calcium ferrites. In addition, α-SiO2 that originated from gangue in iron ore, and/or from silica stone added for basicity ad-justment was added.
Rietveld analysis was conducted by refining stepwise the crys-talline structure factors and profile function of the respective miner-al phase. In the first place, in the order from α-Fe2O3 to α-SiO2 as shown in Table 2, the lattice constant and profile function were re-fined simultaneously. After that, the crystalline structure factors of the major mineral phases were refined in the order from α-Fe2O3 to Ca2SiO4 sequentially. Refining for the minor mineral phase was lim-ited to the lattice constant and profile function.
3. Result and Discussions3.1 Evaluation of quantitative analysis accuracy of Rietveld
methodUsing the single phase sample of di-calcium ferrite (2CaO-
Fe2O3) and mono-calcium ferrite (CaO-Fe2O3) composed by the powder sintering method, quantitative analysis accuracy of Rietveld analysis was evaluated. Phase fraction was sought by using XRD measurement and Rietveld analysis regarding the mixture of sam-ples wherein the ratio of the single phase samples was varied, and the result was compared with the nominal weight fraction of the mixture. In Rietveld analysis, only lattice constant and profile pa-rameters were refined. In Fig. 2, the relationship between the pre-pared composition ratios and the phase fractions determined by Rietveld analysis is shown. There was a mean relative deviation of about 7% between the phase fraction of di-calcium ferrite deter-mined by Rietveld analysis and the actual nominal weight fraction. In the samples with the prepared mix ratios of less than 10%, the quantification accuracy decreased and the relative deviation in-creased to 10%–25%, which is allowable for comparative quantifi-cation analysis.3.2 Result of quantification of phase fraction of constituent
phase of sinter ore sampleXRD patterns of Sample A, B and C and the identification re-
sults of diffraction peaks of major mineral phases are shown in Fig. 3. The differences among the peak intensities of calcium ferrites of each sample are small, and the quantification and the refinement of the crystalline structure of the respective mineral phase only by comparing the peak intensity are difficult. Rietveld analysis was ap-plied to these diffraction patterns and the obtained results are shown in Fig. 4 and Table 3. Figure 4 shows the measured XRD pattern and the calculated XRD pattern refined by Rietveld analysis (shown in the upper section) and the residual difference between the two
Fig. 3 XRD patterns of sinter samples A, B and C 19)
● : α-Fe2O3, ○ : Fe3O4, ◇ : SFCA, ♦ : SFCA-I, ▲ : Ca2SiO4, ◎ : FeO, ■ : CFF, △ : SiO2
Fig. 2 Relationship of nominal mass fraction of mixture of Ca2Fe2O5 and CaFe2O4, and its quantitative value determined by Rietveld method 19)
Fig. 4 Comparison of the measured (solid line) and the calculated (dotted line) XRD patterns of sinter samples A, B and C 19)
Differential of the profiles were shown in the bottom region of the figure.

NIPPON STEEL & SUMITOMO METAL TECHNICAL REPORT No. 118 MARCH 2018
- 69 -
(shown in the section below). Table 3 shows the mass fractions of the mineral phases obtained by Rietveld analysis and the reliability factor (Rwp, S) of the respective sample.
Rietveld analysis provided us with mass fractions of not only the main constituents, such as α-Fe2O3, Fe3O4, SFCA, SFCA-I, Ca2SiO4, but also the less than 5 mass% minor mineral phases such as FeOx, CFF and α-SiO2. In the samples, the iron oxides, α-Fe2O3 and Fe3O4occupied slightly over 50 mass% of the entire mass, and the multi-component calcium ferrites (SFCA + SFCA-I) occupied 35 mass% of the in the sinter ore samples, and less than 10 mass% slag (Ca2SiO4 + α-SiO2) was present. In the subject samples, Ca2Fe2O5 was scarcely formed. In any samples, Rwp is below 2.0% and the S value is about 1.1. Statistically, the fitting is judged as good. 12)
Table 4 shows the chemical analysis values of Sample A, B and C, and the compositions obtained by multiplying the mass fractions of mineral phases determined by Rietveld analysis with the compo-sitions of the initial structural model (denoted as “initial” in Table 4). In the utmost bottom column of Table 4, the average values of rela-tive error between the compositions by Rietveld analysis results and the chemical analysis values are shown for the three samples.
As compared with the relative error of total Fe (T.Fe) of the ma-jor compositions, the relative error of quantified values of Ca, Si and Al, which are contained both in the major mineral phases and minor mineral phases, was large. This is considered to be attributed to the difference between the initial model compositions of SFCA and SF-CA-I phases and the compositions of multiple calcium ferrite phases formed during the actual sintering operation. Furthermore, the influ-ence of amorphous slag is considered for the error of Si composition.
For the mineral phase’s mass fractions of Sample A, B and C, trends of decrease in α-Fe2O3 and increase in Fe3O4 in the direction from the top layer to the bottom layer were observed. It is inferred
that the sintering reaction in the lower layer proceeded at higher temperature and longer time than those in the upper layers. More-over, the measured O2 gas concentration values in the exhaust gas are 15% in the upper layer and 12% in the lower layer. Another fac-tor that supports this trend is that the oxygen partial pressure is low-er in the lower layer and Fe3O4 is prone to be produced more easily.
Regarding the total amount of calcium ferrites that are consid-ered to correspond to the amount of the melt at a high temperature, there were no significant differences among samples when the quan-tification errors are taken into consideration. It is considered that the +5mm diameter grain sinter ore used for the analysis sample in this research has the minimum strength, and the low strength section wherein less of the calcium ferrite melt is produced was removed. It is considered that, if the entire sinter ore before the strength test is used for analysis, the lower layer is sintered at a higher temperature and the amount of the melt increases therein, and the increase in the absolute amount of calcium ferrites could be obtained as a result.
The above result shows that the mass fractions of mineral phases determined by Rietveld analysis explain the sintering reaction proc-ess. The sinter ore properties such as mechanical strength etc. are contributed by other factors such as pores, the particle size and the shape of a mineral phase in addition to the mineral phase fraction. To define the influence of these factors quantitatively, the quantifica-tion of a mineral phase by Rietveld analysis is considered to be an important step.3.3 Crystal structure of calcium ferrite optimized by Rietveld
methoedNext, the difference in crystalline structure parameters of calci-
um ferrites among samples was discussed. A calcium ferrite is a continuous solid solution consisting of multi-component systems that dissolve gangue compositions, 1) and the crystal structure varies depending on the composition. 2–6) First, to define the amount of the
Table 3 Quantitative value of mineral phases in sample A, B and C determined by Rietveld method 19)
Sample name
Quantitative value /mass%
Rwp/% Sα-Fe2O3 Fe3O4 SFCA SFCA-I Ca2SiO4 FeO CFF Ca2Fe2O5 α-SiO2
Total calcium ferrites(SFCA + SFCA-I
+ CFF + Ca2Fe2O5)Sample A 44.1(1) 15.5(1) 19.5(3) 8.6(2) 6.3(2) 1.7(1) 2.5(2) 0.1(1) 1.6(1) 30.7 1.81 1.01Sample B 37.0(1) 18.9(1) 20.7(3) 11.0(3) 7.9(5) 1.2(1) 1.6(2) n.d. 1.7(1) 33.3 1.89 1.03Sample C 33.0(1) 23.0(1) 21.8(4) 9.3(3) 8.5(6) 1.8(1) 1.5(2) n.d. 1.2(1) 32.6 2.03 1.06
Table 4 Chemical compositions of samples A, B and C obtained by chemical and Rietveld method 19)
Sample MethodQuantitative value /mass%
T.Fe CaO SiO2 Al2O3
Sample AChemical analysis
Rietveld analysis (initial)Rietveld analysis (EDS)
58.1859.858.9
9.72 8.610.0
5.494.85.8
1.281.6 1.2
Sample BChemical analysis
Rietveld analysis (initial)Rietveld analysis (EDS)
56.5158.258.9
10.95 9.910.2
6.755.55.6
1.291.71.4
Sample CChemical analysis
Rietveld analysis (initial)Rietveld analysis (EDS)
57.3958.459.5
10.3310.3 9.8
6.015.25.7
1.451.71.3
Relative deviation of Rietveld analysis (initial) 2.5% −7.3% −14.9% 25.3%Relative deviation of Rietveld analysis (EDS) 3.1% −2.8% −5.6% −5.8%

- 70 -
NIPPON STEEL & SUMITOMO METAL TECHNICAL REPORT No. 118 MARCH 2018
solid solution of gangue on an experimental basis, the electron mi-crographs of the high gangue-containing calcium-ferrite microstruc-ture (a), and of the low gangue-containing calcium ferrite micro-structure (b) of Sample B shown in Fig. 5 were analyzed for the amounts of Fe, Ca, Si and Al by EDS (energy disperse X-ray spec-trometry). The mean compositions at the measurement points of EDS in Fig. 5 were calculated, and based on the elemental composi-tions, the microstructure in Fig. 5 (a) was assumed as the SFCA phase and the microstructure in Fig. 5 (b) with a higher Fe concen-tration was assumed as the SFCA-I phase. The compositional for-mula of the SFCA phase corrected with the mean compositions based on EDS analysis is Ca2.3Fe10.3Al0.6Si0.8O20 for the SFCA phase and Ca3.6Fe15.1Al0.6Si0.7O28 for the SFCA-I phase. The Al content of each phase was lower than that of the crystal structure models used in the present research.
Next, to apply the compositions obtained by EDS analysis to the crystalline structural models of SFCA and SFCA-I, the occupancy rate of the cation sites in the respective crystalline structural model was modified, the result of which is shown in Table 5. We assume that the atoms at the octahedral-coordinated cation sites in the SFCA and SFCA-I phases are substituted by Fe and Ca and the tetrahe-dral-coordinated cation sites in the SFCA and that SFCA-I phases are substituted by Fe, Al, and Si. In the case of the SFCA phase, the occupancies of cation sites were corrected to fit to the chemical composition by making the following assumptions (the changed site occupancies are shown in bold in Table 5). Ca preferentially substi-tutes sites with longer oxygen bond distances in SFCA. Therefore, the occupancy of Ca/Fe 12 site was changed to fit the Ca composi-tion. Next, Si in SFCA preferentially substitutes the tetrahedral site with the shortest oxygen bond distance. Therefore, the occupancy of Si/Al 15 site was changed to fit the Si composition. Al prefers to dis-tribute to the Si/Al 15 sites and the Al/Fe 6 sites with the next short-est oxygen bond distance, so the site occupancies of these sites were changed to fit the Al composition. In the case of the SFCA-I phase, it was assumed that Si statically distributed at the Al substituted the tetrahedral-coordinated cation sites because Si was not contained in the initial models.
The respective mineral phase fraction determined by Rietveld analysis is shown in Table 6, and the crystalline structure factors of SFCA and SFCA-I are shown in Table 7, and the parameters such as atomic coordinates of the SFCA phase of each sample are shown in Table 8, respectively. When the atomic coordinates of the initial structural model of SFCA (Table 5 (a)) and those of the structural model after refining by Rietveld analysis (Table 8) are compared, particularly in the Al/Fe 6 and Ca/Fe 12 sites wherein the occupancy rate was modified by the EDS analysis values, changes in atomic coordinates took place after refining. This is attributed to the influ-
Fig. 5 Electron micrographs of calcium ferrites and chemical composi-tions in sample 19)
(a) Calcium ferrite with high gangue (Ca2.3Fe10.3Al0.6Si0.8O20) (b) Calcium ferrite with low gangue (Ca3.6Fe15.1Al0.6Si0.7O28)
Table 5 Structural model of SFCA 3) and SFCA-I 4) based on EDS analysis 19)
(a) SFCA 3) (b) SFCA-I 4)
AtomCoodinate number
Atomic coodinates OccupancyAtom
Coodinate number
Atomic coodinates Occupancyx y z Ref 3) This study x y z Ref 3) This study
Fe1 6 0.441 0.596 0.348 1 1 Ca1 6 0.088 0.688 0.079 1 1Fe2 6 0.758 0.003 0.254 1 1 Ca2 6 0.4736 0.113 0.920 1 1Fe3 6 0.669 0.693 0.458 1 1 Ca3 6 0.0976 0.155 0.181 1 1Fe4 4 0.737 0.217 0.434 1 1 Fe4 6 0.3153 0.033 0.632 1 1Fe5 4 0.849 0.030 0.741 1 1 Fe5 6 0.1777 0.463 0.354 1 1Al/Fe6 4 0.837 0.529 0.235 1/0 0.4/0.6 Fe/Ca6 6 0.5413 0.399 0.088 0.82/0.18 0.4/0.6Fe7 6 0.349 0.782 0.049 1 1 Fe7 6 0.0755 0.789 0.644 1 1Fe8 4 0.934 0.359 0.691 1 1 Fe/Al/Si8 4 0.0076 0.088 0.632 0.98/0.02 0.98/0.01/0.01Fe9 4 0.547 0.635 0.799 1 1 Fe/Al/Si9 4 0.3767 0.022 0.371 0.96/0.04 0.96/0.02/0.02Fe10 6 0.000 0.000 0.000 0.5 0.5 Fe10 6 0.2438 0.745 0.489 1 1Fe11 6 0.500 0.000 0.500 0.5 0.5 Fe11 6 0.622 0.676 0.223 1 1Ca/Fe12 6 0.556 0.904 0.156 0.8/0.2 0.3/0.7 Fe12 6 0.2457 0.250 0.491 1 1Ca13 7 0.114 0.206 0.420 1 1 Fe13 6 0.6021 0.189 0.228 1 1Ca14 7 0.127 0.664 0.951 1 1 Fe/Al/Si14 4 0.1316 0.473 0.636 0.84/0.16/0 0.84/0.08/0.08Si/Al15 4 0.728 0.731 0.929 0.8/0.2 0.8/0.2 Fe/Al/Si15 4 0.2404 0.477 0.082 0.9/0.1/0 0.9/0.05/0.05
Fe/Al/Si16 4 0.4955 0.407 0.366 0.94/0.06/0 0.94/0.03/0.03Fe/Al/Si17 4 0.8431 0.3225 0.091 0.8/0.2/0 0.8/0.1/0.1Fe/Al/Si18 4 0.1707 0.1876 0.9266 0.7/0.3/0 0.7/0.15/0.15Fe/Al/Si19 4 0.2484 0.9721 0.0794 0.54/0.46/0 0.54/0.23/0.23Fe20 6 0.4324 0.7142 0.3574 1 1
NIPPON STEEL & SUMITOMO METAL TECHNICAL REPORT No. 118 MARCH 2018
- 71 -
ence of the deformation (distortion) of polyhedrons caused by the occupation of elements with different effective ionic radii as a result of the difference in the occupation rates of occupying elements.
The effective ionic radii of Fe3+ and Al3+ at the tetrahedral Al/Fe 6 sites are 0.039 and 0.049 nm, respectively. The effective ionic radii of Fe3+ and Ca2+ at the octahedral Al/Fe 12 sites are 0.055 and 0.100 nm, respectively, and are significantly different from each other. Therefore, it is considered reasonable to have obtained such results because the coordination structure of the surrounding oxygen changed (polyhedra were distorted) and the atomic positions of cat-
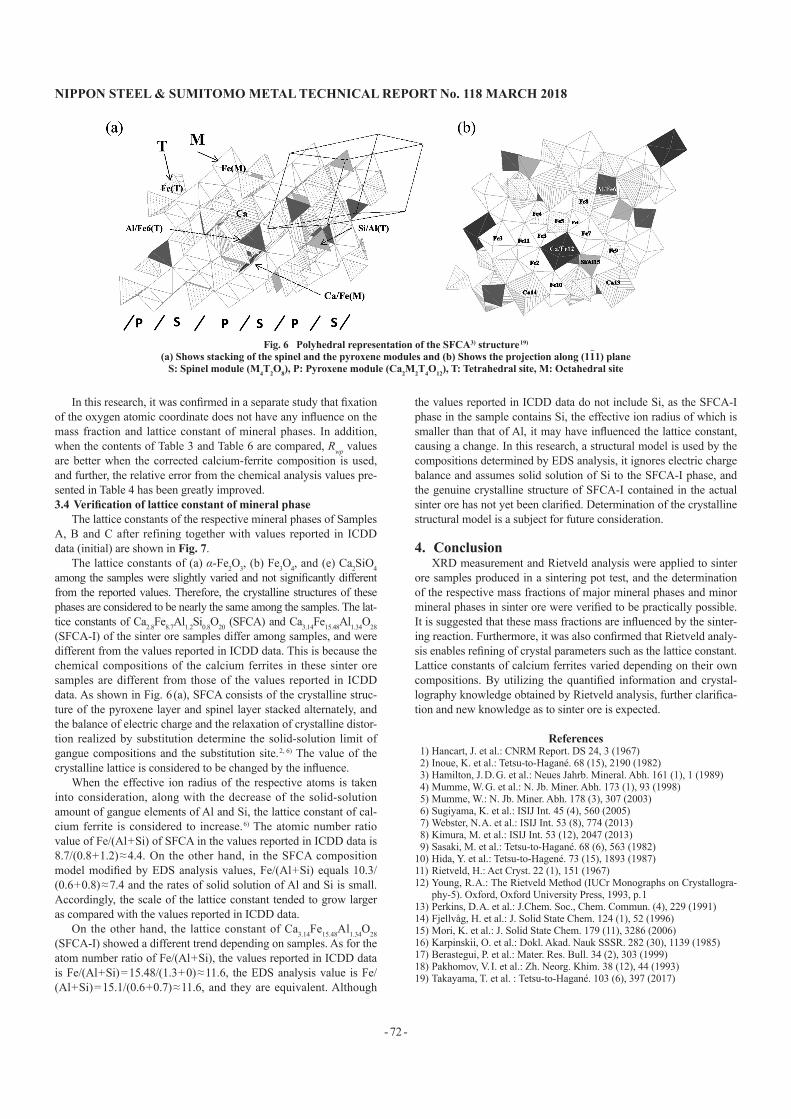
ions in the SFCA phase were different between the initial model and the correction model by EDS. In Fig. 6 (b), the crystalline structure of SFCA on the (11
_
1) plane is shown. The sites arranged on the same plane as the Ca/Fe 12 site are Fe 2, Al/Fe 6, Fe 7, Fe 8, Fe 9, Fe 10, and Fe 11. It is highly probable that the change in the site oc-cupancy of the Ca/Fe 12 affects the atomic coordinates of these adja-cent sites. However, in this research, as the occupation site is as-sumed and the oxygen position is fixed in executing refinement, fur-ther study is required for the determination of the position of the cation.
Table 6 Quantitative value of mineral phases in samples A, B and C determined by Rietveld method (using modified models by EDS results) 19)
Sample name
Quantitative value /mass%
Rwp/% Sα-Fe2O3 Fe3O4 SFCA SFCA-I Ca2SiO4 FeO CFF Ca2Fe2O5 α-SiO2
Total calcium ferrites(SFCA + SFCA-I +CFF + Ca2Fe2O5)
Sample A 42.4 (1) 14.1 (1) 20.8 (3) 8.2 (2) 7.6 (2) 1.7 (1) 2.6 (2) 0.8 (1) 1.9 (1) 32.4 1.74 0.93Sample B 35.9 (1) 19.7 (1) 21.3 (3) 9.6 (3) 7.0 (2) 1.5 (1) 2.3 (2) 1.2 (1) 1.6 (1) 34.4 1.88 1.02Sample C 33.5 (1) 23.9 (1) 18.2 (2) 9.2 (2) 8.8 (2) 1.8 (1) 2.5 (1) 0.9 (1) 1.3 (1) 30.8 1.88 0.97
Table 7 Crystal lattice constants of SFCA and SFCA-I refined by Rietveld method 19)
SampleCa2.3Fe10.3Al0.6Si0.8O20
(SFCA)Ca3.6Fe15.1Al0.6Si0.7O28
(SFCA-I)
Sample A
Space Group: P1_
,a = 0.9102(3) nm, b = 1.0124(2) nm, c = 1.0986(2) nm,α = 60.30(2)°, β = 73.42(2)°, γ = 65.57(2)°,V = 0.7966(5) nm3
Space Group: P1_
,a = 1.0364(6) nm, b = 1.0483(5) nm, c = 1.1780(6) nm,α = 94.16(2)°, β = 111.50(3)°, γ = 110.09(2)°,V = 1.0891(6) nm3
Sample B
Space Group: P1_
,a = 0.9109(2) nm, b = 1.0122(4) nm, c = 1.0984(4) nm,α = 60.21(2)°, β = 73.32(2)°, γ = 65.48(2)°,V = 0.7955(5) nm3
Space Group: P1_
,a = 1.0406(5) nm, b = 1.0541(5) nm, c = 1.1733(6) nm,α = 94.63(4)°, β = 110.82(4)°, γ = 110.05(4)°,V = 1.0993(4) nm3
Sample C
Space Group: P1_
,a = 0.9110(3) nm, b = 1.0110(3) nm, c = 1.0983(3) nm,α = 60.23(2)°, β = 73.39(2)°, γ = 65.48(2)°,V = 0.7948(4) nm3
Space Group: P1_
,a = 1.0373(4) nm, b = 1.0540(5) nm, c = 1.1720(6) nm,α = 94.25(3)°, β = 111.51(3)°, γ = 109.99(3)°,V = 1.0959(8) nm3
Table 8 Atomic coordinates and occupancies of SFCA phases in (a) Sample A, (b) B and (c) C determined by Rietveld method 19)
(a) Sample A (b) Sample B (c) Sample CAtom x y z Occupancy Atom x y z Occupancy Atom x y z Occupancy
Fe1 0.443 0.573 0.386 1 Fe1 0.455 0.587 0.366 1 Fe1 0.466 0.576 0.359 1Fe2 0.766 −0.004 0.255 1 Fe2 0.746 0.006 0.259 1 Fe2 0.760 0.003 0.242 1Fe3 0.661 0.707 0.462 1 Fe3 0.669 0.692 0.468 1 Fe3 0.676 0.684 0.474 1Fe4 0.761 0.215 0.421 1 Fe4 0.754 0.211 0.434 1 Fe4 0.758 0.189 0.421 1Fe5 0.842 0.026 0.753 1 Fe5 0.844 0.026 0.733 1 Fe5 0.834 0.022 0.760 1Al/Fe6 0.832 0.492 0.265 0.4/0.6 Al/Fe6 0.858 0.514 0.239 0.4/0.6 Al/Fe6 0.867 0.529 0.246 0.4/0.6Fe7 0.365 0.796 0.041 1 Fe7 0.378 0.778 0.054 1 Fe7 0.353 0.782 0.057 1Fe8 0.909 0.371 0.717 1 Fe8 0.917 0.355 0.697 1 Fe8 0.915 0.370 0.698 1Fe9 0.535 0.627 0.799 1 Fe9 0.553 0.633 0.788 1 Fe9 0.549 0.625 0.791 1Fe10 0.000 0.000 0.000 0.5 Fe10 0.000 0.000 0.000 0.5 Fe10 0.000 0.000 0.000 0.5Fe11 0.500 0.000 0.500 0.5 Fe11 0.500 0.000 0.500 0.5 Fe11 0.500 0.000 0.500 0.5Ca/Fe12 0.550 0.990 0.153 0.3/0.7 Ca/Fe12 0.546 0.896 0.170 0.3/0.7 Ca/Fe12 0.579 0.877 0.149 0.3/0.7Ca13 0.119 0.214 0.433 1 Ca13 0.110 0.221 0.425 1 Ca13 0.099 0.227 0.407 1Ca14 0.153 0.655 0.961 1 Ca14 0.148 0.636 0.957 1 Ca14 0.127 0.683 0.957 1Si/Al15 0.728 0.731 0.923 0.8/0.2 Si/Al15 0.753 0.720 0.924 0.8/0.2 Si/Al15 0.728 0.739 0.945 0.8/0.2
- 72 -
NIPPON STEEL & SUMITOMO METAL TECHNICAL REPORT No. 118 MARCH 2018
In this research, it was confirmed in a separate study that fixation of the oxygen atomic coordinate does not have any influence on the mass fraction and lattice constant of mineral phases. In addition, when the contents of Table 3 and Table 6 are compared, Rwp values are better when the corrected calcium-ferrite composition is used, and further, the relative error from the chemical analysis values pre-sented in Table 4 has been greatly improved.3.4 Verification of lattice constant of mineral phase
The lattice constants of the respective mineral phases of Samples A, B and C after refining together with values reported in ICDD data (initial) are shown in Fig. 7.
The lattice constants of (a) α-Fe2O3, (b) Fe3O4, and (e) Ca2SiO4 among the samples were slightly varied and not significantly different from the reported values. Therefore, the crystalline structures of these phases are considered to be nearly the same among the samples. The lat-tice constants of Ca2.8Fe8.7Al1.2Si0.8O20 (SFCA) and Ca3.14Fe15.48Al1.34O28 (SFCA-I) of the sinter ore samples differ among samples, and were different from the values reported in ICDD data. This is because the chemical compositions of the calcium ferrites in these sinter ore samples are different from those of the values reported in ICDD data. As shown in Fig. 6 (a), SFCA consists of the crystalline struc-ture of the pyroxene layer and spinel layer stacked alternately, and the balance of electric charge and the relaxation of crystalline distor-tion realized by substitution determine the solid-solution limit of gangue compositions and the substitution site. 2, 6) The value of the crystalline lattice is considered to be changed by the influence.
When the effective ion radius of the respective atoms is taken into consideration, along with the decrease of the solid-solution amount of gangue elements of Al and Si, the lattice constant of cal-cium ferrite is considered to increase. 6) The atomic number ratio value of Fe/(Al + Si) of SFCA in the values reported in ICDD data is 8.7/(0.8 + 1.2) ≈ 4.4. On the other hand, in the SFCA composition model modified by EDS analysis values, Fe/(Al + Si) equals 10.3/(0.6 + 0.8) ≈ 7.4 and the rates of solid solution of Al and Si is small. Accordingly, the scale of the lattice constant tended to grow larger as compared with the values reported in ICDD data.
On the other hand, the lattice constant of Ca3.14Fe15.48Al1.34O28 (SFCA-I) showed a different trend depending on samples. As for the atom number ratio of Fe/(Al + Si), the values reported in ICDD data is Fe/(Al + Si) = 15.48/(1.3 + 0) ≈ 11.6, the EDS analysis value is Fe/(Al + Si) = 15.1/(0.6 + 0.7) ≈ 11.6, and they are equivalent. Although
the values reported in ICDD data do not include Si, as the SFCA-I phase in the sample contains Si, the effective ion radius of which is smaller than that of Al, it may have influenced the lattice constant, causing a change. In this research, a structural model is used by the compositions determined by EDS analysis, it ignores electric charge balance and assumes solid solution of Si to the SFCA-I phase, and the genuine crystalline structure of SFCA-I contained in the actual sinter ore has not yet been clarified. Determination of the crystalline structural model is a subject for future consideration.
4. ConclusionXRD measurement and Rietveld analysis were applied to sinter
ore samples produced in a sintering pot test, and the determination of the respective mass fractions of major mineral phases and minor mineral phases in sinter ore were verified to be practically possible. It is suggested that these mass fractions are influenced by the sinter-ing reaction. Furthermore, it was also confirmed that Rietveld analy-sis enables refining of crystal parameters such as the lattice constant. Lattice constants of calcium ferrites varied depending on their own compositions. By utilizing the quantified information and crystal-lography knowledge obtained by Rietveld analysis, further clarifica-tion and new knowledge as to sinter ore is expected.
References1) Hancart, J. et al.: CNRM Report. DS 24, 3 (1967)2) Inoue, K. et al.: Tetsu-to-Hagané. 68 (15), 2190 (1982)3) Hamilton, J. D. G. et al.: Neues Jahrb. Mineral. Abh. 161 (1), 1 (1989)4) Mumme, W. G. et al.: N. Jb. Miner. Abh. 173 (1), 93 (1998)5) Mumme, W.: N. Jb. Miner. Abh. 178 (3), 307 (2003)6) Sugiyama, K. et al.: ISIJ Int. 45 (4), 560 (2005)7) Webster, N. A. et al.: ISIJ Int. 53 (8), 774 (2013)8) Kimura, M. et al.: ISIJ Int. 53 (12), 2047 (2013)9) Sasaki, M. et al.: Tetsu-to-Hagané. 68 (6), 563 (1982)
10) Hida, Y. et al.: Tetsu-to-Hagené. 73 (15), 1893 (1987)11) Rietveld, H.: Act Cryst. 22 (1), 151 (1967)12) Young, R. A.: The Rietveld Method (IUCr Monographs on Crystallogra-
phy-5). Oxford, Oxford University Press, 1993, p. 113) Perkins, D. A. et al.: J.Chem. Soc., Chem. Commun. (4), 229 (1991)14) Fjellvåg, H. et al.: J. Solid State Chem. 124 (1), 52 (1996)15) Mori, K. et al.: J. Solid State Chem. 179 (11), 3286 (2006)16) Karpinskii, O. et al.: Dokl. Akad. Nauk SSSR. 282 (30), 1139 (1985)17) Berastegui, P. et al.: Mater. Res. Bull. 34 (2), 303 (1999)18) Pakhomov, V. I. et al.: Zh. Neorg. Khim. 38 (12), 44 (1993)19) Takayama, T. et al. : Tetsu-to-Hagané. 103 (6), 397 (2017)
Fig. 6 Polyhedral representation of the SFCA 3) structure 19)
(a) Shows stacking of the spinel and the pyroxene modules and (b) Shows the projection along (11_
1) planeS: Spinel module (M4T2O8), P: Pyroxene module (Ca2M2T4O12), T: Tetrahedral site, M: Octahedral site

NIPPON STEEL & SUMITOMO METAL TECHNICAL REPORT No. 118 MARCH 2018
- 73 -
Fig. 7 Comparison of lattice constants refined by Rietveld method of major mineral phases in samples A, B and C, and the one reported in ICDD
Toru TAKAYAMAResearcherMaterials Characterization Research Lab.Advanced Technology Research Laboratories20-1 Shintomi, Futtsu City, Chiba Pref. 293-8511
Reiko MURAOResearcher, Dr. Eng. Materials Characterization Research Lab.Advanced Technology Research Laboratories