technical report of methods - travel survey
TRANSCRIPT

MUNICIPALITY OF ANCHORAGE
HOUSEHOLD TRAVEL SURVEY Technical Report of Methods
3006 Bee Caves Rd., Suite A-300 . Austin, Texas 78746 (512) 306-9065. fax (512) 306-9077 . www.nustats.com
Contact: Johanna Zmud, President
September 26, 2002

TABLE OF CONTENTS Introduction 1 Study Procedures 2
Survey Universe 2 Sample Design and Selection 2 Enrichment Samples 2 The Survey Instruments 3 The Recruitment Questionnaire and Interview 4 Travel Log 5 Retrieval Questionnaire and Interview 5 Data Weighting 6 Geocoding 8 Data File Creation 8 Item Completion Rates 9
Sample Validation 10 Conclusion 14 Appendix A – Data Items 15 Appendix B – Recruitment Script 37 Appendix C – Diary Packet Materials 43 Appendix D – Retrieval Script 44

LIST OF TABLES AND FIGURES Figure 1: Geographic Distribution of Sampled Households 1 Table 2: Travel Day Distribution 4 Table 3: RDD Recruited Households in Anchorage and Eagle
River/ Chugiak 4 Table 4: Recruitment Call Outcomes 5 Table 5: Completed Households by Sample Type 5 Table 6: Retrieval Call Outcomes 6 Table 7: Geography Weight to Compensate for Over Sample of
Eagle River and Chugiak Households 7 Table 8: Household Size Weight for Combined Sample 7 Table 9: Geocoding Match Rates 8 Table 10 Item Completion Rates (RDD only) 9 Table 11: Household Size 10 Table 12: Household Vehicles 10 Table 13: Household Income 11 Table 14: Residence Type 11 Table 15: Owner or Renter Status 12 Table 16: Age of Members of Households in the Sample 12 Table 17: Employment Status 13 Table 18: Student Status 13

N U S T A T S A N C H O R A G E H O U S E H O L D T R A V E L S U R V E Y T E C H N I C A L R E P O R T 1 9 . 2 6 . 0 2
INTRODUCTION The Household Travel Survey for the Municipality of Anchorage entailed the collection of activity and travel information for household members (age 5 and older) during a specific 24-hour period. In addition to providing basic information about each household and its members, the survey documented specific characteristics of activities and trips made, including number, purpose, time of day, mode and questions specific to mode usage.
The study conformed to standard procedures for conducting a household travel behavior survey. These procedures included:
Probability sample generation,
Telephone interview to recruit household members to participate in the survey and to collect data about the households and their members,
Travel diary packets mailed to recruited households,
Reminder calls to recruited households prior to a randomly assigned travel day,
Telephone call subsequent to travel day to collect activity and travel information,
Geocoding of home, work, school, and other trip destination locations, and
Data processing and editing for data file creation.
Travel days for the survey were spread across the pilot study (February 12-15, 2002) and the full study (April 1, 2002 - May 17, 2002). In total, 2,035 households were recruited to participate in the study. Of these 1,293 completed travel diaries, and the information was retrieved from all household members age five and older (see map on next page). These 1,293 completes included an over sample of 242 households in the Eagle River and Chugiak communities. These numbers do not include an intercept sample of 174 users of People Mover.
NuStats conducted the Household Travel Survey, in association with NuStats’ DataSource, Cambridge Systematics, and CH2MHill. NuStats designed the survey, managed data collection, and analyzed the survey data. NuStats’ DataSource conducted the telephone interviews and mailed the diary packets. CH2MHill’s Anchorage office provided local support for the survey effort, while Cambridge Systematics produced a technical memorandum detailing the specifications for updating the travel-forecasting model.
The map below illustrates the home addresses of participating households in the study area.

N U S T A T S A N C H O R A G E H O U S E H O L D T R A V E L S U R V E Y T E C H N I C A L R E P O R T 1 9 . 2 6 . 0 2
FIGURE 1: GEOGRAPHIC DISTRIBUTION OF SAMPLED HOUSEHOLDS
#
#
#
#
#
#
#
#
#
#
#
#
#
#
#
#
#
##
## #
#
#
#
#
#
#
##
#
#
#
#
#
#
#
#
# #
#
#
#
##
#
#
#
#
#
#
#
##
#
#
#
#
##
#
#
#
#
#
#
#
#
#
#
#
#
##
#
##
#
#
#
#
#
##
#
#
#
#
#
#
#
#
#
#
#
#
#
#
#
#
#
#
#
#
#
#
#
#
#
#
#
#
#
#
## #
#
#
# #
#
##
#
#
#
#
#
#
#
#
#
#
#
#
##
#
#
#
#
#
#
#
#
#
#
#
#
#
#
#
#
#
#
#
#
#
#
#
#
#
#
#
#
#
##
#
#
#
#
#
#
#
#
#
#
#
#
#
#
#
#
#
#
# #
#
#
#
#
#
#
#
#
#
#
#
#
#
#
#
#
#
#
#
#
#
#
#
#
#
#
##
#
#
#
#
#
##
#
#
#
#
#
#
#
#
#
#
#
#
#
#
#
#
##
#
##
#
##
#
#
###
#
#
#
#
#
##
#
#
#
#
#
#
#
#
#
## #
#
#
#
# #
#
#
#
#
#
#
#
#
#
#
#
#
#
#
#
#
#
##
#
#
#
#
#
#
#
#
#
#
##
##
##
##
#
#
#
#
#
#
#
#
#
##
#
#
#
#
#
#
#
#
#
#
#
#
#
#
#
#
#
#
#
#
#
#
#
#
#
#
# #
#
#
##
#
#
# #
#
#
#
#
#
# #
#
#
#
#
#
#
#
#
#
#
#
#
#
#
#
##
#
#
#
##
#
#
#
#
#
#
#
#
#
#
#
#
#
#
#
#
#
#
#
#
#
# #
#
#
#
#
#
#
#
#
##
#
#
#
#
#
#
#
#
#
#
#
#
#
#
#
#
#
#
# #
#
#
#
# #
#
##
#
#
##
#
#
#
#
#
#
#
#
##
#
##
#
#
#
#
#
#
#
#
#
#
#
#
#
#
#
#
#
#
#
#
#
#
#
##
# #
#
#
#
#
##
#
#
#
#
#
#
#
#
#
#
#
#
#
#
##
#
#
#
#
#
#
#
#
#
#
#
#
##
#
# #
#
#
##
#
##
#
#
#
#
#
#
#
##
#
#
#
#
#
#
#
#
#
#
##
#
#
#
#
##
# #
#
#
#
#
#
#
#
#
#
#
#
#
#
#
#
#
#
#
#
#
#
#
#
#
##
#
#
###
#
#
# #
#
#
#
#
#
#
#
#
#
#
##
#
#
#
#
#
#
##
#
#
#
#
#
#
#
#
#
#
#
#
#
#
##
#
#
#
#
#
#
#
#
#
#
##
#
#
#
#
#
#
#
#
#
#
#
#
#
#
#
#
#
#
#
#
#
#
#
#
#
#
#
#
#
#
##
#
#
#
#
#
#
#
#
#
#
#
#
#
#
#
#
# #
#
#
#
#
#
#
#
#
#
#
#
#
#
#
#
#
#
#
#
#
##
#
#
#
#
#
#
#
#
#
#
#
#
#
#
#
#
#
#
#
#
#
#
#
#
#
#
#
#
#
#
#
#
#
#
#
##
#
#
#
#
#
#
##
#
#
#
#
#
#
#
#
#
#
#
#
#
#
#
#
#
#
#
#
#
#
#
#
#
#
##
#
#
#
#
#
##
#
#
#
#
#
#
#
#
# #
#
#
#
#
#
#
#
#
# #
# #
#
#
#
##
#
#
#
#
#
#
#
#
#
#
#
#
##
#
#
#
##
#
#
##
#
#
#
#
#
#
##
#
#
#
##
#
#
#
#
#
#
#
#
##
#
###
#
#
#
#
#
#
#
##
##
#
#
#
#
##
#
#
#
#
#
#
#
#
#
#
#
#
#
#
##
#
#
#
#
#
#
#
#
#
#
#
#
#
#
#
#
#
#
#
#
#
#
##
##
#
#
##
#
#
#
#
#
#
#
#
#
#
#
#
#
#
#
#
#
#
#
#
#
#
#
##
#
##
#
#
#
#
#
#
#
#
#
##
# #
##
#
#
## #
#
#
##
#
##
#
#
#
##
#
#
#
#
#
#
#
#
#
#
#
#
#
#
#
#
#
#
#
#
#
# #
#
#
#
#
##
#
#
#
#
#
#
#
#
#
#
##
#
#
#
#
#
#
#
#
#
#
#
#
#
#
#
#
#
#
#
#
#
#
#
#
#
#
#
#
##
#
#
#
#
#
#
#
#
#
#
#
#
#
#
#
#
#
#
#
#
#
#
#
#
#
#
#
#
#
#
##
#
#
#
#
#
#
#
#
#
#
#
#
#
#
## #
#
# #
#
#
##
#
#
#
#
#
#
#
#
#
##
## #
#
#
#
#
#
#
#
#
#
#
#
##
###
#
#
#
#
#
##
#
#
#
## #
#
# #
#
#
#
#
#
#
#
#
#
#
#
#
#
#
##
#
##
##
#
##
##
#
#
#
#
#
#
#
#
#
##
#
#
## #
#
### ##
# #
#
#
#
#
##
#
#
#
#
#
##
#
# # #
#
#
#
#
#
#
#
#
####
#
#
#
#
#
#
#
#
##
#
#
# #
#
#
#
#
#
#
#
#
#
#
##
##
#
#
#
#
#
#
#
##
##
#
##
#
#
#
#
#
#
#
#
# #
#
#
#
#
#
#
##
#
#######
#
#
#
#
#
##
#
#
#
#
#
###
#
#
#
#
#
# #
#
#
##
#
# ##
#
#
#
##
#
##
#
#
## #
#
#
##
#
##
##
#
##
###
##
###
#
##
#
#
##
#
##
#
##
#
#
##
##
##
#
#
#
#
#
#
#
#
#
#
##
#
#
#
#
##
#
#
#
#
##
# ##
#
#
##
#
#
#
#
#
#
#
#
#
#
#
##
#
#
##
Chugiak-Eagle RiverMilitary
Hillside
Muldoon
Mountain View
Downtown
North Midtown
Northwest
Airport
Sand Lake
South Midtown
Abbott Loop
South Anchorage
University

N U S T A T S A N C H O R A G E H O U S E H O L D T R A V E L S U R V E Y T E C H N I C A L R E P O R T 2 9 . 2 6 . 0 2
STUDY PROCEDURES SURVEY UNIVERSE
The survey universe for the Household Travel Survey was defined as all households with operational landline telephones located within municipality of Anchorage. According to Census 2000 data, there were 94,822 households located within the municipality.
SAMPLE DESIGN AND SELECTION
This sampling description provides information on how households were selected for the survey. A sample is the subset of the universe that is used to gain information about the entire population. The population of inference for the Household Travel Survey was all households with landline telephones in Anchorage. A probability design was used to select a sample that would truly represent all such households. The probability design ensured that each household with landline telephone service would have an equal chance of selection. The type of probability sample that was used was a random digit dial (RDD) sample, in which the primary sampling units were telephone numbers.
Both listed and unlisted telephone numbers were generated using random digit dial (RDD) procedures. Listed numbers were generated from working exchanges and blocks for the telephone numbers in the study area (FIPS code 02020). NuStats then generated all the possible combinations of telephone numbers within these working exchanges and blocks. Unlisted telephone numbers were randomly generated based on the telephone exchanges and blocks identified for the listed sample. All generated unlisted telephone numbers that were listed in the database were eliminated from the sampling frame. In all, 12,000 total telephone numbers were generated into 116 replicates. A replicate is a systematically selected sub-sample of the universe. The main benefit of using replicated samples is that the interviewers do not need to call the entire sample frame in order to ensure proper representation of the study area. When the quota of completed households is accomplished, it is only necessary to attempt to complete households in the current replicate that has been released or opened.
ENRICHMENT SAMPLES
The survey, using the sampling procedures described above, would result in a representative sample of households within the city. However, there were two enrichment samples added to the survey design through over sampling: (1) Households in Eagle River / Chugiak and (2) People Mover users.
Upon review of population and demographic information by census tract for the study area and discussions with the client and expert consultants, it was decided that there would be value in over sampling census tracts representing Eagle River and Chugiak. Eagle River and Chugiak are located in a high-growth corridor that tends to attract high-income householders. It was assumed that these households would have significantly different travel patterns from those located in the Anchorage Bowl, and that it would be important to have sufficient households records for use in the update of the travel forecasting model. In generating the telephone numbers for the random sample, census tracts comprising the geography of Eagle River and Chugiak (i.e., 1.01, 1.02, 2.01, 2.02, 2.03, 2.04) were over sampled. While such households comprised 10 percent of total households in Anchorage, they were over sampled so that they would comprise 17 percent of the final sample.

N U S T A T S A N C H O R A G E H O U S E H O L D T R A V E L S U R V E Y T E C H N I C A L R E P O R T 3 9 . 2 6 . 0 2
TABLE 1: SAMPLE DISTRIBUTION BY AREA Area No. Households
in Population Percent of Total Population
Projected Sample
Percent of Projected Sample
Municipality of Anchorage 84,945 89.6 1,000 83.3 Eagle River / Chugiak Over Sample
9,877 10.4 200 16.7
Total 94,822 100.0 1,200 100.0
The survey included a second enrichment sample, that of People Mover users. The purpose for this enrichment sample was to ensure an adequate number of transit trips in the trip file for mode choice modeling. Due to the low incidence of transit riders in Anchorage, it would have been cost-prohibitive to locate these households through RDD methods.
Two intercept strategies were done. First, with the assistance of CH2MHill, transit users were identified via intercept interviews at transit centers in Anchorage. Contact information was collected so that these users could be recruited via telephone and then processed through the data collection effort in the same way as RDD sampled households. Unfortunately, the in-person screening intercept did not result in sufficient numbers of completed interviews and diaries with transit users.
Second, NuStats sent three experienced interviewers from NuStats DataSource to Anchorage to conduct in-person interviews with transit users at transit centers. This effort differed from the previous in that we did not just collect contact information but also collected data as in the recruitment and retrieval telephone questionnaires. The interviewers were supplied with paper questionnaires to collect demographic data about people and households, and diaries to record the riders’ reported trips. In order to ensure that the data were collected on the spot, the interviewers asked the riders to reconstruct their travel for a transit-using day. In most cases this was the previous day. The interviewers guided the respondents through their travel day and were responsible for accurately recording the travel information. These data were gathered from one person in the household only – the transit-using person, which was sufficient for the mode choice modeling.
Tables presented in this report were based on the combined Anchorage and Eagle River/ Chugiak RDD samples. Because the transit data were gathered using non-probability sampling techniques, they cannot be reliably aggregated with the RDD samples. These transit data can be analyzed independently to derive insights on the characteristics of transit users.
THE SURVEY INSTRUMENTS
The objectives of the Household Travel Survey required comprehensive survey instruments to collect demographic and socioeconomic details about households and persons, vehicle information, details of school and work travel, and detailed data of all trips made on an assigned travel day. The survey instruments contained three components: (1) the recruitment questionnaire, (2) the travel log, and (3) the retrieval questionnaire. An overview of each is provided in the following sections. A complete list of variables collected in the survey is attached in Appendix A: Data Dictionary.

N U S T A T S A N C H O R A G E H O U S E H O L D T R A V E L S U R V E Y T E C H N I C A L R E P O R T 4 9 . 2 6 . 0 2
THE RECRUITMENT QUESTIONNAIRE AND INTERVIEW
The recruitment interview was administered using a computer-assisted telephone interviewing (CATI) program. At that time, each household was telephoned by an interviewer to determine if they qualified for the study. The respondent was then asked (on behalf of the entire household) to participate in the study. If the respondent agreed, demographic information was collected from the household including income, household size, vehicle ownership, and other household characteristics. In addition, demographic characteristics were obtained for each member of the household such as age, gender, employment and school status (see Appendix B for the recruitment questionnaire).
Each household was assigned a travel day. The distribution of household by travel day indicates that fewer households in the sample traveled on Wednesdays and Fridays.
TABLE 2: TRAVEL DAY DISTRIBUTION TRAVEL DAY PERCENT Monday 22% Tuesday 24% Wednesday 16% Thursday 23% Friday 16% Total 100%
Base: 1,293 RDD households. May not add to 100 percent due to rounding.
In total 2,035 households were recruited using RDD sampling methods. Each recruited household was notified that it would receive a package in the mail that included a travel diary for each member in the household age five or older.
TABLE 3: RDD RECRUITED HOUSEHOLDS IN ANCHORAGE AND EAGLE RIVER / CHUGIAK Sample Type Recruited
Households
Municipality of Anchorage 1,674
Eagle River / Chugiak Over Sample 372
Total 2,035
During the recruitment phase, 2,035 RDD households agreed to participate in the study for a recruitment response rate of 43 percent. About 16 percent refused to participate in the study. The response rate was calculated under standards of the Council of American Survey Research Organizations (CASRO). It was derived by dividing the number of households that agreed to participate by the sum of the total number of “eligible” households and a portion of the households for whom “eligibility” was unknown. This response rate formula is shown below. The final dispositions for the recruitment call attempts are indicated on the following page.
RR = 2035 = 2035 = 2,035 = 43% 4169+(2447*.34) 3936+755 4,691
RR = Where,
RR is the response rate, a is the number of completed surveys, A is the number of eligible telephone numbers, C is the number of eligibility unknown, and ER is the eligibility rate.
a
A+(C * ER)

N U S T A T S A N C H O R A G E H O U S E H O L D T R A V E L S U R V E Y T E C H N I C A L R E P O R T 5 9 . 2 6 . 0 2
TABLE 4: RECRUITMENT CALL OUTCOMES Call Outcome
Frequency
Recruited 2,035 Refused to participate 2,027 Partial completes 107 SUB-TOTAL ELIGIBLE 4,169
Ineligible Units Disconnected/non-working 4,613 Business/Government 645 Facsimile 600 Over Quota 2 Out of area 50 Communications Barrier 80 SUB-TOTAL INELIGIBLE UNITS 5,990
Eligibility Unknown Units No answer 1,147 Call Back 270 Answering machine 665 Busy 165 SUB-TOTAL ELIGIBILITY UNKNOWN UNITS 2,247 GRAND TOTAL: 12,406
TRAVEL LOG
A total of 2,035 travel-log packages were mailed to recruited households. These packages consisted of a letter signed by Mr. Lance Wilbur, Traffic Department Director for the Municipality of Anchorage, introducing the study; a brochure providing details about its objectives and methods; and one travel log for each member of the household age five or older. (See Appendix C for sample materials.) The travel log collected information about each trip made on the assigned travel day, including place name and address, time of travel, travel mode, and purpose. A reminder call was made to each recruited household prior to its assigned travel day. During that reminder call, the receipt of the package was confirmed, the assigned travel day acknowledged, and any questions were answered.
RETRIEVAL QUESTIONNAIRE AND INTERVIEW
The day following each household’s assigned travel day, the household was contacted by telephone (or attempted to be contacted) to retrieve the travel information. (See Appendix D for the Retrieval questionnaire.) In total, 1,293 RDD households provided complete activity and travel information. For most of these households, the information was collected within seven days of the assigned travel day.
TABLE 5: COMPLETED HOUSEHOLDS BY SAMPLE TYPE Sample Type Number
recruited Number completed Completion
Rate Municipality of Anchorage 1,644 1,051 64% Eagle River and Chugiak Over Sample 391 242 62% TOTAL 2,035 1,293 64%

N U S T A T S A N C H O R A G E H O U S E H O L D T R A V E L S U R V E Y T E C H N I C A L R E P O R T 6 9 . 2 6 . 0 2
The retrieval response rate was 64 percent. This rate was calculated following CASRO standards.
RR = 1,293 = 64% 2,008
The final dispositions for the retrieval call attempts are indicated below.
TABLE 6: RETRIEVAL CALL OUTCOMES Call Outcome
Frequency
Eligible Units Completed 1,293 Refused to participate 329 Partial completes 4 Non-contacts 165 Said they would mail diaries but didn’t 218 SUB-TOTAL ELIGIBLE 2,008
Ineligible Units Disconnected/non-working 25 Facsimile 2 SUB-TOTAL INELIGIBLE UNITS 27 GRAND TOTAL: 2,035
Note: Households that did mail back their diaries are counted as completed.
The overall response rate for the main study was calculated as the product of the response and retrieval rates (43% * 64%) for an overall rate of 28 percent.
DATA WEIGHTING
The final data set includes several weight variables that were developed to account for over sampling or under sampling of particular population segments. There is also an expansion weight that factors the sample data to represent total households in the Municipality of Anchorage. The 2000 data for the Municipality of Anchorage from the U.S. Bureau of the Census were used to calculate these weights and expansion factors. To compensate for the over sample of households in Eagle River and Chugiak, a geography weight (geowgt) was developed.
RR = Where,
RR is the response rate, a is the number of completed surveys, A is the number of eligible telephone numbers,
a
A

N U S T A T S A N C H O R A G E H O U S E H O L D T R A V E L S U R V E Y T E C H N I C A L R E P O R T 7 9 . 2 6 . 0 2
TABLE 7: GEOGRAPHY WEIGHT TO COMPENSATE FOR OVER SAMPLE OF EAGLE RIVER AND CHUGIAK HOUSEHOLDS Area No. Households in
Population Percent of Total Population
Final Sample
Percent of Final Sample
GeoWgt
Anchorage 84,945 89.6 1,051 81.3 1.1021 Eagle River / Chugiak 9,877 10.4 242 18.7 0.5561 Total 94,822 100.0 1,293 100.0 ---
The final sample under represented larger (4+ person) households relative to the census data population parameters. To compensate for this, the sample was balanced relative to household size by developing a weight (hhswgt).
TABLE 8: HOUSEHOLD SIZE WEIGHT FOR COMBINED SAMPLE Household Size No. Households in
Population Percent of Total
Population Final
Sample Percent of
Final Sample* HHSWGT
One Person 22,142 23 341 26 .89
Two Persons 30,155 32 514 40 .80
Three Persons 16,942 18 199 15 1.16
Four Persons 14,795 16 161 13 1.25
Five Persons 6,696 7 60 5 1.54
Six Persons 2,536 3 11 1 3.0
Seven + Persons 1,556 2 7 1 3.2
Total 94,822 100% 1,293 100 ---
May not equal to 100 percent due to rounding.
A composite weight (finwgt) was calculated that was the product of these two weights (geowgt * hhswgt). This weight was applied to the data when weighted sample statistics only were required.
The expansion factor (expfct) was calculated by dividing the total households based on Census 2000 data (94,822) by the number of households surveyed (1,293). When using the sample data to run population estimates, the final expansion factor was applied. This final expansion factor was the product of “finwgt” and “expfct”. It is designated as “expwgt” in the data file.

N U S T A T S A N C H O R A G E H O U S E H O L D T R A V E L S U R V E Y T E C H N I C A L R E P O R T 8 9 . 2 6 . 0 2
GEOCODING
Geocoding was conducted using coverage files obtained from AMTS and CH2MHill. Home addresses and trip end addresses were geocoded subsequent to the retrieval interview. The retrieval interview collected multiple location information such as address, nearest landmark, nearest cross street or street intersection to facilitate geocoding. City name and zip code were used to distinguish duplicated street names in different geographies. U.S. Postal Office Standard Address Format, which matched the address style of the street network reference database, was used to record address information.
Out of the 7,545 addresses that were recorded by households as "traveled to", and were within the study area, 98 percent were successfully matched to some level of geography. Ninety-six percent were matched to an X/Y coordinate, 1.3 percent were matched to a zip code centroid, and 1.3 percent were matched to a city centroid. Table 9 presents geocode match rates by location type. As shown, the trip end addresses had the lowest overall match rate at 97 percent.
TABLE 9: GEOCODING MATCH RATES Address Type Total Home 100% Work 99% School 100% Trip Ends 97%
DATA FILE CREATION
After completion of data collection and data editing tasks, the survey data were contained in five files:
1. Household data file – the household is the unit of analysis, with 1,293 records. Contains data elements relating to household demographics such as household size, vehicles available to household and household income.
2. Person data file – persons within households are the units of analysis, with 3,029 records. Contains data elements relating persons, such as age, gender, work and school status.
3. Trip data file – trips made by persons within households are units of analysis, with 12,092 records. Contains information relating to travel, such as locations, purpose, mode, and time of travel.
4. Vehicle data file – vehicles owned by households are the units of analysis, with 2,561 records. Contains information relating to vehicles, such as make, model, and year.
5. Location data file – all locations pertinent to households and trips made by persons within households, with 7,677 records. Contains a location number that links to trip, person and household files.
All data files contain certain variables, such as sample number (unique number assigned to each household), and the weight variables “finwgt” and “expwgt”. A data dictionary for each of the files is presented in Appendix A.

N U S T A T S A N C H O R A G E H O U S E H O L D T R A V E L S U R V E Y T E C H N I C A L R E P O R T 9 9 . 2 6 . 0 2
ITEM COMPLETION RATES
Table 10 presents item completion rates for the most important variables. As shown, these rates are excellent.
TABLE 10: ITEM COMPLETION RATES (RDD ONLY) Variable Completion Rate Refused/ Retrieved
Household Data
Household Size 100.0% 0 / 1293
Use People Mover 99.8% 2 / 1291
Vehicles Available 100.0% 0 / 1293
Bikes Available 99.8% 2 / 1291
Use of Bikes Last Summer 100.0% 0 / 870
Why Use Bikes Last Summer 100.0% 0 / 623
Use of Bikes Upcoming Summer 100.0% 0 / 870
Why Use Bikes Upcoming Summer 100.0% 0 / 661
Residence Type 100.0% 0 / 1293
Own/Rent Status 99.1% 12 / 1281
Income 89.0% 141 / 1152
Person Data
Gender 99.6% 12 / 3017
Age 98.3% 53 / 2976
Driver License 99.7% 7 / 2462
Employment Status 99.4% 14 / 2455
Type of Non-Employment 97.0% 18 / 587
Number of Jobs 99.7% 6 / 1858
Flexibility of Work Hours 97.2% 52 / 1812
Telework 97.4% 49 / 1815
How Often Telework 97.8% 6 / 267
Educational Attainment 98.1% 41 / 2091
Student Status 99.7% 9 / 3020
Trip Data
Arrival Time 100.0% 0 / 12,092
Departure Time 100.0% 0 / 12,092
Trip Purpose 100.0% 0 / 12,092
Activity (*Both origins and destinations) 99.9% 12 / 15,019*
Mode 99.9% 13 / 12,083
Vehicle Data
Year 96.9% 80 / 2481
Make 98.5% 39 / 2522
Model 95.3% 120 / 2441

N U S T A T S A N C H O R A G E H O U S E H O L D T R A V E L S U R V E Y T E C H N I C A L R E P O R T 1 0 9 . 2 6 . 0 2
SAMPLE VALIDATION The sample was comprised of 1,293 completed households (including the records collected during the pretest), which is a reasonable representation of Anchorage area households. The following tables compare the sample distributions on key demographic variables with census data. (Note: The total percent figures are from geographically weighted data.)
The household size sample distribution differed from that of the census population parameters. The sample had more one and two-person households and fewer three and four-plus person households than the study area households did. Households in Eagle River and Chugiak were larger size than households in the Municipality of Anchorage, in general.
TABLE 11: HOUSEHOLD SIZE Household Size Municipality of
Anchorage ER/Chugiak Over
Sample Weighted
Combined Percent Census 2000*
One Person 29% 14% 28% 23%
Two Persons 40% 41% 40% 32%
Three Persons 14% 20% 15% 18%
Four + Persons 17% 26% 18% 27%
Total 100% 100% 100% 100%
Base: 1,293 Households. May not add to 100 percent due to rounding. Total Percent weighted by geography (geowgt). *Census 2000 Summary File 2
The sample under represented one-vehicle and over represents two-vehicle households. It represented zero-vehicle and three-plus vehicle households well. Vehicle ownership was higher among households in Eagle River and Chugiak than the municipality as a whole, with more than one-third of households owning three or more vehicles.
TABLE 12: HOUSEHOLD VEHICLES Household Vehicles Municipality of
Anchorage ER/Chugiak Over Sample
Weighted Combined Percent Census 2000*
Zero Vehicle 3% 2% 3% 6%
One Vehicle 30% 15% 29% 36%
Two Vehicle 48% 48% 48% 41%
Three Vehicles 13% 22% 14% 13%
Four + Vehicles 5% 14% 6% 4%
Total 100% 100% 100% 100%
Base: 1,293 Households. May not add to 100 percent due to rounding. Total Percent weighted by geography (geowgt). *Census 2000 Supplementary Survey Summary Tables
The survey sample represented the Anchorage area income distribution fairly well. Eleven percent of all households interviewed refused to report household income, which is typical for household travel surveys.

N U S T A T S A N C H O R A G E H O U S E H O L D T R A V E L S U R V E Y T E C H N I C A L R E P O R T 1 1 9 . 2 6 . 0 2
TABLE 13: HOUSEHOLD INCOME Income Municipality of
Anchorage ER/Chugiak Over
Sample Weighted
Combined Percent Census 2000*
Up to $9,999 3% 1% 2% 5%
$10,000 to $19,999 8% 4% 7% 9%
$20,000 to $29,999 10% 4% 8% 11%
$30,000 to $39,999 11% 7% 9% 11%
$40,000 to $49,999 11% 6% 9% 9%
$50,000 to $59,999 10% 10% 9% 11%
$60,000 to $69,999 13% 14% 11% 12%
$70,000 to $79,999 12% 15% 11% 5%
$80,000 to $89,999 5% 5% 4% 6%
$90,000 to $99,999 3% 10% 4% 5%
More than $100,000 15% 26% 15% 18%
Total 100% 100% 100% 100%
Base: 1,150 households providing income. May not add to 100 percent due to rounding. Total Percent weighted by geography (geowgt.) *March 2001 CPS Data Census (Current Population Survey)
The sample majority (62 percent) resided in single-family dwellings. Nearly 90 percent of households sampled from Eagle River and Chugiak resided in single-family homes, compared with 59 percent for the municipality as a whole. This outcome may be an artifact of the survey methodology because mail delivery to apartment buildings can be problematic so that travel log packages are not received and then completed. Persons who live in apartment buildings may also be under represented in the final sample because these households tend to be more mobile with less stable addresses.
TABLE 14: RESIDENCE TYPE Residence Type Municipality of
Anchorage ER/Chugiak Over
Sample Weighted
Combined Percent Census 2000*
Single Family 59% 88% 62% 52%
Multi-family Attached 35% 9% 33% 42%
Mobile Home or Trailer 3% 3% 3% 6%
Group Quarters 3% 0% 2% -
Other, Specify 0% 1% 0% -
Total 100% 100% 100% 100%
Base: 1,293 households reporting residence type. May not add to 100 percent due to rounding. Total Percent weighted by geography (geowgt.) *Census 2000 Supplementary Survey Summary Tables
Nearly three-fourths of households in the sample resided in owner-occupied dwellings. Nine out of ten households in Eagle River and Chugiak were homeowners. In this statistic, the survey over represented homeowners, which is not unusual for these types of surveys. Homeowners are typically more connected to their communities and more likely to take the time to complete a travel log than are renters. The sample percent for homeowners (73 percent) was higher than that for households in single-family dwellings (62 percent), indicating a healthy percentage of owners of condos and duplexes in the sample.

N U S T A T S A N C H O R A G E H O U S E H O L D T R A V E L S U R V E Y T E C H N I C A L R E P O R T 1 2 9 . 2 6 . 0 2
TABLE 15: OWNER OR RENTER STATUS Housing Tenure Municipality of
Anchorage ER/Chugiak Over Sample
Weighted Combined Percent Census 2000*
Owner 71% 91% 73% 60% Renter 27% 8% 25% 40% Other 2% 0% 2% - Total 100% 100% 100% 100%
Base:1,293 households. Total Percent weighted by geography (geowgt.) *U.S. Census Bureau, Census 2000 – Anchorage Municipality, Alaska Profile of General Demographic Characteristics: 2000
The sample is a good representation of the study area residents by age group. The single age range in which it differs significantly from population parameters is the range from 45 to 54 years.
TABLE 16: AGE OF MEMBERS OF HOUSEHOLDS IN THE SAMPLE Age Municipality of
Anchorage ER/Chugiak Over Sample
Weighted Combined Percent Census 2000*
Under 5 years 4% 1% 3% 8%
5 years to 9 years old 7% 5% 7% 8%
10 years to 14 years old 8% 9% 8% 8%
15 years to 19 years old 7% 11% 7% 8%
20 years to 24 years old 6% 2% 6% 7%
25 years to 34 years old 16% 7% 15% 15%
35 years to 44 years old 18% 24% 19% 19%
45 years to 54 years old 19% 27% 20% 15%
55 years to 64 years old 10% 10% 10% 7%
65 years and older 7% 4% 7% 5%
Total 100% 100% 100% 100%
Base: 2,976 Persons reporting age. May not add to 100 percent due to rounding. Total Percent weighted by geography (geowgt.) *Census 2000, Profile of General Demographic Characteristics

N U S T A T S A N C H O R A G E H O U S E H O L D T R A V E L S U R V E Y T E C H N I C A L R E P O R T 1 3 9 . 2 6 . 0 2
The sample provided an excellent distribution of employed versus non-employed persons in the study area. It contained proportionately the same number of employed persons that are present in the population. The resulting data will provide unique information on the work trips of households in the Municipality of Anchorage.
TABLE 17: EMPLOYMENT STATUS Employment Status Municipality of
Anchorage ER/Chugiak Over Sample
Weighted Combined Percent
Census 2000*
Employed 76% 76% 76% 77% Not employed 24% 23% 24% 23% Total 100% 100% 100% 100%
Base: 1,927 persons over age 15 reporting employment status. May not add to 100 percent due to rounding. Total Percent weighted by geography (geowgt.) *Census 2000 Supplementary Survey Summary Tables. Profile of
Economic Characteristics: 2000.
The sample also represented students well relative to the Census proportions of students versus non-students. Information on trips to school should be adequately covered.
TABLE 18: STUDENT STATUS Student Status Municipality of
Anchorage ER/Chugiak Over
Sample Weighted
Combined Percent Census 2000*
Enrolled 26% 30% 27% 31% Not enrolled 74% 70% 73% 69% Total 100% 100% 100% 100%
Base: 2,380 persons over age 3 providing school enrollment status by level of school. Total Percent weighted by geography (geowgt.) *Census 2000 Supplementary Survey Summary Tables.

N U S T A T S A N C H O R A G E H O U S E H O L D T R A V E L S U R V E Y T E C H N I C A L R E P O R T 1 4 9 . 2 6 . 0 2
CONCLUSION By definition, household travel surveys seek information from a sample of households. Invariably, some members of the sample do not provide the desired information. There are many reasons why the relevant information may not be obtained. Given the wide range of potential outcomes of a data collection effort, it is important to document the outcomes and summarize the success of a survey in collecting data from members of the sample.
As the contents of this technical report indicate, the Anchorage Household Travel Survey sample was a reasonable representation of the study area population. The sample design was executed effectively so that adequate samples were obtained for each of the part of the study area. The sample is a good reflection of population parameters, with the exception of household size, vehicles available, and residence type. The sample can be reliably used for robust statistical analyses on survey results to provide usable information to transportation decision makers and planners.

N U S T A T S A N C H O R A G E H O U S E H O L D T R A V E L S U R V E Y T E C H N I C A L R E P O R T 1 5 9 . 2 6 . 0 2
APPENDIX A – DATA ITEMS

N U S T A T S A N C H O R A G E H O U S E H O L D T R A V E L S U R V E Y T E C H N I C A L R E P O R T 1 6 9 . 2 6 . 0 2
HOUSEHOLD VARIABLES Name Position SAMPN Unique sample number 1 SAMPTYPE Sample type 2 Value Label 1 RDD 2 Chugiak/Eagle River Over sample 3 Telephone Transit 4 On Site Transit RSAMPTYP Recode of sample type to classify households 3 Value Label 1 Anchorage households 2 Chugiak-Eagle River households 3 Transit using households TRANTRIP Household with transit mode trip 4 Value Label 1 Yes 2 No CTFIP County FIPS code 5 HHSIZE Household Size 6 Value Label 1 One 2 Two 3 Three 4 Four 5 Five 6 Six 7 Seven 8 Eight 9 Nine 10 Ten PEOPMOVE Used People Mover last year 7 Value Label 1 Yes 2 No 9 DK/RF

N U S T A T S A N C H O R A G E H O U S E H O L D T R A V E L S U R V E Y T E C H N I C A L R E P O R T 1 7 9 . 2 6 . 0 2
TOTVEH Number of household vehicles available 8 Value Label 0 Zero 1 One 2 Two 3 Three 4 Four 5 Five 6 Six 7 Seven 8 Eight 98 DK/RF BIKES Number of bicycles in household 9 Value Label 0 None 1 One 2 Two 3 Three 4 Four 5 Five 6 Six 7 Seven or more 98 DK/RF BIKEPAST Used bike last summer 10 Value Label 1 Yes 2 No 9 DK/RF WHYBIK Purpose bike was used to travel 11 Value Label 1 Work 2 School 3 Shopping 4 Visiting 5 Recreation/Exercise 7 Multi purpose 9 DK/RF BIKEFUT Will use bike this next summer 12 Value Label 1 Yes 2 No 9 DK/RF WILBIK Purpose for using bike to travel this summer 13 Value Label

N U S T A T S A N C H O R A G E H O U S E H O L D T R A V E L S U R V E Y T E C H N I C A L R E P O R T 1 8 9 . 2 6 . 0 2
1 Work 2 School 3 Shopping 4 Visiting 5 Recreation/Exercise 7 Multi purpose 9 DK/RF HHADDR Home address reference number 14 RESTYPE Type of dwelling unit 15 Value Label 1 Unattached Single Family Home 2 Duplex 3 Apartment 4 Condominium or Townhouse 5 Mobile home or Trailer 6 Group quarters (dorms, barracks, etc.) 7 Other, specify 9 DK/RF O_RESTYP Other dwelling unit type 16 OWN Own/rent status 24 Value Label 1 Own/buying 2 Rent 3 Military 4 Church 5 Government 7 Other, specify 8 DK 9 RF O_OWN Other own/rent status 25 INCOM Household Income 33 Value Label 1 Up to $9,999 2 $10,000 - $19,999 3 $20,000 - $29,999 4 $30,000 - $39,999 5 $40,000 - $49,999 6 $50,000 - $59,999 7 $60,000 - $69,999 8 $70,000 - $79,999 9 $80,000 - $89,999 10 $90,000 - $99,999 11 More than $100,000 98 DK/RF

N U S T A T S A N C H O R A G E H O U S E H O L D T R A V E L S U R V E Y T E C H N I C A L R E P O R T 1 9 9 . 2 6 . 0 2
ASSN Travel day - assignment number 34 Value Label 543 Tuesday, February 12 544 Wednesday, February 13 545 Thursday, February 14 546 Friday, February 15 592 Monday, April 1 594 Wednesday, April 3 595 Thursday, April 4 596 Friday, April 5 599 Monday, April 8 600 Tuesday, April 9 601 Wednesday, April 10 602 Thursday, April 11 603 Friday, April 12 606 Monday, April 15 607 Tuesday, April 16 608 Wednesday, April 17 609 Thursday, April 18 610 Friday, April 19 613 Monday, April 22 614 Tuesday, April 23 615 Wednesday, April 24 616 Thursday, April 25 617 Friday, April 26 620 Monday, April 29 621 Tuesday, April 30 622 Wednesday, May 1 623 Thursday, May 2 624 Friday, May 3 627 Monday, May 6 628 Tuesday, May 7 629 Wednesday, May 8 630 Thursday, May 9 631 Friday, May 10 634 Monday, May 13 635 Tuesday, May 14 636 Wednesday, May 15 637 Thursday, May 16 638 Friday, May 17 FUTCALL Willing to participate in future survey 35 Value Label 1 Yes 2 No 9 DK/RF NTRIPS Number of trips per household 36 TRIPGROU Category of number of household trips 37 Value Label

N U S T A T S A N C H O R A G E H O U S E H O L D T R A V E L S U R V E Y T E C H N I C A L R E P O R T 2 0 9 . 2 6 . 0 2
1 No trips 2 1-5 trips 3 6-10 trips 4 11-15 trips 5 16-20 trips 6 More than 20 trips NWORK Number of household workers 38 NSTUD Number of household students 39 CLASS Household class 40 Value Label 1 No Workers + School Age Kids 2 1 Worker + School Age Kids 3 2+ Workers + School Age Kids 4 No Workers, No Kids 5 1 Worker, No Kids 6 2+ Workers, No Kids 7 Retired 8 Children but not of school age RTOTVEH Recode of totveh for 5+ 41 RHHSZ HH Size - Recoded 42 Value Label 1.00 One 2.00 Two 3.00 Three 4.00 Four 5.00 Five 6.00 Six 7.00 Seven or More FINWGT Weight used for sample statistics (Product of geowgt*hhswgt) 43 EXPWGT Weight used for population estimates (finwgt*expfactor) 44 SUBAREA SUBAREA 45 Value Label 1 Military 2 Downtown 3 Mountain View 4 Muldoon 5 Airport 6 Northwest 7 North Midtown 8 University 9 Sand Lake 10 South Midtown 11 Abbott Loop 12 South Anchorage 13 Campbell Tract 14 Chugiak-Eagle River

N U S T A T S A N C H O R A G E H O U S E H O L D T R A V E L S U R V E Y T E C H N I C A L R E P O R T 2 1 9 . 2 6 . 0 2
99 Missing NKID_RE num kids recode 46 Value Label .00 zero 1.00 one or more NUM_KIDS Number of school age kids in household 47 NWORK_RE nwork recode 48 Value Label .00 zero 1.00 one 2.00 two 3.00 three or more TVEH_RE total vehicles recoded 49 Value Label .00 zero 1.00 one 2.00 two 3.00 three 4.00 four or more HHSWGT Household size weight 50 GEOWGT Geographic weight to compensate for over sample of ER / Chug 51

N U S T A T S A N C H O R A G E H O U S E H O L D T R A V E L S U R V E Y T E C H N I C A L R E P O R T 2 2 9 . 2 6 . 0 2
PERSON VARIABLES Name Position SAMPN Unique sample number 1 PERNO Person number 2 WADDR Work address reference number 3 SADDR School address reference number 4 RESP Respondent flag 5 Value Label 1 Yes 2 No RELAT Relationship to respondent 6 Value Label 1 Self 2 Spouse/partner 3 Son/daughter 4 Mother/father/mother-in-law/father-in-law 5 Other relative 6 Live-in help 7 Not related 9 DK/RF GENDER Gender 7 Value Label 1 Male 2 Female 8 DK 9 RF AGE Age 8 Value Label 0 Under 1 year 998 DK/RF AGEGROUP Age category 9 Value Label

N U S T A T S A N C H O R A G E H O U S E H O L D T R A V E L S U R V E Y T E C H N I C A L R E P O R T 2 3 9 . 2 6 . 0 2
1 <5 years 2 5-17 years 3 18-24 years
4 25-34 years 5 35-44 years 6 45-54 years 7 55-64 years
8 65+ years 9 DK/RF LIC Licensed driver 10 Value Label 1 Yes 2 No 9 DK/RF EMPLY Employment status 11 Value Label 1 Yes, Full-time 2 Yes, Part-time 3 Yes, both full and part time 4 No 9 DK/RF NOEMPLY Primary activity 12 Value Label 1 Retired 2 Disability status 3 Homemaker 4 Unemployed and looking for work 5 Unemployed and not looking for work 7 Other, specify 9 DK/RF O_NOEMPL Other primary activity 13 JOBS Number of paying jobs 28 Value Label 1 One 2 Two 3 Three or more 9 DK/RF WORKHRS Variable work schedule 29 Value Label 1 Hours fixed and the same every day 2 Hours vary at my choice

N U S T A T S A N C H O R A G E H O U S E H O L D T R A V E L S U R V E Y T E C H N I C A L R E P O R T 2 4 9 . 2 6 . 0 2
3 Hours allowed to vary within fixed limits 4 Fixed starting time, but variable ending time 5 Fixed hours, but different hours on different days 6 Variable, depending on work 7 Other, specify 9 DK/RF O_WORKHR Other work schedule 30 TELEWORK Telecommute 37 Value Label 1 Yes 2 No 9 DK/RF HOWOFTEN How often telecommute 38 Value Label 1 Almost every day 2 Once a week or more 3 Once a month or more 4 Only a few times a year 8 DK 9 RF EDUCATT Highest level of education completed 39 Value Label 1 11th grade or less 2 High school graduate 3 2 years of college or Associates Degree 4 4 years of college or Bachelor's Degree 5 Post-graduate/Graduate degree 6 Vocational school 7 Other, specify 9 DK/RF STUDENT Student status 40 Value Label 1 Yes 2 No 9 DK/RF SLEEPTIM Time went to sleep 41 Value Label 9999 DK/RF TOTPL Total places visited 42

N U S T A T S A N C H O R A G E H O U S E H O L D T R A V E L S U R V E Y T E C H N I C A L R E P O R T 2 5 9 . 2 6 . 0 2
NTRIPS Total trips taken 43 Value Label 99 Under 5 years old NOTRIPS Reason for no trips 44 FINWGT Weight used for sample statistics 59 EXPWGT Weight used for population estimates 60 SUBAREA SUBAREA 61 Value Label 1 Military 2 Downtown 3 Mountain View 4 Muldoon 5 Airport 6 Northwest 7 North Midtown 8 University 9 Sand Lake 10 South Midtown 11 Abbott Loop 12 South Anchorage 13 Campbell Tract 14 Chugiak-Eagle River

N U S T A T S A N C H O R A G E H O U S E H O L D T R A V E L S U R V E Y T E C H N I C A L R E P O R T 2 6 9 . 2 6 . 0 2
TRIP VARIABLES Name Position SAMPN Unique Sample number 1 PERNO Person number 2 TRIPNO Trip number 3 DEPART Departure time (military time) 4 DEPHOUR Departure time (hour within) 5 DEPRANGE Departure Time Range 6 Value Label 1 Midnight 12 am to 7 am 2 AM Peak 7 to 9 am 3 Midday 9 am to 3 pm 4 PM Peak 3 to 6 pm 5 Evening 6 pm to 12 Midnight OPTYPE Origin Place Type 7 Value Label 1 HOME 2 WORK 3 SCHOOL 4 PREVIOUSLY ENTERED PLACE 5 NEW PLACE 6 OUT OF TRAVEL STUDY AREA OLOCNO Origin Location Number 8 OACT1 Origin Activity: Primary 9 Value Label 1 At home activities 2 Working at home 3 Work, including regular volunteer work 4 Work related 5 Attending school 6 School related activities 7 Childcare 8 Quick stop for gas, coffee, ATM, etc. 9 Shopping
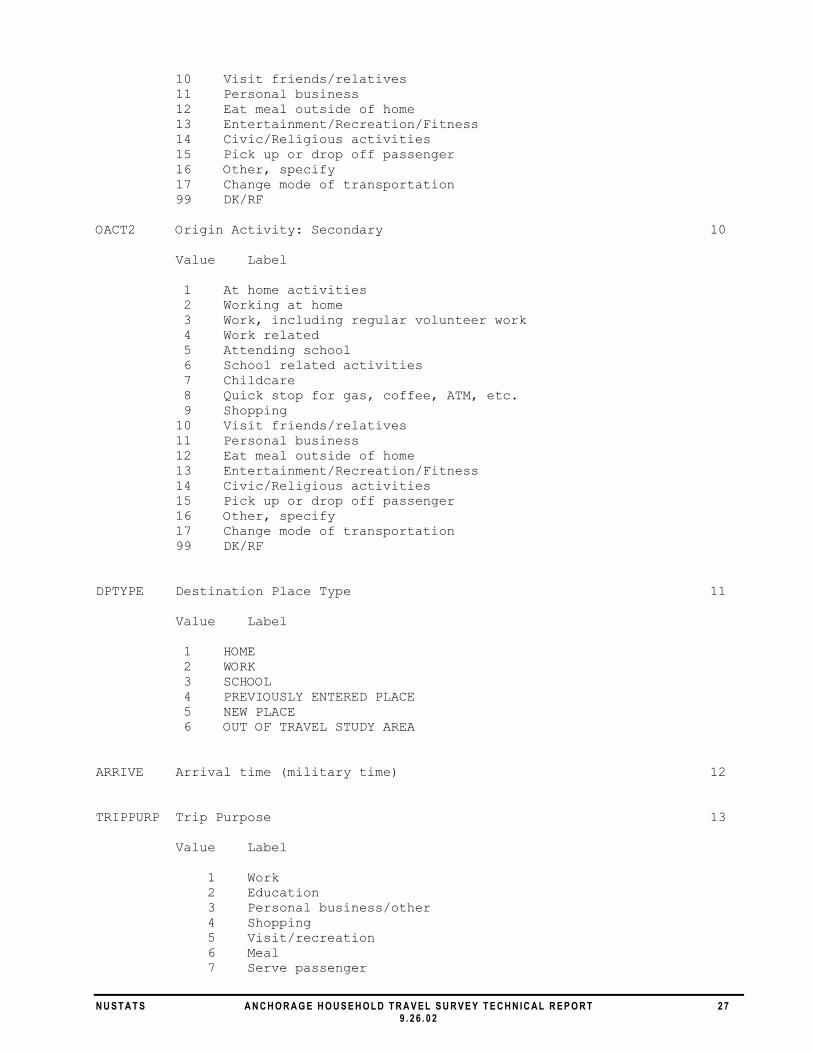
N U S T A T S A N C H O R A G E H O U S E H O L D T R A V E L S U R V E Y T E C H N I C A L R E P O R T 2 7 9 . 2 6 . 0 2
10 Visit friends/relatives 11 Personal business 12 Eat meal outside of home 13 Entertainment/Recreation/Fitness 14 Civic/Religious activities 15 Pick up or drop off passenger 16 Other, specify 17 Change mode of transportation 99 DK/RF OACT2 Origin Activity: Secondary 10 Value Label 1 At home activities 2 Working at home 3 Work, including regular volunteer work 4 Work related 5 Attending school 6 School related activities 7 Childcare 8 Quick stop for gas, coffee, ATM, etc. 9 Shopping 10 Visit friends/relatives 11 Personal business 12 Eat meal outside of home 13 Entertainment/Recreation/Fitness 14 Civic/Religious activities 15 Pick up or drop off passenger 16 Other, specify 17 Change mode of transportation 99 DK/RF DPTYPE Destination Place Type 11 Value Label 1 HOME 2 WORK 3 SCHOOL 4 PREVIOUSLY ENTERED PLACE 5 NEW PLACE 6 OUT OF TRAVEL STUDY AREA ARRIVE Arrival time (military time) 12 TRIPPURP Trip Purpose 13 Value Label 1 Work 2 Education 3 Personal business/other 4 Shopping 5 Visit/recreation 6 Meal 7 Serve passenger

N U S T A T S A N C H O R A G E H O U S E H O L D T R A V E L S U R V E Y T E C H N I C A L R E P O R T 2 8 9 . 2 6 . 0 2
8 Work/school-based 9 Other MODE Travel mode 14 Value Label 1 Walk 2 Bike 3 Auto/Van/Truck - Driver 4 Auto/Van/Truck - Passenger 5 Public bus 6 School bus 7 Taxi/Shuttle/Limo 8 Motorcycle 97 Other, specify 99 DK/RF GETTO Bus access 15 Value Label 1 Walk 2 Drove and parked 3 Was dropped off 4 Rode bike 7 Other, specify 9 DK/RF 97 Other, specify PARKNRD1 Park and Ride lot 1 16 Value Label 9 DK/RF ROUTE Bus route 17 Value Label 1 Record response 9 DK/RF GETFR Bus egress 18 Value Label 1 Walk 2 Pick up car and drove 3 Was picked up 4 Rode bike 7 Other, specify 9 DK/RF PARTY Number of people on trip (not including self) 19 HHMEM Number of household members on trip 20

N U S T A T S A N C H O R A G E H O U S E H O L D T R A V E L S U R V E Y T E C H N I C A L R E P O R T 2 9 9 . 2 6 . 0 2
Value Label 99 DK/RF PERTP Household members on trip 21 Value Label 99 DK/RF NONHH Number of non-household members on trip 22 Value Label 98 DK/RF SPDFLAGS Speedflags 23 Value Label 0 No speed violation 1 Respondent Error - same area/different trip (miles = 0) 2 Add 5 minutes and will pass speed check 3 Add 10 minutes and will pass speed check-geocoding verified 4 Add 15 minutes and will pass speed check- geocoding verified 5 Unresolved speed violation DLOCNO Destination Location Number 24 DACT1 Destination Activity: Primary 25 Value Label 1 At home activities 2 Working at home 3 Work, including regular volunteer work 4 Work related 5 Attending school 6 School related activities 7 Childcare 8 Quick stop for gas, coffee, ATM, etc. 9 Shopping 10 Visit friends/relatives 11 Personal business 12 Eat meal outside of home 13 Entertainment/Recreation/Fitness 14 Civic/Religious activities 15 Pick up or drop off passenger 16 Other, specify 17 Change mode of transportation 99 DK/RF DACT2 Destination Activity: Secondary 26 Value Label 1 At home activities 2 Working at home 3 Work, including regular volunteer work

N U S T A T S A N C H O R A G E H O U S E H O L D T R A V E L S U R V E Y T E C H N I C A L R E P O R T 3 0 9 . 2 6 . 0 2
4 Work related 5 Attending school 6 School related activities 7 Childcare 8 Quick stop for gas, coffee, ATM, etc. 9 Shopping 10 Visit friends/relatives 11 Personal business 12 Eat meal outside of home 13 Entertainment/Recreation/Fitness 14 Civic/Religious activities 15 Pick up or drop off passenger 16 Other, specify 17 Change mode of transportation 99 DK/RF TRPDUR Trip Duration (Computed = DEPART – ARRIVE) 27 ACTDUR Activity Duration 28 TRPDURGR Trip Duration Category 29 Value Label 1 Less than 15 minutes 2 15-30 minutes 3 31-60 minutes 4 More than 60 minutes FINWGT Weight used for sample statistics 30 EXPWGT Weight used for population estimates 31 HSUBAREA Household Subarea 32 Value Label 1 Military 2 Downtown 3 Mountain View 4 Muldoon 5 Airport 6 Northwest 7 North Midtown 8 University 9 Sand Lake 10 South Midtown 11 Abbott Loop 12 South Anchorage 13 Campbell Tract 14 Chugiak-Eagle River 99 Missing AGEGROUP Age Group 33
N U S T A T S A N C H O R A G E H O U S E H O L D T R A V E L S U R V E Y T E C H N I C A L R E P O R T 3 1 9 . 2 6 . 0 2
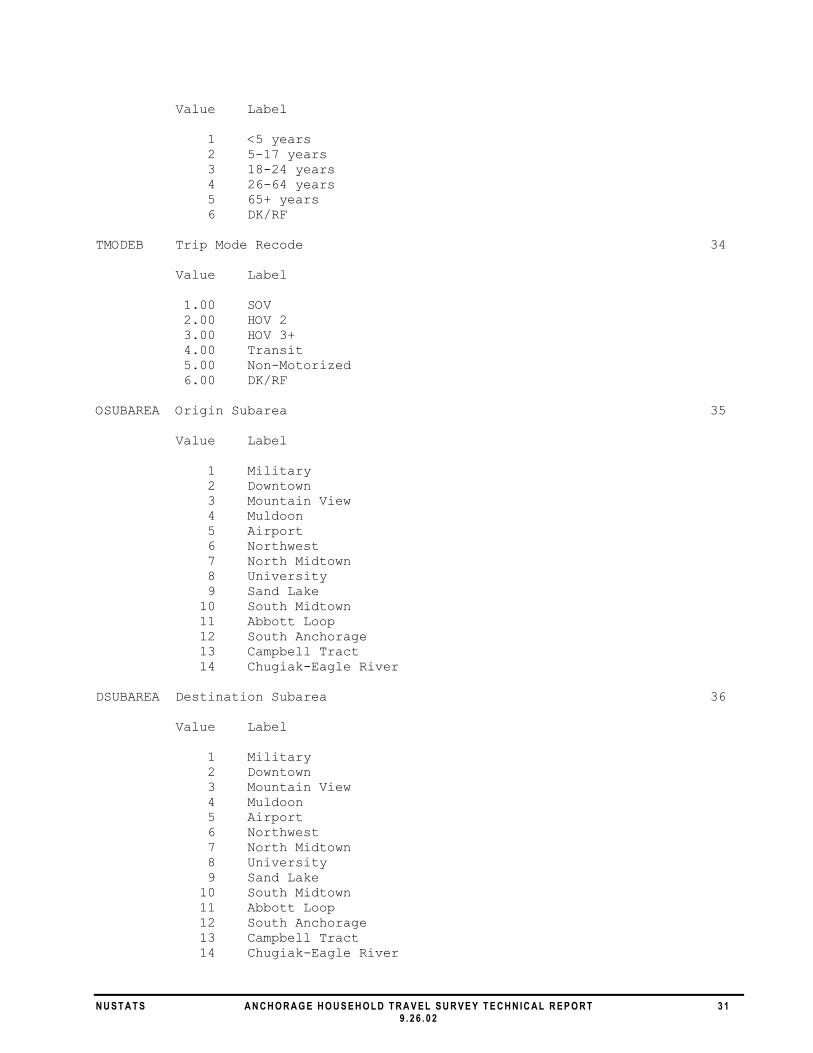
Value Label 1 <5 years 2 5-17 years 3 18-24 years 4 26-64 years 5 65+ years 6 DK/RF TMODEB Trip Mode Recode 34 Value Label 1.00 SOV 2.00 HOV 2 3.00 HOV 3+ 4.00 Transit 5.00 Non-Motorized 6.00 DK/RF OSUBAREA Origin Subarea 35 Value Label 1 Military 2 Downtown 3 Mountain View 4 Muldoon 5 Airport 6 Northwest 7 North Midtown 8 University 9 Sand Lake 10 South Midtown 11 Abbott Loop 12 South Anchorage 13 Campbell Tract 14 Chugiak-Eagle River DSUBAREA Destination Subarea 36 Value Label 1 Military 2 Downtown 3 Mountain View 4 Muldoon 5 Airport 6 Northwest 7 North Midtown 8 University 9 Sand Lake 10 South Midtown 11 Abbott Loop 12 South Anchorage 13 Campbell Tract 14 Chugiak-Eagle River

N U S T A T S A N C H O R A G E H O U S E H O L D T R A V E L S U R V E Y T E C H N I C A L R E P O R T 3 2 9 . 2 6 . 0 2
AVOFLAG Vehicle Occupancy Flag 37 Value Label 1 All Non-Household Members 2 All Household Members 3 Both Household & Non-Household TPURPB Trip Purpose 38 Value Label 1.00 Work (to or from Work) 2.00 School (to or from School) 3.00 Personal Business 4.00 Shopping 5.00 Recreation 6.00 Eat Out 7.00 Serve Passenger 8.00 Other TPURPC Purpose Recode 39 Value Label 1.00 Home-Based Work (to work from home) 2.00 Home-Based Other (to all else from home) 3.00 Non-Home Based (trips not starting from home) FWFLAG Trips from work 40 TWFLAG Trips to work 41

N U S T A T S A N C H O R A G E H O U S E H O L D T R A V E L S U R V E Y T E C H N I C A L R E P O R T 3 3 9 . 2 6 . 0 2
VEHICLE VARIABLES Name Position SAMPN Unique sample number 1 VEHNO Vehicle number 2 YEAR Vehicle year 3 MAKE Vehicle make 4 Value Label 1 Acura 2 Audi 3 BMW 4 Buick 5 Cadillac 6 Chevrolet 7 Chrysler 8 Dodge 9 Ford 10 Geo 11 GMC 12 Harley Davidson 13 Honda 14 Hyundai 15 Infiniti 16 Isuzu 17 Jaguar 18 Jeep 19 Kawasaki 20 Kia 21 Lexus 22 Lincoln 23 Mazda 24 Mercury 25 Mercedes 26 Mitsubishi 27 Nissan 28 Oldsmobile 29 Plymouth 30 Pontiac 31 Porsche 32 Range Rover 33 Saab 34 Saturn 35 Subaru 36 Suzuki 37 Toyota 38 Volkswagon 39 Volvo 40 Yamaha 41 Daewoo

N U S T A T S A N C H O R A G E H O U S E H O L D T R A V E L S U R V E Y T E C H N I C A L R E P O R T 3 4 9 . 2 6 . 0 2
97 Other, specify 98 DK 99 RF O_MAKE Other vehicle make 5 MODEL_1_ Vehicle model 13 O_MODEL_ Other vehicle model 17 FINWGT Weight used for sample statistics 25 EXPWGT Weight used for population estimates 26

N U S T A T S A N C H O R A G E H O U S E H O L D T R A V E L S U R V E Y T E C H N I C A L R E P O R T 3 5 9 . 2 6 . 0 2
LOCATION VARIABLES Name Position LOCNO Unique Location Reference Number 1 LOCTYPE Location Type 2 Value Label 1 Home 2 Primary workplace 3 School 4 Secondary workplace 5 Previously entered place/Someone else's habitual address 6 New place 7 Out of the travel study area but in AK 9 Out of the travel study area and not in AK NAME Location Name 3 ADDRESS Location Street Address 12 SUITE Location number/suite 19 XSTREET Closest cross street(s) 20 LANDMARK Closest landmark 29 CITY Location city 38 COUNTY Location borough 42 STATE Location state 45 ZIP Location zip code 48 AV_STATU ArcView status 49 XCORD Location latitude 51 YCORD Location longitude 52

N U S T A T S A N C H O R A G E H O U S E H O L D T R A V E L S U R V E Y T E C H N I C A L R E P O R T 3 6 9 . 2 6 . 0 2
AV_SCORE ArcView score 53 AV_SIDE ArcView side 54 AV_ZONE ArcView zone 56 AV_ADD ArcView address 58 GEOCITY ArcView city 68 GEOZIP ArcView zip code 72 FIPSCODE Fipscode 73 EASA East Anchorage Study Area 75 Value Label 1 East Anchorage Study Area QCFLAG Quality Control Flag 76 Value Label 1 Given City matches GEOCITY and Given Zip matches GEOZIP 2 Given Zip matches GEOZIP 3 Given City matches GEOCITY 4 Visually Point Verified (or verified unmatched, out of area) SUBAREA_ Subarea Number 77 SUBNAME Name of Subarea 78

N U S T A T S A N C H O R A G E H O U S E H O L D T R A V E L S U R V E Y T E C H N I C A L R E P O R T 3 7 9 . 2 6 . 0 2
APPENDIX B – RECRUITMENT SCRIPT

N U S T A T S A N C H O R A G E H O U S E H O L D T R A V E L S U R V E Y T E C H N I C A L R E P O R T 3 8 9 . 2 6 . 0 2
Hi, my name is _____ and I'm calling on behalf of the Municipality of Anchorage. May I speak with the head of the household? We are conducting a study of travel patterns in Anchorage. The study is purely a research effort and any information you provide will be kept strictly confidential. Your information will be combined with that of 1,400 other households in the area to help your local government improve the transportation system. Let me assure you that we are not trying to solicit or sell you anything. Your participation will involve your recording your travel for one day in a specially prepared travel log, which we will mail to you. In order to prepare the logs, I need to ask a few questions about your household's vehicles and the members of your household. «HHSIZ » How many people, including yourself, live in your household? IF NEEDED: This includes all persons who sleep there at least 3 nights per week. «TRANS » Does anyone in your household ride People Mover within the last year? PEOPLEMOVER IS THE ANCHORAGE PUBLIC TRANSIT SYSTEM. «HHVEH » Next, how many vehicles are available to members of your household? (This number should include all cars, trucks, vans, motorcycles and recreational vehicles, whether owned or leased or provided by an employer and in working condition.) <VEHNO> Now I need to get some information about each vehicle. Starting with the vehicle that is driven the most, what is the vehicle year, make, and model? «BIKES » How many bicycles in working condition are available to your household for traveling to work, school, shopping or other travel purpose? «BIKEU » Last summer, did anyone in your household use one of the bicycles to travel to work, school, shopping or some other activity? YES 1 NO 2 => USEBK DK/RF 9 => USEBK «WHYBK » For what purpose was the bike used to travel? Work 1 School 2 Shopping 3 Visiting 4 Recreation/Exercise 5 OTHER, SPECIFY 7 O DK/RF 9

N U S T A T S A N C H O R A G E H O U S E H O L D T R A V E L S U R V E Y T E C H N I C A L R E P O R T 3 9 9 . 2 6 . 0 2
«USEBK » Next summer, does anyone in your household plan to use one of the bikes to travel to work, school, shopping or some other activity next summer? YES 1 NO 2 => RESTY DK/RF 9 => RESTY «WILBK » For what purpose will the bike used? Work 1 School 2 Shopping 3 Visiting 4 Recreation/Exercise 5 OTHER, SPECIFY 7 O DK/RF 9 «RESTY » Do you live in a... Unattached Single Family Home 1 Duplex 2 Apartment 3 Condominium or townhouse 4 Mobile home or trailer 5 Group quarters (dorms, barracks, etc) 6 OTHER, SPECIFY 7 O DK/RF 9 «HADDR » Where is your home located? **PHYSICAL ADDRESS. NO P.O. BOXES ALLOWED** «HXSTR » What is the closest intersection to where you live? «HLAND » Is there a recognizable landmark nearby, such as a park, major employer, or other popular destination? «OWN » Do you own or rent this home? Own/buying 1 Rent 2 OTHER, SPECIFY 7 O DK 8 RF 9 Now I need to get some information about each person in your household, so I can prepare individual diaries. Again, I want to assure you that this information is for research purposes only and will be held in strict confidence. Earlier you indicated that there were<HHSIZ>persons in your household.

N U S T A T S A N C H O R A G E H O U S E H O L D T R A V E L S U R V E Y T E C H N I C A L R E P O R T 4 0 9 . 2 6 . 0 2
«RELAT » What is<FNAME >'s relationship to you? DON'T ASK FOR RESPONDENT SELF 1 Spouse/partner 2 Son/Daughter 3 Mother/Father/Mother In-law/Father In-law 4 Other relative 5 Live-in Help 6 Not Related 7 DK/RF 9 «GEND » What is<YOUR >gender? DON'T ASK FOR RESPONDENT MALE 1 FEMALE 2 DK/RF 9 «AGE » What is<YOUR>age, in years? IF LESS THAN 1, ENTER 0 RANGE: 0 - 105 DK 998 RF 999 «LIC » Do/Does<YOU >have a valid driver's license? Yes 1 No 2 DK/RF 9 «EMPLY » Are/Is<YOU>employed full-time or part-time? Yes, Full-time 1 => JOBS Yes, Part-time 2 => JOBS Yes, Both Full- and Part-time 3 => JOBS No 4 DK/RF 9 «PRIMA » Which of the following best describes<YOUR >current situation? Retired 1 Disability status 2 Homemaker 3 Unemployed and looking for work 4 Unemployed and not looking for work 5 OTHER, SPECIFY 7 O DK/RF 9 «JOBS » How many paying jobs do/does<YOU >hold? ONE 1 TWO 2 THREE OR MORE 3 DK/RF 9

N U S T A T S A N C H O R A G E H O U S E H O L D T R A V E L S U R V E Y T E C H N I C A L R E P O R T 4 1 9 . 2 6 . 0 2
«HRVR1 » How would you describe<YOUR>work schedule at<YOUR>job? YOU MAY USE MULTIPLE RESPONSE FOR MORE THAN 1 JOB NUMBER OF JOBS:<JOBS > Hours fixed and the same every day 1 Hours vary at my choice 2 Hours allowed to vary within fixed limits 3 Fixed starting time, but variable ending time 4 Fixed hours, but different hours on different days 5 Variable, depending on work 6 OTHER, SPECIFY 7 O DK/RF 8 «TELEC » Do/Does<YOU >ever telecommute, that is work at home instead of traveling to<YOUR >usual place of employment? YES 1 NO 2 => EDUCA DK 8 => EDUCA RF 9 => EDUCA «TELEO » How often? Almost every day 1 Once a week or more 2 Once a month or more 3 Only a few times a year 4 DK 8 RF 9 «EDUCA » What is the highest level of education<YOU >have/has attained? 11th grade or less 1 High school graduate 2 2 years of college or Associate's Degree 3 4 years of college or Bachelor's Degree 4 Post-graduate/Graduate Degree 5 Vocational school 6 OTHER, SPECIFY 7 O DK/RF 9 «STUDE » Are/Is<YOU>currently enrolled in any type of school? YES 1 NO 2 DK/RF 9 «INCOM » Was your household's total annual income last year from all sources before taxes, for all members of your household, above or below $50,000? BELOW 50K 1 => INCB5 ABOVE 50K 2 => INCA5 DK/RF 9 THEY ABSOLUTELY WILL NOT SAY WHAT THEIR INCOME IS 9 => /INCOM

N U S T A T S A N C H O R A G E H O U S E H O L D T R A V E L S U R V E Y T E C H N I C A L R E P O R T 4 2 9 . 2 6 . 0 2
I'm going to read a series of income ranges. Please stop me when I get to the range closest to your household's. INCOME Up to $9,999 01 $10,000 - $19,999 02 $20,000 - $29,999 03 $30,000 - $39,999 04 $40,000 - $49,999 05 $50,000 - $59,999 06 $60,000 - $69,999 07 $70K to $79,999 08 $80K to $89,999 09 $90K to $99,999 10 More than $100K 11 DK 98 RF 99 «ASSN » Okay, your household will keep track of their travel on READ DATE. PRESS ENTER TO CONTINUE Thank you very much for helping us. We'll call you on the day before <ASSN> to make sure you received your logs and to answer any questions you might have. Thank you again and have a nice day. Goodbye. END OF SURVEY 1 D «THANK »

N U S T A T S A N C H O R A G E H O U S E H O L D T R A V E L S U R V E Y T E C H N I C A L R E P O R T 4 3 9 . 2 6 . 0 2
APPENDIX C – DIARY PACKET MATERIALS

N U S T A T S A N C H O R A G E H O U S E H O L D T R A V E L S U R V E Y T E C H N I C A L R E P O R T 4 4 9 . 2 6 . 0 2
APPENDIX D – RETRIEVAL SCRIPT

N U S T A T S A N C H O R A G E H O U S E H O L D T R A V E L S U R V E Y T E C H N I C A L R E P O R T 4 5 9 . 2 6 . 0 2
Hi - my name is _______ and I'm calling on behalf of the Municipality of Anchorage about the travel survey your household recently completed. May I please speak with someone over the age of 18? I'm calling to collect your travel information. Our records show that you traveled on<ASSN «TOTPL » How many total places did<YOU >visit over the course of the travel day? DK/RF 999 «PTYPE » IF PLACE 1: Okay - Where were/was<YOU >at 3 am on... OTHERWISE: Where did you go next? HOME 01 => TIME1 WORK 02 => TIME1 SCHOOL 03 => TIME1 PREVIOUSLY ENTERED PLACE. IE MOM DROPS KIDS OFF AT SCHOOL. 04 NEW PLACE (ASK IF THAT IS IN THE ANCHORAGE BOWL. IF NOT, IT'S OUT OF THE STUDY AREA SO, SELECT #6) 05 OUT OF THE TRAVEL STUDY AREA 06 «LOCAT » Does the place have a name? «ADDR » What is the street address of that place? Is there a suite or apartment number? «XSTRT » What is the nearest cross street or cross streets to that place? FORMAT: STREET1/STREET2 «LAND » What is the nearest major landmark? THIS CAN BE ANYTHING THAT WE CAN USE TO TRY TO FIND THIS PLACE. EXAMPLE: 7-11 ON THE CORNER OF XYZ STREET, STORE, ETC «ARRTM » IF PLACE 1, ENTER 0300 OTHERWISE: What time did<YOU >get there? ENTER IN MILITARY TIME, HHMM 0000-MIDNIGHT, 1200-NOON, 2359-11:59PM, 0030-12:30AM «TRPDR » COMPUTED TRIP DURATION «MODE » How did<YOU >get there? Walk 01 Bike 02 Driver-Auto/Van/Truck 03 Passenger-Auto/van/truck 04 Public bus 05 School bus 06 Taxi/Shuttle/Limo 07 Motorcycle 08
N U S T A T S A N C H O R A G E H O U S E H O L D T R A V E L S U R V E Y T E C H N I C A L R E P O R T 4 6 9 . 2 6 . 0 2
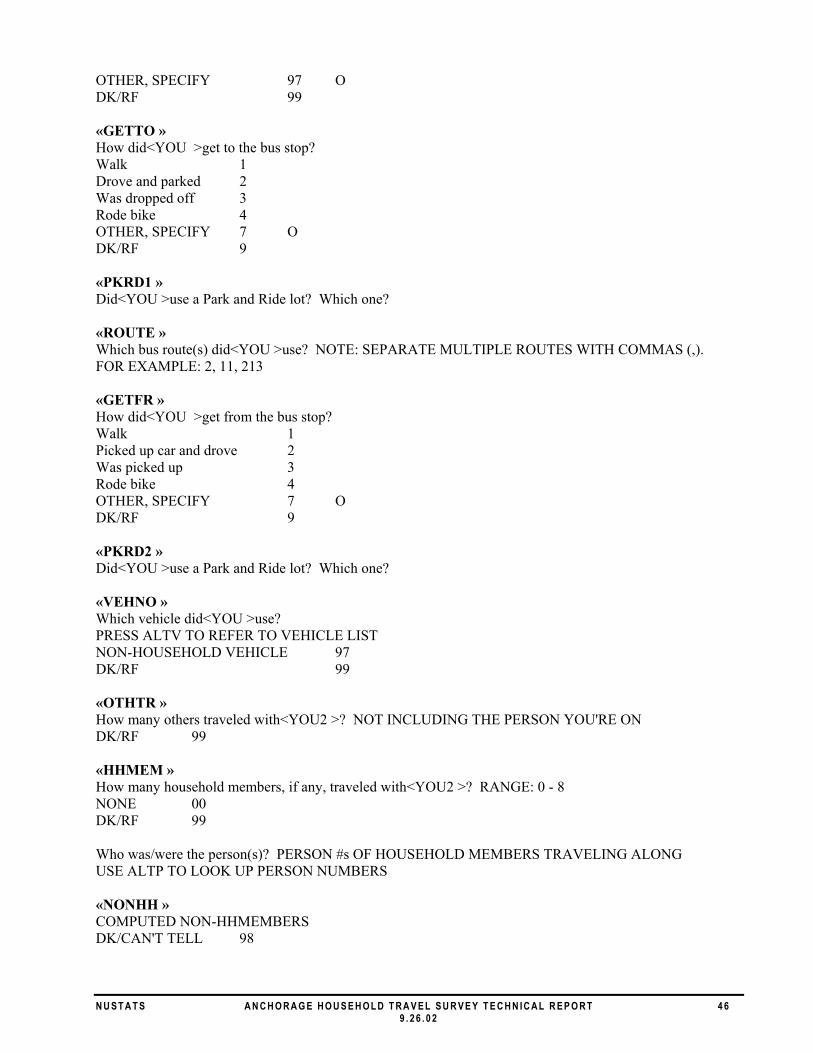
OTHER, SPECIFY 97 O DK/RF 99 «GETTO » How did<YOU >get to the bus stop? Walk 1 Drove and parked 2 Was dropped off 3 Rode bike 4 OTHER, SPECIFY 7 O DK/RF 9 «PKRD1 » Did<YOU >use a Park and Ride lot? Which one? «ROUTE » Which bus route(s) did<YOU >use? NOTE: SEPARATE MULTIPLE ROUTES WITH COMMAS (,). FOR EXAMPLE: 2, 11, 213 «GETFR » How did<YOU >get from the bus stop? Walk 1 Picked up car and drove 2 Was picked up 3 Rode bike 4 OTHER, SPECIFY 7 O DK/RF 9 «PKRD2 » Did<YOU >use a Park and Ride lot? Which one? «VEHNO » Which vehicle did<YOU >use? PRESS ALTV TO REFER TO VEHICLE LIST NON-HOUSEHOLD VEHICLE 97 DK/RF 99 «OTHTR » How many others traveled with<YOU2 >? NOT INCLUDING THE PERSON YOU'RE ON DK/RF 99 «HHMEM » How many household members, if any, traveled with<YOU2 >? RANGE: 0 - 8 NONE 00 DK/RF 99 Who was/were the person(s)? PERSON #s OF HOUSEHOLD MEMBERS TRAVELING ALONG USE ALTP TO LOOK UP PERSON NUMBERS «NONHH » COMPUTED NON-HHMEMBERS DK/CAN'T TELL 98

N U S T A T S A N C H O R A G E H O U S E H O L D T R A V E L S U R V E Y T E C H N I C A L R E P O R T 4 7 9 . 2 6 . 0 2
«TPUR1 » What was<YOUR >your main purpose for traveling there? DO NOT READ LIST. SELECT BEST MATCH AND CONFIRM. NO OTHER ACTIVITIES 00 N AT HOME ACTIVITIES 01 WORKING AT HOME 02 WORK 03 WORK RELATED 04 ATTENDING SCHOOL 05 SCHOOL-RELATED ACTIVITIES 06 CHILDCARE 07 QUICK STOP FOR GAS, COFFEE, ATM, ETC 08 SHOPPING 09 VISIT FRIENDS/RELATIVES 10 PERSONAL BUSINESS 11 EAT MEAL OUTSIDE OF HOME 12 ENTERTAINMENT/RECREATION/FITNESS 13 CIVIC/RELIGIOUS ACTIVITES 14 PICK-UP OR DROP-OFF PASSENGER 15 OTHER, SPECIFY 16 O CHANGE MODE OF TRANSPORTATION 17 DK/RF 99 «TPUR2_01 » «TPUR2_02 » «TPUR2_03 » And what other activities did<YOU >do there? NO OTHER ACTIVITIES 00 X AT HOME ACTIVITIES 01 WORKING AT HOME 02 WORK 03 WORK RELATED 04 ATTENDING SCHOOL 05 SCHOOL-RELATED ACTIVITIES 06 CHILDCARE 07 QUICK STOP FOR GAS, COFFEE, ATM, ETC 08 SHOPPING 09 VISIT FRIENDS/RELATIVES 10 PERSONAL BUSINESS 11 EAT MEAL OUTSIDE OF HOME 12 ENTERTAINMENT/RECREATION/FITNESS 13 CIVIC/RELIGIOUS ACTIVITES 14 PICK-UP OR DROP-OFF PASSENGER 15 OTHER, SPECIFY 16 O CHANGE MODE OF TRANSPORTATION 17 DK/RF 99 X Did<YOU >go anywhere else that day? IF THEY WENT OUT OF THE STUDY AREA, ASK IF THEY CAME BACK INTO THE STUDY AREA THAT DAY. IF THEY SAY "YES", SELECT "Yes". OTHERWISE, SELECT "No"

N U S T A T S A N C H O R A G E H O U S E H O L D T R A V E L S U R V E Y T E C H N I C A L R E P O R T 4 8 9 . 2 6 . 0 2
«DEPTM » IF LAST PLACE OF THE DAY, ENTER 0259 OTHERWISE: What time did<YOU >leave for the next place? ENTER IN MILITARY TIME, HHMM 0000-MIDNIGHT, 1200-NOON, 2359-11:59PM, 0030-12:30AM «NOGO » So,<YOU >made no trips, including for work or school? TRUE: Why not? 1 O FALSE 2 => CHECK «FOLOW » Okay, great. Those are all the questions I have for you today. Would you be interested in participating in a follow-up survey on the topic of transportation? YES 1 NO 2 DK/RF 9