technical report maverick springs p nevada … · technical report maverick springs project nevada,...
TRANSCRIPT

TECHNICAL REPORT MAVERICK SPRINGS PROJECT
NEVADA, USA
PREPARED FOR
AND
SNOWDEN MINING INDUSTRY CONSULTANTS #720 – 1090 WEST PENDER STREET, VANCOUVER, B.C. V6E 2N7
PROJECT NUMBER: 03V315 EFFECTIVE DATE: APRIL 13, 2004 PREPARED BY: NEIL BURNS M.SC., P.GEO.
Vista Gold Corp April 13, 2004 Technical Report, Maverick Springs Doc Ref: 03V315 Report.doc
Snowden Mining Industry Consultants Page ii
CONTENTS CONTENTS ............................................................................................................................... II 1. SUMMARY ......................................................................................................................... 1 2. INTRODUCTION AND TERMS OF REFERENCE .............................................................. 3 3. DISCLAIMER...................................................................................................................... 4 4. PROPERTY DESCRIPTION AND LOCATION ................................................................... 5 5. ACCESSIBILITY, CLIMATE, LOCAL RESOURCES, INFRASTRUCTURE AND
PHYSIOGRAPHY ............................................................................................................... 6 6. HISTORY ............................................................................................................................ 7 7. GEOLOGICAL SETTING.................................................................................................... 8 8. DEPOSIT TYPE .................................................................................................................. 9 9. MINERALIZATION............................................................................................................ 10 10. EXPLORATION............................................................................................................ 11 11. DRILLING..................................................................................................................... 12 12. SAMPLING METHOD AND APPROACH..................................................................... 14
12.1. Diamond Drilling ..................................................................................................... 14 12.2. Reverse Circulation Drilling ................................................................................... 14
13. SAMPLE PREPARATION, ANALYSES AND SECURITY ........................................... 16 14. DATA VERIFICATION.................................................................................................. 17
14.1. Quality Control ........................................................................................................ 17 14.2. Independent Sampling............................................................................................ 22 14.3. Assay Certificate Review........................................................................................ 25
15. ADJACENT PROPERTIES .......................................................................................... 26 16. MINERAL PROCESSING AND METALLURGICAL TESTING .................................... 27 17. MINERAL RESOURCE AND MINERAL RESERVE ESTIMATES................................ 28
17.1. Available Data ......................................................................................................... 28 17.2. Conversion to Milli-Ounce...................................................................................... 28 17.3. Compositing and Bias Adjustment........................................................................ 28 17.4. Geological Interpretation........................................................................................ 29 17.5. Statistical Analysis ................................................................................................. 32 17.6. Geostatistical Analysis........................................................................................... 35 17.7. Resource Estimate.................................................................................................. 39 17.8. Density..................................................................................................................... 47 17.9. Reporting of Tonnages and Grades ...................................................................... 47
18. OTHER RELEVANT DATA AND INFORMATION........................................................ 49
Vista Gold Corp April 13, 2004 Technical Report, Maverick Springs Doc Ref: 03V315 Report.doc
Snowden Mining Industry Consultants Page iii
19. CONCLUSIONS AND RECOMMENDATIONS............................................................. 50 20. REFERENCES ............................................................................................................. 51 21. CERTIFICATE OF AUTHOR........................................................................................ 52
FIGURES Figure 11.1 Plan View of Drill Hole Locations ................................................................... 12 Figure 14.1 Original Goldbar Fire Assays vs. ALS Chemex Duplicate Fire Assays - Gold 20 Figure 14.2 Original Goldbar Fire Assays vs. ALS Chemex Duplicate Fire Assays - Silver21 Figure 14.3 Original AAL Assay Results vs. ALS Chemex Check Assays - Gold .............. 24 Figure 14.4 Original AAL Assay Results vs. ALS Chemex Check Assays - Silver............. 24 Figure 17.1 Probability Plot of Sample Lengths ................................................................ 28 Figure 17.2 Isometric View of Anticlinal Form of Mineralization ........................................ 29 Figure 17.3 Schematic Cross-Section............................................................................... 30 Figure 17.4 Log Probability Plot of AuEQ Composites ...................................................... 31 Figure 17.5 Typical Cross-Section Showing the Distribution of +10moz AuEQ Blocks...... 31 Figure 17.6 Log Histogram and Log Probability Plot - Gold, Southern Main Zone............. 32 Figure 17.7 Log Histogram and Log Probability Plot - Gold, Northern Main Zone ............. 32 Figure 17.8 Log Histogram and Log Probability Plot - Gold, Southern Low Grade Zone ... 33 Figure 17.9 Log Histogram and Log Probability Plot - Gold, Northern Low Grade Zone.... 33 Figure 17.10 Log Histogram and Log Probability Plot - Silver, Southern Main Zone........... 34 Figure 17.11 Log Histogram and Log Probability Plot - Silver, Northern Main Zone ........... 34 Figure 17.12 Log Histogram and Log Probability Plot - Silver, Southern Low Grade Zone . 35 Figure 17.13 Log Histogram and Log Probability Plot - Silver, Northern Low Grade Zone.. 35 Figure 17.14 Continuity Analysis Conventions ................................................................... 36 Figure 17.15 Continuity Analysis Conventions ................................................................... 37 Figure 17.16 Direction 1 Variogram for Gold ...................................................................... 38 Figure 17.17 Direction 1 Variogram for Silver..................................................................... 38 Figure 17.18 Block Model Definition ................................................................................... 40 Figure 17.19 Classified blocks on Section 13E................................................................... 42 Figure 17.20 Composite Grades (left) compared with Block Grades – Gold ....................... 43 Figure 17.21 Capped Composite Grades (left) Compared with Block Grades - Silver ........ 43 Figure 17.22 Trend Validation Plot - Gold - by Easting....................................................... 44 Figure 17.23 Trend Validation Plot - Gold - by Northing ..................................................... 44 Figure 17.24 Trend Validation Plot - Gold - by Elevation .................................................... 45 Figure 17.25 Trend Validation Plot - Silver - by Easting...................................................... 45 Figure 17.26 Trend Validation Plot - Silver - by Northing .................................................... 46 Figure 17.27 Trend Validation Plot - Silver - by Elevation................................................... 46 TABLES Table 1.1 Maverick Springs Classified Resource Estimate in terms of Silver Equivalence2 Table 10.1 Drill Campaign Summary ............................................................................... 11 Table 14.1 Statistics of ALS Chemex Duplicate Fire Assays - Gold................................. 18 Table 14.2 Statistics of ALS Chemex Duplicate Fire Assays - Silver ............................... 19 Table 14.3 Drill Core Intervals Reviewed by Snowden in 2002........................................ 22
Vista Gold Corp April 13, 2004 Technical Report, Maverick Springs Doc Ref: 03V315 Report.doc
Snowden Mining Industry Consultants Page iv
Table 14.4 RC Drilling Intervals Selected by Snowden in 2003 ....................................... 23 Table 17.1 Gold and Silver Prices ................................................................................... 39 Table 17.2 Global Validation Statistics............................................................................. 42 Table 17.3 Density Determinations (Bates, 2002)............................................................ 47 Table 17.4 Maverick Springs Classified Resource Estimate in terms of Silver Equivalence.
...................................................................................................................... 47 APPENDICES Appendix A Maverick Springs Project Drill Hole Listing Appendix B Vista’s 2003 Standards Analysis Appendix C Vista American Assay vs. ALS Chemex Plots Appendix D Snowden 2002 Independent Analysis Appendix E Snowden 2003 Independent Check Analysis Appendix F Variography Appendix G Kriging Parameters Appendix H Resource Estimate Summary Tables Appendix I 2003 Site Visit Photos

Vista Gold Corp April 13, 2004 Technical Report, Maverick Springs Doc Ref: 03V315 Report.doc
Snowden Mining Industry Consultants Page 1
1. SUMMARY Snowden Mining Industry Consultants (Snowden) was asked by Vista Gold Corporation (Vista) to provide an updated resource estimate for the Maverick Springs Project, Nevada. The resource estimation work was undertaken in compliance with CIM Mineral Resource and Mineral Reserve definitions that are referred to in National Instrument (NI) 43-101, Standards of disclosure for Mineral Projects. This Technical Report has been prepared in compliance with the requirements of Form 43-101F. The Maverick Springs Project is located approximately half-way between Elko and Ely, Nevada and covers approximately 3,970 acres within the prospective region of gold/silver mineralization known as the Carlin Trend. The ownership of the property is subject to an agreement between Vista and Newmont Corporation (Newmont) and to a management agreement between Vista and Silver Standard Resources Inc (SSRI). The geology in the region is dominated by limestones and dolostones of the Permian Pennsylvanian Rib Hill Formation, limestones of the Permian Pequop Formation, and carbonate strata of the Permian Park City Group that were deposited along a continental margin. The sediments have been intruded locally by Cretaceous acidic to intermediate, biotitic igneous rocks and have been overlain by Tertiary rhyolites, Late Tertiary tuffs and sediments. The Carlin Trend is thought to mark a deep penetrating fault that separates relatively thick and stable continental crust to the east from a zone of thinned transitional crust to the west. Late basin and range faulting has left a northeast lineation to the topography and structural setting. This trend is offset by northwest trending structures that locally produce horsts of pre-Cenozoic units that are bounded to the northeast and southwest by Tertiary units. The Maverick Springs Project is underlain primarily by Upper Paleozoic calcareous and siliciclastic sediments covered by local basin-fill Tertiary volcanic rocks. Silty limestone and fine grained calcareous clastic sediments of the Permian Rib Hill Formation are the dominant hosts to the silver-gold mineralization at Maverick Springs. These units generally strike to the north and dip to the east. Intrusives of felsic and intermediate composition have been intersected in drill holes and these are believed to be feeder systems for the Tertiary basin fill volcanics. The target mineralization does not crop out and has been delineated by programs of reverse circulation (RC) and diamond core (DD) drill holes. A resource estimate completed by Snowden on behalf of Vista in 2002 was developed from a database of 136 drill holes. The current study includes data from an additional 23 RC holes completed by Vista within and adjacent to the target mineralization. The target trends NNE and occurs as a gently-folded sub-horizontal zone, of dimensions of approximately 8,000 ft along strike and 2,500 ft wide. The zone of mineralization is approximately 200 ft thick and occurs at depths of 500 ft to 600 ft below surface. Snowden’s resource estimate of Maverick Springs was preceded by a site visit from November 11th to 13th 2003 to verify the conduct of the 2002 and 2003 drill programs. Vista’s geological consultant Thomas C. Doe & Associates supervised the drilling and sampling activities. Snowden has relied upon the geological consultant’s reports of sampling conditions, recoveries and sample quality as this aspect of the evaluation could not be assessed from first principles by Snowden.

Vista Gold Corp April 13, 2004 Technical Report, Maverick Springs Doc Ref: 03V315 Report.doc
Snowden Mining Industry Consultants Page 2
The estimate involved statistical and geostatistical analyses of the data, indicator modeling of the mineralization extents to constrain the interpretation and an ordinary kriged interpolation of composited gold and silver assays into a 3D block model. The criteria for mineral resource classification for the 2002 study was reviewed in compliance with CIM definitions and modified for the current study to reflect the improved description of grade continuity, structure and proximity to drill information. Table 1.1 provides a report of the classified resource at Maverick Springs above block cutoff grades for silver equivalence. Equivalent grades were calculated using assumed metal prices determined from averages of the past three years, according to the following values and formula:
• Average gold (Au) price - $US327 per ounce (oz); • Average silver (Ag) price – $US4.77 per oz; and • Silver equivalence (AgEQ) = Ag + Au*68.46.
Complete resource summary tables of different metal cutoff scenarios are located in Appendix H.
CutoffGrade Grade Grade
Classification Mtons AgEQ Ag (oz/ton) Au (oz/ton)Measured - - - -Indicated 69.63 1.8 1.0 0.010
Meas. Plus Ind. 69.63 1.8 1.0 0.010Inferred 85.55 1.5 1.0 0.008
1.0 AgEQ oz/ton
Table 1.1 Maverick Springs Classified Resource Estimate in terms of Silver Equivalence
At a cutoff grade of 1.0 oz silver equivalent/ton, the currently defined Indicated Mineral Resource at Maverick Springs is 69.63 million tons grading 1.0 oz silver/ton and 0.01 oz gold/ton or 1.8 oz silver equivalent/ton. Inferred Resources are estimated at 85.55 million tons grading 1.0 oz silver/ton and 0.008 oz gold/ton, or 1.5 oz silver equivalent/ton above the same silver equivalent cutoff grade.

Vista Gold Corp April 13, 2004 Technical Report, Maverick Springs Doc Ref: 03V315 Report.doc
Snowden Mining Industry Consultants Page 3
2. INTRODUCTION AND TERMS OF REFERENCE Snowden Mining Industry Consultants (Snowden) was asked by Vista Gold Corporation (Vista) to provide an updated resource estimate for the Maverick Springs Project, Nevada. The resource estimation work was undertaken in compliance with CIM Mineral Resource and Mineral Reserve definitions that are referred to in National Instrument (NI) 43-101, Standards of disclosure for Mineral Projects. This Technical Report has been prepared in compliance with the requirements of Form 43-101F. Mr. Neil Burns, P.Geo., an employee of Snowden, served as the Qualified Person responsible for preparing the Technical Report and undertook a site visit in November 2003. The resource estimation work was reviewed by Mr. Andrew Ross, FAusIMM, CPGeo, also an employee of Snowden. In preparing this report, Snowden relied on geological reports and maps, and miscellaneous technical papers listed in the References (Section 20) of this report, public information, and Snowden’s experience in Nevada. A site visit of the Maverick Springs Property was made by Mr. Neil Burns, between November 11th and November 13th, 2003, during which the recent drilling programs were reviewed and many of the new drill collars were substantiated. Photos of the site visit are located in Appendix I. At the time of the site visit, the drilling program had concluded and all samples had been shipped from site to American Assay Laboratories (AAL) for analysis. AAL was asked by Snowden to provide a suit of representative sample rejects for independent confirmation analysis and these were sent to ALS Chemex Laboratories in Vancouver. The assay results are included in this report. Snowden has not reviewed the land tenure situation in detail and has not independently verified the legal status or ownership of the properties or underlying option and/or joint venture agreements. The results and opinions expressed in this report are based on Snowden’s field observations and the technical data supplied by Vista. While Snowden has carefully reviewed all of the information provided by Vista, and believe it is reliable from the limited checks made, Snowden has not conducted an in-depth independent investigation to verify its accuracy and completeness from first principles. Snowden has relied upon the reports of Thomas C. Doe and Associates for descriptions of drill sample protocols, recoveries and quality assurance matters. All measurement units used in the resource estimate are imperial/standard and the currency is expressed in US dollars unless stated otherwise.

Vista Gold Corp April 13, 2004 Technical Report, Maverick Springs Doc Ref: 03V315 Report.doc
Snowden Mining Industry Consultants Page 4
3. DISCLAIMER No disclaimer statement was necessary for the preparation of this report. The author has not relied upon reports, opinions or statements of legal or other experts who are not qualified persons.

Vista Gold Corp April 13, 2004 Technical Report, Maverick Springs Doc Ref: 03V315 Report.doc
Snowden Mining Industry Consultants Page 5
4. PROPERTY DESCRIPTION AND LOCATION With the exception of legal agreements to which the property is subject, material relevant to this section is contained in a previous Technical Report on the Maverick Springs Project, Nevada dated December 2002. Material change in agreements affecting the Maverick Springs Project. In June, 2003, Vista entered into an agreement granting SSRI an option to acquire a 100% interest in the silver resources at Maverick Springs. Vista will retain its 100% interest in the gold resources. Completion of this transaction is subject to regulatory approvals, and negotiation and execution of a definitive agreement. The agreement with SSRI will be subject to the terms of the purchase agreement between Newmont and Vista. Under the agreement, SSRI will pay $1.5 million over four years including a payment of $300,000 upon acceptance of the option agreement for filing with the TSX, which payment was made. The remaining $1.2 million will be used to fund exploration programs, land holding costs and option payments. SSRI and Vista have formed a committee to jointly manage exploration of the Maverick Springs project. Vista is the operator and has a 45% vote on the committee, and SSRI has a 55% vote. After SSRI has completed its $1.5 million in payments, costs will be shared by the two corporations in proportion: Vista - 45% / SSRI - 55%, subject to standard dilution provisions.

Vista Gold Corp April 13, 2004 Technical Report, Maverick Springs Doc Ref: 03V315 Report.doc
Snowden Mining Industry Consultants Page 6
5. ACCESSIBILITY, CLIMATE, LOCAL RESOURCES, INFRASTRUCTURE AND PHYSIOGRAPHY
Material relevant to this section is contained in Snowden’s previous Technical Report on the Maverick Springs Property, Nevada dated December 2002.
Vista Gold Corp April 13, 2004 Technical Report, Maverick Springs Doc Ref: 03V315 Report.doc
Snowden Mining Industry Consultants Page 7
6. HISTORY Material relevant to this section is contained in Snowden’s previous Technical Report on the Maverick Springs Property, Nevada dated December 2002.

Vista Gold Corp April 13, 2004 Technical Report, Maverick Springs Doc Ref: 03V315 Report.doc
Snowden Mining Industry Consultants Page 8
7. GEOLOGICAL SETTING Material relevant to this section is contained in Snowden’s previous Technical Report on the Maverick Springs Property, Nevada dated December 2002.

Vista Gold Corp April 13, 2004 Technical Report, Maverick Springs Doc Ref: 03V315 Report.doc
Snowden Mining Industry Consultants Page 9
8. DEPOSIT TYPE Material relevant to this section is contained in Snowden’s previous Technical Report on the Maverick Springs Property, Nevada dated December 2002.

Vista Gold Corp April 13, 2004 Technical Report, Maverick Springs Doc Ref: 03V315 Report.doc
Snowden Mining Industry Consultants Page 10
9. MINERALIZATION Material relevant to this section is contained in Snowden’s previous Technical Report on the Maverick Springs Property, Nevada dated December 2002.

Vista Gold Corp April 13, 2004 Technical Report, Maverick Springs Doc Ref: 03V315 Report.doc
Snowden Mining Industry Consultants Page 11
10. EXPLORATION Claims at Maverick Springs were first staked in 1986 by Artemis Exploration Company (Artemis). Artemis subsequently leased the property to Angst, Inc. (Angst). From 1987 through to 1992, several exploration programs were conducted by Angst. The work included geological mapping, soil and stream geochemical surveys, and a substantial amount of drilling. A total of 128 drill holes were completed during this period, of which 37 were shallow conventional rotary or percussion holes, 37 were reverse circulation (RC) holes, and 54 were diamond core holes (DDHs). The total drilled was approximately 130,000 ft, from which over 17,500 samples were collected for assaying. In 1996, the property was leased by Harrison Western Mining L.L.C. (Harrison). In 2001, Harrison gave up its lease after conducting a minor amount of exploration including the drilling of 2 holes in 1998. Vista acquired the Maverick Springs Project from Newmont in October 2002. A wide-spaced 7 hole RC drill program was then carried out to test for continuation of the previously identified mineralized zone. In 2003, Vista drilled a further 16 RC holes further testing for the continuation of mineralization. Hole MR03-139 was drilled to the northwest, well beyond defined mineralization, to explore mineralized extents. Much of the data generated from these programs is stored in digital format. Core and assay laboratory rejects are stored in a well organized fashion in several semi-trailers near the property. Table 10.1 summarizes the various drilling campaigns by year, company and method.
Year Company Method Number 1987 Artemis Conventional Rotary 5
1988 Angst Conventional
Hammer 32 RC 1 GEXA RC 2
1989 Angst RC 15 RC/Core 2 Core 2 Water Well 1
1990-91 GEXA RC 4 Angst RC 38 RC/Core 14 Core 18
1998 Harrison RC 2 2002 Vista RC 7 2003 Vista RC 16 Total 159
Table 10.1 Drill Campaign Summary
Vista Gold Corp April 13, 2004 Technical Report, Maverick Springs Doc Ref: 03V315 Report.doc
Snowden Mining Industry Consultants Page 12
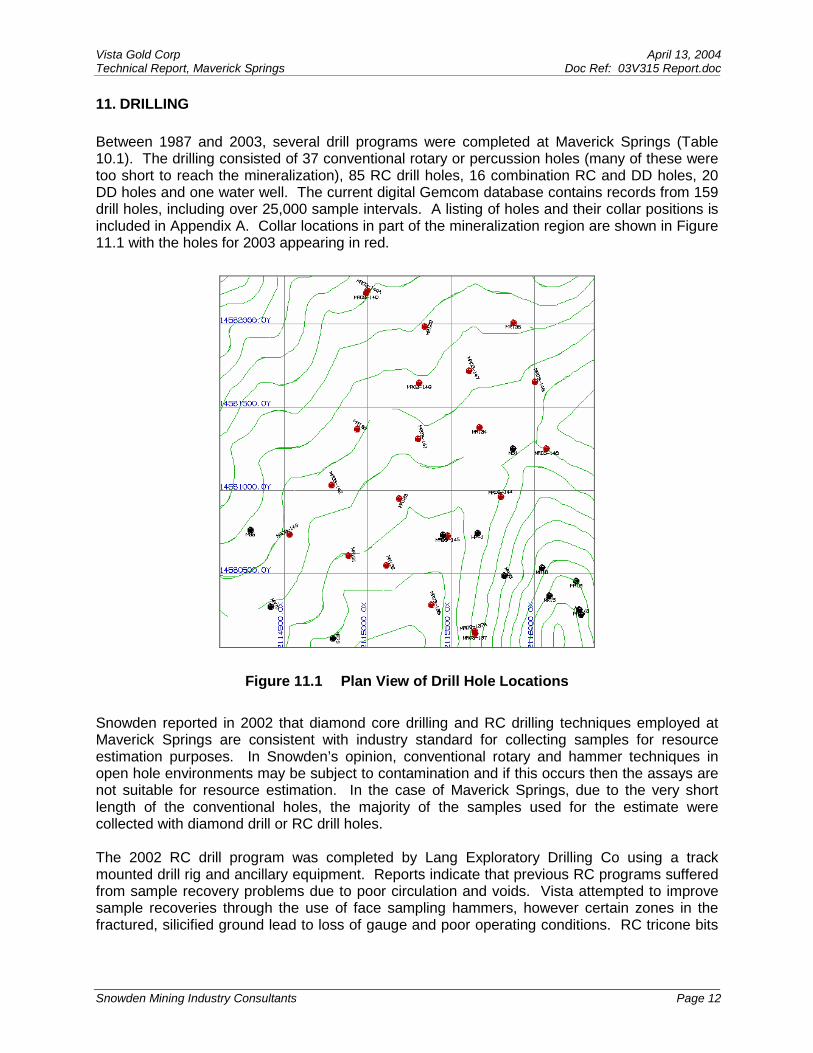
11. DRILLING Between 1987 and 2003, several drill programs were completed at Maverick Springs (Table 10.1). The drilling consisted of 37 conventional rotary or percussion holes (many of these were too short to reach the mineralization), 85 RC drill holes, 16 combination RC and DD holes, 20 DD holes and one water well. The current digital Gemcom database contains records from 159 drill holes, including over 25,000 sample intervals. A listing of holes and their collar positions is included in Appendix A. Collar locations in part of the mineralization region are shown in Figure 11.1 with the holes for 2003 appearing in red.
Figure 11.1 Plan View of Drill Hole Locations
Snowden reported in 2002 that diamond core drilling and RC drilling techniques employed at Maverick Springs are consistent with industry standard for collecting samples for resource estimation purposes. In Snowden’s opinion, conventional rotary and hammer techniques in open hole environments may be subject to contamination and if this occurs then the assays are not suitable for resource estimation. In the case of Maverick Springs, due to the very short length of the conventional holes, the majority of the samples used for the estimate were collected with diamond drill or RC drill holes. The 2002 RC drill program was completed by Lang Exploratory Drilling Co using a track mounted drill rig and ancillary equipment. Reports indicate that previous RC programs suffered from sample recovery problems due to poor circulation and voids. Vista attempted to improve sample recoveries through the use of face sampling hammers, however certain zones in the fractured, silicified ground lead to loss of gauge and poor operating conditions. RC tricone bits

Vista Gold Corp April 13, 2004 Technical Report, Maverick Springs Doc Ref: 03V315 Report.doc
Snowden Mining Industry Consultants Page 13
and standard hammers with a cross-over sub were also used to improve penetration and sample recoveries during 2002. DeLong Construction and Drilling, from Winnemucca, were contracted for the 2003 RC drill program. An MPD1500 drill was used with 3.5” pipe with a 5.125” outside diameter. Some difficulties were encountered during drilling where the abrasive nature of the rock caused wear problems at pipe joints. In some instances cracks in the pipe would cause air leakage and affect return. Hole locations were surveyed with a hand held Magellan Meridian Platinum GPS by Thomas C. Doe & Associates. Snowden expects that collar positions are known with an accuracy of 5 ft with this type of instrument and possibly to a greater accuracy depending on prevailing satellite numbers. Downhole surveying was done using a gyroscope at an average interval of 50 ft. Once completed, hole collars were plugged with cement and labeled with a stamped brass tag. The main mineralized zone is gently folded and sub-horizontal, with approximate dimensions of 8,000 ft (strike), 2,500 ft (width) and 200 ft (thickness). The majority of holes were drilled in a vertical orientation and sampled at intervals of 5 ft.
Vista Gold Corp April 13, 2004 Technical Report, Maverick Springs Doc Ref: 03V315 Report.doc
Snowden Mining Industry Consultants Page 14
12. SAMPLING METHOD AND APPROACH
12.1. Diamond Drilling In 2002 Snowden reported that all of the core drilling was NQ sized and the samples were split on site longitudinally with a manual percussion type splitter. One half was shipped directly by surface transport to Angst Resources’ Goldbar Mine (Goldbar) laboratory in Beatty, Nevada where they were prepared and analyzed for silver and gold. The other half was kept as a permanent record and is currently stored in several semi-trailers on a private ranch approximately 10 miles south of the property.
12.2. Reverse Circulation Drilling Vista engaged Thomas C. Doe and Associates to manage the recent RC resource drilling programs (Doe, 2003 and pers. comm). Snowden understands that the recent RC drill samples were wet samples collected through a cyclone and a 24” rotary wet splitter. Samples were collected on 5 ft intervals directly into 20” x 24” sample bags placed in 5-gallon buckets. A thin polymer mix was prepared for use as a flocculent and added to each bag prior to sample collection. The rotary splitter was set to deliver 25% of the sample stream to the sample port using the “pie” covers. Assuming 100% sample return with the 5.25” bits used during this program, this arrangement resulted in a theoretical sample size of approximately 25 to 30 pounds. Although this is a rather large sample, it was elected not to split it further in the field and risk samples that were too small when circulation and recovery fell off. The larger sample size also provided sufficient material for metallurgical testing. The water injection was regulated to minimize the fluid return while maintaining sufficient flow for drilling and sample return. The collection of larger samples resulted in more frequent sample overflow that was collected in a second bucket. When two buckets were used for a sample, they were set aside, flocculated, decanted, and combined. Sample bags were tied closed, set aside, and allowed to weep prior to transport. The flocculent worked reasonably well in the silicified, oxidized zones. It was ineffective in the Tertiary tuffaceous sediments with high clay content and the unoxidized, unaltered siltstones. Since these units are essentially unmineralized, the loss of fines was not considered significant. Sample recovery was again less than ideal due to problems with maintaining circulation but in line with past RC drilling. No detailed record of sample weights was kept however, the estimated weight of samples after they had field dried was reported to be approximately 20 lbs. Thomas C. Doe and Associates provided Snowden with a comparison of assay population characteristics for gold and silver grades for the various drilling programs. The cumulative frequency figures indicated the 2003 RC program results are consistent with the diamond drill programs for both gold and silver. However, the results for the 2002 RC program are biased slightly low for both gold and silver compared with the diamond drill results and 2003 RC program. Snowden believes it is acceptable to include the results for the 2002 RC program as they have not contributed to high grading of the samples due to poor recoveries and they represent only a minor component of the data.

Vista Gold Corp April 13, 2004 Technical Report, Maverick Springs Doc Ref: 03V315 Report.doc
Snowden Mining Industry Consultants Page 15
Snowden is satisfied that, as described by Vista’s geological consultant, the 2003 RC samples were collected in line with standard industry practices.

Vista Gold Corp April 13, 2004 Technical Report, Maverick Springs Doc Ref: 03V315 Report.doc
Snowden Mining Industry Consultants Page 16
13. SAMPLE PREPARATION, ANALYSES AND SECURITY At the Goldbar laboratory, all of the drill samples were subjected to a 1 assay ton (AT) fire assay with an atomic absorption finish (FA/AA) to determine the silver and gold content. Some samples were also tested with a cyanide soluble leach with an atomic absorption finish (CS/AA). Only the FA/AA results have been used for this resource estimate. All assaying for the 2002 and 2003 drill programs was done at AAL in Sparks, NV. Drill samples were lined up in the field where, after drying out, they were transported to AAL’s laboratory in Sparks, NV. AAL’s sub-sampling protocols were as follows:
• Samples were dried at 105°C; • Samples were reduced in a jaw crusher to >85% passing 6 mesh; • Samples were then split with a Jones riffle splitter; • Samples of >300 g were pulverized with a vertical spindle pulverizer to >85% passing
150 mesh; and • Grab samples were then taken for analysis.
Routine analyses at AAL included 1 assay ton fire with an AA finish for gold and 0.4-gram aqua regia leach with AA finish for silver. Any silver value of 100 parts per million (ppm) or greater was re-run by 1 assay ton fire with a gravimetric finish. Results were reported in ppm with detection limits of 0.005 ppm for gold and 0.05 ppm for silver. AAL advised Snowden that is has been in operation since the 1980’s and that it participates in CANMET and local round-robin assay surveys.

Vista Gold Corp April 13, 2004 Technical Report, Maverick Springs Doc Ref: 03V315 Report.doc
Snowden Mining Industry Consultants Page 17
14. DATA VERIFICATION Snowden reviewed the quality control (QC) protocols, undertook the collection of check samples during site visits, and reviewed selected assay certificates and compared these with the digital database entries.
14.1. Quality Control
14.1.1. Routine Standard, Blank and Duplicate Submittals
One of the recommendations of Snowden’s first site visit was the implementation of QC measures involving the insertion of blanks, standards and duplicate samples prior to the analytical laboratory. Subsequently Vista’s 2002 and 2003 drilling programs at Maverick Springs included QC measures. AAL in Sparks, NV was the analytical laboratory used for both the 2002 and 2003 drill programs. QC measures included duplicate assays which were included within the original runs, repeat assays run separately and AAL’s internal standards and blanks. To further monitor QC, Vista included commercially prepared non-certified standards and blanks within the sample submissions. Appendix B contains plots of Vista’s standards analysis results.
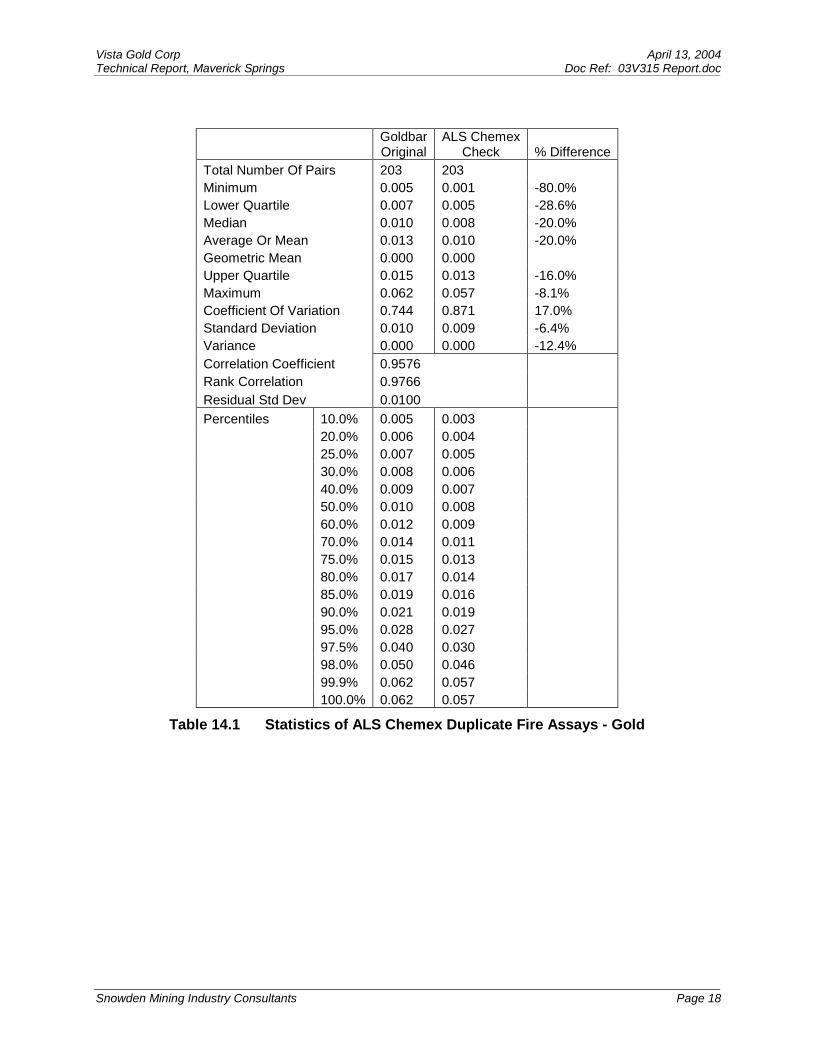
14.1.2. Duplicate Sample Analyses at Independent Commercial Laboratories Several batches of duplicate samples were submitted to different laboratories for check analyses over the past three years. Newmont summarized the results for most of the check assaying in a memo dated December 3, 2001 (Harris, 2001). Newmont reported a total of 1975 checks on “mine-generated” pulps at the Goldbar laboratory and 1174 check assays, also on “mine-generated” pulps at three independent laboratories: ALS Chemex, Bondar-Clegg and Legend. The results clearly indicated that the original analyses for both gold and silver were consistently higher than the check assays at the independent laboratories. Newmont found that the average difference between the original and independent gold fire assays was 19.4%. Similarly, the average difference between the original and independent silver fire assays was 15.8%. To verify Newmont’s results, Snowden compared the original assay data for both silver and gold with the independent results from ALS Chemex. The ALS Chemex check assay data was chosen for comparison because it contains the largest number of duplicate sample pairs. Table 14.1 and Table 14.2 summarize the comparison statistics for gold and silver, respectively.
Vista Gold Corp April 13, 2004 Technical Report, Maverick Springs Doc Ref: 03V315 Report.doc
Snowden Mining Industry Consultants Page 18
Goldbar Original
ALS Chemex Check % Difference
Total Number Of Pairs 203 203 Minimum 0.005 0.001 -80.0% Lower Quartile 0.007 0.005 -28.6% Median 0.010 0.008 -20.0% Average Or Mean 0.013 0.010 -20.0% Geometric Mean 0.000 0.000 Upper Quartile 0.015 0.013 -16.0% Maximum 0.062 0.057 -8.1% Coefficient Of Variation 0.744 0.871 17.0% Standard Deviation 0.010 0.009 -6.4% Variance 0.000 0.000 -12.4% Correlation Coefficient 0.9576 Rank Correlation 0.9766 Residual Std Dev 0.0100 Percentiles 10.0% 0.005 0.003 20.0% 0.006 0.004 25.0% 0.007 0.005 30.0% 0.008 0.006 40.0% 0.009 0.007 50.0% 0.010 0.008 60.0% 0.012 0.009 70.0% 0.014 0.011 75.0% 0.015 0.013 80.0% 0.017 0.014 85.0% 0.019 0.016 90.0% 0.021 0.019 95.0% 0.028 0.027 97.5% 0.040 0.030 98.0% 0.050 0.046 99.9% 0.062 0.057 100.0% 0.062 0.057
Table 14.1 Statistics of ALS Chemex Duplicate Fire Assays - Gold

Vista Gold Corp April 13, 2004 Technical Report, Maverick Springs Doc Ref: 03V315 Report.doc
Snowden Mining Industry Consultants Page 19
Goldbar Original
ALS Chemex Check % Difference
Total Number Of Pairs 231 231 Minimum 0.091 0.010 -89.0% Lower Quartile 0.205 0.150 -26.8% Median 0.470 0.300 -36.2% Average Or Mean 1.322 0.983 -25.6% Geometric Mean 0.520 0.339 -34.7% Upper Quartile 1.110 0.835 -24.8% Maximum 33.010 31.200 -5.5% Coefficient Of Variation 2.707 3.066 13.3% Standard Deviation 3.579 3.015 -15.8% Variance 12.808 9.089 -29.0% Correlation Coefficient 0.9422 Rank Correlation 0.8646 Residual Std Dev 2.1813 Percentiles 10.0% 0.14 0.07 20.0% 0.18 0.12 25.0% 0.21 0.15 30.0% 0.23 0.18 40.0% 0.31 0.23 50.0% 0.47 0.30 60.0% 0.64 0.44 70.0% 0.97 0.67 75.0% 1.11 0.84 80.0% 1.30 0.95 85.0% 1.64 1.14 90.0% 2.17 1.64 95.0% 4.67 3.71 97.5% 6.38 5.37 98.0% 8.94 6.36 99.9% 32.67 30.88 100.0% 33.01 31.20
Table 14.2 Statistics of ALS Chemex Duplicate Fire Assays - Silver To further analyze the relationship between the original analyses and the ALS Chemex check samples, scatter plots comparing the original Goldbar assays with the ALS Chemex check assays were generated for both gold and silver. These are displayed along with the regression equations that define the relationships in Figure 14.1 and Figure 14.2.

Vista Gold Corp April 13, 2004 Technical Report, Maverick Springs Doc Ref: 03V315 Report.doc
Snowden Mining Industry Consultants Page 20
Normal ScatterplotMaverick Springs
Original vs Lab Check
y = 0.8961x - 0.0012
0
0.01
0.02
0.03
0.04
0.05
0.06
0.07
0.08
0 0.01 0.02 0.03 0.04 0.05 0.06 0.07 0.08
Gold Bar (oz/ton)
Che
mex
Che
ck (o
z/to
n)
Correlation Coefficient = 0.959
Figure 14.1 Original Goldbar Fire Assays vs. ALS Chemex Duplicate Fire Assays - Gold

Vista Gold Corp April 13, 2004 Technical Report, Maverick Springs Doc Ref: 03V315 Report.doc
Snowden Mining Industry Consultants Page 21
Normal ScatterplotMaverick Springs Ag
Gold Bar Original vs Chemex Check
y = 0.7937x - 0.066
0
2
4
6
8
10
12
14
16
18
20
0 2 4 6 8 10 12 14 16 18 20
Gold Bar (oz/ton)
Che
mex
Che
ck (o
z/to
n)
Correlation Coefficient = 0.946
Figure 14.2 Original Goldbar Fire Assays vs. ALS Chemex Duplicate Fire Assays - Silver
14.1.3. 2003 Vista Analytical Checks As part of Vista’s 2003 QC program, a suite of 217 samples (pulps and reject material) were sent to ALS Chemex in Vancouver for check analysis. Appendix C contains plots of the AAL and ALS Chemex results prepared by Thomas C. Doe and Associates. It was concluded that the plots show good correlation between the two sets of data, confirming that AAL’s analyses are acceptable.
Vista Gold Corp April 13, 2004 Technical Report, Maverick Springs Doc Ref: 03V315 Report.doc
Snowden Mining Industry Consultants Page 22
14.2. Independent Sampling
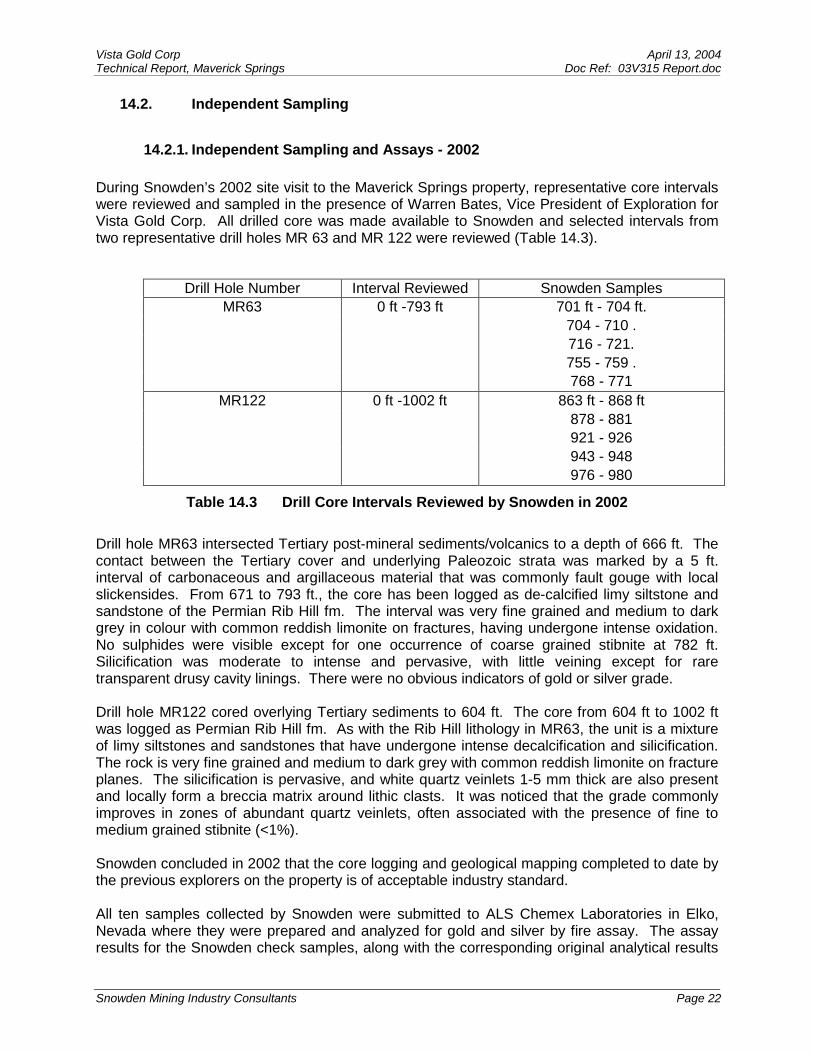
14.2.1. Independent Sampling and Assays - 2002 During Snowden’s 2002 site visit to the Maverick Springs property, representative core intervals were reviewed and sampled in the presence of Warren Bates, Vice President of Exploration for Vista Gold Corp. All drilled core was made available to Snowden and selected intervals from two representative drill holes MR 63 and MR 122 were reviewed (Table 14.3).
Drill Hole Number Interval Reviewed Snowden Samples MR63 0 ft -793 ft 701 ft - 704 ft.
704 - 710 . 716 - 721. 755 - 759 . 768 - 771
MR122 0 ft -1002 ft 863 ft - 868 ft 878 - 881 921 - 926 943 - 948 976 - 980
Table 14.3 Drill Core Intervals Reviewed by Snowden in 2002 Drill hole MR63 intersected Tertiary post-mineral sediments/volcanics to a depth of 666 ft. The contact between the Tertiary cover and underlying Paleozoic strata was marked by a 5 ft. interval of carbonaceous and argillaceous material that was commonly fault gouge with local slickensides. From 671 to 793 ft., the core has been logged as de-calcified limy siltstone and sandstone of the Permian Rib Hill fm. The interval was very fine grained and medium to dark grey in colour with common reddish limonite on fractures, having undergone intense oxidation. No sulphides were visible except for one occurrence of coarse grained stibnite at 782 ft. Silicification was moderate to intense and pervasive, with little veining except for rare transparent drusy cavity linings. There were no obvious indicators of gold or silver grade. Drill hole MR122 cored overlying Tertiary sediments to 604 ft. The core from 604 ft to 1002 ft was logged as Permian Rib Hill fm. As with the Rib Hill lithology in MR63, the unit is a mixture of limy siltstones and sandstones that have undergone intense decalcification and silicification. The rock is very fine grained and medium to dark grey with common reddish limonite on fracture planes. The silicification is pervasive, and white quartz veinlets 1-5 mm thick are also present and locally form a breccia matrix around lithic clasts. It was noticed that the grade commonly improves in zones of abundant quartz veinlets, often associated with the presence of fine to medium grained stibnite (<1%). Snowden concluded in 2002 that the core logging and geological mapping completed to date by the previous explorers on the property is of acceptable industry standard. All ten samples collected by Snowden were submitted to ALS Chemex Laboratories in Elko, Nevada where they were prepared and analyzed for gold and silver by fire assay. The assay results for the Snowden check samples, along with the corresponding original analytical results

Vista Gold Corp April 13, 2004 Technical Report, Maverick Springs Doc Ref: 03V315 Report.doc
Snowden Mining Industry Consultants Page 23
are provided in Appendix D. Snowden found that the check assays correlate well with the original assays.
14.2.2. Independent Sampling and Assays - 2003 Due to the timing of Snowden’s 2003 site visit, RC samples had been removed and processed and thus were not available for sampling directly from the drill rig. Following the site visit, Snowden identified certain intervals from the assay certificates and requested AAL to provide the surplus material. Ten sample intervals were chosen according to high, low and average concentrations of gold and silver. These sample intervals and hole numbers are shown in Table 14.4. AAL shipped them to ALS Chemex Laboratories in Vancouver for confirmatory assay. The original AAL results and ALS Chemex check assays are provided in Appendix E. Scatter plots displayed in Figure 14.3 and Figure 14.4 show the correlation between the two sets of assay data.
Drill Hole Number Snowden SamplesMR-130 695 ft - 700 ft
700-705705-710
MR-131 710-715MR03-140A 845-850
850-855855-860
MR03-142 760-765765-770
MR03-144 435-440 Table 14.4 RC Drilling Intervals Selected by Snowden in 2003
With the exception of one of the silver data (MR130 695-700), the original and check assays are in general close agreement.

Vista Gold Corp April 13, 2004 Technical Report, Maverick Springs Doc Ref: 03V315 Report.doc
Snowden Mining Industry Consultants Page 24
Normal ScatterplotMaverick Springs
Am Assay Orig vs Chemex Check
y = 0.8695x + 0.321
0
10
20
30
40
50
60
70
80
90
0 10 20 30 40 50 60 70 80 90
Am Assay ( Au Moz/ton)
Che
mex
Che
ck (A
u M
oz/to
n)
Figure 14.3 Original AAL Assay Results vs. ALS Chemex Check Assays - Gold
Normal ScatterplotMaverick Springs
Am Assay Orig vs Chemex Check
y = 0.5173x + 0.7834
0
5
10
15
20
25
30
0 5 10 15 20 25 30
Am Assay ( Ag oz/ton)
Che
mex
Che
ck (A
g oz
/ton)
Figure 14.4 Original AAL Assay Results vs. ALS Chemex Check Assays - Silver
Vista Gold Corp April 13, 2004 Technical Report, Maverick Springs Doc Ref: 03V315 Report.doc
Snowden Mining Industry Consultants Page 25
14.3. Assay Certificate Review As part of the 2002 report, Snowden checked Goldbar assay certificates for holes MR65 and MR124 against the drill hole logs and Gemcom table records. The data was found to have been transferred accurately apart from a transcription error noted on one of the drill logs. This was rectified. Vista provided Snowden with the original AAL certificates for the 2002 and 2003 drilling programs. These certificates were checked against the digital assay data. Snowden noted that assay results for gold and silver were reported by AAL in parts per million (ppm). These were subsequently converted to ounces per short ton by Vista using a conversion factor of 0.029167. For samples that were assayed a second time, the mean of the two samples was used. Snowden’s review of the assay certificates found that the transfer to the digital database was performed accurately and that manipulations to the database were performed without error.

Vista Gold Corp April 13, 2004 Technical Report, Maverick Springs Doc Ref: 03V315 Report.doc
Snowden Mining Industry Consultants Page 26
15. ADJACENT PROPERTIES Information from adjacent properties is not included in the Technical Report on the Maverick Springs Property, Nevada.

Vista Gold Corp April 13, 2004 Technical Report, Maverick Springs Doc Ref: 03V315 Report.doc
Snowden Mining Industry Consultants Page 27
16. MINERAL PROCESSING AND METALLURGICAL TESTING In 2002, Snowden reported that, based on the information supplied by Vista, it is Snowden’s understanding that the only metallurgical tests conducted on Maverick Springs mineralization were completed by Newmont in 2002. The testwork involved coarse bottle roll tests to determine the amenability of the gold and silver to cyanide leaching. A total of fifteen composite samples were tested and the recoveries ranged between 28 and 65% for gold and 5-52% for silver. The mean recoveries were 43% for gold and 25% for silver. Newmont concluded that the mineralization at Maverick Springs “…does not appear to be a good candidate for a low-cost heap leach process as the recovery is low and particle size dependent.”(Arthur, 2002). However, it was noted that the mineralization was not particularly refractory and would probably be leachable if the particle size could be reduced. SSRI recently sent a suite of samples from the 2003 drill campaign to Process Research Associates Ltd. (PRA) in Vancouver, for metallurgical testing of combined cyanidation and milling scenarios. The first round of results from PRA show that cyanide leaching at a feed size of 80% passing 75 µm, with 3 g/t sodium cyanide (NaCN), for 72 hours retention time, recovers 63.3% to 97.5% of silver. NaCN consumption ranged from 1.84 to 5.07 g/t. Testing with finer grinds indicated an improvement in silver extraction by 34.8% to 46.5% when the particle size was reduced to 80% passing 51 µm. Test results did not indicate a correlation between gold and silver extraction. Gold extraction ranged from 35.7% to 91.1% and was commonly in the range of 80% to 90%. Preliminary tests indicate that the samples are less amenable to flotation separation (PRA, 2004). Further testing is currently being done at the PRA laboratory.

Vista Gold Corp April 13, 2004 Technical Report, Maverick Springs Doc Ref: 03V315 Report.doc
Snowden Mining Industry Consultants Page 28
17. MINERAL RESOURCE AND MINERAL RESERVE ESTIMATES
17.1. Available Data Vista provided Snowden with located assay and lithological data from the 23 new RC holes in the form of Excel spreadsheets. Snowden imported collar location, assay, lithological and survey data directly from these spreadsheets into the Gemcom database used in the previous resource estimate reported in 2002. Lithology rock codes were standardized and updated within the database for consistency between drill campaigns. Other data previously provided to Snowden by Vista included a topographic surface, originally provided by Newmont, and wireframes of interpreted faults.
17.2. Conversion to Milli-Ounce Snowden elected to convert grades from ounce per ton (opt) to milli-ounce per ton (moz) for the purposes of statistics and grade estimation. This conversion prevented rounding errors during computation. The final resource estimates are reported as opt.
17.3. Compositing and Bias Adjustment Approximately 90% of the 25,755 sample intervals within the database are 5 ft; 10% are less than 5 ft and 5% are longer than 5 ft. The distribution of sample lengths is displayed in Figure 17.1.
Log Probability Plot for Sample LengthDomain ***
Sample Length (Feet)
Cumulative P
robability (%)
0.1 1 10 1000.010.020.05
0.10.20.5
125
10
20304050607080
90959899
99.899.9
99.99GL
Points:Weights:
Mean:Std Dev:Variance:
CV:Skewness:
Geom Mean:Log-Est Mean:
Maximum:75%:50%:25%:
Minimum:
25755257554.8751.2551.5740.25731.3924.7454.922
1055550.1
Figure 17.1 Probability Plot of Sample Lengths

Vista Gold Corp April 13, 2004 Technical Report, Maverick Springs Doc Ref: 03V315 Report.doc
Snowden Mining Industry Consultants Page 29
Gold and silver assay data were composited by Snowden to 5 ft lengths commencing at the drill hole collars. To compensate for the apparent high bias in the original assay data collected at the Goldbar laboratory, the pre-2002 composites were factored according to the following regression equations, as discussed in 14.1.2.
• Gold: Aunew = 0.896Auorig -0.001
• Silver: Agnew = 0.794Agorig -0.066.
17.4. Geological Interpretation The Snowden 2003 interpretation constrains the estimate to the favourable Permian calcareous strata beneath the post-mineral Tertiary cover and above a unit of poorly mineralized Paleozoic limestones. The interpretation also incorporates faulting (considered to be post-mineral) that juxtaposes barren sediments against mineralization. The general trend of mineralization and major faulting is approximately N20°E. The new drilling information has allowed the interpretation of a broad anticlinal structure that defines the mineralized zone (Figure 17.2). The hinge of this anticline trends along an approximate azimuth of 310° and occurs around 14 581 260N.
Figure 17.2 Isometric View of Anticlinal Form of Mineralization
Low grade gold intercepts also occur above the interpreted folded mineralized zone. This low grade mineralization occurs within a siltier, less silicified unit. Gold values within this zone are generally accompanied by very low silver grades. The low grade zone appears to surround the central fault suggesting its presence during mineralization (Figure 17.3). The faults had generally been considered to post-date mineralization. However, the bracketing shape of the low grade zone suggests that the faults may have acted as feeders to mineralization, with later post-mineral displacement.

Vista Gold Corp April 13, 2004 Technical Report, Maverick Springs Doc Ref: 03V315 Report.doc
Snowden Mining Industry Consultants Page 30
Figure 17.3 Schematic Cross-Section
Geo-assay zones were created separately to identify the main body of mineralization and the overlying low grade region. The two zones were then divided on either side of the interpreted anticlinal hinge, to produce 4 domains (Northern and Southern Low Grade Zones; Northern and Southern Main Zones). Composites were then coded by the 4 domains for statistical and geostatistical analysis. Blocks were selected to constrain the region of estimation within the geo-assay zones. The selection of constrained blocks was made by the following steps:
• The composites for gold and silver were calculated to represent gold equivalence according to the formula AuEQ = Au + Ag/68.46;
• Indicator kriging was used to estimate the block proportion above a value of 10 moz. A 10 moz AuEQ indicator was chosen as an effective discriminator of higher grade mineralization. This value corresponds to an inflection point on the log probability plot of AuEQ composites (Figure 17.4);
• Blocks were selected where the block proportion exceeded 50%. Figure 17.5 is a typical cross-section showing 10 moz AuEQ mineralized block locations inside of the interpreted main and low grade zones.

Vista Gold Corp April 13, 2004 Technical Report, Maverick Springs Doc Ref: 03V315 Report.doc
Snowden Mining Industry Consultants Page 31
Figure 17.4 Log Probability Plot of AuEQ Composites
Figure 17.5 Typical Cross-Section Showing the Distribution of +10moz AuEQ Blocks
topography
Main zone
Low grade zone
+10moz Aueq blocks

Vista Gold Corp April 13, 2004 Technical Report, Maverick Springs Doc Ref: 03V315 Report.doc
Snowden Mining Industry Consultants Page 32
17.5. Statistical Analysis 17.5.1. Gold Composites
Grades range from extremely low values to 0.1587 oz/ton in the zones (Figure 17.6 to Figure 17.9). Average gold grades range from 0.0027 oz/ton, in the Southern Low Grade Zone, to 0.0105 oz/ton in the Southern Main Zone. The distributions are positively skewed, without a large number of high grade outliers, but show evidence of mixed populations. The lack of high grade outliers is reflected in the relatively low coefficients of variation (COVs), particularly in the main mineralized zone. These range from a low of 0.89 in the Northern Low Grade Zone, to a high of 1.53 in the Southern Low Grade Zone.
Log Histogram for AuDomain ***
Au (MOZ/ton)
Frequency (% of 3223 points)
0.1 1 10 1000
2
4
6
8
10
12
14
G L25 50 75
Points:Weights:
Mean:Std Dev:Variance:
CV:Skewness:
Geom Mean:Log-Est Mean:
Maximum:75%:50%:25%:
Minimum:
3223322310.47611.398129.9171.0884.5067.15410.805
158.712.57.84.20.1
Log Probability Plot for AuDomain ***
Au (MOZ/ton)
Cumulative P
robability (%)
0.1 1 10 1000.010.020.05
0.10.20.5
125
10
20304050607080
90959899
99.899.9
99.99G L
Points:Weights:
Mean:Std Dev:Variance:
CV:Skewness:
Geom Mean:Log-Est Mean:
Maximum:75%:50%:25%:
Minimum:
3223322310.47611.398129.9171.0884.5067.15410.805
158.712.57.84.20.1
Figure 17.6 Log Histogram and Log Probability Plot - Gold, Southern Main Zone
Log Histogram for Au
Domain ***
Au (MOZ/ton)
Frequency (% of 165 points)
1 100
2
4
6
8
10
12
14
16
18
G L25 50 75
Points:Weights:
Mean:Std Dev:Variance:
CV:Skewness:
Geom Mean:Log-Est Mean:
Maximum:75%:50%:25%:
Minimum:
16516510.4259.09482.6960.8722.2527.91410.231
52.613.16.94.20.7
Log Probability Plot for AuDomain ***
Au (MOZ/ton)
Cumulative P
robability (%)
1 100.010.020.05
0.10.20.5
125
10
20304050607080
90959899
99.899.9
99.99G L
Points:Weights:
Mean:Std Dev:Variance:
CV:Skewness:
Geom Mean:Log-Est Mean:
Maximum:75%:50%:25%:
Minimum:
16516510.4259.09482.6960.8722.2527.91410.231
52.613.16.94.20.7
Figure 17.7 Log Histogram and Log Probability Plot - Gold, Northern Main Zone

Vista Gold Corp April 13, 2004 Technical Report, Maverick Springs Doc Ref: 03V315 Report.doc
Snowden Mining Industry Consultants Page 33
Log Histogram for AuDomain ***
Au (MOZ/ton)
Frequency (%
of 775 points)
0.1 1 100.00
0.75
1.50
2.25
3.00
3.75
4.50
5.25
6.00
6.75
7.50
8.25
9.00
9.75G L25 50 75
Points:Weights:
Mean:Std Dev:Variance:
CV:Skewness:
Geom Mean:Log-Est Mean:
Maximum:75%:50%:25%:
Minimum:
7757752.8644.39119.2851.5337.2001.5742.927
663.51.70.70.1
Log Probability Plot for AuDomain ***
Au (MOZ/ton)
Cumulative P
robability (%)
0.1 1 100.010.020.05
0.10.20.5
125
10
20304050607080
90959899
99.899.9
99.99G L
Points:Weights:
Mean:Std Dev:Variance:
CV:Skewness:
Geom Mean:Log-Est Mean:
Maximum:75%:50%:25%:
Minimum:
7757752.8644.39119.2851.5337.2001.5742.927
663.51.70.70.1
Figure 17.8 Log Histogram and Log Probability Plot - Gold, Southern Low Grade Zone
Log Histogram for AuDomain ***
Au (MOZ/ton)
Frequency (% of 22 points)
1 100
2
4
6
8
10
12
14
16
18
20
22
G L25 50 75
Points:Weights:
Mean:Std Dev:Variance:
CV:Skewness:
Geom Mean:Log-Est Mean:
Maximum:75%:50%:25%:
Minimum:
22223.5272.8087.8850.7962.0962.7583.547
13.14.22.31.80.8
Log Probability Plot for AuDomain ***
Au (MOZ/ton)
Cum
ulative Probability (%
)
1 100.010.020.05
0.10.20.5
125
10
20304050607080
90959899
99.899.9
99.99G L
Points:Weights:
Mean:Std Dev:Variance:
CV:Skewness:
Geom Mean:Log-Est Mean:
Maximum:75%:50%:25%:
Minimum:
22223.5272.8087.8850.7962.0962.7583.547
13.14.22.31.80.8
Figure 17.9 Log Histogram and Log Probability Plot - Gold, Northern Low Grade Zone
17.5.2. Silver Composites Silver composites at Maverick Springs are characterized by a broad range of grades, from extremely low to 36.4 oz/ton (Figure 17.10 to Figure 17.13). Silver distributions are positive skew, but with a greater number of high grade outliers than gold. As a result, COVs for silver are significantly higher than gold with a low of 0.92 in the Northern Low Grade Zone (very little data) to a high of 3.12 in the Southern Low Grade Zone. In order to reduce the impact of high grade outliers on the resource estimate, silver composites were capped prior to running of the kriged estimates. A grade cap of 9.77 Ag oz/ton was

Vista Gold Corp April 13, 2004 Technical Report, Maverick Springs Doc Ref: 03V315 Report.doc
Snowden Mining Industry Consultants Page 34
chosen. This value was established by comparing the average grades of the capped population with the Sichel estimate of mean grade derived for the uncapped population.
Log Histogram for AgDomain ***
Ag (MOZ/ton)
Frequency (% of 3526 points)
10 100 1000 100000.00
0.75
1.50
2.25
3.00
3.75
4.50
5.25
6.00
6.75
7.50
8.25
9.00
G L25 50 75
Points:Weights:
Mean:Std Dev:Variance:
CV:Skewness:
Geom Mean:Log-Est Mean:
Maximum:75%:50%:25%:
Minimum:
35263526927.4862232.8644985680.2312.4077.131313.541884.315
364367912991173
Log Probability Plot for AgDomain ***
Ag (MOZ/ton)
Cumulative P
robability (%)
10 100 1000 100000.010.020.05
0.10.20.5
125
10
20304050607080
90959899
99.899.9
99.99G L
Points:Weights:
Mean:Std Dev:Variance:
CV:Skewness:
Geom Mean:Log-Est Mean:
Maximum:75%:50%:25%:
Minimum:
35263526927.4862232.8644985680.2312.4077.131313.541884.315
364367912991173
Figure 17.10 Log Histogram and Log Probability Plot - Silver, Southern Main Zone
Log Histogram for AgDomain ***
Ag (MOZ/ton)
Frequency (% of 304 points)
10 100 1000 100000
1
2
3
4
5
6
7
8
9
10
11
12
G L25 50 75
Points:Weights:
Mean:Std Dev:Variance:
CV:Skewness:
Geom Mean:Log-Est Mean:
Maximum:75%:50%:25%:
Minimum:
3043041335.2432799.8557839188.6732.0974.274429.3121397.142
1949911724501645
Log Probability Plot for AgDomain ***
Ag (MOZ/ton)
Cumulative P
robability (%)
10 100 1000 100000.010.020.05
0.10.20.5
125
10
20304050607080
90959899
99.899.9
99.99G L
Points:Weights:
Mean:Std Dev:Variance:
CV:Skewness:
Geom Mean:Log-Est Mean:
Maximum:75%:50%:25%:
Minimum:
3043041335.2432799.8557839188.6732.0974.274429.3121397.142
1949911724501645
Figure 17.11 Log Histogram and Log Probability Plot - Silver, Northern Main Zone

Vista Gold Corp April 13, 2004 Technical Report, Maverick Springs Doc Ref: 03V315 Report.doc
Snowden Mining Industry Consultants Page 35
Log Histogram for AgDomain ***
Ag (MOZ/ton)
Frequency (% of 705 points)
10 100 10000.0
2.5
5.0
7.5
10.0
12.5
G L25 50 75
Points:Weights:
Mean:Std Dev:Variance:
CV:Skewness:
Geom Mean:Log-Est Mean:
Maximum:75%:50%:25%:
Minimum:
705705121.626379.166143766.8573.1178.99346.11792.471
52509041203
Log Probability Plot for AgDomain ***
Ag (MOZ/ton)
Cumulative Probability (%
)
10 100 10000.010.020.05
0.10.20.5
125
10
20304050607080
90959899
99.899.9
99.99G L
Points:Weights:
Mean:Std Dev:Variance:
CV:Skewness:
Geom Mean:Log-Est Mean:
Maximum:75%:50%:25%:
Minimum:
705705121.626379.166143766.8573.1178.99346.11792.471
52509041203
Figure 17.12 Log Histogram and Log Probability Plot - Silver, Southern Low Grade Zone
Log Histogram for AgDomain ***
Ag (MOZ/ton)
Frequency (% of 27 points)
1000
2
4
6
8
10
12
14
16
18
20
G L25 50 75
Points:Weights:
Mean:Std Dev:Variance:
CV:Skewness:
Geom Mean:Log-Est Mean:
Maximum:75%:50%:25%:
Minimum:
2727119.667109.98412096.3850.9191.69884.487121.181
418134855320
Log Probability Plot for AgDomain ***
Ag (MOZ/ton)
Cumulative Probability (%
)
1000.010.020.05
0.10.20.5
125
10
20304050607080
90959899
99.899.9
99.99G L
Points:Weights:
Mean:Std Dev:Variance:
CV:Skewness:
Geom Mean:Log-Est Mean:
Maximum:75%:50%:25%:
Minimum:
2727119.667109.98412096.3850.9191.69884.487121.181
418134855320
Figure 17.13 Log Histogram and Log Probability Plot - Silver, Northern Low Grade Zone 17.6. Geostatistical Analysis
Snowden’s Supervisor software was used to evaluate the continuity of gold and silver mineralization. Only the Southern Main Zone contains sufficient data for reliable analysis. The parameters derived from this zone were therefore applied to the other zones after taking the gently folded structure of the mineralization into account. The study aimed to describe continuity in three dimensional space by obtaining variogram fans as follows: (1) a horizontal fan used to define the strike direction, (2) an across-strike vertical fan

Vista Gold Corp April 13, 2004 Technical Report, Maverick Springs Doc Ref: 03V315 Report.doc
Snowden Mining Industry Consultants Page 36
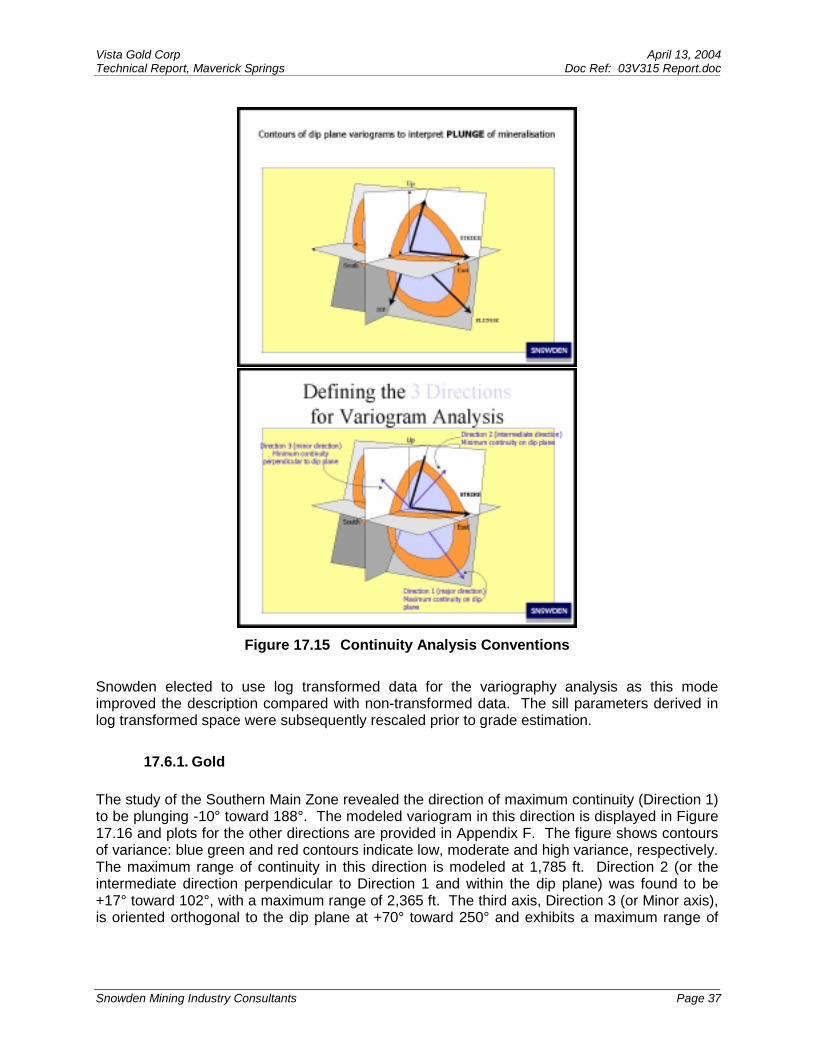
used to define the dip angle and (3) a dip-plane fan to determine the plunge direction within the dip plane. The dip-plane fan was used to determine the direction of maximum continuity (whether along strike, down dip, or plunging toward another direction) (Figure 17.14 and Figure 17.15).
Figure 17.14 Continuity Analysis Conventions
Vista Gold Corp April 13, 2004 Technical Report, Maverick Springs Doc Ref: 03V315 Report.doc
Snowden Mining Industry Consultants Page 37
Figure 17.15 Continuity Analysis Conventions
Snowden elected to use log transformed data for the variography analysis as this mode improved the description compared with non-transformed data. The sill parameters derived in log transformed space were subsequently rescaled prior to grade estimation.
17.6.1. Gold The study of the Southern Main Zone revealed the direction of maximum continuity (Direction 1) to be plunging -10° toward 188°. The modeled variogram in this direction is displayed in Figure 17.16 and plots for the other directions are provided in Appendix F. The figure shows contours of variance: blue green and red contours indicate low, moderate and high variance, respectively. The maximum range of continuity in this direction is modeled at 1,785 ft. Direction 2 (or the intermediate direction perpendicular to Direction 1 and within the dip plane) was found to be +17° toward 102°, with a maximum range of 2,365 ft. The third axis, Direction 3 (or Minor axis), is oriented orthogonal to the dip plane at +70° toward 250° and exhibits a maximum range of

Vista Gold Corp April 13, 2004 Technical Report, Maverick Springs Doc Ref: 03V315 Report.doc
Snowden Mining Industry Consultants Page 38
615 ft. The Maximum: Intermediate anisotropy ratio is therefore 0.75, and the Maximum: Minor anisotropy ratio is 2.9.
(Direction 1) -10-->188: Log Continuity for AuDomain 2
Sample Separation (m)
Gamm
a (0.831)
Pair Counts
0 250 500 750 1000 1250 1500 1750 2000 2250 25000.00
0.25
0.50
0.75
1.00
1.25
0
5000
10000
15000
20000
25000
30000
35000
40000
45000
50000
N( 0.15 )
Sph( 0.26, 710 )Sph( 0.05, 1610 )
Sph( 0.54, 1785 )
Figure 17.16 Direction 1 Variogram for Gold
17.6.2. Silver
The spatial continuity of silver in the Southern Main Zone is similar to that shown by gold. The direction of maximum continuity (1) was found to be -5° towards 190°, with a maximum range of 1,555 ft (Figure 17.17) Plots for the other directions are provided in Appendix F. Direction 2 was found to be inclined +9° towards 100°, with a maximum range of 1,555 ft. Direction 3 is oriented at +80° towards 250°, with a maximum range of 510 ft. The Maximum: Intermediate anisotropy ratio is therefore 1.0, and the Maximum: Minor anisotropy ratio is 3.0.
(Direction 1) -05-->190: Log Continuity for AgDomain 2
Sample Separation (m)
Gamm
a (2.736)
Pair Counts
0 250 500 750 1000 1250 1500 1750 2000 2250 25000.00
0.25
0.50
0.75
1.00
1.25
0
5000
10000
15000
20000
25000
30000
35000
40000
45000
50000
N( 0.1 )
Sph( 0.18, 620 )
Sph( 0.28, 1540 )
Sph( 0.44, 1555 )
Figure 17.17 Direction 1 Variogram for Silver
Vista Gold Corp April 13, 2004 Technical Report, Maverick Springs Doc Ref: 03V315 Report.doc
Snowden Mining Industry Consultants Page 39
17.7. Resource Estimate
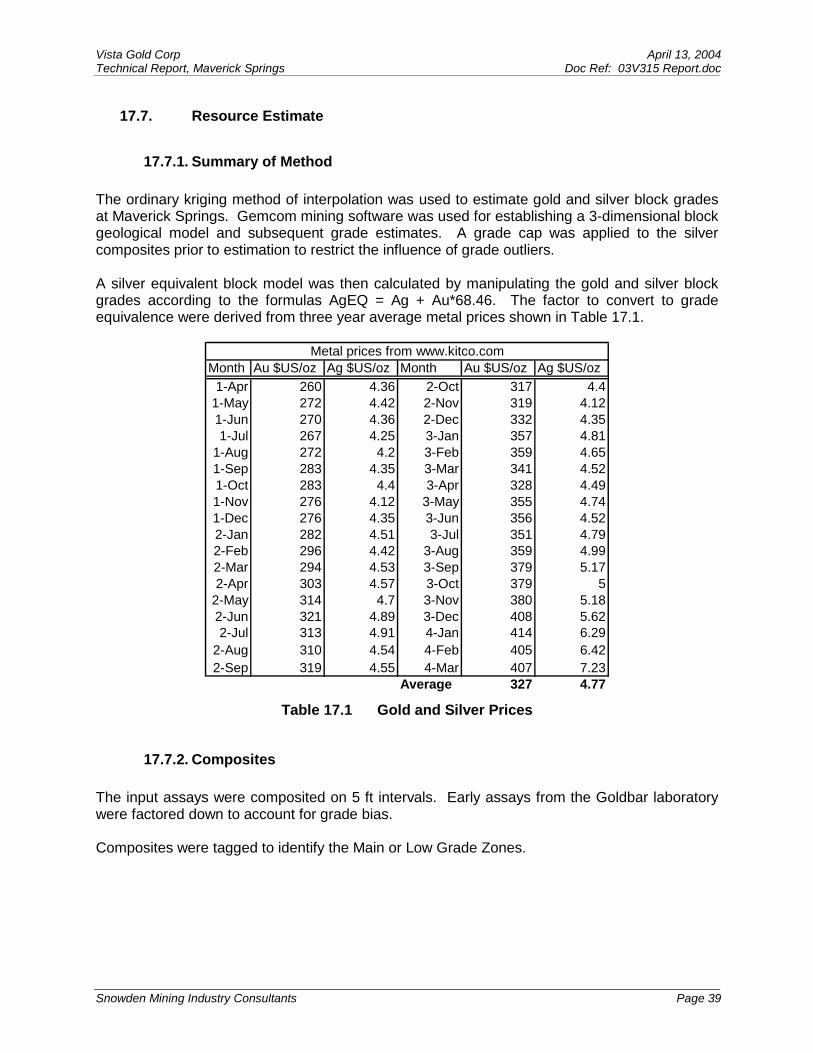
17.7.1. Summary of Method The ordinary kriging method of interpolation was used to estimate gold and silver block grades at Maverick Springs. Gemcom mining software was used for establishing a 3-dimensional block geological model and subsequent grade estimates. A grade cap was applied to the silver composites prior to estimation to restrict the influence of grade outliers. A silver equivalent block model was then calculated by manipulating the gold and silver block grades according to the formulas AgEQ = Ag + Au*68.46. The factor to convert to grade equivalence were derived from three year average metal prices shown in Table 17.1.
Month Au $US/oz Ag $US/oz Month Au $US/oz Ag $US/oz1-Apr 260 4.36 2-Oct 317 4.4
1-May 272 4.42 2-Nov 319 4.121-Jun 270 4.36 2-Dec 332 4.351-Jul 267 4.25 3-Jan 357 4.81
1-Aug 272 4.2 3-Feb 359 4.651-Sep 283 4.35 3-Mar 341 4.521-Oct 283 4.4 3-Apr 328 4.491-Nov 276 4.12 3-May 355 4.741-Dec 276 4.35 3-Jun 356 4.522-Jan 282 4.51 3-Jul 351 4.792-Feb 296 4.42 3-Aug 359 4.992-Mar 294 4.53 3-Sep 379 5.172-Apr 303 4.57 3-Oct 379 5
2-May 314 4.7 3-Nov 380 5.182-Jun 321 4.89 3-Dec 408 5.622-Jul 313 4.91 4-Jan 414 6.29
2-Aug 310 4.54 4-Feb 405 6.422-Sep 319 4.55 4-Mar 407 7.23
Average 327 4.77
Metal prices from www.kitco.com
Table 17.1 Gold and Silver Prices
17.7.2. Composites The input assays were composited on 5 ft intervals. Early assays from the Goldbar laboratory were factored down to account for grade bias. Composites were tagged to identify the Main or Low Grade Zones.

Vista Gold Corp April 13, 2004 Technical Report, Maverick Springs Doc Ref: 03V315 Report.doc
Snowden Mining Industry Consultants Page 40
17.7.3. Block Model Setup Figure 17.18 describes the block model setup. Gemcom’s definition of the model origin is the maximum elevation of the lower left (southwest) corner of the model. The model was rotated so that the column direction (X) matches the orientation of the long axis of the mineralized envelope (27° clockwise) and is perpendicular to the azimuth of the main drill sections.
Figure 17.18 Block Model Definition
The target blocks for grade estimation included the +10 moz blocks selected from the indicator envelope as well as the remaining blocks contained within the broad low grade mineralized zone.
17.7.4. Kriging Parameters The interpolation parameters for gold and silver are summarized in Appendix G and were developed from the variogram models. Identical variography models were used for the Southern and Northern Zones, but with different search orientations to account for the dip on either side of the anticlinal hinge. The Low Grade Zone does not contain sufficient data to allow the description of robust variography models, therefore the parameters from the Main Zones were adopted and applied to the Low Grade Zone. The effective search ellipse was set to the maximum ranges of grade continuity as described by the variograms. The contact between Low Grade and Main Zones was regarded as a “hard” boundary for grade restriction. This meant the higher grade composites of the Main Zone were not available to smear grades into the Low Grade Zone in regions of low sample populations. A “soft” boundary was applied between the Northern and Southern Zones so that composites from either side of

Vista Gold Corp April 13, 2004 Technical Report, Maverick Springs Doc Ref: 03V315 Report.doc
Snowden Mining Industry Consultants Page 41
the anticlinal hinge were available to estimate a block grade providing the composites fell within the search radius. Up to two passes were used to estimate block grades in each Zone. The first pass used search radii that were equivalent to the maximum ranges of the variograms. Kriging variance values from this pass were written to a block model to assist in classification. A second pass was completed with larger ranges to fill any uninformed blocks that remained from the first pass. No kriging variance values were written to the model from the second pass, with the intention that blocks interpolated during the second pass were automatically classified as Inferred. All of the passes used a minimum of 4 composites and a maximum of 32. For all of the passes, the blocks were discretized into an array of points.
17.7.5. Classification The classification scheme took the confidence in the geological interpretation, numbers of informing samples, variogram ranges, and data distribution into account. The selection of +10 moz blocks provided a means of comparing the estimates with the 2002 models reported by Snowden. The model was coded to identify Indicated and Inferred blocks according to the CIM 2000 guidelines. No Measured blocks have been identified in the estimate. The process of classification involved the following steps:
• Only blocks informed by a minimum of 4 composites received a block grade; • A perimeter was defined by the outermost drill holes within the interpreted mineralization
and then expanded 50 ft. Any blocks lying within the perimeter were eligible for Indicated classification. Blocks outside of the perimeter were considered to be estimated from extrapolated data and were therefore classified as Inferred;
• A surface was then generated to identify the last assay in each drill hole. Indicated blocks were restricted to only those blocks lying above the last assay surface;
• The third requirement for Indicated classification was the +10 moz. Blocks were only classified as Indicated if they fell within the perimeter, above the last assay surface and within the 10 moz envelope. All other blocks were classified as Inferred; and
• All blocks within the low grade domains were classified as Inferred due to less confidence in the grade continuity and lack of bulk density data.
Figure 17.19 is a typical section showing the classified blocks. Green blocks are classified as Indicated and blue blocks are Inferred. The undulating black surface is the “last assay” surface.

Vista Gold Corp April 13, 2004 Technical Report, Maverick Springs Doc Ref: 03V315 Report.doc
Snowden Mining Industry Consultants Page 42
Figure 17.19 Classified blocks on Section 13E.
17.7.6. Model Validation The reasonableness of block grade models was validated using 3 methods:
• Visual comparison of block and composite grades in section and plan; • Global comparison of mean model and input grades; and • Validation plots by easting, northing and elevation to compare the mean input and block
grades on a series of parallel plans and sections through the deposit. The visual comparison of block and composite grades on sections and plans showed a good correlation between the input data and output values. No obvious discrepancies were noted. The global mean block gold and silver grades were compared to the global mean of declustered input grades (Table 17.2 and Figure 17.20-21). The difference between the declustered input grade and the model grade is less than 10% and Snowden considers this to be reasonable. Metal
Model grade (moz/t)
Raw grade
No. of composites
Capped value
Grade after capping
Declustered average grade
% difference to model
Au Ag
6.41 680
7.99 828
4439 4439
None 9.77
No change 750
6.92 755
-7.4% -9.9%
Table 17.2 Global Validation Statistics

Vista Gold Corp April 13, 2004 Technical Report, Maverick Springs Doc Ref: 03V315 Report.doc
Snowden Mining Industry Consultants Page 43
Log Histogram for Au
Composites
Au (MOZ/ton)
Weighted Frequency (%
of 7.99978)
0.001 0.01 0.1 1 10 1000.0
2.5
5.0
7.5
10.0
12.5
15.0
17.5
20.0
22.5
25.0
G L50 75
Points:Weights:
Mean:Std Dev:Variance:
CV:Skewness:
Geom Mean:Log-Est Mean:
Maximum:75%:50%:25%:
Minimum:
44397.999786.92110.703114.5491.5465.3446.09811.254
158.79.64.200
Log Histogram for AuBlocks
Au (MOZ/ton)
Frequency (% of 39709 points)
0.001 0.01 0.1 1 100
2
4
6
8
10
12
14
G L25 50 75
Points:Weights:
Mean:Std Dev:Variance:
CV:Skewness:
Geom Mean:Log-Est Mean:
Maximum:75%:50%:25%:
Minimum:
39709397096.4084.70822.1670.7351.4454.8056.744
52.978.915.422.81-0.3
Figure 17.20 Composite Grades (left) compared with Block Grades – Gold
Log Histogram for AgComposites
Ag (MOZ/ton)
Weighted Frequency (%
of 7.99978)
0.001 0.01 0.1 1 10 100 10000.0
2.5
5.0
7.5
10.0
12.5
G L25 50 75
Points:Weights:
Mean:Std Dev:Variance:
CV:Skewness:
Geom Mean:Log-Est Mean:
Maximum:75%:50%:25%:
Minimum:
44397.99978755.3011670.3042789915.3612.2114.862300.7461120.994
9770665210530
Log Histogram for AgBlocks
Ag (MOZ/ton)
Frequency (% of 39709 points)
0.001 0.01 0.1 1 10 100 10000
2
4
6
8
10
12
14
16
18
GL25 50 75
Points:Weights:
Mean:Std Dev:Variance:
CV:Skewness:
Geom Mean:Log-Est Mean:
Maximum:75%:50%:25%:
Minimum:
3970939709680.868528.662279483.9390.7761.798521.119713.292
4745.04941.19531.39305.020
Figure 17.21 Capped Composite Grades (left) Compared with Block Grades - Silver
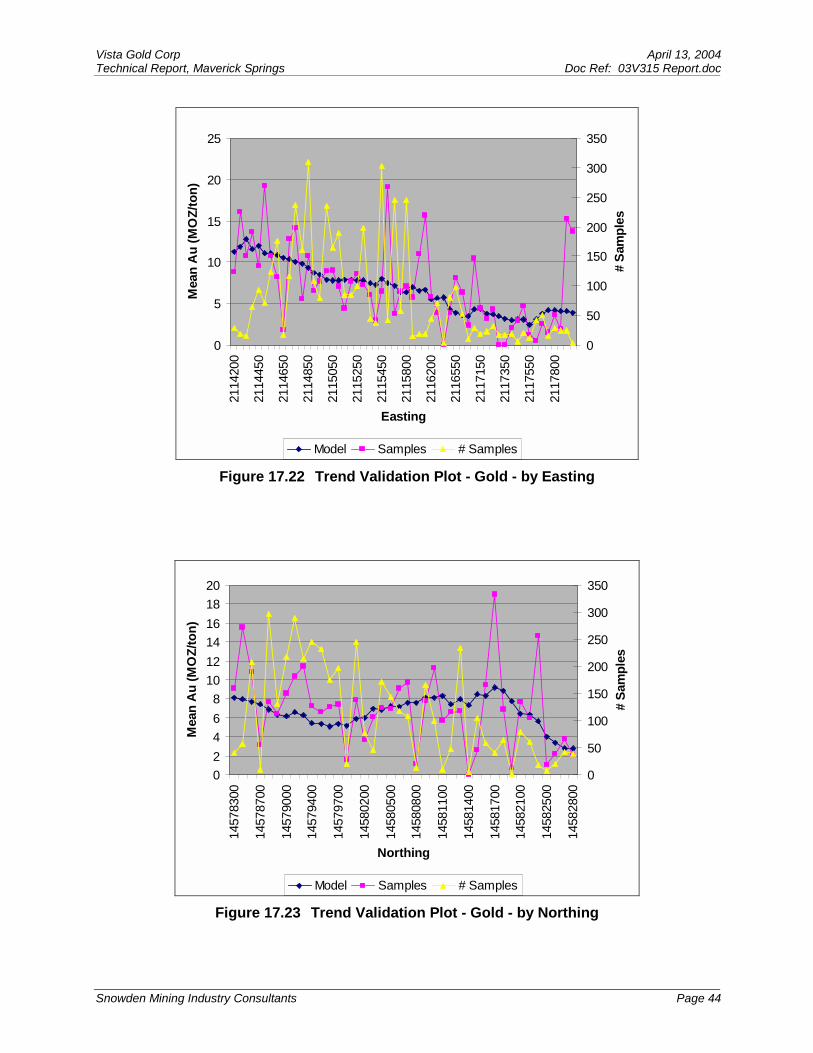
Mean block grades and mean composite grades of gold and silver were plotted on a series of sections and plans (Figure 17.22 to Figure 17.27). The trend of block grades generally honors the trend of input grades, but is smoother as expected from the smoothing effects of kriging estimates into blocks. Portions of the graphs where the block grades diverge from the input grades are generally associated with areas of low data.
Vista Gold Corp April 13, 2004 Technical Report, Maverick Springs Doc Ref: 03V315 Report.doc
Snowden Mining Industry Consultants Page 44
0
5
10
15
20
25
2114
200
2114
450
2114
650
2114
850
2115
050
2115
250
2115
450
2115
800
2116
200
2116
550
2117
150
2117
350
2117
550
2117
800
Easting
Mea
n A
u (M
OZ/
ton)
0
50
100
150
200
250
300
350
# Sa
mpl
es
Model Samples # Samples Figure 17.22 Trend Validation Plot - Gold - by Easting
02468
101214161820
1457
8300
1457
8700
1457
9000
1457
9400
1457
9700
1458
0200
1458
0500
1458
0800
1458
1100
1458
1400
1458
1700
1458
2100
1458
2500
1458
2800
Northing
Mea
n A
u (M
OZ/
ton)
0
50
100
150
200
250
300
350
# Sa
mpl
es
Model Samples # Samples Figure 17.23 Trend Validation Plot - Gold - by Northing

Vista Gold Corp April 13, 2004 Technical Report, Maverick Springs Doc Ref: 03V315 Report.doc
Snowden Mining Industry Consultants Page 45
0
2
4
6
8
10
12
14
16
18
5100
5200
5300
5400
5500
5600
5700
5800
5900
6000
6100
6200
6300
6400
6500
6600
6700
Elevation
Mea
n A
u (M
OZ/
ton)
0
20
40
60
80
100
120
140
160
180
200
# Sa
mpl
es
Model Samples # Samples Figure 17.24 Trend Validation Plot - Gold - by Elevation
0
500
1000
1500
2000
2500
3000
2114
200
2114
450
2114
650
2114
850
2115
050
2115
250
2115
450
2115
800
2116
200
2116
550
2117
150
2117
350
2117
550
2117
800
Easting
Mea
n A
g (M
OZ/
ton)
0
50
100
150
200
250
300
350
# Sa
mpl
es
Model Samples # Samples Figure 17.25 Trend Validation Plot - Silver - by Easting

Vista Gold Corp April 13, 2004 Technical Report, Maverick Springs Doc Ref: 03V315 Report.doc
Snowden Mining Industry Consultants Page 46
0
200
400
600
800
1000
1200
1400
1600
1800
1457
8300
1457
8700
1457
9000
1457
9400
1457
9700
1458
0100
1458
0400
1458
0700
1458
1000
1458
1300
1458
1600
1458
2000
1458
2300
1458
2700
Northing
Mea
n A
g (M
OZ/
ton)
0
50
100
150
200
250
300
350
# Sa
mpl
es
Model Samples # Samples Figure 17.26 Trend Validation Plot - Silver - by Northing
0
1000
2000
3000
4000
5000
6000
7000
8000
5100
5220
5340
5460
5580
5700
5820
5940
6060
6180
6300
6420
6540
6660
6780
Elevation
Mea
n A
g (M
OZ/
ton)
0
20
40
60
80
100
120
140
160
180
200
# Sa
mpl
es
Model Samples # Samples Figure 17.27 Trend Validation Plot - Silver - by Elevation
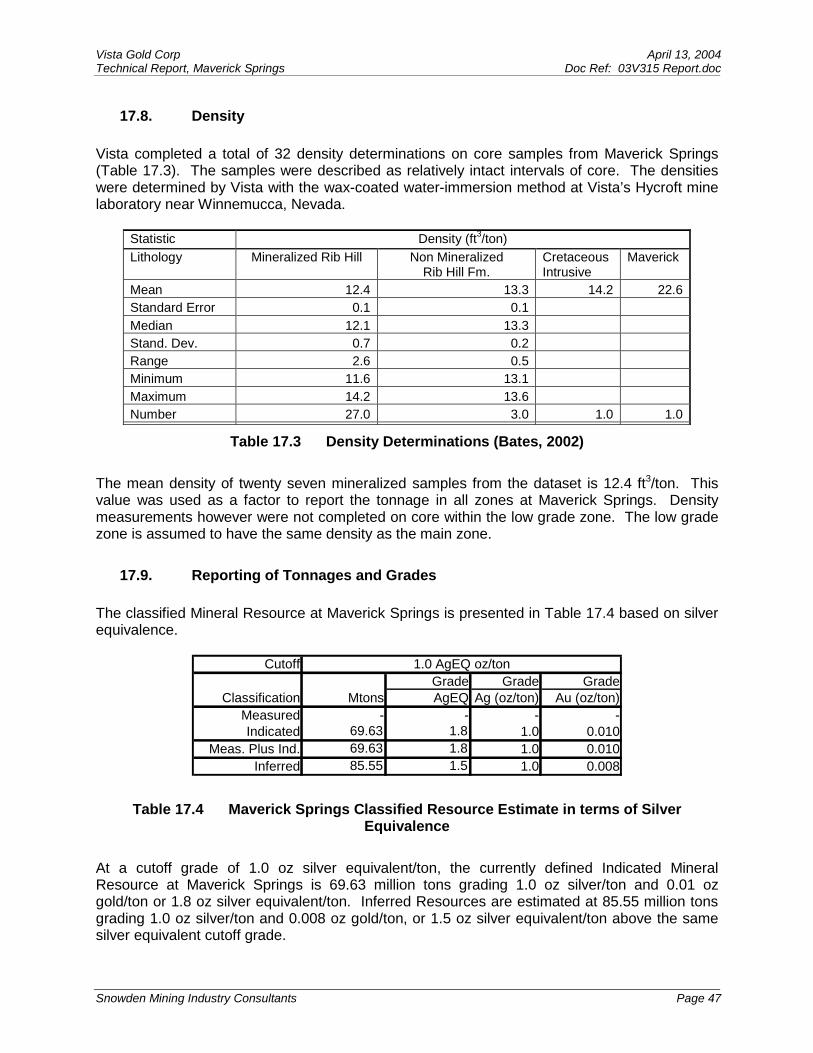
Vista Gold Corp April 13, 2004 Technical Report, Maverick Springs Doc Ref: 03V315 Report.doc
Snowden Mining Industry Consultants Page 47
17.8. Density Vista completed a total of 32 density determinations on core samples from Maverick Springs (Table 17.3). The samples were described as relatively intact intervals of core. The densities were determined by Vista with the wax-coated water-immersion method at Vista’s Hycroft mine laboratory near Winnemucca, Nevada.
Statistic Density (ft3/ton) Lithology Mineralized Rib Hill
Non Mineralized
Rib Hill Fm. Cretaceous Intrusive
Maverick
Mean 12.4 13.3 14.2 22.6Standard Error 0.1 0.1 Median 12.1 13.3 Stand. Dev. 0.7 0.2 Range 2.6 0.5 Minimum 11.6 13.1 Maximum 14.2 13.6 Number 27.0 3.0 1.0 1.0
Table 17.3 Density Determinations (Bates, 2002) The mean density of twenty seven mineralized samples from the dataset is 12.4 ft3/ton. This value was used as a factor to report the tonnage in all zones at Maverick Springs. Density measurements however were not completed on core within the low grade zone. The low grade zone is assumed to have the same density as the main zone.
17.9. Reporting of Tonnages and Grades The classified Mineral Resource at Maverick Springs is presented in Table 17.4 based on silver equivalence.
CutoffGrade Grade Grade
Classification Mtons AgEQ Ag (oz/ton) Au (oz/ton)Measured - - - -Indicated 69.63 1.8 1.0 0.010
Meas. Plus Ind. 69.63 1.8 1.0 0.010Inferred 85.55 1.5 1.0 0.008
1.0 AgEQ oz/ton
Table 17.4 Maverick Springs Classified Resource Estimate in terms of Silver Equivalence
At a cutoff grade of 1.0 oz silver equivalent/ton, the currently defined Indicated Mineral Resource at Maverick Springs is 69.63 million tons grading 1.0 oz silver/ton and 0.01 oz gold/ton or 1.8 oz silver equivalent/ton. Inferred Resources are estimated at 85.55 million tons grading 1.0 oz silver/ton and 0.008 oz gold/ton, or 1.5 oz silver equivalent/ton above the same silver equivalent cutoff grade.
Vista Gold Corp April 13, 2004 Technical Report, Maverick Springs Doc Ref: 03V315 Report.doc
Snowden Mining Industry Consultants Page 48
Equivalent grades were calculated using average metal prices determined from the past three years, according to the following values and formulae:
• Average gold (Au) price = $US327 per ounce (oz); • Average silver (Ag) price = $US4.77 per oz; and • Silver equivalence (AgEQ) = Ag + Au*68.46.
Detailed tables summarizing the resource totals at various metal cutoff grades are located in Appendix H.

Vista Gold Corp April 13, 2004 Technical Report, Maverick Springs Doc Ref: 03V315 Report.doc
Snowden Mining Industry Consultants Page 49
18. OTHER RELEVANT DATA AND INFORMATION There is no other relevant data or information to report.

Vista Gold Corp April 13, 2004 Technical Report, Maverick Springs Doc Ref: 03V315 Report.doc
Snowden Mining Industry Consultants Page 50
19. CONCLUSIONS AND RECOMMENDATIONS The Maverick Springs property contains a sediment hosted silver and gold deposit similar to other precious metal deposits of the Carlin Trend. The main zone of mineralization is approximately 200 ft. thick and occurs at depths of 500 ft to 600 ft below surface. At a cutoff grade of 1.0 oz silver equivalent/ton, the currently defined Indicated Mineral Resource at Maverick Springs is 69.63 million tons grading 1.0 oz silver/ton and 0.01 oz gold/ton, or 1.8 oz silver equivalent/ton. Inferred Resources are estimated at 85.55 million tons grading 1.0 oz silver/ton and 0.008 oz gold/ton or 1.5 oz silver equivalent/ton, above the same silver equivalent cutoff grade. This resource estimate was generated by ordinary kriged methods using 5 ft composites of RC and diamond drill hole data. The pre-2002, composite data was factored down to account for grade bias in the original data. The factor was determined according to linear regression equations derived from the results of duplicate analysis campaigns completed by Newmont in 2001 and 2002. Drilling by Vista in 2003 allowed the modeling of mineralization additional to that defined in the Snowden estimate of 2002. In Snowden’s opinion, Inferred resources could be upgraded to Indicated with infill drilling on 400 ft. centers or less. It is also Snowden’s opinion that the extent of the mineralization at Maverick Springs has not yet been defined in the southern and north/northwestern directions. Hole MR03-139 is mineralized and lies approximately 1,450 ft northwest of the latest sectional drilling. Hole MR61 contains low grade mineralization and lies over 2,000 ft south of the southernmost drill section. The project could be advanced by the following actions: 1. Further drilling is required on approximately 400 ft centers to determine the full extent of mineralization at Maverick Springs; 2. Once the extents of mineralization is known and metal recoveries are established from testwork, a Scoping Study of the Maverick Springs deposit should be undertaken for a range of metal prices, mining and milling costs to determine under which scenario a mining operation is feasible; 3. If the assessment is positive, Snowden believes that further infilling of the drill spacing to approximately 200 ft or less could improve the description of grade continuity and geological interpretation such that part of the resource could be classified as Measured; 4. Snowden believes that further duplicate analyses be conducted on the original assay intervals. The current regression formulae are derived from a population of approximately 200 ALS Chemex duplicates. This should be increased to 500 duplicates to improve confidence in the assays; 5. Additional density determinations are required. The samples chosen should be representative of the geologic domains identified. Consideration should also be given to having the determinations performed at an independent laboratory. Density measurements within the low grade zone may allow some Inferred Resources to be reclassified; 6. Further efforts should be made to refine the geologic model – with particular emphasis on defining the structural and lithological controls to mineralization.

Vista Gold Corp April 13, 2004 Technical Report, Maverick Springs Doc Ref: 03V315 Report.doc
Snowden Mining Industry Consultants Page 51
20. REFERENCES Arthur, B., 2002. Maverick Test Results, Internal Memorandum, Newmont Mining Company, March 19, 2002. Bates, W., 2002. Maverick Springs Tonnage Factors, Memorandum prepared by Vista Gold Corp. for Snowden, October 11, 2002. Blakestad, R., 2001. Summary and Overview of the Maverick Springs Silver-Gold Property
Elko and White Pine Counties, Nevada, Consultants report prepared for Newmont Mining Company
Doe, T.C., 2003. 2002 Drilling Program Summary Report. Consultant’s report prepared for
Vista Gold Corp. Thomas C. Doe & Associates Friberg, R., 1997. Report on the Maverick Springs Project, Consultant’s report prepared for
AGX Resources Corp., January, 1997. Process Research Associates Ltd. (PRA), 2004. Maverick Springs Cyanidation Laboratory
Testing. Schroeter, T. and Poulsen, H., 1996. Carbonate-hosted Disseminated Au-Ag, in Selected
British Columbia Mineral Deposit Profiles, Volume 2 – Metallic Deposits, Lefebure , D.V and Hoy, T., Editors, British Columbia Ministry of Employment and Investment, Open File 1996-13, pages 9-12.
Tosdal, R., 1998. Contributions to the Gold Metallogeny of Northern Nevada – Preface, USGS
Open File 98-338.

Vista Gold Corp April 13, 2004 Technical Report, Maverick Springs Doc Ref: 03V315 Report.doc
Snowden Mining Industry Consultants Page 52
21. CERTIFICATE OF AUTHOR
Neil R. Burns, P.Geo.
1090 West Pender Street, Suite 720 Vancouver B.C.
Tel: (604) 683-7645 Fax: (604) 683-7929
Email: [email protected] I, Neil R. Burns, M.Sc., P.Geo., am a Professional Geoscientist employed as a Resource Geologist by Snowden Mining Industry Consultants, 1090 West Pender Street, Vancouver, B.C. I graduated with a Bachelor of Science degree in Earth Sciences from Dalhousie University, Halifax, NS in 1995. Subsequently I obtained a Master of Science degree in Mineral Exploration from Queen’s University in 2003. I am a member of the Association of Professional Engineers and Geoscientists of British Columbia. I have worked as a geologist for a total of eight years since graduating with my bachelor’s degree. I have read the definition of “qualified person” set out in National Instrument 43-101 (“NI 43-101”) and certify that by reason of my education, affiliation with a professional association (as defined in NI 43-101) and past relevant work experience, I fulfill the requirements of a “qualified person” for the purposes of NI 43-101. I am responsible for the preparation of the technical report titled Technical Report, Maverick Springs Property, Nevada USA and dated April 13th, 2004 (the “Technical Report”), and I visited the site from November 11th to November 13th, 2003. I have not had prior involvement with the property that is the subject of the technical report. I am not aware of any material fact or material change with respect to the subject matter of this technical report that is not reflected in the report, the omission to disclose which makes this report misleading. I am independent of the issuer applying all of the tests in section 1.5 of NI 43-101. I have read National Instrument 43-101 and Form 43-101F1, and the Technical Report has been prepared in compliance with that instrument and form. Dated at Vancouver, British Columbia, this 13th day of April, 2004.
[SIGNED] Neil R. Burns, M.Sc., P.Geo

Vista Gold Corp April 13, 2004 Technical Report, Maverick Springs Doc Ref: 03V315 Report.doc
Snowden Mining Industry Consultants Page 53
CONSENT OF QUALIFIED PERSON
Neil R. Burns, P.Geo.
1090 West Pender Street, Suite 720 Vancouver B.C.
Tel: (604) 683-7645 Fax: (604) 683-7929
Email: [email protected]
TO: The securities regulatory authorities of each of the provinces and territories of Canada I, Neil R. Burns, M.Sc., P.Geo., do hereby consent to the filing of the report titled Technical Report, Maverick Springs Property, Nevada USA, prepared for Vista Gold Corporation and Silver Standard Resources Inc. dated April 13th, 2004. Dated at Vancouver, British Columbia this 13th day of April, 2004.
[SIGNED] Neil R. Burns, M.Sc., P.Geo.

Appendix A Maverick Springs Project Drill Hole Listing

Record No. HOLE-ID Collar East Collar North Collar Elev LENGTH(UTM Ft) (UTM Ft) (Feet ASL) (Feet)
1 HP-1 2115662 14580745 7170 425.02 HP-2 2114038 14583501 7510 383.03 MR03-136 2115384 14580312 7137 980.04 MR03-137 2115646 14580142 7187 500.05 MR03-137A 2115643 14580155 7187 940.06 MR03-138 2114941 14578344 7108 1200.07 MR03-139 2115420 14583609 7252 1100.08 MR03-140 2114994 14582186 7262 595.09 MR03-140A 2115000 14582199 7262 1000.010 MR03-141 2115305 14581310 7192 1000.011 MR03-142 2114787 14581031 7192 940.012 MR03-143 2114534 14580735 7194 870.013 MR03-144 2115801 14580962 7181 1000.014 MR03-145 2115482 14580729 7158 760.015 MR03-146 2116076 14581250 7179 690.016 MR03-147 2115610 14581720 7207 840.017 MR03-148 2116007 14581651 7190 975.018 MR03-149 2115312 14581647 7215 625.019 MR1 2115613 14579327 7178 245.020 MR10 2116313 14578908 7301 340.021 MR100 2112513 14579325 7238 2422.022 MR101 2114489 14578704 7066 1617.023 MR102 2114877 14579404 7095 1318.024 MR103 2114863 14579630 7103 1375.225 MR104 2114575 14579329 7099 1399.526 MR105 2116156 14579423 7275 1300.427 MR106 2113964 14580428 7199 1980.028 MR107 2114434 14578504 7061 1354.029 MR108 2112082 14579395 7290 2080.030 MR109 2109622 14579897 6953 2000.031 MR11 2116119 14579102 7265 140.032 MR110 2108992 14578433 6873 1660.033 MR111 2109752 14582793 7098 3220.034 MR112 2120890 14584815 6860 2000.035 MR113 2109589 14583810 7149 3040.036 MR114 2119007 14582483 6988 1935.037 MR115 2122265 14586759 6783 2000.038 MR116 2116281 14580256 7320 1170.539 MR117 2109526 14577474 6946 2700.040 MR118 2114582 14578877 7073 1270.041 MR119 2107576 14578322 6805 2480.042 MR12 2115839 14579122 7220 325.043 MR120 2111627 14575950 6888 2150.044 MR121 2115213 14579453 7129 1173.045 MR122 2114581 14578877 7073 1382.546 MR123 2113507 14579419 7108 2000.047 MR124 2115303 14578959 7144 1152.048 MR125 2116886 14582642 7137 1283.049 MR126 2115607 14579254 7174 1032.050 MR127 2115040 14579319 7112 1216.051 MR128 2114578 14578882 7074 1329.852 MR129 2115345 14581985 7237 1000.053 MR13 2115730 14579151 7197 225.054 MR130 2114941 14581369 7204 1000.055 MR131 2114889 14580607 7159 1020.056 MR132 2115115 14580552 7150 1000.057 MR133 2115190 14580952 7166 1000.0
Maverick Springs Project Drill Hole Listing

Record No. HOLE-ID Collar East Collar North Collar Elev LENGTH(UTM Ft) (UTM Ft) (Feet ASL) (Feet)
58 MR134 2115673 14581378 7190 1000.059 MR135 2115876 14582008 7225 1000.060 MR14 2115378 14579319 7142 290.061 MR15 2116095 14580368 7320 515.062 MR16 2116254 14580454 7307 550.063 MR17 2116272 14580285 7317 300.064 MR18 2116048 14580535 7284 160.065 MR19 2116310 14579378 7281 360.066 MR2 2115713 14579336 7196 300.067 MR20 2115977 14579506 7255 25.068 MR21 2116292 14579818 7319 50.069 MR22 2116088 14579922 7326 200.070 MR23 2116128 14579442 7277 80.071 MR24 2116168 14579422 7275 60.072 MR25 2116475 14579307 7273 265.073 MR26 2116514 14580510 7224 115.074 MR27 2116623 14580512 7207 90.075 MR28 2116918 14581728 7103 100.076 MR29 2117632 14581373 7053 220.077 MR3 2115809 14579325 7223 180.078 MR30 2117275 14581552 7073 85.079 MR31 2116900 14581296 7100 90.080 MR32 2117650 14580944 7101 160.081 MR33 2109784 14582857 7107 380.082 MR34 2109926 14582616 7115 195.083 MR35 2108853 14578411 6868 385.084 MR36 2108870 14578189 6915 365.085 MR37 2108855 14578034 6931 125.086 MR38 2119159 14585003 6990 420.087 MR39 2122257 14586755 6783 340.088 MR4 2112397 14579379 7244 305.089 MR40 2118605 14582554 7006 600.090 MR41 2115728 14579191 7201 465.091 MR42 2115409 14579353 7147 540.092 MR43 2116321 14579329 7274 640.093 MR44 2116449 14579277 7276 280.094 MR45 2116306 14578923 7302 620.095 MR46 2115033 14579543 7102 575.096 MR47 2116158 14579428 7275 210.097 MR48 2115134 14579939 7117 380.098 MR49 2116181 14579413 7275 563.099 MR5 2112503 14579335 7238 90.0100 MR50 2114763 14579232 7086 701.0101 MR51 2115121 14579051 7129 677.0102 MR52 2115807 14578704 7209 170.0103 MR53 2116695 14578704 7241 660.0104 MR54 2115499 14578859 7156 532.0105 MR55 2116165 14578515 7254 660.0106 MR56 2115832 14578709 7209 640.0107 MR57 2115493 14579763 7160 460.5108 MR58 2119176 14584954 6992 1290.0109 MR59 2114748 14579242 7086 1647.5110 MR6 2116111 14579065 7266 30.0111 MR60 2114396 14579420 7122 1272.0112 MR61 2114615 14576017 7201 2000.0
Maverick Springs Project Drill Hole Listing (Continued)

Record No. HOLE-ID Collar East Collar North Collar Elev LENGTH(UTM Ft) (UTM Ft) (Feet ASL) (Feet)
113 MR62 2114322 14579904 7171 1177.0114 MR63 2114662 14579734 7118 1025.0115 MR64 2117627 14581375 7053 1830.0116 MR65 2115058 14579530 7106 1040.0117 MR66 2116910 14581732 7103 2000.0118 MR67 2116739 14579577 7197 940.0119 MR68 2117103 14581199 7081 1600.0120 MR69 2115492 14578863 7155 1063.7121 MR7 2116116 14579087 7265 185.0122 MR70 2114423 14580301 7177 1275.0123 MR71 2117292 14580652 7088 1300.0124 MR72 2115139 14579043 7129 999.0125 MR73 2114794 14580113 7140 1063.7126 MR74 2114054 14579590 7142 1227.8127 MR75 2116558 14580547 7214 1085.0128 MR76 2115125 14579943 7116 1091.0129 MR77 2116559 14580111 7236 1080.0130 MR78 2117463 14580108 7148 1700.0131 MR79 2117648 14582256 7089 1800.0132 MR8 2116338 14578916 7299 325.0133 MR80 2117797 14580816 7108 1993.0134 MR81 2117467 14582793 7075 1695.0135 MR82 2115492 14579771 7160 922.0136 MR83 2118189 14582430 7052 2020.0137 MR84 2118007 14582971 7069 1980.0138 MR85 2116757 14579599 7196 476.7139 MR86 2117601 14579591 7199 1145.0140 MR87 2118929 14582102 7030 2025.0141 MR88 2117923 14583683 7070 1780.0142 MR89 2116563 14580509 7215 1059.0143 MR9 2116310 14578900 7302 325.0144 MR90 2118155 14580655 7133 1700.0145 MR91 2115855 14579575 7222 974.0146 MR92 2116282 14578893 7301 1320.0147 MR93 2117796 14581734 7040 1890.0148 MR94 2117980 14581192 7072 1870.0149 MR95 2115823 14580487 7227 1198.0150 MR96 2118340 14581905 7026 2100.0151 MR97 2116032 14578143 7231 1012.0152 MR98 2114580 14578875 7075 1504.8153 MR99 2114672 14579056 7079 1454.0154 MS1 2115875 14581250 7190 180.0155 MS2 2114317 14586388 7515 120.0156 MS3 2113667 14580607 7235 1000.0157 MS4 2115455 14580732 7150 460.0158 MS5 2114300 14580762 7215 820.0159 MS6 2113234 14580565 7270 960.0
Maverick Springs Project Drill Hole Listing (Continued)

Appendix B Vista’s 2003 Standard’s Analysis

Std 1 Au
0.20
0.25
0.30
0.35
0.40
0.45
0.50
0.55
5/26 6/9 6/23 7/7 7/21 8/4 8/18 9/1 9/15 9/29 10/13 10/27 11/10 11/24
Date Received
Au
(ppm
)
Std 1 Ag
200.0
250.0
300.0
350.0
400.0
450.0
500.0
550.0
600.0
650.0
700.0
5/26 6/9 6/23 7/7 7/21 8/4 8/18 9/1 9/15 9/29 10/13 10/27 11/10 11/24
Date Received
Ag
(ppm
)
Std 2 Ag
0
25
50
75
100
125
150
175
200
5/26 6/9 6/23 7/7 7/21 8/4 8/18 9/1 9/15 9/29 10/13
10/27
11/10
11/24
Date Received
Au
(ppm
)
Std 2 Au
0.250
0.300
0.350
0.400
0.450
0.500
5/26 6/9 6/23 7/7 7/21 8/4 8/18 9/1 9/15 9/29 10/13 10/27 11/10 11/24
Date Received
Au (p
pm)
Std 3 Au
0.10
0.15
0.20
0.25
0.30
0.35
0.40
0.45
0.50
5/26 6/9 6/23 7/7 7/21 8/4 8/18 9/1 9/15 9/29 10/13 10/27 11/10 11/24
Date Received
Au
(ppm
)
Std 3 Ag
0
1
2
3
4
5
6
7
8
9
10
5/26 6/9 6/23 7/7 7/21 8/4 8/18 9/1 9/15 9/29 10/13 10/27 11/10 11/24
Date Received
Ag (p
pm)
Std 4 Au
0.00
0.05
0.10
0.15
0.20
0.25
0.30
5/26 6/9 6/23 7/7 7/21 8/4 8/18 9/1 9/15 9/29 10/13 10/27 11/10 11/24
Date Received
Au
(ppm
)
Std 4 Ag
0
1
2
3
4
5
6
7
8
9
10
5/26 6/9 6/23 7/7 7/21 8/4 8/18 9/1 9/15 9/29 10/13 10/27 11/10 11/24
Date Received
Ag (p
pm)

Std 5 Au
0.0000.0020.0040.0060.0080.0100.0120.0140.0160.0180.0200.0220.0240.0260.0280.030
5/26 6/9 6/23 7/7 7/21 8/4 8/18 9/1 9/15 9/29 10/13 10/27 11/10 11/24
Date Received
Au (p
pm)
Std 5 Ag
0.0
0.5
1.0
1.5
2.0
2.5
3.0
3.5
4.0
4.5
5.0
5/26 6/9 6/23 7/7 7/21 8/4 8/18 9/1 9/15 9/29 10/13
10/27
11/10
11/24Date Received
Ag
(ppm
)
Std 6 Au
0.000
0.005
0.010
0.015
0.020
0.025
5/26 6/9 6/23 7/7 7/21 8/4 8/18 9/1 9/15 9/29 10/13 10/27 11/10
Date Received
Au (p
pm)
Std 6 Ag
0.0
0.5
1.0
1.5
2.0
2.5
3.0
3.5
4.0
4.5
5.0
5/26 6/9 6/23 7/7 7/21 8/4 8/18 9/1 9/15 9/29 10/13 10/27 11/10
Date Received
Ag (p
pm)
Std Alt Au
0.000
0.005
0.010
0.015
0.020
0.025
5/26 6/9 6/23 7/7 7/21 8/4 8/18 9/1 9/15 9/29 10/13 10/27 11/10 11/24
Date Received
Au (p
pm)
Std Alt Ag
0.0
0.5
1.0
1.5
2.0
2.5
3.0
3.5
4.0
4.5
5.0
5/26 6/9 6/23 7/7 7/21 8/4 8/18 9/1 9/15 9/29 10/13 10/27 11/10 11/24
Date Received
Ag
(ppm
)
NP 1 Au
0.55
0.60
0.65
0.70
0.75
5/26 6/9 6/23 7/7 7/21 8/4 8/18 9/1 9/15 9/29 10/13 10/27 11/10 11/24
Date Received
Au
(ppm
)
NP 1 Ag
5
6
7
8
9
10
11
12
13
14
15
5/26 6/9 6/23 7/7 7/21 8/4 8/18 9/1 9/15 9/29 10/13
10/27
11/10
11/24
Date Received
Ag
(ppm
)
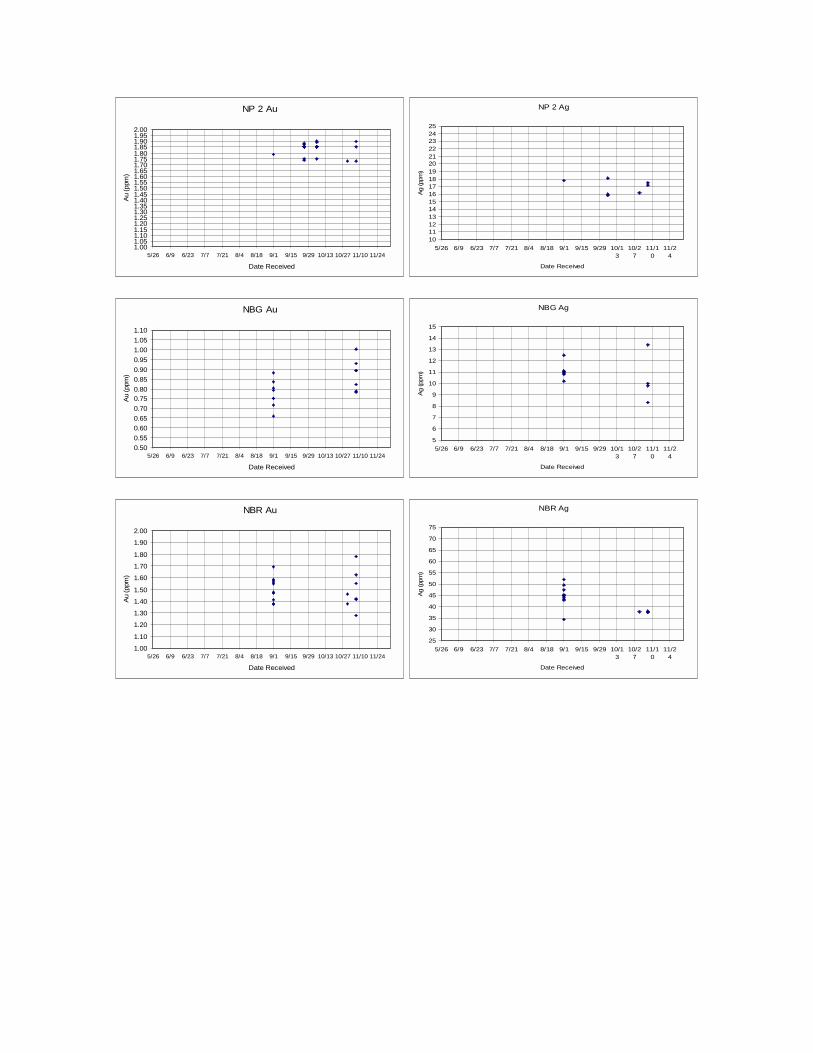
NP 2 Au
1.001.051.101.151.201.251.301.351.401.451.501.551.601.651.701.751.801.851.901.952.00
5/26 6/9 6/23 7/7 7/21 8/4 8/18 9/1 9/15 9/29 10/13 10/27 11/10 11/24
Date Received
Au
(ppm
)
NP 2 Ag
10111213141516171819202122232425
5/26 6/9 6/23 7/7 7/21 8/4 8/18 9/1 9/15 9/29 10/13
10/27
11/10
11/24
Date Received
Ag
(ppm
)
NBG Au
0.500.550.600.650.700.750.800.850.900.951.001.051.10
5/26 6/9 6/23 7/7 7/21 8/4 8/18 9/1 9/15 9/29 10/13 10/27 11/10 11/24
Date Received
Au
(ppm
)
NBG Ag
5
6
7
8
9
10
11
12
13
14
15
5/26 6/9 6/23 7/7 7/21 8/4 8/18 9/1 9/15 9/29 10/13
10/27
11/10
11/24
Date Received
Ag
(ppm
)
NBR Au
1.00
1.10
1.20
1.30
1.40
1.50
1.60
1.70
1.80
1.90
2.00
5/26 6/9 6/23 7/7 7/21 8/4 8/18 9/1 9/15 9/29 10/13 10/27 11/10 11/24
Date Received
Au
(ppm
)
NBR Ag
25
30
35
40
45
50
55
60
65
70
75
5/26 6/9 6/23 7/7 7/21 8/4 8/18 9/1 9/15 9/29 10/13
10/27
11/10
11/24
Date Received
Ag
(ppm
)

Appendix C Vista American Assay verses Chemex Plots
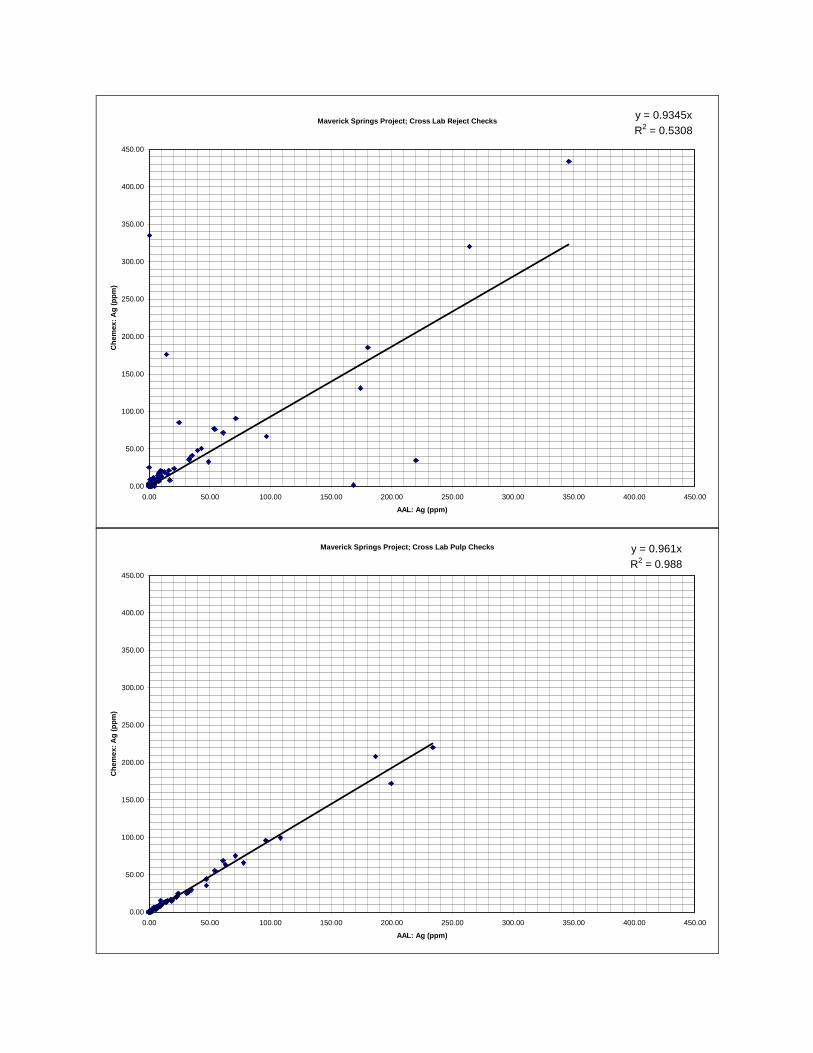
Maverick Springs Project; Cross Lab Reject Checks y = 0.9345xR2 = 0.5308
0.00
50.00
100.00
150.00
200.00
250.00
300.00
350.00
400.00
450.00
0.00 50.00 100.00 150.00 200.00 250.00 300.00 350.00 400.00 450.00
AAL: Ag (ppm)
Che
mex
: Ag
(ppm
)
Maverick Springs Project; Cross Lab Pulp Checks y = 0.961x
R2 = 0.988
0.00
50.00
100.00
150.00
200.00
250.00
300.00
350.00
400.00
450.00
0.00 50.00 100.00 150.00 200.00 250.00 300.00 350.00 400.00 450.00
AAL: Ag (ppm)
Che
mex
: Ag
(ppm
)
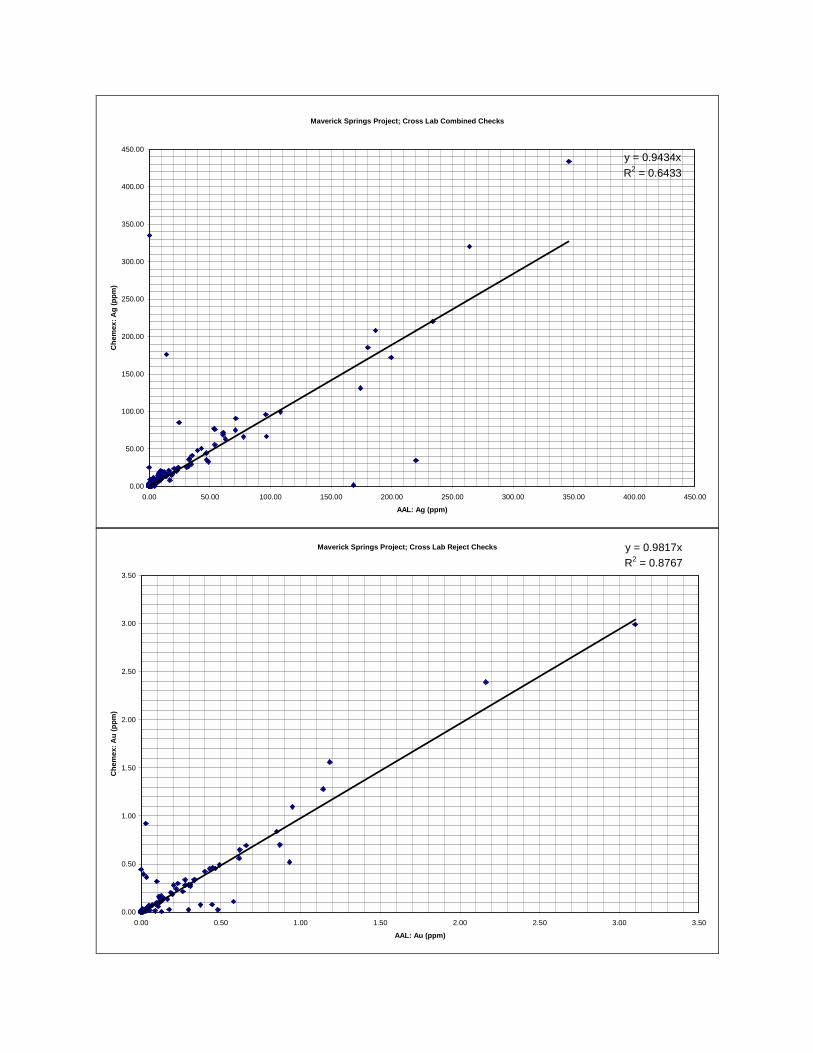
Maverick Springs Project; Cross Lab Combined Checks
y = 0.9434xR2 = 0.6433
0.00
50.00
100.00
150.00
200.00
250.00
300.00
350.00
400.00
450.00
0.00 50.00 100.00 150.00 200.00 250.00 300.00 350.00 400.00 450.00
AAL: Ag (ppm)
Che
mex
: Ag
(ppm
)
Maverick Springs Project; Cross Lab Reject Checks y = 0.9817x
R2 = 0.8767
0.00
0.50
1.00
1.50
2.00
2.50
3.00
3.50
0.00 0.50 1.00 1.50 2.00 2.50 3.00 3.50
AAL: Au (ppm)
Che
mex
: Au
(ppm
)
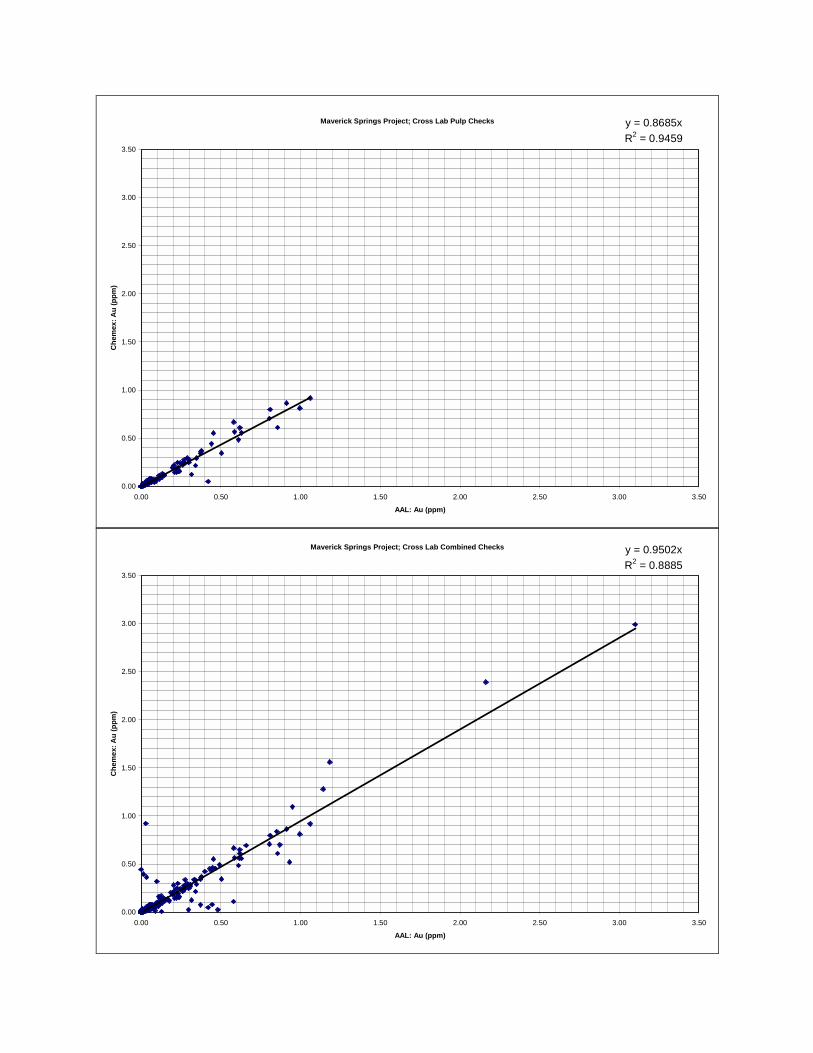
Maverick Springs Project; Cross Lab Pulp Checks y = 0.8685xR2 = 0.9459
0.00
0.50
1.00
1.50
2.00
2.50
3.00
3.50
0.00 0.50 1.00 1.50 2.00 2.50 3.00 3.50
AAL: Au (ppm)
Che
mex
: Au
(ppm
)
Maverick Springs Project; Cross Lab Combined Checks y = 0.9502x
R2 = 0.8885
0.00
0.50
1.00
1.50
2.00
2.50
3.00
3.50
0.00 0.50 1.00 1.50 2.00 2.50 3.00 3.50
AAL: Au (ppm)
Che
mex
: Au
(ppm
)

Appendix D Snowden 2002 Independent Analysis

Hole-ID From To Sample #(ft) (ft) Original Assay Snowden Assay Original Assay Snowden Assay
MR63 701 704 144685 3.84 4.2 0.003 <0.002704 710 144686 1.08 0.7 0.006 <0.002716 721 144689 10.87 16.7 0.013 0.016755 759 108501 2.79 5 0.019 0.01768 771 108506 0.61 1.2 0.014 0.01
MR122 863 868 37876 1.63 1.2 0.015 0.013878 881 37829 3.31 4.1 0.01 <0.002921 926 37891 0.46 0.4 0.029 0.026943 948 37896 1.37 0.5 0.013 0.014976 980 37905 6.26 5.2 0.02 0.018
Snowden 2002 Independent Check AnalysisAg (oz/ton) Au (oz/ton)

Appendix E Snowden 2003 Independent Check Analysis

Hole ID From To Au ppm Ag ppm Au oz/ton Ag oz/ton Au ppm Ag ppm Au oz/ton Ag oz/ton Au ppm Ag ppm Au oz/ton Ag oz/ton
H Au, H AgMR-142 760.000 765.000 3.000 102.950 0.088 3.003 2.34 98.3 0.068 2.867 0.660 4.650 0.019 0.136MR-142 765.000 770.000 0.980 43.800 0.029 1.278 0.609 46.8 0.018 1.365 0.371 3.000 0.011 0.088
H Au, L AgMR-140A 845.000 850.000 0.317 1.400 0.009 0.041 0.285 1.8 0.008 0.053 0.032 0.400 0.001 0.012MR-140A 850.000 855.000 2.819 1.000 0.082 0.029 2.82 1.1 0.082 0.032 0.001 0.100 0.000 0.003MR-140A 855.000 860.000 0.689 1.100 0.020 0.032 0.638 1.1 0.019 0.032 0.051 0.000 0.001 0.000
A Au, A AgMR-131 710.000 715.000 0.484 32.400 0.014 0.945 0.514 45.5 0.015 1.327 0.030 13.100 0.001 0.382
L Au, H AgMR-130 695.000 700.000 0.336 731.895 0.010 21.347 0.36 338 0.011 9.858 0.024 393.895 0.001 11.489MR-130 700.000 705.000 0.136 347.770 0.004 10.143 0.125 325 0.004 9.479 0.011 22.770 0.000 0.664MR-130 705.000 710.000 0.120 179.215 0.004 5.227 0.127 156 0.004 4.550 0.007 23.215 0.000 0.677
L Au, L AgMR-144 435.000 440.000 0.019 0.500 0.001 0.015 0.03 0.9 0.001 0.026 0.011 0.400 0.000 0.012
American Assay -original assay Chemex -Snowden check assay DifferenceSnowden 2003 Independent Check Analysis

Appendix F Variography
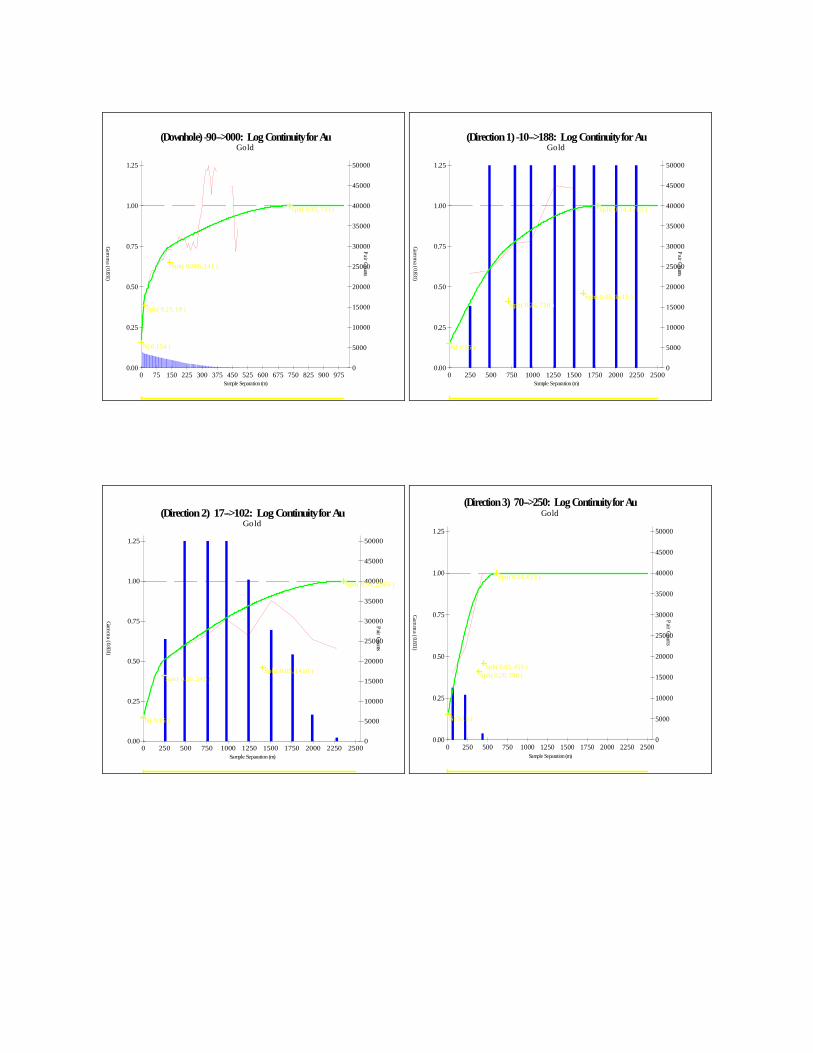
(Downhole) -90-->000: Log Continuity for AuGold
Sample Separation (m)
Gamm
a (0.831)
Pair Counts
0 75 150 225 300 375 450 525 600 675 750 825 900 9750.00
0.25
0.50
0.75
1.00
1.25
0
5000
10000
15000
20000
25000
30000
35000
40000
45000
50000
N( 0.154 )
Sph( 0.23, 18 )
Sph( 0.266, 141 )
Sph( 0.35, 733 )
(Direction 1) -10-->188: Log Continuity for AuGold
Sample Separation (m)
Gamm
a (0.831)
Pair Counts
0 250 500 750 1000 1250 1500 1750 2000 2250 25000.00
0.25
0.50
0.75
1.00
1.25
0
5000
10000
15000
20000
25000
30000
35000
40000
45000
50000
N( 0.15 )
Sph( 0.26, 710 )Sph( 0.05, 1610 )
Sph( 0.54, 1785 )
(Direction 2) 17-->102: Log Continuity for AuGold
Sample Separation (m)
Gamm
a (0.831)
Pair Counts
0 250 500 750 1000 1250 1500 1750 2000 2250 25000.00
0.25
0.50
0.75
1.00
1.25
0
5000
10000
15000
20000
25000
30000
35000
40000
45000
50000
N( 0.15 )
Sph( 0.26, 245 )Sph( 0.05, 1410 )
Sph( 0.54, 2365 )
(Direction 3) 70-->250: Log Continuity for AuGold
Sample Separation (m)
Gamm
a (0.831)
Pair Counts
0 250 500 750 1000 1250 1500 1750 2000 2250 25000.00
0.25
0.50
0.75
1.00
1.25
0
5000
10000
15000
20000
25000
30000
35000
40000
45000
50000
N( 0.15 )
Sph( 0.26, 390 )Sph( 0.05, 455 )
Sph( 0.54, 615 )
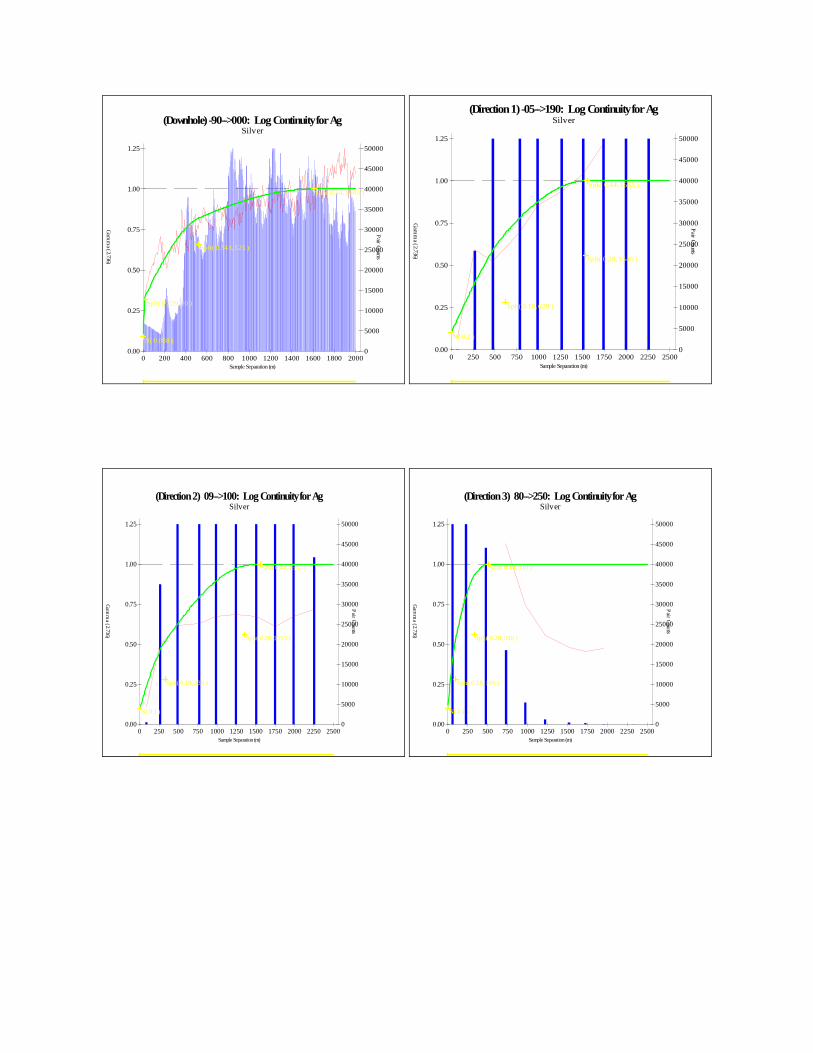
(Downhole) -90-->000: Log Continuity for AgSilver
Sample Separation (m)
Gamm
a (2.736)
Pair Counts
0 200 400 600 800 1000 1200 1400 1600 1800 20000.00
0.25
0.50
0.75
1.00
1.25
0
5000
10000
15000
20000
25000
30000
35000
40000
45000
50000
N( 0.088 )
Sph( 0.229, 20 )
Sph( 0.343, 525 )
Sph( 0.34, 1605 )
(Direction 1) -05-->190: Log Continuity for AgSilver
Sample Separation (m)
Gamm
a (2.736)
Pair Counts
0 250 500 750 1000 1250 1500 1750 2000 2250 25000.00
0.25
0.50
0.75
1.00
1.25
0
5000
10000
15000
20000
25000
30000
35000
40000
45000
50000
N( 0.1 )
Sph( 0.18, 620 )
Sph( 0.28, 1540 )
Sph( 0.44, 1555 )
(Direction 2) 09-->100: Log Continuity for AgSilver
Sample Separation (m)
Gamm
a (2.736)
Pair Counts
0 250 500 750 1000 1250 1500 1750 2000 2250 25000.00
0.25
0.50
0.75
1.00
1.25
0
5000
10000
15000
20000
25000
30000
35000
40000
45000
50000
N( 0.1 )
Sph( 0.18, 330 )
Sph( 0.28, 1355 )
Sph( 0.44, 1555 )
(Direction 3) 80-->250: Log Continuity for AgSilver
Sample Separation (m)
Gamm
a (2.736)
Pair Counts
0 250 500 750 1000 1250 1500 1750 2000 2250 25000.00
0.25
0.50
0.75
1.00
1.25
0
5000
10000
15000
20000
25000
30000
35000
40000
45000
50000
N( 0.1 )
Sph( 0.18, 100 )
Sph( 0.28, 330 )
Sph( 0.44, 510 )

Appendix G Kriging Parameters

Search Range 1 Range 2 Range 3(ft) (m) (m) (m)
1 1150 1 -13 -> 015 620 1540 1555Low Grade North 1150 2 -20 -> 105 0.26 0.15 330 0.23 1355 0.36 1555
Ag 380 3 -70 -> 250 100 330 5101 1350 1 -13 -> 015 710 1610 1785
Low Grade North 1170 2 -20 -> 105 0.21 0.24 245 0.05 1410 0.5 2365Au 460 3 -70 -> 250 390 455 6151 1150 1 -10 -> 188 620 1540 1555
Low Grade South 1150 2 17 -> 102 0.26 0.15 330 0.23 1355 0.36 1555Ag 380 3 70 -> 250 100 330 5101 1350 1 -10 -> 188 710 1610 1785
Low Grade South 1770 2 17 -> 102 0.21 0.24 245 0.05 1410 0.5 2365Au 460 3 70 -> 250 390 455 6152 1040 1 -13 -> 015 620 1540 1555
Main Zone North 1040 2 -20 -> 105 0.26 0.15 330 0.23 1355 0.36 1555Ag 340 3 -70 -> 250 100 330 5102 1190 1 -13 -> 015 710 1610 1785
Main Zone North 1580 2 -20 -> 105 0.21 0.24 245 0.05 1410 0.5 2365Au 410 3 -70 -> 250 390 455 6152 1040 1 -10 -> 188 620 1540 1555
Main Zone South 1040 2 17 -> 102 0.26 0.15 330 0.23 1355 0.36 1555Ag 340 3 70 -> 250 100 330 5102 1190 1 -10 -> 188 710 1610 1785
Main Zone South 1580 2 17 -> 102 0.21 0.24 245 0.05 1410 0.5 2365Au 410 3 70 -> 250 390 455 615
Sill 1 Sill 2 Sill 3Rocktype Dir Dip/Dip Direction Nugget
Appendix H Resource Estimate Summary Tables

Cutoff Grade Tonnage AgEQ Ag Grade Au Grade Tonnage AgEQ Ag Grade Au Grade Tonnage AgEQ Ag Grade Au Grade(oz/ton AgEq) (MT) (oz/ton) (oz/ton) (oz/ton) (MT) (oz/ton) (oz/ton) (oz/ton) (MT) (oz/ton) (oz/ton) (oz/ton)
5.00 0 0.0 0.0 0.000 0.06 5.2 4.2 0.015 0.06 5.2 4.2 0.0152.00 0 0.0 0.0 0.000 19.10 2.7 1.8 0.013 19.10 2.7 1.8 0.0131.75 0 0.0 0.0 0.000 27.46 2.4 1.5 0.013 27.46 2.4 1.5 0.0131.50 0 0.0 0.0 0.000 39.24 2.2 1.4 0.012 39.24 2.2 1.4 0.0121.25 0 0.0 0.0 0.000 52.60 2.0 1.2 0.011 52.60 2.0 1.2 0.0111.00 0 0.0 0.0 0.000 69.63 1.8 1.0 0.010 69.63 1.8 1.0 0.0100.75 0 0.0 0.0 0.000 89.24 1.6 0.9 0.010 89.24 1.6 0.9 0.0100.50 0 0.0 0.0 0.000 100.71 1.5 0.8 0.009 100.71 1.5 0.8 0.0090.25 0 0.0 0.0 0.000 102.52 1.4 0.8 0.009 102.52 1.4 0.8 0.0090.01 0 0.0 0.0 0.000 102.55 1.4 0.8 0.009 102.55 1.4 0.8 0.009
Measured Resource2004 Tonnage Grade Report by AgEq Cutoffs
Indicated Resource Total Measured + Indicated Resources
Cutoff Grade Tonnage AgEQ Ag Grade Au Grade(oz/ton AgEq) (MT) (oz/ton) (oz/ton) (oz/ton)
5.00 0.00 0.0 0.0 0.0002.00 14.71 2.4 1.6 0.0121.75 24.13 2.2 1.5 0.0111.50 36.06 2.0 1.3 0.0101.25 53.34 1.8 1.2 0.0091.00 85.55 1.5 1.0 0.0080.75 119.07 1.4 0.9 0.0070.50 174.65 1.1 0.7 0.0060.25 228.01 0.9 0.6 0.0050.01 281.35 0.8 0.5 0.004
2004 Tonnage Grade Report by AgEq Cutoffs Inferred Resources

Cutoff Grade Tonnage Ag Grade Au Grade AgEQ Tonnage Ag Grade Au Grade AgEQ Tonnage Ag Grade Au Grade AgEQ(oz/ton Ag) (MT) (oz/ton) (oz/ton) (oz/ton) (MT) (oz/ton) (oz/ton) (oz/ton) (MT) (oz/ton) (oz/ton) (oz/ton)
2.00 0 0.0 0.000 0.0 5.93 2.6 0.008 3.1 5.93 2.6 0.008 3.11.75 0 0.0 0.000 0.0 8.36 2.4 0.008 2.9 8.36 2.4 0.008 2.91.50 0 0.0 0.000 0.0 11.61 2.2 0.009 2.8 11.61 2.2 0.009 2.81.25 0 0.0 0.000 0.0 17.32 1.9 0.010 2.5 17.32 1.9 0.010 2.51.00 0 0.0 0.000 0.0 28.34 1.6 0.010 2.2 28.34 1.6 0.010 2.20.75 0 0.0 0.000 0.0 46.04 1.3 0.010 1.9 46.04 1.3 0.010 1.90.50 0 0.0 0.000 0.0 67.67 1.1 0.009 1.7 67.67 1.1 0.009 1.70.25 0 0.0 0.000 0.0 90.64 0.9 0.009 1.5 90.64 0.9 0.009 1.50.01 0 0.0 0.000 0.0 102.54 0.8 0.009 1.4 102.54 0.8 0.009 1.40.00 0 0.0 0.000 0.0 102.55 0.8 0.009 1.4 102.55 0.8 0.009 1.4
Measured Resource Indicated Resource Total Measured + Indicated Resources2004 Tonnage Grade Report by Ag Cutoffs
Cutoff Grade Tonnage Ag Grade Au Grade AgEQ(oz/ton Ag) (MT) (oz/ton) (oz/ton) (oz/ton)
2.00 2.72 2.4 0.007 2.81.75 5.72 2.1 0.008 2.61.50 11.42 1.9 0.008 2.31.25 20.89 1.6 0.008 2.11.00 40.48 1.4 0.007 1.80.75 68.52 1.2 0.006 1.60.50 100.53 1.0 0.006 1.40.25 177.74 0.7 0.005 1.10.01 264.01 0.5 0.005 0.80.00 285.08 0.5 0.004 0.8
Inferred Resources2004 Tonnage Grade Report by Ag Cutoffs

Cutoff Grade Tonnage Au Grade Ag Grade AgEQ Tonnage Au Grade Ag Grade AgEQ Tonnage Au Grade Ag Grade AgEQ(oz/ton Au) (MT) (oz/ton) (oz/ton) (oz/ton) (MT) (oz/ton) (oz/ton) (oz/ton) (MT) (oz/ton) (oz/ton) (oz/ton)
0.040 0 0.000 0.0 0.0 0.08 0.046 1.3 4.1 0.08 0.046 1.3 4.10.035 0 0.000 0.0 0.0 0.18 0.041 1.2 3.8 0.18 0.041 1.2 3.80.030 0 0.000 0.0 0.0 0.39 0.036 1.1 3.4 0.39 0.036 1.1 3.40.025 0 0.000 0.0 0.0 0.98 0.031 1.0 3.0 0.98 0.031 1.0 3.00.020 0 0.000 0.0 0.0 3.29 0.025 1.1 2.6 3.29 0.025 1.1 2.60.015 0 0.000 0.0 0.0 11.17 0.019 1.0 2.2 11.17 0.019 1.0 2.20.010 0 0.000 0.0 0.0 37.07 0.014 0.9 1.8 37.07 0.014 0.9 1.80.005 0 0.000 0.0 0.0 79.86 0.011 0.8 1.5 79.86 0.011 0.8 1.50.001 0 0.000 0.0 0.0 100.61 0.009 0.8 1.4 100.61 0.009 0.8 1.40.000 0 0.000 0.0 0.0 102.53 0.009 0.8 1.4 102.53 0.009 0.8 1.4
Total Measured + Indicated Resources2004 Tonnage Grade Report by Au Cutoffs
Measured Resource Indicated Resource
Cutoff Grade Tonnage Au Grade Ag Grade AgEQ(oz/ton Au) (MT) (oz/ton) (oz/ton) (oz/ton)
0.040 0.00 0.000 0.0 0.00.035 0.01 0.036 1.6 3.80.030 0.03 0.033 1.1 3.10.025 0.21 0.028 1.2 3.00.020 1.39 0.023 1.1 2.60.015 6.30 0.018 1.0 2.10.010 21.81 0.014 0.9 1.80.005 92.45 0.009 0.7 1.20.001 253.02 0.005 0.5 0.80.000 279.55 0.004 0.5 0.8
Inferred Resources2004 Tonnage Grade Report by Au Cutoffs

Appendix I 2003 Site Visit Photos

Water Well at Maverick Springs
View to the South from West of Lem Hill
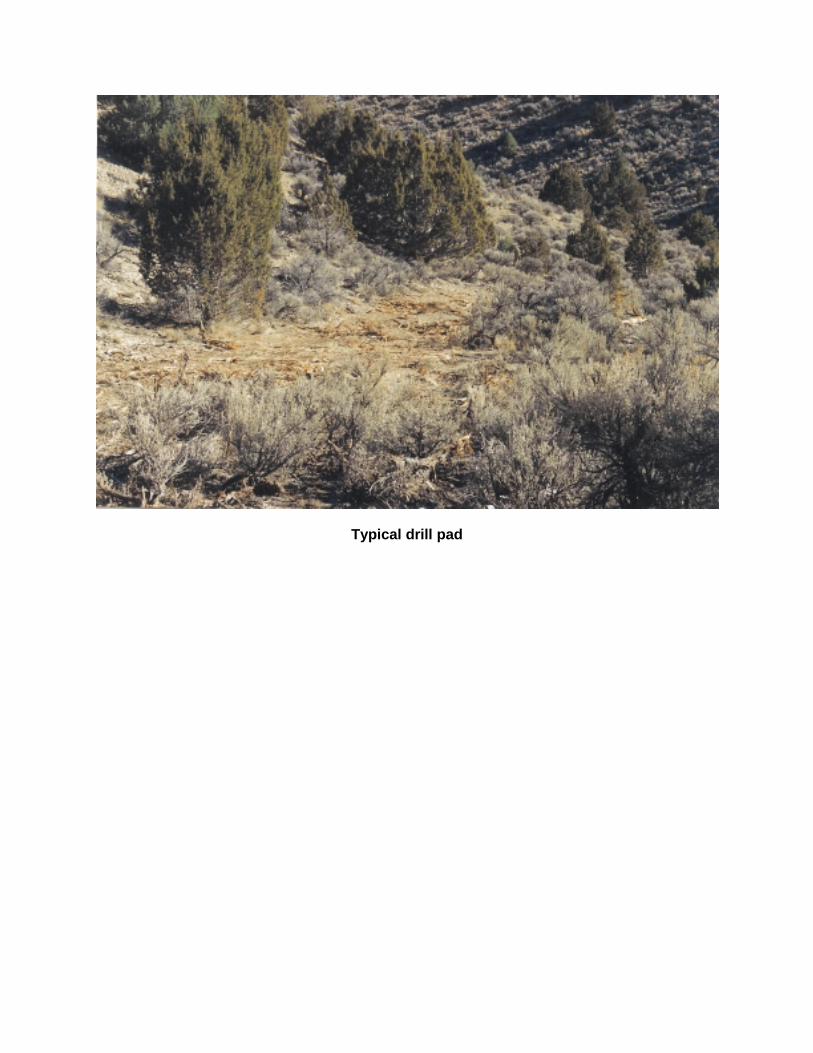
Typical drill pad

View to the West of access roads from Lem Hill
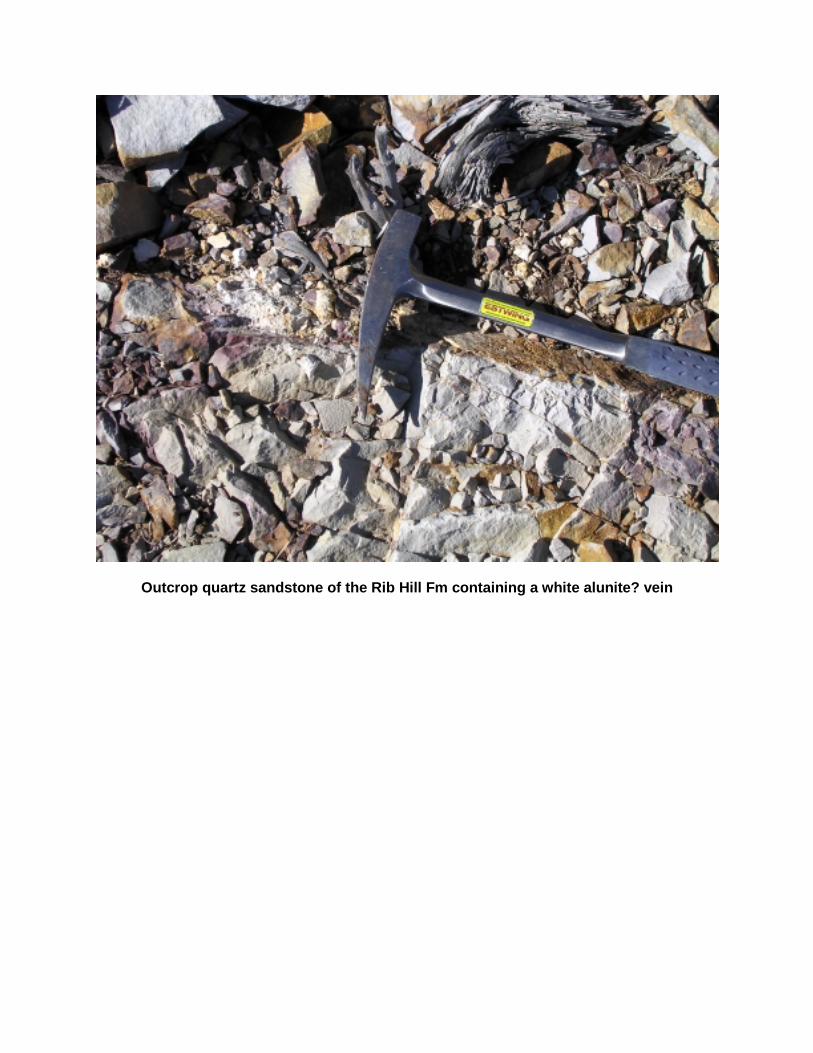
Outcrop quartz sandstone of the Rib Hill Fm containing a white alunite? vein
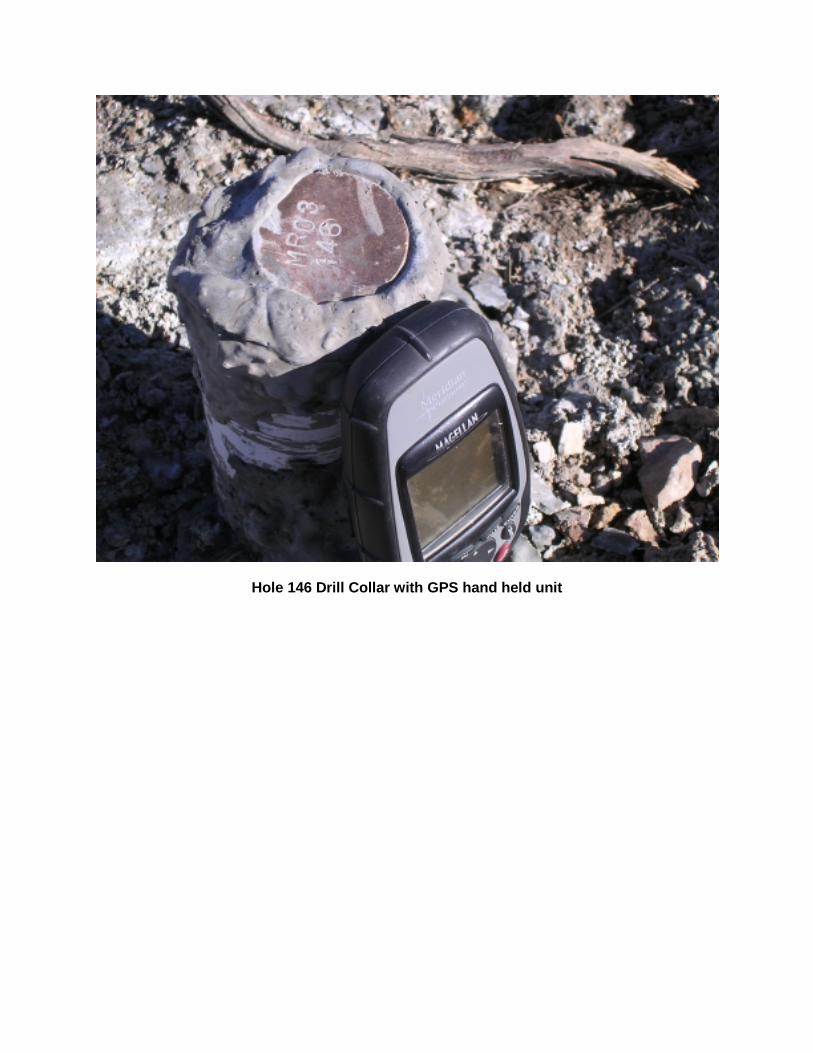
Hole 146 Drill Collar with GPS hand held unit

Hole 135 Drill Collar with GPS hand held unit