technical report 3.6 · 2019-03-19 · leachate at 32 active municipal solid waste landfi lls...
TRANSCRIPT

1NTH | Statewide Study on Landfi ll Leachate PFOA and PFOS Impact Technical Report
This report summarizes the results of a statewide study completed on behalf of the Michigan Waste & Recycling Association (MWRA) to determine levels of PFOA and PFOS in the leachate of those landfi lls participating in the study, and to estimate the leachate’s relative contribution to the total amount found in wastewater infl uent at water resource recovery facilities (WRRFs) (aka POTWs or publicly owned treatment works, or sewage or wastewater treatment plants). The study involved testing leachate at 32 active municipal solid waste landfi lls (Type II landfi lls) located throughout the state. This report presents general background information on PFAS, summarizes testing results, and summarizes available PFAS information from WRRFs that receive leachate and those that do not.
PFOA and PFOS are two compounds in a class of compounds known as Per- and polyfl uoroalkyl substances (PFAS). They have been used for over 50 years in household products such as non-stick coatings in cookware, in stain and water-resistant coatings and fabrics, and in industrial products such as fi refi ghting foam. More recently, certain PFAS compounds were identifi ed as having potentially adverse effects on human health and the environment. In general, PFAS compounds are resistant to natural degradation, and can therefore persist in the environment for a long time.
Each solid waste landfi ll in the study is licensed by the State of Michigan to accept household, commercial, and industrial solid waste generated by the communities they serve. Some of the wastes received for disposal contain PFAS. Leachate is the liquid that occurs in landfi lls when rainwater combines with moisture contained within the waste. Chemicals present in the waste may be present in the leachate. The leachate is effectively captured by utilizing engineered liner and active liquid collection systems. A common method of leachate management is through discharge to a local WRRF where it is handled with other household, commercial, and various industrial
wastewaters. In this way, leachate is managed in a closed system where there is no direct exposure to the public.
Landfi ll leachate sent to a WRRF is typically directly discharged via pipeline or stored in onsite tanks prior to being transferred to tanker trucks and hauled to the treatment facility. WRRFs are engineered structures that apply various technologies to treat wastewater to meet certain regulatory criteria prior to discharge of these waters.
In 2018, the Michigan Department of Environmental Quality (MDEQ) and various WRRFs requested that landfi lls test for PFAS in leachate as part of a statewide effort to better understand the presence of PFAS in the environment and to work toward plans for PFAS reduction, where needed. The information was also useful to examine the interdependent cycle of waste disposal, leachate generation, wastewater treatment, and wastewater sludge disposal.
Rather than participating landfi lls sampling and reporting individually, the MWRA (with MDEQ concurrence) conducted a collective study involving 32 active municipal solid waste landfi lls (Type II landfi lls) located throughout the state. This effort represents one of the largest studies conducted on active landfi ll leachate to-date. The main objective of the study was to gather information on PFOA and PFOS concentration in leachate at individual landfi lls and to examine its potential signifi cance to WRRF infl uent across the state.
NTH Consultants, Ltd, (NTH), a Michigan-based professional environmental and engineering consulting fi rm, conducted the MWRA study. NTH prepared this technical report that provides testing results for individual landfi lls, details of the sampling and analysis procedures, characteristic leachate discharge volumes, and available fl ow and PFAS testing information from the potentially-affected WRRFs.
Michigan Waste & Recycling AssociationStatewide Study on Landfi ll Leachate PFOA and PFOS Impact on
Water Resource Recovery Facility Infl uent
TECHNICAL REPORT Completed in Collaboration with Michigan Department of Environmental Quality
March 1, 2019 (Second Revision March 6, 2019)
1.0 INTRODUCTION & OVERVIEW

2NTH | Statewide Study on Landfi ll Leachate PFOA and PFOS Impact Technical Report
2.1 Status Of Regulatory Action In Michigan
Information on various adverse health effects associated with certain PFAS compounds has been evolving since the early 2000’s. Two of the most widely-utilized PFAS compounds, PFOA and PFOS, have received early environmental regulatory focus. These and related compounds have been used in thousands of applications worldwide. Largely for these reasons, the manufacture of PFOA and PFOS has been voluntarily phased-out in the United States.
In response to concerns regarding the increasingly common detection of PFAS in the environment, the Michigan PFAS Action Response Team (MPART) was formed by an Executive Directive issued by then-Governor Snyder in November 2017. MPART, a multiagency group, is comprised of a team of local, state, and federal agencies that are working to understand the exposure risks and ways to mitigate PFAS impacts to the environment.
MPART emphasizes the need for cooperation and coordination among agencies at all levels of government charged with identifying PFAS contaminants, informing the public, and mitigating the potential effects.
The EPA established a drinking water health advisory (HA) for PFOA and PFOS of 70 ppt in 2016. Although the HA is not an enforceable drinking water standard, it was established as a protective guidance for the most sensitive subpopulations over a lifetime of exposure. In January of 2018, the MDEQ incorporated the information contained in the HA and established the same 70 ppt value as groundwater cleanup criteria under Part 201, Environmental Remediation, of the Natural Resources and Environmental Protection Act, 1994 P.A. 451, as amended (Act 451). Currently, this value is used by the Michigan Department of Health and Human Services (DHHS) as guidance when evaluating PFAS concentrations in public and private drinking water supplies.
The MDEQ also promulgated Water Quality Standards (WQS) for PFOA and PFOS in surface water in May 2011 and March 2014, respectively. These WQS values were developed for use by MDEQ when evaluating permits for discharge to surface water and were promulgated in
accordance with the Part 4 Rule 57 administrative rules (Rule 57) pursuant to Water Resources Protection (Part 31) of Act 451. Michigan’s WQS values include chemical-specifi c values that represent the water quality values protective of aquatic life, human health, or wildlife; and acute chemical-specifi c values protective of aquatic life. The applicable most restrictive WQS values developed by the State are listed in below in Table 2-1, Rule 57 Values.
Other states have or are considering establishing regulatory limits for PFAS compounds. The variability in existing values between states is generally attributable to differences in the selection and interpretation of the choice of uncertainty factors, and the approach used for animal-to-human extrapolation mostly using the same key toxicity data. Differences in values between regulatory agencies may also be due to the choice of exposure assumptions, including the amount of water consumed, life stage used, and the relative source contributions (percentage exposure assumed to come from non-drinking water sources). All of this contributes to the overall uncertainty across the US in how to most appropriately establish risk-based criteria for these compounds and more consistency is needed in this important area.
2.0 REGULATORY STATUS AND GLOBAL LANDFILL LEACHATE CONCENTRATIONS
ChemicalsHNV
(non-drinking water*)
HNV (drinking water**)
PFOS 12 ppt 11 ppt
PFOA 12,000 ppt 420 ppt
HNV: Human Non-cancer Value
ppt: parts per trillion (laboratory reports in nanograms per liter (ng/L)
* “non-drinking water” means the surface water body receiving the discharge is not designated as a public drinking water source
** “drinking water” means the surface water body receiving the discharge is used as a public drinking water source
Table 2-1 – Rule 57 Values

3NTH | Statewide Study on Landfi ll Leachate PFOA and PFOS Impact Technical Report
2.2 Literature Summary Of PFOA & PFOS Concentrations In Landfi ll Leachate
To provide a basis for comparison of the results of the MRWA landfi ll leachate study, NTH completed a review of current literature regarding PFOA and PFOS concentrations in landfi ll leachate. Sources include professional journals, regulatory documents, and government agency websites. A summary of the information we reviewed is presented below.
2.2.1 Worldwide PFOA and PFOSLiterature review focused on documents published over the past 15 years. Two recent and comprehensive publications regarding PFAS concentrations in leachate includes a worldwide perspective by Hamid, et al (2018) and its associated multiple references, and the US-focused paper by Lang, et al (2017).
Unlike Hamid, et al (2018), Lang, et al (2017) focused on an evaluation of climatic effects on leachate PFAS concentrations and associated mass loading to municipal wastewater treatment plants located in the US. This study, which included 87 samples from 18 landfi lls, representing one of the largest databases of any similar investigation to date, demonstrates PFOA and PFOS concentrations in leachate generally have been decreasing over time, with greater rates of decline in humid regions (i.e., precipitation greater than 75 cm/year), which is where landfi lls that contain nearly half the annual volume of solid waste disposed in the US are located.
Hamid, et al (2018) compiled data from 11 selected literature sources, published between 2004 to 2017, that include PFAS leachate concentrations from landfi lls located in Australia, Canada, China, Denmark, Germany, Norway, Spain , Sweden, and the USA . Together, these sources comprise dozens of landfi lls with a total of more than 162 leachate samples.
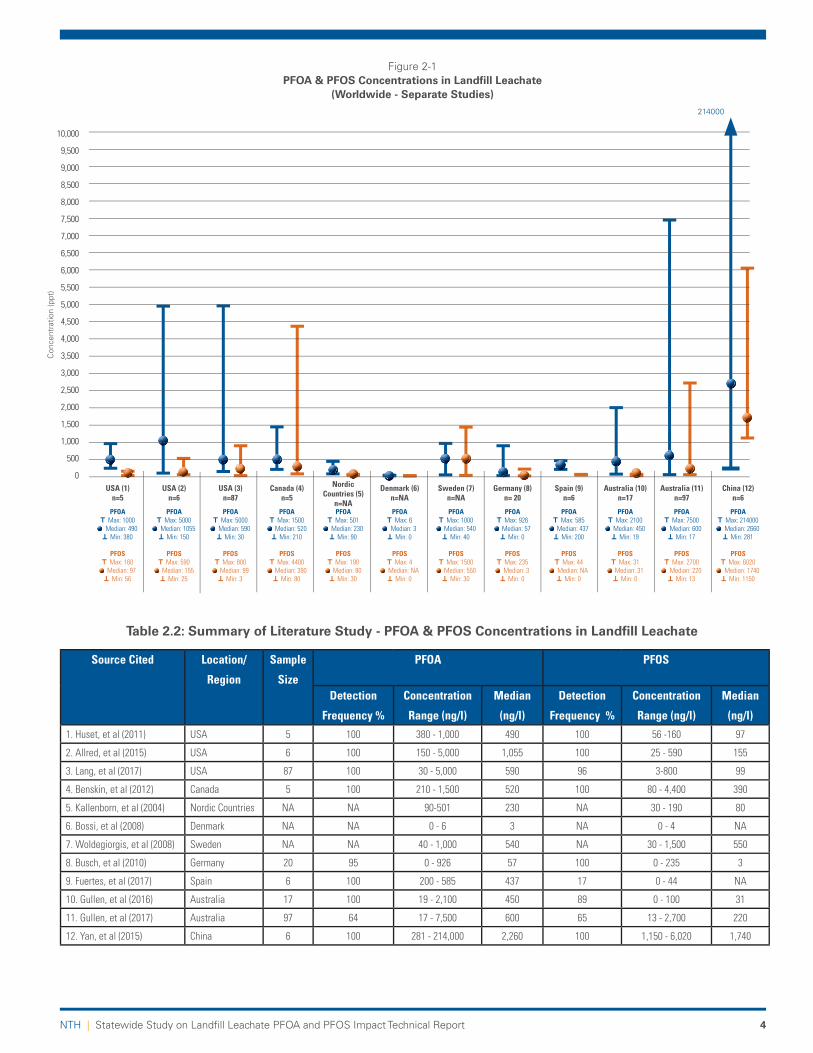
To summarize the PFOA and PFOS leachate results from these various studies, we prepared Table 2-2, Study of Literature Study derived from Hamid, et al.’s database (Supplemental Information Table 1) and information from the Lang (2017) et al. study. This information is graphically depicted on Figure 2-1, PFOA & PFOS Concentration in Landfi ll Leachate (Worldwide – Separate Studies).
Figure 2-2, PFOA & PFOS Concentrations in Landfi ll Leachate (By Region) summarizes the PFOA and PFOS ranges observed in each of the world regions. As shown, PFOA and PFOS concentrations in landfi ll leachate vary considerably in different regions of the world and likely refl ect the nature of the consumer products and industrial materials used, produced, and disposed in each country. The age of waste materials, as well as climatic conditions to which landfi lls are subject, appear important factors that govern the rate of degradation of PFAS materials to PFOA and PFOS, both considered “terminal” products of precursor compounds.
In summary, the preceding information reveals a wide range of leachate PFOA and PFOS concentrations worldwide including the United States. China’s values are much higher than elsewhere in the world, likely a result of their continued production of consumer goods (as well as industrial waste associated with related manufacturing processes) with PFAS compounds. These products are then distributed throughout the world for purchase, including in the US and eventually disposed.
4NTH | Statewide Study on Landfi ll Leachate PFOA and PFOS Impact Technical Report
Source Cited Location/
Region
Sample
Size
PFOA PFOS
Detection
Frequency %
Concentration
Range (ng/l)
Median
(ng/l)
Detection
Frequency %
Concentration
Range (ng/l)
Median
(ng/l)
1. Huset, et al (2011) USA 5 100 380 - 1,000 490 100 56 -160 97
2. Allred, et al (2015) USA 6 100 150 - 5,000 1,055 100 25 - 590 155
3. Lang, et al (2017) USA 87 100 30 - 5,000 590 96 3-800 99
4. Benskin, et al (2012) Canada 5 100 210 - 1,500 520 100 80 - 4,400 390
5. Kallenborn, et al (2004) Nordic Countries NA NA 90-501 230 NA 30 - 190 80
6. Bossi, et al (2008) Denmark NA NA 0 - 6 3 NA 0 - 4 NA
7. Woldegiorgis, et al (2008) Sweden NA NA 40 - 1,000 540 NA 30 - 1,500 550
8. Busch, et al (2010) Germany 20 95 0 - 926 57 100 0 - 235 3
9. Fuertes, et al (2017) Spain 6 100 200 - 585 437 17 0 - 44 NA
10. Gullen, et al (2016) Australia 17 100 19 - 2,100 450 89 0 - 100 31
11. Gullen, et al (2017) Australia 97 64 17 - 7,500 600 65 13 - 2,700 220
12. Yan, et al (2015) China 6 100 281 - 214,000 2,260 100 1,150 - 6,020 1,740
Table 2.2: Summary of Literature Study - PFOA & PFOS Concentrations in Landfi ll Leachate
Figure 2-1PFOA & PFOS Concentrations in Landfi ll Leachate
(Worldwide - Separate Studies)
10,000
9,500
9,000
8,500
8,000
7,500
7,000
6,500
6,000
5,500
5,000
4,500
4,000
3,500
3,000
2,500
2,000
1,500
1,000
500
0
Con
cent
ratio
n (p
pt)
PFOA Max: 214000
Median: 2660
Min: 281
PFOS Max: 6020
Median: 1740
Min: 1150
214000
China (12) n=6
USA (1)n=5
PFOA Max: 1000
Median: 490
Min: 380
PFOS Max: 160
Median: 97
Min: 56
Denmark (6)n=NA
PFOA Max: 6
Median: 3
Min: 0
PFOS Max: 4
Median: NA
Min: 0
Germany (8)n= 20
PFOA Max: 926
Median: 57
Min: 0
PFOS Max: 235
Median: 3
Min: 0
USA (2) n=6
PFOA Max: 5000
Median: 1055
Min: 150
PFOS Max: 590
Median: 155
Min: 25
Canada (4)n=5
PFOA Max: 1500
Median: 520
Min: 210
PFOS Max: 4400
Median: 390
Min: 80
Nordic Countries (5)
n=NAPFOA
Max: 501
Median: 230
Min: 90
PFOS Max: 190
Median: 80
Min: 30
Sweden (7)n=NA
PFOA Max: 1000
Median: 540
Min: 40
PFOS Max: 1500
Median: 550
Min: 30
Spain (9)n=6
PFOA Max: 585
Median: 437
Min: 200
PFOS Max: 44
Median: NA
Min: 0
Australia (10) n=17
PFOA Max: 2100
Median: 450
Min: 19
PFOS Max: 31
Median: 31
Min: 0
Australia (11) n=97
PFOA Max: 7500
Median: 600
Min: 17
PFOS Max: 2700
Median: 220
Min: 13
USA (3) n=87
PFOA Max: 5000
Median: 590
Min: 30
PFOS Max: 800
Median: 99
Min: 3

NTH | Statewide Study on Landfi ll Leachate PFOA and PFOS Impact Technical Report
Figure 2-2PFOA & PFOS Concentrations in Landfi ll Leachate
(By Region)
10,000
9,500
9,000
8,500
8,000
7,500
7,000
6,500
6,000
5,500
5,000
4,500
4,000
3,500
3,000
2,500
2,000
1,500
1,000
500
0
United States Europe Australia China
Con
cent
ratio
n (p
pt)
PFOA Max: 5000 Median: 712 Min: 30
PFOS Max: 800 Median: 117 Min: 3
PFOA Max: 1000 Median: 253 Min: 0
PFOS Max: 1500 Median: 211 Min: 0
PFOA Max: 7500 Median: 525 Min: 17
PFOS Max: 2700 Median: 126 Min: 0
PFOA Max: 214000 Median: 2660 Min: 281
PFOS Max: 6020 Median: 1740 Min: 1150
214000
5

6NTH | Statewide Study on Landfi ll Leachate PFOA and PFOS Impact Technical Report
This section includes information regarding the statewide PFAS sampling program participants, along with sample collection methods and analytical techniques. The sampling program included 32 sites located in the Lower and Upper Peninsulas of Michigan, as shown on the attached Figure 3-1, Site Location Map. Each site is an active, Type II, municipal solid waste landfi ll. As explained later in this report, we included three additional landfi lls with leachate data available for comparison as part of our overall evaluation. The locations of these three disposal facilities (i.e., City of Riverview Landfi ll, South Kent County Landfi ll, and Smiths Creek Landfi ll) are also shown on Figure 3-1.
3.1 Field Methods
3.1.1 Site Sampling Planning & CoordinationNTH working with Test America Laboratories (TAL) sampled leachate at the 32 MWRA-member landfi lls over a period of 14 days, beginning on Monday, November 19, 2018, and concluding on Wednesday, December 12, 2018. NTH accompanied TA staff during the fi rst 5 days of sampling to verify TAL followed MDEQ-recommended sampling methods and protocol in the guidance documents referenced below.
NTH contacted each of the 32 participating facilities and requested information including site contacts, leachate system discharge confi guration, access limitations, specialized site requirements, pretreatment installations, leachate discharge volume, and receiving WRRF locations. The relevant information from the sites is summarized on Table 3-1, Landfi ll Leachate Discharge Information.
Additionally, NTH prepared and distributed a sampling schedule based on logistical groupings to maximize effi ciency and coordinate acceptable sampling times at each site. NTH remained in contact with TAL to maintain the established schedule according to site-specifi c approvals. NTH provided TAL the compiled site information for use as a guide during the sampling to help streamline and prepare for the fi eld work.
3.1.2 Sampling Collection OverviewExperienced TAL fi eld staff completed leachate sampling with oversight by Mr. Michael McNamara (NTH) during
the fi rst 5 sampling days. Mr. McNamara previously completed PFAS sampling training conducted by the MDEQ in April 2018. The MDEQ training included fi eld-sampling of leachate and groundwater along with the collection equipment blanks using laboratory-supplied PFAS-free water (LSPFW). MDEQ has issued a number of draft guidance documents for PFAS sample collection, including:
• “Standard Operating Procedure – Collection of Landfi ll Leachate Samples for Analysis of Polyfl uorinated Alkyl Substances (draft),” dated April 2018,
• “Wastewater PFAS Sampling Guidance,” dated October 2018, and
• “General PFAS Sampling Checklist,” dated October 2018.
Both NTH and TAL reviewed and followed these documents during sampling activities. To maintain consistency and uniformity with the program sampling, TAL dedicated two experienced representatives (Gary Schafer and Zachary Nelson) to this project, who remained involved for the duration of the entire 32-site program, as indicated in Table 3-1. During the fi rst fi ve days of sampling, which included 14 of the 32 sites, NTH accompanied the designated TAL sampling crew and verifi ed that TAL followed the MDEQ PFAS-sampling protocols. A summary of the sampling procedures is included in Appendix A, Sampling and Testing Methods.
3.1.3 Sample AnalysisConsistent with MWRA’s agreement with MDEQ, the sample analysis for this study included PFOA and PFOS using EPA Method 537 (modifi ed). This was done to focus the study on the two compounds with Michigan Part 201 and Rule 57 standards. TA analyzed the samples at their Sacramento laboratory following their US EPA Method 537 (modifi ed) standard operating procedures (SOPs).
3.0 LEACHATE SAMPLING PROGRAM

Figure 3-1
C&C Expanded Sanitary Landfi ll
Granger Grand River Landfi ll
McGill Road Landfi ll
Granger Wood Street Landfi ll
Dafter Sanitary Landfi ll
Waters Landfi ll
Republic Services of Pinconning (Whitefeather)
Peoples Landfi ll, Inc.
Brent Run Landfi ll
Tri-City Recycling and Disposal Facility
Venice Park Recycling and Disposal Facility
Citizens Disposal
Eagle Valley Recycle and Disposal Facility
Smith’s Creek Landfi ll
Oakland Heights Development, Inc.
Pine Tree Acres, Inc.
Advanced Disposal Services Arbor Hills Landfi ll, Inc.
Sauk Trail Hills Landfi ll
Woodland Meadows RDF - Van Buren
Riverview Land Preserve
Carleton Farms Landfi ll
Vienna Junction Industrial Park Sanitary Landfi ll
K&W Landfi ll
Michigan Environs Inc.
Glens Sanitary Landfi ll
Manistee County Landfi ll, Inc.
Northern Oaks
Recycling and Disposal Facility
Central Sanitary Landfi ll, Inc.
Ottawa County Farms Landfi ll
Pitsch Sanitary Landfi ll
Autumn Hills Recycling and Disposal Facility
South Kent Landfi ll
SC Holdings
Orchard Hill Sanitary Landfi ll
Westside Recycling and Disposal Facility
LANDFILL SAMPLED AS PART OF THE MWRA-TESTING PROGRAM
LANDFILL WITH PUBLICLY-AVAILABLEPFOA AND PFOS DATA AVAILABLE
NTH | Statewide Study on Landfi ll Leachate PFOA and PFOS Impact Technical Report 7

MWRA-Member Landfi ll Designation Leachate Treatment Facility
LEACHATE DISCHARGE INFORMATION
Discharge Confi guration Pretreatment
Approximate Daily Dispos-
al Volume at WRRF (Gallons)
Discharge to Sanitary Sewer
ADVANCED DISPOSAL SERVICES ARBOR HILLS
LANDFILL INC
Ypsilanti Community Utilities Authority (YCUA)
Pump and Haul to CWT eventually discharges to GLWA (~38,000 gpd) Manhole to Sewer N/A 60,400
BRENT RUN LANDFILL Anthony Ragnone WWTP (Genesee County) Manhole to Sewer N/A 16,400
CITIZENS DISPOSAL Anthony Ragnone WWTP (Genesee County) Manhole to Sewer N/A 32,900
EAGLE VALLEY RECYCLE & DISPOSAL FACILITY Great Lakes Water Authroity WRRF (GLWA) Forcemain to Sewer N/A 32,900
GRANGER GRAND RIVER LANDFILL Southern Clinton County Utilities Authority (SCCMUA) Manhole to Sewer N/A 64,400
GRANGER WOOD STREET LANDFILL City of Lansing WWTP (Lansing) Manhole to Sewer N/A 19,200
OAKLAND HEIGHTS DEVELOPMENT INC Clinton River Water Resource Recovery Facility in Pontiac (CRWRRF) Manhole to Sewer N/A 17,800
PINE TREE ACRES INC Great Lakes Water Authroity WRRF (GLWA) Manhole to Sewer N/A 74,000
SAUK TRAIL HILLS LANDFILL Ypsilanti Community Utilities Authority (YCUA) Manhole to Sewer N/A 20,500
SC HOLDINGS City of Hastings WWTP (Hastings) Direct Discharge Ammonia Treatment 16,000
VENICE PARK RECYCLING & DISPOSAL FACILITY Anthony Ragnone WWTP (Genesee County) Two Manholes to Sewer N/A 32,900
WESTSIDE RECYCLING & DISPOSAL FACILITY City of Three Rivers WWTP (Three Rivers) Direct Discharge N/A 60,800
WOODLAND MEADOWS RDF-VAN BUREN Great Lakes Water Authroity WRRF (GLWA) Manhole to Sewer N/A 54,800
Pump and Haul to WRRF
AUTUMN HILLS RECYCLING AND DISPOSAL
FACILITY City of Grand Rapids WWTP (Grand Rapids) Loadout Pad N/A 54,800
DAFTER SANITARY LANDFILL City of Sault Ste. Marie WWTP (Sault St. Marie) Loadout Pad N/A 16,500
GLENS SANITARY LANDFILL Betsie Lake Utility Authority (BLUA) Loadout Pad Site Evaporator 3,800
K & W LANDFILL
Portage Lake Water and Sewage Authority's WWTF (Portage Lake)
Iron-Gogebic Wastewater Authority's Treatment Facility (Ironwood) Loadout Pad N/A 17,500
MANISTEE COUNTY LANDFILL INC
City of Ludington WWTP (Ludington) (approx 4,700 gpd) Loadout Pad N/A
4,700Packaging Corporation of America (PCA) - approx 30,000 gpd Loadout Pad N/A
MICHIGAN ENVIRONS INC City of Menominee WWTF (Menominee) Loadout Pad N/A 13,100
PITSCH SANITARY LANDFILL Belding WRRF (Belding), with Grand Rapids as a backup Loadout Pad N/A 15,000
TRI-CITY RECYCLING AND DISPOSAL FACILITY City of Sandusky WWTP (Sandusky) Loadout Pad N/A 9,600
Pump and Haul to Centralized Waste Treatment
ADVANCED DISPOSAL SERVICES ARBOR HILLS
LANDFILL INC
YCUA (60,400 gpd)
Pump and Haul to CWT eventually discharges to GLWA Loadout Pad N/A 38,000
C & C EXPANDED SANITARY LANDFILL Dart/Clean Earth in Detroit (DART) - GLWA Loadout Pad N/A 42,000
CARLETON FARMS LANDFILL Dart/Clean Earth in Detroit (DART) - GLWA Loadout Pad N/A 123,300
CENTRAL SANITARY LANDFILL INC SET Environmental Inc - Grand Rapids Loadout Pad N/A 30,100
MCGILL ROAD LANDFILL Usher Oil (Detroit) (Usher) - GLWA Loadout Pad N/A 13,700
NORTHERN OAKS RECYCLING AND DISPOSAL
FACILITY Plummer's Environmental Services - Wyoming, MI (Plummer's) Loadout Pad Site Evaporator 12,300
ORCHARD HILL SANITARY LANDFILL Third Party Pretreatment Facility in Holland, MI - Holland WRRF" Loadout Pad Reverse Osmosis 12,500
OTTAWA COUNTY FARMS LANDFILL SET Environmental Inc - Grand Rapids Loadout Pad N/A 82,200
PEOPLES LANDFILL INC Usher - GLWA Loadout Pad N/A 21,900
VIENNA JUNCTION INDUSTRIAL PARK SANITARY
LANDFILL
Half to City of Toledo - Toledo (Out of state so not included in total)
Half to Usher in Romulus, MI - GLWA Loadout Pad N/A 13,700
Pump and Haul to Deep Injection Well for Disposal
WHITEFEATHER LANDFILL Deep Injection Well In Pinconning -approx 12,600 gpd Loadout Pad N/A
Deep Well
Disposal - No
offsite leach-
ate disposal
WATERS LANDFILLNortheastern Exploration (Deep Well) in Johannesburg, MI-approx
8,200 gpdLoadout Pad Site Evaporator
Deep Well
Disposal -
No offsite
leachate
disposal
Table 3-1Landfi ll Leachate Generation & Disposal Methods
8

9NTH | Statewide Study on Landfi ll Leachate PFOA and PFOS Impact Technical Report
3.2 Leachate Disposal Methods, Daily Leachate Volume, & Receiving WRRFs
In this section, we present details regarding leachate disposal methods, annual leachate volumes, and the water resource recovery facilities (WRRFs) that treat leachate generated by the participating landfi lls, including relevant summary tables and graphics.
3.2.1 Disposal Methods We obtained disposal information from a pre-sampling questionnaire completed by each facility owner representative. Based on the compiled data included in Table 3-1, the participating landfi lls manage leachate either by direct sanitary sewer discharge (DSD); pump-and-haul (PAH) for discharge; deep well injection (DWI); or a combination of these three methods. One site, Orchard Hill Landfi ll, primarily treats leachate for direct discharge to surface water using a reverse-osmosis (RO) system or whenever necessary, manages leachate by PAH. Figure 3-2, Statewide Leachate Disposal Methods illustrates thepercentage by leachate volume of each disposal methodutilized by the participating landfi lls.
3.2.2 Daily Leachate VolumesEach site representative accessed their respective site Operating Records that include leachate fl ow measurements. The average daily leachate volumes by site, are included on Table 3-1. As indicated on Table 3-1 and graphed on Figure 3-3, Average Daily Leachate Volume Managed at Michigan WRRFs, the leachate volume discharged to WRRFs varies, ranging from approximately 3,800 gallons per day (gpd) at Glen’s Sanitary Landfi ll to approximately 123,000 gpd at Carleton Farms Landfi ll. The daily fl ow from all 32 landfi lls is just over 1 million gallons. In general, the larger landfi lls produce more leachate than smaller ones, but other factors affect leachate generation including timing of cell closures, new cell development, leachate minimization practices, precipitation and recirculation.
3.2.3 Receiving WRRFs As summarized on Table 3-1, with the exception of DWI, leachate from the original 32 MWRA-member landfi lls participating in this study are ultimately discharged to a WRRF, regardless of disposal/conveyance/pretreatment method employed. Statewide, the leachate from 18 facilities (more than half the participating sites) is managed at one of the fi ve following, relatively large, regional WRRFs located in the southern half of Michigan’s Lower Peninsula
1. Great Lakes Water Authority in Detroit (GLWA), usedby nine landfi lls,
2. Clinton River Water Resource Recovery in Pontiac(CRWRR), used by one landfi ll;
3. Grand Rapids Water Resource Recovery (GRWRR),used by four landfi lls
4. Anthony Ragnone Wastewater Treatment Plant nearFlint (Ragnone), used by three landfi lls
5. Ypsilanti Community Utilities Authority (YUCA), usedby two landfi lls (one of these landfi lls also PAH toGLWA).
Leachate from the remaining 12 participating landfi lls is managed at individual, local and generally smaller-scale WRRFs, primarily located in less-densely populated regions of the state (e.g., Mid-Michigan, SW-Michigan, Northern-Michigan, and various locations in the Upper Peninsula), as indicated in Table 3-1.
Figure 3-2Statewide Leachate Disposal Methods(Percentage based on gallons treated)
Direct Sanitary Discharge
Pump and Haul to WRRF
Pump and Haul to Centralized Water Treatment
Reverse Osmosis
Deep Well Injection
47%47%
26%26%
22%22%
3%3%2%2%
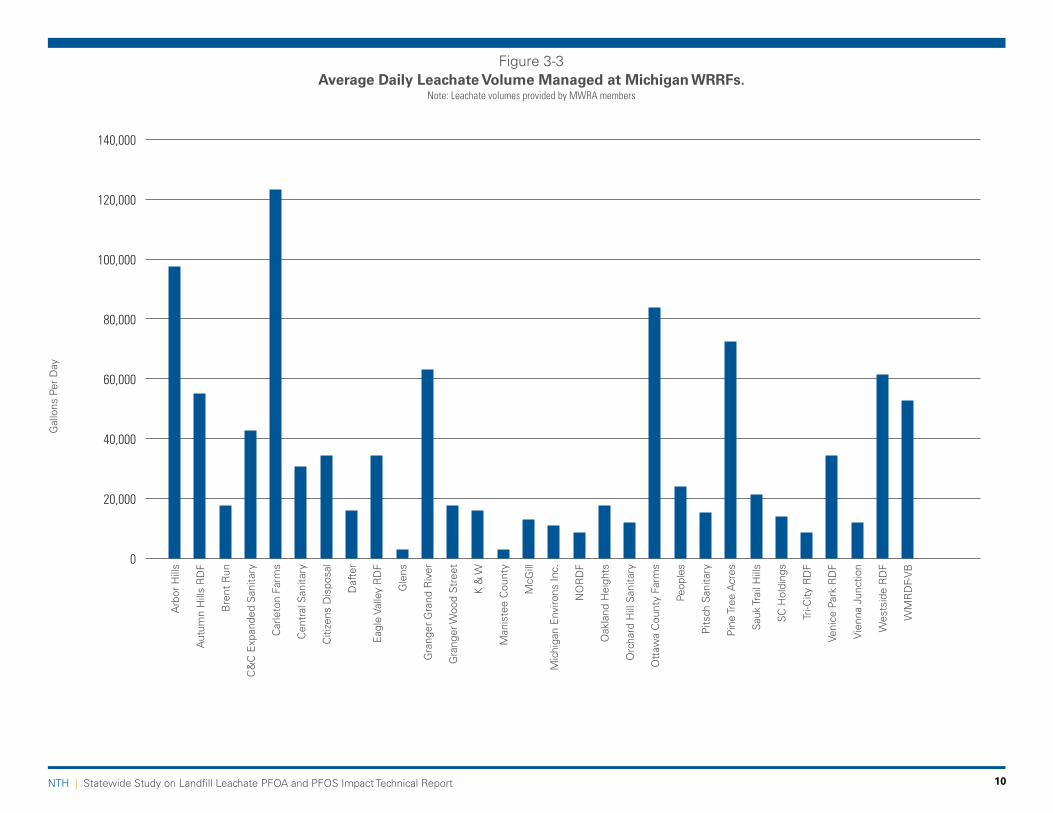
Figure 3-3Average Daily Leachate Volume Managed at Michigan WRRFs.
140,000
120,000
100,000
80,000
60,000
40,000
20,000
0
Gal
lons
Per
Day
Arb
or H
ills
Aut
umn
Hill
s R
DF
Bre
nt R
un
C&
C E
xpan
ded
San
itary
Car
leto
n Fa
rms
Cen
tral
San
itary
Citi
zens
Dis
posa
l
Daf
ter
Eag
le V
alle
y R
DF
Gle
ns
Gra
nger
Gra
nd R
iver
Gra
nger
Woo
d S
tree
t
K &
W
Man
iste
e C
ount
y
McG
ill
Mic
higa
n E
nviro
ns In
c.
NO
RD
F
Oak
land
Hei
ghts
Orc
hard
Hill
San
itary
Ott
awa
Cou
nty
Farm
s
Peop
les
Pits
ch S
anita
ry
Pin
e Tr
ee A
cres
Sau
k Tr
ail H
ills
SC
Hol
ding
s
Tri-C
ity R
DF
Veni
ce P
ark
RD
F
Vie
nna
Junc
tion
Wes
tsid
e R
DF
WM
RD
F-V
B
Note: Leachate volumes provided by MWRA members
NTH | Statewide Study on Landfi ll Leachate PFOA and PFOS Impact Technical Report 10

11NTH | Statewide Study on Landfi ll Leachate PFOA and PFOS Impact Technical Report
This section includes the leachate laboratory results and our analyses and evaluation of the leachate PFOA and PFOS concentrations from samples collected during this study. As mentioned previously, PFOA and PFOS data were publicly available in MiWaters.com (MiWaters) for three landfi lls outside of this study; for completeness, we also evaluated those data below. This results in 35 landfi lls that represent the majority of the 45 active solid waste disposal facilities in Michigan. We focus our presentation on statewide summary statistics, comparisons to worldwide leachate concentrations, and the total leachate PFOA and PFOS discharged to WRRFs to estimate the percentage of the total mass of these compounds contributed to WRRFs statewide.
A discussion of the laboratory sample processing and analytical methods, quality control protocol, and data validation process are summarized in Appendix A.
4.1 Summary of All Landfi lls and Water Resource Recovery Facilities Included in this Study
As indicated previously, the original scope of this study included evaluating the leachate PFOA and PFOS content and their effect on the overall infl uent concentrations and mass at receiving WRRFs for the 32 participating landfi lls. For completeness, the scope was expanded to evaluate available PFOA and PFOS data for all active Type II landfi lls and all Michigan WRRFs (those that accept leachate and those that do not). The resulting database used as part of NTH’s analyses and evaluation presented in this section is summarized in Table 4-1A, Summary of Landfi ll Data
Utilized and Table 4-1B, Summary of WRRF Data Utilized, below.
For additional details and reference, we prepared a schematic, or fl owchart (presented in Appendix B: Source Data Flowchart), which combines the information provided in Tables 4-1A and 4-1B related to the source of all data used in this report and the basis of our analyses and evaluations in this section.
Taken together, as indicated on Table 4-1A, the study considers 35 landfi lls with available data (out of the 45 active Type II Michigan landfi lls). [For reference the remaining 10 Type II landfi lls are listed in a table included in Appendix B.]
For WRRF data, we relied on publicly available information provided by MiWaters. Some WRRFs accept leachate from several landfi lls and others only a single disposal facility, and some do not accept any leachate. We also note that MiWaters’ infl uent PFOA and PFOS data set is incomplete; not all WRRFs included information for both compounds. As indicated in Table 4-1B, WRRF PFOA and or PFOS infl uent data are available for 39 (out of Michigan’s 95 total operating treatment facilities with industrial pretreatment programs). As also indicated in Table 4-1B, 68 of these WRRFs do not accept landfi ll leachate and 27 WRRFs do accept leachate. Of the 27 WRRFs accepting leachate, 13 had available infl uent data.
4.0 LABORATORY RESULTS, DATA ANALYSES AND EVALUATION
MWRA-member Landfi lls Included in this study
Other Active Type II Landfi lls included in this study
Total No. of Active Type II Landfi lls include in this study
TType II Active Landfi lls without PFAS data - not evaluated in this study
32 3 35 10
Table 4-1ASummary of Landfi ll PFOA/PFOS Data Utilized
WRRFs with PFOA/PFOS data that manage MWRA-member landfi ll
leachate
Total WRRFs with PFOA/PFOS data that manage leachate from other
active Type II Landfi lls
WRRFs with PFOA/PFOS data that do not manage Leachate from active Type II Landfi lls
Total WRRFs with PFOA/PFOS data included in this Study
11 7 16 34
Table 4-1BSummary of WRRF PFOA/PFOS With Infl uent Data Evaluated in This Study

12NTH | Statewide Study on Landfi ll Leachate PFOA and PFOS Impact Technical Report
4.2 Statewide PFOA and PFOS Leachate Concentrations
Analytical data reports prepared by TAL, are contained in Appendix C, Analytical Data Reports. Table 4-2A, PFOA and PFOS Concentrations and Mass in Active Type II Landfi lls Leachate presents the concentrations of these PFAS compounds detected in 39 separate leachate samples collected from 35 active Type II landfi lls located in Michigan. We note three landfi lls included two or more leachate samples/locations (Venice Park, two samples; Riverview LF, three samples; and South Kent County LF, two samples).
As shown on Table 4-2A, PFOA concentrations for the MWRA participating landfi lls ranged from 240 ppt to 3,200 ppt. For all 35 Michigan active Type II landfi lls with data the PFOA concentration ranged from 16 ppt to 3,200 ppt with the lowest concentration in leachate detected in a Western-Michigan landfi ll and greatest concentration at a SE-Michigan landfi ll. The median PFOA leachate concentration was 1,000 ppt and the “average” concentration was approximately 1,187 ppt.
For PFOS, the leachate concentrations ranged from 100 to 710 ppt for the MWRA 32 participating landfi lls. For all 35 Michigan active Type II landfi lls with data the PFOS concentration ranged from 9 to 960 ppt, and the median value is 220 ppt. The lowest PFOS concentration was detected in leachate from a SE-Michigan landfi ll; the greatest from a Western-Michigan landfi ll. The average PFOS concentration was 287 ppt and the median concentration was 220 ppt.
4.3 MWRA Landfi ll Leachate PFOA & PFOS Concentrations Compared To Other Studies
Table 4-3, Michigan vs. Worldwide PFOA and PFOS Leachate Concentration Ranges compares ranges of PFOA and PFOS leachate concentrations observed as part of this study (“Michigan”) to the ranges reported for other areas, based on the literature review discussed in Section 2.1. As shown, the worldwide leachate range for PFOA concentrations, is non-detect to 214,000 ppt and the corresponding PFOS range is non-detect to 6,020 ppt.
As indicated in Table 4-3, Michigan’s PFOA and PFOS ranges are within those observed in the US based on available published literature. The Michigan PFOS concentration range is consistent with that reported in other Western world regions, but nearly an order-of-magnitude lower than what is reported for China. The apparent reason China’s concentrations are greater is their continued use of PFAS compounds in consumer-goods
manufacturing.
4.4 Leachate PFOA And PFOS Concentrations vs. MDEQ Criteria
As indicated in Section 2.1, Michigan has established both groundwater clean-up criteria and surface water quality standards (WQS) for PFOA and PFOS. The Michigan Part 201 groundwater cleanup criteria for PFOA and PFOS is 70 ppt, either individually or as a combined limit. This is not an enforceable standard for public drinking water supplies but has been used in Michigan as a protective guideline during site investigations.
The Rule 57 PFOA WQS is 420 ppt for surface water that may be used as a drinking water (DW) source and 12,000 ppt for non-drinking water (NDW) sources. For PFOS, the WQS for drinking and non-drinking water sources are 11 ppt and 12 ppt, respectively.
It is not appropriate regulatory policy to compare the leachate results to surface water quality standards (WQS) because leachate is not being discharged to surface water. Nevertheless, the WQS are used as a means of putting the leachate results in some context.
Individually, as shown on Table 4-2A, the concentration of PFOA in leachate collected from two landfi lls during this study are below the 420 ppt DW WQS as are the concentrations from two samples from two separate landfi lls with data obtained from MiWaters. The other samples are above the 420 ppt value. The concentration of PFOA in the leachate from all sites was considerably lower than the 12,000 ppt NDW WQS. The concentration of PFOS at all locations exceeded the DW and NDW WQS.
Region PFOA(ppt)
PFOS (ppt)
Michigan* 16 to 3,200 9 to 960
United States 30 to 5,000 3 to 800
Europe ND to 1,000 ND to 1,500
Australia 17 to7,500 13 to 2,700
China 281 to 214,000 1,150 to 6,020
Worldwide Range ND to 214,000 ND to 6,020
Table 4-3Michigan vs. Worldwide PFOA and PFOS Leachate
Concentrations Ranges
* Based on leachate analyses from 32 MWRA-member landfi lls participating in this statewide study and leachate data obtained on MiWaters.com.

13NTH | Statewide Study on Landfi ll Leachate PFOA and PFOS Impact Technical Report
MWRA ParticipatingLandfi ll Designation
Average Leachate Volume GPD
PFOA (ppt)
PFOS (ppt)
"PFOA Daily Mass
(lb/day)"
"PFOS Daily Mass
(lb/day)"
Arbor Hills Landfi ll 98,400 3200 220 0.0026 0.00018
Autumn Hills RDF 54,800 1300 380 0.0006 0.00017
Brent Run Landfi ll 16,400 540 110 0.0001 0.00002
C&C Expanded Sanitary Landfi ll 42,000 1300 450 0.0004 0.00015
Carleton Farms Landfi ll 123,300 1800 250 0.0018 0.00026
Central Sanitary Landfi ll 30,100 2500 470 0.0006 0.00012
Citizen's Disposal Inc. 32,900 1100 180 0.0003 0.00005
Dafter Sanitary Landfi ll 16,500 680 130 0.0001 0.00002
Eagle Valley RDF 32,900 490 170 0.0001 0.00005
Glens Sanitary Landfi ll 3,800 770 210 0.00002 0.00001
Granger Grand River Landfi ll 64,400 240 160 0.0001 0.00009
Granger Wood Street Landfi ll 19,200 470 110 0.0001 0.00002
K&W Landfi ll 17,500 830 170 0.0001 0.00002
Manistee County Landfi ll 4,700 420 220 0.000016 0.000009
McGill Road Landfi ll 13,700 760 170 0.0001 0.00002
Michigan Environs Inc. (Menominee) 13,100 1400 100 0.0002 0.00001
Northern Oaks RDF 12,300 1000 220 0.0001 0.00002
Oakland Heights Development 17,800 780 230 0.0001 0.00003
Orchard Hill Sanitary Landfi ll 12,500 650 110 0.0001 0.00001
Ottawa County Farms Landfi ll 82,200 1800 530 0.0012 0.0004
People's Landfi ll 21,900 2500 710 0.0005 0.00013
Pine Tree Acres RDF 74,000 1800 430 0.001 0.0003
Pitsch Sanitary Landfi ll 15,000 1300 260 0.0002 0.00003
Sauk Trail Hills Landfi ll 20,500 2800 610 0.0005 0.00010
SC Holdings 16,000 960 410 0.0001 0.00005
Tri-City RDF 9,600 1200 160 0.0001 0.00001
Venice Park RDF MH#20*32,900
910 1900.0007 0.0002Venice Park RDF MH#21* 1500 630
Vienna Junction Industrial Park Sanitary Landfi ll 13,700 1300 130 0.0001 0.00001
Waters Landfi ll NONE 930 230 NONE NONE
Westside RDF 60,800 1300 160 0.0007 0.00008
Whitefeather Landfi ll NONE 1700 550 NONE NONE
Woodland Meadows RDF -Van Buren 54,800 2000 510 0.0009 0.00023
Other Active Type II Landfi ll Leachate Data Obtained from MIWaters
PFOA (ppt)
PFOS (ppt)
PFOA Daily Mass(lb/day)
PFOS Daily Mass(lb/day)
Riverview 003*Riverview 004*Riverview 007* 37,400
190086038
2701408.5 0.0003 0.00004
South Kent Outfall*South Kent Hauled* 48,000
72516
960130 0.0001 0.0002
Smith's Creek Landfi ll* 32,900 510 120 0.0001 0.00003
minimummaximum
medianaverage
n
1632001000118639
996022028739
0.0000160.0030.00010.0004
33
0.0000070.0004
0.000050.0001
33
Table 4-2AConcentrations and Mass of PFOA AND PFOS
Michigan Active Type II Landfi lls’ Leachate
Notes: 1. There are a total 45 Active Type II Landfi lls in Michigan; 35 are represented in this table.
* - These facilities reported multiple laboratory results. In these cases, we calculated mass based on the averaged concentrations for PFOA and PFOS.
2. Riverview, South Kent, and Smith’s Creek leachate are managed by the Downriver, Wyoming, and Port Huron WRRFs, respectively.

14NTH | Statewide Study on Landfi ll Leachate PFOA and PFOS Impact Technical Report
4.5: Statewide PFOA and PFOS WRRF Infl uent Concentrations
WRRFs serve all users within their respective service areas. Landfi ll leachate mixes with other wastewater from homes and workplaces, as well as public and private facilities (e.g., churches, restaurants and stores), that is delivered via municipal sanitary sewer networks. The WRRF treats the combined wastewater before adequately-treated water is discharged to a local surface water body or via infi ltration beds.
Although very effective at removing bacteria, pathogens, and most undesirable chemicals present in wastewater, most WRRFs are not currently designed to signifi cantly remove PFOA and PFOS.
Table 4-2B, WRRF Infl uent PFOA & PFOS Concentrations & Daily Mass, summarizes available data obtained from MiWaters organized by three groups. “Group A” includes the 14 (11 with available data) WRRFs that accept leachate from MWRA-member landfi lls; “Group B” nine (8 with data) that represent WRRF’s that accept leachate from other active Type II landfi lls; and “Group C” 39 (20 with data) identify WRRFs that do not accept leachate from active Type II landfi lls.
Reviewing all three groups, PFOA infl uent concentrations ranged from non-detect (ND) at eight WRRFs to 64.6 ppt.
The median PFOA infl uent concentration was 5.06 ppt and the average was 10.3 ppt, based on 31 sample with reported detections.
For PFOS in all groups, infl uent concentrations ranged from ND (at the same six WRRFs as before) to approximately 500 ppt. The median and average PFOS infl uent concentrations were 8.6 ppt and 34.5 ppt respectively, based on 29 samples with results above the method detection limit (MDL).
Figure 4-1A, WRRF Gross Infl uent PFOA Concentrations, graphically depicts available data for infl uent PFOA concentrations at WRRFs that accept leachate from active Type II landfi lls and those that do not, categorized by the groupings described above and on the graphic. Based on visual analyses of Figure 4-1A, we note that all infl uent values (Group A, Group B, and Group C) were below the most stringent 420 ppt PFOA WQS.
Figure 4-1B, WRRF Gross Infl uent PFOS Concentrations, depicts available data for infl uent PFOS concentrations at WRRFs that accept leachate from active Type II landfi lls and those that do not, categorized by the groupings described above and on the graphic. Based on visual analyses of Figure 4-1B, we note that more than half (12 of 19) of the WRRFs that accept landfi ll leachate (Group A and Group B) were below 11 ppt, the most stringent WQS for PFOS.
Figure 4-1AWRRF Gross Infl uent PFOA Concentrations
At WRRFs that Accept and Do Not Accept Active Type II Leachate
100
90
80
70
60
50
40
30
20
10
0
PFO
A C
once
ntra
tion
(ng/
L)
PFOA (ng/L) in WRRF Infl uent
(WRRF Receives Leachate)
PFOA (ng/L) in WRRF Infl uent
(WRRF Does NOT Accept Leachate)
“Group A”WRRFs With Active Type II Leachate Contribution
(from MWRA-member active
landfi lls sampled as part of study)
“Group B”WRRFs With Active Type II Leachate
Contribution (from other active landfi lls that
were not sampled as part of this study)
“Group C”WRRFs Without Active Type II Leachate Contribution
Men
omin
ee
CR
WR
FF
Gen
esse
e C
o-R
agno
ne
GLW
A
Gra
nd R
apid
s
Hol
land
Lans
ing
San
dusk
y
Thre
e R
iver
s
Wyo
min
g
YC
UA
Bay
Cit
y
Dow
nriv
er
Flin
t
Kal
amaz
oo
Mus
kego
n C
o. M
etro
Nor
th K
ent
Port
Hur
on
SH
UVA
Alp
ena
Ann
Arb
or
Bro
nson
Com
mer
ce T
wp.
Del
hi T
wp.
Dex
ter
East
Lan
sing
Gay
lord
Gen
esee
Co.
#3
How
ell
Ioni
a
Jaks
on
Lape
er
Lyon
Tw
p.
Mar
quet
te
Mon
roe
Sag
inaw
Taw
as U
A
War
ren
Wix
om
NDND ND ND ND ND ND ND
Notes 1. PFOS infl uent concentrations obtained from MIWaters.com.
2. ND = Not detected above laboratory reporting limit.
3. PFOA surface water standard is 420 ppt (not depicted on this chart).

15NTH | Statewide Study on Landfi ll Leachate PFOA and PFOS Impact Technical Report
4.6 PFOA & PFOS Leachate and WRRF Mass Comparison
In order to estimate the mass contribution of PFOA and PFOS in landfi ll leachate to the total WRRFs infl uent mass that were evaluated in the study, we again relied on information available from MWRA-member landfi lls (combined with data available for other landfi lls) and data provided via MiWaters (for infl uent and WRRF design fl ows). This information was used to calculate an estimated mass contribution of PFOA and PFOS from each landfi ll to their associated WRRF. We also estimated the total mass contribution of PFOA and PFOS from all study landfi lls and other wastewater sources that contribute to WRRF infl uent.
4.6.1: Infl uent Leachate PFOA and PFOS MassTable 4-2A, summarizes the calculated daily mass of PFOA in leachate from 33 landfi lls (2 landfi lls do not discharge to WRRFs) included in this study. The total daily PFOA estimated mass from all 33 landfi lls’ leachate was 0.014 lb. Daily mass for PFOA was from a low of 0.000016 lb. (Northern-Michigan landfi ll) to a high of 0.0026 lb. (SE-Michigan landfi ll). The median daily PFOA mass was 0.0001 lb. and the average daily PFOA mass was 0.0004 lb. These small mass values illustrate that although some of the concentration results appear
high when viewed in parts per trillion values, the mass contributions are actually quite low.
The calculated daily mass of PFOS in leachate from the 33 landfi lls is also include on Table 4-2A. The total daily PFOS estimated mass in leachate from all 33 landfi lls’ leachate was 0.0031 lb. The daily mass ranged from a low of 0.000007 lb. (Northern-Michigan landfi ll) to a high of 0.0004 lb. (Western Michigan Landfi ll). The median daily PFOS mass was 0.00005 lb. and the average daily mass for PFOS was 0.0001 lb.
4.6.2: WRRF PFOA and PFOS MassTable 4-2B, provides a summary of all WRRFs used in our analyses. We note that the infl uent fl ow calculation is based on the WRRF design fl ow capacity provided in each WRRF’s NPDES permit. This design fl ow was used since actual fl ow information is not known or published via MiWaters. Further, we note that most of the WRRF infl uent mass calculations rely on a single or very limited number of samples. Based on these considerations, the calculated masses are provided as estimates and actual mass may fl uctuate over time, depending on a number of inter-related factors (e.g., precipitation, seasonality, etc.)
From Table 4-2B, based on 27 results, estimated daily WRRF infl uent PFOA mass ranged from non-detect
Figure 4-1BWRRF Gross Infl uent PFOS Concentrations
At WRRFs that Accept and Do Not Accept Active Type II Leachate
550
500
450
400
350
300
250
200
150
100
50
0
Notes 1. PFOS infl uent concentrations obtained from MIWaters.com
2. ND = Not detected above laboratory reporting limit
PFO
S C
once
ntra
tion
(ng/
L)
PFOS (ppt) in WRRF Infl uent
(WRRF Receives Leachate)
PFOS (ppt) in WRRF Infl uent
Ioni
a(G
roup
C)
Wix
om
(Gro
up C
)
“Group A”WRRFs With Active Type II Leachate Contribution
(from MWRA-member active
landfi lls sampled as part of study)
“Group B”WRRFs With Active Type II Leachate
Contribution (from other active land-
fi lls that were not sampled as part of
this study)
“Group C”WRRFs Without Active Type II Leachate Contribution
Men
omin
ee
CR
WR
FF
Gen
esse
e C
o-R
agno
ne
GLW
A
Gra
nd R
apid
s
Hol
land
Lans
ing
San
dusk
y
Thre
e R
iver
s
Wyo
min
g
YC
UA
Bay
Cit
y
Dow
nriv
er
Flin
t
Kal
amaz
oo
Mus
kego
n C
o. M
etro
Nor
th K
ent
Port
Hur
on
SH
UVA
Alp
ena
Ann
Arb
or
Bro
nson
Com
mer
ce T
wp.
Del
hi T
wp.
Dex
ter
East
Lan
sing
Gay
lord
Gen
esee
Co.
#3
How
ell
Jaks
on
Lape
er
Lyon
Tw
p.
Mar
quet
te
Mon
roe
Sag
inaw
Taw
as U
A
War
ren
ND ND ND
75
60
45
30
15
0
PFO
S C
once
ntra
tion
(ng/
L)
ND ND ND
PFOS Surface Water Standard
(11 ppt)
ND NDND

16NTH | Statewide Study on Landfi ll Leachate PFOA and PFOS Impact Technical Report
Table 4-2BWRRF Infl uent PFOA and PFOS Concentrations (Page 1 of 2)
Leachate Disposal/WRRF Facility
WRRF Permitted Capicity (MGD)*
Infl uent Concentration Infl uent Mass
PFOA(ppt)
PFOS (ppt)
PFOA (lb/day PFOS (lb/day)
Min to Max Min to Max
Group A: WRRFs Utilized by MWRA-member Active, Type II Landfi lls Participating in this Study
Belding 3.07 NA NA NA NA
Menominee 3.2 12 5.6 0.0003 0.0001
Clinton River 30.6 4.94 7.68 0.0013 0.0019
Genesee Co-Ragnone 25.9 4 5.22 0.0009 0.0012
GLWA 650 6.02 7.54 0.0324 0.0406
Grand Rapids 61.1 5.06 12.7 0.0026 0.0066
Hastings 2 NA NA NA NA
Holland 12 8.93 3.79 0.0009 0.0004
Lansing 35 4.98 ND 0.0014 ND
Ludington 4.5 NA NA NA NA
Sandusky 2.55 12.2 7.98 0.0003 0.0002
Three Rivers 2.75 21.44 7.39 0.0005 0.0002
Wyoming 22 5.08 to 25 6.2 to 26.4 0.0046 0.0048
YCUA 51.2 12 4.8 to 7.51 0.0051 0.0032
Group B: WRRFs Utilized to Dispose Leachate from Other Active, Type II Landfi lls
Bay City 18 4.87 18.2 0.0007 0.0027
Downriver 125 7.2 22.2 0.0075 0.0230
Flint 50 10.3 62.4 0.0043 0.0258
Kalamazoo 53.5 ND ND ND ND
KI Sawyer 0.65 NA NA NA NA
Muskegon Co Metro 43 11.7 to 36.9 10.5 to 24.3 0.0131 0.0086
North Kent S A 8 11.2 31.1 0.0007 0.0021
Port Huron 20 64.6 19.5 0.0107 0.0032
S Huron Valley UA (SHUVA) 24 3.76 ND 0.0007 ND
* WRRF permitted daily fl ow and PFOA and PFOS data provided by MIWaters.com.
Infl uent mass calculated using the single sample or the maximum value where multiple data are available.
NA: data not available
ND : Not detected. Detection limit unknown. Excluded from average and median calculations.
(at 10 facilities) to 0.03 lb., with a median of 0.0007 lb. and average of 0.003 lb. For PFOS, based on 25 results, estimated daily WRRF infl uent ranged from non-detect (at several locations) to 0.04 lb.; the associated median and average values were 0.0019 lb. and 0.005 lb., respectively.
Figure 4-2A, PFOA Mass: Infl uent Leachate vs. Overall WRRF Infl uent, depicts the total PFOA mass contribution from leachate versus overall estimated WRRF infl uent mass on a daily basis for the 13 facilities that receive leachate and have PFOA and/or PFOS data. Review of this graphic reveals the following:
• PFOA mass from leachate represents a relatively minor proportion of the individual WRRFs estimated infl uent mass at a majority of the WRRFs.
• GLWA’s PFOA infl uent mass is at least twice that of any of the other 12 WRRFs, which is based on its permitted treatment capacity and large area served including many industrial facilities; and
• The infl uent PFOA mass for the other WRRFs that serve large, densely-populated metropolitan areas are
generally greater than observed at smaller WRRFs that serve less-populated areas.
Figure 4-2B, PFOS Mass: Infl uent Leachate vs. Overall WRRF Infl uent, depicts the total PFOS mass contribution from leachate versus overall estimated WRRF infl uent mass on a daily basis for the 13 facilities that receive leachate and have PFOA and or PFOS data. Visual evaluation of this stacked bar chart graph reveals the following:
• PFOS mass from leachate represents a relatively minor proportion of most the individual WRRFs and overall;
• GLWA’s PFOS infl uent mass is at least twice that of any of the other WRRFs, based on its large permitted treatment capacity and large area served including many industrial facilities; and
• Other than Lansing, which did not detect PFOS in their infl uent, the infl uent PFOS mass for the WRRFs that serve large, metropolitan areas are generally greater than smaller WRRFs that serve less populated areas.

17NTH | Statewide Study on Landfi ll Leachate PFOA and PFOS Impact Technical Report
Leachate Disposal/WRRF Facility
WRRF Permitted Capicity (MGD)*
Infl uent Concentration Infl uent Mass
PFOA(ppt)
PFOS (ppt)
PFOA (lb/day PFOS (lb/day)
Min to Max Min to Max
Group C: WRRFs that do not Treat Active Type II Leachate
Adrian 7 NA NA NA NA
Alpena 5.5 5.94 5.44 0.0003 0.0002
Ann Arbor 29.5 2.91 to 4.3 16.5 to 20 0.0011 0.0049
AuGres 0.221 NA NA NA NA
Battle Creek 18 NA NA NA NA
Benton Harbor - St. Joseph 15.3 NA NA NA NA
Boyne City 0.9 NA NA NA NA
Bronson 0.5 ND 12 ND 0.0001
Charlotte 1.8 NA NA NA NA
Commerce Twp 8.5 17.9 6.38 0.0013 0.0004
Delhi Twp 4 ND ND ND ND
Dexter 0.58 ND ND ND ND
East Lansing 18.75 2.21 ND 0.0004 ND
Gaylord 2.2 ND ND ND ND
Genesee Co #3 11 2.6 ND 0.0002 ND
Gladwin 0.65 NA NA NA NA
Greenville 1.75 NA NA NA NA
Holly 1.35 NA NA NA NA
Howell 2.4 4.42 ND 0.0001 ND
Ionia 4 ND 499.36 ND 0.0165
Jackson 18 ND 5.98 ND 0.0009
Lapeer 1.5 4.2 8.6 0.0001 0.0001
Lyon Twp 1.095 ND ND ND ND
Marquette 3.85 3.27 10.3 0.0001 0.0003
Marysville 2.4 NA NA NA NA
Milan WWTP 2.5 NA NA NA NA
Monroe 24 2.89 5.5 0.0006 0.0011
Mt Clemens 6 NA NA NA NA
Petoskey 2.5 NA NA NA NA
Saginaw Twp 4.8 NA NA NA NA
Saginaw 32 2.56 4.19 0.0007 0.0011
Saline 1.81 NA NA NA NA
South Lyon 2.5 NA NA NA NA
Sturgis 2.8 NA NA NA NA
Tawas Utility Authority 2.4 6.2 17 0.0001 0.0004
Warren 36 4.61 7.31 0.0014 0.0022
West Bay County Regional 10.28 NA NA NA NA
Wixom 2.8 3.07 128 0.0001 0.0029
Zeeland 1.65 NA NA NA NA
Summary Statistics - all Groups (A, B, C)
minimum
maximum
median
average
n
ND
64.6
5.06
10.3
31
ND
499.36
8.6
34.5
29
ND
0.03
0.0007
0.003
31
ND
0.04
0.0019
0.005
29
Table 4-2BWRRF Infl uent PFOA and PFOS Concentrations (Page 2 of 2)
* WRRF permitted daily fl ow and PFOA and PFOS data provided by MIWaters.com
Infl uent mass calculated using the single sample or the maximum value where multiple data are available.
NA: data not available
ND : Not detected Detection limit unknown Excluded from average and median calculations

18NTH | Statewide Study on Landfi ll Leachate PFOA and PFOS Impact Technical Report
Figure 4-2APFOA Mass: Infl uent Leachate vs. Overall WRRF Infl uent
0.012
0.010
0.008
0.006
0.004
0.002
0.000
lb /
day
CR
WR
R
Dow
nriv
er
Gen
esee
C
o-R
agno
ne
Gra
nd R
apid
s
Hol
land
Lans
ing
Men
omin
ee
Port
Hur
on
San
dusk
y
Thre
e R
iver
s
Wyo
min
g
YCU
A
0.040
0.035
0.030
0.025
0.020
0.015
0.010
0.005
0.000
Note: Gray shading indicates active Type II landfi ll leachate loading to WWRF for PFOA mass. This graph includes a total of 13 WRRFs utilized by 26 landfi lls. Eleven of the WRRFs treat 24 active landfi lls (23 which were sampled as
part of this study and South Kent landfi ll). Two of the WRRFs are utilized by two additional active landfi lls that were not sampled as part of this study. PFOA and PFOS infl uent concentrations were unavailable from the WRRFs that treat
other active Type II landfi lls. The mass represents a calculated value on a single sample, permitted discharge volume, and average daily leachate discharge.
GLW
A
lb /
day
PFOA in WRRF Infl uent from sources other
than leachate (lb/day)
PFOA leachate (lb/day)
Figure 4-2BPFOS Mass: Infl uent Leachate vs. Overall WRRF Infl uent
0.025
0.020
0.015
0.010
0.005
0.000
lb /
day
CR
WR
R
Dow
nriv
er
Gen
esee
C
o-R
agno
ne
Gra
nd R
apid
s
Hol
land
Lans
ing
Men
omin
ee
Port
Hur
on
San
dusk
y
Thre
e R
iver
s
Wyo
min
g
YCU
A
0.045
0.040
0.035
0.030
0.025
0.020
0.015
0.010
0.005
0.000
Note : Blue shading represents active Type II landfi ll leachate loading for PFOS mass at each WRRF. This graph includes a total of 13 WRRFs utilized by 26 landfi lls. Eleven of the WRRFs treat 24 active landfi lls (23 which were sampled
as part of this study and South Kent landfi ll). Two of the WRRFs are utilized by two additional active landfi lls that were not sampled as part of this study. PFOS infl uent concentrations were unavailable for the WRRFs that treat other
active Type II landfi lls. The mass represents a calculated value on a single sample, permitted discharge volume, and average daily leachate discharge.
GLW
A
lb /
day
PFOS leachate (lb/day) PFOS in WRRF Infl uent from sources
other than leachate (lb/day)

19NTH | Statewide Study on Landfi ll Leachate PFOA and PFOS Impact Technical Report
Industrial Waste
Commercial Waste
(Offices,Schools, Markets, etc.)
Contaminated Legacy Sites
MSW (Household Waste)
LandfillWater Resource
Recovery Facility (WRRF)
Biosolids Land Application
SOLIDS
WASTEWATER
LEACHATE
RESIDUALS
LIQUID
WASTE
WASTEWATER
SOLIDS
SOLIDS
SOLIDS
WASTEWATER
Treated Water
(Discharge to
Environment)
In this section, we discuss other concerns related to the current understanding of PFOA and PFOS in the environment that need to be addressed to help guide future regulatory, toxicological, and best-management practices (BMPs).
5.1: WRRF Infl uent, Effl uent, and Biosolids
It is documented that WRRF biosolids typically contain PFAS (NEBRA, 2018). A recent comprehensive study was completed for the North East Biosolids and Residuals Association (NEBRA) that examined PFOA and PFOS concentrations in WRRF biosolids. Although the biosolids data are reported for solid/sludge samples and leachate samples are liquids, based on our review, the biosolids concentrations were typically two orders-of-magnitude greater than observed in active, Type II landfi ll leachate on a ppt basis.
Related specifi cally to PFOA and PFOS mass in leachate and WRRF biosolids, there are complexities between these two media that need evaluation to optimize future management of these two waste streams:
• the role of biochemical processes in WRRFs;• fate and transport of PFOA/PFOS contained in
biosolids• temporal and spatial variation effects;• waste age and state of decomposition in landfi lls; • impact of equipment and infrastructure residual
contamination; and• appropriate and effective current BMPs.
While beyond the scope of this study to assess these factors, recent and ongoing research by others may provide direction. For example, work by Hamid (2018) and Lang (2017) indicate some PFAS compounds typically increase in WRRF effl uent as compared to infl uent from biochemical degradation of related PFAS chemicals within the waste stream. Other factors could include residual PFAS from WRRF processing equipment.
For landfi lls, the existing literature (Lang, et al, and related references) indicates that PFOA+PFOA leachate mass decreases over time with more rapid declines observed in temperate, humid climates. This observation is signifi cant with respect to long-term PFAS leachate management and reduction.
5.2: Proper PFAS Waste Management: Interdependence between Landfi lls, WRRFs, and General Public
Our study and previous investigations confi rm PFAS presence in LF leachate – it comes from many sources that cannot be easily identifi ed or eliminated including various consumer products disposed in landfi lls. As indicated throughout this report, PFAS have been used for over 50 years in household products. Managing PFAS-containing waste is a challenge that touches all sectors of the economy, including the solid waste industry, manufacturing and commercial sectors, and the general public. It is a societal concern that we need to work together to effectively address.
The leachate is effectively managed at landfi lls through active leachate collection via engineered liner systems. In Michigan, the most viable method for leachate management is its discharge to a local WRRF where it is handled with other household, commercial, and various industrial wastewaters. In this way, leachate is managed in a closed system where there is no direct exposure to the public. WRRFs treat wastewater to meet certain regulatory criteria prior to discharge of the treated water.
5.0: OTHER CONSIDERATIONS

20NTH | Statewide Study on Landfi ll Leachate PFOA and PFOS Impact Technical Report
Considering data collected and evaluated during this study, the impact that PFOA and PFOS in landfi ll leachate has on WRRFs infl uent concentrations is presented on Figures 4-2A and 4-2B. These data indicate that: :
a. leachate provides a relatively minor contribution to the overall PFOA and PFOS concentration/mass in most WRRF infl uent because of the relatively low leachate discharge volumes;
b. non-leachate sources of PFOA and PFOS signifi cantly contribute to WRRF infl uent and at higher volumes. It is noteworthy that the WRRF infl uent that have no landfi ll leachate contribution show a similar concentration range for PFOA and PFOS as WRRF infl uent that has leachate contribution; and
c. although reduction of landfi ll leachate concentrations of PFOA and PFOS to the WRRF infl uent could be benefi cial to meeting WQS in the WRRF effl uent, the impact may be minor in most cases since leachate typically contributes a relatively small volume to the overall WRRF infl uent.
As discussed above, WRRFs also produce biosolids (i.e., “sewage sludge”) with elevated concentrations of PFAS. These biosolids are normally either land applied as fertilizer or incinerated (which potentially create separate environmental exposures), or are disposed at landfi lls (which likely contributes to higher PFAS concentrations in leachate at those landfi lls).
Each of these WRRF biosolids management methods have potential unintended adverse consequences. Incineration emissions may contribute to airborne PFAS, although this is largely un-studied. Similar cross-media impacts may be related to land application. Disposing of biosolids in landfi lls likely increases the concentrations of PFAS in leachate discharged to WRRFs. However, of the three disposal methods, landfi lling in properly built and managed landfi lls appears to pose the least risk because landfi lls have engineering controls and environmental monitoring systems.Accordingly, landfi lls and WRRFs have an important and mutually-benefi cial relationship: landfi lls need to dispose of leachate and WRRFs need to safely manage society’s biosolids. Together, these two critical environmental infrastructure components would benefi t from enhanced cooperation to manage PFAS to serve the needs of both industries and protect the environment.

21NTH | Statewide Study on Landfi ll Leachate PFOA and PFOS Impact Technical Report
PFOA and PFOS were detected in all of the leachate samples taken in the study. The concentration ranges were similar to previous leachate studies conducted elsewhere in the US. The variability from landfi ll to landfi ll may refl ect variations in waste-types, waste age, size of landfi lls in the study, and the relative state of decomposition. In summary:
• In leachate sampled from MWRA member landfi lls that participated in this study, PFOA ranged from 240 to 3,200 ppt and PFOS ranged from 100 to 710 ppt.
• In published studies of landfi ll leachate in the United States, PFOA ranged from 30 to 5,000 ppt and PFOS ranged from 3 to 800 ppt.
• Michigan leachate concentrations were substantially lower than some other countries, such as China, where published studies show PFOA ranged from 281 to 214,000 ppt and PFOS ranged from 1,150 to 6,020 ppt.
Comparing leachate volume and mass contribution from the 35 landfi lls examined to the total infl uent mass at the 39 WRRFs shows that the contribution of PFOA and PFOS is mostly from non-landfi ll sources.
• On a statewide basis, available data indicates that the 35 landfi lls contribute approximately one million gallons of leachate to WRRF infl uent, with approximately 0.01 lbs / day of PFOA and 0.003 lbs / day of PFOS.
• On a statewide basis, available data indicates that the 34 WRRFs that have infl uent data receive approximately 1.4 billion gallons of infl uent daily (based on design capacity), with approximately 0.09 lbs / day of PFOA and 0.15 lbs / day of PFOS.
The ranges of PFOA and PFOS concentrations in WRRF infl uent that do not accept leachate show overlap with those that do accept leachate.
• In WRRFs that do not accept landfi ll leachate, infl uent levels of PFOA range from non-detect to 17.9 ppt while PFOS ranges from non-detect to 499 ppt (next highest value is 128 ppt).
• In WRRFs that accept landfi ll leachate, infl uent levels of PFOA range from non-detect to 64.6 ppt while PFOS ranges from non-detect to 62.4 ppt.
• Available data show that PFOA levels in WRRF infl uent are well below Michigan’s most conservative surface water criteria (420 ppt) at all WRRFs examined, and that PFOS levels in WRRF infl uent are below Michigan’s most conservative surface water criteria (11 ppt) at approximately two-thirds of the WRRFs examined.
• The data collected during this study indicate that leachate provides a relatively minor contribution to the overall PFOA and PFOS concentration in most WRRF infl uent; non-leachate sources of PFOA and PFOS contribute greater mass to WRRF infl uent than leachate.
6.0: CONCLUSIONS

22NTH | Statewide Study on Landfi ll Leachate PFOA and PFOS Impact Technical Report
Based on the results of this study, we present the following recommendations:
• The solid waste industry in Michigan (and nationally) must continue working to understand the signifi cance of the contribution of leachate to PFOA and PFOS received by WRRFs and work towards reduction solutions.
• The conclusions of this study are based mainly on a single leachate sample from each landfi ll and limited available data for WRRFs. Therefore, calculated mass values are estimates and more data and information are needed. This should include additional leachate data, WRRF infl uent data, and biosolids data.
• Facilities will need to present and discuss their individual results with the WRRF receiving their leachate to help evaluate any appropriate solutions on a local basis.
The information gathered during this study and other research can be used to develop, where needed, improved practices for management of waste that contains PFAS within and between landfi lls and WRRFs. Future collaboration should involve forming a workgroup consisting of MWRA members, MDEQ, MPART, and WRRFs. Discussions should take into consideration the unique aspects of landfi lls as a component of PFAS management and their interdependence with WRRFs in providing an important function to society. Further, the stakeholder parties need to work with toxicologists and other environmental scientists to better understand the potential impacts of PFOA and PFOS on human health in the context of landfi ll leachate and in general.
MWRA is committed to continue playing an active role in this process, as demonstrated by its funding of this statewide leachate report and ongoing participation with state and federal technical and scientifi c committees working toward solutions that follows sound scientifi c principles and implements best management practices where needed.
7.0: RECOMMENDATIONS

23NTH | Statewide Study on Landfi ll Leachate PFOA and PFOS Impact Technical Report
Agency for Toxic Substances and Disease Registry (ATSDR). “Perfl uoroalkyl and Polyfl uoroalkyl Substances (PFAS) Frequently Asked Questions.” August 22, 2017.
https://www.atsdr.cdc.gov/pfas/docs/pfas_fact_sheet.pdf. Accessed December 2018 through February 8, 2019.
Agency for Toxic Substances and Disease Registry (ATSDR). “Toxicological Profi le for Perfl uoroalkyls.” Draft for Public Comment, June 2018. https://www.atsdr.cdc.gov/toxprofi les/tp200.pdf. Accessed December 2018 through February 8, 2019.
Allred, B. Mckay, et al. “Physical and Biological Release of Poly- and Perfl uoroalkyl Substances (PFASs) from Municipal Solid Waste in Anaerobic Model Landfi ll Reactors.” Environmental Science & Technology, vol. 49, no. 13, 2015, pp. 7648–7656.
Association of State Drinking Water Administrators (ASDWA). “Per- and Polyfl uoroalkyl Substances (PFAS) Laboratory Testing, Primer for State Drinking Water Programs and Public Water Systems.” October 10, 2018.
Benskin, Jonathan P., et al. “Per- and Polyfl uoroalkyl Substances in Landfi ll Leachate: Patterns, Time Trends, and Sources.” Environmental Science & Technology, vol. 46, no. 21, 2012, pp. 11532–11540.
Bossi, R., et al. “Perfl uoroalkyl Compounds in Danish Wastewater Treatment Plants and Aquatic Environments.” Environ. Int. 34, 2008, pp. 443-450.
Buck, Robert C, et al. “Perfl uoroalkyl and Polyfl uoroalkyl Substances in the Environment: Terminology, Classifi cation, and Origins.” Integrated Environmental Assessment and Management, vol. 7, no. 4, 2011, pp. 513–541.
Busch, Jan, et al. “Polyfl uoroalkyl Compounds in Landfi ll Leachates.” Environmental Pollution, vol. 158, no. 5, 2010, pp. 1467–1471.
Davidson, Carla. “Michigan’s IPP PFAS Initiative.” Schoolcraft College. September 14, 2018.
DoD Quality Systems Manual Version 5.1. “Department of Defense (DoD) Department of Energy (DoE) Consolidated Department of Energy (DOE) Consolidated Quality Systems Manual (QSM) for Environmental Laboratories.” 2017.
“Factsheets Pfos and Pfoa: Behaviour In Soil and Waters.” Emerging Contaminants www.emergingcontaminants.eu/index.php/background-info/Factsheets-PFOS-intro/Factsheets-PFOS-behaviour. Accessed December 2018 through February 8, 2019.
Fuertes, et al. “Perfl uorinated alkyl substances (PFASs) in northern Spain municipal solid waste landfi ll leachates.” Chemosphere vol. 168, 2017, pp 399-407.
Gallen, et al. “Australia-Wide Assessment of Perfl uoroalkyl Substances (Pfass) in Landfi ll Leachates.” Hazardous Materials 331, 2017. pp 132-141.
Gallen, et al. “Occurrence and distribution of brominated fl ame retardants and perfl uoroalkyl substances in Australian landfi ll leachate and biosolids.” Hazardous Materials 312, 2016. pp 55-64.
Geosyntech Consultants. “Environmental Protection at the Managed Solid Waste Landfi ll.” March 29, 2010.
Hamid, Hanna, et al. “Review of the Fate and Transformation of Per- and Polyfl uoroalkyl Substances (PFASs) in Landfi lls.” Environmental Pollution, vol. 235, 2018, pp. 74–84.
Hamid, Hanna, et al. Supplemental Information (SI): Table S1. “Concentration Range (Ng/L) and Detection Frequency of Perfl uoroalkyl Acids (PFAAs) in Landfi ll Leachate.” Table S2. “Concentration Range and Detection Frequency of Perfl uoroalkyl Sulfonamide Derivatives and Fluorotelomer Acids in Landfi ll Leachate.” Table S3. “Classifi cation of Landfi ll Leachate According to Age and Typical Characteristics.”
REFERENCES(cited and or reviewed)

24NTH | Statewide Study on Landfi ll Leachate PFOA and PFOS Impact Technical Report
Huset, Carin A., et al. “Quantitative Determination of Fluorochemicals in Municipal Landfi ll Leachates.” Chemosphere, vol. 82, no. 10, 2011, pp. 1380–1386.
Interstate Technology Regulatory Council (ITRC). “Fact Sheet Tables 4-1 and 4-2.” January 2019. https://pfas-1.itrcweb.org/fact-sheets/. Accessed December 2018 through February 8, 2019.
Kallenborn, R. “Perfl uorinated Alkylated Substances (PFAS) in the Nordic Environment.” Nordic Council of Ministers, 2004.
Lang, Johnsie R., et al. “National Estimate of Per- and Polyfl uoroalkyl Substance (PFAS) Release to U.S. Municipal Landfi ll Leachate.” Environmental Science & Technology, vol. 51, no. 4, 2017, pp. 2197–2205.
Michigan, Pfas Response - Taking Action, Protecting Michigan. https://www.michigan.gov/PFASresponse. Accessed December 2018 through February 8, 2019.
Michigan Department of Environmental Quality “Water Resource and Information Forms (MiWaters).” https://miwaters.deq.state.mi.us/miwaters/external/home. Accessed December 2018 through February 8, 2019.
Michigan Department of Environmental Quality “Waste Data System (WDS).” Waste Data System. N.p., n.d. Web. 13 Dec. 2016. < MDEQ http://www.deq.state.mi.us/wdspi/Home.aspx. Accessed December 2018 through February 8, 2019.
Michigan Department of Environmental Quality. “Wastewater PFAS Sampling Guidance.” Revised October 11, 2018.
Michigan Department of Environmental Quality. “General PFAS Sampling Guidance.” Revised October 16, 2018.
Michigan Department of Environmental Quality. “Standard Operating Procedure, Collection of Landfi ll Leachate Samples for Analysis of Polyfl uorinated Alkyl Substances.” Revised October 16, 2018.
Michigan Department of Environmental Quality Waste Management Division “Report of Solid Waste Landfi lled In Michigan, October 1, 2017 – September 30, 2018.” January 31, 2019.
Michigan Department of Environmental Quality Map – ACTIVE SOLID WASTE LANDFILLS Part 115 of Act 451 (and New Non-Active), June 2008.
https://www.michigan.gov/documents/deq/deq-whmd-swp-Landfi ll-map_247566_7.pdf. Accessed December 2018 through February 8, 2019.
Michigan Department of Environmental Quality Rule 57 Water Quality Values Surface Water Assessment Section. Retriever from: https://www.michigan.gov/deq/0,4561,7-135-3313_3681_3686_3728-11383--,00.html. Accessed December 2018 through February 8, 2019.
Michigan Department of Environmental Quality Cleanup Criteria Requirements for Response Activity (Formerly the
Part 201 Generic Cleanup Criteria and Screening Levels) https://www.michigan.gov/deq/0,4561,7-135-3311_4109-251790--,00.html. Accessed December 2018 through
February 8, 2019.
Michigan Department of Environmental Quality. “Addendum for Per- and Polyfl uoroalkyl Substances (PFAS) in Michigan, Current State of Knowledge and Recommendations for Future Actions.” 2017
Michigan Executive Order No. 2019-03. 2019. https://www.michigan.gov/whitmer/0,9309,7-387-90499_90705-488737--,00.html. Accessed February 4, 2019
through February 8, 2019
Minnesota Pollution Control Agency. “PFCs in Minnesota’s Ambient Environment: 2008 Progress Report.”
Minnesota Pollution Control Agency Solid Waste Section. “2005-2008 Perfl uorochemical Evaluation at Solid Waste Facilities in Minnesota, Technical Evaluation and Regulatory Management Approach.” April 14, 2010.

25NTH | Statewide Study on Landfi ll Leachate PFOA and PFOS Impact Technical Report
North East Biosolids and Residuals Association (NEBRA). “PFAS and Recycling: Putting Them in Perspective, A NEBRA Fact Sheet.” March 22, 2018.
https://www.nebiosolids.org. Accessed December 2018 through February 8, 2019.
Oliaei, Fardin, et al. “Investigation of Perfl uorochemical (Pfc) Contamination in Minnesota, Phase One.” Report to Senate Environment Committee. February 2006.
U.S. Department of Health and Human Services, Public Health Service, Agency for Toxic Substances and Disease Registry, Division of Health Assessment and Consultation. “Pfos Detections in the City of Brainerd, Minnesota.” August 13, 2008.
United States environmental Protection Agency (USEPA) -Solid-Phase Extraction (SPE) EPA Method 3535A (SW-846). Retrieved from “Selected Analytical Methods for Environmental Remediation and Recovery (SAM) 2017.” EPA, Environmental Protection Agency, 24 May 2018.
https://www.epa.gov/homeland-security-research/epa-method-3535a-sw-846-solid-phase-extraction-spe. Accessed December 2018 through February 8, 2019.
United States Environmental Protection Agency (USEPA). “Determination of Selected Perfl uorinated Alkyl Acids in Drinking Water by Solid Phase Extraction and Liquid Chromatography/Tandem Mass Spectrometry (LC/MS/MS).” (USEPA Method 537) USEPA. October 2015.
https://cfpub.epa.gov/si/si_public_record_report.cfm?Lab=NERL&dirEntryId=198984&simpleSearch=1&searchAll=EPA%2F600%2FR-08%2F092. Accessed December 2018 through February 8, 2019.
United States Environmental Protection Agency (USEPA) Statistical Software ProUCL 5.1.00 for Environmental Applications for Data Sets with and without Nondetect Observations.
https://www.epa.gov/land-research/proucl-software. Accessed December 2018 through February 8, 2019.
United States Environmental Protection Agency (USEPA). “PFAS National Leadership Summit and Engagement.” May 22-23, 2018.
www.epa.gov/pfas/pfas-national-leadership-summit-and-engagement. Accessed December 2018 through February 8, 2019.
United States Environmental Protection Agency (USEPA). “Drinking Water Health Advisories for PFOA and PFOS.” https://www.epa.gov/ground-water-and-drinking-water/drinking-water-health-advisories-pfoa-and-pfos.
Accessed December 2018 through February 8, 2019.
United States Environmental Protection Agency (USEPA). “Practical Methods to Analyze and Treat Emerging Contaminants (PFAS) in Solid Waste, Landfi lls, Wastewater/Leachates, Soils, and Groundwater to Protect Human Health and the Environment.” Informational Webinar for Applicants EPA NCER STAR RFA, August 29, 2018.
Woldegiorgis, eet al. “Results from the Swedish National Screening Programme 2005: Subreport 3: Perfl ourinated Alkylated Substances (PFAS).” 2006.
Yan, Hong, et al. “Perfl uoroalkyl Acids in Municipal Landfi ll Leachates from China: Occurrence, Fate during Leachate Treatment and Potential Impact on Groundwater.” Science of the Total Environment, vol. 524-525, 2015, pp. 23–31.