technical partner - wwf-indiaawsassets.wwfindia.org/downloads/lcdp___report_low_res.pdfsince the...
TRANSCRIPT

Technical Partner

Supported By
February, 2014
This report is a collaborative partnership between:
Disclaimer
Copyright
- EvangelischerEntwicklungsdienst
Technical Advisor
The study was supported by “Brot für die Welt”.The positions held in this document represent opinions of theeditors and not the ofcial position of “Brot für die Welt”.

Low-carbon Development Pathways for a Sustainable India | I
Supported By
February, 2014
This report is a collaborative partnership between:
Disclaimer
Copyright
- EvangelischerEntwicklungsdienst
Technical Advisor
The study was supported by “Brot für die Welt”.The positions held in this document represent opinions of theeditors and not the ofcial position of “Brot für die Welt”.
LOW-CARBON DEVELOPMENT PATHWAYS FOR A SUSTAINABLE INDIA

II | Low-carbon Development Pathways for a Sustainable India

Low-carbon Development Pathways for a Sustainable India | III
Low-carbon Development Pathways for a Sustainable India
The Partners’ View
As an emerging economy, India faces the twin challenges of fast tracking its development towards poverty reduction on one hand, and on the other, responding to environmental threats like climate change by avoiding and reducing rising greenhouse gas (GHG) emissions. India essentially seeks to maintain its commitment to reduce poverty and, at the same time, be responsible towards the environment. India’s commitment
was echoed in the then Prime Minister Indira Gandhi’s speech at the UN Conference on the Human Environment in Stockholm in 1972: “On the one hand, the rich look askance at our continuing poverty - on the other, they warn us against their own methods. We do not wish to impoverish the environment any further and yet we cannot for a moment forget the grim poverty of large numbers of people. Are not poverty and need the greatest polluters?”i In 2007, Prime Minister Manmohan Singh committed to meet India’s development goals, while at the same time stating that India’s per-capita emissions will not exceed the per-capita emissions of developed countries. As India’s economic capacities are limited, several low-carbon options may be considered for development in India. The Planning Commission of the Government of India has been commissioned with the challenge of low-carbon development for India, and has been carrying out its own studies on low-carbon strategies for inclusive growth.
Keeping the challenges of climate-friendly development in view, the project partners to this present study - WWF India, Centre for Environment Education India, LAYA, Church’s Auxiliary for Social Action (CASA) and German Agro - took the initiative to contribute to a wider debate with the objective to envisioning a low-carbon development pathway for a sustainable India, demonstrating that both goals can be achieved simultaneously. The present study is the result of a two-year discussion process, in which Indian and German civil society organizations have come together in order to promote possible approaches for low-carbon development scenarios in a society which still faces a high degree of poverty.
The partner consortium selected the New Delhi-based institute Integrated Research for Action and Development (IRADe) as technical partner, through a tendering process. This research organization had already worked on a low-carbon development model which provided the base for this study to build upon. IRADe was assigned to develop a visionary development scenario which is based on human well-being indicators suggesting a development threshold for India. On this foundation, two India-specific low-carbon development scenarios (LC1 and LC2) were elaborated that describe national pathways for a climate safe 2050 in a multi-sectoral approach. Thus, both the low-carbon scenarios are in line with a) the goal to end poverty and to promote sustainable development, and b) a calculated carbon budget for India. This carbon budget is compatible with the global 2°C limit - meaning the objective to limit global warming to below 2 degrees Celsius compared to pre-industrial levels, as agreed by the United Nations Framework Convention on Climate Change (UNFCCC) at its 16th Conference of the Parties (COP 16, Cancun in 2010). The 2°C limit is taken as a reference for the modeling, based on the WBGU (German Advisory Council on Global Change) budget approachii , suggesting a carbon budget below 156 Gt CO2 (base year 1990) and 133 Gt CO2 (base year 2010) respectively for India. The WBGU approach allocates the available global carbon budget from base years 1990 and 2010 to 2050 for each country, on equal per capita basis according to the population in the base year.
The present study provides an assessment of India’s economic development with decadal scenarios till 2050. It assesses India’s options on energy mix and CO2-emissions in two low-carbon scenarios emphasising on energy efficiency and renewable energy sources such as solar, wind, hydro and biomass. For the present study nuclear energy generation has been limited to the existing and currently under
iSafeguarding Environment, 1992, published by H. S. Poplai for Wiley Eastern Limited, New Delhi, India
iiWBGU (2011): Solving the climate dilemma: The budget approach, Special Report, http://www.wbgu.de/fileadmin/templates/dateien/veroeffentlichungen/sondergutachten/sn2009/wbgu_sn2009_en.pdf

IV | Low-carbon Development Pathways for a Sustainable India
construction nuclear power plants in India as some of the project partners consider it as neither a sustainable, nor safe, nor cost-efficient energy provider.
Thus, the study connects both scenarios with the current deliberations on Sustainable Development Goals (SDGs) within the post-2015 process, the UN Decade on Sustainable Energy for Alliii, and the summary findings of the Fifth Assessment Report from Working Group 1 of the Intergovernmental Panel on Climate change (IPCC) which explicitly refers to an available global carbon budget in order to stay below 2°C, limit to adequately address the climate crisisiv.
The vision of a low-carbon development pathway is therefore an opportunity for the Indian government and decision makers to make policy choices that will take the country on a development path that responds to national and global needs and, at the same time, creates the link to international processes. This study is designed to lead to a wider discussion showing that India can achieve a low-carbon pathway without considerably decreasing its development ambitions.
Choice of the IRADe model, its respective strengths and limitations, and alternative pathwaysThe strength of the model is its ability to develop scenarios that are consistent in terms of resource availabilities, and assess the impact of various policy actions on a wide range of well-being indicators. This is perhaps the first attempt to develop a model that also includes besides Human Development Index (HDI), the level of poverty, level of literacy, access to clean cooking fuels, electricity, clean water, sanitation facility, and ‘pakka’ houses. In this unique approach, development thresholds are defined as minimum levels necessary to attain human well being. The model scenario tries to reach these thresholds sooner than a business as usual projection and in fact most could be reached by 2030. Given the inherent limitations of any model in covering relevant parameters especially with regards to human well-being modeling and due to the lack of availability of consistent data we are well aware that the study contains certain limitations. In our view, the development threshold is defined only to the minimum standards so that the targets should be reached earlier than in 2050. How best to deal with these limits is partly covered in our recommendations and will be topic of more strategic discussions during a stakeholder discussion phase which will include a wider range of actors in this process.
The scenarios are developed based on a set of assumptions which have bearing on the model’s findings and need to be kept in mind when interpreting the results. One of the major challenges perceived seen by the Indian and German partners is the continuing focus on economic growth in the absence of indicators for Sustainable Development. While the model in all the scenarios looks to achieve the HDI targets, Gross Domestic Product (GDP) is a major factor in measuring HDI. Alternative measurement models of human well- being, including consumption and lifestyle patterns were therefore, one of the limitations of the model used. However, while the model does account for some lifestyle changes in an indirect way, such as reduction in transport and fuel demand by households to reflect greater use of public transport and non-motorised transport, this is not done explicitly.
This study considers autonomous energy efficiency improvement of selected sectors as the major empirical evidence for a non-price increase in energy efficiency. Since the model optimises simultaneously over 45 years, leapfrogging due to such future reductions in prices, is according to the authors of the study, factored into the scenarios. However, it does not consider any new, currently not envisaged breakthrough technologies that could help more leapfrogging in the existing growth model. While one sees several examples of leapfrogging in India (e.g. mobile phone revolution, rapid spread of Compact Fluorescent Lamp (CFL), Bus Rapid Transit Systems (BRTS) etc) there are an equal number of examples of unsustainable technologies, processes and ideas being introduced. There is a major scope for making better choices and creating development path towards sustainability with
iii2014-2024 United Nations Decade of Sustainable Energy for All, Report of the Secretary-General (2013): http://sustainabledevelopment.un.org/content/documents/2005energysgrep.pdf
ivIPCC – AR5, Summary for Policy Makers, SPM WG1, pp25

Low-carbon Development Pathways for a Sustainable India | V
development that is suitable to India. There is an on-going German and partly European discussion on the limits of growth. This is not reflected in the present study.
Specifically the following observations are made by the partner consortium:
1. The IRADe model looks at alternative strategies which may decrease GDP but without lowering the HDI goals. In other words, there is an assumed decoupling of GDP from HDI goals. Sustainable pathways which focus on more efficient energy generation, transmission and use; renewable energies; more public transport use, and more efficient goods movement as well as sustainable forestry leads to less consumption in the way GDP is measured. Therefore the presented report argues that India should move away from defining growth in only GDP terms towards defining it in a language of sustainable development.
2. India starts from a very low GDP per capita base. GDP increase even in conventional development models is therefore inevitable to meet the minimum HDI levels. But to the extent that sustainable and low-carbon alternatives are selected, these are achieved even though GDP seems to be “compromised”.
3. The model does not factor in better governance and delivery mechanisms. This is a major concern in India and there is much room for improvement. More efficient governance in the years to come, with less corruption, would only further improve the results. The current political debate in India is very focused on this aspect and one can expect considerable improvement in this regard, however it may be premature to build this into the model and this has therefore not been done.
Typical climate and energy models do not deal with human development issues and this model is a marked departure from that. However, despite the new features introduced in the study, it is conservative in terms of “out of the box thinking” and does not consider break-through technologies not yet on the horizon, or proven.
The expansion of low-cost mitigation options, i.e. increased innovation policy, is not considered.
Moreover, the adopted model for this study considers only CO2 and neglects other GHG emissions since they are largely related to agriculture, a sector beyond the scope of this study. Further, similar to other models, it does not deal with the issue of governance, policies and frameworks and their effective implementation during the model timeframe. Also, the model has limitations in integrating quality aspects related to education and health, and sustainable environment indicators, and indicators for equity because of data gaps. Finally, a detailed sectoral analysis in terms of technological interventions and their cost implications is not captured in an adequate manner in all sectors. The range of emissions and mitigation options is limited and focuses on major sectors only.
Apart from these observations, the treatment of shifting energy prices until 2050 could have been addressed differently. To be more specific, from 2010 to 2050 the model runs with constant energy prices based on the years 2003-2004 instead of starting with updated prices and providing more detailed estimates for future changes in energy pricing taking into account expected fluctuation due to peak-oil, power shifts towards renewable energies and other potential factors. Despite data availability and mainstream projections done by international agencies like the International Energy Agency (IEA), the energy prices were not adjusted in the model used. Instead, the energy prices are determined by the import prices as India is substantially dependent on imported energy. The import prices of oil and gas are raised substantially compared to base prices to reflect likely increases due to peak oil.
The study factors in the recently fallen, and continuously falling, prices especially for solar energy. While electricity from imported coal or domestic natural gas today

VI | Low-carbon Development Pathways for a Sustainable India
costs about 4.5 per kWh, the current solar energy price lies at around 6.5-7 per kWh. A few years ago it still cost up to 18 per kWhv. Thus, the study assumes a solar price decrease between 2005 and 2015 by 36% and between 2015 and 2050 by 43 % anticipating a price of around 4.5 per kWh in 2050.
Concluding remarksDespite the fact that the model used for this study contains room for improvement, the study does provide interesting and highly useful results for the Indian low-carbon development policy debate: India can achieve a low-carbon pathway, with appropriate policies being implemented, without considerably decreasing the development ambitions. This objective can be made effective through increasing the investment in development goals; enhancing the focus on implementation of renewable energy targets, and bringing energy efficiency to a level where it is able to explore its full potential. The expansion of low-cost mitigation options, innovative solutions, and indigenous, decentralised energy options will aid in rapid infusion and leapfrogging from the conventional fossil and nuclear fuel-based pathways while achieving development goals.
The study, thus, has the potential to play a critical role in advancing political and public discourses on integrated climate change mitigation and development in India. It presents an alternative vision for the Indian society at large, for policy choices towards leapfrogging. While India needs to be understood in the context of poverty reduction and development, it can benefit from avoiding the mistakes made by highly industrialized societies and adopt best practices from around the world (including the own) on the way towards a low-carbon society. On this basis, we would hope to encourage Indian policy makers and other stakeholders to take informed and sound decisions on development pathways, and leapfrog to a fair and low-carbon society instead of following traditional but inequitable and emission-intensive development models.
RecommendationsThe authors of the low-carbon development study conclude that India can achieve a low-carbon pathway without considerably decreasing their development ambitions. In order to meet this objective the model itself made use of a number of assumptions like increased investment in development; energy efficiency in most relevant sectors, and up-scaling of renewable energies use. In spite of the mentioned limitations, we at this point wish to conclude with some main recommendations for further scientific research, stakeholder discourses, and a list of policy instruments for the Government of India.
A. Recommendations to the academia on further research
The following observations for improvements of sustainable low-carbon studies for India were made during this exercise:
1. Relationships in between interlinked fields of relevance for low-carbon development: Understanding the interactions between areas of relevance for low-carbon development such as energy security and access, climate change, development, governance and many more is crucial for the development of such a pathway. A mapping of well-developed relations and interlinkages, or the lack of the same, between relevant areas could prove useful for improving the strategies of a low-carbon development pathway. It could foster the understanding of linkages between the areas in order to take decisions not only for low-carbon pathways but for a sustainable development.
2. Need for improved modeling of the development threshold: Improved models of well-being supported by better data availability and comprehensive reflection of all relevant qualitative and quantitative data for each well-being indicator, including in particular the environmental well-being could lead to a
vTimes of India, 15 January 2014, Solar energy ambitions take shape as costs tumble: http://timesofindia.indiatimes.com/business/india-business/Solar-energy-ambitions-take-shape-as-costs-tumble/articleshow/28846123.cms

Low-carbon Development Pathways for a Sustainable India | VII
more solid framing of a development threshold, and move beyond minimum standards of well-being towards more ambitious targets and timelines. However, no satisfactory metric to quantify environmental well-being is available, and research is needed to develop this. Considering the growing pressure on India’s natural resources, further research is vital for envisioning indicators to maintain the integrity of natural ecosystems, wildlife populations and biodiversity, including regeneration of degraded ecosystems. Initial efforts are already being carried out by civil society actors, amongst others, in this regard. It is imperative that the government of India prioritizes Sustainable Development Goals for a more sustainable society in 2050. Currently, ‘environment’ is hardly central to the planning process in India. For example the central government allocation to the Ministry of Environment and Forests remains well under 1% of the total budget, based on 2009-2010 datavi.
3. Consideration of environment factors and equity in the SDGs: There is a need for a holistic conceptualization of achievable targets for India to be posited along the lines of the global debate on the SDG debate, post Rio+ 20. There also is a tremendous scope to create more holistic models in order to develop SDG targets for India for 2050, which take into consideration various dimensions of ‘environmental factors’ and ‘equity’ considerations. This study helps clarify what is possible, and what is needed to achieve some of these SDGs.
4. Investment in good governance: The issue of good governance has always been a concern in the Indian context because good policies do not necessarily get effectively implemented. Constant improvements have been observed, especially since the Right to Information act. In this context developing indicators for effective governance systems based on the rule of law and sound institutions are imperative. Further research is necessary into the kind of investments that need to be made, and the institutions that need to be developed by the Government of India in ensuring regulatory mechanisms for good governance as future initiatives.
5. Development of an energy model: For future modeling exercises an energy model should be used with better capacity than what the IRADe-LCSD model offers to modulate different scenarios for low-carbon pathways of India. An energy model should include variable energy prices; the development of renewable energies and innovative technological interventions, and other essential flexible parameters. Furthermore, the costs created by the instruments and regulations towards a low-carbon society should be able to be estimated by the model.
6. Increased research on renewable energies: Research with the aim to identify the role renewable energies could play in a low-carbon development pathway could provide more precise renewable energy potentials across the country, track and project price developments, and time strategies for upscaling of renewables.
7. Allowing greater flexibility in models: Consideration of improvements in terms of education and awareness raising; shifting trends and behaviours with regard to lifestyles should be workable in a model. Before this can be done, however, one needs to define policies beyond increase in public expenditure that is already built in the model scenarios that will improve quality of education. The term ‘alternative lifestyle’ also needs to be defined in quantitative terms.
B. Recommendations for an informed low-carbon development discourse
A sustainable low-carbon development pathway for India must be supported by a range of stakeholders in order for it to succeed. So far, the partners have observed obstacles in the trust in the required comprehensive shifts and changes for the transition to a sustainable low-carbon society. For instance, doubts about the affordable access to renewable energy by all, and the ability of renewable
viAseem Shrivastava and Ashish Kothari: Globalisation in India: impacts and Alternatives, Kalpavriksh, 2012, pp 10.
VIII | Low-carbon Development Pathways for a Sustainable India
energies to meet the constantly rising electricity demand are still common. Such doubts, if ill founded, need to be dispelled by credible analysis based on facts. Based on the present study the partners conclude with the following recommendations for the Indian discourse on development and a low-carbon economy:
1. Development of a vision for a ‘sustainable India’: As far as the development threshold and a low-carbon society are concerned, the key recommendation for Government of India is to come up with a vision of a ‘sustainable India’ through a larger open stakeholder process. Till to date no such vision has been articulated. The current debate on a post 2015-scenario for the SDGs will serve as an impetus to provide insights for development of such a visionary goal in terms of defining well-being, including qualitative and quantitative indicators for the sectors of health and education, as well as visionary goals for economically sustainable structures.
2. Choice of development pathway: As outlined above, the right and early choice of the development model is crucial for defining a vision for India and entering a low-carbon pathway that also meets the developmental needs of India. An informed and broad discourse about the development choices; leapfrogging possibilities (instead of repeating the mistakes of industrialized economies), and international technological and financial support for the same should be fostered by various stakeholders in India. The government of India should consider leapfrogging as a valid alternative to following the fossil pathways. In regard to the energy-related aspects of leapfrogging, measures such as renewable energies substitution to adopt eco-friendly fuel, the use of renewable energy technology, and gradual increment in application of energy and emission standards will prove useful both as short and medium term strategies. It is required that cost-effective decentralized energy options are developed and implemented, and power generation efficiency is improved along with enhancing end-use energy efficiency in various sectors. As a long-term strategy this can be ensured with greater emphasis on research and development, transfer and use of energy efficient technologies. The priority should be to help technology mature and create mechanisms which could aid in the realization of potential of wind and solar energy generation. This will help in exploring full potential and stimulate economic growth and also make alternative options economically viable across all levels. In this way, India would be able to leapfrog some of the emission intensive technologies which are supposed to be phased-out in the developed countries through the US-American coal cap or the German energy transition and India would be able to directly utilize the cleaner alternatives.
3. Lessons from Rio+20 for India: The present study also provides a window for civil society to input into this framework by doing further research on the articulation of a society which India must strive towards reaching. The outcome document of Rio+20, titled ‘The Future we Want’ recognizes the need for a radical perspective as a future imperative: “We recognize that poverty eradication, changing unsustainable and promoting sustainable patterns of consumption and production, and protecting and managing the natural resource base of economic and social development are the overarching objectives and essential requirements for sustainable development”vii. To conceptualise an alternative social economic environment framework should be an imperative for the government of India and civil society.
4. Applying national equity: At the international level India rightly argues for the application of the equity principle in arriving at a fair and just climate deal. The same should be applicable to the situation within India as well, particularly because the per capita ecological footprint of the wealthiest Indians (top 0.01%) is 330 times that of the poorest 40% of India’s population!viii India should develop the political will to address issues of climate justice and energy access. Given its vast renewable energy sources, India does have greater potential to meet the energy needs of its energy-denied population through alternative measures. In the long run, large centrally controlled energy systems
viiThe Future We Want, 2012: http://www.uncsd2012.org/content/documents/727The%20Future%20We%20Want%2019%20June%201230pm.pdf
viiiAseem Shrivastava and Ashish Kothari: Globalisation in India: impacts and Alternatives, Kalpavriksh, 2012, p 2

Low-carbon Development Pathways for a Sustainable India | IX
need to give way to easily accessible and locally managed viable initiatives and indiscriminate energy consumption to energy equity. Currently, the energy generated in large power plants does not provide energy access for people, who most need it. This opens up many challenging possibilities:
- About 300 million people in India do not have access to electricity, offering the possibility of tremendous leapfrogging technology options embedded in renewable technologies.
- The transport sector is one of the largest consumers of energy, next only to the industry and commercial sector, yet one fourth of India’s villages do not have proper road access, and more than half our population has little access to efficient public transport. This provides huge options to rethink the transport policy in favour of energy-efficient mass transport systems in urban and rural areas including non-motorised forms of transport.
- Buildings already account for more than 30% of the country’s electricity consumption. Nearly 70% of the buildings in India, which will exist by 2030, have yet to be built, providing scope for remarkable choices for energy efficiency systems and shifts in the current coal intensive energy source for electricity generationix.
- More than half of the Indian population does not reside in permanent homes, leaving great possibilities for appropriate sustainable housing technologies. The above, and several other fields such as water, food security, access to health care, etc. call for the need of redistribution of resources within India.
5. Access to energy and per capita emissions: Energy access is in particular an equity issue related to low-carbon development. For example considering that the per capita emissions of the rural poor is about 0.9x tons per year, and for the 1/3rd of the population living below the poverty line, much below 0.9 tons per person per year, there is space to grow for these sections of the population. On the other hand the energy consumption of the richer population (those with income above.30,000/ USD 500 a month) emits 4.5 times more than that of the poorest (income below. 3000/USD 50 per month)xi. The challenge is to rethink the energy consumption and production patterns. The present study attempts to facilitate attainment of development goals with a low-carbon path and assumes that future work on this subject will provide more insights on options and possibilities.
C. Policy recommendations: The crucial role of Government of India Core to the success of a low-carbon development pathway for a ‘sustainable India’ are the policies that are enacted and implemented. The partners recommend the following four policy decisions for meeting developmental goals:
1. Increased investment in health care and education: For guaranteeing development and well-being in India the investments in health, sanitation, water and education need to be scaled up to 7% of annual GDP by additional investment by 2015 and onwards. However, given the abysmal standards of current public health care and education systems, there is a need to envision and develop quality health care systems, including the role of indigenous systems, as well as quality education other than the mean years of schooling. It is imperative that efforts are made to invest in effective institutions and human resources for quality health care and educational systems for envisioning ‘well-being’ in the context of a sustainable India. Nurturing health and education is likely to impact positively on the vast human potential in all spheres of life and hence would have a multiplier effect for the effectiveness for a ‘Sustainable India’.
2. Access to electricity: The present study envisages at least 1kwh electricity per day to the poorest households by 2015. Such a benchmark challenges the notion of achieving energy security adequate for a life with dignity for the poor in India even in 2050. The current problem is that almost half the rural population
ixhttp://switchboard.nrdc.org/blogs/ajaiswal/accelerating_energy_efficient.htmlxThis has been calculated at 50% of the Indian national average which stands at 1.8 tons per person per year and has been validated by informal local surveys undertaken by civil society organizations at the grassroots level. See Joy, K.J. and S. Paranjape (2004): Watershed Development Review – Issues and Prospects, CISED, Bangalore.xiAseem Shrivastava and Ashish Kothari: Globalisation in India: impacts and Alternatives, Kalpavriksh, 2012, p 7

X | Low-carbon Development Pathways for a Sustainable India
of India, about 300 million people, does not have access to electricity. This implies that the country has huge options for ensuring energy security to all by investing adequately both in the realm of leapfrogging technologies and energy equity measures.
3. Access to clean cooking fuels: The study shows that only 12% of the rural households have access to clean cooking fuels. The Visionary Development and Low-Carbon Development scenarios provide 6 cylinders of LPG per year to all households from 2015 onwards. Since LPG is substantially imported, it is a huge challenge for India to develop leapfrogging technologies. Hence this is an area that needs special attention for ecologically sustainable technology development for clean cooking fuels.
4. Environment friendly housing material for shelter: About half the rural households and one third of urban households live in temporary shelters as indicated in this study. One of the key investments for India is to ensure durable or ‘pakka’ houses to its entire population as part of its development obligations. The scenarios provide for ‘pakka’ houses to all by 2030. It is common knowledge that buildings use much energy. In this context appropriate research and technology initiatives for environment friendly housing materials, architecture and planning need to be prioritized for promoting durable houses.
The main sector for a low-carbon transformation in India is as described in the study the power (electricity) sector. Both suggested low-carbon development pathways emphasise a shift towards renewable energy sources as replacement for fossil fuels as well as enhanced energy efficiency measures. For a developing country like India with extensive energy poverty, it is important to ensure a balanced policy that considers reasonable financial impact on consumers and tax payers to support large grid-connected renewable energies and at the same time, promote robust decentralized renewable energy solutions in order to ensure access to energy. Regarding the low-carbon pathway, the partners have the following recommendations:
5. Shifting energy mix towards renewable energy and ensuring energy efficiency: Most central to a low-carbon development is the limited share of fossil fuels like coal, crude petroleum products and petroleum products. During the transition phase, the share of natural gas in electricity generation should be increased to have a balanced supply with renewable sources like solar and wind energy.
6. Implementation of existing instruments: India’s National Action Plan on Climate Change (NAPCC) and other existing policies already suggest and enact a range of low-carbon policies like bidding schemes, feed in tariffs, taxes, and energy efficiency labeling. The first step for a successful low-carbon pathway would be to fully implement these existing instruments and improving them consistently by, for example, adding compliance mechanisms.
7. Scaling up renewable energies by investments and infrastructure: To restrict CO2 emissions, ensure access, and energy security in the low-carbon development scenarios an increase in the use of renewable sources of energy is envisaged. The electricity share of renewable energy sources such as solar, wind and hydro power increases substantially to 41% and 44% (LC1 and LC2 respectively) until 2050 in the study, supported by a shift towards gas-based generation as compared to coal-based power generation. Thus, government, businesses and investors should increase their trust in renewable energy technologies being able to meet large shares of energy demand at affordable prices, and achieve renewable energy generation in a sustainable way. The focus by Government of India in fostering renewable energies should not only lie in implementing the defined national and state-level targets by the technology of solar, wind and hydro power itself, but should also consider the bottlenecks of the transmission (reduce transmission losses to 12% until 2050

Low-carbon Development Pathways for a Sustainable India | XI
as the study suggests) and the grid and storage. Government, businesses and investors should address technical and operational issues with renewable energy technologies. This will be useful to meet large shares of energy demand at affordable prices and achieve renewable energy generation in a sustainable way. Moreover, market structures, decentralised solutions and price regulations will need to be addressed by:
A. Designing robust decentralized renewable energy solutions to provide reliable access to clean energy to the poor. The current solar programme focuses on grid-connected solutions while a serious solar strategy must promote decentralised / off-grid solutions in parallel. Decentralised solar energy especially must be subsidised in order to promote solar energy use and make it not only affordable but also attractive.
B. Increasing manufacturing capacity in the country, short-term support from the government to bridge the viability gap, aggressive research and development, and large-scale deployment are required. Economic initiatives need to pay respect to the Indian solar market in order to keep benefits in the country. This means that the Indian solar industry must improve, and at least in some niches become capable of competing at the world market. Including research and medium size businesses in renewable energy business models might be advisable.
C. Storage solutions for renewable energies such as wind and in particular for solar energy as India’s high potential renewable source, both photovoltaic and thermal, technological innovation and cost reduction both for large-scale installations and decentralized options must be increased. Not only the technological know-how but also the management of renewable technologies must be obtained.
D. Developing integrated electricity systems – renewable energy grid, mini grids and smart grid networks -, and making renewable energies affordable before completely phasing out of fossil fuels is an imperative for guaranteed energy access. The government should create tariff structures that benefits households. The integrated electricity systems require large grid improvement as renewable energy use depends on functional grids.
E. The timely variability in production during the day and throughout the year and assured, uninterrupted energy supply must be secured by storage and grid improvement. These two bottlenecks in the energy shift towards renewables remain to be solved in terms of technology development (partly ongoing in other countries) and implementation in India.
F. Strengthened market mechanisms for installation of solar and wind-based projects would help up-scaling of renewables.
These measures should be undertaken while renewables are maximised in parallel through being used ‘naturally’ (sun-drying of cloths or using daylight instead of electric lightning).
8. Implementing energy efficiency: Energy efficiency improvements are considered by the study across various sectors such as power, industry, buildings as well as the domestic sector. The study is based on 30% and 36% (LC1 and LC2) energy-demand reduction by efficient household appliances. Energy-efficient commercial buildings should be promoted which comply with the Energy Conservation Building Code (ECBC). Due to their 30% lesser energy requirements these buildings are economically wise despite their slightly higher building costs. Greater emphasis is laid on energy efficiency suggesting AEEI rate improvements of 1.2 to 1.5% from 2005 to 2050 in the energy sector as for the cement and steel industry. Additionally, it is required to enhance the effectiveness of central grid extension through electricity transmission and distribution improvement. We recommend that grid losses must be reduced at the rate of 0.3 to 0.5 % to bring it at the level of 12% by 2050. The government of India should ensure the full implementation of the NAPCC’s energy efficiency

XII | Low-carbon Development Pathways for a Sustainable India
mission under the National Action Plan on Climate Change along with its existing policies, and scale these up.
9. Fuel shift and behaviour change in the transportation sector: The transport sector involves a higher modal share of rail for freight movement: The study suggests shifting 67% of goods transport from the roads to rails, as compared to today’s 34%. It suggests that from 2015 onwards, the share of roadways in freight traffic will decrease by 2.5 % annually and that railways will carry that amount of additional freight. Moreover, it recommends increased electrification of the transport fleet, and a fuel shift towards compressed natural gas. Besides these technical improvements, increased use of public transportation is modelled by reducing household demand for petroleum products to reflect greater use of more energy efficient public transport and non-motorized transport. Metro, bus and three-wheeler systems must be improved and made better accessible for daily use, encouraging behaviour change for public transportation use, especially in India’s larger cities. The share of cleaner fuels like CNGs needs to be widened across the country. The Government of India should consider framing a SDG on 50% public transportation in cities. Beyond the scope of the presented model the partners recommend the provision of walking and biking lanes in cities for enhancing safe non-motorised transportation and life-quality improvement.
10. Increasing the sequestration capacity of Indian forests: As recommended by the study, the sequestration of carbon emissions should increase by 2050 to 264 million tonnes CO2 annually. This target is in line with the current Green India Mission and the Government of India should guarantee a healthy forest cover as a safe carbon sink.
11. Decreasing carbon footprints of urban consumption: With increasing urbanisation, there is a need for a careful analysis of the consumption patterns in the urban areas that could reduce the demand for energy, as well as of transport and goods. This would require not only technical interventions but also lifestyle changes towards less resource intensive consumption. An acceptable model of alternative lifestyle needs to be evolved. For want of such a model the study has not dealt with such alternatives. It is highly recommended that the Government of India shows the courage to seriously consider the area of urban consumption and growing middle class consumption, and generates a debate on alternative lifestyles.
12. Formulating an Indian NAMA and seeking international cooperation: The above mentioned required shifts extend the capacity of India to implement the drastic changes in developmental choices and technology options. Thus, the Government of India as well as businesses and research stakeholders should engage in international cooperation for research and technology transfer, especially on renewable energies and energy efficiency technologies. Channels for international funding should also be explored. Formulating a National Appropriate Mitigation Action (NAMA) would be a good opportunity to trigger such international cooperation of special importance for technology transfer and a share of the required funding. The required institutional structures should be created for allowing this.

Low-carbon Development Pathways for a Sustainable India | i
Low-carbon Development Pathways for a Sustainable India

ii | Low-carbon Development Pathways for a Sustainable India
Project teamDr Kirit Parikh (mentor) Dr Jyoti ParikhDr Probal GhoshMs Gayatri Khedkar
Supported byWWF-India, New Delhi, India Centre for Environment Education, Ahmedabad, IndiaLAYA, Visakhapatnam, IndiaChurch’s Auxiliary for Social Action, New Delhi, IndiaBread for the World – Protestant Development Service, Berlin, GermanyWelthungerhilfe, Bonn, Germany
Technical AdvisorÖko Institute e.V., Freiburg, Germany

Low-carbon Development Pathways for a Sustainable India | iii
The climate crisis has forced every nation to re-examine its development process. Growth processes can no longer follow traditional pathways, which depend heavily on fossil fuels. Developing countries, in particular, will have to strike a balance between their development goals and the carbon constraints stipulated by global carbon budget estimates.
Development economists, demographers and people working in the field of human development have been looking at developmental issues, while low-carbon pathways have been addressed mostly from the point of view of technologists. At present, India lacks a rigorous modelling framework, which can deal with development issues together with mitigation actions. IRADe has had the opportunity and experience of working in both these areas. In this study, IRADe has tried to create such a framework and has initiated research on an integrated analysis of climate change and development for India.
The study has taken the approach of step-by-step analysis for reaching low-carbon development pathways by 2050. Since the global carbon budget provides the share of each country in the global carbon space from 2010 to 2050, it is important to formulate low-carbon pathways that will adhere to such a carbon budget constraint by 2050. However, it is not sufficient for India to shift from a business-as-usual scenario to low-carbon pathways; the country has to first deal with pressing issues of poverty, health, education and many developmental priorities. While calculating the costs of shifting to low-carbon pathways, one needs to incorporate the cost of development as well.
Accordingly, the study has built four scenarios: Dynamics As Usual (a business-as-usual scenario that incorporates trends of government policies and expenditures), Visionary Development scenario (which sets targets for various human development indicators to be achieved by 2050 and assesses costs required for them) and two Low-carbon Development scenarios (which achieve visionary targets of human development, while adhering to two carbon budgets, with 1990 and 2010 as the base years). To create the low-carbon development pathways, the study has focused on the major emissions sectors in the Indian economy, viz., power, transport, industry, household and energy, over and above some economy-wide interventions.
As one would expect, different stakeholders look at development differently, and a challenging, yet essential, task of the study was to undertake a comprehensive assessment of development, in terms of a macroeconomic climate model. The quantification of the causal factors at play behind well-being indicators, as well as the assessment of their financial and emissions implications are the distinctive features of the study.
Whereas constructing a Visionary Development scenario requires socio-economic research, designing a low-carbon development pathway requires identifying the major emissions sectors in the economy and incorporating various low-carbon technologies. Though a wide range of technologies are available, there are viability issues and ethical concerns regarding many power technologies, and due concern has been given to these in the report.
This is a first-of-its-kind study to address development concerns in the climate- modelling framework. Interim results of this work were presented at a side event, “Peoples’ Voices in policy choices: A low carbon vision for sustainable India”, organized at the Conference of Parties (COP, Doha) at Qatar on 3 December 2012. The study received good feedback at the event.
Preface

iv | Low-carbon Development Pathways for a Sustainable India
We at IRADe hope that this study will play a critical role in the discourse on integrated climate change protection and development in India, and beyond, by presenting an alternative vision for policy choices. We hope that it will help generate policy discussions, open new research arenas and enable NGOs, government, academia and research institutions as well as multilateral institutions to address issues in a quantitative manner.
We interacted frequently with partners. The process of communicating in non-technical language with persons of different disciplinary background, perceptions and beliefs was a long drawn out challenge, particularly because some of the partners had unrealistic expectations about what a quantitative model can provide. We hope all of us have broadened our vision.
IRADe would like to thank the partner organizations (viz: WWF-India, Centre for Environment Education, LAYA, Church’s Auxiliary for Social Action, Bread for the World – Protestant Development Service and Welthungerhilfe), including its technical advisor Öko Institute e.V., Germany, for the financial support and extensive technical inputs provided for the study.
IRADe aims at doing further research in this field, analysing implications of higher development goals and incorporating more low-carbon technologies into the analysis. We request the readers of this report to provide us with their valuable feedback as we take this exercise to the next level of research.
Jyoti ParikhExecutive Director
IRADe3 September 2013

Low-carbon Development Pathways for a Sustainable India | v
We at IRADe sincerely thank WWF-India, Centre for Environment Education, LAYA, Church’s Auxiliary for Social Action, Bread for the World – Protestant Development Service and Welthungerhilfe for supporting the study on “Low-carbon Development Pathways for a Sustainable India”.
We would like to especially appreciate the efforts of Dr T.S. Panwar, Director, Climate Change and Energy Programme, WWF-India, in coordinating the project as well as in providing valuable technical input. He and Ms Sejal Worah were available to solve any difficulties we faced. Mr Kartikeya Sarabhai, Director, Centre for Environment Education (CEE) gave many suggestions for improving the scenarios and facilitating the process of communication among partners.
We are grateful to Mr Thomas Hirsch and Ms Sabine Minninger of Bread for the World, Mr Michael Kuehn of the Deutsche Welthungerhilfe, Dr Nafisa D’Souza, director of LAYA, Mr Dinesh Vyas of CASA, Mr Praveen Prakash and Ms Rixa Schwarz of CEE for making pertinent comments, which led to refinements of the drafts and even the scenarios constructed.
Dr Felix of Öko Institute e.V., Germany, came to India on a special visit and guided the team on low-carbon technology analysis. The team benefitted by his expertise and experience.
Interim results of this work were presented at a side event organized at the Conference of Parties (COP, Doha) at Qatar in December 2012. We thank the partners for arranging this event, in which the study got good feedback.
Four stakeholder meetings were organized in four major cities of the country, namely, Delhi, Mumbai, Bangalore and Kolkata to understand the views of various stakeholders, such as researchers, non-governmental organizations and activists, both in the field of development as well as climate change. These stakeholder meetings proved to be very helpful in taking into account the diverse views on the subject matter. The team would like to thank the organizers as well as all the participants of these stakeholder meetings.
Constructing well-being indicators for India required substantial data mining as well as expertise in the field of development. The Institute of Human Development, New Delhi, assisted IRADe in the task. We would like to especially acknowledge the efforts put in by Dr Dev Nathan, Dr Sandip Sarkar and Mr Abhishek Kumar in providing an indicative list of well-being indicators for India and time series data for the same.
The Center for Study of Science, Technology and Policy, Bangalore, helped provide recent analysis on wind and solar technologies in India, and we would like to thank Dr Sharad Rao for the same.
Ms Nirnajana Prasad and Mrs Jayeeta Bhadra require special mention for their invaluable research support. We are also thankful to Ms Yogeeta Sharma for editorial support.
Acknowledgments

vi | Low-carbon Development Pathways for a Sustainable India

Low-carbon Development Pathways for a Sustainable India | vii
ContentsPreface iiiAcknowledgments v List of Tables ixList of Figures xiList of Annexures xiiiList of Acronyms and Abbreviations xiiiExecutive Summary xvChapter 1 Introduction 1
1.1 Background 11.2 Issues to be explored 1
Chapter 2 Methodology, Brief Description Of Model, Data And Assumptions 3
2.1 Methodology of the study 32.2 Brief description of the IRADe model 32.3 CO2 and non-CO2 emissions 42.4 Sectoral break-up in IRADe– LCDS model 5
2.4.1 Energy sector 6 2.4.2 Power sector 7 2.4.3 Cement and steel sectors 9 2.4.4 Transport sector 9 2.4.5 Household consumption 9
2.5 Measurement of poverty in the model 122.6 Limitations of the model 132.7 Brief scenario descriptions 14
Chapter 3 Dynamics-as-Usual scenario 153.1 Assumptions behind DAU 15
3.1.1 Role of government 153.1.2 Electricity generation options 163.1.3 Autonomous energy efficiency improvement 16
3.2 Results of Dynamics-as-Usual scenario 173.2.1 Macroeconomic characteristics of DAU 173.2.2 CO2 emissions profile in DAU 18
Chapter 4 Visionary Development scenario 214.1 Present development scenario in India 214.2 Well-being indicators and development thresholds5 224.3 Methodology adopted to determine development thresholds 234.4 Determining the factors governing well-being indicators 254.5 Development interventions and policy framework for the Visionary Development scenario 254.6 Results of the Visionary Development scenario 31
4.6.1 Achievements in well-being indicators 314.6.2 Assessment of the cost of Visionary Development scenario 394.6.3 Impact of Visionary Development on carbon emissions 40
Chapter 5 Low-carbon Development scenarios 435.1 Deciding carbon budget for India 43
5.1.1 Adhering to the carbon budget by 2050 45

viii | Low-carbon Development Pathways for a Sustainable India
5.2 Interventions in Low-carbon Development scenarios 465.2.1 Energy sector 465.2.2 Power sector 46
5.2.2.1 Fossil fuels 475.2.2.2 Nuclear fuel 475.2.2.3Renewable sources 47
5.2.3 Transport sector 495.2.3.1 Modal shift in freight transport 495.2.3.2 Fuel alternatives 50
5.2.4 Industry sector 505.2.5 Household consumption sector 52
5.2.5.1 Reduction in demand for transport in household consumption 525.2.5.2 Increase in usage of energy-efficient electric appliances 52
5.2.6 Buildings sector 535.2.7. Forestry sector 53
5.3 Results of the Low-carbon Development scenario 545.3.1 Impact on carbon emissions 545.3.2 Costs to the economy of shifting to a low-carbon development pathway 645.3.3 Decomposition analysis of the Low-carbon Development scenario 64
Chapter 6 Summary and conclusions 69Annexures 73
Annexure 1 IRADe–LCDS model equations 73Annexure 2 Total factor productivity growth in India 75Annexure 3 Autonomous energy efficiency improvements for India 77Annexure 4 Wind power potential for India 77Annexure 5 Detailed analysis of well-being indicators 79Annexure 6 Projecting mean years of schooling 88Annexure 7 Tables 92
List of References 103

Low-carbon Development Pathways for a Sustainable India | ix
Table 1 Details of well-being indicators chosen for the study xvi
Table 2 Progress of well-being indicators in the VD scenario xviii
Table 3 Assumptions about important control parameters in the IRADe– LCDS model 4
Table 4 Natural resource availability of different fossil fuels and the rates of resource growth 6
Table 5 Fossil fuel import prices in the model 7
Table 6 Production and imports of fossil fuels in the DAU scenario 7
Table 7 Capital costs of power technologies 8
Table 8 Potential of power technologies 8
Table 9 AEEI parameters in Dynamics as Usual 17
Table 10 List of well-being indicators considered for the VD scenario 23
Table 11 Country classification on the basis of the human development index 23
Table 12 Well- being indicators chosen for India in the VD scenario, level of achievement at present and development thresholds for 2050 24
Table 13 Public health expenditure in recent years 27
Table 14 Public expenditure on education in recent years 28
Table 15 Total cost of building additional houses 29
Table 16 Derivation of subsidy for minimum electricity consumption 29
Table 17 WBGU approach – India’s carbon budget based on 1990 and 2010 45
Table 18 India’s GHG emissions 45
Table 19 AEEI (per cent per annum) 46
Table 20 Falling costs of wind and solar in Low-carbon Development scenarios 48
Table 21 Share of rail transport in the freight market 49
Table 22 Energy intensity of freight, by mode 49
Table 23 Targets and rates of reduction of specific energy consumption of designated consumers under the first phase (2012-2015) of the PAT scheme 51
Table 24 Scope for emissions intensity reduction in major industries (MT CO2e/MT) 51
Table 25 Annual rate of energy efficiency improvement (% per year) 52
List of Tables

x | Low-carbon Development Pathways for a Sustainable India
Table 26 2007 GHG sequestration from LULUCF (in million tonnes of CO2/year) 53
Table 27 Share of various technologies in electricity generation in 2050 60
Table 28 Percentage reduction in CO2 emissions in LC1 compared with VD 65
Table 29 Percentage reduction in CO2 emissions in LC2 compared with VD 66
Table 30 Snapshot of the achievements in VD as in 2050 70
Table 31 Total economy TFPG from 1960 to 1984 for India 75
Table 32 Total economy TFPG from 1960 to 1999 for India 75
Table 33 Total economy TFPG combined analysis of various studies for India 76
Table 34 Autonomous energy efficiency index, 1991-2011 77
Table 35 Wind power potential in India (in Gw) 78
Table 36 CSTEP estimate of wind potential in India (in Gw) 78
Table 37 Ratio – Berkeley estimate to CSTEP estimate 78
Table 38 Life expectancy 79
Table 39 Infant mortality rates across countries 81
Table 40 Infant mortality rate based on a three-year period (2008-10) 81
Table 41 Education-specific mean years of schooling of the labour force in 2007-08 82
Table 42 Poverty indicators, as per the Planning Commission of India 87
Table 43 Poverty across states (Tendulkar Methodology, 2009-10) 87
Table 44 Gross enrolment ratio 88
Table 45 Years of schooling for a child entering different classes in the year 90
Table 46 Mean years of schooling in the DAU scenario 90
Table 47 Mean years of schooling in the VD Scenario 91

Low-carbon Development Pathways for a Sustainable India | xi
Figure 1 Percentage Share of CO2 and non-CO2 emissions in India 5
Figure 2 CO2 emissions, by sector, in 2007 5
Figure 3 Consumption shares in % for different commodities across different expenditure classes in rural areas 10
Figure 4 Proportion of rural population across classes 11
Figure 5 Consumption shares in % for different commodities across different expenditure classes in urban areas 11
Figure 6 Proportion of urban population across classes 12
Figure 7 GDP at 2003-04 prices 17
Figure 8 Per Capita Consumption Expenditure (INR/ Year) at 2003-04 Prices 17
Figure 9 CO2 emissions per year in DAU 18
Figure 10 Cumulative CO2 emissions in DAU 18
Figure 11 CO2 intensity of the GDP in DAU 18
Figure 12 Per capita CO2 emissions in DAU 18
Figure 13 Sectoral CO2 emissions (million tonnes) in DAU 19
Figure 14 Electricity generation in DAU 20
Figure 15 Progress of India on the human development index since 1980 21
Figure 16 Life expectancy at birth (female) 32
Figure 17 Life expectancy at birth (male) 33
Figure 18 Infant mortality rate 33
Figure 19 Mean years of schooling 34
Figure 20 Rural population earning less than INR 227 at 2003-04 constant prices 35
Figure 21 Urban population earning less than INR 360 at 2003-04 constant prices 35
Figure 22 Access to clean water 36
Figure 23 Access to sanitation 37
Figure 24 Per person per annum average electricity consumption in poor rural households 37
Figure 25 Per person per annum average electricity consumption in poor urban households 38
Figure 26 Per capita consumption expenditure in DAU and VD 39
Figure 27 GDP in DAU and VD 40
Figure 28 Cumulative emissions in DAU and VD 40
Figure29 CO2 emissions per year in DAU and VD 40
Figure 30 Per capita CO2 emissions in DAU and VD 41
Figure 31 CO2 intensity of the GDP in DAU and VD 41
Figure 32 Sectoral emissions in DAU and VD 41
List of Figures

xii | Low-carbon Development Pathways for a Sustainable India
Figure 33 Electricity generation in DAU 42
Figure 34 Electricity generation in VD 42
Figure 35 Historical series of India’s CO2 emissions from fuel combustion 45
Figure 36 Cumulative emissions 54
Figure 37 Annual CO2 emissions in VD, LC1 and LC2 55
Figure 38 Per capita carbon emissions in VD, LC1 and LC2 55
Figure 39 CO2 intensity of GDP in VD, LC1 and LC2 56
Figure 40 Sectoral emissions (2020) 56
Figure 41 Sectoral emissions (2030) 56
Figure 42 Sectoral emissions (2040) 56
Figure 43 Sectoral emissions (2050) 56
Figure 44 Electricity generation in VD 58
Figure 45 Electricity generation in LC1 58
Figure 46 Electricity generation in LC2 59
Figure 47 Power sector emissions 60
Figure 48 Energy sector emissions 61
Figure 49 Transport sector emissions 61
Figure 50 Industry sector emissions 62
Figure 51 Iron and steel and cement industry break- up of CO2 emissions 63
Figure 52 Emissions in rural areas 63
Figure 53 Emissions in urban areas 63
Figure 54 GDP (at 2003-04 constant prices) in LC1 and LC2 compared to VD 64
Figure 55 Decomposition of CO2 reduction in LC1compared with VD 66
Figure 56 Decomposition of CO2 reduction in LC2 compared with VD 67
Figure 57 Mean years of schooling across states in 2010 83
Figure 58 Percentage of rural households, by main source of drinking water 83
Figure 59 Percentage of rural households, by type of latrine facility 84
Figure 60 Percentage of urban households, by type of latrine facility 84
Figure 61 Percentage of households, by cooking fuel 85
Figure 62 Percentage share of total households, by light source 85
Figure 63 Structural types of houses 86
Figure 64 State- specific poverty lines, numbers and percentages of population living below the poverty line in different states (2009-10) 88
Figure 65 GER for class I and class VI 89
Figure 66 Dropout rates till classes V, VIII and X 89

Low-carbon Development Pathways for a Sustainable India | xiii
Annexure 1 - IRADe–LCDS model equations
Annexure 2 - Total factor productivity growth in India
Annexure 3 - Autonomous energy efficiency improvements for India
Annexure 4 - Wind power potential for India
Annexure 5 - Detailed analysis of well-being indicators
Annexure 6 - Projecting mean years of schooling
AEEI - Autonomous Energy Efficiency Improvement
DAU - Dynamics-as-Usual Scenario
GAMS - General Algebraic Modeling System
GEA - Global Energy Assessment
IEA - International Energy Agency
kWh - Kilowatt Hour
LC - Low-carbon Development scenario
MGNREGA - Mahatma Gandhi National Rural Employment Guarantee Act
PDV - Present Discounted Value
RH - Rural Household
TFPG - Total Factor Productivity Growth
UH- Urban Household
VD - Visionary Development Scenario
List of Annexures
List of Acronyms and Abbreviations

xiv | Low-carbon Development Pathways for a Sustainable India

Low-carbon Development Pathways for a Sustainable India | xv
Executive Summary
India needs to explore possible low-carbon pathways if it has to adhere to its share in the global carbon budget by 2050. Yet there is the simultaneous challenge of achieving development goals and ensuring that India’s human development is not compromised, while adopting low-carbon pathways.
The study aims to show that low-carbon pathways in India can be followed and at the same time, its development goals can be
achieved by 2050. The study is based on the IRADe– LCSD (low-carbon sustainable development) model, which is a dynamic, multi-sectoral and inter- temporal linear programming activity analysis model based on an input–output framework. The model focuses on only CO2 emissions and not all GHG emissions. The model has 25 sectors but a detailed sectoral analysis is done for five sectors of the economy, which are responsible for major CO2 emissions, namely, power, transport, industry, energy and household. The model runs on 2003-04 constant prices and simulates from 2005. It reports results for 2050 as well as interim results for 2020, 2030 and 2040.
ScenariosFour scenarios are constructed to assess the transitions of India to low- carbon sustainable development pathways till 2050 to meet its human development thresholds, while adhering to the carbon budget.
A. Dynamics as Usual (DAU): It shows the trend analysis for India till 2050, based on recent past data and trends. It includes the impact of government policies already in place before 2005 (as the model starts simulating from 2005).
B. Visionary Development (VD): It incorporates policies to achieve human development thresholds and well-being indicators and compares the results with the Dynamics-as-Usual scenario.
C. Low-carbon Development scenarios (LC): Two scenarios are constructed to show low-carbon pathways adhering to two alternative carbon budgets for India over the period from 2010 to 2050. These provide cumulative CO2 emissions of 155 gigatonnes (Gt) and 133 Gt. Low-carbon development pathways include the development thresholds achieved in the Visionary Development scenario.
Dynamics-as-Usual scenarioThe Dynamics-as-Usual (DAU) scenario shows the growth trajectory, level of development and emissions in India by 2050 if current trends continue. The maximization of household consumption is the main driver in the Dynamics-as-Usual scenario. DAU does not have any specific additional policies for development nor does it have a carbon constraint. It continues the policies as well as patterns of government expenditure prevailing in 2003-04. The trends of fossil fuel as well as renewable sources used in the power, transport, energy, industry and household sectors are assumed to continue. However, there is an autonomous energy efficiency improvement (AEEI) factor, which accounts for a historical rate of improvement in energy efficiency in various sectors. In addition, in the DAU situation, the total factor productivity growth (TFPG) continues at the rate at which productivity growth has been taking place in India. Thus, Dynamics as Usual is a base case scenario if current actions on the development front as well as in climate change in India continue till 2050.
Visionary Development scenario The Visionary Development (VD) scenario identifies the shortfalls in the Dynamics-as-Usual trajectory in achieving development goals by 2050 and, accordingly, provides for various interventions in the economy to reach the development thresholds. Development here refers to human development as defined by UNDP human development indicators and various indicators of the World Bank. The scenario aims to reach the level of “very high human development countries”, as set out in Human Development Report 2013, and to achieve a human development index value of 0.905
Executive Summary

xvi | Low-carbon Development Pathways for a Sustainable India
Executive Summary
by 2050 from the current level of 0.554. In addition, IRADe has identified durable housing, access to clean cooking fuels and access to electricity as important factors in improving the standard of living in India and has set targets for universal access of the same. Table 1 discusses, in detail, the well-being indicators incorporated in the VD scenario, the current levels of these indicators in India and the development thresholds to be achieved by 2050.
Table 1 Details of well-being indicators chosen for the study
Brief description of the well-being indicator
Most recent available value of the indicator
Development threshold to be achieved by 2050 or before
Gap between present value and threshold value
Human development index (HDI)a 0.554 0.905 0.351
Life expectancy at birtha (the number of years a newborn infant would live if prevailing patterns of mortality at the time of its birth were to stay the same throughout its life)
65.8 80.1 14.3
Infant mortality ratea (number of deaths of children before they attain the age of one, per 1,000 live births)
48 5 -43
Mean years of schoolinga (the average number of years of education received by people aged25 years and more, converted from education attainment levels, using official durations of each level)
5.48 11.5 6.02
Percentage of households with access to improved water sourceb (includes tap water, borehole, handpump, covered well and springs, according to the World Bank definition)
90.5 100 9.5
Percentage of households with access to improved sanitation facilitiesb (includes latrine facility with water closet, covered pit latrine and public latrine, according to the World Bank definition)
47.2 100 52.8
Percentage of rural households with access to clean cooking fuelsc (including LPG/PNG, electricity and biogas)
11.9 100 88.1
Percentage of urban households with access to clean cooking fuelsc (including LPG/PNG, electricity and biogas)
65.5 100 34.5
Percentage of rural households living in durable housesc
46 100 54
Percentage of urban households living in durable housesc
68 100 32
Percentage of rural households with access to electricityc
55.3 100 44.7
Percentage of urban households with access to electricityc
92.7 100 7.3
Poverty headcount ratiob (percentage of population below poverty line, based on Tendulkar Committee methodology)
29.8 0 -29.8
Source:a - UNDP, 2013ab - Planning Commission of India, 2010 c - Census 2011

Low-carbon Development Pathways for a Sustainable India | xvii
Executive Summary
To achieve the targets of development thresholds, it is important to analyse the factors responsible for these well-being indicators. Cross-country regression of over 100 countries using UNDP and World Bank data revealed that many indicators influence one another. For example, better access to water and sanitation improves life expectancy and also increases school enrolment. Better education reduces chances of infant mortality and so on. This study has assessed additional expenditures and/or the reallocation of expenditure required for various development actions and incorporated the following interventions in the Visionary Development scenario.
1. To achieve the development thresholds in health (life expectancy, infant mortality), government expenditure on health and education is increased from 1.5 per cent to 4 per cent of the GDP in 2015 and, thereafter, it grows in that proportion at 7 per cent per year. This is to ensure better outcomes in health and education.
2. Access to clean drinking water and sanitation is universalized by 2020 and 2040, respectively.
3. The government of India has launched schemes to provide monetary support for constructing houses in rural and urban areas. The total durable housing backlog in the country has been assessed and government expenditure on these schemes has been stepped up, accordingly, to provide durable housing to all by 2030.
4. India faces major shortage of electricity, with regular power cuts and the lack of grid connectivity in rural areas. The model identifies the population that consumes less than 1 kWh of electricity per household per day (73 kWh per person per annum) and provides it with subsidized electricity to step up electricity consumption to the threshold level from 2015 onwards.
5. To reduce the dependence of rural population on cow dung and fuel wood for cooking, there is a provision for 90 kg of LPG or six cylinders per year to every household, and the government buys these and provides them free of cost to poor households.
6. Direct cash transfer is identified as the best way to provide all subsidies and income transfers to the poor. Cash transfers of INR 3,000 per person or roughly INR15,000 per household per year, at 2003-04 constant prices, are provided to the population in the two poorest consumption expenditure classes in both rural and urban areas till they come out of poverty and enter the next expenditure class. It is assumed that the government is able to levy additional taxes on the richer classes and is able to target it effectively.
Low-carbon Development scenariosLow-carbon Development scenarios take the analysis one step further and aim at achieving the development envisaged in the Visionary Development scenario, while reducing carbon emissions to the level of the prescribed carbon budget for India. The reference global carbon budget for the study is taken as 750 Gt of CO2, with 1990 as base year, and 600 Gt of CO2, with 2010 as base year, as given by the WBGU1 study. According to the principle of equity, on the basis of per capita allocation, for the period from 2010 to 2050, India is assigned a share of 156 Gt of cumulative CO2 emissions in the global carbon budget, with 1990 as the base year (in scenario LC1), and 133 Gt of cumulative CO2 emissions, with 2010 as the base year (in scenario LC2).
To reduce CO2 emissions, the following additional measures are introduced in the two scenarios, LC1 and LC2.
• Power sector – On the supply side, the capital costs of renewables, like solar and wind, are assumed to fall till 2025 at the rapid rate observed since 2005. After that, the improvement in TFPG will be 1 per cent as in the Visionary Development scenario. Improvements in electricity grids will reduce transmission and distribution losses by 12 percentage points by 2050.
1 WBGU (German Advisory Council on Climate Change) special report Solving the climate dilemma: The budget approach (WBGU 2009)

xviii | Low-carbon Development Pathways for a Sustainable India
Executive Summary
• Transport sector – Freight movement will shift from road to rail, and the share of railways in freight movement will increase from about 34 per cent in 2011-12 to 67 per cent by 2050. Also, the share of fuels used in transport will change over the period of time. The requirement for petroleum products inputs will fall by 2 per cent per year and will be replaced by CNG and electricity in the proportion of 60 and 40, respectively.
• Industry sector – There will be greater emphasis on energy efficiency so that the rate of AEEI increases from 1.2 per cent to 1.5 per cent except in power generation, where the scope for further reduction is considered small.
• Household sector – Households will use more efficient electrical appliances. Their marginal budget share for electricity will be reduced gradually and will reach a reduction of 36 per cent by 2050 compared to 2005. Households will use more fuel-efficient cars, public transport and non-motorized transport. This is modelled by reducing their marginal budget share for petroleum products, which will reach a reduction of 50 per cent by 2050 compared to 2005.
• Buildings sector – New commercial buildings will comply with the Energy Conservation Building Code (ECBC). They will have a slightly higher capital cost but will require 30 percent less energy as compared to the traditional buildings..
• Forestry sector – The green cover in the country is assumed to grow as per the Green India Mission of the National Action Plan on Climate Change. This will increase the sequestration of CO2 from 176 MT/year in 2005 to 264 MT/year in 2050.
Results Results show that Dynamics as Usual (DAU) achieves many development goals on its own by 2050 (access to water, access to electricity, reduction in infant mortality rate, etc.) However, one cannot wait till 2050 to achieve these development goals. Specific interventions taken in Visionary Development (VD) accelerate the process of development and achieve the human development thresholds earlier—by 2040, in the case of infant mortality reduction and by 2020, in the case of access to electricity. Poverty, as defined in the model (per capita monthly consumption of INR 227 in rural areas and INR 360 in urban areas at 2003-04 constant prices), is almost removed by 2020 in urban areas and by 2030 in rural areas with direct cash transfers in the VD scenario, whereas DAU will require a longer time to achieve poverty reduction. India substantially lags behind in the case of indicators like life expectancy at birth, mean years of schooling, durable housing, access to clean cooking fuels and access to sanitation. If this trend continues, India will not be able to reach the threshold levels even by 2050 in DAU. Hence, it is of utmost importance to step up government expenditure, put in place appropriate machinery and ensure last-mile delivery of health, education, housing, cooking fuel and sanitation facilities from 2015 onward. The results show that VD will achieve the threshold levels on these well-being indicators by 2050 if the interventions subscribed are successfully implemented.
Table 2 Progress of well-being indicators in the VD scenario
Well-being indicator 2020 2030 2040 2050
Life expectancy at birth(female), in years 73 78 80 80.31
Life expectancy at birth(male), in years 70 74 76 76
Infant mortality rate 25 7 2 2
Mean years of schooling 6.3 8.7 10.7 12.1
Population below poverty line2 (rural/urban )25 4 0 0
1 0 0 0
Access to clean water (% of population with access) 100 100 100 100
2 Poverty line in the model is defined as per capita monthly consumption expenditure of INR 227 in rural areas and INR 360 in urban areas in 2003-04 constant prices.

Low-carbon Development Pathways for a Sustainable India | xix
Executive Summary
Well-being indicator 2020 2030 2040 2050
Access to sanitation (% of population with access) 70 90 100 100
Average electricity consumption per person per year in the three poorest rural classes (kWh)3
85 105 158 257
Average electricity consumption per person per year in the three poorest urban classes (kWh)
101 128 187 322
It is, thus, possible to achieve Visionary Development with additional government expenditure/reallocation of resources and better governance. The human development envisioned in the VD scenario does not affect GDP growth in any significant way (see Figure 27). A redistribution of resources and specific attention to poor groups is important and will lead to an overall higher human development in the country than in DAU. Such human development will ensure sustainable growth and will also reduce the vulnerability of the poor to climate change.
In terms of emissions, the VD scenario is similar to DAU. However, both DAU and VD will lead to substantially higher CO2 emissions by 2050 and cross 380 Gt of cumulative CO2 emissions by 2050. The continued use of coal in power sector and petroleum products in the transport sector would be the reasons for this. However, it should be noted that autonomous energy efficiency improvement (AEEI), total factor productivity growth, increase in the capacity of solar and wind and the shift in technology from subcritical to supercritical coal plants will reduce the energy intensity and CO2 intensity of the GDP by 2050, compared to 2005 levels, even in the DAU and VD scenario CO2 intensity of the GDP would reduce by 50 per cent and 51 per cent in DAU and VD scenarios, respectively.
For achieving development at the same time as reducing CO2 emissions, cumulative emissions over 2010 to 2050 are restricted to 156 Gt and 133 Gt in LC1 and LC2, respectively. To achieve these targets, energy efficiency measures are taken in all sectors of the economy, as specified by higher AEEI coefficients. Over and above that, specific actions are taken in the five major CO2 emitting sectors of the economy, namely, power, transport, industry, household and energy, to adhere to the cumulative emissions constraints. The additional measures result in reducing the per capita CO2 emissions in 2050 from 13.1 tonnes in VD to 5 tonnes and 4.1 tonnes in LC1 and LC2, respectively. Annual emissions in 2050 are 7.61 Gt and 6.25 Gt in LC1 and LC2, respectively, compared to 20 Gt in VD .The emissions intensity in 2050 is 0.204 MT/USD billion GDP PPP (purchasing power parity) in VD. It comes down to 0.107 MT/USD billion GDP PPP and 0.106 MT/USD billion GDP PPP in LC1 and LC2, respectively.
The IRADe–LCSD model results show that the reductions in emissions required to stay within the carbon budget are accomplished by three things—lowering GDP, which reduces the demand and need for energy; increasing energy efficiency, which reduces energy requirement; and replacing the production of electricity from coal and gas with non-carbon emitting sources such as wind, solar, hydro electricity, etc., which lowers the emissions intensity. Compared to the VD scenario, total emissions in 2050 are lower by 62 per cent and 69 per cent in LC1 and LC2, respectively (see figures 55 and 56). In LC1, GDP loss contributes 21 per cent to emissions reductions, the share of energy efficiency is 12 per cent and that of lower emissions intensity is 29 per cent. The corresponding contributions in LC2 are 30 per cent, 11 per cent and 28 per cent, respectively.
From a sectoral viewpoint, emissions from the power and transport sectors, which shoot up in the DAU and VD scenarios (see figures 33 and 44), will need to be curbed substantially. The power portfolio changes completely by 2050 in the LC1 and LC2 scenarios compared to DAU and VD. Though there is a shift from subcritical to supercritical coal plants in the DAU and VD scenarios, the dependence on coal
3The average of electricity consumption per person per year in the three poorest rural and urban classes, which mainly benefit from subsidized electricity

xx | Low-carbon Development Pathways for a Sustainable India
Executive Summary
continues. More than 70 per cent of the total electricity generated in 2050 – nearly 14,000 billion kWh – is from coal-based power plants. In low-carbon scenario LC1 (see figure 45), out of a much lower generation of under than 7,000 billion kWh, less than 20 per cent is derived from coal by 2050.Solar becomes an important source of electricity generation, and solar photovoltaic (PV) produces 541 billion kWh of electricity in 2050. However, solar PV and wind energy generation are available only when there is sunshine or wind, and to satisfy power demand over other periods, solar PV with storage, hydroelectricity and gas-based plants are required even though they may involve higher costs. Solar PV with storage produces 927 billion kWh of electricity in 2050. Wind power (988 billion kWh) and hydro electricity (591 billion kWh) are other important sources in the LC1 scenario. As the role of coal reduces (a total of 1,118 billion kWh of electricity is generated from subcritical and supercritical plants), natural gas comes up as a major source of electricity generation by 2050 (2,684 billion kWh), for which investments in the economy start by 2035.
Interventions in the transport sector, such as shift in freight transport from road to rail and fuel switch from oil to electricity and CNG, result in substantial reductions in transport sector emissions—from 4,500 million tonnes in VD to around 1,000 million tonnes in LC1 by 2050. Industry sector emissions reduce from 1,550 million tonnes to 600 million tonnes in LC1.
However, emissions reductions from these measures are expensive and, beyond a point, electricity generation investments reduce private consumption more than what reductions in GDP would do. Since the model maximizes the present discounted value of private consumption, the model chooses to lower GDP.
In the LC2 scenario (see figure 46), a higher carbon constraint of 133 Gt is imposed. It requires further changes in the power sector, where electricity generation capacity becomes less than 6,000 billion kWh. Solar thermal with storage is preferred over solar PV with storage, and solar thermal storage produces 488 billion kWh of electricity. Electricity generation from natural gas reduces marginally to 2,085 billion kWh from 2,684 billion kWh. Electricity from solar PV reduces from 541 billion kWh to 209 billion kWh. Other sources like coal, wind and hydro produce the same amount of electricity as in the LC1 scenario.
The macroeconomic costs of a low-carbon scenario are assessed by measuring the change in the compound annual growth rate (CAGR) of the GDP from 2010 to 2050, according to the Intergovernmental Panel on Climate Change (IPCC) methodology. In low-carbon scenarios LC1 and LC2, the CAGR of the GDP decreases by 0.79 percentage points and by 1.26 percentage points, respectively, compared to that in the VD scenario. It confirms the IPCC finding that macroeconomic costs of mitigation generally rise with the stringency of the stabilisation target (IPCC 2007). These are significant losses.
However, if all countries follow the DAU approach and do not reduce their emissions, it is quite possible that the damages due to climate change may be higher than the losses indicated above. So far, such an analysis has not been possible, as a systematic assessment of losses in all parts of the country over the 2050 horizon has not been undertaken.
What can we conclude from these scenario results?a. Visionary Development targets can be attained sooner through a focused set of
interventions than without such measures. The GDP growth rate achieved will be the same as in the DAU scenario, but without leading to higher CO2 emissions as compared to DAU.
b. It is possible to meet the carbon budget of 156 Gt or even 133 Gt with reductions of 0.79 percentage points and 1.26 percentage points in the GDP growth rate over 2010 to 2050 in LC1 and LC2, respectively, compared to VD. Thus, while India can stay within the carbon budget, it would need foreign inflow of funds and technology assistance to minimize macroeconomic costs.

Low-carbon Development Pathways for a Sustainable India | 1
Introduction
1.1 Background
India has many development priorities. It has to lift 354 million people out of poverty (Planning Commission 2010). A large part of the population is devoid of basic necessities of life, such as food and nutrition, potable drinking water, access to sanitation, health and education facilities, good housing and so on. Forty-nine per cent of workforce is still engaged in agriculture, though
agricultural GDP constitutes only 15 per cent of the total GDP; only 24 per cent and 27 percent of the workforce are employed in the secondary and tertiary sectors, respectively (MoSPI 2013). It is a daunting task for India to solve its development challenges, more so with the looming climate change crisis.
As is increasingly evident, developing countries are more vulnerable to climate change compared to developed countries due to their low capacity to adapt and their disproportionate dependency on natural resources for welfare (Huang, Y 2012). Environmental degradation will only intensify their existing development problems. For example, increased variability in climate and changing rainfall patterns are already exerting negative impacts on the agriculture and food security of many low- income communities, while several coastal nations are suffering from damage to their ocean fisheries brought on by ocean acidification (Howes and Wyrwoll 2012). There is a need for India to achieve its goals faster, in a more inclusive manner. India needs to focus on human development and the well being of its population, which will make it less vulnerable to climate variability.
India, therefore, has a major interest in getting a global agreement and persuading the world community to taking action for minimizing the threat of climate change. India’s average emissions are 1.39 tonnes per capita (India ranks 103rd among 143 countries on per capita CO2 emissions basis), making it one of the lowest per capita emitters in the world (IEA 2012). To combat the climate change crisis and to curb the growth of GHG emissions, it is suggested that the increase in global temperature be limited to 2oC above the global temperature in 1850 (when thWe industrialization started) (Meinshausen 2008, IIASA 2008, WBGU 2009, WWF 2009, TERI 2010 and TISS 2010). To be able to achieve this limit, India would need to restrict cumulative carbon emissions below its share in the global carbon budget; to accomplish that, India would be required to follow a path of low-carbon development.
1.2 Issues to be explored
The study aims at demonstrating low-carbon pathways for India, while recognizing the need for maintaining development goals. The assumption underlying this study is that a meaningful level of well- being for all is possible at the same time as India pursues low-carbon pathways to development.
To define the targets for various well-being attributes that are necessary to create a Visionary Development scenario, it is important to consider the present development problems.
Simultaneously, the pathways for achieving this development need to be consistent with the emissions reduction targets defined by the carbon budget constraints. These preconditions form the basis of low-carbon development pathways in the study. Thus, the main questions addressed in the study are:
A. What could be the Visionary Development scenario and how should it be realized?
B. How can the carbon budget – to stay well below the 2°C limit – be adhered to while pursuing development goals?
Chapter 1 Introduction

2 | Low-carbon Development Pathways for a Sustainable India
Introduction
C. Which are the key sectors for interventions, which are the low-carbon technologies that need to be employed in these sectors and what will be the additional costs to the economy for shifting to a low-carbon pathway?
ScenariosFour scenarios are constructed to assess the transition of India to a low-carbon development pathway by 2050, for meeting its development thresholds at the same time as abiding by its carbon budget.
1. Dynamics as Usual (DAU): It shows the trend analysis for India till 2050, based on recent past data and changes at the same rate as in the past. It includes the impact of government policies already in place before 2005 (the model starts simulating from 2005).
2. Visionary Development (VD): It incorporates policies to achieve development thresholds and well-being indicators and compares the results with DAU.
3. Low-carbon Development scenarios (LC): Two scenarios are constructed to show low-carbon pathways adhering to two alternative carbon budgets for India from 2010 to 2050. These assume cumulative CO2 emissions of 155Gt and 133Gt for the two different scenarios. Low-carbon development pathways include the development thresholds achieved in the Visionary Development scenario.
The report is organized in the following manner.
Chapter 2 provides the modelling methodology and brief scenario descriptions.
Chapter 3 discusses Dynamics as Usual.
Chapter 4 discusses the necessity of Visionary Development, well-being indicators and the transition from Dynamics as Usual to Visionary Development.
Chapter 5 discusses the carbon budget for India, the low-carbon alternatives to achieve Visionary Development and the results of low-carbon development pathways.
Chapter 6 sums up the findings of the study.
Various technical details are provided in the appendices.

Low-carbon Development Pathways for a Sustainable India | 3
Methodology, Brief Description Of Model, Data And Assumptions
2.1 Methodology of the study
The low-carbon development study adopts the following methodological approach.1. Determining the Dynamics-as-Usual scenario, its key driving force identified as the growth of household consumption
2. Determining development thresholds for various indicators for India, based on the measures and policies to attain “well-
being indicators”, where the driving force is “human development” in comparison with the DAU scenario
3. Indicating interventions necessary for a Visionary Development pathway, based on fulfilling the “development threshold”, and differentiated from a DAU pathway
4. Detailing the necessary interventions for the two low-carbon development pathways for India, based on the alternate specifications of India’s share of the global carbon budget (based on 1990 and 2010 as base years for counting cumulative emissions)
5. Measuring the cost differences between the low-carbon development scenario(s) (options one and two corresponding to LCI and LC2, respectively)
6. Detailing the interim targets for 2020, 2030 and 2040 as well as 2050 for CO2 emissions reduction, energy efficiency and renewables under different scenarios
The study uses the IRADe macroeconomic model, which is an established model used to determine India’s emissions trajectory for the government of India and international projects (MoEF 2007, Parikh, J. and Ghosh, P. 2009 and Parikh, K. et al. 2013).
2.2 Brief description of the IRADe model
The IRADe– LCDS model is a dynamic multi-sectoral, inter-temporal, linear programming activity analysis model based on an input–output framework. The input–output matrix used in the model is based on the Social Accounting Matrix for India 2003-04 (Saluja and Yadav 2006).
The model maximizes the present discounted value of private consumption over the planning period (45 years, from 2005 to 2050).
Objective function: MaxU = Σ POPt*PCt+ PC (1)
Where POPt and PCt are the total population and total per capita consumption at time T. T is the planning horizon (from 2005 to 2050). The discount rate is denoted by r. The term PC bar is the discounted sum of per capita consumption beyond the period of optimization, after which the consumption is assumed to grow at a fixed rate called the post terminal growth rate.
Investments to different sectors of the economy are determined endogenously in the model, which eliminates the need for the arbitrary determination of allocation, as is required in a sequential model, which is solved period by period.
To smoothen the growth path of the model, monotonicity constraints are added for per capita total consumption, sectoral output and sectoral investments. (Constraint equations used in the model are given in Annexure 1.) The various consistencies in the model ensure that all the feedback is taken into account and that there are no unaccounted supply sources or demand sinks in
Chapter 2 Methodology, Brief Description Of
Model, Data And Assumptions
T
t=0 (l+r)t

4 | Low-carbon Development Pathways for a Sustainable India
Methodology, Brief Description Of Model, Data And Assumptions
the system. Thus, the model is suited for multi-sectoral, inter-temporal dynamic optimization. This permits exploration of alternative technologies and CO2 reduction strategies from a long-term dynamic perspective and permits substitution of various kinds.
The model is solved using the general algebraic modeling system (GAMS) programming tool developed by Brooke et al. (1988). For consistency in endogenous income distribution, optimal solutions are iterated, changing distribution parameters among iterations till they converge.
The major instruments of control in the model are: the upper bound on the marginal savings rate, exogenous government consumption growth rate, exogenous discount rate and the upper bound on the consumption growth rate. The assumptions about these parameters are given below. The assumptions noted below remain the same across all scenarios.
Table 3 Assumptions about important control parameters in the IRADe– LCDS model
Assumptions Rate (%per annum)
Upper bound on savings rate 35(of GDP)
Upper bound on growth rate of household consumption
9
Discount rate 4
Post terminal growth rate 2
Growth rate of government consumption 7
Total factor productivity growth rate for agriculture
1
Total factor productivity growth rate for industry and services
1.5
Total factor productivity growth (TFPG) represents the percentage increase in output that can be produced for the same amount of capital stock and labour force. Various studies have estimated India’s TFPG as ranging from 1.4 per cent per year to 2.5 per cent per year (Fuglie2010; Das, Erumban, Aggarwal and Wadhwa 2010; Goldar and Mitra 2008; Bosworth, Collins and Virmani2006; Rodrik and Subramanian 2005and Jorgenson 2005). This study assumes a TFPG rate of 1.5 per cent per year in DAU (see Annexure 2).
2.3 CO2 and non-CO2 emissions
Among the major GHGs –carbon dioxide (CO2), methane (CH4) and nitrous oxide (N2O) – the model deals with only CO2 emissions that are related to growth. In India, non-CO2 emissions from CH4 and N2O are found to be either decreasing or growing at a very low rate. Though the economy has been growing, there has been only a minor growth in the emissions of non-carbon dioxide greenhouse gases. The share of agriculture in the total emissions has shown a decreasing trend. Thus, though the total emissions have been increasing marginally over the last 20 years, agriculture sector emissions have, in fact, shown a reverse trend.
If the annual emissions growth rates of these greenhouse gases are compared, it can be noted that non-carbon GHG emissions are increasing at a significantly lower rate than CO2 emissions. Hence, the share of non-CO2 gases in overall GHG emissions has been dropping.

Low-carbon Development Pathways for a Sustainable India | 5
Methodology, Brief Description Of Model, Data And Assumptions
Perc
enta
ge s
hare
0
10
20
30
40
50
60
70
80
1990 2000 2010Years
CO2CH4N2O
Figure 1 Percentage Share of CO2 and non-CO2 emissions in India
Source: World Bank, 2013
2.4 Sectoral break-up in IRADe– LCDS model
The input–output table provided by the Central Statistical Organisation of India (CSO) consists of information on 115 sectors/activities (Saluja and Yadav 2006). These have been aggregated to 25 commodities for better interpretation of the results. Five sectors account for production activities in the model; household consumption is the fifth sector and accounts for consumption in the economy.
It is necessary to put into perspective the current emissions profile of India and to understand which sectors are mainly responsible for carbon emissions.
According to Ministry of Environment and Forests (MoEF), India’s emissions in 2007 were 1,221 million tonnes of CO2-eq (with LULUCF). But the per capita emissions of India are as low as 1.3 tonnes CO2 in 2007. If one looks at sectoral emissions (see Figure 2), electricity generation, which is currently heavily dependent on coal, contributes the highest share in emissions. The industry and transport sectors are the second- and third-largest contributors of CO2 emissions in 2007.
Figure 2 CO2 emissions, by sector, in 2007
Source: MoEF, 2010

6 | Low-carbon Development Pathways for a Sustainable India
Methodology, Brief Description Of Model, Data And Assumptions
Thus, India, requires interventions in the electricity sector to reduce CO2 emissions. Also, emissions from other sectors will grow in the coming years, and India will need to shift to low-carbon pathways in these sectors, particularly transport, to reduce the growth rate of the emissions.
• Energy – fossil fuels like coal, crude petroleum, petroleum products and natural gas
• Power – power generated from various technologies
• Industry – includes sectors like cement and steel
• Transport – railways and other transport (including road transport)
• Services – services include education, health services and other public and private services
• Household consumption – household consumption in rural and urban areas
• Forestry sector – accounts for emissions as well as sequestration from forests.
2.4.1 Energy sector
The energy sectors in an economy are related to other energy and non-energy sectors through demand and supply linkages. These linkages are assumed in the model using the 2003-04 input–output matrix provided by the Central Statistical Organisation (Saluja and Yadav 2006).Energy is consumed by all sectors in the production process and as final consumption by private households, the service sector and the government. There are four fossil fuel commodities in the model. These are coal, crude petroleum, petroleum products and natural gas. Output in each sector is constrained by the availability of capital in that sector. Incremental capital/output ratios (ICORs) are used to specify the amount of output possible given the amount of capital available. However, the outputs in the fossil fuel sectors are also constrained by their availability below the ground. Data from the Ministry of Coal and the Ministry of Petroleum and Natural Gas are used to specify the amount of reserves of coal, crude oil and natural gas present in the country (Ministry of Coal 2009 and MoP&NG 2009). Therefore, the production of the commodities is constrained in the model by the rate of depletion due to production and the rate of resource growth of these commodities in the economy. The natural resource availability for different fossil fuels and their rates of resource growth in India are specified in Table 4.
Table 4 Natural resource availability of different fossil fuels and the rates of resource growth
Fossil fuel for 2005-06
Available resources Growth rate Source
Coal* (million tonnes)
247,847 2.4% Annual Report 2009-10, Ministry of Coal, GoI
Crude petroleum (million tonnes)
786 1% Petroleum Statistics, 2008-09
Natural gas (billion cubic meters)
1,101 3.3% Petroleum Statistics, 2008-09
*In the case of coal, 60% of the available coal resource is assumed to be usable.
The model has set the prices of imported fossil fuels several times higher than the prices in 2003-04, the year to which the I/O table refers. This is to reflect their growing scarcity and the expected increase in their relative prices.

Low-carbon Development Pathways for a Sustainable India | 7
Methodology, Brief Description Of Model, Data And Assumptions
Thus, from 2010 onwards, import prices are increased two fold for coal and natural gas and fivefold for crude oil, from the import prices for these fuels in 2003-04.
It may be noted that import prices have been increased sharply once in 2010 and remain at that level till 2050 rather than having been increased gradually till 2050. This should be more favorable to non-fossil energy sources. These higher import prices are used for all scenarios.
The prices for these fuels are given in Table 5.
Table 5 Fossil fuel import prices in the model
A B C D
Fuel Unit Import price in 2003-04 in 2003-04 USD (base price)
Import price in 2003-04 in 2010 USD (base price)
Import price in 2010 in 2010 USD (increased price)
Import price in 2050 in 2050 USD* (increased price)
Coal USD/tonne 29.07 34.56 69.12 185.58
Natural gas
USD/MMBTU
3.07 3.65 7.31 19.62
Crude oil USD/barrel 25.83 30.70 153.50 412.15*Based on a 2.5% inflation rate observed in the US over the last decade
Table 5 shows the import prices considered in the model. Column A depicts the import prices of coal, gas and crude oil in 2003-04, since the input–output table of 2003-04 is used in model. The same price is calculated in 2010 USD in column B to make comparison easier. These import prices are increased twofold for coal and gas and fivefold for crude oil in 2010 and are kept constant till 2050, as seen in column C. This means that in 2050, the nominal prices of coal, gas and crude oil will be the prices shown in column D.
Since India imports these commodities, increased import prices mean increased opportunity costs of these fuels, which will result in a change in the allocations. Also, imports have upper bounds.
The resulting production and imports of these three fuels are summarized in Table 6.
Table 6 Production and imports of fossil fuels in the DAU scenario
Year Coal (million tonnes)
Crude oil (million tonnes)
Natural gas (billion cubic metres)
Domestic production
Imports Domestic production
Imports Domestic production
Imports
2005 487 13 46 100 40 0
2010 482 129 58 109 74 0
2020 1,122 374 62 296 100 100
2030 2,045 682 68 606 174 174
2040 4,364 89 71 1,192 241 241
2050 5,294 150 89 2,184 333 240
2.4.2 Power sector
In the IRADe model, the power sector is vertically integrated and includes generation, transmission and distribution. Power is produced by 13 technologies

8 | Low-carbon Development Pathways for a Sustainable India
Methodology, Brief Description Of Model, Data And Assumptions
including fossil fuels and renewables. The amount of power that can be generated from each technology is constrained by the availability of material and fuel inputs as well as the capital stock in that sector. ICOR is used to specify the amount of electricity generation possible from a given level of capital stock. ICORs are estimated for the base year but they change over a period of time due to technological progress through TFPG. Costs have been calculated using Indian data and in-house assessments. Fixed capital costs have been obtained from electricity regulators for the latest year, i.e., 2013-14. These were deflated to get costs in 2003-04 prices. To these costs, capital costs of transmission and distribution systems were added. Using the plant load factor, the I/O ratio was worked out in INR/INR worth of kWh. For assessing costs of storage for renewables, the Global Energy Assessment (GEA)4 estimate of USD 800/MW was used and converted to INR 2.7 crores/MW. For solar, the collector area was increased to correspond to the storage needed. For battery replacement for PV storage, the replacement cost was put in as expenditure every five years. The assumed efficiency of battery storage was 85 per cent and that of thermal storage was 92 per cent.
Table 7 reports the capital required to produce 1kW of power-generating capacity in each technology and compares it with capital costs given by the GEA (IIASA 2012.).
Table 7 Capital costs of power technologies
Power technology GEA IRADe
Capital cost (USD/kW) Capital cost (USD/kW)Subcritical coal 676 791
Supercritical coal 1,066 971
Natural gas 430 678
Hydro 2,464 1,129
Wind 1,523 828
Solar PV 3,157 1,355
Solar thermal 2,503 2,304
Wood gasification 1,354 745
Nuclear 2,200 1,129
Diesel 971
Solar thermal + storage 3,303 7,319
Solar PV+ storage 3,957 3,320
Wind + storage 2,323 6,456 Note: Capital cost includes associated transmission and distribution costs
Besides this, the model also assumes the potential for certain power technologies. This is to restrict the growth of these technologies to an achievable level in the final solution, so that the model solution that is obtained can be meaningful. The assumed potentials for some of the technologies are reported in Table 8.
Table 8 Potential of power technologies
Power Technology Potential Nuclear power 65 billion kWh/year
Wind power 1,000 billion kWh/year
Hydro 600 billion kWh/year
Solar Unlimited
The potential of nuclear is restricted to the capacity of current plants and the plants under construction.
4 The GEA seeks to examine major global challenges and their linkages to energy; the technologies and resources available for providing energy services; future energy systems that address the major challenges and the policies and other measures to realize sustainable energy futures.

Low-carbon Development Pathways for a Sustainable India | 9
Methodology, Brief Description Of Model, Data And Assumptions
The assumed wind potential is based on studies of wind potential in India by Berkley (Phadke, A., Bharvikar, R. and K. Jagmeet 2012) and CSTEP (Bhardwaj, A., Sudhakar, M., Swamy, D., Mohmad, S., Sastry, A., Jain, R. and B.M. Mazumdar 2013). Its detailed analysis is provided in Annexure 4.
The hydro electricity (hydro) potential is based on the Integrated Energy Policy (Planning Commission 2006).
Non-energy sectors use energy inputs in production processes and, hence, form an important constituent of demand for energy commodities. The outputs of non-energy sectors provide material inputs for production processes of the energy sector. Hence, the growth of the energy sector is related to growth of non-energy sectors through both demand and supply linkages.
2.4.3 Cement and steel sectors
Emissions analyses are done for two important industries—cement and iron and steel. According to Figure 2, 8 per cent of the CO2 emissions come from the iron and steel industry and 9 per cent from the cement industry. Hence, together these two industries alone are responsible for 17 per cent of CO2 emissions in India. Other industries, such as manufacturing, textiles, fertilizer, agro processing, etc., are present in the model but not examined in detail here. The study relies on the research work of IRADe as well as other scholars to define the mitigation options in this sector.
2.4.4 Transport sector
The transport sector is divided into three sub-sectors: railways, road transport and other transport. Aviation, shipping and other transport-related activities are included in the other transport sector. Public and private transport are included under road transport; the model does not distinguish between public and private transport. Private transport is reflected in the consumption of petroleum products by households.
2.4.5 Household consumption
Energy is required for production as well as consumption. Data from the National Sample Survey from the 50th round to the 64th round (MoSPI 2010) have been used to model consumption. Based on an econometrically estimated common underlying non-linear demand system, linear expenditure demand systems (LES) are estimated as locally linear approximations for 20 consumer classes defined by the level of total consumption expenditure—10 in rural areas and 10 in urban areas. Each class has a separate consumption pattern that is derived from the different parameters for the LES demand function for each class. The changing consumption patterns are shown by plotting the per capita consumptions of each of the 25 commodities for each class obtained from the estimated demand parameters. Rural and urban areas have separate consumption pattern and class boundaries (Parikh, K. et al 2009). . The share of per capita consumption of each commodity for each class is plotted in figures 3 and 4 for rural and urban areas, respectively.
Figure 3 shows that RH1 (rural household class 1), which is the poorest class in rural areas, has a consumption pattern such that more than 41 per cent of its consumption expenditure is on food (the food consumption basket comprises food grains, sugarcane, oil seeds, other crops, animal husbandry and fishing), whereas just 18 per cent of its consumption expenditure goes on health, education and such “other services”. At the other end, around 64 per cent of the consumption expenditure by the richest class in rural areas is on those services.

10 | Low-carbon Development Pathways for a Sustainable India
Methodology, Brief Description Of Model, Data And Assumptions
The population in each class also gets endogenously determined in the model. Class boundaries remain constant in a constant Rupee over a period of time, so that we can capture the movement of people from one class to another as the economy grows and can analyse the changes in the consumption patterns of the people.
Figure 3 Consumption shares in % for different commodities across different expenditure classes in rural areas
0%
10%
20%
30%
40%
50%
60%
70%
80%
90%
100%
RH1 RH2 RH3 RH4 RH5 RH6 RH7 RH8 RH9 RH10
Prop
orti
on o
f tot
al c
onsu
mpt
ion
expe
ndit
ure
Rural household expenditure classes
Natural Gas
Other Services
Other Transport
Railway Transport
Water Supply & Gas
Electricity
Construction
Manufacturing
Steel
Non Metallic
Cement Industry
Fertilizer
Petroleum Products
Textiles
Agro Processing
Mining & Quarrying
Crude petroleum
Coal & Lignite
Fishing
Forestry
Animal Husb
Other Crops
Oil Seeds
Sugarcane
Food Grains

Low-carbon Development Pathways for a Sustainable India | 11
Methodology, Brief Description Of Model, Data And Assumptions
0%
10%
20%
30%
40%
50%
60%
70%
80%
90%
100%
UH1 UH2 UH3 UH4 UH5 UH6 UH7 uH8 UH9 UH10
Prop
orti
on o
f tot
al c
onsu
mpt
ion
expe
ndit
ure
Urban household expenditure class
Natural Gas
Other Services
Other Transport
Railway Transport
Water Supply & Gas
Electricity
Construction
Manufacturing
Steel
Non Metallic
Cement Industry
Fertilizer
Petroleum Products
Textiles
Agro Processing
Mining & Quarrying
Crude petroleum
Coal & Lignite
Fishing
Forestry
Animal Husb
Other Crops
Oil Seeds
Sugarcane
Food Grains
Figure 4 Proportion of rural population across classes
Figure 4 shows that in 2010 most people in rural areas are located in the poorer classes (RH1, RH2 andRH3) and most people earn less than INR 14,200 per annum (class boundary of RH3). As the income increases, people will shift to higher consumption expenditure classes. Similar graphs for urban areas are depicted below.
Figure 5 Consumption shares in % for different commodities across different expenditure classes in urban areas
0.04
0.11
0.35
0.17
0. 110.13
0.05 0.02 0.01 0.01
0
0.05
0.1
0.15
0.2
0.25
0.3
0.35
0.4
RH1 RH2 RH3 RH4 RH5 RH6 RH7 RH8 RH9 RH10
Prop
orti
on o
f pop
ulat
ion
Rural household classes
DAU

12 | Low-carbon Development Pathways for a Sustainable India
Methodology, Brief Description Of Model, Data And Assumptions
Figure 6 Proportion of urban population across classes
Figures 5 and 6 show that most people in urban areas belong to poorer classes (UH1, UH2 and UH3) in 2010 and spend more on food and less on manufactured products (as shown in Figure 5);overall, the urban poor consume fewer carbon-intensive goods than the urban rich. When people move to higher classes (UH5, UH6 and UH7), their consumption patterns will change to include more manufactured goods and other services and will, thus, become more energy- and carbon-intensive (as shown by the shares for UH5, UH6 and UH7 classes).
2.5 Measurement of poverty in the model
The number of people below the poverty line is endogenously determined in the model. The class expenditure limits are chosen in a manner so that the consumption expenditures of the first two classes in rural and urban areas are below the poverty line, and people falling in these classes are considered poor. The feature of such an exercise is that it indicates not just income poverty or multidimensional poverty, based on indicators of only food, health, education, etc. Rather, it is based on people’s total consumption, and they are considered to move out of poverty only when they move to a higher class, where their overall consumption patterns change. It also indicates that people are earning sufficiently above the minimum to afford higher consumption. As the model is dynamic and household consumption is stipulated to be monotonic, the number of people below the poverty line does not increase from one period to another. The constant class boundaries are helpful in tracing the movement of people to higher classes over a period of time. So, poverty is thought to decrease when the proportions of population in the two poorest classes in rural and urban areas diminish. Thus, the poverty line is defined in terms of the class boundary of the second- poorest class in rural and urban areas. The poverty line in rural areas is the upper class limit of RH2, i.e., INR 6,800 per annum or INR 227 per month per person at 2003-04 constant prices. In urban areas, the poverty line is the class boundary of class UH2, which is INR 10,800 per annum or INR 360 per month per person at 2003-04 constant prices. The poverty line is defined in terms of constant prices and, thus, remains constant over a period of years, which helps calculate how many people cross the poverty line and move to higher classes.
The consumption basket is linked to the energy use embodied in the commodities and, thereby, to resulting carbon emissions. Any poverty-alleviating measure can be traced to its impact on carbon emissions. As people move out of poverty and their consumption patterns change, the model also tracks the increased energy use and the rise in carbon emissions.
0.05
0.14
0.38
0.15
0.09 0.09
0.04 0.030.01
0.02
0
0.05
0.1
0.15
0.2
0.25
0.3
0.35
0.4
0.45
UH1 UH2 UH3 UH4 UH5 UH6 UH7 UH8 UH9 UH10
Prop
orti
on o
f pop
ulat
ion
Urban household classes
DAU

Low-carbon Development Pathways for a Sustainable India | 13
Methodology, Brief Description Of Model, Data And Assumptions
2.6 Limitations of the model
Many strengths of the model have been described so far. However, no model is perfect and all have some limitations. The results of the model have to be interpreted keeping these limitations in mind. As long as this is done, it can be very helpful in clarifying mitigation and development options and their consequences.
Since this model optimizes over the whole period of 45 years (2005 to 2050), the path is not smooth. However, a smooth path would involve lower present discounted value (PDV) of private (household) consumption. One has to take the scenario results as upper bounds.
The model runs with constant prices of 2003-04. However, the results are affected by relative scarcity of various resources in the economy. The shadow prices or opportunity costs of different resources change over a period of time and also across scenarios, where different constraints may be imposed. For example, in the low-carbon scenarios, the shadow price of carbon emission constraint will be reflected in the costs of all activities that emit CO2.
Also, since many products are imported, particularly, coal, oil and natural gas; their import price can be specified to raise their opportunity costs if one expects their relative prices to change in the future. Thus, higher prices have been specified for coal, oil and natural gas.
The model focuses is on assessing an alternative pattern of Visionary Development and analysing technologies for low-carbon development in the context of macroeconomic consistency and feedback. The outcomes of many policies depend on financial outlays, governance and the efficiency in implementation. The model captures the impact and consequences of financial outlays. It does not deal with the issue of governance and effective implementation.
Also, the model at present deals only with CO2 emissions. Other GHG emissions are not considered. For India, two-thirds of these other emissions come from the agriculture sector. If the household sector’s use of crop residue and animal dung is added to it, it will account for nearly 80 percent of GHG emissions in 2007. Reducing emissions from agriculture is a daunting task, given that the sector provides livelihood to millions of small farmers, with an average farm size of less than two hectares. The government of India, in its Copenhagen statement, has also excluded agriculture from its emissions intensity- reduction targets.
Once households become richer and more convenient fuels are provided to them, (as is the case in Visionary Development and Low-carbon Development scenarios) the emissions of GHG from households will go down.
Fugitive emissions and waste account for the bulk of the remaining GHG emissions. One would expect these to come down with development and the better enforcement of environmental standards.
Thus, while GHG emissions other than CO2 have not explicitly been accounted for, they should not play an important role in deciding policy actions for low-carbon development.

14 | Low-carbon Development Pathways for a Sustainable India
Methodology, Brief Description Of Model, Data And Assumptions
2.7 Brief scenario descriptions
Policy analyses with scenarios usually involve developing a reference scenario and, then, comparing the policy scenarios with the reference scenario. This study constructs as reference scenario—Dynamics as Usual (DAU). Keeping in view the dual objectives of attaining the development threshold and abiding by two carbon constraints, three scenarios are constructed apart from DAU, which constitutes a reference scenario for the Visionary Development scenario.
The model scenarios cover the period from 2005 to 2050 and have nine time periods, five years apart. Thus, the model is solved simultaneously for 2005, 2010, and 2015 up to 2050. The results of the scenarios are reported for 2050 as well as decadal targets of 2020, 2030 and 2040.
The model runs at constant prices of 2003-04.A. Dynamics as Usual (DAU) scenario – It depicts India’s growth path till
2050 based on current trends of growth, development and mitigation actions. It assumes that the current trend of government actions on the development front as well as the mitigation actions accounted for till 2005 will continue.
B. Visionary Development scenario (VD) – Achievement of well-being indicators and development thresholds, latest by 2050, is a part of the Visionary Development scenario. Additional actions required on the development front are depicted in this scenario.
C. Low-carbon Development scenarios (LC1 and LC2) – Low-carbon (LC) Development scenarios show the achievement of Visionary Development after imposing two carbon emission constraints of alternative carbon budgets of cumulative emissions over 2010 to 2050 for India.
For India, development is of paramount importance for raising the level of human well-being of its citizens. So, before LC scenarios can be implemented, the VD scenario is compared with the DAU scenario to assess the impact of policies needed to reach VD thresholds. The LC scenarios can be acceptable only if they do not compromise the VD thresholds. Therefore, the LC scenarios are also compared with the VD scenario.

Low-carbon Development Pathways for a Sustainable India | 15
Dynamics-as-Usual scenario
The Dynamics-as-Usual (DAU) scenario shows the growth trajectory, level of development and emissions in India by 2050 if the current trends continue. The maximization of household consumption is the main driver in the Dynamics-as-Usual scenario. Since independence, a large expenditure has been incurred on health, education and social programmes, etc., leading to considerable improvements in well-being indicators. For example, life expectancy has improved to 65.8 years in 2010 compared to the age span of 32.1 years in 1950. Literacy rate has also increased from 18.3 per cent in 1950
to 74 per cent in 2010 (Planning Commission 2010). However despite the higher rate of development in recent years compared to that in the past, India’s level of achievements is low in comparison with even some of the developing countries, like Sri Lanka and Bangladesh, on various well-being indicators (such as infant mortality rate, life expectancy at birth, mean years of schooling). Thus, improvements in well-being indicators take place even in the DAU scenario but at a slower pace than required.
3.1 Assumptions behind DAU
The following section describes specific assumptions pertaining to the Dynamics-as-Usual scenario, in the context of the role of the government and technical specifications for power technologies and autonomous energy efficiency improvements (AEEI).
3.1.1 Role of government
The government consumption growth rate is prescribed exogenously and is assumed to be a uniform 7 per cent per annum for all commodities over a period of time. This will keep the share of government expenditure in the GDP roughly constant.
The model is based on the Social Accounting Matrix of 2003-04 and starts from 2005. Hence, all the government policies and actual incurred expenditure on them are accounted for while calculating government consumption. Hence, the 7 percent growth rate of government consumption is derived from the base value of government consumption in 2003-04.
The role of the government in Dynamics as Usual should be seen in this light. All the government expenditure including that on welfare schemes incurred on and before 2003-04 is accounted for in Dynamics as Usual. For example, welfare schemes like Pradhan Mantri Gram Sadak Yojana, Sarva Shiksha Abhiyan and Indira Awaas Yojana are accounted for in the government expenditure in the Dynamics as Usual and the impact of these welfare schemes gets reflected in the improved welfare of people, as seen in the scenario. The trend of government expenditure on these and numerous other welfare schemes is assumed to continue in the Dynamics as Usual scenario.
Similarly, government initiatives on the climate change front taken on or before 2003-04 are accounted for, and the trend is assumed to continue till 2050 in Dynamics as Usual.
However, the government has started many welfare schemes like Mahatma Gandhi National Rural Employment Guarantee Act (MGNREGA), right to education, etc. after 2005. For action on climate change, the National Action Plan on Climate Change (NAPCC) has been developed which includes eight missions related
Chapter 3Dynamics-as-Usual
scenario

16 | Low-carbon Development Pathways for a Sustainable India
Dynamics-as-Usual scenario
to mitigation, adaptation, environmental sustainability and energy efficiency measures. These policies and schemes started after 2005 are not accounted for in the Dynamics-as-Usual scenario. If these measures were accounted for, the DAU scenario would show lower growth rate and lower emissions, as NAPCC measures involve additional costs, such as the subsidy provided to solar power through higher feed-in tariff compared to the cost of power from conventional sources.
3.1.2 Electricity generation options
Dynamics as Usual considers various options in electricity generation.
Coal Coal is the main fuel for power plants in India. Two types of plants considered here are subcritical and supercritical. The latter is more expensive but uses less coal. The government has already taken steps to replace subcritical coal technology with supercritical coal technology. The target is to replace 70 per cent of the coal-based electricity generation plants with supercritical coal-based technology power plants by 2050, hence, DAU incorporates this target (Planning Commission 2011). The increased cost of coal has already been taken into account by imposing a constraint on the total coal availability and through a higher price of imported coal.
Nuclear energy India’s installed nuclear capacity as on 31 March 2013 was 4,780 MW, consisting mainly of domestic pressurized heavy water reactors (PHWRs), which require natural uranium as the fuel. By the end of Twelfth Five-year Plan (2017), 5,300 MW of capacity will be added. Thus, existing plants, along with plants that are under construction, will give an installed capacity of 11,000 MW by 2017. Dynamics as Usual freezes the nuclear capacity at this level. The same upper bound is imposed in all other scenarios. Nuclear power poses many issues of waste disposal, costs of decommissioning and the consequences of large accidents, even though the probability of such accidents may be very small. These issues are not discussed here, since the study has not considered nuclear as an option beyond the plants under construction in all scenarios.
HydropowerThe ultimate potential for generating power from a hydro plant is 150,000 MW at 35 per cent load factor (Planning Commission 2006). However, according to the Expert Group on Low Carbon Strategy, only those hydro projects should be considered viable where the cost of resettlement, deforestation and emissions from land clearing are taken into account (Planning Commission 2011).
Natural gasIndia’s natural gas potential is limited and an import ceiling has been imposed, which is 50 per cent of the total domestic requirement. The infrastructure to import and use gas has been limited because a dependence on external resources is a risk, which has to be kept in check.
Renewables Renewable technologies like wind, solar thermal, solar photovoltaic with and without storage and wood gasification are available as options. India has been pursuing, with moderate success, many renewable options such as solar cookers, solar water heaters, biogas plants, improved cook stoves, etc. for decades. The problem of poor acceptability by consumers is due to the high initial cost of water heaters, inconvenience of maintaining biogas plants (which need to be tended every day; those families that are rich enough to own the necessary number of cattle to afford biogas plants, find its maintenance too tedious), inadequacy of solar cookers to fulfill cooking requirements and under-performance of improved cook stoves.
3.1.3 Autonomous energy efficiency improvement
The changes in the energy–GDP ratio that are not related to the deviations in the relative price of energy are referred to as trends in autonomous energy efficiency

Low-carbon Development Pathways for a Sustainable India | 17
Dynamics-as-Usual scenario
improvement (AEEI). It is an empirical representation of non-price driven changes in technology that are increasingly energy efficient. Table 9 shows the AEEI values used in the DAU scenario.
Table 9 AEEI parameters in Dynamics as UsualCoal 1.2%
Petroleum products 1.2%
Natural gas 1.2%
Electricity 1.0%
However, AEEI for coal use in electricity generation and gas input in gas-based power plants has been restricted to 1 per cent per annum. Electricity used in electricity generation has an AEEI of 0.5 per cent.
3.2 Results of Dynamics-as-Usual scenario
The DAU scenario is not a forecast of what will happen but a scenario that depicts what could happen if the present discounted value of private consumption expenditure is maximized, given the current policy trends.
3.2.1 Macroeconomic characteristics of DAU
As mentioned earlier, India is already on a high-growth pathway, which is reflected in Dynamics-as-Usual. DAU projects that the GDP, at 2003-04 constant prices, will grow at an average rate of 6.96 per cent per year over the 40-year period—2010 to 2050. The per capita per annum household consumption expenditure reaches INR 492,929 at 2003-04 constant prices by 2050 and grows at the rate of 7.69 per cent from 2010 to 2050 (see figures 7 and 8). Since income distribution standard deviation is assumed to remain constant, inequity does not increase and a large number of people move out of poverty even in the DAU scenario. The GDP growth rate slows down from 2040 to 2050 as the economy runs into resource constraints. The bounds on domestic production and imports are binding in 2050 for gas, crude oil and petroleum products. If the economy is to grow more, these have to be relaxed or substitutes need to be developed.
Figure 7 GDP at 2003-04 prices Figure 8 Per Capita Consumption Expenditure (INR/ Year) at 2003-04 Prices
55008
118757
256388
492929
0
100,000
200,000
300,000
400,000
500,000
600,000
2020 2030 2040 2050
INR
/Per
son
Years
DAU
202623
406790
664649
887428
0
100,000
200,000
300,000
400,000
500,000
600,000
700,000
800,000
900,000
1,000,000
2020 2030 2040 2050
INR
Bill
ions
Years
DAU

18 | Low-carbon Development Pathways for a Sustainable India
Dynamics-as-Usual scenario
3.2.2 CO2 emissions profile in DAU
DAU, which is a scenario without a specific carbon constraint, leads to a per capita CO2 emission of 13.1 tonnes/year by 2050, and cumulative CO2 emissions from 2010 reach 385 Gt by 2050. CO2 intensity of the GDP reduces to 0.203 MT/billion USD GDP (PPP) compared to the 2005 level of 0.407 MT/billion USD GDP (PPP).
Figure 9 CO2 emissions per year in DAU Figure10 Cumulative CO2 emissions in DAU
41103
212
385
050
100150200250300350400450
2020 2030 2040 2050G
igat
onne
sYears
DAU
Figure 11 CO2 intensity of the GDP in DAU Figure 12 Per capita CO2 emissions in DAU
4443
8177
13857
20072
0
5000
10000
15000
20000
25000
2020 2030 2040 2050
Mil
lion
Ton
nes
Years
DAU
0.1970.181
0.1880.203
0
0.05
0. 1
0.15
0. 2
0.25
2020 2030 2040 2050
Mt/
Bill
ion$
GD
P (P
PP)
Years
DAU3. 4
5. 7
9. 1
13. 1
0
2
4
6
8
10
12
14
2020 2030 2040 2050
Per
Cap
ita C
emis
sion
sO 2
Tonn
es/
Pers
on
Years
DAU

Low-carbon Development Pathways for a Sustainable India | 19
Dynamics-as-Usual scenario
0
2000
4000
6000
8000
10000
12000
14000
16000
2020 2030 2040 2050
Mill
ion
Ton
nes
Years
Forestry
Services
Industry
Transport
Power
Energy
Sectoral emissions in DAU CO2 emissions of the energy, power, transport, industry, services and forestry sectors are given in Figure 13.
Figure 13 Sectoral CO2 emissions (million tonnes) in DAU
Up to 2030, the power sector is responsible for most of the CO2 emissions. Between 2020 and 2040, emissions of the power sector triple in quantity. However, the current policies to replace subcritical coal with supercritical coal pay off in the longer run and the growth of CO2 emissions in the power sector is curbed by 2050. The total emissions from power sector do not increase beyond 5,000 million tonnes in 2050 in DAU.
The transport sector in the model includes passenger and freight transport as well as public and private transport. It is a relatively low-emissions sector in 2020 but emerges as the second-most dominant sector in CO2 emissions, comparable with the power sector by 2050. Very few initiatives in the current policies for the transport sector are responsible for this steep rise in emissions. The sector is, currently, heavily dependent on petroleum products like petrol and diesel. If this trend continues, transport emissions will significantly increase. Besides, the import bill will also increase, which has its own macroeconomic implications.
The study introduces measures in low-carbon scenarios to reduce the transport sector’s demand for petroleum products.
Energy sector emissions take into account CO2 emissions from only the production processes of energy inputs like coal, natural gas, crude petroleum and petroleum products. Thus, energy sector emissions remain low because coal, petroleum products, natural gas are mainly used as inputs in other sectors and the emissions are accounted for in other sectors of the economy.
Industry emissions include emissions from cement and steel and are comparatively low throughout 2020 till 2050.
Emissions from the service sector include emissions from education, health and other such public and private services. As income increases and the population shifts to higher expenditure classes, there will be a larger demand for services and emissions from the service sector will more than double by 2050 to 2085 million tonnes compared to 919 million tonnes in 2020.

20 | Low-carbon Development Pathways for a Sustainable India
Dynamics-as-Usual scenario
The forestry sector category includes emissions from the forestry sector.
Electricity generation in DAU
Figure 14 Electricity generation in DAU
Figure 14 shows power generation, by technology, over the years. Subcritical coal dominates in the beginning, and 64 per cent of electricity is generated in power plants using subcritical technology. However, supercritical coal will slowly replace subcritical coal, as per current policies, and by 2050, the contribution of subcritical coal in electricity generation will fall to 22 per cent, as per the government target. Supercritical coal will produce 54 per cent of electricity by 2050. In terms of electricity generation, the capacity of subcritical coal-based power generation rises till 2040 and it produces 3,335 billion kWh of electricity; it remains more or less stable till 2050. Most additional requirement of electricity in each decade is fulfilled by mainly supercritical coal as well as other sources. The capacity of supercritical coal thus increases from only 619 billion kWh in 2020 to 7,595 billion kWh by 2050. In 2050, 54 per cent of additional electricity generation over 2040 is produced using renewable sources like wind (1,000 billion kWh), hydro (600 billion kWh) and solar photovoltaic (352 billion kWh) and natural gas (778 billion kWh).
Well-being indicators in DAUTo avoid repetition and provide context to the results of well-being indicators for the Dynamics-as-Usual scenario, they are discussed together with the results of the Visionary Development scenario.
0
2,000
4,000
6,000
8,000
10,000
12,000
14,000
16,000
2020 2030 2040 2050
Bill
ion
kWh
Years
Wind Storage
Solar Thermal Storage
PV Storage
Solar Thermal
Solar PV
Diesel
Wind
Wood
Nuclear
Natural Gas
Hydel
Super Critical Coal
Sub Critical Coal
4882
9164
1355
2485

Low-carbon Development Pathways for a Sustainable India | 21
Visionary Development scenario
As projected in the DAU scenario, if India’s GDP grows at 7 per cent and the per capita consumption grows at 7.7 per cent, progress in human development in the country can be expected. The Indian economy grew at more than 8 per cent from 2003-04 to 2011-12 (Ministry of Finance 2012), and this has led to better human development, as discussed in the following section.
4.1 Present development scenario in India
India has been on a high-growth pathway for more than two decades now. Compared to many other emerging economies, India has sustained this high growth for quite a long time. High growth has also helped India achieve better human development. Human Development Report 2013 has included India in the group of 18 “highlighted countries”, which have been achieving greater gains in the human development index (HDI) between 1990 and 2012 than would have been predicted from their previous performance on the HDI (UNDP 2013a).
The human development index value of India has improved from 0.345 in 1980 to 0.554 in 2012, which is a 60 per cent improvement since 1980. India is catching up slowly with the trajectory of South Asia, as shown in the Figure 15.
Figure 15 Progress of India on the human development index since 1980
Source: UNDP, 2013a
But India’s performance is still well below the average HDI of medium human development countries as well as the world average of human development index of 0.694 (UNDP 2013b). Many indicators like water, sanitation, schooling, infant mortality rate, housing and poverty show slow progress and need extra targeted efforts (CSO 2011). A mere focus on growth in terms of GDP increase is not sufficient to achieve development by 2050. If India has to achieve faster development within a span of less than 40 years, the main driver of the economy should be development along with welfare concerns. Also, the country cannot wait to realize the trickledown effect—the
Chapter 4Visionary Development
scenario

22 | Low-carbon Development Pathways for a Sustainable India
Visionary Development scenario
growth of the economy taking care of poverty alleviation and the availability of basic services. The desirable course would be to launch focused efforts for the faster achievement of all well-being indicators.
4.2 Well-being indicators and development thresholds5
To determine a Visionary Development pathway for India, which can be achieved by 2050, the following are required: a comprehensive understanding of the development problems in the country, knowledge of the factors governing development indicators, knowledge of the interrelationships between various indicators (e.g., reliable water supply, improved sanitation facility, etc.), knowledge of the role of income and non-income factors in the development process and an understanding of the international experience of development.
To define the Visionary Development scenario for this study, stakeholder meetings were undertaken in major cities (Delhi, Mumbai, Bangalore and Kolkata) of India to understand the viewpoint of non-governmental organizations and social workers working in the field of development. They brought to the light the importance of access to basic services like water and sanitation. The role of non- income factors, like governance, and the impact of customs and traditions on the development process were highlighted. Many of the issues raised do not lend themselves to modelling in a macroeconomic framework as they relate to governance and not to additional resource allocation.
There are a number of indices and measures, which are currently being used to measure human development across countries. The most popular among them are the human development indicators, the multidimensional poverty index and the Millennium Development Goals developed by the UNDP. The World Bank provides a comprehensive time series of cross-country data on a number of indicators. The Population Division of the United Nations’ Department of Economic and Social Affairs provides data on a number of health- and education-related indicators. In India, the Planning Commission, National Sample Survey Organisation and annual economic surveys by the Ministry of Finance provide national as well as state-level data on the progress of well-being indicators.
It was important to select well-being indicators relevant for India as well as relevant for this study. The Institute for Human Development (IHD), New Delhi, which is an advanced research institute in the field of human development in India, was given the task to select important well-being indicators. The chosen indicators make sure that in a Visionary Development pathway basic amenities, like water supply and sanitation facility, are provided to everyone and health indicators, such as life expectancy at birth and infant mortality rate, reach levels comparable to those in developed countries today. Education improvement –captured by measuring mean years of schooling – should also reach a high level.
Apart from these indicators, the IRADe research team felt that a futuristic scenario for India’s development in the coming 40 years should increase the standard of living of the masses. Complete poverty eradication and the transition of poor classes to the middle class are envisaged as important goals of the Visionary Development pathway. It is assumed that access to electricity and clean cooking fuels will play a key role in improving the quality of life. It is estimated that 5.4 per cent of the households in India live in houses made with materials like mud, thatch or bamboo known as “kutcha” (non-durable) houses (Census 2011). It is considered imperative to provide durable houses to all households. This is also an important adaptation measure against climate change.
5For a similar discussion on well-being indicators in the macroeconomic framework, please refer to Chapter 2 of Green National Accounts in India - a Framework, published by the Ministry of Statistics and Programme Implementation (MoSPI 2013).

Low-carbon Development Pathways for a Sustainable India | 23
Visionary Development scenario
Table 10 List of well-being indicators considered for the VD scenario
Category Well-being indicators included in the study
Health
Life expectancy at birth (female)
Life expectancy at birth (male)
Infant mortality rate (per 1,000 population)
Education Mean years of schooling
Access to services
Access to improved water source
Access to improved sanitation facility
Access to durable housing
Access to electricity
Access to clean cooking fuel
Poverty Headcount ratio of poverty
To realize Visionary Development, it is not enough to stop at having identified the well-being indicators. The indicators need to be quantified, and measurable targets need to be set for each of them. Hence, a development threshold, which is to be achieved by 2050, is defined for each well-being indicator. The methodology adopted to define the development thresholds follows.
4.3 Methodology adopted to determine development thresholds
The UNDP classifies countries into four categories, according to their performance on the human development index (see Table 11).Table 11 Country classification on the basis of the human development index
Level of human development
Range of human development index values (in 2012)
Average value of human development index (in 2012)
Very high human development
0.0805 to 0.955 0.905
High human development 0.712 to 0.796 0.758
Medium human development 0.536 to 0.710 0.640
Low human development 0.304 to 0.534 0.466Source: UNDP, 2013a
India has an HDI value of 0.554 in 2012 and ranks 136th among 186 countries. It lies in the lower range of medium human development countries.
The Visionary Development scenario aims to raise India to the category of “very high human development” by the end of 2050, at the latest, and increase its HDI value to 0.905, which is the current average HDI of the very high human development countries, as per the Human Development Report 2013 (UNDP 2013a).
The current value for India given in the 2013 report (UNDP 2013a) is taken as baseline for well-being indicators in health and education. The current average value of very high human development countries (Germany, Sweden, United States, Japan Israel, Australia, Ireland and Korea among a total of 47 countries) is taken as the development threshold to be achieved by 2050. In the case of basic services – water and sanitation –the study has followed the definition of indicators given by the World Bank (World Bank 2013). Data from the

24 | Low-carbon Development Pathways for a Sustainable India
Visionary Development scenario
Planning Commission (Planning Commission 2010) is taken as the baseline. The target is to achieve 100 per cent access to these basic services as early as possible and not to wait till 2050.
In the case of housing, the study has used the latest census data (Census 2011) as the baseline and the target is to convert all non-durable (kutcha) houses to durable (pucca) houses and take care of the additional housing requirement.
In the case of clean cooking fuel and electricity, the study has considered census data (Census 2011) as the baseline, and the target is to cover the population, that currently lacks access to these services.
One of the Millennium Development Goals is to reduce the population below the poverty line by half between 2000 and 2015. Extending this, this study sets the target at completely alleviating poverty before 2050.
Table 12 provides a brief description of each well-being indicator, the present value of the indicator, the development thresholds selected and the gap between the two.
Table 12 Well- being indicators chosen for India in the VD scenario, level of achievement at present and development thresholds for 2050
Brief description of the well-being indicator
Most recent available value of the indicator
Development threshold to be achieved by 2050 or before
Gap between present value and threshold value
Human development index (HDI)a
0.554 0.905 0.351
Life expectancy at birtha (the number of years a newborn infant would live if prevailing patterns of mortality at the time of its birth were to stay the same throughout its life)
65.8 80.1 14.3
Infant mortality ratea (the number of deaths of children before they attain the age of one, per 1,000 live births)
48 5 -43
Mean years of schoolinga (the average number of years of education received by people aged 25 years and more, converted from education attainment levels using the official durations of each level)
5.48 11.5 6.02
Percentage of households with access to improved water source (includes tap water, borehole, hand pump, covered well and springs, according to the World Bank definition) b
90.5 100 9.5
Percentage of households with access to improved sanitation facilitiesb (includes latrine facility with water closet, covered pit latrine and public latrine, according to the World Bank definition)
47.2 100 52.8

Low-carbon Development Pathways for a Sustainable India | 25
Visionary Development scenario
Brief description of the well-being indicator
Most recent available value of the indicator
Development threshold to be achieved by 2050 or before
Gap between present value and threshold value
Percentage of rural households with access to clean cooking fuelsc (including LPG/PNG, electricity and biogas)
11.9 100 88.1
Percentage of urban households with access to clean cooking fuelsc (including LPG/PNG, electricity and biogas)
65.5 100 34.5
Percentage of rural households living in durable housesc
46 100 54
Percentage of urban households living in durable housesc
68 100 32
Percentage of rural households with access to electricityc
55.3 100 44.7
Percentage of urban households with access to electricityc
92.7 100 7.3
Poverty headcount ratiob (percentage of population below the poverty line, based on the Tendulkar Committee methodology)
29.8 0 -29.8
Source:a - UNDP, 2013ab - Planning Commission of India, 2010 c - Census, 2011
4.4 Determining the factors governing well-being indicators
A pathway needs to be mapped for each well-being indicator if its corresponding development threshold is to be achieved between now and 2050. It is important to understand the factors that govern and determine the level of each indicator. For this, a literature survey was carried out. (The detailed analysis of the importance of each indicator in the development process, factors that govern each indicator and data tables and figures for the current levels of achievement are given in Annexure 5.)
This was followed by an extensive regression analysis, using the eVIEWS software to determine the causal relationship among well-being indicators and income and non-income factors. For example, the level of public health expenditure in the country and improved water and sanitation facilities both affect infant mortality rate. For this exercise, cross-country data for 2011 from the World Bank was used (World Bank 2013).
4.5 Development interventions and policy framework for the Visionary Development scenario
The following interventions and policy frameworks have been envisaged for the VD scenario.
i. Access to improved water source and sanitation Water and sanitation issues should be tackled together. A study conducted by

26 | Low-carbon Development Pathways for a Sustainable India
Visionary Development scenario
Plan International and Wash Institute for the Ministry of Drinking Water and Sanitation in 2009 shows that only three states, viz., Delhi, Punjab and West Bengal, can boast of high water supply and sanitation facilities. The rest of the states either have a problem of water or sanitation facility or both. The provision of water and sanitation facilities is a public service and is primarily considered government responsibility. But according to Twelfth Five-year Plan, the government of India has spent only 67 per cent of the eleventh plan allocation made for water and sanitation during the plan period (2007-12) (Planning Commission 2012). The target of the government’s Bharat Nirman plan was to provide safe drinking water to all developing areas in the country by 2012; the Nirmal Gram Scheme aimed at making the country free of open defecation through an award-based incentive scheme called “Nirmal Gram Puraskar” (NGP) for fully sanitized and open defecation-free gram panchayats, blocks, districts and states (Ministry of Drinking Water and Sanitation 2013). Adequate budgetary provisions have been made. Given the growing awareness and demand for sanitation, one can be sure that this target will be reached. In the state of Madhya Pradesh, to avail the benefits under the Mukhya Mantri Kanyadan Yojana (MKY), the local administration has made it mandatory for a groom, who wishes to participate in the mass marriage ceremony, to send a picture of himself with his toilet as proof that his house has the facility (Times of India 2013). © Times of India In the Visionary Development scenario, the government will spend the entire sum allocated for water and sanitation on providing these services. Rural drinking water and sanitation programmes are converged. In urban areas, every water supply project will have a sewage treatment plant, as per the Twelfth Five-year Plan target (Planning Commission 2012). The problem of the availability of safe drinking water is more acute in rural areas. Rural drinking water schemes will be integrated with the national system of aquifer management. “Slipped back” habitations will also be covered under the Visionary Development scenario. There is much scope for community interventions in the area of water and sanitation. For example, the Michael & Susan Dell Foundation has supported pilot projects for the provision of water and sanitation services to more than 50,000 urban families in India (Prasad and Basu 2013). Another successful intervention is by Gram Vikas—an NGO working in Odisha. It ensures that every single household in the village where it operates is connected to the same water mains. Water is piped to each house, which contains a toilet, a tap and a bathing room that are all connected to the same system. The monthly cost of the system, including maintenance, for each household is INR190 or USD4. The rest of the money is collected through donors (Banerjee and Duflo 2011).
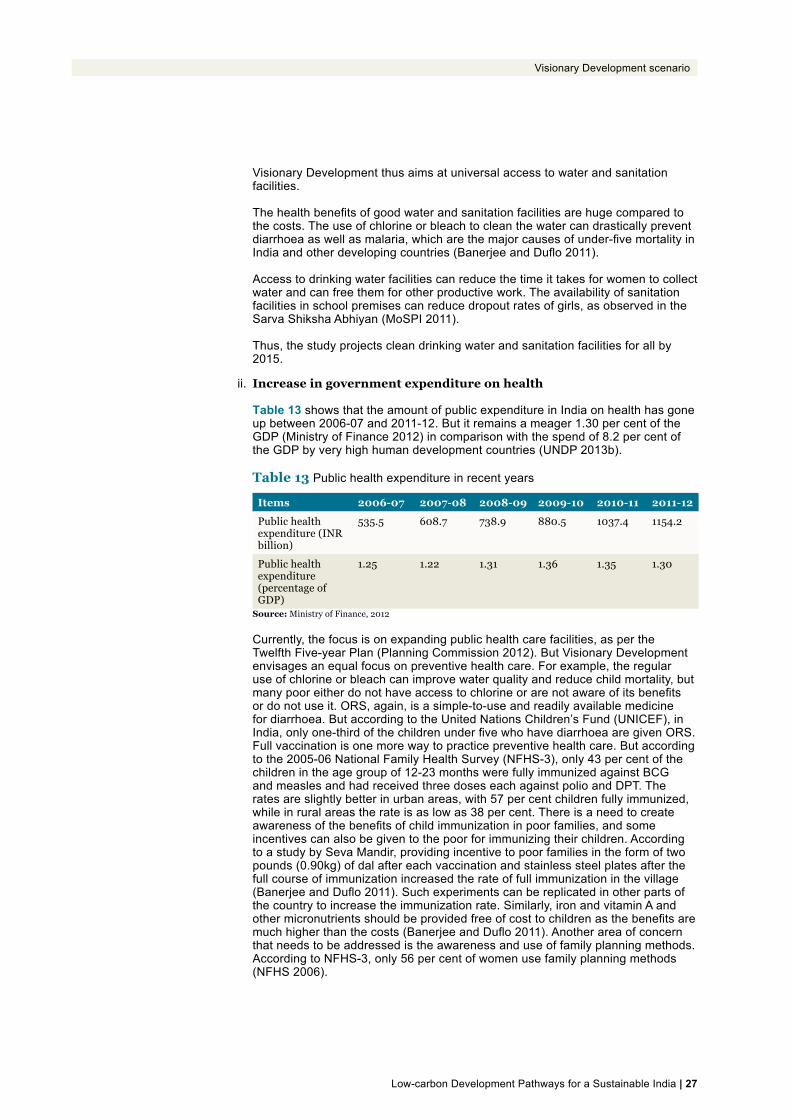
Low-carbon Development Pathways for a Sustainable India | 27
Visionary Development scenario
Visionary Development thus aims at universal access to water and sanitation facilities. The health benefits of good water and sanitation facilities are huge compared to the costs. The use of chlorine or bleach to clean the water can drastically prevent diarrhoea as well as malaria, which are the major causes of under-five mortality in India and other developing countries (Banerjee and Duflo 2011). Access to drinking water facilities can reduce the time it takes for women to collect water and can free them for other productive work. The availability of sanitation facilities in school premises can reduce dropout rates of girls, as observed in the Sarva Shiksha Abhiyan (MoSPI 2011). Thus, the study projects clean drinking water and sanitation facilities for all by 2015.
ii. Increase in government expenditure on health Table 13 shows that the amount of public expenditure in India on health has gone up between 2006-07 and 2011-12. But it remains a meager 1.30 per cent of the GDP (Ministry of Finance 2012) in comparison with the spend of 8.2 per cent of the GDP by very high human development countries (UNDP 2013b). Table 13 Public health expenditure in recent years
Items 2006-07 2007-08 2008-09 2009-10 2010-11 2011-12
Public health expenditure (INR billion)
535.5 608.7 738.9 880.5 1037.4 1154.2
Public health expenditure (percentage of GDP)
1.25 1.22 1.31 1.36 1.35 1.30
Source: Ministry of Finance, 2012 Currently, the focus is on expanding public health care facilities, as per the Twelfth Five-year Plan (Planning Commission 2012). But Visionary Development envisages an equal focus on preventive health care. For example, the regular use of chlorine or bleach can improve water quality and reduce child mortality, but many poor either do not have access to chlorine or are not aware of its benefits or do not use it. ORS, again, is a simple-to-use and readily available medicine for diarrhoea. But according to the United Nations Children’s Fund (UNICEF), in India, only one-third of the children under five who have diarrhoea are given ORS. Full vaccination is one more way to practice preventive health care. But according to the 2005-06 National Family Health Survey (NFHS-3), only 43 per cent of the children in the age group of 12-23 months were fully immunized against BCG and measles and had received three doses each against polio and DPT. The rates are slightly better in urban areas, with 57 per cent children fully immunized, while in rural areas the rate is as low as 38 per cent. There is a need to create awareness of the benefits of child immunization in poor families, and some incentives can also be given to the poor for immunizing their children. According to a study by Seva Mandir, providing incentive to poor families in the form of two pounds (0.90kg) of dal after each vaccination and stainless steel plates after the full course of immunization increased the rate of full immunization in the village (Banerjee and Duflo 2011). Such experiments can be replicated in other parts of the country to increase the immunization rate. Similarly, iron and vitamin A and other micronutrients should be provided free of cost to children as the benefits are much higher than the costs (Banerjee and Duflo 2011). Another area of concern that needs to be addressed is the awareness and use of family planning methods. According to NFHS-3, only 56 per cent of women use family planning methods (NFHS 2006).

28 | Low-carbon Development Pathways for a Sustainable India
Visionary Development scenario
All this will call for additional government expenditure. The Indian government’s target is to raise public expenditure on health and education to 6 per cent of the GDP. This study assumes a higher level for the VD scenario. Thus, government expenditure on health and education in the VD scenario is increased as a proportion of the GDP by four percentage points in 2015 to reach 7.5 per cent of the GDP; thereafter, government expenditure on health and education grows at the same rate as government consumption. Many countries, with good records in health and education, spend around 7 per cent of their GDPs on these sectors.
iii. Increase in government expenditure on education Government expenditure on education has improved in recent years. It has increased from 2.72 per cent of the GDP in 2006-07 to 3.11 per cent of the GDP in 2011-12. (Ministry of Finance 2012) Table 14 Public expenditure on education in recent years Items 2006-07 2007-08 2008-09 2009-
102010-11RE*
2011-12BE**
i) Public education expenditure (INR billion)
1,169.33 1,275.47 1,613.6 1,970.7 2,493.43 2,768.66
ii) Education expenditure (% of GDP)
2.72 2.56 2.87 3.05 3.25 3.11
Source: Ministry of Finance,2012 *RE- Revised Estimate **BE – Budget Estimate Given that the present mean years of schooling in the country is only 5.48 years and the target is to attain 11.6 years of schooling by 2050, India needs to boost its efforts to increase the education level in the country. In Visionary Development, there is a lump sum increase in government expenditure on health and education in 2015 (the earliest year to start intervention in the model) by 4 percentage points of the GDP, as described in the preceding section. The goal of universal primary education has nearly been achieved now (CSO 2011) and there is a need to focus on increasing the rate of enrolment and reducing dropout rates in secondary and tertiary education. Currently, dropout rates in secondary school are more than 40 per cent (Planning Commission 2010). The quality of education remains very poor till date, according to annual reports published by Pratham, a Mumbai-based NGO (Pratham 2012). Higher allocations for education, along with good governance, will facilitate improvement in quality, reduce dropout rates and raise the percentage of student’s opting for tertiary education.
iv. Access to housing, electricity and clean cooking fuels The above mentioned interventions in water, sanitation, health and education are community-level interventions. There are large “positive externalities” of providing these basic services to all the people. If a child is immunized against infectious diseases, the children in his/her neighborhood and school also have a reduced risk of getting those diseases. Similarly, a well-educated adult can be more productive, earn more income and help the nation grow. But given that 51 per cent of the population in India is identified as poor, according to the multidimensional poverty index (UNDP 2011), it is imperative to provide many basic services targeted at this section. The study has identified housing, electricity and clean cooking fuels as areas that are improving slowly in the current scenario and require greater focused efforts to reach all the poor.
6Pucca: Houses with walls and roof made of permanent materials; walls can be made of galvanized steel, metal, asbestos sheets, burned bricks, stone or concrete, while roofs can be made of tiles, slates, galvanized steel, metal, asbestos sheets, bricks, stone or concrete. Kutcha: Houses with walls and roof made of temporary material; walls can be made of grass, thatch, bamboo, plastic, polythene, mud, unburned brick, or wood, while the roof can be made of grass, thatch, bamboo, wood, mud, plastic or polythene. Semi-Pucca: Either the walls or the roof is made of permanent material; temporary material is used for the other.(Census,2011)

Low-carbon Development Pathways for a Sustainable India | 29
Visionary Development scenario
Durable housing for all As per the 2011 census, there are 13 million non-durable (kutcha)6 houses in the country, which are owned by the very poor (Census 2011). The government has launched two schemes for helping the poor build durable houses, viz.,Indira Awaas Yojana (scheme for housing in rural areas) and Rajiv Awaas Yojana (scheme for housing in urban areas) (MoRD 2013 and Ministry of Housing and Urban Poverty Alleviation 2013). The Eleventh Five-year Plan provided about 1.5 million houses under these schemes, implying a rate of 0.3 million housing units being built every year. (Planning Commission 2011). Visionary Development aims at increasing the pace of providing such housing and stepping it up from 0.3 million units/year to 0.5 million units/year by 2015 and to 1 million units/year till 2025. Hence, the scenario envisages that apart from the current rate of 0.3 million houses per year, additional 0.2 houses will be built each year till 2015 and an additional 0.7 million housing units will be built each year from 2015 to 2025. Under Indira Awaas Yojana, in 2010, assistance of INR 45,000 is provided to a poor individual for building a house. At 2003-04 prices (used in the model), the cost incurred in this activity is INR 30,000. Taking into account the houses that need to be built in addition to the government target and the cost per house, the total costs are calculated as shown in Table 15. Table 15 Total cost of building additional houses Year 2010 2015 2020 2025
Additional houses (in millions) 0.2 0.7 0.7 0.7
Total cost @ INR45,000 (2010 price)/unit (in INR billion)
90 315 315 315
Total cost @ INR 30,000 (2003-04 price)/unit (in INR billion)
60 210 210 210
The total costs from 2010 to 2015 are, thus, INR 60 billion each year for building additional houses, apart from houses that are built under the Indira Awaas Yojana. From 2015 onwards, the number of houses built is stepped up and the total costs each year are INR210 billion. It is assumed that, with economic development, income levels will go up and there will be no need to provide government assistance to build durable houses beyond 2025. Access to electricity India has already made some progress in increasing the access to electricity, especially in urban areas. The Rajiv Gandhi Grameen Vidyutikaran Yojana (RGGVY) aims to connect all villages to electricity by 2012 and to provide free electricity connections to all BPL households. While there have been slippages, the expectation is that all but some 25,000 remote villages will be connected to the grid soon. However, power supply is erratic and, then, electricity consumption is low. Access to electricity is a dynamic concept, in which electricity consumption goes up with the increase in income level as well as lifestyle changes over a period of time. Taking into account these changes, Visionary Development aims to give a minimum electricity access of 1kWhper household per day, which is adequate to use modern electric appliances like tube lights, fans, refrigerator, etc. In the VD scenario, households that consume less than 1kWh of electricity per day are given the balance amount of electricity by the government, who pays for it. The derivation of the total value of per capita annual electricity consumption paid for by the government to benefit poor households is shown below. Table 16 Derivation of subsidy for minimum electricity consumption Price of electricity (INR/kWh) in 2003-04
Minimum electricity access (kWh/household per day
Minimum annual electricity consumption per person
Total value of per capita annual electricity consumption
2.13 1 73 155.49

30 | Low-carbon Development Pathways for a Sustainable India
Visionary Development scenario
Access to clean cooking fuel As mentioned earlier, a majority of rural households still depend heavily on firewood as cooking fuel. Thus, Visionary Development aims to provide LPG connections to all households in both rural and urban areas. A lump sum subsidy will be given to poor households that cannot afford to buy LPG connections. The subsidy can be gradually removed when the total income of the poor increases and they can afford clean cooking fuel on their own. Simultaneous innovations in efficient cooking stoves and biogas plants to reduce indoor air pollution and the pressure on forests are necessary. The Indian Network on Ethics and Climate Change (INECC) has compiled eight case studies on such possible micro interventions at the community level (INECC 2011). In the VD scenario, the government supplements the expenditure of poorer households on cooking fuels by providing them six cylinders of LPG per year at subsidized rates.
v. Cash transfer to the poor Indicators of clean cooking fuel, electricity, health and sanitation will reduce multi dimensional poverty. But it is still important to alleviate income poverty and ensure a minimum income for everyone. The instrument used for alleviating poverty in Visionary Development is direct cash transfer to the poor households. It must be noted that replacing cash transfer for basic services would not be effective if there are no service providers from among whom to choose (UNDP 2013 a). However, unconditional cash transfer given in addition to the provision for basic services can increase income levels and bring desired outcomes (Edmonds and Schady 2008, Duflo 2003 and Yanez-Pagans 2008). In the Visionary Development scenario from 2015 onwards, each person in the two poorest household classes in rural and urban areas receives INR3,000 (at 2003-04 prices) per person per annum. This cash transfer can be taken as the sum of all kinds of cash transfers received by the poor, for example, in the form of cash transfers for food, guaranteed wages received for unskilled labour under an employment guarantee scheme (like MGNREGA), or all other subsidies. It is assumed that the government is able to levy additional taxes on the richer classes and is able to target it effectively. Even though targeting effectiveness is very questionable, the cash transfer instrument is used to make maximum impact on poverty reduction at minimum cost. A note on the limitations of well-being indicators and the Visionary Development scenario The study mainly aims to understand the level of development India needs to achieve by 2050, at the latest, to attain the goals of Visionary Development, the policies that can help reach those goals and the macroeconomic feasibility and consequences of reaching them. The study acknowledges that there are many other development issues in India, apart from the ones highlighted in the study and they require urgent attention. Stakeholder meetings have brought to the light important issues like tribal rights, gender inequality, income inequality, access to natural resources (such as land and water), quality issues in health and education, farmers’ indebtedness, issue of measuring the level of happiness in the country, etc. However, many of these issues are qualitative and it is not possible to incorporate them explicitly in the study. The policies required for them are largely related to improving implementation and governance and have little to do with the provision of additional resources. Their macroeconomic implications would be small and difficult to incorporate in a model. The Visionary Development scenario envisaged in the study aims to provide a basic minimum standard of living to all Indians across states, genders, castes and classes in areas such as health, education, sanitation, water and shelter. The well-being indicators have been carefully chosen and aim to create a productive and healthy society for all, which will take India on the path of development. To use the term applied by Amartya Sen, a Visionary Development scenario for India

Low-carbon Development Pathways for a Sustainable India | 31
Visionary Development scenario
aims to make individuals “capable”. Thus, this scenario includes better health, more education and access to electricity, clean cooking-fuel, durable housing and additional income. Assumptions on technology in the Visionary Development scenario The Visionary Development scenario focuses on development interventions over and above the Dynamics-as-Usual (DAU) scenario. Hence, all the specifications in DAU that are related to energy mix, total factor productivity growth, autonomous energy efficiency improvement, energy options and the role of renewables remain intact in Visionary Development. Visionary Development does not put restrictions on carbon emissions. For example, the target in Visionary Development is to attain universal access to electricity; it does not take into consideration whether the electricity comes from fossil fuels or renewables.
4.6 Results of the Visionary Development scenario
The Visionary Development (VD) scenario has many development interventions in the economy and aims to achieve the development thresholds of well-being indicators by 2050, as discussed earlier.
The following section discusses the results of the Visionary Development scenario. First, the VD scenario is compared with the DAU scenario for well-being indicators. The cost comparison and the impact on carbon emissions are discussed in latter sections.
4.6.1 Achievements in well-being indicators
Well-being indicators reach the threshold levels by 2050 and some even before 2050. As one can see from the results, the DAU scenario is, itself, on the development pathway and makes substantial achievements in many well-being indicators by 2050. However, Visionary Development accelerates the development and achieves either better or faster development.
(In all the diagrams of well-being indicators the horizontal line shows the targeted threshold value.)
• Health
Life expectancy at birth Life expectancy at birth indicates the number of years a newborn infant would live if prevailing patterns of mortality at the time of its birth were to stay the same throughout its life. It is a comprehensive health indicator in a country.
According to regression analysis, life expectancy at birth depends on the availability of clean water, sanitation facility and the prevailing death rates. The following are the coefficients of regression for life expectancy at birth for females.
Constant 54.63
Weighted average of rural and urban availability of water (percentage of population with access)
0.12
Sanitation(percentage of population with access)
0.20
Death rate (number of deaths per 1,000 people)
-0.94

32 | Low-carbon Development Pathways for a Sustainable India
Visionary Development scenario
Figure 16 Life expectancy at birth (female)
The regressions are confirmed by cross checking the value for the base year of 2010 with currently available actual values for India. According to the Planning Commission of India, life expectancy at birth for females was 64 in 2010. Given the prevailing rate of availability of water, there will be universal access to water by 2020 in DAU. However, sanitation facility will reach only 68 per cent of the population by 2050 in DAU. Death rates are already low and projected to go down to 8 by 2050 in DAU. Hence, by 2050 female life expectancy will increase to 72 years in the DAU scenario (see figure 16).
For increasing the life expectancy in the VD scenario, development interventions in water, sanitation and health expenditure are made and access to water is universalized in 2015. Sanitation facility will still take time to reach all the population, given its current very low base, and it is projected to universalize by 2035. These two factors, by themselves, significantly affect life expectancy, as denoted by regression coefficients. Death rate also reduces by 1 point and reaches 7 by 2050 in VD. As a result, female life expectancy increases to 80 years by 2050 and the reaches the threshold level of 80.1 years.
Life expectancy at birth for males is generally below the life expectancy at birth for females. The regression results suggest that life expectancy for males depends on water, sanitation, death rate and income.
Life expectancy at birth (male)Constant 57.81
log(GNI/person) -0.24
Death rate (number of deaths per 1,000 people) -1.02
Weighted average of rural and urban availability of water (percentage of population with access)
0.09
Sanitation (percentage of population with access) 0.17
6668 70 72
73
78 80 80
40
45
50
55
60
65
70
75
80
85
2020 2030 2040 2050
Life
Exp
ecta
ncy
Years
DAU
VD

Low-carbon Development Pathways for a Sustainable India | 33
Visionary Development scenario
Figure 17 Life expectancy at birth (male)
64 65 676970
74 76 76
40
45
50
55
60
65
70
75
80
2020 2030 2040 2050
Year
s
Years
DAU
VD
According to the Planning Commission (2010), male life expectancy at birth is 62 years, at present. DAU projects it to increase to 68 years by 2050. With additional measures for health, water and sanitation, VD projects that life expectancy of males will reach 76 years (see Figure 17).
Infant mortality rate Infant mortality rate (IMR) is defined as number of deaths of children before they attain the age of one per 1,000 live births (World Bank 2011). Currently, infant mortality rates in India are very high— 31 in urban areas and 51 in rural areas. The regression analysis shows that infant mortality depends on female literacy, public health expenditure and water and sanitation.
Infant mortalityConstant 158.13
Public health expenditure -0.27
Sanitation -0.38
Weighted average of rural and urban availability of water
-0.37
Female literacy rate -0.59
Figure 18 Infant mortality rate
36
21
7
22 2
25
7
0
5
10
15
20
25
30
35
40
2020 2030 2040 2050
No.
of d
eath
s of
chi
ldre
n un
der
the
age
one/
1000
live
bir
ths
Years
DAU
VD

34 | Low-carbon Development Pathways for a Sustainable India
Visionary Development scenario
DAU makes substantial progress in reducing infant mortality rate by 2050 and achieves the target of 5 by 2050 (see Figure 18). However, higher health and education expenditure, universal access to water and sanitation reduce IMR even faster in the VD scenario. The threshold of 5 is almost reached in 2030 itself, and by 2040, IMR reduces to 2.
• Education
Mean years of schooling Mean years of schooling is calculated as the average number of years of education received by people aged 25 years and more, converted from education attainment levels using official durations of each level. Currently, the mean years of schooling is 5.48 years. DAU projects that it will reach the threshold level of 11 years by 2050 (see Figure 19). However, the increase in expenditure on education in the VD scenario is expected to raise literacy levels, school enrolment ratios and reduce dropout rates (detailed analysis and projections are given in Annexure 6), and VD achieves 10.72 years of schooling by 2040 and exceeds the threshold level in 2050 to achieve 12 years of schooling.
Figure 19 Mean years of schooling
• Poverty
Population below poverty line In India, an expert group appointed by the Planning Commission identifies the criteria to be included in establishing the poverty line. According to the Tendulkar Committee appointed by the Planning Commission in 2009, the definition of poverty is based on the consumption expenditure data given by the National Sample Survey of India. The committee decided that people whose monthly per capita consumption expenditure is below INR 672.8 (USD 12.19) in rural areas and INR 859.6 (USD 15.57) in urban areas in 2009-10 (at current prices) would be regarded as people living below the poverty line. According to this committee’s estimates, there were 354.68 million people in 2009-10 whose monthly consumption expenditure was below these threshold levels. The average poverty headcount ratio for India was 29.8 per cent, while it was 33.8 per cent in rural areas and 20.9 per cent in urban areas during that period.
The population below the poverty line is defined differently in the model used in this study. The poverty line is defined in terms of the class boundary of the second-poorest class in rural and urban areas. The poverty line in rural areas is the upper class limit of RH2 (rural household class 2), i.e., INR 6,800 per annum or INR 227 per month per person at 2003-04 constant prices. In urban areas, the poverty line is the class boundary of UH2 (urban household class 2), which is INR 10,800 per annum or INR 360 per month per person at 2003-04 constant prices(see “Measurement of poverty in the model” in Chapter 2). Hence, study data for the poverty line as well as the population below the poverty line are not strictly comparable with national data. However, they are useful for comparing the results of scenarios in a consistent manner.
6.236. 3
0
2
4
6
8
10
12
14
2020 2030 2040 2050
Mea
n ye
ars
of s
choo
ling
Years
DAU
VD
8.0
9.7
11.2
8. 7
10. 7 12. 1

Low-carbon Development Pathways for a Sustainable India | 35
Visionary Development scenario
Figure 20 Rural population earning less than INR227 at 2003-04 constant prices
The population below the poverty line shown here should be interpreted only in terms of trend and as evaluating the impact of interventions such as cash transfers. DAU shows the level of poverty, as counted by model, if the trend of poverty alleviation measures taken before 2005 continues (since the model starts simulating at 2005, poverty alleviation measures taken before that are not included and schemes like MGNREGA are not accounted for). With this definition, there are 242 million people spending less than INR 227 at 2003-04 constant prices in rural areas in 2005. By 2020, there will be 92 million earning less than INR 227 and by 2050, all will be earning more than INR 227 at 2003-04 constant prices.
Hence, development under the DAU scenario will shift a majority of the rural population to the middle class (classes RH3, RH5, RH6) by 2050.
The VD scenario accelerates the process of poverty alleviation by providing cash transfers to people belonging to the two poorest rural classes. Cash transfers are given till every person enters RH3 or has a monthly consumption expenditure of more than INR 227. After that, the cash transfer instrument automatically gets eliminated. With cash transfers of INR 3,000 per person per year, poverty is eliminated at a faster rate by 2020; there will be 25 million poor in rural areas spending less than INR 227 at 2003-04 prices. By 2030, this number will reduce to only 4 million and, no one will be spending less than INR 227 in rural areas by 2040.
Figure 21 Urban population earning less than INR 360 at 2003-04 constant prices
0
50
100
150
200
250
300
2005 2010 2020 2030 2040 2050
Num
ber
of p
eopl
e be
low
pov
erty
line
(in
mill
ions
)
Year
DAU
VD
0
20
40
60
80
100
120
2005 2010 2020 2030 2040 2050
Num
ber
of p
eopl
e be
low
pov
erty
line
(in
mill
ions
)
Year
DAU
VD

36 | Low-carbon Development Pathways for a Sustainable India
Visionary Development scenario
In the Indian scenario, urban poverty is already limited compared to rural areas (both in terms of absolute number of people below the poverty line and head count ratio of poverty). (The same is reflected in the trend shown by DAU and VD). According to the DAU trend, there are only eight million poor left who will be earning less than INR 360 per person per month at 2003-04 constant prices in 2030. By 2040, only one million people will be earning less than INR 360, and poverty is alleviated in that sense. In VD, poverty is eliminated faster than in the DAU scenario till 2030, and it is completely eliminated in 2040 because of cash transfer.
• Access to services
Access to water and sanitation According to World Development Indicators, World Bank’s collection of development indicators, access to an improved water source refers to the percentage of the population with reasonable access to an adequate amount of water from an improved source, such as a household connection, public standpipe, borehole, protected well or spring and rainwater collection. Unimproved sources include vendors, tanker trucks, and unprotected wells and springs. Reasonable access is defined as the availability of, at least, 20 litres of water per person per day from a source within one kilometre of the dwelling.
Figure 22 Access to clean water
Currently, more than 80 per cent of the households have access to clean water. In the DAU scenario, by 2020, the entire population will have access to clean water. Visionary Development achieves universal access to clean water by 2015.
Access to improved sanitation facility includes access to a latrine facility with water closet or covered pit latrine or public latrine (World Bank 2012). Currently, 67.3 per cent of households does not have access to sanitation facilities and have to opt for open defecation (Census 2011). If this trend follows in the DAU scenario only 68 per cent of the population will have access to sanitation facilities by 2050. In VD, 90 per cent of the population will have access to sanitation by 2030, and by 2040, universal access to sanitation is provided.
0
20
40
60
80
100
120
2020 2030 2040 2050
Perc
enta
ge o
f peo
ple
wit
hac
cess
to c
lean
wat
er
Year
DAU
VD

Low-carbon Development Pathways for a Sustainable India | 37
Visionary Development scenario
Figure 23 Access to sanitation
Access to electricity At present, 67 per cent of the households have access to electricity; however, even though they are connected to the grid, access is limited due to power cuts (Census 2011). The model shows that poor households (people in household consumption classes of RH1, RH2 and RH3 in rural areas) consume less than 1kWh of electricity per household per day in the DAU scenario. Thus, in the VD scenario, subsidized electricity is provided to poor households in these three classes to increase their electricity consumption above 1 kWh per household per day, or above 365 kWh per annum. Assuming the household size of five persons, it translates to electricity access of 73 kWh per person per annum.
Figure 24 shows that in the DAU scenario, the average electricity consumption of poor households from RH1, RH2 and RH3 is merely 13 kWh per person per annum in 2020. By 2040, on an average every person in a poor household will consume 79 kWh of electricity per annum, and by 2050, average electricity consumption will increase to 174 kWh per person per annum for the poor.
Figure 24 Per person per annum average electricity consumptionin poor rural households
0
20
40
60
80
100
120
2020 2030 2040 2050
Perc
enta
ge o
f pop
ulat
ion
Years
DAU
VD42
70
90100 100
5159 68
1328
79
174
85105
158
257
2020 2030 2040 2050
kWh
0
50
100
150
200
250
300
Years
DAU
VD

38 | Low-carbon Development Pathways for a Sustainable India
Visionary Development scenario
In the DAU scenario, the electricity consumption by poor households (UH1, UH2 and UH3 household consumption classes) in urban areas will be 58 kWh per person per annum in 2020. By 2030, every poor household will consume more than 78 kWh of electricity per person per annum. In the VD scenario, the electricity consumption of poor households will exceed 79 kWh per person per annum and will be 101 kWh in 2020; by 2050,electricity consumption will be 322 kWh per person per annum (see Figure 25).
Figure 25 Per person per annum average electricity consumption in poor urban households
Access to clean cooking fuel According to Census 2011, only 29 per cent of households in India use LPG or PNG as cooking fuel. The rest of the households, mainly in rural areas, are dependent on firewood, cow dung cake, crop residue, etc. for cooking fuel requirements. Visionary Development aims to provide universal access to LPG and/or PNG. In the VD scenario, a minimum of six LPG cylinders is provided to all those households that are already not consuming LPG.
The Visionary Development scenario envisages development in important well-being indicators like health, education, access to various services and poverty reduction. These can be achieved mainly with income growth, targeted assistance/subsidies reaching the poor and increase in government expenditure on health and education, along with good governance. The values of well-being indicators in the VD scenarios are summarized below.
Well-being indicator 2020 2030 2040 2050Life expectancy at birth (female) years
73 78 80 80.31
Life expectancy at birth (male) years
70 74 76 76
Infant mortality rate 25 7 2 2
Mean years of schooling 6.3 8.7 10.7 12.1
Population below poverty line7 (rural/urban )
25 4 0 0
1 0 0 0
Access to clean water (% of population with access)
100 100 100 100
Access to sanitation (% of population with access)
70 90 100 100
5878
139
266
101128
187
322
0
50
100
150
200
250
300
350
2020 2030 2040 2050
kWh
Years
DAU
VD
7 The poverty line in the model is defined as the per capita monthly consumption expenditure of INR 227 in rural areas and INR 360 in urban areas, at 2003-04 constant prices.

Low-carbon Development Pathways for a Sustainable India | 39
Visionary Development scenario
Well-being indicator 2020 2030 2040 2050Average electricity consumption per person per year in the three poorest rural classes (kWh)8
85 105 158 257
Average electricity consumption per person per year in the three poorest urban classes (kWh)
101 128 187 322
4.6.2 Assessment of the cost of Visionary Development scenario
The Visionary Development scenario maximizes the per capita consumption expenditure, as in the DAU scenario. However, due to various development interventions, government consumption increases. Many investments are reallocated to favour an increase in household consumption on health, education, housing, electricity, cooking fuel, etc. Figure 26 shows that the per capita consumption expenditure remains similar in the DAU and VD scenarios. While it would seem that income transfer to the poor should have increased the average per capita consumption in VD, this does not happen because the transfer is financed by a tax on the richer classes. This would affect savings of different classes. However, the study does not consider savings by class, and the aggregate saving in the economy is endogenously determined in the model to optimize the present discounted value of private consumption over a period of time. (Chidiak, M. and Tirpak, D. 2008)
Figure 26 Per capita consumption expenditure in DAU and VD
The GDPs in DAU and VD are also comparable with each other. The GDP grows at a slightly higher rate of 7.02 per cent from 2010 to 2050 in the VD scenario. Figure 27 gives the GDP comparison between DAU and VD at 2003-04 constant prices.
55008
118757
256388
492929
53927116425
251353
493707
0
100,000
200,000
300,000
400,000
500,000
600,000
2020 2030 2040 2050
Years
DAUVD
INR
/ Pe
rson
8 The average electricity consumption per person per year in the three poorest rural and urban classes, which mainly benefit from subsidized electricity

40 | Low-carbon Development Pathways for a Sustainable India
Visionary Development scenario
Figure 27 GDP in DAU and VD
4.6.3 Impact of Visionary Development on carbon emissions
One would expect that development in all fields would lead to significant increase in carbon emissions in the Visionary Development scenario. However, results show that carbon emissions are, in fact, similar in the DAU and VD scenarios (see figures 28 and 29). This is mainly because the technology and energy mix are kept the same in DAU and VD. It makes an important point that Visionary Development is, in fact, possible without increasing carbon emissions in comparison with Dynamics as Usual.
Figure 28 Cumulative emissions in DAU and VD
Figure 29 CO2 emissions per year in DAU and VD
168695
226418
366179
713793
1640772191 19
360589
697328
0
100,000
200,000
300,000
400,000
500,000
600,000
700,000
800,000
2020 2030 2040 2050Years
DAUVD
INR
Bill
ions
0
100
200
300
400
500
2020 2030 2040 2050
Gig
a To
nnes
Years
DAUVD
0
5,000
10,000
15,000
20,000
25,000
2020 2030 2040 2050
Mill
ion
Tonn
es
Years
DAUVD

Low-carbon Development Pathways for a Sustainable India | 41
Visionary Development scenario
Figure 31 CO2 intensity of the GDP in DAU and VD
Since, Visionary Development focuses on development, the technology and sectoral assumptions of DAU are kept intact, and the sectoral composition of emissions does not change much in VD (see Figure 32).
Figure 32 Sectoral emissions in DAU and VD
Electricity generation in VD compared to DAU The electricity generation portfolio does not change much in VD compared to DAU (see figures 33 and 34). The share of subcritical coal in electricity generation increases until 2030 and, thereafter, stabilizes. The share of supercritical coal constantly increases and by 2040, supercritical coal replaces subcritical coal as the most dominant technology for electricity generation in India. By 2050, wind (1,000 billion kWh), natural gas (928 billion kWh), hydro (600 billion kWh), solar PV (496 billion kWh) and solar thermal (464 billion kWh) will assume important roles in electricity generation and produce 22 per cent of the total electricity.
2020 2030 2040 20500
2
4
6
8
10
12
14
Tonn
es/P
erso
n
Years
DAU
VD
0
0.05
0.1
0.15
0.2
0.25
2020 2030 2040 2050
Mt/
Bill
ion
$GD
P(P
PP)
Years
DAU
VD
0
2,000
4,000
6,000
8,000
10,000
12,000
14,000
16,000
DAU VD DAU VD DAU VD DAU VD
2020 2030 2040 2050
Mill
ion
Tonn
es
Years
Forestry
Services
Industry
Transport
Power
Energy
Figure 30 Per capita CO2 emissions in DAU and VD

42 | Low-carbon Development Pathways for a Sustainable India
Visionary Development scenario
Figure 33 Electricity generation in DAU
Figure 34 Electricity generation in VD
0
2,000
4,000
6,000
8,000
10,000
12,000
14,000
16,000
2020 2030 2040 2050
Bill
ion
kWh
Years
Windstorage
Solarthermalstorage
PV storage
Solarthermal
Solar PV
Diesel
Wind
Wood
Nuclear
Natural gas
Hydel
Supercritical coal
Sub criticalcoal
0
2,000
4,000
6,000
8,000
10,000
12,000
14,000
16,000
2020 2030 2040 2050
Bill
ion
kWh
Years
Windstorage
Solarthermalstorage
PV storage
Solarthermal
Solar PV
Diesel
Wind
Wood
Nuclear
Natural gas
Hydel
Supercritical coal
Sub criticalcoal

Low-carbon Development Pathways for a Sustainable India | 43
Low-carbon Development scenarios
The goal of this study is to examine the possibilities, options and implications of achieving low-carbon development pathways for staying below the 2°C global warming limit, along with attaining Visionary Development. This section analyses how India can achieve the Visionary Development targets, described in the preceding sections, within the constraint of prescribed carbon budgets.
5.1 Deciding carbon budget for India
“Latest research shows that there is only a realistic chance of restricting global warming to 2°C if a limit is set on the total amount of CO2 emitted globally between now and 2050. To keep global warming within a mean global temperature increase of no more than 2ºC, which is considered still manageable and to which it will presumably still be possible to adapt, worldwide greenhouse gas emissions must be reduced.”- WWF International, 2009
The global carbon budget is defined as the maximum net amount of emissions that can be emitted globally, within a specified period, to limit the increase in global mean temperature below 2ºC, compared to the average temperature in 1850. Thus, the global carbon budget available till 2050 for all countries is essentially limited and not a free good. Countries need to share this limited global carbon space between now and 2050, and the emission rights of countries need to be shared on the basis of the principle of equity.
Various studies have given estimates of global carbon space and approaches to share this global carbon space, known as global carbon budget (Meinshausen 2010, WBGU 2009, TERI 2010 and TISS 2010).
This study uses the budget approach given by the German Advisory Council on Global Change (WBGU) as the council follows the principle of equity to determine the share in the global carbon budget (WBGU 2009). It uses a per-capita basis for allocating emission rights among all the countries. It may be noted that such estimates have implicit assumptions of time profiles of emissions. Say, if all 600 Gt were to be emitted in the year 2050 and nothing in between, then that would have a different warming impact. Ideally, one should assess the global carbon budget in Gt-years of emissions. Thus, one gigatonne of emission in 2010 should count for 40 Gt-years, whereas one gigatonne of emission in 2050 should count as one Gt-year. Such a measure would be more equitable to developing countries whose emissions will be increasing over the development period.
The budget approach of WBGU The global carbon budget of CO2 emissions is arrived at from the probability of the increase in global mean temperature by 2ºC.By the middle of the 21st century, a maximum of about 750 Gt CO2 (billion metric tonnes) may be released into the earth’s atmosphere if the 2ºC limit is to be adhered to with a probability of 67 per cent. If the probability is raised to 75 per cent, the cumulative emissions within this period would have to remain below even 600 Gt CO2.
The WBGU budget approach concentrates on the fossil fuel-based CO2 emissions. CO2 emissions from anthropogenic sources play a key role in climate mitigation due to the large amounts that are released in the atmosphere and the extensive length of time for which they are retained in the environment (WBGU 2009).
Chapter 5Low-carbon
Development scenarios

44 | Low-carbon Development Pathways for a Sustainable India
Low-carbon Development scenarios
The WBGU approach considers three criteria for deciding national carbon budgets. i. The start year of the budget ii. The probability of achieving compliance with the 2ºC limit by the end year iii. The demographic reference year for calculating the population share of each countryTwo approaches are suggested under the WBGU study for deciding national carbon budgets based on the above three criteria. i. Historical responsibility ii. Future responsibility
i. Historical responsibility, based on 1990 The historical responsibility approach takes 1990 as the start year for calculating the global carbon budget. It takes into account the “polluter pays” principle and the historical responsibility of industrialized countries for emissions. It was in 1990 that the IPCC published its First Assessment Report and countries were informed of the climate problem, its causes and effects. (WBGU 2009) A probability of 75 per cent compliance with the 2°C guard rail is selected, which yields a global budget of 1,100 Gt CO2 from fossil sources from 1990 to 2050. The year 1990 is also taken as the demographic reference year, according to which the world population and the share of each country in the world population are determined. National carbon budgets are arrived at by dividing the global carbon budget of 1,100 Gt CO2 by the share of each country in the world population in 1990 and assigning budgets on a per-capita basis. India had a share of 16 per cent in the world population in1990, giving India emission rights of 175 Gt CO2 from 1990 to 2050. Emissions already produced from 1990 to 2009 are subtracted from India’s total emission rights to arrive at the carbon budget from 2010 to 2050. India produced emissions of 19 Gt of CO2 from 1990 to 2009, which leaves it with a carbon budget of 156 Gt CO2 for use from 2010 to 2050.
ii. Future responsibility, based on 2010 The future responsibility approach considers 2010 as the base year. It is oriented toward the responsibility of all countries for future emissions (starting from 2010), and historical responsibility is taken care via lump-sum compensation payments by industrialized countries to newly industrializing and developing countries. This approach accepts a greater climate change risk and assumes a probability of only 67 per cent compliance with the 2°C limit. Accordingly, a global carbon budget of 750 Gt is divided into national carbon budgets. The demographic reference year is 2010. The share of each country in the world population in 2010 is determined so as to arrive at national carbon budgets on a per-capita basis. India had a share of 18 per cent in the world population in 2010, giving the country an allocation of 133 Gt of CO2 emissions from 2010 to 2050.

Low-carbon Development Pathways for a Sustainable India | 45
Low-carbon Development scenarios
The summary of this discussion and India’s carbon budget calculation are given in Table17.
Table 17 WBGU approach – India’s carbon budget based on 1990 and 2010
Start year 1990 2010Global carbon budget (Gt CO2) 1,100 750
Share of India in world population at start year (%) 16 18
Total carbon budget for India till 2050 (Gt CO2) 175 133
Emissions to date 1990-2009 (Gt CO2) 19
Carbon budget from 2010 to 2050 (Gt CO2) 156 133
Carbon budget per year from 2010 to 2050 (Gt CO2) 3.8 3.2
In this study, two carbon budgets are used for India—156 Gt CO2 (1990) and 133 Gt CO2 (2010), as worked out by WBGU.
5.1.1 Adhering to the carbon budget by 2050
According to International Energy Agency (IEA) data on CO2 emissions from fuel combustion, India’s CO2 emissions have grown from 200.2 million tonnes of CO2 in 1971 to 1,625.8 million tonnes of CO2 in 2010.
India’s official emission report for 2007 is presented in Table 18.
Table 18 India’s GHG emissions
GHG emissions Quantity (in million tonnes)CO2 1,497
CO2 sequestration through additional forests 275
CH4 21
N2O 239
CO2-eq 1,728Source: MoEF, 2010
Figure 35 Historical series of India’s CO2 emissions from fuel combustion
Source: IEA, 2012
If the current trend (see Figure 35) is assumed to continue, India will have CO2 emissions of more than 14 Gt in 2050. The cumulative emissions from 2010 to 2050 will amount to 242 Gt of CO2, according to trend analysis. Thus, it is clear that if India is to stay within the prescribed carbon budgets, it will need to avoid getting
0
200
400
600
800
1,000
1,200
1,400
1,600
1,800
1971 1973 1975 1977 1979 1981 1983 1985 1987 19891991 1993 1995 1997 1999 20012003200520072009
Co
emis
sion
s fr
om fu
el2
com
bust
ion(
Mill
ion
Tonn
es)
Years

46 | Low-carbon Development Pathways for a Sustainable India
Low-carbon Development scenarios
locked in a fossil fuel-based development pathway and must shift to low-carbon development pathway. Since inclusive development is not to be ignored, the study has taken the Visionary Development scenario as the starting point for low-carbon development. It is implicit that low-carbon development will achieve the thresholds of Visionary Development to the furthest extent possible. The highest priority for India is to improve the well-being of its people.
5.2 Interventions in Low-carbon Development scenarios
This section details all the interventions in major sectors that will reduce emissions and lead to a low-carbon development pathway which adheres to carbon constraints.
5.2.1 Energy sector
In the current situation, the energy scenario in India is dominated by fossil fuels like coal and petroleum products. This is because coal is relatively abundant and is the cheapest source of energy available in India at present. The model decides the production and investments, based on the opportunity cost to maximize household consumption; hence, fossil fuels get preference in the Dynamics-as-Usual scenario. But in the Low-carbon Development scenario, once a constraint is imposed on the model, opportunity costs have to take into account the resulting emissions and whether they abide by the constraint. So, the economy can emit only 156 Gt CO2 of cumulative emissions in the LC1 scenario and, even lower, 133 Gt CO2 of cumulative emissions in the LC2 scenario from 2010 to 2050. As a result, in Low-carbon Development, the share of fossil fuels like coal, crude petroleum products and petroleum products gets limited, on the one hand. On the other hand, the share of natural gas increases; natural gas is a comparatively cleaner source of energy and is relatively cheaper for generating peaking power to balance energy production from solar and wind, which is not available on demand.
The autonomous energy efficiency improvement (AEEI) parameters of the energy resources are increased to take into account better energy efficiency of these parameters in low-carbon scenarios. AEEI of coal, petroleum products, natural gas and electricity is increased, except in electricity generation, as shown in Table 19.
Table 19 AEEI (per cent per annum)
Coal, except in electricity generation 1.5
Coal in electricity generation 1.0
Petroleum products, except in electricity generation
1.5
Petroleum products in electricity generation 1.0
Natural gas, except electricity generation 1.5
Natural gas in electricity generation 1.0
Electricity, except in electricity generation 1.0
Electricity, used in electricity generation 0.5
5.2.2 Power sector
Low-carbon alternatives in the power sector depend on conversion technologies and the role of upfront fixed investment needed for them. The power portfolio in India is changing. From subcritical technology-based coal power plants, a shift is already being made to supercritical coal-based power plants, as discussed in Dynamics as Usual. The target of the National Solar Mission, announced in 2009, is to generate 20,000 MW of electricity by 2020. Wind also

Low-carbon Development Pathways for a Sustainable India | 47
Low-carbon Development scenarios
contributes substantially to electricity generation. But these efforts are not enough to restrict carbon emissions from the power sector in a big way. These, and other technologies, will have to play a big role in the Low-carbon Development scenarios, for which the following options are provided.
5.2.2.1 Fossil fuels
Thermal coalThough supercritical-coal technology requires a higher capital cost than subcritical-coal technology, it entirely replaces subcritical coal; supercritical-coal-based power plants use 20 per cent less coal and, thus, emit less CO2. The capital cost of supercritical coal is higher than subcritical coal. Subcritical coal has been assumed to have a 0 per cent per annum AEEI, as subcritical power plants are already being replaced by supercritical coal. The share of subcritical coal in the total electricity generation from thermal coal is assumed to decrease to 0.32 by 2050.
The average efficiency of coal use in electricity generation was 30.5 per cent in 2010. In the study model, electricity is a vertically integrated sector, which includes generation, transmission and distribution (T&D). The difference between the energy billed and energy supplied was 24 per cent in 2010-11 (Planning Commission 2012) for the major distribution utilities. For the country, as a whole, it would be higher still. A reduction of two percentage points in T&D losses is attainable, as most developed countries have T&D losses much below 12 per cent. For example, T&D losses in the EU, USA and China are below 7 per cent (UNDP 2008). Over 40 years, this will suggest an additional improvement of 0.3 per cent per year. This study has assumed a slightly higher effort of 0.5 per cent per year.
Wood gasificationWood-based electricity generation, which has zero net emissions if based on sustainable forestry, is used in the Low-carbon Development scenario. But its potential is restricted to using 2 per cent of the forestry output in India.
Natural gasThe model assumes that a maximum of 40 per cent of the total available natural gas is used for power generation. Natural gas is a fossil fuel but relatively cleaner than coal. Its role is more of a transition fuel and is used primarily to meet the peak demand requirement along with hydro, solar and wind.
5.2.2.2 Nuclear fuel
Nuclear technologies carry with them risks of significant damage in case of an accident. Also, there are other concerns of costs and disposal of waste from the use of nuclear technology. This study does not go into these details as nuclear potential in India is restricted to 11 Gw throughout all scenarios and it does not play any role in the study. The capacity of 11 Gw is already installed or under construction.
5.2.2.3 Renewable sources
At present, renewable sources are expensive compared to fossil fuels, given the higher capital cost per kWh of generation. But due to the need to restrict CO2 emissions in the Low-carbon Development scenarios, an increase in the use of renewable sources of energy is envisaged. A minimum penetration rate of 5 per cent (the increase in share in total electricity generation) for renewables is assumed in the LC scenarios.

48 | Low-carbon Development Pathways for a Sustainable India
Low-carbon Development scenarios
Solar technologyGiven the tremendous potential for solar power in India, the scenario does not put any restrictions on solar-based electricity generation. According to the Expert Group on Low Carbon Strategies for Inclusive Growth, solar has considerable advantages for both centralized and decentralized electricity generation, and also for powering rural areas. Solar electricity is presently expensive, almost three to four times the cost of coal-based power. However, the solar industry is optimistic that the cost could come down to grid parity within the coming decade because of the growing manufacturing capacity in the country, short-term support from the government to bridge the viability gap, aggressive research and development and large-scale deployment (Planning Commission 2011).
Two technologies – solar photovoltaic and solar thermal – are used for electricity generation. Both options, with and without storage, are provided. The cost of solar is assumed to fall over a period of time till 2025 and, thereafter, it is assumed to stabilize.
Wind technologyWith an installed capacity of over 17Gwin 2010, India ranks fifth in the world in the manufacture and deployment of wind-based electricity generation. The current policy framework in wind energy generation is investor friendly. Measures such as an attractive accelerated depreciation, feed-in tariff, supportive regulatory regime, fiscal and promotional incentives provide a strong foundation for the growth of the sector (MNRE 2012). According to the Expert Group on Low Carbon Strategies for Inclusive Growth, “wind power is a commercially mature technology. The momentum should continue and wind capacity could increase to 30,000 MW by 2020. Even though the load factor of wind plants is low (17%), it is attractive as it can be set up quickly” (Planning Commission 2011).
Costs of wind are also seen to decline across the globe. The scenario assumes that the cost of wind-based electricity generation will fall over a period of time till 2015 and stabilize after that.
Both with and without storage options are explored for wind-based electricity generation. The estimate of wind power potential varies widely. Wind potential is assumed to be 1,000 Gw till 2050 (see Annexure 4).
But wind power has many environmental and social implications. The area of land required for wind power can create financial as well as social costs in India. India has small and fragmented land holdings. To successfully implement a wind power project in India, a suitable business model has to be created under which land is rented from small farmers or a share in the revenue is provided to them. It is assumed in the scenarios in this study that this will be done. The investment costs required to produce a kilowatt of power from solar and wind (with storage and without storage) technologies are given in Table 7 (see Chapter 2). Higher operating costs are assumed for wind with storage and solar PV with storage to account for battery costs. Battery costs are assumed to be 40 per cent of the capital costs, and batteries are assumed to be replaced every five years.
For solar and wind technology, falling costs are assumed through a higher total factor productivity growth (TFPG). The rate of decline in the capital costs for solar and wind technologies are as shown in Table 20.
Table 20 Falling costs of wind and solar in Low-carbon Development scenarios
Falling costs of solar and windTFPG assumed for solar
2010 0.21
2015 0.28
2020 0.16
2025 0.19
2030 onwards 0.1

Low-carbon Development Pathways for a Sustainable India | 49
Low-carbon Development scenarios
Falling costs of solar and windTFPG assumed for wind
2010 0.2
2015 onwards 0.1
HydroThe capital cost of hydro is less compared to solar. But the share of hydro power in electricity generation has been gradually declining because of the increasing difficulty in exploiting the remaining potential, which lies mainly in the North-east region of the country. Also, the viability of large hydro projects needs to be examined, given the high cost of resettlement and the emissions from land clearing (Planning Commission 2011).
5.2.3 Transport sector
Owing to economic development and lifestyle changes, the role of the transport sector in carbon emissions will increase. So, some important interventions are introduced in the transport sector in LC scenarios.
5.2.3.1 Modal shift in freight transport
Indian Railways had a share of about 88 per cent of the freight market (in tonne-km) in 1950-51, which has fallen to less than 34 per cent in 2011-12. The bulk of this lost share of the freight market has been captured by road freight, as shown in Table 21. This is despite the vast rail network and the poor quality of roads.
Table 21 Share of rail transport in the freight market
Year Percent1950-51 88
1960-60 82
1970-71 70
1980-81 62
1990-91 62
2000-01 38
2011-12 34
2016-17* 31*Trend Projection
Road freight is considerably more energy and carbon intensive than rail transport. For example, Rue du Can (2009) gives an estimate of the energy intensity of freight by different modes (see Table 22).
Table 22 Energy intensity of freight, by mode
Year 1990 1995 2000 2005 2010 2015 2020
(in MJ/tonne-km)
Trucks 5.04 3.68 2.58 2.42 2.24 2.13 2.04
Rail diesel
0.23 0.18 0.14 0.11 0.11 0.11 0.11
Rail electricity
0.11 0.1 0.09 0.08 0.08 0.08 0.08
Source: Rue du Can, 2009

50 | Low-carbon Development Pathways for a Sustainable India
Low-carbon Development scenarios
As can be seen, one tonne-km of freight hauled by diesel trains consumes about 1/20th the energy consumed by a heavy truck. Given the distinct possibility of an oil-constrained future and India’s rising import dependence, there is an urgent need to arrest and reverse the falling trend of the share of rail in freight transport. Industrialized countries, despite having much better road infrastructure, carry 40-50 per cent of freight traffic by railroads. India needs to increase the share of rail for two reasons: shifting to rail transport will reduce the dependence on the import of petroleum products and it will also reduce CO2 emissions.
As per a RITES study the optimal share of railways in freight movement should be 88 per cent (RITES 2009). A significant increase in the efficiency and capacity of railways will be required to get to this level. Railways freight rates will also require to be rationalized. Today, the railways cross- subsidizes passenger transport from freight earnings. At present, two dedicated freight train corridors are under construction and four more are planned. These will not only increase the capacity of the railways to carry more freight, but also will improve the quality of freight movement by rail, in terms of timely delivery.
Thus, the study stipulates that from 2015, the share of roadways in freight traffic will decrease by 2.5 per cent per year and railways will carry that amount of freight. This is accomplished by modifying the coefficients in the input– output matrix.
For bulk commodities, which are currently moved largely by railways, the share of roadways will decrease by only 1per cent per year and not by 2.5 per cent per year. Thus by 2050, the share of other transport will be around 50 per cent of its share in 2005, i.e.0.6 x 0.65 =0.39. The share of rail will be 61per cent.
5.2.3.2 Fuel alternatives
At present, the transport sector relies on petroleum products, and there are limited clean fuel alternatives to restrict the emissions potential of the transport sector. Thus, in the Low-carbon Development scenario, an attempt has been made to explore alternatives to petroleum products such as petrol, diesel, etc.
The demand for petroleum products is assumed to fall by 2 per cent per year. The emerging gap of fuel is filled by natural gas (CNG) and electricity-based transport in the ratio of 60:40. Natural gas is assumed to have a higher potential to replace petrol and diesel because the infrastructure for CNG- based transport is already in place in major cities. Also, existing petrol pumps can be converted into CNG pumps. The government has taken initiatives to introduce CNG in public transport (for example, CNG bus transport in New Delhi) and such models can be replicated in other parts of the country.
Electric cars will also have bigger role to play in private transport in coming years, and their potential to replace fossil fuels has to be taken into account. In the model, energy inputs in the transport sector have been changed to correspond to these substitutions.
5.2.4 Industry sector
The energy efficiency rates for different sectors are already stipulated. The Interim Report of the Expert Group on Low Carbon Strategies for Inclusive Growth has clearly identified the kind of emissions intensity reductions that are possible in the two major sectors—steel and cement. Other studies (IRADe 2009 and CSE 2010) have examined other sectors. India has also launched a scheme for energy reduction in major industries under a “perform, achieve and trade” (PAT) scheme.

Low-carbon Development Pathways for a Sustainable India | 51
Low-carbon Development scenarios
Table 23 shows the reductions in specific energy consumption (SEC) to be achieved over three years – from 2012 to 2015 – by 334 designated consumers (DCs).
Table 23 Targets and rates of reduction of specific energy consumption of designated consumers under the first phase (2012-2015) of the PAT scheme
Sector No. of DCs
Baseline SEC (toe/tof product)
SEC reduction (%)
Target SEC (toe/tof product)
Annual rate of reduction (%)
Iron and steel 67 0.549 5.863 0.517 1.898
Cement 85 0.088 4.793 0.084 1.557
Industry, including cement and steel
334 0.23 5.486 0.217 1.778
Baseline net heat rate (kcal/kWh)
Net heat rate reduction (%)
Target net heat rate (kcal/kWh)
Thermal power plant
144 2,775.56 2.149 2,715.919 0.704
Total 478
Table 24 summarizes the reductions projected by a detailed industry-wise study.
Table 24 Scope for emissions intensity reduction in major industries (MT CO2e/MT)
Industry 2008-09 2020-21 2030-31 EEI (%/year)
Iron and steel
2.40 2.00 2.00 0.8
Cement 0.68 0.52 0.43 2.1Aluminum 20.10 11.50 11.40 2.5Paper and pulp
3.00 1.80 1.60 2.8
Fertilizer 0.70 0.45 0.43 2.2Source: Bhushan, C., 2010EEI= emission efficiency increase
The Interim Report of the Expert Group on Low Carbon Strategies for Inclusive Growth had studied two industries in detail, iron and steel and cement. The estimated rates of energy efficiency improvement were 0.81 and 0.99, respectively, over 2005 and 2020. The three sets of estimates are summarized in Table 25.

52 | Low-carbon Development Pathways for a Sustainable India
Low-carbon Development scenarios
Table 25 Annual rate of energy efficiency improvement (% per year)
Sector
PAT scheme designated consumers, 2012-2015
Low Carbon Committee, 2005-2020
CSE study by Chandra Bhushan, 2008-2030
Aluminum 1.74 2.5
Chlor-alkali 1.99
Textile 1.82
Pulp and paper 1.71 2.8
Iron and steel 1.90 0.81 0.8
Fertilizer 1.92 2.2
Major product Ammonia
0.50
Cement 1.56 0.99 2.1
Industry total 1.78 Source: Planning Commission, 2011, and Bhushan C (2010)
Based on this, the study has taken an AEEI value of 1.5 per cent for the industrial sector. A recent World Bank study assumes a 1.08 per cent emission reduction potential for industry from 2007 to 2031 (World Bank 2011).
5.2.5 Household consumption sector
Household consumption emissions result from the demand for various commodities like transport, electricity and so on by households. Emissions from the household consumption sector are currently limited; however, they are assumed to grow with rising income levels and changing lifestyles and the increasing use of electric appliances over a period of time. Hence, interventions are introduced in household consumption to reflect energy efficiency improvements in appliances, equipment and motorized transport vehicles as well as to indicate the shift to non-motorized transport.
5.2.5.1 Reduction in demand for transport in household consumption
The marginal budget share (demand) of transport is reduced by 0.8 per cent per year in the household consumption sector. The underlying assumption is that with more fuel-efficient vehicles, better urban planning and increased use of mass transport and non-motorized transport, there will be a reduction in the demand for private transport. So, the demand for petroleum products decreases by 1.5 per cent per year, reducing the marginal demand (i.e., the demand above the committed consumption of each expenditure class) for petroleum products by the household sector by 50 per cent by 2050.
5.2.5.2 Increase in usage of energy-efficient electric appliances
As income levels go up and poverty alleviation takes place according to the Visionary Development scenario, an increasing number of people will own appliances like better lights, fans, television sets, refrigerators, air conditioners, etc. Government schemes to provide CFL bulbs or issue star ratings for appliances, which rank appliances according to energy efficiency, are important in this regard. The National Mission on Energy Efficiency is assumed to play a key role in this scenario; already, consumers are buying more energy-efficient appliances. To reflect this, the marginal demand by households for coal and electricity is assumed to reduce by 36 per cent by end of 2050.

Low-carbon Development Pathways for a Sustainable India | 53
Low-carbon Development scenarios
5.2.6 Buildings sector
The service sector uses commercial buildings, which consume electricity. The Bureau of Energy Efficiency (BEE) has formulated the Energy Conservation Building Code (ECBC) (BEE 2009). Experience shows that ECBC-compliant buildings save 30 per cent electricity but cost 4-5per cent more. So, another service production activity is introduced. The share of ECBC- compliant buildings to this sector’s output is exogenously prescribed. In the case of residential buildings, builders who develop housing for sale have no incentive to spend more and individuals who get their houses constructed on their own are very sensitive to initial cost. Hence, ECBC is not applied to residential buildings.
5.2.7. Forestry sector
The National Mission for a Green India is one of the eight missions under the National Action Plan on Climate Change (NAPCC). The mission targets to increase forest/tree cover on five million hectares (50,000 square kilometres) of forest/non-forest lands and improve the quality of forest cover on another five million hectares.
The government plans to achieve the mission output through following way.• Qualitative improvement of forest cover/ecosystems in:
- 1.5m ha (15,000sq. km) of moderately dense forests
- 3m ha (30,000sq. km) of open degraded forests
- 0.4m ha (4,000sq. km) of degraded grasslands
• Creating new forest cover through eco-restoration/afforestation
- 2m ha (20,000sq. km) of scrubs, mangroves, ravines, cold deserts, shifting cultivation areas and abandoned mining areas
- 0.2m ha (2,000sq. km) of urban/peri urban land
- 3.0m ha (3,000sq. km) of agroforestry/social forestry; non-cultivation land
Carbon sinks are assumed to increase according to the targets for afforestation under the Green India Mission.
The technical details of the Green India Mission targets, that have been included in the model, are shown in Table 26.
Table 26 2007 GHG sequestration from LULUCF (in million tonnes of CO2/year)
Forests Croplands Grasslands Firewood Total
MT of CO2 67.8 207.52 -10.49 -87.84 176.99
Area (in ha) 67.8 207.52 3.4
Sequestration (per ha)
1 1 -3.085294

54 | Low-carbon Development Pathways for a Sustainable India
Low-carbon Development scenarios
Projected GHG sequestration from LULUCF (in million tonnes of CO2/year)
Forests Croplands Grasslands Firewood Total
2005 65 205 -9 -85 176
2010 76 210 -13 -90 183
2015 90 210 -16 -70 214
2020 110 210 -20 -30 270
2025 110 210 -21 -30 269
2030 110 210 -22 -30 268
2035 110 210 -23 -30 267
2040 110 210 -24 -30 266
2045 110 210 -25 -30 265
2050 110 210 -26 -30 264
2055 110 210 -27 -30 263
2060 110 210 -28 -30 262
2065 110 210 -29 -30 261Source: MoEF, 2010Cropland is assumed to change a little on the basis of net sown areaGrassland loss is assumed to stop at 10 million ha (100,000sq. km)
5.3 Results of the Low-carbon Development scenario
The study compares the Low-carbon Development (LC) scenario with the VD scenario, which is now the reference scenario. Two scenarios are created for low-carbon development. LC1 restricts the cumulative emissions from 2010 to 2050 to156 Gt of CO2 by adhering to the carbon budget, based on 1990 as the base year. The LC2 scenario restricts the cumulative emissions to 133 Gt of CO2 over the period from 2010 to 2050, given the carbon budget based on 2010. This section, first, discusses the changed carbon emission pathways, CO2 intensity and sectoral emissions in the context of the carbon budget. Then, it assesses the costs to the economy of adopting a low-carbon development pathway.
5.3.1 Impact on carbon emissions
Figure 36 shows that the cumulative carbon emissions of 381 Gt in VD scenario are brought down to the level of 156 Gt and 133 Gt in LC1 and LC2 scenarios, respectively. It must be noted that it is ambitious to set a reduction target of 225 Gt CO2 and 248 Gt CO2 in 40 years over the reference scenario, i.e., VD. It translates into cumulative CO2 reductions of 59 percent and 65 percent for LC1 and LC2, respectively, over the reference scenario by 2050.
Figure 36 Cumulative emissions
40
102
209
381
2756
96
156
2651
85
133
0
50
100
150
200
250
300
350
400
450
2020 2030 2040 2050
Gig
a to
nnes
Years
VD
LC1
LC2

Low-carbon Development Pathways for a Sustainable India | 55
Low-carbon Development scenarios
In terms of annual CO2 emissions, the Low-carbon Development pathways require that CO2 emissions are restricted to less than 7,500 million tonnes in 2050, where as the reference scenario, VD, projects CO2 emissions to be 20,000 million tonnes in 2050 (see Figure 37).
Figure 37 Annual CO2 emissions in VD, LC1 and LC2
Per capita emissions are below five tonnes/person in 2050 for LC1 and 4.1 tonnes/person in LC2 compared to more than 13 tonnes/person in the VD scenario (see Figure 38). In 2020, per capita emissions need to be reduced to 1.77tonnes/person, which are projected to grow up to 3.3 tonnes/person in the VD scenario.
Figure 38 Per capita carbon emissions in VD, LC1 and LC2
To achieve the targets of 156 Gt and 133 Gt of cumulative emissions, the CO2 intensity of the GDP decreases further. India’s CO2 intensity of the GDP is already low, but it will need to reduce to below 0.1MT/billion USD GDP (PPP) in the LC scenarios, while it will be 0.2 MT/billion USD GDP (PPP) in VD scenario (see Figure 39).
4383
8082
13712
20000
22693539 4621
7616
21112915 3651
6251
0
5,000
10,000
15,000
20,000
25,000
2020 2030 2040 2050
Mill
ion
onne
sT
Years
VD
LC1
LC2
3.3
5.6
9.0
13. 1
1. 7 2.5 3
5
1. 6 2 2. 4
4. 1
0
2
4
6
8
10
12
14
2020 2030 2040 2050
Tonn
es/P
erso
n
Years
VD
LC1
LC2

56 | Low-carbon Development Pathways for a Sustainable India
Low-carbon Development scenarios
Figure 39 CO2 intensity of GDP in VD, LC1 and LC2
Sectoral emissions Sectoral emissions change in the LC1 and LC2 scenarios compared to the VD scenario from 2020 to 2050 (see figures 40 - 43).
Figure 40 Sectoral emissions (2020) Figure 41 Sectoral emissions (2030)
Figure 42 Sectoral emissions (2040) Figure 43 Sectoral emissions (2050)
0.200.18 0.19
0.200.17
0.17
0.11 0.11
0.180.16
0.11 0.11
0
0.05
0.1
0.15
0.2
0.25
2020 2030 2040 2050
MT
/Bill
ion
US
D G
DP
(PPP
)
Years
VD
LC1
LC2
-2000
0
2000
4000
6000
8000
10000
12000
VD
LC1
LC2
Mill
ion
Tonn
es
Forestry
Services
Industry
Transport
Power
Energy
-2000
0
2000
4000
6000
8000
10000
12000V
D
LC1
LC2
Mill
ion
Tonn
es
Forestry
services
Industry
Transport
Power
Energy
-2,000
0
2,000
4,000
6,000
8,000
10,000
12,000
VD
LC1
LC2
Mill
ion
Tonn
es
Forestry
Services
Industry
Transpor t
Power
Energy
-2,000
0
2,000
4,000
6,000
8,000
10,000
12,000
14,000
16,000
VD
LC1
LC2
Mill
ion
Tonn
es
Forestry
Services
Industry
Transport
Power
Energy

Low-carbon Development Pathways for a Sustainable India | 57
Low-carbon Development scenarios
In 2020, the major emissions reduction comes from the power sector. Power sector emissions reduce from 1,318 million tonnes to 511 million tonnes in LC1 and to 510 million tonnes in LC2 scenario. Emissions from the energy and industry as well as the transport sectors decline consistently in LC1 and LC2 scenarios compared to the VD scenario. In total, emissions from these four CO2-intensive production sectors are restricted to less than 1,000 million tonnes in the Low-carbon Development scenarios in 2020. In 2030, carbon emissions from the energy, power, transport and industry sectors together exceed 4,000 million tonnes in VD but are curbed to less than 2,000 million tonnes in the Low-carbon Development scenarios. In 2050, transport sector emissions are nearly as high as power sector emissions in VD scenario. However, various initiatives in the transport sector reduce emissions from 4,524 million tonnes to 1,081 million tonnes in LC1 and to 797 million tonnes in LC2.
Power sector A transition from Visionary Development to a Low-carbon Development scenario requires that low-carbon options in electricity generation be explored, as the power sector amounts to more than 50 per cent of the carbon emissions among major CO2- intensive sectors in India. To reduce emissions from the power sector, it is important to move away from subcritical coal-based electricity generation. This is already a part of the policy of the government of India. Supercritical coal takes on a more prominent role in electricity generation in Low-carbon Development scenarios than in the VD scenario. However one observes that though the share of subcritical plants in total power generation from coal decreases in the DAU and VD scenarios their absolute contribution in billion kWh does not decrease. Infact it increases slightly. This is because even though government policy requires all new plants that are set up to be based on supercritical technology, the earlier existing plants which were subcritical-technology based, continue to operate till they are phased out. They keep generating power using the currently installed capacities. Hence, the generation from subcritical plants increases slightly around 2040 and decreases thereafter.
Substituting subcritical coal with supercritical coal is not enough to achieve the required emissions reductions. A shift to hydro, natural gas and nuclear is the second-most important step in reducing emissions, whereas wind, solar PV and wood gasification technologies start appearing in 2020 in the Low-carbon Development scenarios. It needs to be noted here that the capital costs of power technologies are same across scenarios (except for solar and wind). Thus, in Low-carbon Development scenarios, the model balances emissions and costs of power technologies according to the potential of that technology in the country. Thus, given the carbon constraints, the model chooses solar PV with storage and without storage and wind without storage as major options in the LC1 scenario. Other renewables like hydro and wood gasification are limited by potential. Natural gas and nuclear-based thermal power generation are also limited. Natural gas is limited because of the high cost of importing natural gas, and nuclear-based power generation is limited as it is not considered an option beyond the existing plants and those under construction. Low-carbon electricity generation requires higher investments. Higher investment means lower consumption. Hence, beyond a point, the model finds that higher investment leads to lower consumption than when the GDP is lowered. The model, therefore, makes a choice for lowering emissions either by reducing the GDP or by increasing the share of renewables in power generation. In the LC2 scenario, the carbon constraint is more stringent and requires many more low-carbon options to be explored. Hence, the contribution of supercritical coal further declines in the LC2 scenario and the share of other options like solar photovoltaic, solar thermal with storage, natural gas and hydro increases (see figures 44 - 46).

58 | Low-carbon Development Pathways for a Sustainable India
Low-carbon Development scenarios
Figure 44 Electricity generation in VD
Figure 45 Electricity generation in LC1
0
2,000
4,000
6,000
8,000
10,000
12,000
14,000
16,000
2020 2030 2040 2050
Bill
ion
kWh
Years
Wind storage
Solar thermalstorage
PV storage
Solar thermal
Solar PV
Diesel
Wind
Wood
Nuclear
Natural gas
Hydel
Super criticalcoal
Sub critical coal
0
2000
4000
6000
8000
10000
12000
14000
16000
2020 2030 2040 2050
Bill
ion
kWH
Years
Wind storage
Solar thermalstorage
PV storage
Solar thermal
Solar PV
Diesel
Wind
Wood
Nuclear
Natural gas
Hydel
Super critical coal
Sub critical coal

Low-carbon Development Pathways for a Sustainable India | 59
Low-carbon Development scenarios
Figure 46 Electricity generation in LC2
In the LC2 scenario, wind, hydro, solar PV and solar thermal with storage produce a total 2,292 billion kWh of electricity in 2050. However, some of these renewable sources are not available on demand and need back up. While the share of coal reduces in LC2 in 2050, the share of natural gas increases and it produces 2,085 billion kWh of electricity.
As a result of the increased share of renewable sources and the reduced share of subcritical coal, emissions from the power sector are reduced drastically in LC1 and LC2. They are below 1,000 million tonnes in 2050 (see Figure 47).
Table 27 shows the change in electricity generation from various power technologies. Supercritical and subcritical coal, natural gas and diesel are clubbed as fossil fuels. However, one should note that emissions from supercritical coal and natural gas are comparatively lower than subcritical coal and diesel, and thus, are considered cleaner fuels. Solar with storage and without storage, wind, hydro and wood are clubbed as renewable sources, and nuclear is reported separately. The results show that in 2050, in the VD scenario, the share of fossil fuels in electricity generation is 82 per cent, whereas renewables contribute 18 per cent to electricity generation. In the Low-carbon Development scenarios, the share of fossil fuels declines to 55 per cent in LC1 and 58 per cent in LC2, whereas the share of renewables increases to 44 per cent in LC1 and 41 per cent in LC2.
0
2000
4000
6000
8000
10000
12000
14000
16000
2020 2030 2040 2050
Bill
ion
kWh
Years
Wind storage
PV storage
Solar thermal
Diesel
Wind
Wood
Nuclear
Hydel
Natural gas
Solar thermalstorage
Solar PV
Super criticalcoal
Sub criticalcoal

60 | Low-carbon Development Pathways for a Sustainable India
Low-carbon Development scenarios
Table 27 Share of various technologies in electricity generation in 2050
2050
VD LC1 LC2
Total electricity generation in billion kWh for 2050 14,092 6,941 5,571
Supercritical coal 7,479 677 677
Subcritical coal 3,075 441 441
Natural gas 928 2,684 2,085
Diesel 10 10 10
Total fossil fuels 11,492 3,812 3,213
Percentage of total electricity generation 82 55 58
Wind 1,000 988 988
Solar with storage 464 927 488
Solar without storage 496 541 209
Hydro 600 591 591
Wood 16 16 16
Total renewables 2,576 3,063 2,292
Percentage of total electricity generation 18 44 41
Nuclear 24 66 66
Figure 47 Power sector emissions
Energy sector Efficiency improvements result in reduced emissions from the energy sector. An energy efficiency growth rate of 1 per cent has been assumed for each fossil fuel-based power generation technology. This is complimented by falling capital costs due to technological improvements, especially of renewable technologies.
0
500
1000
1500
2000
2500
3000
3500
4000
4500
5000
2020 2030 2040 2050
Mill
ion
Tonn
es
Years
VD
LC1
LC2

Low-carbon Development Pathways for a Sustainable India | 61
Low-carbon Development scenarios
Figure 48 Energy sector emissions
Transport sector Emissions from the transport sector are growing because of the changes in lifestyle. However, due to the modal shift in freight transport from road to rail and the lowering of the demand for transport from the household sector, emission from this sector can be reduced as well as restricted to 1,100 million tonnes in LC1 and 800 million tonnes in LC2 (see Figure 49).
Figure 49 Transport sector emissions
Industry sector The industry sector includes cement and steel, and emissions from the iron and steel and cement industries account for the overall sector emissions. According to Gielen and Talyor (2009), the iron and steel industry in India produces steel from iron ore and steel scrap. Coal and electricity are the main energy and feedstock sources. The cost of energy accounts for 24 per cent of the cost of production in the iron and steel sector. The Indian iron and steel industry is special because a high share of steel production is based on the use of direct reduced iron (DRI). India is the largest producer of DRI worldwide, and it is the only country that has DRI production based on coal. India produced 9.1 MT of DRI and 26.1 MT of iron hot metal in 2004 (so, 26 per cent of all primary metal feedstock is DRI). The combined production of iron and DRI almost equals that of steel production. This is typical of a developing country that lacks scrap steel resources. The iron and steel industry
0
100
200
300
400
500
600
700
800
900
2020 2030 2040 2050
Mill
ion
Ton
nes
Years
VD
LC1
LC2
0
500
1000
1500
2000
2500
3000
3500
4000
4500
5000
2020 2030 2040 2050
Mill
ion
Tonn
es
Years
VD
LC1
LC2

62 | Low-carbon Development Pathways for a Sustainable India
Low-carbon Development scenarios
has complex flows of energy and materials. Most of the commodities can be sold ‘‘over the fence’’ and some can be shipped over long distances. As a consequence, the energy use and CO2 emissions of the full production chain may be considerably higher or lower than what is suggested by the footprint at the industry site.
In the case of cement, India is the second-largest producer in the world. The majority of its large kilns are among the most energy efficient in the world, with an average thermal energy use of 3 GJ/t. This can be explained by the fact that energy cost accounts for 40 per cent of the total production cost. Coal and electricity are the main sources of energy (Gielen and Taylor 2009).
According to C-CAP (2009), the mitigation options that are evaluated for the cement industry include the expansion of ongoing efforts in plant modernization, process improvements and the use of blended cements. Some suggestions to overcome the high cost of new technologies (identified as a key barrier) in the iron and steel sector are: focusing R&D on improving the quality of steel, building capacity for facilitating the resolution of pending technical issues, developing adequate financing mechanisms, such as domestic cap-and- trade mechanisms, etc.
Figure 50 gives the comparison of emissions from the industry sector in VD, LC1 and LC2.
Figure 50 Industry sector emissions
The breakup of emissions among the iron and steel and cement industries can be seen in Figure 51. The share of emissions from iron and steel increases, whereas the share of the cement industry declines by 2050, across all three scenarios—VD, LC1 and LC2.
0
200
400
600
800
1000
1200
1400
1600
1800
2020 2030 2040 2050
Mill
ion
Tonn
es
Years
VD
LC1
LC2

Low-carbon Development Pathways for a Sustainable India | 63
Low-carbon Development scenarios
0200400600800
1,0001,2001,4001,6001,800
VD LC1 L C2 VD LC1 L C2 VD LC1 L C2 VD LC1 L C2
2020 2030 2040 2050
Mill
ion
onne
sT
Years
Iron & Steel
Cement Industry
Figure 51 Iron and steel and cement industry break- up of CO2 emissions
Household consumption sector Emissions from the household consumption sector increase rapidly in the VD scenario as a result of many development interventions. However, in low-carbon scenarios, emissions are curbed because of the energy efficiency of electric appliances and the reduction in transport demand (see figures 52 and 53).
Lighting and appliances (such as refrigerators, air conditioners, water heaters, fans and so on) account for about 10 per cent of the total electricity consumption in India, which has been estimated to be 68 billion kWh in 2010-11 (Planning Commission 2011). With rising incomes and increasing penetration of appliances in households, the demand for electricity for lighting and appliances is expected to rise to 155 billion units by 2016-17. During the Eleventh Five-year Plan period, the Standards and Labelling Programme of the Bureau of Energy Efficiency (BEE) has enabled consumers to identify and purchase more energy-efficient appliances. Still, more energy-efficient appliances need to be promoted through policies of branding and mandatory standards. Labelling has been mandated of four appliances, namely, frost-free refrigerators, room air conditioners, tube lights and distribution transformers.
901
948958
932
870880890900910920930940950960970
0
100
200
300
400
500
600
2020 2030 2040 2050
Mill
ions
Mill
ion
Tonn
es
Year s
VD LC1 LC2 Rural Population
425497 557
599
-3070170270370470570670770870970
0200400600800
10001200140016001800
2020 2030 2040 2050
Mill
ions
Mill
ion
Ton
nes
Years
VD LC1 LC2 Urban Population
Figure 52 Emissions in rural areas Figure 53 Emissions in urban areas

64 | Low-carbon Development Pathways for a Sustainable India
Low-carbon Development scenarios
5.3.2 Costs to the economy of shifting to a low-carbon development pathway
It is important to assess the macroeconomic costs of mitigation actions. It is widely accepted that higher emissions mitigation generally leads to higher costs (IPCC 2007). According to the IPCC Fourth Assessment Report: Climate Change 2007, in 2050, the global average macroeconomic costs of mitigation toward stabilization between 710 ppm CO2-eq and 445 ppm CO2-eq are between a 1 per cent gain to a 5.5 per cent decrease of the global GDP. For specific countries and sectors, costs vary considerably from the global average (IPCC 2007).
Figure 54 GDP (at 2003-04 constant prices) in LC1 and LC2 compared to VD
It is important to understand that the macroeconomic costs, in terms of the reduction in the average annual growth rate of the GDP (the standard measure used by IPCC to measure macroeconomic costs), will be experienced most in the middle years from 2020 to 2040 for India. The economy will have to make investments in low-carbon options in the initial years, and gains from them will start accruing later. Less stringent carbon constraints require fewer investments. However, if the carbon constraints are more stringent, the economy will experience a higher reduction in the average annual growth rate of the GDP. Hence, the reduction in the growth rate of the GDP, i.e., in the compound annual growth rate, is 0.79 per cent and 1.26 per cent over 2010 to 2050 for LC1 and LC2, respectively, compared to that in the VD scenario. In LC2, the reduction in the growth rate of the GDP in the middle years needs to be compensated by foreign funding and technology assistance.
The macroeconomic cost can be assessed by an alternate method: the present discounted value of the GDP can be calculated over the period under consideration. At a discount rate of 4 per cent, the sum of the present discounted value of the GDP is less by USD (2005)9 10,872 billion in LC1 and by USD (2005) 13,172 billion in LC2, in comparison with the sum of the present discounted value of the GDP in VD.
It should be remembered that most models are not able to capture costs incurred due to global warming. As pointed out by many, only when these costs of the possible damage from climate change are added to the DAU and VD scenarios without carbon constraints, may the comparison be proper (Garnaut, R. 2011).
5.3.3 Decomposition analysis of the Low-carbon Development scenario
The IRADe activity analysis model includes renewable technology like wind, solar, hydro and wood gasification in the power sector. In the transportation sector, the
0
100,000
200,000
300,000
400,000
500,000
600,000
700,000
800,000
900,000
1,000,000
2020 2030 2040 2050
INR
Bill
ions
Years
DAU
VD
LC1
LC2
9Average USD/INR Exchange rate – 44.2735 for 2005-06 ( Source - http://www.rbi.org.in/scripts/PublicationsView aspx?id=12838 )

Low-carbon Development Pathways for a Sustainable India | 65
Low-carbon Development scenarios
model considers gas- and electricity-based transportation for achieving a low-carbon path. Apart from renewables and low-carbon technologies in the power and transport sectors, there are other interventions; one of the major drivers of a low-carbon pathway is autonomous energy efficiency improvement (AEEI). The adoption of a low-carbon lifestyle through increased vehicular efficiency, efficient electrical appliances and the efficient use of fossil fuels in private vehicles are considered under this. To analyse the impact of various options available in the model, by component, the study uses the formula illustrated below.
Where Xt denotes the relative change over time of variable Xt
From the above formula, it can be seen that CO2 reduction happens because of a reduction in the CO2 intensity of energy (due to the increasing use of renewables), reduction in the energy intensity of the GDP (due to AEEI and lifestyle changes in favour of a low-carbon path) and reduction in the GDP. The formula is used to compute the reduction in CO2 achieved in the LC1 and LC2 scenarios, compared to the VD scenario, and to calculate how much of this reduction is attributable to the reduction in the CO2 intensity of energy use, energy intensity of the GDP and the reduction in GDP. The results are shown in tables 28 and 29 and figures 55 and 56.
Table 28 Percentage reduction in CO2 emissions in LC1 compared with VD
LC1- VDYear CO2 GDP CO2/energy Energy/GDP
2010 -17 -2 -14 -1
2020 -48 -37 -17 6
2030 -56 -53 -18 14
2040 -66 -34 -16 -16
2050 -62 -21 -12 -29

66 | Low-carbon Development Pathways for a Sustainable India
Low-carbon Development scenarios
Figure 55 Decomposition of CO2 reduction in LC1 compared with VD
Figure 55 shows that the CO2 intensity of energy plays an important role in the initial years. GDP reduction contributes in the first 30 years, and the energy intensity of the GDP through AEEI becomes significant in the last 15 years. One should note that even in the VD scenario, there is an AEEI of 1.2 per cent per year; so what is seen in the figure above is an impact- increased AEEI (1.5 per cent). AEEI of 1.2 per cent gives a 40 per cent reduction in energy intensity of the GDP by 2050 compared with 2005. One can also say that since the growth rate and energy requirement reduce significantly in the earlier years, the share of existing power plants becomes larger and therefore, the CO2 intensity of energy does not decrease and, in fact, it increases in 2030.
Table 29 Percentage reduction in CO2 emissions in LC2 compared with VD LC2-VD
Year CO2 GDP CO2 /energy Energy/GDP
2010 -19 -3 -15 -1
2020 -52 -44 -16 8
2030 -64 -55 -16 7
2040 -73 -44 -15 -14
2050 -69 -30 -11 -28
-80
-70
-60
-50
-40
-30
-20
-10
0
10
-80
-70
-60
-50
-40
-30
-20
-10
0
10
2020 2025 2030 2035 2040 2045 2050
20
Contribution of different factors in CO2 emissions reduction in LC1scenario compared to VD scenario
GDP CO2/Energy Energy/GDP CO2

Low-carbon Development Pathways for a Sustainable India | 67
Low-carbon Development scenarios
Figure 56 Decomposition of CO2 reduction in LC2 compared with VD
-80
-70
-60
-50
-40
-30
-20
-10
0
10
-80
-70
-60
-50
-40
-30
-20
-10
0
10
20
30
2020 2025 2030 2035 2040 2045 2050
Contribution of different factors in CO emissions reduction in LC22
scenario compared to VD scenario
GDP CO2/Energy Energy/GDP CO2

68 | Low-carbon Development Pathways for a Sustainable India
Low-carbon Development scenarios

Low-carbon Development Pathways for a Sustainable India | 69
Summary and conclusions
The main objective of this study was to explore some separate but inter-related themes. How soon can India reach the thresholds of various well-being indicators for it to be considered visionary? How can India’s development path remain within the prescribed carbon budgets to stay well below the 2°C limit of average global warming? What are the technological options for achieving this? What would be the impact on the indicators of well-being?
These issues were examined with the help of a bottom-up–top-down macro-model, which covered the whole economy and provided alternative technologies. The model optimized the present discounted value of household consumption over 2005 to 2050.
Dynamics as Usual
India needs to progress to be able to address its human development needs. The Dynamics as Usual (DAU) scenario, which continues the policies of 2003-04, shows that with a compound annual growth rate of 6.96 per cent of the GDP and a rate of 7.69 per cent of private consumption over 2010 to 2050, per capita consumption per year will exceed INR 490,000 at 2003-04 prices.
With this high growth rate and the absence of any special measures to reduce emissions, India’s emissions in 2050 will reach about 15.5 Gt of CO2.Cumulative emissions in this scenario will be 385 Gt of CO2 over 2010 to 2050.
The share of different sectors in emissions will change dramatically over the period of time. The share of the energy sector (i.e., coal, gas, oil and petroleum products) remains more or less constant at 5-7 percent. The share of the power sector, however, declines dramatically from nearly 60 percent in 2007 to 30 percent by 2050. The share of the transport sector in emissions increases from 11 percent in 2007 to 40 percent by 2050. The share of industry comes down from around 25 percent in 2007 to 16 percent by 2050.
The progress in the well-being indicators of human development is steady and many of the target thresholds are reached by 2050.
Electricity generation remains dominated by coal. However, the share of coal for subcritical power plants goes down from 67 percent in 2010 to slightly more than 20 percent by 2050, when supercritical coal provides more than 50 percent of the electricity. Renewables such as wind, solar and hydro become important only in later years and provide 14 percent of the electricity generated in 2050.
Visionary Development
India’s human development index is currently low and below the average of medium human development countries. It has been improving and at a higher rate in recent years than in the past; the UNDP has identified India as one of the 18 “highlighted countries” whose gain over 1990 to 2012 is higher than its trend values.
For this scenario, well-being indicator thresholds were set based on the indicators of high human development countries. Accordingly, the development thresholds were set for water, sanitation, health, education, housing, poverty, clean cooking fuel and access to electricity (see Table 10).
The government’s target for the Bharat Nirman plan was to provide safe drinking water to all by 2012. The trend shows that this will be achieved by 2020 under DAU itself.
Chapter 6Summary and
conclusions

70 | Low-carbon Development Pathways for a Sustainable India
Summary and conclusions
A number of other measures are incorporated in the VD scenario:
a. Government expenditure on health and education is increased by 4 per cent of the GDP in 2015 and, thereafter, increases by 7 per cent of the GDP. This is to ensure better outcomes for health and education.
b. The government provides pucca (durable) houses to all by 2020 under the Indira Awaas Yojana and Rajiv Awaas Yojana.
c. The government ensures electricity consumption of 1kWh per household per day (without regular brown-outs) by providing the necessary subsidy to poorer households.
d. The government provides 90 kg of LPG or 6 cylinders (for cooking) to every household per year at subsidized rates.
e. Cash transfer of INR 3,000 per person per year is given to all individuals below the poverty line, from 2015 onwards.
Cross-country regression analysis has shown that life expectancy and infant mortality depend on per capita gross national income (GNI), access to clean water and sanitation, death rates, public health expenditure and female literacy rates. The model generates the GDP; access to water and sanitation are projected from government policies and, as a conservative measure, the current trend of death rate is assumed in the study. All the well-being indicators are generated in this manner. Table 30 shows the values of these indicators in the VD scenarios till 2050.
Table 30 Snapshot of the achievements in VD as in 2050 Well-being indicator VD in 2020 VD in 2030 VD in 2040 VD in 2050Life expectancy at birth (female) years 73 78 80 80.31
Life expectancy at birth (male) years 70 74 76 76
Infant mortality rate 25 7 2 2
Mean years of schooling 6.3 8.7 10.7 12.1
Population below poverty line (rural/urban )10
25 4 0 0
1 0 0 0
Access to clean water (percentage of population with access)
100 100 100 100
Access to sanitation (percentage of population with access)
70 90 100 100
Average electricity consumption per person per year in the three poorest rural classes (kWh)11
85 105 158 257
Average electricity consumption per person per year in the three poorest urban classes (kWh)
101 128 187 322
It is seen that the VD scenario reaches the threshold values of well-being indicators earlier for some indicators like headcount ratio of poverty, access to sanitation, infant mortality rate by 2040.It is important to note that the GDP values and the per capita consumption levels are virtually the same in VD as in DAU. So are CO2 emissions.
10Poverty line in the model is defined as the per capita monthly consumption expenditure of INR 227 in rural areas and INR 360 in urban areas at 2003-04 constant prices. 11The average electricity consumption per person per year in the three poorest rural and urban classes, which mainly benefit from subsidized electricity

Low-carbon Development Pathways for a Sustainable India | 71
Summary and conclusions
A major conclusion is that VD does not involve any significant cost compared to DAU. All it needs is effective implementation, through focused policies. Of course, the growth of the GDP plays an important role in realizing Visionary Development but it is, by itself, insufficient.
Low-carbon Development scenarios
The Low-carbon Development scenarios, LC1 and LC2, stipulate that India’s cumulative emission over 2010 to 2050 should be below 156 Gt (base year 1990) and 133Gt (base year 2010), respectively. Their limits were worked out by WBGU – based on 1990 and 2010 as starting dates – considering the global carbon budget and India’s share in it, on the basis of its population in 1990 or in 2010 (WBGU2009).
Ideally, the allocation of a carbon budget should be in terms of Gt -years and not Gt. Thus, a Gt emitted in 2010 should have a weight of 40 and a Gt emitted in 2050, a weight of 1. This would encourage everyone to postpone their emissions. It would also be fair to developing countries.
The following additional measures introduced in LC1 and LC2 help achieve the required reductions in CO2 emissions.
a. Greater emphasis will be put on energy efficiency so that the rate of AEEI increases from 1.2 per cent to 1.5 per cent, except in power generation where the scope for further reduction is considered small.
b. Improvement in electricity grids will reduce transmission and distribution losses by 12 percentage points by 2050.
c. The capital costs of renewables like solar and wind will continue to fall till 2025 at the rapid rate observed since 2005. After that, the improvement in TFPG will be 15 per cent, as in the VD scenario.
d. Freight movement will shift from road to rail, and the share of railways will increase from about 34 per cent in 2011-12 to 67 per cent by 2050.
e. The share of fuels used in transport will change over a period of time. The requirement for petroleum products inputs will fall by 2 per cent per year and will be replaced by CNG and electricity in the proportion of 60 and 40.
f. The rate of AEEI is assumed to increase to 1.5 per cent for the industrial, cement and steel sectors.
g. Households will use more efficient electrical appliances, and their marginal budget share for electricity will reduce gradually and reach a reduction of 36 per cent by 2050 compared with 2005.
h. Households will use more fuel- efficient cars, public transport and non-motorized transport. This is modelled by reducing their marginal budget share for petroleum products, which will reach a reduction of 50 per cent by 2050 compared to 2005.
i. Energy-efficient commercial buildings that comply with the Energy Conversation Building Code (ECBC) come into effect, with a slightly higher capital cost but have 30 per cent less energy requirements.
j. The green cover is assumed to grow as per the Green India Mission of NAPCC. This will increase sequestration of CO2 from 176 MT/year in 2005 to 261 MT/year in 2050.
These additional measures lead to lower per capita CO2 emissions in 2050, from 13.1 tonnes in the VD scenario to 5 tonnes and 4.1 tonnes in LC1 and LC2, respectively.

72 | Low-carbon Development Pathways for a Sustainable India
Summary and conclusions
In LC1 and LC2, the annual emissions in 2050 are 7.61 Gt and 6.25 Gt, which is a reduction of 62 per cent and 69 per cent, respectively, compared to 20 Gt of emissions in the VD scenario.
The emissions intensity in 2050 is 0.204 MT/billion USD GDP (PPP) in VD. It comes down to 0.107 MT/billion USD GDP (PPP) and 0.106 MT/billion USD GDP (PPP) in LC1 and LC2, respectively.As far as sectoral emissions are concerned, emissions from energy, power, transport and industry all reduce in LC1 and LC2 compared to VD. The relative share of transport in emissions increases in all scenarios in 2050 compared to 2005. Thus, the emission structure in 2050 resembles that as it is found today in developed countries, where transport dominates. Emissions from cement and steel come down in LC1 and LC2 compared to VD in 2050; cement emissions in LC are less than two-thirds of that in VD.
LC1 and LC2 scenarios show that the CAGR for the GDP between 2010 and 2050 will be reduced by 0.79 per cent in LC1 and 1.26 per cent in LC2, compared to the VD scenario. This confirms the IPCC finding that the macroeconomic costs of mitigation generally rise with the stringency of the stabilisation target (IPCC 2007).
The following conclusions can be drawn from these scenario results.
a. Visionary Development targets can be attained with a focused set of interventions sooner than otherwise with the same GDP growth rate achieved in DAU, yet without higher CO2 emissions in comparison with DAU.
b. It is possible to meet the carbon budget of 156 Gt, or even 133 Gt, with a reduction of 0.79 per cent and 1.26 per cent in the GDP growth rate from 2010 to 2050 in LC1 and LC2, respectively, compared to VD. In doing so, while India can stay within carbon budgets, it would need foreign inflow of funds and technology assistance to minimize macroeconomic costs.
c. If all countries follow the DAU approach and do not reduce their emissions, it is quite possible that the damages due to climate change may be more than the losses indicated above. So far, such an analysis has not been possible, as a systematic assessment of losses in all parts of the country, over the 2050 horizon, has not been undertaken.
d. The IRADE–LCSD model results show that the reductions in emissions required to stay within the carbon budget are accomplished by three things—lowering the GDP, which reduces the demand and need for energy; increasing energy efficiency, which reduces energy requirement and replacing the production of electricity from coal and gas with non-carbon emitting sources such as wind, solar, hydro electricity, etc., which lowers emissions intensity. Compared with the VD scenario, the total emissions in 2050 are lower by 62 per cent and 69 per cent in LC1 and LC2, respectively. In LC1, the contributions to the reductions are as follows: 21per cent from GDP loss, 12 per cent from energy efficiency and 29 per cent from lower emissions intensity. The corresponding contributions in LC2 are 30 per cent, 11per cent and 28 per cent, respectively.

Low-carbon Development Pathways for a Sustainable India | 73
Annexures
Annexure 1 IRADe–LCDS model equations
The following equations are introduced in the model as constraints. Constraint equation C
iht = C
iho + β
ih(E
ht - ∑C
iho) ....................... (1)
Where,Ciht = per capita consumption of the ith commodity by the hth household group in tth time period,cih0 = minimum per capita consumption of the ith commodity by the hth household,βih = share of ith commodity in total per capita consumption of the hth household andEht = Total per capita consumption expenditure of the hth household.
As incomes rise, per capita consumption increases, which results in people moving from lower expenditure classes to higher classes. Such changes would impact the demand structure of the economy. The model has an endogenous income distribution, separately for rural and urban areas, to incorporate the change in the number of people in different classes over the period of time (2005-2050). The linear expenditure system (LES) and endogenous income distribution together provide a dynamically changing commodity-wise non-linear demand structure of the economy. The original input–output table consisting of 115 sectors was aggregated to 25 commodities, being produced by 38 production activities. The model considers one commodity being produced by each production activity, except electricity. For example, to produce power, the model employs renewables (wind, solar thermal, solar photovoltaic, wood gasification) and nuclear-based technologies. Assumptions on nuclear are based on plants that are already present or are in the process of construction. No further policies on nuclear are assumed, apart from the traditional technologies of thermal, hydro and gas, similar to those assumed in the IEP (2006) model. Coal, crude, natural gas and electricity are energy inputs into the model. The model ensures equilibrium between demand and supply in the optimal path for each commodity.
Demand and supply equilibrium equation
Cit+G
it +I
it+IO
it+E
it ≤ Y
it +M
it ....................... (2)
Private consumption demand + government consumption demand+ investment demand + intermediate input demand+ export demand = domestic production + imports
Government consumption (Gi,t) is exogenous and specified to grow at a growth rate of 7 per cent. (The government’s tax collections and revenue are not modelled explicitly but accounted for implicitly.)
Intermediate demand (IOi,t) is determined endogenously by the input–output coefficients. Total private consumption (Ci,t) is obtained from the LES demand function and endogenous income distribution. Exports (Ei,t) and imports (Mi,t) are determined endogenously from trade-side equations of balance of payments and other constraints.Domestic availability of commodities is assumed to come from domestic output (Yi,t) and imports (Mi,t). Domestic production is constrained by capacity constraint, i.e., the maximum output that can be produced at the given capital stock.
Annexuresi

74 | Low-carbon Development Pathways for a Sustainable India
Annexures
Capacity constraint(X
j,t – X
j,t-1)≤(K
j,t – K
j,t-1) /ICOR
j ....................... (3)
(Incremental output is related to incremental capital.)
Where,Xj,t = domestic output of the jth sector at time t,Kj,t = capital of the jth sector at time t andICORj = incremental capital output ratio of the jth sector, which is exogenously specified in the model.Capital stock in sector j depends upon the rate of depreciation, and investment and is modelled using the following relation.
Capital stock equationK
j,t = DEL (J)*K
j,t-1+I
j,t ....................... (4)
Where DEL(J) is the rate of depreciation in sector j, which is exogenous, and Ij,t is the investment in sector j. Aggregate investment demand is assumed to depend on aggregate domestic investible resources (domestic savings determined by the marginal savings rate) and foreign investments available. Investment goods, which reflect the structure of capital goods in the sectors, are identified separately and are allocated to different sectors as fixed proportions (Pi,j) of the total investment (Ii,j) in each sector.
Investment equations∑ z
it ≤ z
o + S*(VA
t – VA
0 ) + (FT
t – FT
0 ) ....................... (5)
∑(Pi,t
* Ii,t
) ≤ Zi,t ....................... (6)
FTt = (a-b*t)*VA
t ....................... (7)
Where,Zi,t = investment demand of commodity i at time t,VAt = value added at time t,FTt = foreign investment at time t, S = exogenously specified maximum marginal savings ratio, Z0= investment in the base year (2004-05) andPi,j and a and b are pre-specified constants.
Trade is endogenous to the model. Foreign capital inflow (FT) is a changing proportion of value added. Though exports and imports are endogenous to the model, upper and lower limits are exogenously specified on the growth rate of exports and imports. The model has a balance of payment constraint for exports and imports so that they grow in a realistic manner.
Balance of payment equations∑ (M
i,t * MTT
i) = ∑ E
i,t + FT
t ....................... (8)
i
i i

Low-carbon Development Pathways for a Sustainable India | 75
Annexures
Mi,t
≥ (1 + MGRUi )* M
i,t-1 ....................... (9)
Mi,t
≤ (1 + MGRLi )* M
i,t-1 ....................... (10)
Ei,t
≤ (1 + EXGRUi )* E
i,t-1 ....................... (11)
Where, MTT
i= trade and transport margins for commodity i,
MGRUi and MGRL
i=upper and lower bounds for imports growth rates of commodity i
andEXGRU
i= upper bound for exports growth rate of commodity i.
Equations (7) to (11) form the complete specifications of the trade-side of the model. Equations (1) to (11) form a set of constraints, based on economic criteria, for the model solution to be meaningful.
Annexure 2 Total factor productivity growth in India
The total factor productivity growth (TFPG) reports output growth that is not accounted for by the growth in inputs. Though there is evidence in literature of converging trends, the magnitudes show substantial variations. In the current study, prominent research works have been considered and compared to arrive at the TFPG values. Bosworth, Collins and Virmani (2006) estimated a TFPG of 2 for India between the period of 1980 and 2004.The break-up of the values on factor productivity, as per the aforementioned study, is given in Table31.
Table 31 Total economy TFPG from 1960 to 1984 for India Period 1960-04 1960-80 1980-04
TFPG 1.2 0.2 2
Source: Bosworth, Collins and Virmani, 2006
The above-mentioned study shows a varying magnitude of total factor productivity growth. It should be noted that the sectoral break-up of TFPG values shows similar trends, where in the TFPG values for agriculture and manufacturing have shown a declining trend and that of services has shown an increasing incline. The methodologies followed by the aforementioned paper would contribute to the divergence in values. Bosworth, Collins and Virmani (2006) follow growth-accounting methodologies to empirically estimate India’s TFPG. These are based on the concept of aggregate production function, which is very similar to the methodology used by Fuglie (2010). The same figures are quoted in the study conducted by Goldar and Mitra (2008). An earlier paper by the duo states that the value of the estimate differs according to the methods used, such as the use of single versus double deflation in the measurement of real growth. The study by Rodrik and Subramanium (2005), enumerated in Table 32, shows similar results.
Table 32 Total economy TFPG from 1960 to 1999 for India
Period 1960–70 1970–80 1980–90 1990–99Rodrik and Subramanium
0.74 −0.50 2.49 1.57
Bosworth- Collins and Virmani
−0.94 −2.07 1.28 1

76 | Low-carbon Development Pathways for a Sustainable India
Annexures
Jorgenson and Vu (2005) show very similar results through the growth accounting methodology employed, as per Jorgenson et al (2007). The TFPG results as per this study are 2.06 for 1989-95 and 2.49 for 1995-03. A common observation of the extensive empirical evidence, which focuses on characterizing India’s growth performance at the level of broad sectors, is that the TFPG rates of the agriculture and industry sectors have been declining and the TFPG of the services sector has been increasing or has been stable during the 1990s12.
Fuglie (2010) estimates India’s overall TFPG at 1.4 for the period between 1961 and2001. The growth accounting method used in this study employed the following specifics. TFPG is the difference between the growth in aggregate output and the growth in aggregate input. The comparison of change in aggregate output with the change in aggregate input gives a superior measure of TFPG and the sector’s efficiency. The methodology used in this derives its basis from Chambers (1988) and Avila and Evenson (2004). Additionally, the Hodrick–Prescott filter is used to smoothen out short-term fluctuations. The methodology focuses on changes in aggregate inputs and outputs in contrast to studies employing other econometric methods. Additionally, the components (aggregates of input and output) used in this methodology correlate to the study conducted.
Table 33 Total economy TFPG combined analysis of various studies for India
Total economy TFPG
Period 1960-70 1970-80 1980-90 1990-99
Rodrik and Subramanium
0.74 −0.50 2.49 1.57
Bosworth-Collins
−0.94 −2.07 1.28 1
Period 1960-04 1960-80 1980-04 -
Bosworth, Collins and Virmani (2006)
1.2 0.2 2 -
Period - - 1989-95 1995-03
Jorgenson and Vu
- - 2.06 2.49
Period 1961-2001
Fuglie (2010) 1.4
12See Das et al., 2010

Low-carbon Development Pathways for a Sustainable India | 77
Annexures
Annexure 3 Autonomous energy efficiency improvements for India
The changes in energy/GDP ratio that are not related to the deviations in the relative price of energy are referred to as the trends in autonomous energy efficiency improvement (AEEI). It is an empirical representation of non-price driven changes in technology, which are increasingly energy-saving changes. The IRADe study shows the value of AEEI for India over the period between 1991 and 2011.
The data used in this study is obtained from two sources. Data for energy is from the website of the US Energy Information Agency; the variables– total energy consumption (measured in quadrillion btu) and gross domestic product (measured in INR crores at constant prices) –are obtained from the database of the Ministry of Statistics and Programme Implementation (MoSPI).
The process of calculating the AEEI is conducted over several stages. The annual data spans from 1991 to 2011. The ratio of energy/GDP is used in logs and is regressed over a period of time using the method of least squares. This is done in three parts: initially, from 1991 to 2011, then, from 1991 to 2000 and finally, from 2001 to 2011. The coefficient of time, when multiplied by 100, gives the AEEI value for India. The values for this are tabulated in Table 34.
Table 34 Autonomous energy efficiency index, 1991-2011
Time Coefficient AEEI (%)
1991-2000 -0.008 0.8
2001-2011 -0.020 2.0
1991-2011 -0.017 1.7
It should be noted that the value of the autonomous energy efficiency index has shown an increasing incline over the years, with the value growing from 0.8 per cent in 1991-2000 to 2 per cent in 2001-2011. The study shows that the AEEI ratio increases in 2011 contrary to the trend shown for the rest of the decade. This is due to a fall in the GDP. The AEEI number, resulting from this study, correlates to the values derived from several other studies as well. Thus, it can be concluded that the autonomous energy efficiency improvement for India is at 1.7 per cent from 1991 to 2011.
Annexure 4 Wind power potential for India
Some of the estimates for wind power potential in India are as follows: • MNRE estimate, at 80 metre height: 45 Gw
• Revised C-WET estimate, at 80 metre height: 102 Gw
• Phadke, Bharvikar and Khangura (Berkeley 2012) estimate, at 120 metre height and potential as shown in Table 35.

78 | Low-carbon Development Pathways for a Sustainable India
Annexures
Table 35 Wind power potential in India (in Gw)
Country/State Height (m) No farmland With 5% farmland
With all farmland
India80 748 760 984120 976 1,005 1,549
Andhra Pradesh
80 190 195 296120 247 254 385
Karnataka80 255 261 380120 332 340 500
Berkeley: 120m; 5% agricultural land;
Table 36 CSTEP estimate of wind potential in India (in Gw)
State Height (m) No farmlandWith 5% agricultural land
Andhra Pradesh
80 88.90 100.90
120 163.80 194.60
Karnataka80 49.30 69.40
120 81 119.40
Andhra Pradesh and Karnataka
120 244.80 314
CSTEP: 120m, with 5% agricultural land
Table 37 Ratio – Berkeley estimate to CSTEP estimate
State Height No farmlandWith 5% agricultural land
Andhra Pradesh80 2.14 1.94
120 1.50 1.30
Karnataka80 5.20 3.80
120 4.00 2.80
Analysis• The Berkeley study estimates that in India the availability of 5 per cent of
agricultural land would lead to a wind power-generation capacity of 1,005 Gw at a height of 120 m. The estimate for Karnataka and Andhra Pradesh is 594 Gw.
• The Center for Study of Science, Technology and Policy (CSTEP) estimates a potential of 314 Gw at a height of 120 m for Karnataka and Andhra Pradesh.
• If the same factor of 314 Gw/594 Gw is applied to Berkeley’s all-India estimate, the following figure is obtained.
1,005 Gw x 314 Gw/594 Gw = 531Gw• The capacity utilization factor (CUF) is estimated at 22 per cent for most of
the capacity, but for 12 per cent of it, it is 29 per cent and for 3 per cent of the capacity, the CUF is 36 per cent.
• This gives an average of 0.85 x 22 + .12 x 29 + .03 x 36 = 23.26
• This gives an energy potential of
8,760 x 0.2226 x 531/1,000 = 1,082 bkWh (upper limit on wind).So, the potential of wind power is taken to be 1,000 bkWh.

Low-carbon Development Pathways for a Sustainable India | 79
Annexures
Annexure 5 Detailed analysis of well-being indicators
A detailed analysis of each well-being indicator is given below.• Health indicators
Life expectancy at birth (female) and life expectancy at birth (male)Life expectancy at birth indicates the number of years a newborn infant would live if prevailing patterns of mortality at the time of its birth were to stay the same throughout its life. It is a comprehensive health indicator for a country. A higher level of life expectancy indicates that the death rate, infant mortality rate, under-five mortality rate as well as the level of malnutrition and the number of underweight children in the country are low, and vice versa. India has made considerable improvement in life expectancy, which has more than doubled, in the last 60 years. It increased from around 30 years at the time of independence to over 63.5 years in 2002-06. Although the decadal increase has slowed from 5.7 years in the 1970s to 3.2 years in the 1990s, overall life expectancy has increased by 14.1 years in rural areas and 9.9 years in urban areas during the period from 1970-75 to 2002-06 (Ministry of Health and Family Welfare 2010).
Table 38 Life expectancy
India and major states 2002-06
Male Female
Madhya Pradesh 58.1 57.9
Assam 58.6 59.3
Odisha 59.5 59.6
Uttar Pradesh 60.3 59.5
Rajasthan 61.5 62.3
Bihar 62.2 60.4
India 62.6 64.2
Andhra Pradesh 62.9 65.5
Gujarat 62.9 65.2
Karnataka 63.6 67.1
West Bengal 64.1 65.8
Tamil Nadu 65 67.4
Haryana 65.9 66.3
Maharashtra 66 68.4
Himachal Pradesh 66.5 67.3
Punjab 68.4 70.4
Kerala 71.4 76.3
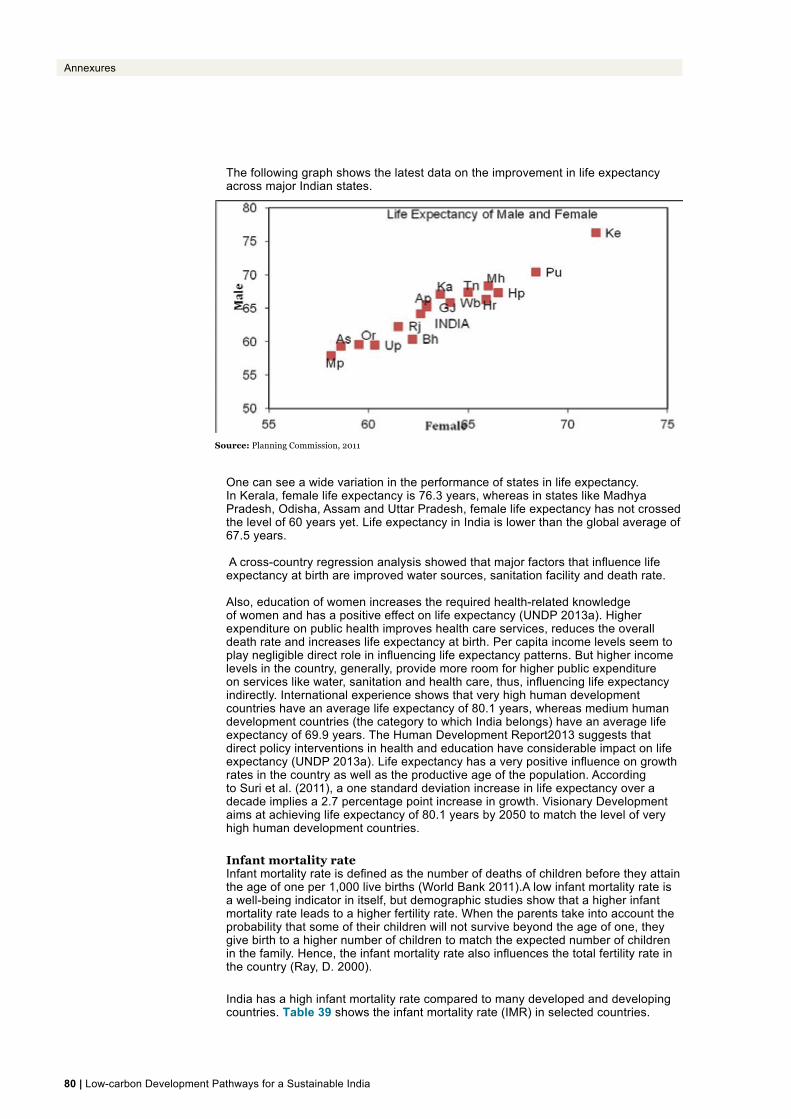
80 | Low-carbon Development Pathways for a Sustainable India
Annexures
The following graph shows the latest data on the improvement in life expectancy across major Indian states.
Source: Planning Commission, 2011
One can see a wide variation in the performance of states in life expectancy. In Kerala, female life expectancy is 76.3 years, whereas in states like Madhya Pradesh, Odisha, Assam and Uttar Pradesh, female life expectancy has not crossed the level of 60 years yet. Life expectancy in India is lower than the global average of 67.5 years.
A cross-country regression analysis showed that major factors that influence life expectancy at birth are improved water sources, sanitation facility and death rate.
Also, education of women increases the required health-related knowledge of women and has a positive effect on life expectancy (UNDP 2013a). Higher expenditure on public health improves health care services, reduces the overall death rate and increases life expectancy at birth. Per capita income levels seem to play negligible direct role in influencing life expectancy patterns. But higher income levels in the country, generally, provide more room for higher public expenditure on services like water, sanitation and health care, thus, influencing life expectancy indirectly. International experience shows that very high human development countries have an average life expectancy of 80.1 years, whereas medium human development countries (the category to which India belongs) have an average life expectancy of 69.9 years. The Human Development Report2013 suggests that direct policy interventions in health and education have considerable impact on life expectancy (UNDP 2013a). Life expectancy has a very positive influence on growth rates in the country as well as the productive age of the population. According to Suri et al. (2011), a one standard deviation increase in life expectancy over a decade implies a 2.7 percentage point increase in growth. Visionary Development aims at achieving life expectancy of 80.1 years by 2050 to match the level of very high human development countries.
Infant mortality rate Infant mortality rate is defined as the number of deaths of children before they attain the age of one per 1,000 live births (World Bank 2011).A low infant mortality rate is a well-being indicator in itself, but demographic studies show that a higher infant mortality rate leads to a higher fertility rate. When the parents take into account the probability that some of their children will not survive beyond the age of one, they give birth to a higher number of children to match the expected number of children in the family. Hence, the infant mortality rate also influences the total fertility rate in the country (Ray, D. 2000).
India has a high infant mortality rate compared to many developed and developing countries. Table 39 shows the infant mortality rate (IMR) in selected countries.

Low-carbon Development Pathways for a Sustainable India | 81
Annexures
Table 39 Infant mortality rates across countries
Country Infant mortality rate (2009)
India 53
China 19
Japan 3
United States 7
Bangladesh 47
Pakistan 73
Sri Lanka 17Source: Ministry of Health and Family Welfare, 2010
As far as infant mortality rate is concerned, the comparison shows that India lags behind developed countries like United States and Japan as well as south Asian countries like Sri Lanka and Bangladesh.
There are wide differences in rural and urban IMR. In 2009, urban IMR was 36 compared to rural IMR of 58.
State-level IMR shows that Kerala is best performer with an IMR of 13, whereas Madhya Pradesh, Uttar Pradesh and Odisha are the worst performers with IMRs of 62.
Table 40 Infant mortality rate based on a three-year period (2008-10)
Cross-country regression analysis has shown that water, sanitation and public health expenditure are major factors that influence IMR. But the most important factor to influence it is the role of women. Female literacy can reduce infant mortality to a great extent.
The Twelfth Five-year Plan aims at reducing IMR to 28. Upfront policy interventions in controlling diseases like cholera and diarrhoea, improving sanitation and
Ke
Tn
Wb
Mh
Pu Kr
Jh
Bh
Ap
INDIA
Gu
Hr
Ch
As
Rj
Od
Up
Mp
10
15
20
25
30
35
40
45
50
10 30 50 70
Urb
an
Rural
India and major states
Rural Urban
Kerala 14 10
Tamil Nadu 25 22
West Bengal 32 25
Maharashtra 34 20
Punjab 37 28
Karnataka 43 28
Jharkhand 44 30
Bihar 49 38
Andhra Pradesh 51 33
Gujarat 51 30
India 51 31
Haryana 51 38
Chhattisgarh 52 44
Assam 60 36
Rajasthan 61 31
Odisha 63 43
Uttar Pradesh 64 44
Madhya Pradesh 67 42

82 | Low-carbon Development Pathways for a Sustainable India
Annexures
empowering women will result into reducing IMR over the years. The Visionary Development scenario has kept the target of reducing IMR to 5 by 2050.
• Education Mean years of schooling Mean years of schooling is calculated as the average number of years of education received by people aged 25 years and more, converted from education attainment levels using official durations of each level. Data on the mean years of schooling is a very important indicator from the development point of view. It takes into account the number of children in a given age group who enter school and complete schooling (considering the enrolment rate and dropout rate in that education level) and the number of children who complete primary education, secondary education and tertiary education. Hence, it is a comprehensive indicator of the level of education in the country. A higher figure for the mean years of schooling reflects that more children complete secondary education and tertiary education. Higher education has been found to influence better health outcomes, income levels and overall lifestyle changes. Hence, higher education is important for the development process as well as for influencing the consumption levels in the country. According to the Human Development Report 2013, the mean years of schooling in India is merely 4.4 years, suggesting that only primary education is universal and very few children complete secondary and tertiary education. Very high human development countries have mean years of schooling of 11.6, suggesting that secondary education is universal and many individuals complete tertiary education. A comprehensive picture of education in India is clear from the Planning Commission data on mean years of schooling across states. When comparing the Indian data on mean years of schooling with international data, it should be noted that mean years of schooling in India is calculated as education received by people aged 15 years and above. Small states like Delhi, Goa, Nagaland and Kerala seem to have done much better on the education front, whereas Rajasthan, Madhya Pradesh, Bihar and Jharkhand lag behind in education attainment levels. Table 41 Education-specific mean years of schooling of the labour force in 2007-08
India and major states
Percentage of mean years of schooling of labour force(MYS)
Rajasthan 4.03
Bihar 4.16
Andhra Pradesh 4.32
Chhattisgarh 4.46
Jharkhand 4.53
Madhya Pradesh 4.7
Odisha 4.72
Uttar Pradesh 4.89
India 5.48
India and major states
Percentage of mean years of schooling of labour force(MYS)
Karnataka 5.49
West Bengal 5.61
Gujarat 5.84
Haryana 6.22
Tamil Nadu 6.24
Punjab 6.55
Assam 6.64
Maharashtra 6.82
Himachal Pradesh 6.89
Kerala 8.4

Low-carbon Development Pathways for a Sustainable India | 83
Annexures
Figure 57 Mean years of schooling across states in 2010 As per the Millennium Development Goals-India Country Report 2009, India has achieved the target of universal primary education set by the Millennium Development Goals. But enrolment rates in secondary and tertiary education need to be improved and special efforts need to be made to reduce dropout rates in secondary and tertiary education. Human Development Report 2013 demonstrates that in many countries, the job market lags behind the education levels, creating distortions. Hence, while keeping a target of achieving 11.6 years of mean years of schooling for 2050, policymakers need to take into account the requirement for creating employment opportunities at the same pace.
• Access to services Improved water source According to the World Development Indicators of the World Bank, access to an improved water source refers to the percentage of the population with reasonable access to an adequate amount of water from an improved source, such as a household connection, public standpipe, borehole, protected well or spring and rainwater collection. Unimproved sources include vendors, tanker trucks and unprotected wells and springs. Reasonable access is defined as the availability of at least 20 litres of water per person per day from a source within one kilometre of the dwelling. Universal access to clean water is a goal in itself but it also affects health conditions, as suggested by the earlier analysis on life expectancy and infant mortality rate. Figure 58 indicates that only 30 per cent of the households in rural areas and 70 per cent of the households in urban areas have access to tap water. Figure 58 Percentage of rural households, by main source of drinking water
0123456789
Mea
n ye
ars
of s
choo
ling
30. 8
1. 5
43. 6
8. 3
0. 7
15. 1Tap water
CoveredWell
Hand Pump
Tubewell/Borehole
Spring
Othersources

84 | Low-carbon Development Pathways for a Sustainable India
Annexures
Access to water is mainly a function of public expenditure and the Visionary Development scenario aims to provide universal access to clean drinking water by 2030. Clearly, more investments are needed in rural areas than in urban areas. The target of the government of India is to ensure that 50 per cent of the rural population has access to piped drinking water supply by 2017. A higher goal is set for the Visionary Development scenario. Figure 59 Percentage of rural households, by type of latrine facility Figure 60 Percentage of urban households, by type of latrine facility
• Access to clean cooking fuel According to Planning Commission data, a large number of the population in rural areas still uses wood, biomass and fodder as cooking fuel, which is polluting and hazardous to health.
30. 7
1. 967. 3
Latrine Facility With in the Premises Public Latrine Open
81.4
6
12. 6
Latrine Facility Within the Premises Public Latrine Open

Low-carbon Development Pathways for a Sustainable India | 85
Annexures
49%
9%
8%
1%
3%
29%
0%0% 1%
0%Firewood
Cropresidue
Cow dungcake
Coal, Lignite,Charcoal
Kerosene
LPG/ PNG
Electicity
Biogas
Figure 61 Percentage of households, by cooking fuel Source: Census 2011, and data compiled by IRADe Only 11.9 per cent the population in rural areas uses LPG/PNG, electricity or biogas, which are considered clean cooking fuels (see Figure 61). The majority of the rural population (62 per cent) depends on firewood as a source of cooking fuel. A study conducted by Parikh, J. (2009) in the Indian state of Himachal Pradesh showed that biofuels put a strain on women. Biofuels met 70 per cent of the fuel needs, and women had to walk typically 30km each month; each trip to collect fuelwood took an average of 2.7 hours. This was a physically strenuous process and almost two-thirds of the women suffered from neckaches at least quarterly and half of them suffered from backaches almost daily. Nearly 30 per cent of the women felt that the time taken in collecting wood was a problem. About 70 per cent of the adult women were household cooks and, hence, were exposed to smoke and pollution.
• Access to electricity Better health and education, essentially, require good infrastructure. Thus, electricity access to all is an important input in achieving development goals. Currently, urban areas have near universal access to electricity, but in rural areas nearly 45 per cent of the population still lacks electricity access. Figure 62 Percentage share of total households, by light source Source: Census 2011, and data compiled by IRADe
67%
32%
0%
0% 0%
1%
Electricity
Kerosene
Solar
Other oil
Any other
No lighting

86 | Low-carbon Development Pathways for a Sustainable India
Annexures
• Better housing The world today faces a housing crisis, with nearly a third of the world population living in inadequate houses. A large proportion of this shortage is concentrated in the developing world. According to the Census of India 2011, there are 246 million houses in India. The average household size is about 4.9. Nearly 131 million of the 246 million houses are durable (pucca), 102 million houses are semi-durable (semi-pucca) and 13 million houses are non-durable (kutcha). The percentage share of non-durable housing has reduced from 18 percent to 5.3 percent during 2001 to 2011. The share of durable homes has increased from about 51 percent in 2001 to 53 percent in 2011. In absolute terms, while the total number of houses increased by 54 million units during 2001-11, durable and semi-durable houses increased by 76 million units. (Parikh, J. and Tiwari, P. 2012) Figure 63 Structural types of houses Source: Tiwari, P. and Parikh, J., 2012
• Poverty Headcount ratio of poverty The preceding well-being indicators talk about the various aspects of multidimensional poverty and target to eliminate vulnerability to poverty and deprivation of the masses from the perspective of basic rights. But it is equally important to eliminate income poverty so that people are able to earn for themselves a minimum standard of living and nobody is “trapped in poverty”. In India, the expert group appointed by the Planning Commission of India decides the criteria to be included in defining the poverty line. According to the Tendulkar Committee, appointed by the Planning Commission in 2009, poverty is defined on the basis of the consumption expenditure given by National Sample Survey of India. The committee decided that people whose monthly per capita consumption expenditure is below INR 672.8 (USD 12.19) in rural areas and below INR 859.6 (USD 15.57) in urban areas in 2009-10 would be regarded as living below the poverty line. According to this committee’s estimates, there were 354.68 million poor individuals in 2009-10. The average poverty headcount ratio for India was 29.8 per cent, while it was 33.8 per cent in rural areas and 20.9 per cent in urban areas in that period.
62100
13146
57
102
43
35
13
0
50
100
150
200
250
300
1991 2001 2011
Kutchha Semi-Pucca Pucca
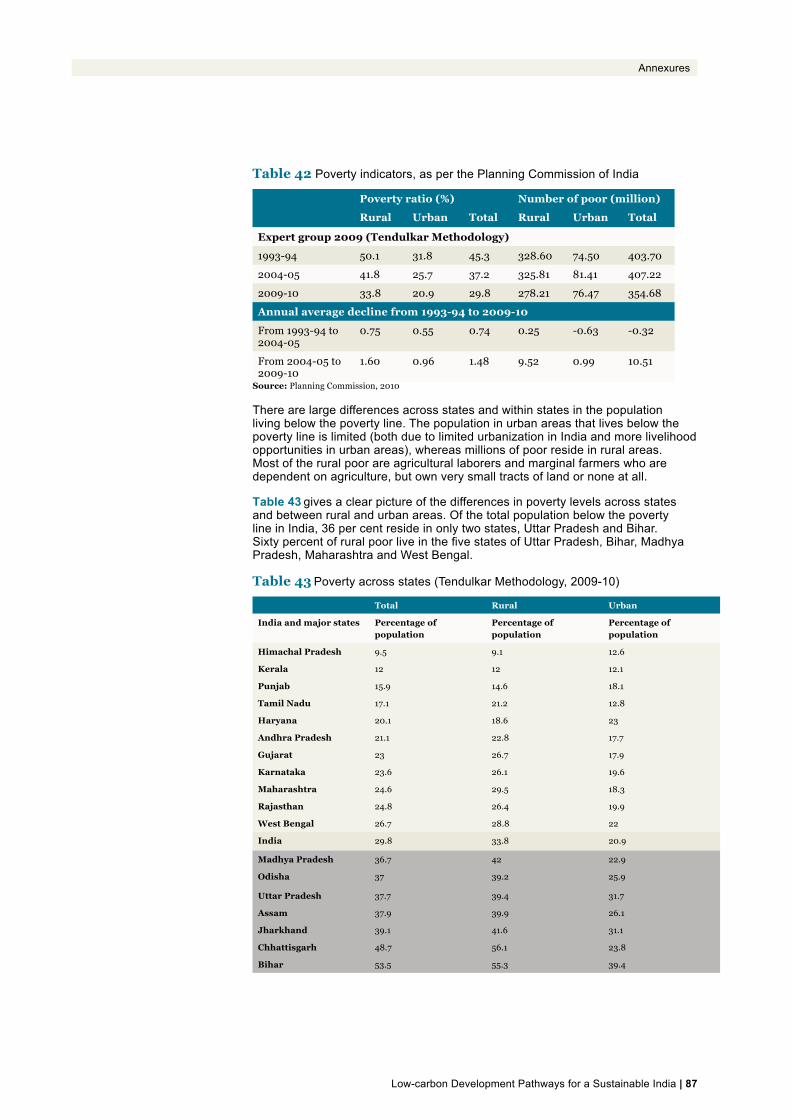
Low-carbon Development Pathways for a Sustainable India | 87
Annexures
Table 42 Poverty indicators, as per the Planning Commission of India Poverty ratio (%) Number of poor (million)
Rural Urban Total Rural Urban Total
Expert group 2009 (Tendulkar Methodology)
1993-94 50.1 31.8 45.3 328.60 74.50 403.70
2004-05 41.8 25.7 37.2 325.81 81.41 407.22
2009-10 33.8 20.9 29.8 278.21 76.47 354.68
Annual average decline from 1993-94 to 2009-10
From 1993-94 to 2004-05
0.75 0.55 0.74 0.25 -0.63 -0.32
From 2004-05 to 2009-10
1.60 0.96 1.48 9.52 0.99 10.51
Source: Planning Commission, 2010 There are large differences across states and within states in the population living below the poverty line. The population in urban areas that lives below the poverty line is limited (both due to limited urbanization in India and more livelihood opportunities in urban areas), whereas millions of poor reside in rural areas. Most of the rural poor are agricultural laborers and marginal farmers who are dependent on agriculture, but own very small tracts of land or none at all. Table 43 gives a clear picture of the differences in poverty levels across states and between rural and urban areas. Of the total population below the poverty line in India, 36 per cent reside in only two states, Uttar Pradesh and Bihar. Sixty percent of rural poor live in the five states of Uttar Pradesh, Bihar, Madhya Pradesh, Maharashtra and West Bengal.
Table 43 Poverty across states (Tendulkar Methodology, 2009-10)
Total Rural Urban
India and major states Percentage of population
Percentage of population
Percentage of population
Himachal Pradesh 9.5 9.1 12.6
Kerala 12 12 12.1
Punjab 15.9 14.6 18.1
Tamil Nadu 17.1 21.2 12.8
Haryana 20.1 18.6 23
Andhra Pradesh 21.1 22.8 17.7
Gujarat 23 26.7 17.9
Karnataka 23.6 26.1 19.6
Maharashtra 24.6 29.5 18.3
Rajasthan 24.8 26.4 19.9
West Bengal 26.7 28.8 22
India 29.8 33.8 20.9
Madhya Pradesh 36.7 42 22.9
Odisha 37 39.2 25.9
Uttar Pradesh 37.7 39.4 31.7
Assam 37.9 39.9 26.1
Jharkhand 39.1 41.6 31.1
Chhattisgarh 48.7 56.1 23.8
Bihar 53.5 55.3 39.4

88 | Low-carbon Development Pathways for a Sustainable India
Annexures
Figure 64 State- specific poverty lines, numbers and percentages of population living below the poverty line in different states (2009-10) Source: Planning Commission, 2010
Annexure 6 Projecting mean years of schooling Table 44 depicts the gross enrolment ratio in India.
Table 44 Gross enrolment ratio
Enrolment in primary and middle classes as percentage of
population in appropriate age groups by sex in India
(1951, 1961, 1971and 1981 to 2001-2002)
Year
Primary classes Middle classes
I-V (6-11 years) VI-VIII (11-14 years)
Female Male Total Female Male Total
1951 24.8 60.6 42.6 4.6 20.6 12.7
1961 41.4 82.6 62.4 11.3 33.2 22.5
1971 60.5 95.5 78.6 19.9 46.3 33.4
1981 64.1 95.8 80.5 28.6 54.3 41.9
1982 66.2 98.9 83 29.7 56 43.3
1983 69.6 103 86.8 31.8 58.3 45.5
1984 72.6 106.9 90.2 33.2 60.6 47.3
76 110.3 93.6 34 61.3 48.1
1986 79.2 111.1 95.6 35.3 61.8 49
1987 79.8 110 95.3 34.7 61 48.2
1988 83.2 114 99 36.6 63.1 50.2
1989 80.3 109.2 95.1 35.8 61.4 48.9
1990 81.3 109.7 96 42.1 72 57.4
1991 85.5 113.9 100.1 47 76.6 60.1
1992 86.9 112.8 100.2 49.6 75.1 61.8
1993 73.5 95 84.6 48.9 72.5 61.4
1994 73.1 89.6 81.7 49.2 67.1 58.6
1995 78.2 96.6 87.7 50 68.9 60
1996 79.4 97.1 88.6 49.8 67.8 59.3
1997 (P) 80.1 97 88.8 49.2 65.8 58
1998 (P) 82.2 99.3 91.1 49.7 66.3 58.5
Kr
Pu
Tn
Hr
Ap GuKr Mh
RjWb
INDI AMp
Od
Up
As
Jh
Ch
Bh
10
15
20
25
30
35
40
10 20 30 40 50 60
Urb
an
Rural

Low-carbon Development Pathways for a Sustainable India | 89
Annexures
Enrolment in primary and middle classes as percentage of
population in appropriate age groups by sex in India
(1951, 1961, 1971and 1981 to 2001-2002)
Year
Primary classes Middle classes
I-V (6-11 years) VI-VIII (11-14 years)
Female Male Total Female Male Total
1999 (P) 82.9 100.9 92.1 49.1 65.3 57.6
2000 (P) 85.18 104.08 94.9 49.66 67.15 58.79
2001 (P) 85.9 104.9 95.7 49.9 66.7 58.6
2001-02 (P)
86.91 105.29 96.3 52.09 67.77 60.2
2010-11 116 85.5
Data up to 2010-11 are from the website of the Ministry of Human Resource Development. Data after that are projected, based on the rates of progress. It is worth noting that gender differences are narrowing rapidly at these levels.The gross enrolment ratio and dropout rates are plotted in figures 65 and 66.
Figure 65 GER for class I and class VI
Figure 66 Dropout rates till classes V, VIII and X
0
20
40
60
80
100
120
Series1
Series2
0
10
20
30
40
50
60
70
80
90
Series1
Series2
Series3

90 | Low-carbon Development Pathways for a Sustainable India
Annexures
Based on these, the years of schooling can be estimated. For example, if 100 pupils enroll in class I and the dropout rate is 20, then assuming that the dropout rate is uniform across classes from class I onward and across states, the pupils’ years of schooling would be as follows.(100 -20/2) x5 = 450Similar calculations are made for other levels. This gives us the number of school years per person, as shown in Table 45.
Table 45 Years of schooling for a child entering different classes in the year
Class I Class VI Class XI
2010 5.1 8.8 10.3
2015 5.0 9.0 10.7
2020 4.6 9.1 10.9
2025 4.8 9.3 11.4
2030 4.9 9.4 11.7
2035 5.0 9.6 12.2
2040 5.0 9.8 12.8
2045 5.0 9.9 13.1
2050 5.0 9.9 13.5
Here, it has been assumed that after class X, the enrolment rate for tertiary education will increase from 17 per cent in 2010-11 to 20 per cent by 2020, as targeted by the government. It is projected to reach 50 per cent by 2050, increasing by five percentage points every five years. Those completing class X will get five years of higher secondary and college education. The assumption in this study is conservative and it has not accounted for the many who will opt for further education, vocational training, etc.
To compute the mean years of schooling, population projections are needed by age group. These projections are based on population statistics for 2010 obtained from the UN, and survival rates obtained from the vital statistics on the Census Commissioner’s website.
The total school years of the population above 25 years are calculated by multiplying the population by the means years of schooling. The results are summarized in Table 46.
Table 46 Mean years of schooling in the DAU scenario
Year Total years of schooling Population above 25 years Mean years of schooling
2015 2978.4 559.4 5.3
2020 3558.2 565.5 6.3
2025 4087.9 568.6 7.2
2030 4527.2 567.2 8.0
2035 4917.6 562.5 8.7
2040 5953.9 615.6 9.7
2045 6923.0 662.1 10.5
2050 7842.3 703.1 11.2

Low-carbon Development Pathways for a Sustainable India | 91
Annexures
The same procedure is used to estimate literacy rate of the population above 20 years of age.
The literacy rate for 2010 was 0.75. One may note that the study considers only literacy in primary schools and no account of adult literacy efforts has been taken.
Dropout rates will go down in the Visionary Development scenario due to the emphasis on education and health. The study has projected lower dropout rates for the VD scenario and has worked out the mean years of schooling on that basis. These are shown in Table 47.
Table 47 Mean years of schooling in the VD Scenario
Year Total years of schooling Population above 25 years Mean years of schooling
2015 2978.4 559.4 5.3
2020 3547.9 565.5 6.3
2025 4297.3 568.6 7.6
2030 4925.7 567.2 8.7
2035 5428.6 562.5 9.7
2040 6602.8 615.6 10.7
2045 7613.2 662.1 11.5
2050 8476.7 703.1 12.1

92 | Low-carbon Development Pathways for a Sustainable India
Annexures
Annexure 7 Tables
Consumption of different commodities across different expenditure classes in rural areas
RH1 RH2 RH3 RH4 RH5 RH6 RH7 RH8 RH9 RH10
1 Food Grains 773 1037 1265 1433 1538 1634 1751 1852 1963 2167
2 Sugarcane 21 38 62 89 106 129 158 182 206 236
3 Oil Seeds 28 46 66 84 93 108 123 128 130 133
4 Other Crops 111 257 545 988 1363 1830 2575 3357 4319 6357
5 Animal Husb 87 203 620 1434 2039 2764 3980 5350 7122 11377
6 Forestry 166 217 253 272 287 278 261 259 276 447
7 Fishing 31 59 149 295 384 470 600 736 898 1267
8 Coal&Lignite 0 0 0 0 0 0 0 0 0 0
9 Crudepetroleum 0 0 0 0 0 0 0 0 0 0
10 Mining&Quarrying 0 0 0 0 0 0 0 0 0 0
11 Agro Processing 741 1211 1853 2460 2837 3199 3514 3574 3352 3079
12 Textiles 188 364 663 1042 1347 1702 2250 2830 3580 5377
13 Petroleum Products 12 34 94 198 293 441 708 1021 1374 2097
14 Fertilizer 0 0 0 0 0 0 0 0 0 0
15 Cement Industry 0 0 0 0 0 0 0 0 0 0
16 Non Metallic 4 7 11 16 20 26 38 50 67 105
17 Steel 0 0 0 0 0 0 0 0 0 0
18 Manufacturing 31 110 326 782 1264 2263 4531 7799 13089 28660
19 Construction 0 0 0 0 0 0 0 0 0 0
20 Electricity 3 8 42 114 186 297 511 779 1039 1554
21 Water Supply & Gas 1 3 7 13 20 31 58 99 204 612
22 RailwayTransport 2 7 18 37 55 85 138 195 275 428
23 Other Transport 228 524 1128 1909 2466 3281 4323 4948 5104 2165
24 Other Services 550 1305 2938 5267 7117 10352 15616 20846 27112 36169
25 Natural Gas 0 0 0 0 0 0 0 0 0 0

Low-carbon Development Pathways for a Sustainable India | 93
Annexures
UH1 UH2 UH3 UH4 UH5 UH6 UH7 uH8 UH9 UH10
1 Food Grains 588 859 1118 1250 1319 1372 1426 1473 1517 1610
2 Sugarcane 20 41 74 90 100 109 116 120 121 120
3 Oil Seeds 9 34 107 113 123 127 122 106 82 58
4 Other Crops 430 913 1694 2436 2902 3404 3991 4573 5142 6730
5 Animal Husb 194 584 1424 2753 3861 5308 7358 9579 12015 18340
6 Forestry 184 105 76 46 38 32 23 17 8 12
7 Fishing 63 136 237 354 438 533 649 761 869 1116
8 Coal&Lignite 18 29 28 21 18 15 13 11 9 7
9 Crudepetroleum 0 0 0 0 0 0 0 0 0 0
10 Mining&Quarrying 0 0 0 0 0 0 0 0 0 0
11 Agro Processing 818 1590 2453 2899 3063 3099 2885 2481 1837 1490
12 Textiles 160 331 566 824 901 1190 1639 1932 2546 4115
13 Petroleum Products 13 93 391 948 1432 2121 3154 4324 5690 9468
14 Fertilizer 0 0 0 0 0 0 0 0 0 0
15 Cement Industry 0 0 0 0 0 0 0 0 0 0
16 Non Metallic 0 2 9 20 32 49 74 105 139 258
17 Steel 0 0 0 0 0 0 0 0 0 0
18 Manufacturing 38 168 914 2133 3142 4545 6617 8971 11640 19938
19 Construction 0 0 0 0 0 0 0 0 0 0
20 Electricity 19 72 226 482 704 1015 1443 1912 2439 3862
21 Water Supply & Gas 3 11 61 137 203 299 411 536 663 1159
22 RailwayTransport 2 13 78 265 458 773 1320 2029 2934 6108
23 Other Transport 65 262 1332 3804 5525 7857 11231 14952 19096 31224
24 Other Services 712 2606 8290 19067 28504 41916 62259 85425 112360 188348
25 Natural Gas 0 0 0 0 0 0 0 0 0 0
Consumption of different commodities across different expenditure classes in urban areas

94 | Low-carbon Development Pathways for a Sustainable India
Annexures
GDP (INR Billion)
Year DAU VD LC1 LC2
2005 32003 31388 31408 31408
2010 60265 58623 57483 56794
2015 126371 124574 88450 81607
2020 202623 200569 120551 107548
2025 295132 292787 154453 125182
2030 406790 404150 185433 168966
2035 522871 522915 252454 212531
2040 664649 663011 375875 297491
2045 821568 816522 484763 394533
2050 887428 883464 643182 532695
CAGR 2010-50 6.96 7.02 6.22 5.76
Per capita consumption (INR/person)
Year DAU VD LC1 LC2
2005 17341 17000 17386 17386
2010 25479 24979 25545 25545
2015 37437 36702 37534 37534
2020 55008 53927 55150 55150
2025 80824 79237 81033 81033
2030 118757 116425 118327 83857
2035 174494 171067 123891 100019
2040 256388 251353 111719 85049
2045 376718 369320 164151 124965
2050 492929 493707 241192 183614
CAGR 2010-50 7.69 7.75 5.77 5.05
Poverty (million)
Rural
Year DAU VD LC1 LC2
2005 242 247 241 241
2010 158 163 158 158
2015 92 56 53 53
2020 47 25 24 24
2025 21 10 10 10
2030 8 4 3 9
2035 3 1 3 6
2040 1 0 4 9
2045 0 0 1 3
2050 0 0 0 1

Low-carbon Development Pathways for a Sustainable India | 95
Annexures
Urban
Year DAU VD LC1 LC2
2005 94 98 94 94
2010 51 53 51 51
2015 22 4 3 3
2020 7 1 1 1
2025 2 0 0 0
2030 0 0 0 0
2035 0 0 0 0
2040 0 0 0 0
2045 0 0 0 0
2050 0 0 0 0
population (millions)
Year Total Rural Urban
2005 1096 781 314
2010 1177 826 351
2015 1254 866 388
2020 1326 901 425
2025 1390 929 462
2030 1444 948 497
2035 1486 958 529
2040 1515 958 557
2045 1530 950 581
2050 1531 932 599
CAGR 2005-50 0.75 0.39 1.45
CO2 emissions (million tonnes)
Year DAU VD LC1 LC2
2005 1449 1440 1258 1258
2010 1877 1866 1543 1511
2015 3081 3037 1783 1689
2020 4443 4383 2269 2111
2025 6134 6057 2854 2572
2030 8177 8082 3539 2915
2035 10712 10570 4025 3387
2040 13857 13712 4621 3651
2045 17601 17480 5847 4727
2050 20072 20000 7616 6251
CAGR 2005-50 6.01 6.02 4.08 3.63

96 | Low-carbon Development Pathways for a Sustainable India
Annexures
Per capita CO2 emissions (tonnes/person)
Year DAU VD LC1 LC2
2005 1.3 1.3 1.1 1.1
2010 1.6 1.6 1.3 1.3
2015 2.5 2.4 1.4 1.3
2020 3.4 3.3 1.7 1.6
2025 4.4 4.4 2.1 1.8
2030 5.7 5.6 2.5 2
2035 7.2 7.1 2.7 2.3
2040 9.1 9 3 2.4
2045 11.5 11.4 3.8 3.1
2050 13.1 13.1 5 4.1
CAGR 2005-50 5.27 5.27 3.42 2.97
CO2 intensity of GDP (MT/_billion_USD GDP(PPP))
Year DAU VD LC1 LC2
2005 0.407 0.413 0.36 0.36
2010 0.28 0.286 0.241 0.239
2015 0.219 0.219 0.181 0.186
2020 0.197 0.197 0.169 0.177
2025 0.187 0.186 0.166 0.185
2030 0.181 0.18 0.172 0.155
2035 0.184 0.182 0.143 0.143
2040 0.188 0.186 0.111 0.11
2045 0.193 0.193 0.108 0.108
2050 0.203 0.204 0.107 0.106
Energy intensity of GDP (kgoe/ USD GDP(PPP)lakh)
Year DAU VD LC1 LC2
2005 0.104 0.102 0.102 0.102
2010 0.07 0.071 0.07 0.07
2015 0.054 0.054 0.055 0.056
2020 0.048 0.048 0.052 0.054
2025 0.045 0.045 0.051 0.057
2030 0.043 0.043 0.053 0.048
2035 0.044 0.043 0.045 0.044
2040 0.044 0.044 0.034 0.034
2045 0.045 0.045 0.033 0.033
2050 0.05 0.05 0.032 0.031

Low-carbon Development Pathways for a Sustainable India | 97
Annexures
Electricity generation from different technologies in DAU
Electricity generation from different technologies in VD
Year Subcritical
coal
Super
critical coal
Hydro Natur
al gas
Nuclear Wood Wind Diesel Solar
PV
Solar
thermal
Solar PV
storage
Solar
thermal
storage
Wind
with
storage
2005 544 0 92 84 22 0 0 16 0 0 0 0 0
2010 665 0 116 117 27 24 18 16 5 0 0 0 0
2015 1374 0 114 111 26 23 18 15 5 0 0 0 0
2020 1617 619 113 106 26 22 18 14 5 0 0 0 0
2025 2161 1145 112 100 26 21 18 14 5 0 0 0 0
2030 2737 1895 110 95 25 20 17 13 5 0 0 0 0
2035 3380 2976 108 91 25 19 17 12 5 0 0 0 0
2040 3335 5301 106 86 25 18 17 12 5 0 0 0 0
2045 3287 7995 104 312 25 17 17 11 5 0 0 0 0
2050 3122 7595 600 778 24 16 1000 10 352 0 0 0
Year Sub critical
coal
Super
critical
coal
Hydro Natural
gas
Nuclear Wood Wind Diesel Solar
PV
Solar
thermal
Solar
PV
storage
Solar
thermal
storage
Wind
with
storage
2005 533 0 86 84 22 0 0 15 0 0 0 0 0
2010 665 0 116 117 27 24 18 16 5 0 0 0 0
2015 1347 0 114 111 26 23 18 15 5 0 0 0 0
2020 1588 608 113 106 26 22 18 14 5 0 0 0 0
2025 2126 1127 111 100 26 21 18 14 5 0 0 0 0
2030 2698 1869 110 95 25 20 17 13 5 0 0 0 0
2035 3310 2887 108 91 25 19 17 12 5 0 0 0 0
2040 3284 5247 106 86 25 18 17 12 5 0 0 0 0
2045 3236 7873 104 388 25 17 17 11 5 0 0 0 0
2050 3075 7479 600 928 24 16 1000 10 496 0 0 464 0

98 | Low-carbon Development Pathways for a Sustainable India
Annexures
Electricity generation from different technologies in LC1
Electricity generation from different technologies in LC2
Sectoral emissions (in million tonnes)
Sectors (2050) DAU VD LC1 LC2
Energy 845.7 845.5 3.3E+02 270.7
Power 4,775.5 4,723.2 8.7E+02 790.8
Transport 4,518.9 4,524.1 1.1E+03 797.5
Industry 1,556.3 1,550.8 6.0E+02 488.9
Year Sub critical
coal
Super
critical
coal
Hydro Natural
gas
Nuclear Wood Wind Diesel Solar
PV
Solar
thermal
Solar PV
storage
Solar
thermal
storage
Wind with
storage
2005 533 0 86 84 22 0 0 15 0 0 0 0 0
2010 665 0 116 117 27 24 18 16 5 0 0 0 0
2015 1347 0 114 111 26 23 18 15 5 0 0 0 0
2020 1588 608 113 106 26 22 18 14 5 0 0 0 0
2025 2126 1127 111 100 26 21 18 14 5 0 0 0 0
2030 2698 1869 110 95 25 20 17 13 5 0 0 0 0
2035 3310 2887 108 91 25 19 17 12 5 0 0 0 0
2040 3284 5247 106 86 25 18 17 12 5 0 0 0 0
2045 3236 7873 104 388 25 17 17 11 5 0 0 0 0
2050 3075 7479 600 928 24 16 1000 10 496 0 0 464 0
Year Subcritical
coal
Super
critical
coal
Hydro Natural
gas
Nuclear Wood Wind Diesel Solar PV Solar
Thermal
Solar
PV
Storage
Solar
Thermal
storage
wind
with
Storage
2005 529 0 92 84 22 0 0 15 0 0 0 0 0
2010 665 0 116 117 27 24 18 16 5 0 0 0 0
2015 632 0 133 111 66 23 239 15 5 0 0 0 0
2020 600 230 265 106 66 22 365 14 5 0 0 0 0
2025 570 302 537 100 66 21 632 14 5 0 0 0 0
2030 542 375 600 95 66 20 690 13 5 0 552 0 0
2035 514 449 600 91 66 19 686 12 5 0 959 0 0
2040 489 524 600 338 66 18 677 12 260 0 949 0 0
2045 464 600 600 947 66 17 1000 11 547 0 938 0 0
2050 441 677 591 2684 66 16 988 10 541 0 927 0 0

Low-carbon Development Pathways for a Sustainable India | 99
Annexures
Contribution of different factors in CO2 emissions reduction in LC1 scenario compared to VD scenario
LC1-VD
Year CO2 GDP CO2/Energy Energy/GDP
2005 -13 0 -13 0
2010 -17 -2 -14 -1
2015 -41 -26 -17 1
2020 -48 -37 -17 6
2025 -53 -44 -17 9
2030 -56 -53 -18 14
2035 -62 -47 -18 3
2040 -66 -34 -16 -16
2045 -67 -32 -16 -19
2050 -62 -21 -12 -29
Contribution of different factors in CO2 emissions reduction in LC2 scenario compared to VD scenario
LC2-VD
Year CO2 GDP CO2/Energy Energy/GDP
2005 -13 0 -13 0
2010 -19 -3 -15 -1
2015 -44 -31 -16 3
2020 -52 -44 -16 8
2025 -58 -57 -16 16
2030 -64 -55 -16 7
2035 -68 -53 -16 1
2040 -73 -44 -15 -14
2045 -73 -41 -15 -17
2050 -69 -30 -11 -28
Well being indicators –
Health indicators
Life expectancy at birth (female)
DAU VD LC1 LC2
2005 62 62 62 62
2010 63 63 63 63
2015 65 71 71 71
2020 66 73 73 73
2025 67 76 76 76
2030 68 78 78 78
2035 69 80 81 81
2040 70 80 80 81
2045 71 80 80 80
2050 72 80 80 80

100 | Low-carbon Development Pathways for a Sustainable India
Annexures
Life expectancy at birth (male)
DAU VD LC1 LC2
2005 60 60 60 60
2010 61 61 61 61
2015 63 68 68 68
2020 64 70 70 70
2025 64 72 72 72
2030 65 74 74 74
2035 66 76 76 76
2040 67 76 76 76
2045 68 76 76 76
2050 69 76 76 76
Infant mortality rate
DAU VD LC1 LC2
2005 65 65 65 65
2010 52 52 52 52
2015 45 36 36 36
2020 36 25 25 25
2025 29 16 16 16
2030 21 7 7 7
2035 14 2 2 2
2040 7 2 2 2
2045 2 2 2 2
2050 2 2 2 2
Poverty
Population below poverty line in rural area (millions)
DAU VD LC1 LC2
2005 242 247 241 241
2010 158 163 158 158
2015 92 56 53 53
2020 47 25 24 24
2025 21 10 10 10
2030 8 4 3 9
2035 3 1 3 6
2040 1 0 4 9
2045 0 0 1 3
2050 0 0 0 1

Low-carbon Development Pathways for a Sustainable India | 101
Annexures
Population below poverty line in urban area (millions)
DAU VD LC1 LC2
2005 94 98 94 94
2010 51 53 51 51
2015 22 4 3 3
2020 7 1 1 1
2025 2 0 0 0
2030 0 0 0 0
2035 0 0 0 0
2040 0 0 0 0
2045 0 0 0 0
2050 0 0 0 0
Access to services
Access to clean water (%)
DAU VD LC1 LC2
2005 86 86 86 86
2010 92 92 92 92
2015 97 100 100 100
2020 100 100 100 100
2025 100 100 100 100
2030 100 100 100 100
2035 100 100 100 100
2040 100 100 100 100
2045 100 100 100 100
2050 100 100 100 100
Access to sanitation (%)
DAU VD LC1 LC2
2005 30 30 30 30
2010 34 34 34 34
2015 38 60 60 60
2020 42 70 70 70
2025 46 80 80 80
2030 51 90 90 90
2035 55 100 100 100
2040 59 100 100 100
2045 63 100 100 100
2050 68 100 100 100

102 | Low-carbon Development Pathways for a Sustainable India
Annexures
Average electricity consumption in the three poorest rural household classes (kWh)
DAU VD LC1 LC2
2005 8 71 71 71
2010 10 72 72 72
2015 11 80 79 79
2020 13 85 83 83
2025 17 93 89 89
2030 28 105 97 88
2035 45 125 96 91
2040 79 158 92 86
2045 128 207 103 93
2050 174 257 122 106
Average electricity consumption in the three poorest urban household classes (kWh)
DAU VD LC1 LC2
2005 50 83 83 83
2010 52 85 85 85
2015 54 54 92 92
2020 58 101 96 96
2025 66 110 102 102
2030 78 128 114 101
2035 103 152 113 313
2040 139 187 106 97
2045 201 252 119 107
2050 266 322 138 122

Low-carbon Development Pathways for a Sustainable India | 103
List of References
• Avila, A.F.D.and Evenson, R.E. 2004. Total Factor Productivity Growth in Agriculture: The Role of Technology Capital. Mimeo, Yale Economic Growth Center, New Haven, Connecticut, USA.
• Banerjee, A. and Duflo, E.2011. Poor Economics: A Radical Rethinking of the Way to Fight Global Poverty. Public Affairs, New York, USA.
• BEE. 2009. Energy Conservation Building Code User Guide. Bureau of Energy Efficiency, New Delhi, India. < http://www.beeindia.in/schemes/documents/ecbc/eco3/ecbc/ECBC-User-Guide(Public).pdf >, last accessed in October, 2012.
• Bhardwaj, A., Sudhakar, M., Swamy, D., Mohmad,S.A., Sastry, A., Jain, R. and B.M. Mazumdar. 2013. Wind Power in Karnataka and Andhra Pradesh: Potential Assessment, Costs and Grid Implications. Center for Study of Science, Technology and Policy, Bangalore, India.
• Bhushan, C. 2010. Challenge of the New Balance. Centre for Science and Environment, New Delhi, India.
• Bosworth, B., Collins, S. and A. Virmani. 2007. Sources of growth in Indian Economy. NBER Working Paper No. 12901
• Brooke, A., Kendrick, D. and A. Meerhaus. 1998.GAMS – A User’s Guide. The Scientific Press, Redwood City, California, USA.
• C-CAP.2009. Analysis of GHG Emissions for Major Sectors in India: Opportunities and Strategies for Mitigation. IRADe and ICF international, New Delhi, India, and Center for Clean Air Policy, Washington DC, USA.
• Census of India 2011. Office of the Register General and Census Commissioner, Ministry of Home Affairs, Government of India, New Delhi, India.
• Chambers, R. 1988. Applied Production Analysis: A Dual Approach. Cambridge University Press, Cambridge, UK.
• Chidiak, M. and Tirpak, D. 2008. Mitigation Technology Challenges: Considerations for National Policy Makers to Address Climate Change. Environment and Energy Group, UNDP.
• CSO.2011. Millennium Development Goals: India Country Report 2011.Central Statistical Organisation, Ministry of Statistics and Programme Implementation, Government of India, New Delhi, India. < http://mospi.nic.in/mospi_new/upload/mdg_2011_24apr12.pdf >, last accessed in November, 2012.
• Das, D.K., Erumban,A.A, Aggarwal, S. and D.Wadhwa. 2010. Total Factor Productivity Growth in India in the Reform Period: A Disaggregated Sectoral Analysis. Paper presented at the “First World KLEMS Conference”, Harvard University, USA.
• Duflo, E. 2013, “Grandmothers and Granddaughters: Old-Age Pensions and Intrahousehold Allocation in South Africa,” World Bank Economic Review, Vol. 17, no. 1, June 2003: pp 1-25
• Edmonds, E. V. and Schady, N., 2008. “Poverty alleviation and child labor,” Policy Research Working Paper Series 4702, The World Bank.
• Fuglie 2010 The Shifting Patterns of Agricultural Production and Productivity Worldwide. The Midwest Agribusiness Trade Research and Information Centre, I Iowa State University, Ames, Iowa.
• Garnaut, R. 2011. Australia in the global response to the climate change. Garnaut Climate Change Review. Cambridge University Press.
• Goldar, B. and Mitra, A. 2008. Productivity Increase and Changing Sectoral Composition: Contribution to Economic Growth in India. V.K.R.V. Rao Centenary
List of References

104 | Low-carbon Development Pathways for a Sustainable India
List of References
Conference on “National Income and Other Macro-Economic Aggregates in a Growing Economy”, on 28-30April 2008.
• Howes, S., and Wyrwoll, P. 2012. Climate Change Mitigation and Green Growth in Developing Asia. ADBI Working Paper No. 369, < http://www.adbi.org/files/2012.07.10.wp369.climate.change.mitigation.green.growth.asia.pdf >, last accessed in February, 2013. Huang, Y. 2012.Climate Change and Development Policy: Competing Aims?United Nations University [website],< http://unu.edu/publications/articles/climate-change-and-development-policy.html >, last accessed in November, 2012.
• IEA. 2012. CO2 Emissions from Fuel Combustion - Highlights.International Energy Agency, Paris, France.< http://www.iea.org/co2highlights/co2highlights.pdf >, last accessed in January, 2013.
• IIASA. 2012. Global Energy assessment: Towards A Sustainable Future. International Institute For Applied Energy Systems, Laxenburg, Austria.< http://www.iiasa.ac.at/web/home/research/Flagship-Projects/Global-Energy-Assessment/Global_Energy_Assessment_FullReport.pdf >, last accessed in May, 2013.
• INECC. 2011. Development through a low carbon pathway 8 case studies, Indian Network on Ethics and Climate Change (INECC), < http://www.laya.org.in/PublicFiles/Development_Through_A_Low_Carbon_Pathway.pdf?download>, last accessed in March, 2013.
• IPCC. 2007. IPCC Fourth Assessment Report: Climate Change 2007, Intergovernmental Panel for Climate Change.<http://www.ipcc.ch/publications_and_data/ar4/syr/en/mains5-6.html#footnote33>, last accessed in May, 2013.
• Jorgenson, D.W. and Vu, K.2005. Information Technology and the World Economy. Department of Economics, Harvard University, Cambridge, USA. <http://scholar.harvard.edu/jorgenson/files/03_sjoe430.pdf> last accessed in April, 2013.
• Meinshausen, M., Smith, S.J., Calvin, K.,Daniel, J.S.,Kainuma, M.L.T., Lamarque, J-F., Matsumoto, K.,Montzka, S.A., Raper,S.C.B., Riahi,K.,Thomson, A.,Velders, G.J.M. and D.P.P. van Vuuren. 2011.The RCP greenhouse gas concentrations and their extensions from 1765 to 2300, SpringerLink [website],<http://link.springer.com/content/pdf/10.1007%2Fs10584-011-0156-z.pdf>, last accessed in September, 2012.
• Manne, A.S., and Richels, R.G. 1992. Buying Greenhouse Insurance: The Economic Costs of Carbon Dioxide Emission Limits. MIIT Press, Cambridge, UK.
• McKibben, W.J. and Wilcoxen, P. 1995. The Theoretical and Empirical Structure of G-Cubed. Working Paper Australian National University, University of Texas at Austin, and the Brookings Institution, Australia.
• Ministry of Coal. 2009. Annual report 2009-10. Ministry of Coal, Government of India, New Delhi, India < http://www.coal.nic.in/annrep0910.pdf > September 2012.
• Ministry of Drinking Water and Sanitation, 2013. Total Sanitation Campaign. Nirmal Gram Puraskar [website], Ministry of Drinking Water and Sanitation, Government of India, New Delhi, India. < http://nirmalgrampuraskar.nic.in/NgpRelated.aspx > last accessed in April, 2013.
• Ministry of Finance. 2012. Economic Survey 2011-12. Ministry of Finance, Government of India, New Delhi, India. < http://indiabudget.nic.in/es2011-12/estat1.pdf >, last accessed in February, 2013.
• Ministry of Housing and Urban Poverty Alleviation.2013. Rajiv Awaas Yojana [website], Ministry of Housing and Urban Poverty Alleviation, Government of India, New Delhi, India. < http://mhupa.gov.in/ray/Ray_index.htm >, last accessed in December, 2012.

Low-carbon Development Pathways for a Sustainable India | 105
List of References
• MoRD. 2013. Indira Awaas Yojana [website], Ministry of Rural Development, Government of India, New Delhi, India. last accessed in < http://iay.nic.in/netiay/home.aspx >, December, 2012.
• MoEF. 2009. India’sGHGEmissionsProfile:ResultsofFiveClimateModellingStudies, Climate Modelling Forum, supported by Ministry of Environment and Forests, Government of India, New Delhi, India. < http://www.moef.nic.in/downloads/home/GHG-report.pdf >, last accessed in October, 2012.
• MoP&NG.2009. Basic Statistics on Indian Petroleum and Natural Gas, 2008-09. Ministry of Petroleum and Natural Gas, Government of India, New Delhi, India.
• MoSPI.2010. Key Indicators of Household Consumer Expenditure in India 2009-10. National Statistical Organisation, National Sample Survey Office, Ministry of Statistics and Programme Implementation, Government of India, New Delhi, India.
• MoSPI. 2013 a. Green National Accounts in India- a Framework. A Report by an Expert Group Convened by the National Statistical Organization, Ministry of Statistics and Programme Implementation, Government of India, New Delhi, India.
• MoSPI.2013 b. Key Indicators of Employment and Unemployment in India,2011-12. Press release by National Sample Survey Office, Ministry of Statistics and Programme Implementation, Government of India, New Delhi, India.
• NFHS. 2006. Key Findings National Family Health Survey round 3. International Institute for Population Sciences, Mumbai, India and Macro International, Maryland, USA.< http://www.rchiips.org/nfhs/factsheet.shtml# >, last accessed in December 2012.
• Parikh, J. and Ghosh, P. 2009. Energy Technology Alternatives for India till 2030. International Journal of Energy Sector Management, 3(3), pp 233–250.
• Parikh, K., Binswanger, H., Ghosh, P. and A. D’souza. 2009. Double Digit Inclusive Growth: Not Without Robust Agricultural Growth. Syngenta Foundation for Sustainable Agriculture, IRADe, New Delhi, India.
• Parikh, K., Parikh, J., Ghosh, P. and G. Khedkar. 2013. Poverty and Low Carbon Development Strategies India. MAPS Research Paper. IRADe, New Delhi, India.
• Phadke A., Bharvikar, R. and K. Jagmeet. 2012. Reassessing Wind Potential Estimate for India: Economic and Policy Implications. Lawrence Berkeley Laboratory Research Report, Berkeley, USA.< http://ies.lbl.gov/node/473 >, last accessed in November 2012.
• Planning Commission.2006. Integrated Energy Policy: Report of the Expert Committee. Planning Commission, Government of India, New Delhi, India. < http://planningcommission.gov.in/reports/genrep/rep_intengy.pdf >, last accessed in September, 2012.
• Planning Commission. 2010. Data for use of Deputy Chairman, Planning Commission. Planning Commission, Government of India, New Delhi, India. < http://planningcommission.nic.in/data/datatable/0205/databook_comp0205.pdf > last accessed in October, 2012.
• Planning Commission. 2011. Interim Report of the Expert Group on Low Carbon Strategies for Inclusive Growth. Planning Commission, Government of India, New Delhi, India. < http://planningcommission.nic.in/reports/genrep/Inter_Exp.pdf >, September, 2012.
• Planning Commission.2012. Twelfth Five Year Plan (2012–2017) Faster, More Inclusive and Sustainable Growth, Volume I. Planning Commission, Government of India, New Delhi, India. < http://planningcommission.gov.in/plans/planrel/12thplan/pdf/vol_1.pdf >, last accessed in February, 2013.
• Prasad, U. and Basu, S. 2013. A New Approach to India’s Water Sanitation Crisis: Part 1. Stanford Social Innovation Review, Stanford Center on Philanthropy and

106 | Low-carbon Development Pathways for a Sustainable India
List of References
Civil Society, Stanford, USA. < StanfordUniversity.http://www.ssireview.org/blog/entry/a_new_approach_to_indias_water_sanitation_crisis_part_1 >, last accessed in April 2013.
• Pratham.2012. Annual Report 2011-12, Pratham Education Foundation [website] < http://www.pratham.org/file/PEF-Annual-Report_2011-12.PDF >, last accessed in April, 2013.
• RITES (2009), Total Transport System System Study on Traffic Flows & Modal Costs (Highways, Railways, Airways & Coastal Shipping). RITES Ltd, Planning Commission,New Delhi, India. < http://www.planningcommission.gov.in/reports/genrep/index.php?repts=rites.html >, last accessed in January, 2013.
• Rodrik, D. and Subramanian, A. 2005. From “Hindu Growth” to Productivity Surge: The Mystery of the Indian Growth Transition. IMF Staff Papers, Vol. 52, No. 2 pp 193-228. Palgrave Macmillan Journals.
• Rue du Can, 2009. Residential and transport energy use in India: Past trend and future outlook, S. Rue du Can, V. Letschert, M. McNeil, N. Zhou, J. Sathaye, Lawrence Berkeley National Laboratory report, January 2009.
• Saluja, M.R. and Yadav, B. 2006. Social Accounting Matrix for India 2003-04. India Development Foundation, New Delhi, India.< http://planningcommission.nic.in/reports/sereport/ser/sr_sam.pdf >, last accessed in April , 2013.
• TERI. 2010. National and International Policy Responses to the Carbon Budget Approach: An Indian perspective,The Energy and Resources Institute [website], < http://www.teriin.org/events/CoP16/National_International_Policy.pdf > last accessed in November, 2012.
• Times of India. 2012. Pose with a toilet to get hitched in MP district. Times of India [website], published on 21 May 2012 < http://articles.timesofindia.indiatimes.com/2013-05-21/india/39418127_1_mp-district-grooms-toilets >, last accessed in May, 2013.
• TISS.2010. Discussion Paper, Supplementary Notes and Summary Report.Conference on “Global Carbon Budgets and Equity in Climate Change 28-29 June 2010”, Tata Institute of Social Sciences [website], < http://www.moef.nic.in/downloads/public-information/tiss-conference-cc-2010.pdf >, last accessed in November, 2012.
• Tiwari, P. and Parikh, J. 2012. Global housing challenge: a case study of CO2 emissions in India. SPANDREL
• UNDP.2011. Human Development Report, Sustainability and Equity: A Better Future For All, United Nations Development Programme [website], < http://hdr.undp.org/en/media/HDR_2011_EN_Complete.pdf >, last accessed in September, 2012.
• UNDP.2013 a. Human Development Report 2013, The Rise of the South: Human Progress in a Diverse World, United Nations Development Programme [website], < http://www.undp.org/content/dam/undp/library/corporate/HDR/2013GlobalHDR/English/HDR2013%20Report%20English.pdf >, last accessed in September, 2012.
• UNDP. 2013 b. India, country profile: Human Development Indicators, United Nations Development Programme [website], < http://hdrstats.undp.org/en/countries/profiles/IND.html >, last accessed in September, 2012.
• WBGU. 2009. Solving the climate dilemma: The budget approach. German Advisory Council On Global Change, Berlin, Germany.< http://www.wbgu.de/fileadmin/templates/dateien/veroeffentlichungen/sondergutachten/sn2009/wbgu_sn2009_en.pdf >, S last accessed in October, 2012.
• World Bank.2011. Energy Intensive Sectors of the Indian Economy: Path to Low Carbon Development. Energy, Environment, Water Resources and Climate

Low-carbon Development Pathways for a Sustainable India | 107
List of References
Change Units, Sustainable Development Department, South Asia Region, The World Bank.< http://esmap.org/sites/esmap.org/files/India_LowCarbon_FullReport.pdf >, last accessed in April, 2013.
• World Bank. 2013. The World Bank open data, indicators. The World Bank [website],< http://data.worldbank.org/ > last accessed in September, 2013. October, 2012.
• WWF International. 2009. Sharing the Effort Under a Global Carbon Budget.WWF International [website],< http://www.ecofys.com/files/files/wwf_ecofyscarbonbudget.pdf >, last accessed in November, 2012.
• Yanez-Pagans, M., 2008. “Culture and Human Capital Investments: Evidence of an Unconditional Cash Transfer Program in Bolivia,” IZA Discussion Paper No. 3678
• Yongfu Huang, Y. 2012. “Climate change and development policy” competing aims? (2012, November, 27). United Nations University [website],< http://unu.edu/publications/articles/climate-change-and-development-policy.html >, last accessed in December, 2012.


Technical Partner

THIS
RE
PO
RT IS
PR
INTE
D O
N 100%
RE
CY
CLA
BLE
PAP
ER