technical note -- nasa tn 0
TRANSCRIPT

-- N A S A TECHNICAL NOTE N A S A TN D-561 5-
0.1
RADIO BLACKOUT ALLEVIATION A N D PLASMA DIAGNOSTIC RESULTS FROM A 25 000 FOOT PER SECOND BLUNT-BODY REENTRY
* - , ' I ..by Normun D. Akey und Anbrey E. Cross , :; . . '. ,: .. ...
,; , c-( ' . %
? <,.; 41..#.: , r ,LungZey Reseurch Center , '
1 {i.,.& ... "', .
LungZey Stution, Humpton, Vu. , ,':&! :
NATIONAL AERONAUTICS AND SPACE A D M I N I S T R A T I O N WASHINGTON, D. C. FEBRUARY 1970

TECH LIBRARY KAFB,NM
Illllll1111111111llllllllllIll1lllltillIll 1. Report No. 2. Government Accession No. 3. Recipient's Catalog No.
NASA TN D-5615 I 4. T i t l e and Subtitle 5. Report Date
RADIO BLACKOUT ALLEVIATION AND PLASMA DIAGNOSTIC RESULTS February 1970 FROM A 25 WO FOOT PER SECOND BLUNT-BODY REENTRY 6. Performing Organization Code
7. Author(s1
-1
I I
I
I 8. Performing Organization Report No.
Norman 0. Akey and Aubrey E. Cross L-6866
10. Work Uni t No. 730-01-00-01-23
9. Performing Organization Name and Address 1 1 . Contract or Gront No.
NASA Langley Research Center I
17. Key Words Suggested by A u t h o r W 1 18. Distribution Statement
Reentry communications Unclassif ied - Unl imi tedPlasma diagnostics
Blackout al leviat ion Mater ia l in ject ion Electrostatic (Langmuir) probes
19. Security Classif. (of this report) 20. Security Classif . (of this page) 21. No. of Pages 22. Price'
Unclassif ied Unclassif ied 93 $3.00


CONTENTS
SUMMARY . . . . . . . . . . . . . . . . . . . . . . . . . . . . . . . . . . . . . . . . 1
INTRODUCTION . . . . . . . . . . . . . . . . . . . . . . . . . . . . . . . . . . . . . . 1
DESCRIPTION OF PAYLOAD . . . . . . . . . . . . . . . . . . . . . . . . . . . . . . 3 General Characteristics . . . . . . . . . . . . . . . . . . . . . . . . . . . . . . . . 3 Water Injection System . . . . . . . . . . . . . . . . . . . . . . . . . . . . . . . . 4 X-Band Telemetry System . . . . . . . . . . . . . . . . . . . . . . . . . . . . . . 5 Electrostatic Probe Experiment . . . . . . . . . . . . . . . . . . . . . . . . . . . 5 Thermocouple Probe . . . . . . . . . . . . . . . . . . . . . . . . . . . . . . . . . . 6
RESULTS AND DISCUSSION . . . . . . . . . . . . . . . . . . . . . . . . . . . . . . . 7 Trajectory and Tracking . . . . . . . . . . . . . . . . . . . . . . . . . . . . . . . 7 Signal Blackout . . . . . . . . . . . . . . . . . . . . . . . . . . . . . . . . . . . . 7 X-Band Telemetry . . . . . . . . . . . . . . . . . . . . . . . . . . . . . . . . . . . . 8 Water Injection. . . . . . . . . . . . . . . . . . . . . . . . . . . . . . . . . . . . . . 8 Electrostatic Probe . . . . . . . . . . . . . . . . . . . . . . . . . . . . . . . . . . 9 Thermocouple Probe . . . . . . . . . . . . . . . . . . . . . . . . . . . . . . . . . 11
CONCLUDING REMARKS . . . . . . . . . . . . . . . . . . . . . . . . . . . . . . . . 11
TABLES . . . . . . . . . . . . . . . . . . . . . . . . . . . . . . . . . . . . . . . . . 13
FIGURES . . . . . . . . . . . . . . . . . . . . . . . . . . . . . . . . . . . . . . . . . 17
APPENDIX A .DESCRTPTION OF RAM C-I VHF TELEMETRY ANTENNA SYSTEMS . . . . . . . . . . . . . . . . . . . . . . . . . . . . . . . . . 45
APPENDIX B .DESIGN AND DEVELOPMENT O F C-BAND AND X-BAND RAM C-I ANTENNAS . . . . . . . . . . . . . . . . . . . . . . . . . . . . 60
APPENDIX C .INTERPRETATION OF RAM C-I ELECTROSTATIC PROBEDATA . . . . . . . . . . . . . . . . . . . . . . . . . . . . . . . . . . . . . 81
REFERENCES . . . . . . . . . . . . . . . . . . . . . . . . . . . . . . . . . . . . . . 89
iii
I

RADIO BLACKOUT ALLEVIATION AND PLASMA DIAGNOSTIC RESULTS
FROM A 25 000 FOOT PER SECOND BLUNT-BODY REENTRY
By Norman D. Akey and Aubrey E. Cross Langley Research Center
SUMMARY
On October 19, 1967,RAM C-I was launched from the NASA Wallops Station aboard a four-stage Scout vehicle. The threefold purpose of the flight experiment was to determine the effectiveness of water injection as a communications blackout suppressant on a spacecraft entering the earth's atmosphere at earth-orbital velocities of about 25 000 ft/sec (7620m/sec), to test the effectiveness of an X-band high-frequency teleme t ry system in reducing blackout time, and to make electrostatic probe measurements of flow-field characteristics. Water injection reduced the radio-frequency signal attenuation caused by the plasma surrounding the RAM C-I at altitudes between 260 000 and 135 000 f t (79.2 and 41.1 km). The electrostatic probe measurements were made continuously during the portion of the flight from 290 000 to 200 000 f t (88.4 t o 61.0 km) and were used to infer electron density distributions in the plasma sheath. The X-band (9210 MHz) telemetry signal was received down to 144 000 f t (43.9 km), approximately 120 000 f t (36.6 km) after VHF blackout. Other transmission frequencies were 225.7 MHz, 259.7 MHz, and 5700 MHz.
INTRODUCTION
Disruption of communications with a spacecraft traveling at a high velocity through the earth's atmosphere is due to the plasma (ionized gas) formed about the spacecraft by aerodynamic heating. The dominant chemical kinetic processes in the plasma play an important role in determining the degree of electromagnetic interference and vary as the velocity and bluntness of the reentering spacecraft. For a given body bluntness, th ree velocity regimes can be considered (ref. 1). The low-velocity regime centers about 18 000 ft/sec (5486 m/sec) and singular molecular ionization is the important chemical kinetic factor. The medium-velocity region centers about 26 000 ft/sec (7925 m/sec) and atomic ionization and charge transfer processes become important. The high-velocity
IIIl111111Ill IIIIIIII I Ill1 I I I
regime is above 30 000 ft/sec (9144 m/sec) and the atomic ionization, photoionization, and electron-impact ionization processes and multiple-charged ions a r e all important.
In the Langley Research Center Project RAM (Radio Attenuation Measurements), plasma characteristics and radio interference alleviation techniques have been studied and tested in both ground facilities and flights. Results are documented in par t in references 1t o 17; other pertinent information is given in references 18 to 24. Previous RAM flight experiments have included water injection during reentry at 18 000 ft/sec (5486 m/sec) from a hemisphere-cone body (ref. 11) and at 24 000 ft/sec (7315 m/sec) from a Gemini spacecraft (ref. 17).
RAM C-I, a hemisphere-cone probe with a 6-in. (15.24 cm) nose radius, was launched from the NASA Wallops Station on October 19, 1967, aboard a Scout vehicle and had a nominal reentry velocity of 25 000 ft/sec (7620 m/sec). During payload reentry, two techniques f o r alleviating blackout were tested (water injection and X-band signal transmission) and electrical characteristics of the plasma sheath were measured.
Water was injected into the flow field from the spacecraft as a means of reducing radio signal attenuation during reentry. Water injection into the flow field utilizes the water droplets as recombination surfaces for positive ions and free electrons. Theoretical and experimental background for both the mechanism and mechanics of liquid injection may be found in references 10 t o 14.
An X-band (9210 MHz) telemetry system was used as a means of reducing the radio blackout period. This telemetry system transmitted a microwave ca r r i e r which was above the critical plasma frequency during a large portion of the reentry. A discussion of this technique may be found in references 1 and 5.
Plasma positive ion density was measured as a function of standoff distance from the spacecraft surface at a fixed body station by using an electrostatic probe fin. From these measurements, electron density concentrations in the flow field of the spacecraft were inferred.
The effectiveness of the two blackout alleviation techniques and the plasma-sheath diagnostic measurements are presented in this report. Also included are a description of the RAM C-I VHF telemetry antenna systems in appendix A by Thomas G. Campbell, a discussion of the design and development of C-band and X-band antennas in appendix B by Fred B. Beck, and an interpretation of RAM C-I electrostatic probe data in appendix C by W. Linwood Jones, Jr .
2

DESCFUPTION O F PAYLOAD
General Characteristics
A four-stage solid-fuel Scout (Scout S-159) was the launch vehicle for the RAM C-I. (See fig. 1.) The payload and the fourth stage were spin stabilized at three revolutions per second just pr ior t o fourth-stage ignition. A protective heat shield for the payload and fourth-stage motor was ejected during coasting flight between second-stage burnout and third-stage ignition.
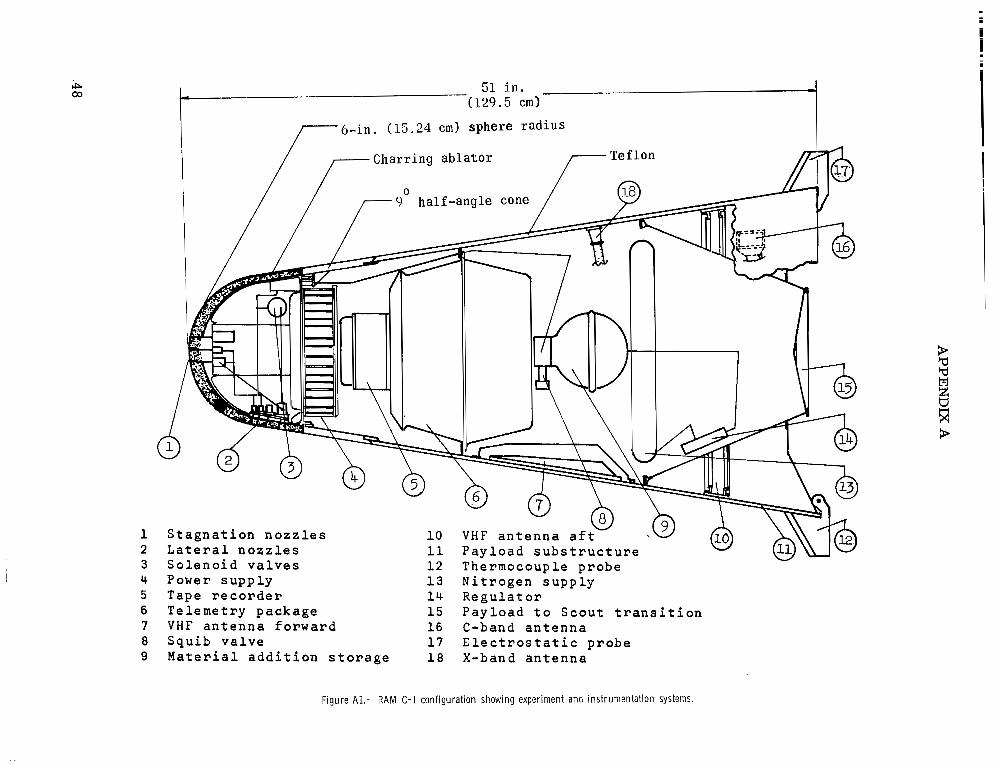
The payload configuration (fig. 2) had a 6-in.-radius (15.24 cm) hemispherical nose followed by a 90 half-angle cone. The overall length of the payload was 51 in. (129.5 cm). The cone base diameter was 24 in. (61.0 cm) and the weight at launch was 267 lb (121.1 kg). The heat protection material covering the hemisphere nose was a charring ablator. The material was selected (ref. 25) in order that the integrity of the water injection nozzles ,drilled through the material, would be maintained during ablation. The afterbody was covered with teflon.
The two major systems onboard the RAM C-I were the experiment system and the instrumentation system. The experiment system consisted of (1)water injection mechanism, (2) X-band telemetry, and (3) electrostatic probes. The instrumentation system included various sensors, payload performance instruments ,a tape recorder ,and two VHF telemeters. Figure 2, a cutaway drawing of the payload, shows the relative location of the various components. All instrumentation performance was nominal and is not discussed in this report.
A perspective sketch of the RAM C-I and coordinates of the important functional par ts are given in table I. Indicated in the sketch are the respective locations (three) of the water injection nozzles, the VHF and X-band telemetry antennas, the C-band beacon antenna, and the electrostatic and thermocouple probe fins. One water injection site was in the stagnation region and the other two were located diametrically at the points of tangency between the hemisphere and cone section. Two 259.7-MHz VHF cavity-backed slot antennas, for the real-time telemetry system, were also located diametrically, aft of and in line with the water injection sites. The real-time 259.7-MHz VHF telemetry link used a 5-W FM transmitter. A 225.7-MHz VHF antenna, also excited by a 5-W FM transmitter, was just forward of the payload base. The 225.7-MHz system was also used as a telemetry link transmitting the same data as the 259.7-MHz system but with a 45-sec delay. This delayed telemetry was accomplished by a continuous loop tape recorder in the payload which stored real-time information for 45 sec before t ransmittal and supplied the data after the payload emerged f rom blackout. A detailed description of the two VHF telemetry antenna systems is given in appendix A.
3

I I1ll11lllllllIlI1111 I I I
The 9210-MHz X-band telemetry antenna system was a four-horn array. The X-band horns were positioned at 90° intervals on the periphery of the payload with a 300 offset from the slot antennas. The 5700-MHz C-band beacon antenna was located behind the 225.7-MHz VHF antenna. The C-band and X-band antenna systems are discussed in appendix B. The two retractable fins were diametrically positioned at the aft end of the payload and in line with the water injection sites. One fin contained eight electrostatic probes for measuring the plasma ion current. The other fin was equipped with three thermocouples for correlation of the fin leading-edge heating. Both fins were retracted at 176 000 ft (53.6 km) during reentry fo r payload stability considerations. Detailed descriptions of the two onboard blackout alleviation systems and the flow-field diagnostic experiment are presented in the following sections.
Water Injection System
The water injection system was designed to provide a programed variation of flow rates and jet velocities in order to place specific amounts of water throughout part of the radio-frequency (RF) attenuating layer of the flow field. The experiment was designed so that flow rate levels for the water injection system would provide for electron density reductions in the R F attenuating layer of the flow field, which varies with altitude.
The water injection system is shown in block diagram form in figure 3(a). It consists basically of a gas pressurizing system, a water reservoir , 11 solenoid valves, and an electronic programer. P r io r to separation of the payload from the fourth stage, the system conditions were as follows: the nitrogen supply bottle was sealed off from the pressure reservoir by the supply valves; the water reservoir , which held 4.2 lb (1.905 kg) of water, was sealed from the gas side by the neoprene bladder and from the other side by the water dump valve; the water lines t o the solenoid valves were empty and all of the valves were closed. When the payload had descended to an altitude of 410 000 f t (125.0 km), a command signal from Bermuda initiated the electronic programer action. Ten sec later two solenoid valves were opened t o allow the water supply lines t o the solenoid valves t o be bled down t o the ambient pressure, which was essentially vacuum, The valves were then closed and the water dump valve was opened to allow the water to f i l l the lines. The water pressure at that time was 2 psia (13.79 kN/m2) due to the initial condition in the pressure reservoir. The cycling of the solenoid valves was then begun with the sequencing shown in figure 3(b). As shown, a cycle of the valves consisted of 7 pulses and the cycle was repetitive every 4 sec. The valve-on times were 230 msec and the valves were opened at 0.5-sec intervals. Valves 5 , 6, and 7 (at stagnation injection site) were consecutively opened and allowed increasingly larger amounts of water to be injected into the flow field. Next, the pa i r s of valves from the side locations (valves l, 2, 3, and 4) were consecutively opened and also provided increasing flow rates.
4

Figure 4 shows the orifice configurations for the various flow rates. All orifices were 0.018 in. (0.4577 mm) in diameter and the increase in Ilow.rate was accomplished by increasing the number of orifices used. To increase both the rate of flow and the penetration of the injection into the flow field as a function of decreasing altitude, the two pressure supply valves were opened by the programer, one at 250 000 f t (76.2 km) and the other at 176 000 f t (53.6 km). The gas from the nitrogen supply bottle was thus fed through the valve orifices at a predetermined rate and thereby the head pressure on the water was increased as the payload descended. The resultant flow rates as obtained from flight data are given in table 11, with the altitude noted for the start of each pulse. (Cycle 1 had no flow due to a slow f i l l rate in the lines.)
X-3and Telemetry System
A block diagram of the X-band telemetry system which was used to demonstrate the effectiveness of higher transmission frequencies in reducing blackout time, is shown in figure 5. All input data transmitted by this system were also transmitted by the VHF telemetry links. Each of the 60 input channels was commutated 15 t imes pe r second by a solid-state electronic commutator-encoder. The outputs from the encoder were pulse position modulated (PPM) to the X-band transmitter and pulse duration modulated (PDM) to the VHF transmitter. The X-band transmitter had a peak power output of 500 W with a pulse width of 1.0 psec and a pulse repetition frequency of 1800 pulses pe r second. The power was divided and transmitted through a four-horn antenna a r r a y (described in appendix B) providing a symmetrical radiation pattern about the payload. Since the payload was spin stabilized during reentry, a symmetrical pattern would allow signal-strength interpretations of RF attenuation effects independent of vehicle spin motions.
Electrostatic Probe Experiment
The electrostatic probe experiment was designed to measure the positive ion density profiles through and beyond the flow-field boundary layer of the plasma surrounding the spacecraft as a function of distance normal t o the payload surface. The leading-edge dimension of the probe was designed to be free molecular for altitudes above 180 000 f t (54.9 km). The probe body was designed to extend through the peak o r maximum plasma density region of the flow field so that an experimental determination of peak density as a function of altitude could be made. Measurements were made at a fixed body station on the aft portion of the spacecraft.
The exterior physical configuration of the electrostatic probe fin, a sectional view of the leading edge, and standoff dimensions of the ion collectors are given in figure 6(a). The probe was essentially a rake consisting of eight individual sensors which were made from iridium strips. The sensors , or ion collectors, extended 0.010 in. (0.254 mm)
5

beyond the wedge-shaped leading edge. Larger iridium pieces mounted parallel t o the leading edge on both sides of the wedge functioned as electron collectors. Iridium was used because of its high melting temperature, high electronic work function, and negligible oxidation property. The 0.010-in. radius of the beryllium oxide leading edge was followed by a 600 wedge, and the entire probe configuration was swept back at a 45O angle with respect to the payload surface.
Each ion collector was electrically insulated with beryllium oxide ,which was used because of its high temperature insulation properties. The two electron collectors on either side of the wedge were electrically common. Referenced to the electron collectors , a fixed bias of -5.0 V was applied to all ion electrodes s o that in the presence of a plasma the positive ions were collected. The resultant ion current on each of the eight probes was commutator sampled and then conditioned by a logarithmic amplifier for telemetering. The logarithmic amplifier had a current range from A to 10-3 A; this current range corresponded to an electron density range from lo8 electrons/cm3 to 1012 electrons/cm3.
When immersed in a flowing plasma, the collectors appear to the charged particles t o be O.OlO-in.-diameter (0.254. mm) cylindrical wires due to the directed ion velocity; therefore, a modified cylindrical probe theory can be used in the interpretation (ref. 15). The basic theory and a sample calculation of the data reduction procedure for interpretation of the electrostatic probe data a r e given in appendix C. Although only positive ions a r e measured by the electrostatic probes, electron densities can be inferred because equal distribution of the electrons and positive ions is assumed.
Thermocouple Probe
The purpose of the thermocouple probe was to determine the altitude at which insulation degradation for the electrostatic probes began. The thermocouple probe fin was mounted on the payload diametrically opposite the electrostatic probe fin. Both the thermocouple and electrostatic probes were in line with the water injection sites to insure s imilar heating environments.
The geometry of the thermocouple probe fin shown in figure 6(b) was the same as that of the electrostatic probe fin. Instead of electrodes, however, three thermocouples were imbedded 0.025 in. (0.635 mm) from the leading edge of the wedge as shown in the
I sectional view of the probe leading edge; The thermocouples were platinum-platimm 13 percent rhodium and were located 0.787, 1.575, and 2.36 in. (2, 4, and 6 cm) from the
I payload surface. The useful measurement range of the thermocouples was f rom Oo F to 31000 F (255' K to 1978O K).
6
I

RESULTS AND DISCUSSION
Trajectory and Tracking
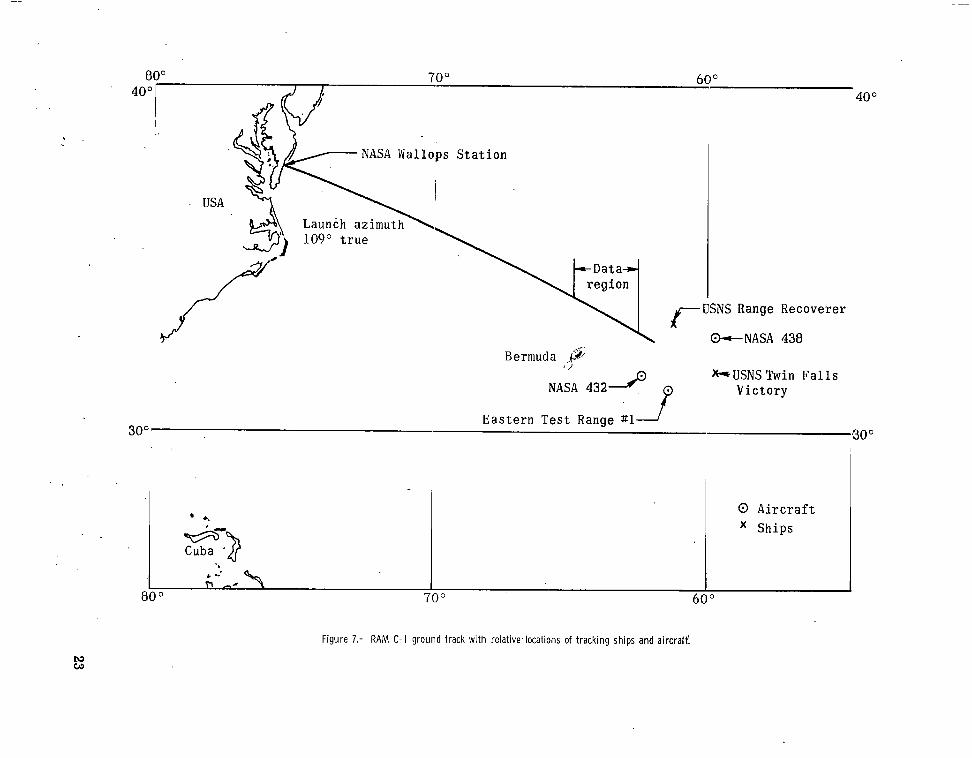
RAM C-I was launched f rom the NASA Wallops Station at 17:33:00 GMT on October 19, 1967, on an azimuth of 1090. The launch vehicle flew a suborbital trajectory and reached an apogee of 750 000 f t (229 km) pr ior t o driving the payload back into the atmosphere at a flight-path angle of -15O. Maximum payload velocity was 25 165 ft/sec (7670 m/sec). Reentry was north of Bermuda, the pr imary tracking station. Midway through the data period the payload was 100 n. mi. (185.2 km) f rom the island. The RAM C-I ground t rack is shown in figure 7.
The variation of altitude and velocity with t ime for the reentry is shown in figure 8. The indicated events are the command signal f rom Bermuda which started the programer at 410 000 f t (125.0 km), fourth-stage separation f rom the payload at 360 000 f t (109.7 km), beginning of water injection at 273 000 ft (83.2 km), retraction of the two probe fins at 176 000 f t (53.6 km), and water cutoff at 110 000 f t (33.5 km). A detailed payload velocity history during reentry f rom 500 000 ft (152.4 km) down to 20 000 ft (6.10 km) in 5000-ft (1.524 km) altitude increments is given in table III.
Backup tracking was provided by the USNS Twin Falls Victory shown in figure 7. VHF telemetry coverage was provided by Bermuda, the USNS Twin Falls Victory, the USNS Range Recoverer, NASA aircraft 432 and 438, and an Eastern Test Range (ETR) aircraft. The X-band telemetry receiving stations were located at Bermuda.
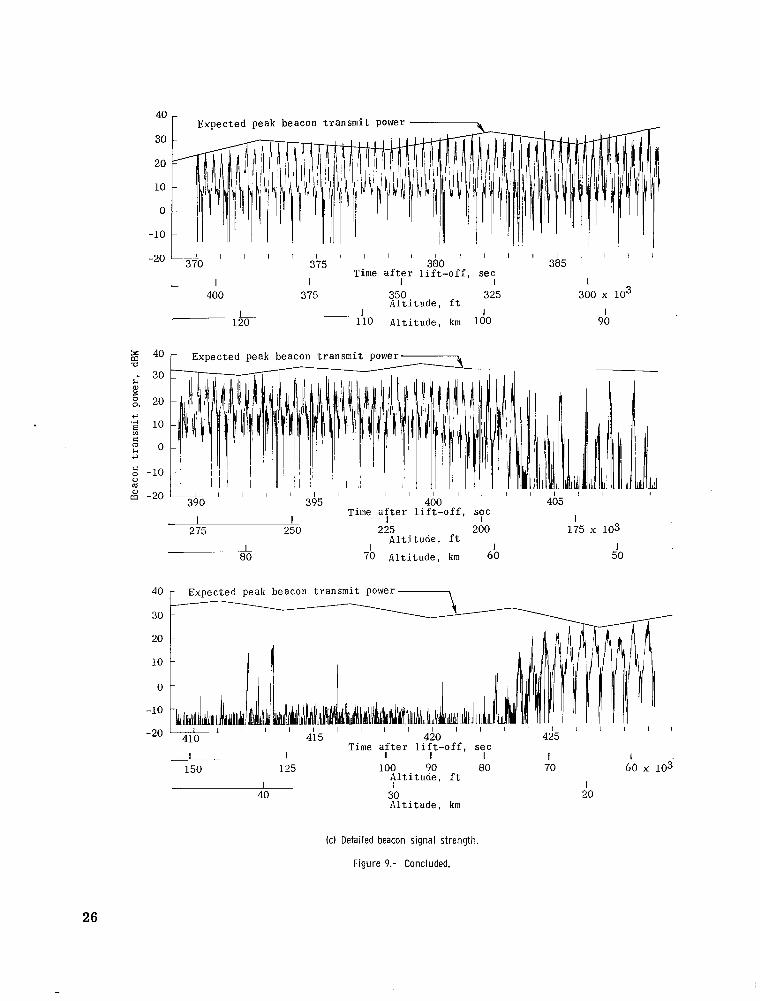
Continuous trajectory data were obtained at the Bermuda radar installation by the AN/FPS-16 and AN/FPQ-6 radars . Figures 9(a) and 9(b) show portions of the smoothed radar signal-strength data obtained. The FPS-16 radar was in the beacon t rack mode initially with the FPQ-6 radar operating in the skin t rack mode. As the payload beacon signal was first attenuate'd by the reentry plasma at 195 000 f t (59.4 km), t he skin t rack return signal was enhanced. When th'e FPS-16 radar lost the beacon signal at 180 000 f t (54.9 km), the FPQ-6 radar continued tracking in the skin t rack mode. The skin return signal remained enhanced until the payload velocity decreased; this decrease caused a reduction of the plasma which, in turn, reduced the skin return signal and allowed the beacon signal t o again be received upon emergence f rom blackout. Detailed C-band beacon t rack records a r e given in figure 9(c). A separate study of the tracking radar results has beeri made and is documented in reference 16.
Signal Blackout
Onset and emergence of signal blackout for the RAM C-I reentry are shown in figure 10. The payload velocity at the onset of blackout was about 25 000 ft/sec' (7620 m/sec) for all frequencies. The first signal attenuated was the 259.7 MHz VHF
7

telemetry from the two slot antennas, followed by the 225.7 MHz VHF signal, the 5700 MHz C-band signal, and the 9210 MHz X-band signal. Table IV gives the altitudes fo r blackout of the various signal frequencies at the different receiving stations. The altitude at onset of attenuation and the altitude at emergence from blackout are also included.
X-Band Telemetry
The X-band telemetry system provided real-time data for two-thirds of the t ime period that the VHF telemetry signal was blacked out. The X-band signal did not black out until 144 000 f t (43.9 km) as compared with 260 000 ft (79.2 km) for the VHF signal (fig. 10). The blackout velocity was about the same for both signal frequencies, approximately 25 000 ft/sec (7620 m/sec). These results obtained with the X-band telemetry system show a significant improvement in operational t ime and altitude range for spacecraft reentering the earth's atmosphere.
Water Injection
The effect of water injection on the two VHF telemetry signals, 225.7 MHz and 259.7 MHz, is shown in figures 11to 15. The received signal strength in decibels is plotted above the noise level as a function of altitude for the five VHF telemetry stations. Signal-strength recovery during the prime data period can be compared with the water injection rates given in table 11. Injection was from 273 000 f t (83.2 km) down to 111 000 f t (33.8 km) for a range of flow ra tes f rom 0.01 lb/sec to 1.55 lb/Sec (4.54 g/sec to 703 g/sec). The last effect of water injection on VHF-signal was noted at an altitude of approximately 150 000 ft (45.7 km). When the experiment was designed, it was expected that the largest water injection flow rate f rom the side (flow rate 4) would provide recovery throughout the entire altitude range of injection. Experimentally, however, only marginal recovery was observed fo r VHF signal down to 150 000 f t (45.7 km). At altitudes above 200 000 f t (61.0 km), water effects a r e relatively good.
The signal-strength records (figs. 11to 15) have been faired to partially eliminate antenna pattern and payload spin effects, which are not readily known nor easily analyzed. For comparison, an unfaired telemetry record of the signal strength received at Bermuda is shown in figure 14(b). Recovery spikes at the beginning and end of the injection pulses a r e sometimes quite large. It is not known whether these spikes a r e due to optimum water penetration at these particular instances which allows maximum free-electron quenching or are due to a disruption of the flow field caused by the injected water stream. A spiking phenomenon was also observed during the water injection experiment on Gemini 3 (ref. 17).
8

The X-band recovery levels are shown in figure 16 and water injection effects were observed down to 129 000 f t (39.3 km). The effect of water injection was observed in the radar cross section of the payload and wake as a variation of intensity of the signal received by the skin t rack C-band radar. These data are evaluated in reference 16.
VHF antenna transmission characteristics are shown in figures 17(a) and (b). Figu re 17(a) shows the effect of water injection on the forward and reflected power levels for the 259.7-MHz VHF system, a sharply tuned narrow-bandwidth slot antenna. During injection the reflected power is reduced and the forward power is increased; this indicates that the effects of the plasma on electromagnetic absorption and reflection are being reduced during the presence of water in the flow field. Figure 17(b) shows the forward and reflected power levels for the 225.7-MHz system, a broadly tuned wide-bandwidth ring antenna. Figure l7(c) shows forward and reflected power levels for the X-band system. An analysis of these power measurements (VSWR) will contribute t o an improved understanding of the flow field.
The electrostatic probe data presented in the next section indicate that the attenuating layer of the flow field surrounding RAM C-I extended beyond the ends of the probes. Thus, it is likely that the water was not distributed far enough into the flow field t o reduce the outer levels of the electron density so that the propagation of the signal through the flow field was possible.
Electrostatic Probe
Approximately 1 sec, corresponding to an altitude change of from 237 000 f t (72.2 km) to 231 000 f t (70.4 km), of the electrostatic probe data is shown in figure 18 where the collected ion current is plotted as a function of altitude. The eight ion collectors a r e sampled consecutively with one sweep of the eight collectors requiring about 0.026 sec. Thus, an ion distribution profile is obtained in 26 msec, which represents about 8 percent of one revolution of the payload. An in-flight calibration of the electronic system occurs after each three sweeps. The calibration levels are indicated in the figu r e (100%, 75%, SO%, 25%, 0% of full scale) and correspond to the scale markings on the ordinate axis.
The effects on the current distributions of flow rates 3 and 4 of water injection cycle 3 are also shown in figure 18. Flow rate 3 reduces the ion currents by approximately 1decade, whereas the larger flow rate 4 reduces the ion currents by approximately 2 decades. The currents returned to their preinjection values very quickly when injection was stopped.
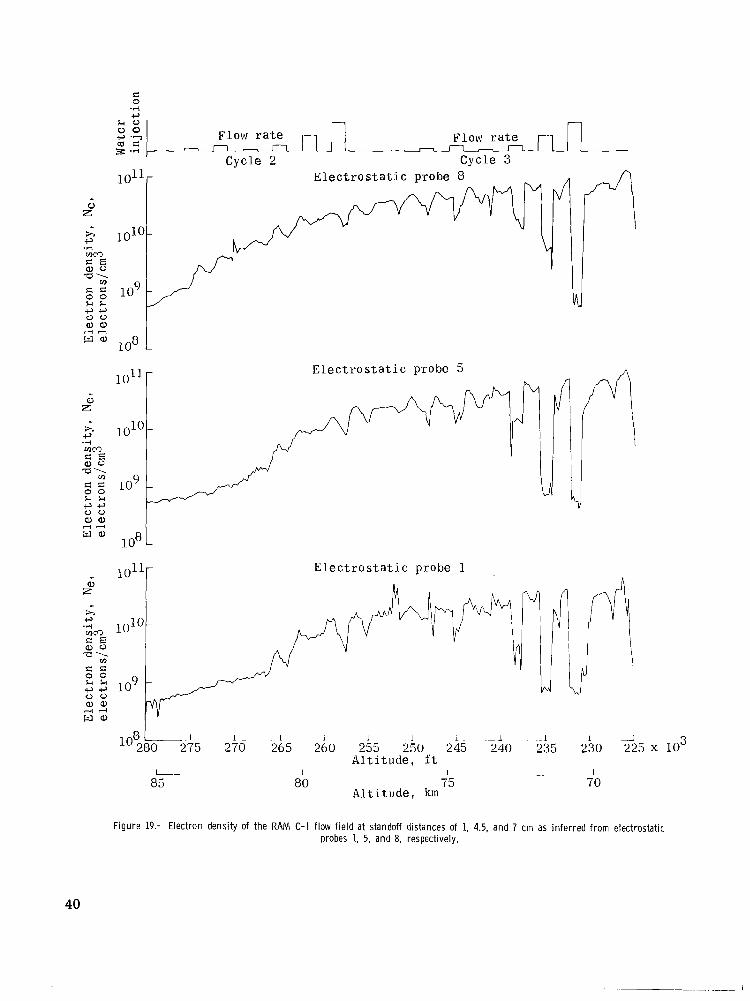
A history of electron density computed from measurements of probes 1, 5, and 8 is presented in figure 19. From a comparison of the curve slopes an insight into electron-density distribution rates may be gained. A gradual increase in electron density for
9

probes 1 and 5 is noted from 280 000 ft t o 267 000 f t (85.3 km t o 81.4 km), with a greater increase in density from 267 000 f t to 257 000 f t (81.4 km t o 78.3 km). The buildup of electrons between 267 000 f t and 257 000 f t corresponds t o the beginning of complete signal loss from the 259.7-MHz forward VHF slot antennas and to the initial attenuation of the 225.7-MHz aft VHF ring antenna. Critical electron densities for the 259.7- and 225.7-MHz frequencies are 8.2 X lo8 and 6.3 X lo8 electrons/cm3, respectively. Below 257 000 f t , electron density curves derived from all probes indicate only a gradual increase in magnitude. However, f rom 280 000 f t t o 257 000 ft (85.3 km to 78.3 km), probe 8 curve shows an almost constant rate of increase in density and has a greater slope than those fo r probes 1 and 5; this indicates that peak or maximum electron density moves in an outboard t o inboard direction since the standoff distance from the payload surface of probes 1, 5, and 8 is increasing as shown in figure 6(a).
Water injection and spacecraft motions, such as yawing, pitching, spinning, and coning, complicate the analysis of the electron density distribution rates. Figure 19 indicates that the probe density measurements include payload motion effects as evidenced by the null occurring during a period of no injection between cycle 2 and cycle. 3 of the water injection (255 000 ft (77.7 km)). This null is certainly not attributable t o injection. Likewise, the nulls occurring during injection cycle 2 are most likely due to payload motion effects. These effects are shown by the difference between the deep null during flow rate 2 and a mild depression during flow rate 3, although flow rate 3 is the larger of the two. A 3-rps oscillatory variation of electron density, which is not readily apparent from the figure, is definitely present in the measured density fluctuations. This variation is most likely due to the fact that the payload is at an angle of attack (unsymmetrical flow field about payload) while spinning at a 3-rps rate through the flow field. The probes, which are fixed on the payload, are therefore measuring a varying electron density at the spin rate because of the asymmetry.
During injection cycle 3, the sequential increase in flow rates are readily seen as corresponding decreases in electron density. Distribution profiles during the side injection portion of cycle 3 are shown in figure 20. The curve labeled "No flow" represents the average distribution during the no-injection periods of injection cycle 3. The data points for each profile represent instantaneous interpolations of electron density from plots such as those in figure 19. If a calculation of the attenuation change at VHF is made by applying plane-wave- homogeneous-plasma slab theory in increments to the electron density profile changes in figure 20 for flow rates 2, 3, and 4, there is good agreement between the resultant integral attenuation change and the observed attenuation change of figures 11to 15.
Effects on electron density during one stagnation sequence of water injection occurring over a 1947-ft (593 m) altitude range is shown in figure 21. Almost a 2-decade
10

change in electron density due to water injection is observed. Injection began at 226 690 f t (69.1 km) and actually stopped at 225 250 f t (68.7 km).
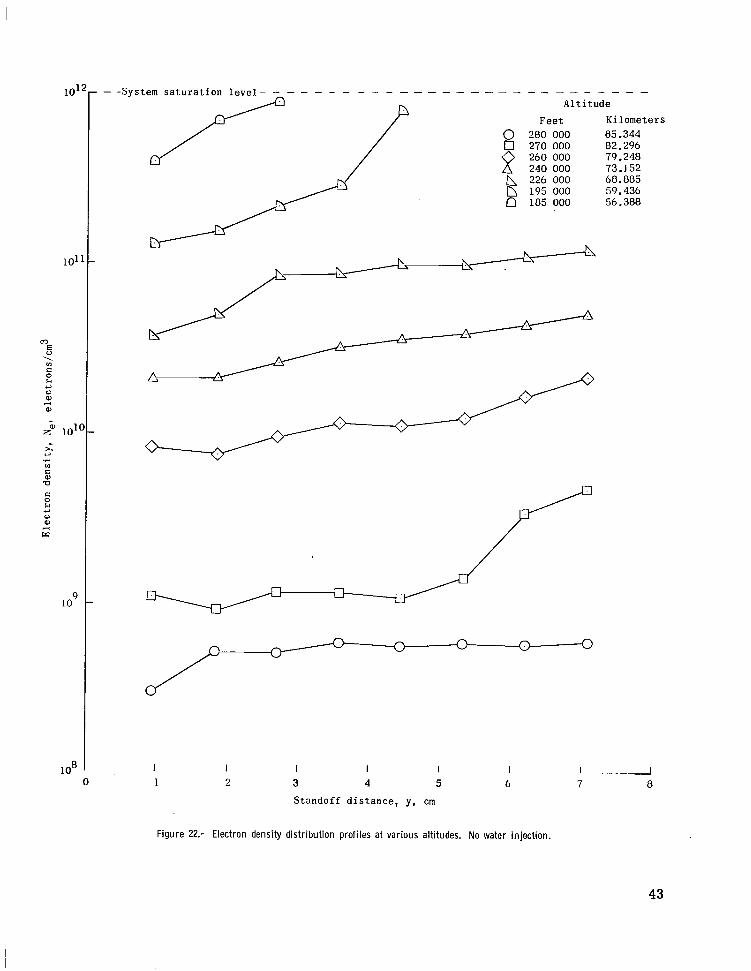
A family of electron density profiles during no injection over an altitude range from 280 000 t o 185 000 f t (85.3 to 56.4 km) is shown in figure 22. The profile at an altitude of 280 000 f t corresponds t o the beginning of the electrostatic probe data period. (At altitudes of 195 000 f t (59.4 km) and 185 000 f t (56.4 km), the outermost collectors have saturated the measuring system.) The profiles inferred from the electrostatic probe measurements indicate a much thicker boundary layer than that used as the design criterion. From the general slope of the profiles, the outer edge of the boundary layer appears to be beyond a standoff distance of 7 cm.
Thermocouple Probe
A knowledge of the aerodynamic heating on the probe is necessary for valid probe current interpretation. Thermocouple probe data for the RAM C-I are presented in figu re 23. Data from thermocouples 7, 8, and 9 show a small initial increase in heating. Thereafter data from thermocouple 9 indicate a sharp rise in heating commencing at about 230 000 f t (70.1 km) and the heating rate of thermocouple 8 changes abruptly at about 204 000 f t (62.2 km). Electrostatic probe data are considered t o be useful only for comparative purposes and not for absolute values once the local probe temperature exceeds 1000° F (811O K) due to probable thermal degradation of the beryllium oxide insulator. Finally, at 189 500 f t (57.8 km), data from thermocouple 7 also indicate an abrupt rise in heating rate. Effects of water injection can also be seen in figure 23, particularly for altitudes below 210 000 f t (64.0 km).
CONCLUDING REMARKS
A reentry flight experiment has been conducted with the RAM C-I at about 25 000 ft/sec (7620 m/sec) to determine the reduction in radio-frequency signal attenuation due to injection of water into the plasma sheath surrounding the RAM C-I and to measure plasma properties by using electrostatic probes. From the data obtained, the following remarks can be made:
1. Water injection into the plasma surrounding the payload reduced the attenuation of signals radiated from the RAM C-I at frequencies of 225.7 MHz, 259.7 MHz, 5700 MHz, and 9210 MHz.
Effects of water injection were observed on signal-strength measurements down t o 150 000 ft (45.7 km) for the VHF frequencies and t o 130 000 ft (39.6 km) for the X-band frequency.
11

Signal recovery levels due to water injection did not meet the design estimates apparently because the attenuating portion of the flow field was thicker than expected, as evidenced by the electrostatic probe measurements at altitudes above 200 000 ft (61.0 km).
Both VHF and X-band VSWR measurements show plasma effects on the antennas, and a change in the effects during water injection is observed.
2. The X-band telemetry system provided real-time data during two-thirds of the t ime period that the VHF signal was blacked out at a reentry velocity of about 25 000 ft/sec (7620 m/sec) and thereby confirmed the worth of high-frequency t ransmission as a means of reducing the t ime interval of communications blackout.
The X-band signal was received to a 115 000-ft (35.0 km) lower altitude than were the VHF signals. The blackout altitudes were 260 000 f t (79.2 km) for VHF and 144 000 f t (43.9 km) for X-band frequency.
3. Electrostatic probes were effective in measuring the plasma properties.
Preliminary data reduction indicated that the region of high electron density in the flow field was thicker than expected.
During the period of valid electrostatic probe measurements, good agreement was obtained between the measured levels of electron density and the VHF signal attenuation data, both with and without water injections.
The effects of vehicular motion on the plasma density levels were also observed.
Langley Research Center, National Aeronautics and Space Administration,
Langley Station, Hampton, Va., October 28, 1969.
12

TABLE I.- POSITION O F FUNCTIONAL PARTS ON THE RAM C-I CONFIGURATION x = o @ = O
@ = 270 f . - xr @ = 180
/ 1
Number I 1 2 3
4 5 6 7 8 9
10 11
12 13
‘13
Part x, Function in. (cm) x/D
(b) Water injection nozzle:
Stagnation La te ra l La te ra l
Antenna: VHF slot V H F slot X-band horn X-band horn X-band horn X-band horn VHF ring C-band horn
Probe: Electrostat ic
0 ( 0 ) --- 0
6.0 (15.2) 0 .48 6.0 (15.2) 180 .48
(259.7 MHz) 29.6 (75.2) 0 2.36
(259.7 MHz) 29.6 (75.2) 180 2.36
(9210 MHz) 32.6 (82.8) 60 2.60
(9210 MHz) 32.6 (82.8) 150 2.60
(9210 MHz) 32.6 (82.8) 240 2.60 (9210 MHz) 32.6 (82.8) 330 2.60
(225.7 MHz) 43.0 (109.2) --- 3.42 (5700 MHz) 46.6 (118.4) 30 3.71
48.6 (123.4) 0 3.87 Thermocouple 48.6 (123.4) 180 3.87
aCenter-line location of par ts . h o s e d iameter D is 12.56 in. (31.90 cm).
13

TABLE II.- RAM C-IWATER INJECTION FLOW RATES
Valve for - Flow rate Altitude Valve for - Flow rate Altitude ~~
3tagnatioi Side injection njectioi .b/se cg/se( ft kminjection nject io1 b/sec ft km ltagnatioi Side
-.
5 0 0 5 0.05 0.023 100 49( 61.: 6 0 0 6 .15 .068 .9723f 60.: 7 0 0 7 .28 .127 .9398; 59.:
1 0 0 1 .10 .045 .90724 58.1 2 0 0 2 .24 .lo9 87 462 57.3 3 0 0 3 .65 .295 84 202 56.3 4 0 0 4 1.01 .458 80 94: 55.: __
5 0 0 "78 90E J5.( 5 0.06 0.027 74 451 53.2 6 0 0 275 635 84.( 6 .18 .082 71 212 52.2 7 .03 ,.014 273 027 83.2 7 .36 .163 67 968 51.1
1 .01 .004 269 11: 82.C 1 .13 .059 64 722 50.2 2 .04 .018 265 866 81.C 2 .32 .145 61 466 49.2 3 .10 .045 262 616 80.C 3 .90 .408 58 199 48.2 4 .15 .068 259 363 79.c 4 1.42 .644 54 937 47.2 __
5 D.02 0.009 252 861 77.1 5 0.07 3.032 48 484 45.2 6 .07 .032 249 598 76.1 6 .23 .lo4 45 267 44.3 7 .14 .064 246 328 75.1 7 .43 .195 42 058 43.3
1 .06 .027 243 048 74.1 1 .15 .068 38 864 42.3 2 .14 .064 239 771 73.1 2 .35 .159 35 684 41.4 3 .40 .181 236 486 72.1 3 .98 .444 32 511 40.4 4 .66 .299 233 '205 71.1 4 1.55 .703 29 532 39.5
5 1.04 1.018 226 690 69.1 5 0.08 1.036 23 137 37.5 6 .12 .054 223 442 68.1 6 .24 .lo9 20 058 36.6 7 .24 .lo9 220 185 67.1 7 .43 .195 17 010 35.7
1 .08 .036 116 915 36.1 1 .15 .068 13 987 34.7 2 .21 .095 !13 635 55.1 2 .35 .159 110 986 33.8 3 .55 .249 310 348 54.1 3 D 1
_- 4 .89 .404 107 054 53.1 4 3 )
14
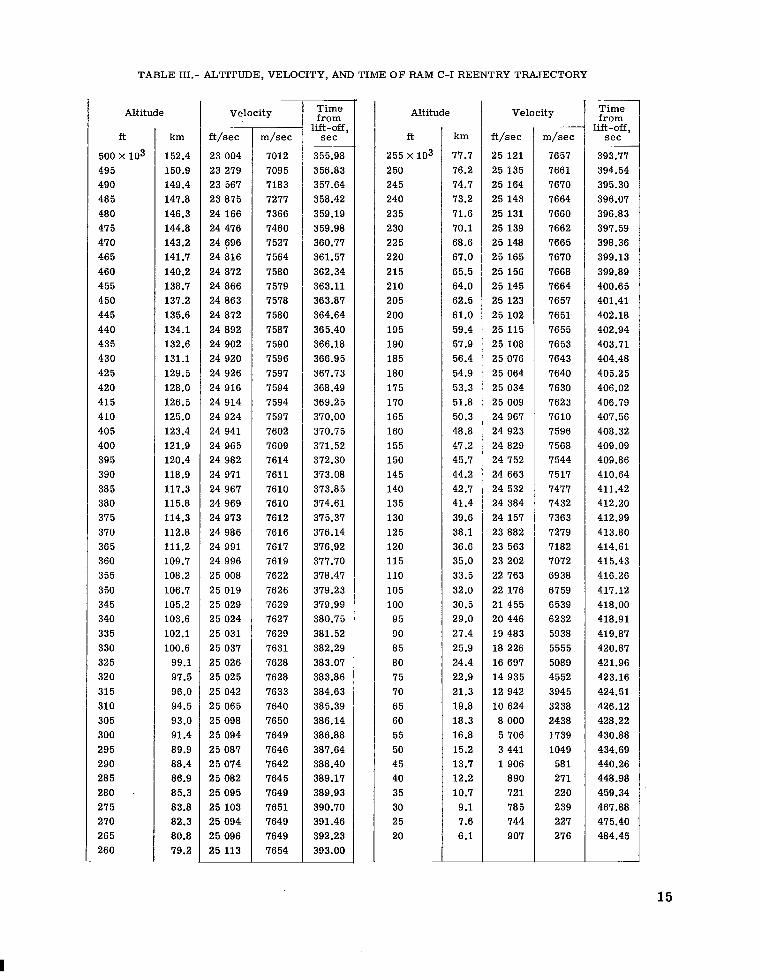
TABLE III.- ALTITUDE, VELOCITY, AND TIME OF RAM C-IREENTRY TRAJECTORY
Altitude Velocity Time Altitude Velocityfrom
ft km ft/sec m/sec lift-off,
sec ft km ft/sec m/sec
500 x 103 152.4 23 004 7012 355.98 255 x 103 77.7 25 121 7657 495 150.9 23 279 7095 356.83 250 76.2 25 f35 7661 490 149.4 23 567 7183 357.64 245 74.7 25 164 7670 485 147.8 23 875 7277 358.42 240 73.2 25 143 7664 480 146.3 24 166 7366 359.19 235 71.6 25 131 7660 475 144.8 24 476 7460 359.98 230 70.1 25 139 7662 470 143.2 24 696 7527 360.77 225 68.6 25 148 7665 465 141.7 24 816 7564 361.57 220 67.0 25 165 7670 460 140.2 24 872 7580 362.34 215 65.5 25 156 7668 455 138.7 24 866 7579 363.11 210 64.0 25 145 7664 450 137.2 24 863 7578 363.87 205 62.5 25 123 7657 445 135.6 24 872 7580 364.64 200 61.0 25 102 7651 440 134.1 24 892 7587 365.40 195 59.4 25 115 7655 435 132.6 24 902 7590 366.18 190 57.9 25 108 7653 430 131.1 24 920 7596 366.95 185 56.4 25 076 7643 425 129.5 24 926 7597 367.73 180 54.9 25 064 7640 420 128.0 24 916 7594 368.49 175 53.3 25 034 7630 415 126.5 24 914 7594 369.25 170 51.8 25 009 7623 410 125.0 24 924 7597 370.00 165 50.3 24 967 7610 405 123.4 24 941 7602 370.75 160 48.8 24 923 7596 400 121.9 24 965 7609 371.52 155 47.2 24 829 7568 395 120.4 24 982 7614 312.30 150 45.7 24 752 7544 390 118.9 24 971 7611 373.08 145 44.2 24 663 7517 385 117.3 24 967 7610 373.85 140 42.7 24 532 7477 380 115.8 24 969 7610 374.61 135 41.4 24 384 7432 375 114.3 24 973 7612 375.37 130 39.6 24 157 7363 370 112.8 24 986 7616 376.14 125 38.1 23 882 7279 365 111.2 24 991 7617 376.92 120 36.6 23 563 7182 360 109.7 24 996 7619 377.70 115 35.0 23 202 7072 355 108.2 25 008 7622 378.47 110 33.5 22 763 6938 350 106.7 25 019 7626 379.23 105 32.0 22 176 6759 345 105.2 25 029 7629 379.99 100 30.5 21 455 6539 340 103.6 25 024 7627 380.75 95 29.0 20 446 6232 335 102.1 25 031 7629 381.52 90 27.4 19 483 5938 330 100.6 25 037 7631 382.29 85 25.9 18 226 5555 325 99.1 25 026 7628 383.07 80 24.4 16 697 5089 320 97.5 25 025 7628 383.86 75 22.9 14 935 4552 315 96.0 25 042 7633 384.63 70 21.3 12 942 3945 310 94.5 25 065 7640 385.39 65 19.8 10 624 3238 305 93.0 25 098 7650 386.14 60 18.3 8 000 2438 300 91.4 25 094 7649 386.88 55 16.8 5 706 1739 295 89.9 25 087 7646 387.64 50 15.2 3 441 1049 290 88.4 25 074 7642 388.40 45 13.7 1906 581 285 86.9 25 082 7645 389.17 40 12.2 890 271 280 . 85.3 25 095 7649 389.93 35 10.7 721 220 275 83.8 25 103 7651 390.70 30 9.1 785 239 270 82.3 25 094 7649 391.46 25 7.6 744 227 265 80.8 25 096 7649 392.23 20 6.1 907 276 260 79.2 25 113 7654 393.00
~ ~~
~ _ _ Time from
lift-off, sec
393.77 394.54 395.30 396.07 396.83 397.59 398.36 399.13 399.89 400.65 401.41 402.18 402.94 403.71 404.48 405.25 406.02 406.79 407.56 408.32 409.09 409.86 410.64 411.42 412.20 412.99 413.80 414.61 415.43 416.26 417.12 418.00 418.91 419.87 420.87 421.96 423.16 424.51 426.12 428.22 430.88 434.69 440.26 448.98 459.34 467.88 475.40 484.45
~
15

Station
Bermuda
NASA aircraft 438
USNS Range Re coverer
TABLE 1V.- SIGNAL BLACKOUT HISTORY
Signal Altitude at beginning Altitude at frequency, of attenuation signal blackout
M H Z ft km ft km
225.7 267 000 81.4 257 000 78.3 259.7 280 000 85.3 262 000 79.9
5700 195 000 59.4 181 000 55.2 9210 182 000 55.5 144 000 43.9
225.7 274 000 83.5 256 000 78.0 259.7 273 000 83.2 263 000 80.2
Altitude at emergence
from blackout
ft km
77 000 23.5 74 000 22.6 75 000 22.9 72 000 21.9
87 000 26.5 79 000 24.1
225.7 279 000 85.0 260 000 79.2 78 000 23.8 259.7 280 000 85.3 267 000 81.4 70 000 21.3
~
16

Figure I.- RAM C-I on launch pad. L-67-220
17

1 2 3 4 5 6 7 8 9
(129.5 cml
6 - i n . (15.24 cm) sphere r a d i u s
3 S t a g n a t i o n n o z z l e s L a t e r a l n o z z l e s 11 P a y l o a d s u b s t r u c t u r e S o l e n o i d v a l v e s 1 2 T h e r m o c o u p l e p r o b e Power s u p p l y 1 3 N i t r o g e n s u p p i y Tape r e c o r d e r 1 4 R e g u l a t o r T e l e m e t r y p a c k a g e 1 5 P a y l o a d t o S c o u t t r a n s i t i o n VHF a n t e n n a f o r w a r d 1 6 C-band a n t e n n a S q u i b v a l v e 1 7 E l e c t r o s t a t i c p r o b e M a t e r i a l a d d i t i o n s t o r a g e 1 8 X-band a n t e n n a
Figure 2.- RAM C- I configuration showing experiment and instrumentation systems.

Neoprene bladder
To e l e c t r o n i c p r o g r a m e r f o r valve s e q u e n c i n g
(a) Water in jec t ion system.
S i d e i n j e c t i o n
Valve number 4-
- S t a g n a t i o n i n j e c t i o n
7-5
I I I I I I I 1 0 1.0 2.0 3 .0 4.0
Time, sec
(b) Water in jec t ion cycle.
Figure 3.- Block diagram of t h e RAM C-l water in jec t ion system and a typical water in ject ion.cycle.
19

C h a r r i n g a b l a t o r
C l e a r a n c e h o l e
0.0625 in.(1.587 mm) diam, s t a g n a t i o n 0.100 i n . ( 2 . 5 4 mm) diam, s i d e
S t a i n l e s s - s t e e l s u b s t r u c t u r e
Nozzle i n s e r t c o n t a i n s e i t h e r 1, 3 o r 9 o r i f i c e s ; a l l o r i f i c e s a r e 0.018 i n . ( 0 . 4 5 7 mm) diam
S i n g l e o r i f i c e
(a) Sectional view of typical nozzle i n s e r t w i th single orif ice.
Flow r a t e 5 6 o r i f i c e s
Flow r a t e 6 21 o r i f i c e s
Flow r a t e 7 39 o r i f i c e s
(b) Stagnation in ject ion or i f ice layout.
3 i n . ( 7 . 6 2 cm) 1 L i n e O f 4 0 f l i g h t 0
Flow r a t e 1 6 o r i f i c e s / s i d e
Flow r a t e 2 ow r
81 o r i f i ce s / s i d e Flow r a t e 31 45 o r i f i c e s / s i d e
(c) Side in ject ion or i f ice layout.
F igure 4.- Ori f ice conf igurat ions for t he water in ject ion system
20

--
Power divider
Solid- PPM X-band t state output transmitter
60 data commutat0r - - 9210 MHz 5 Isolator Power inputs encoder 500 watts divider
peak power
! f
Power PDM divider output 11
70 kHz subcarrier oscillator Forward and reverse
power monitors
t To VHF telemetry
system
Figure 5.- Block diagram of X-band telemetry system.
--
Four-horn antenna array

.005 (0.0127)
radius7 (0.0254)---/+.010 Beryllium oxide Phenolic fiber-glass insulator holder
Leading-edge detail
0.378 0.716 1.062 1.408 1.754 2.102 2.438 2.790 II
~.
(cm)
(0.96) (1.84) (2.70) (3.58) (4.46) (5.34) (6.20) (7.08)
J
(a) Electrostatic probe conf igurat ion.
Leading-edge detail
T i c o u p l e Standoff di stance , Y in. (cm)
0.788 (2.0) 1.576 (4.0) 2.364 (,6.0)
(b) Thermocouple probe conf igurat ion.
Figure 6.- Body conf igurat ions of t h e electrostatic and thermocouple probes. A l l l i nea r dimensions a re in inches (centimeters).
22
1111
80" (U' 60"-A n n 1 I I 40O
p ? t // -NASA Wallom Sta t ion 1
- USA Launch azimuthLyj 109" t rue
Bermuda ..(:2; *USNS Twin F a l l s
Victory
Eastern Test Range E l 30" 30O
0 Airc ra f t 4.
Ships
L a.
h -0
80 O I
Figure 7.- RAM C - I ground track with relative.locations of t racking ships and aircraft,
h3 w

25
2C
1: 0 Q, v)
- \ t,4-1
c
h .lJ
- 0 1( 0
C c
1o3 150
125
100
E X - 75 Q, P s t, -4 cr 4
50C
40C
30(
--20(t, 4 4
1O(
Command p r o g r a m e r on
-
I I I I I I IO 380 400 420 440 460 480
Time f r o m l i f t - o f f , sec
Figure 8.- RAM C - l reentry trajectory.
4 50
25
. o

' 40 c +-'
c P)
m 30
frl v)
0 I I I 1 I 1 I I 220 200 180 160 140 120 100 80 60
Altitude. ft
-50
% -40 .c+-' -0 30c 0 M +-' fA 20 d m -% 102
0 I I I I I x 103
(a) AN/FPS-16 C-band radar. (Automatic beacon tracking; smoothed AGC data.)
50 1
'40 c c +-' m 30 c P)
3 g 10 frl v)
0 220
I 200
I I 1 I 1 180 160 140 120 100
I 80
I 60 lo3
Altitude. ft I I I I I I I I I 1
65 60 55 50 45 40 35 30 25 20 Altitude, km
(b) ANIFPQ-6 C-band radar. (Automatic skin tracking; smoothed AGC data.)
Figure 9.- Strength of C-band radar signals received at Bermuda.
40
30
20
10
0
-10
1 1 1 1 1 1 1 I- 2 O L o I I I I 375 I I I I 3hO 3b5
II Time a f t e r l i f t - o f f , sec
II 400
L120
2 40 Expected peak
- 30 alH 20 c, .-8 10
E O c,
-10 m
.$ -20 2390
1 I I
II
275
375 350Al t i tude , f t
~~ I110 Al t i tude , km
beacon transmit p o w e r I
I I I I I I I
345 400 Time aq te r l i f t - o f f ,
1I
250 225
~I I Al t i tude , f t
80 70 Al t i t ude , km
I I Time a f t e r l i f t - o f f ,
I I 150 125 100 90
q l t i t u d e , f t I
40 30 Al t i tude , km
L 325 300 103
I I 100 90
1 1 1 1 1 405
syc I
200 175 103 I 1
60 50
sec I I I
80 70 60 x 103 I
20
(c) Detailed beacon signal strength.
Figure 9.- Concluded.
26
1

3480 x _ l O
125 400
100 320
E 75 240X End
a al of P Ps s blackout c, c, .rl .rl 2 50 . c ,
d 2 160 VHF
X-band 25 80 I
0 0 1 I I I 1 I I I I I 18 10 12 14 16 18 20 22 24 26 28 x 103
Velocity, f t j s e c 1 I 1 I 1 I3 4 5 6 7 8
Velocity, km/sec
Figure 10.- RAM C - I altitude-velocity reentry profi le showing onset and end of RF signal blackout.

70
- -
m ,-l
Cycle 2 Cycle 3
m - 50
l$ 40 E
E 30 c, v1
20 m E: tn;;; 1 0 1- \ II
0
60 I l
0 - U I I I
280 260 240
I I I I a5 a 0 75 70
259.7 MHz
225.7 MHz
- .i II
220 200 Altitude, ft
I I 65 60
A1titude, km
n
fSignal noise level
Signal noise level
I I 180 160 d o 103
I I I 55 50 45
Figure 11.- RAM C - l water in ject ion effects on VHF telemetry signal strength received aboard the USNS Twin Falls Victory.
c

. ,
t,
4 L-0 Signalg? 10 noise leve l
?-(
60 r
225.7 MHz
Signal noise leve l
I I I I I I I 280 260 240 220 200 180 160 d o 103
Al t i tude , f t I I I I I I I IQS 80 75 70 65 60 55 50 45
A 1titude , km
Figure 12.- RAM C - l water injection effects o n VHF telemetry signal strength received aboard NASA aircraf t 438.

w 0
- 7
a + .eo m a3 '?
E 'r l n n n n
50% c' 40 c,m
30 k c, (0 20 4 m
10 ' r l cn
0
.. c c,mr:a)k+ (0 :h1104 m E m 'rlVI
0I I I
280 260 240
I I I S A 80 75 70
259.7 MHz
Sign 1 noise level
225.7 MHz
Signal noise level
I I I I 220 200 180 160 d o 103
Altitude, ft I I I I 1
65 60 55 50 45 A1titude, km
Figure 13.- RAM C - l Water in ject ion effects on VHF telemetry signal strength received aboard ETR aircraf t number 1.

E: 0
k 'rl -IQ , c ,e o m ab '?c
-4 #-I
Cycle 2 Cycle 3 Cycle 4 Cycle 5 Cycle 6
- Signal noise level
225.7 IGHzu\/i I 1 a , , [signal noise level
L 280
I 260
I 240
I I 220 200
1 1a0
I 160 d o 103
Altitude, ft 1 I I I I I I I 1
a5 80 75 70 65 60 55 50 45 Altitude, km
(a) Faired data.
Figure 14.- Records of VHF telemetry signal strengths received at Bermuda du r ing RAM C-l water in ject ion period. W P

w N
I I I I I I ~ l l l I l ~ l , I , l l 1l I1 I I I 3 0 0 2 5 0 2 0 0 1 5 0 1 0 0 s o x 1 0 3
A l t i t u d e , ft
I I I I I I I 1 9 0 8 0 7 0 6 0 5 0 40 3 0 2 0
A l t i t u d e , km
(b) Unfaired data. (LCP, left c i r cu la r polarization; RCP, r i gh t c i r cu la r polarization.)
Figure 14.- Concluded.

c,
c
3-2 Cycle 3 Cycle 4 Cycle 5 Cycle 6
2 r-40m 259.7 MHz5 30
1 Signal noise level
I ,
-502 2 40- 225.7 MHz + c3,5 30!4 c, rA 20d Signa1m g 10- noise level *?I v)
0'
W Figure 15.- RAM C - l water injection effects o n VHF telemetry signal strength received aboard USNS Range Recoverer. W

w
Cycle 7
40 r
Signal noise level
i I I I I I I I
185 180 170 160 150 140 130 Altitude, f t
I I I I 55 50 45 40
Altitude, Itm
(a) Faired pulse-by-pulse data.
Figure 16.- Records of X-band telemetry signal strengths received at Bermuda du r ing RAM C - l water in ject ion period.

Horizontal p o l a r i z a t i o n
V e r t i c a l p o l a r i z a t i o n
Minimum d i s c e r n i b l e s i g n a l
40
c.+ m E a,
20% d m E eJ1
$ 0 400 402 404 406 408 410 412 414 416 418 420 422 424
(b) Faired peak-pulse data.
Figure 16.- Concluded.
426

+ o
- -c 3
2Fi -4 - - -a,+ ad)L .?
E m m n rl
-8.0
v1+ .Ps-M a,g 7 . 0 -a -ak mE 0 cr
-6.0
3.0 r
300 280 260 240 220 200 180 lo3 Altitude, ft
1 I 1 1 1 I I ! 90 85 80 75 70 65 60 55
Altitude, km
(a) 259.7-MHz system.
I I I I I I I
Figure 17.- Forward and reflected power of VHF and X-band telemetry systems as a func t i on of al t i tude a n d water in ject ion.
36

- 7
-r, rl n -
Cycle 5
ln r
4.0 . .
I 1 ~ 1 1 I I I 300 280 260 240 220 200 180 103
I I I Altitude, ft
I I I I I 90 85 80 75 70 65 60 55
A 1titude, km
(b) 225.7-MHz system.
Figure 17.- Continued.
37

LCycle 8 Cycle 4 Cycle 5 Cycle 6 Cycle 7
8 -1.4 !4 Q)
a -1.8
--6
mP
-10al3 0 a a2 -140 Q)4 W al cc -18
- 2 2 - I
(c) 9210-MHz system.
Figure 17.- Concluded.
38

c,E al k k 3 0
E 0 H
Flow rate 3 Flow rate 4
- 1 Cycle 3 In-flight
calibration level
25 % 0 %
1 I I I I 1 I I 1 I I
396.4. 396.6 396.8 397.0 397.2 397.4
I I Elapsed time, sec
I I I I 1 237 236 235 234 233 232 231 103
Altitude, ft
72.0 71.5 71.0 70.5 A1titude, km
Figure 18.- Effects of water injection on electrostatic probe cu r ren t measurements du r ing injection cycle 3.
W CD
$ 4 0 Q Q )@ '? m c - Flow r a t e 3.4
+ + 0 0 Q ) Q ) d- i
1011- E l e c t r o s t a t i c p robe 1
1010
8 l 1 I - . I -1 ._.I _J
l 0 2 a o 275 270 265 2ko 245 240 2115 240 235 2 i 0 225 x lo3 A l t i t u d e , f t
I I .I _ _ 1 a 5 a0 75 70
A 1 t i tude , km
Figure 19.- Electron density of the RAM C-l flow f ie ld at standoff distances of 1. 4.5, and 7 cm as i n fe r red from electrostatic probes 1, 5, and 8, respectively.
40

Altitude
Feet Kilometers
b 242 720 73.981 v 238 949 72.832 0 235 829 71.881 0 232 223 70.782
I 1 I 1 I 1 1 2 1 2 3 4 5 6 7 8
Standoff distance, y, cm
Figure 20.- Electron density distribution profi les for various injection flow rates of cycle 3.
41

S
0
S
r:
0
Al t i t ude
Feet Kilometers
n 226 690 69.0950226 041 60.097 0 225 717 60.799 n 225 523 60.739
101 G- A 225 060 68.601 0 224 743 68.502
m 0\ VI 0
+m #
m
m z < 101 c .3 v)al P
0
+m I
LJ
I I I 6 7 0
Standoff distance, y, cm
Figure 21.- Effect of stagnation injection a t flow rate 5 of cycle 4 on electron density distribution profiles a t various altitudes,
42
\
E
&I
10- _
10'
m 0111
E:
bc, 0 W 4 0,
z" 10' x .3 v1 E W P
0
c, 0 r(a w
910
108 0
Altitude
Feet Kilometers
0 280 000 85 -344 0 270 000 82.296
260 000 79.2488 240 000 73.152 226 000 68.885 195 000 51.436 n 185 000 56.388
h I\
h/*u
c/ A
0
1 I I I I I I I 1 2 3 4 5 6 7 8
Standoff distance, y , cm
Figure 22.- Electron density distr ibut ion profi les at various altitudes. No water in ject ion.
43

e o
Q)
IIIIIII IIIIIII I IIIII Ill I1 I I IIIII II I 1 I I
E - - h .3m r m a ,
3 '?
.3
- n - - m - I l n ~n n L
Cycle 5
1900 - 3ooc
-
-
2500--1500
-2000
-= tr
-~ W a,
S +lS - c l
h 1500 a W
g 1000 -2 H �
-- 1000
--
500-500
-
300 0 2
I I Thermocouple Distance from
vehicle surface, cm -
7 2
Valid electrostatic probe data below 1000° F ,'
. 1 .
1~ . - . I - .. .~- _ _ - I
260 240 I 200 180 lo3 Altitude, ft
Altitude, km
Figure 23.- Var ia t ion of thermocouple probe leading-edge temperature w i t h alt itude.
44

APPENDIX A
DESCRIPTION OF RAM C-I VHF TELEMETRY ANTENNA SYSTEMS
By Thomas G. Campbell
Introduction i
The RAM C-I had two VHF telemetry systems for the transmission of "direct" t ime and "delayed" t ime data. The antennas designed for these telemetry systems consisted
1
1 of two diametrically opposed cavity-backed slot antennas for the transmission of direct-
I time data and an a r r a y of circumferential slot antennas that transmitted the delayed-time data during the playback portion of the flight. This appendix presents a brief discussion of the design and development of these. antenna systems and the final performance characteristics of each system.
The design objectives for the delayed-time telemetry antenna system were as follows:
(1)Optimize the pattern and radiation efficiency for the playback portion of the trajectory
(2) Provide broadband impedance characteristics to minimize plasma-sheath near-field effects
(3) Reduce the possibility of electromagnetic interference when low-level components a r e used
The design objectives for the direct-time telemetry antenna system were as follows:
(1) Use thin rectangular slot antennas for comparison purposes (This type of antenna had been used on previous RAM experiments.)
(2) Optimize the radiation efficiency while providing broadside radiation from 30' to 1400 off the payload nose (Typical antenna gain should be 2-5 dB for this electrically small antenna.)
(3) Reduce the possibility of electromagnetic interference when low-level components are used
Delayed-Time Telemetry Antenna
A circumferential slot a r r a y was designed for the RAM C-I delayed-time telemetry antenna at a frequency f of 225.7 MHz to achieve end-fire (off the nose and tail)
45

APPENDIX A
radiation pattern characteristics. These characteristics were t o optimize tracking and data acquisition during reentry and the playback phase of the trajectory.
The design of circumferential slot a r r ays has been discussed extensively in the past with respect to achieving omnidirectional pattern characterist ics in the roll plane, but achieving end-fire or broadside radiation with polarization versatility is another problem. For this particular payload application, end-fire radiation was desired and obtained; however, the a r r a y could very easily have been altered t o provide broadside radiation instead.
The antenna design was obtained by first testing two diametrically opposed circumferential slots on the coated conical configuration shown in figure Al . The slots were located in the aft portion of the nose cone to optimize the electrical length of each slot and to maximize the diametric spacing so that coupling would be reduced. The body circumference ka (where k = a X is wavelength in free space, and a is radius ofX ’ nose cone) at the selected location is 1.34X and the diameter d is 0.425X. The two diametrically opposed slots were therefore spaced 0.4251 apart and the pattern control obtained agrees with the theory pertaining to an a r r a y of linear elements spaced the same distance apart. The two slots were fed in parallel with a half-wave-line balun which forced the potential at the feed point of each slot to be equal and opposite. A balancedto-unbalanced impedance ratio of 4 is obtained and a 50-ohm impedance match was obtained at the paralleled input by adjusting the feed-point locations for each slot. The total slot length could also be adjusted by relocating shorting bolts ac ross two circular rings inside the payload. The resulting slot lengths L were 0.334X.
It is interesting to note that these two slots mounted on the cone provided radiation pattern control similar to that of an a r r a y of two linear -
2 1 X elements with a spacing of
approximately X (ref. 26, pp. 279-300 and 471). The pattern results for the two slotsz on the cone are shown in figure A2(a) and A2(b). In figure A2(a) the slots are fed out of phase, that is, the center conductor of the feed line for one slot is connected to the forward side of the slot and the center conductor for the second slot is connected to the aft side of the slot. In figure A2(b) the pattern is for end-fire radiation and this pattern is obtained by merely reversing the feed polarity of the second slot. Therefore, the center conductor for each slot was connected to the forward side of the slot.
Since end-fire radiation was desired for this particular .payload, two additional slots were added to the a r r a y to optimize the polarization of the end-fire radiation. The additional slots were also diametrically opposed and fed with ;thalf-wave-line balun. The resulting pattern is essentially the superposition of the fields from the two pairs of slots and the measured results are shown in figure A2(c). The capability for end-fire circular polarization is evident in the pattern amplitudes of the orthogonal linear polarization. The sense of the circular polarization was easily altered by adjusting the phase
46

APPENDIX A
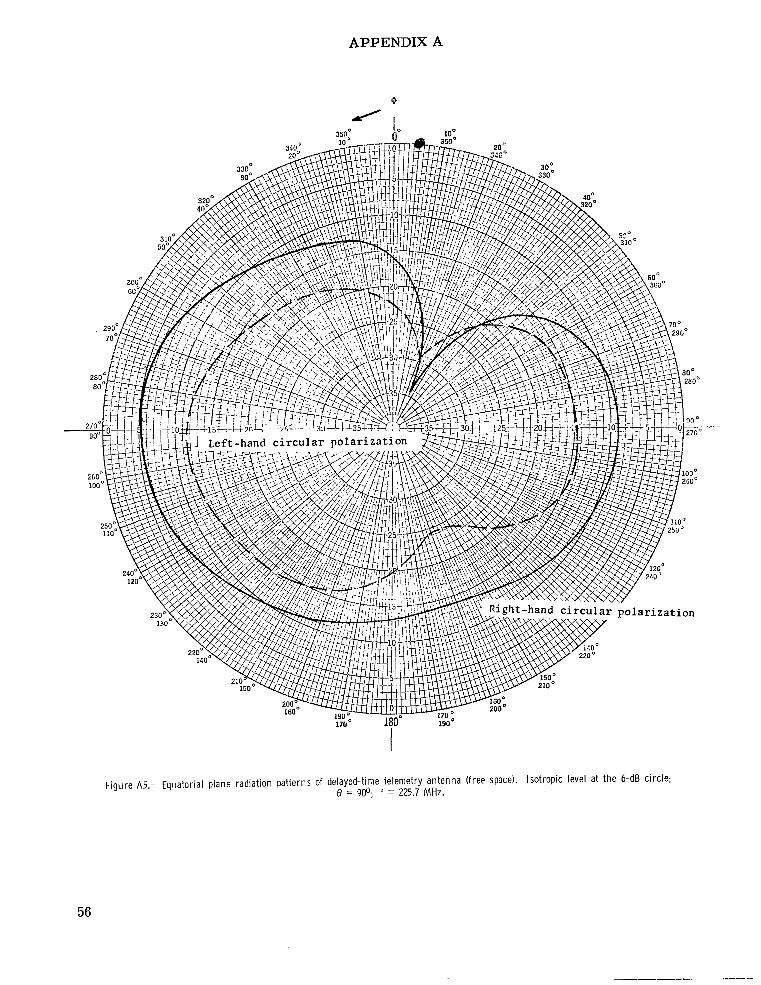
angle @ between slot pairs and the results are presented in figure A3. For @ = 00, the time-phase angle by which the vertical component of the electric field leads the horizontal component of the electric field is 90° and, when the nose cone is viewed off the nose, the sense of the circular polarization is left-hand circular or a clockwise wave approaching. As the payload is viewed from the rear, the sense of the circular polarization is right-hand circular o r a clockwise wave receding. As @ is increased, the sense is completely reversed with right-hand circular off the nose and left-hand circular off the tail. The same polarization versatility could be achieved for broadside radiation by changing the polarity of the slots accordingly. The patterns in figure A3 are also shown for several roll angles a, and no severe pattern changes were observed.
The final radiation characteristics were somewhat different from those shown in figure A3 due to a change in the polarization capability of the main tracking ship. Therefore, the phase variation between slot pairs was changed to produce a more linearly polarized signal off the nose and tail of the payload. The final impedance, VSWR, and typical radiation pattern characteristics of the delayed-time telemetry antenna are shown in figures A4(a), A4(b), and A5, respectively.
Direct-Time Telemetry Antenna
Two diametrically opposed, axial, cavity-backed slot antennas were used to transmit the direct-time telemetry data during the RAM C-I flight experiment. Slot antennas were used on previous RAM experiments and, therefore, they were used on this RAM payload for comparative purposes. Two antennas were used (locations are shown in fig. A1 and in sketch in table I) so that signal variation due to payload spin could be minimized. In order to prevent corona, the slot apertures were pressurized instead of being encapsulated. The slots were pressurized by placing a thin phenolic cover over the apertures. The cover contained a valve that would close when the ambient pressure dropped below 3.5 psi (24.132 kN/m2).
Since an encapsulating dielectric is usually lossy, pressurizing the slots increased the radiation efficiency. Pressurizing the slots also simplified the task of tuning the cavity-backed slot antennas because there was no need to compensate for an encapsulating dielectric. In figure A1 can be seen the pressurizing cover over the slot aperture.
The free-space impedance and voltage standing wave characteristics of the direct-t ime telemetry antennas are shown in figure A6. As expected, these antennas are narrow bandwidth and experienced a near-field detuning effect when they were surrounded by the plasma sheath.
Typical radiation pattern characteristics of the direct-time telemetry antenna are shown in figure A7. On the basis of these radiation pattern characteristics, it was concluded that this antenna system would satisfy the experiment objective.
47
- -
. (129.5 cm)
6 - i n . (15.24 cm) sphere r a d i u s
,-Charring a b l a t o r // // 79
0 half-angle cone
1 \ h
V H F a n t e n n a a f t - P a y l o a d s u b s t r u c t u r e Thermocoup le p r o b e N i t r o g e n s u p p l y R e g u l a t o r P a y l o a d t o S c o u t t r a n s i t i o n C-band a n t e n n a E l e c t r o s t a t i c p r o b e X-band a n t e n n a
1 S t a g n a t i o n n o z z l e s -~ 2 L a t e r a l n o z z l e s 3 S o l e n o i d v a l v e s 4 Power s u p p l y
"7pe r e c o r d e r 6 T e l e m e t r y p a c k a g e 7 VHF a n t e n n a f o r w a r d 8 S q, u i b v a l v e
10 11 1 2 1 3 1 4 1 5 1 6 1 7
9 M a t e r i a 1 a d d i t i o n s t o r a g e 1 8
Figure A I . - RAM C-l conf igurat ion showing experiment and instrumentation systems.

APPENDIX A
2u-* I I00
1800 ta l slots fed out of phase
1800
Ibl Slots fed in phase.
Figure A2.- Radiation pattern diversi ty capabilities of the c i r cumfe ren t ia l slot array. Elevation plane.
49

APPENDIX A
,zation
- 270°
180'
(c) Four slots fed in phase.
Figure A2.- Concluded.
50
- .i . _... .... .._ I..I I

9
00 J
270' 90'90'
180' _ _ . 9=20°180' __.9. 200
_ - 9; 40' la) Left-hand circular. @ = Oo.
_ - @=L@
(bl Left-hand circular. 0-50'.
Figure A3.- Polarization diversity capabilities of the end-fire slot array. Elevation plane.

--
cni t\3 !
270°
1800 _ _ - @= 200 I800 (c) Left-hand circular. 0 = loOo. @= 40' (d) Right-hand circular, O= 00.
Figure A3.- Continued.

--
270'
180' I
-
_ _ _ - @= zoo iau -- 0-40'
( f ) Right-hand circular. QI = 1000.@= 40'
(e) Right-hand circular. 0 = 50'.
Figure A3.- Concluded.

APPENDIX A
(a) Impedance.
Figure Ad.- Final performance characferist ics ot delayed-time telemetry antenna (free space).
54

APPENDIX A
210 214 218 222 226 230 234
Frequency, Wlz
(b) Voltage standing wave ratio.
F igu re A4.- Concluded.
55
APPENDIX A
56

APPENDIX A
(a) Impedance.
F igu re A6.- F ina l performance character ist ics of direct-time telemetry antenna (free space).
57

APPENDIX A
256 257 258 259 2 60 261
Frequency, MHz
(b) Voltage standing wave ratio.
Figure A6.- Concluded.
58
262

APPENDIX A
Figure A7.- Equatorial plane radiation pattern of direct-time telemetry antenna (free space). 8 = 900; f = 259.7 MHz; peak gain, -4 dB.
59

APPENDIX B
DESIGN AND DEVELOPMENT O F C-BAND AND X-BAND RAM C-I ANTENNAS
By Fred B. Beck
Introduction
The major design considerations for the RAM C-I C-band and X-band antennas are physical size, pattern coverage, and gain. The limitations on physical size are surface area on the circumference of the payload and internal volume. Since the antenna surface area primarily determines the pattern coverage, the antenna apertures were designed to be a compromise of these two parameters. With the antenna aperture dimensions defined, the resultant pattern coverage and gain are primarily determined by leaky su r face wave effects (ref. 27) from the ablation coating and efficiency of aperture excitation, respectively .
Preliminary Antenna Design
The first step in the preliminary design procedure for the RAM C-I C-band and X-band antennas was to build a metal mock-up of the payload to be used in conjunction with various antenna test models. The next step was t o determine the available payload space for mounting the antennas and their far-field pattern requirements. The final inputs needed for the preliminary design were trajectory information and antenna polarization requirements. The important trajectory parameter at this stage of the design was the aspect angle since this angle dictates the orientation of the far-field patterns. The aspect angle is formed by a line through the nose-to-tail axis of the payload and the line of sight from a receiving station. For the RAM C-I flight, the primary downrange receiving station is Bermuda.
Different test antenna models were designed within the preliminary guidelines of space and mounted in the RAM C-I metal mock-up in specified locations. Horn antennas were chosen rather than some other aperture-type antenna because of their simplicity and because they had been used on previous RAM flights. Since pattern coverage at X-band frequency was required over the entire 360° in the roll plane, an a r r a y of four horns was chosen. However, for C-band frequency, only one horn was required for continuous smoothed radar tracking.
After the preliminary design decision to use horns for both the C-band and X-band antenna systems was made, far-field radiation patterns were then measured to determine whether the coverage was compatible with anticipated flight conditions. Examination of these preliminary patterns for both circumferential and axial polarization clearly
60

[i APPENDIX BI
demonstrated that circumferential polarization would not be acceptable for the four-horn X-band array. The reason for the unacceptability of the X-band circumferential polarization was the occurrence of deep nulls around the entire 360° of the roll pattern. Although either vertical o r horizontal polarization gave a satisfactory C-band pattern, the downrange C-band tracking radar could receive only vertical polarization, which dictated that the C-band payload polarization be circumferential.
Once the preliminary X-band and C-band antenna design, including the choice of polarization, was completed, effort was then channeled toward refinements of the basic design. In order to make these refinements, trajectory information and a payload mock-up including the teflon heat shield were required. By using the mock-up with heat shield, more meaningful pattern and standing wave ratio measurements were made and incorporated into a final design.
Trajectory Parameters
The reentry trajectory parameters used in the final design of the C-band and X-band antennas a r e given in figure B1. The variation of altitude, velocity, elevation angle, aspect angle, and heat-shield ablation rate with time from lift-off in seconds is given in figure B2. From the standpoint of antenna design, the two most important of these parame ters a r e aspect angle and heat-shield ablation rate. The aspect angle of the trajectory dictates the orientation of the antennas with respect t o the spacecraft axis. Since the aspect angle is approximately 90° as the payload passes Bermuda, the antennas should have radiation patterns favoring the side rather than the nose o r tail of the payload. The heat-shield ablation rate has an important effect on the matching of the antennas and on radiation patterns due to trapped energy in the ablative material.
Antenna Voltage Standing Wave Ratio
A major contribution to a high VSWR on flight vehicles is frequently the impedance mismatch caused by the dielectric heat shield covering the antennas. The method commonly used to decrease the VSWR of horn antennas is to insert a proper size dielectric plug into the throat of the aperture. However, since the protective heat shield ablates during reentry, some detuning effects a r e still expected to occur. Therefore, the dielect r i c plug should be designed to allow some detuning before and after the ablation period. The heat-shield thickness on the RAM C-I before ablation is approximately 0.31 in. (0.79 cm) at the location of the C-band and X-band antennas. After ablation, the thickness is calculated to be approximately 0.11 in. (0.28 cm); this indicates that 0.2 in. (0.51 cm) of the heat shield will ablate during reentry.
The E-plane and H-plane views of the C-band horn antenna and the location of the teflon matching plug are shown in figure B3. The matched condition for the horn occurs
61

APPENDIX B
for a teflon thickness equal t o a multiple of dielectric half-wavelengths. Since 0.2 in. (0.51 cm) of the heat shield ablates during reentry, the plug plus heat shield and bonding agent should be designed 0.1 in. (0.25 cm) greater than the matched condition.
The variation of the VSWR with frequency of the C-band horn antenna on the RAM C-I is presented in figure B4. Note that the VSWR over the frequency range from 5.40 GHz to 5.8 GHz is always less than the maximum desirable preflight value of 2 t o 1. Since the horn has approximately 0.1 in. (0.25 cm) more teflon covering than is required for a matched condition, the horn is expected to become matched when 0.1 in. of the heat shield has ablated.
In designing the X-band matching plugs extra care was deemed necessary because 0.2 in. (0.51 cm) of teflon approaches -1 h at the design frequency of 9.21 GHz. This
4thickness is a sufficient amount t o mismatch the horns if the plugs are not designed properly. A drawing of the flight X-band horn antenna with matching plug is shown in figure B5.
The variation of VSWR with frequency of the four-horn-array X-band antenna on the RAM C-I is shown in figure B6. The total thickness of the matching plug, heat shield, and bonding agent on the flight payload is approximately 0.94 in. (2.39 cm). This thickness is approximately 0.06 in. (0.15 cm) greater than 1h in the dielectric. Since the X-band horns a r e designed pr imari ly for the reentry data period and the total 0.2-in. (0.51 cm) heat-shield ablation does not all occur during this t ime, less overdesign for the matching plugs of the X-band horn is required than for the matching plugs of the C -band horn.
Once the C-band and X-band matching plugs are designed and incorporated into the flight payload, no further refinements should be required unless the far-field patterns have changed so that they a r e no longer acceptable for flight.
Far- Field Patterns of C-Band Antenna
Antenna patterns were measured for different aspect angles varying from Oo t o 180°. These patterns for various aspect angles are shown in figure B7. The payload top is at @ = Oo with all patterns measured over 360° in the roll plane of the model. Note that the level of the patterns increases with an increase in aspect angle up to 80° and then decreases as the aspect angle is increased further. The reason for the symmetry around an aspect angle of 80° instead of 90° is the approximate loo half-angle of the cone-shaped payload. For tracking purposes, the patterns in figure B7 appear very adequate except for aspect angles near Oo and 180°, which are never encountered at Bermuda.
62

APPENDIX B
The curve in figure B8 gives a better idea of how the maximum pattern level varies with aspect angle. The peak gain of the horn is 7.5 dB above the isotropic level.
Far-Field Patterns of X-Band Antenna
Some typical X-band patterns measured on the RAM C-I a r e shown in figure B9. Each plot is a 360° roll-plane pattern for a specific aspect angle. The aspect angle, starting with 00,is increased in increments of loo. For all the roll-plane patterns, the payload top is at 4 = 00.
An important observation to make about most of the patterns in figure B9 is the number and magnitude of the peaks and nulls that occur in the roll plane. These variations are due to individual pattern overlap and leaky surface waves radiating around the periphery of the payload. If the payload was not covered with a layer of teflon, the individual pattern overlap would be the only contributor t o the peaks and nulls. Also, the deep variations would occur primarily in the regions between any two adjacent horns. However, since a layer of teflon is attached for thermal protection, variations also occur which can be attributed to leaky surface waves. Leaky surface waves (ref. 28) can exist for a dielectric skin thickness of zero. The equation for the different modal cutoff thicknesses t (in wavelengths) is
t = n 4 JE-1
where n is an integer representing the mode number and E is the dielectric constant. Since the dielectric constant of teflon is 2.1, t = 0.238n. Due to the boundary conditions, only the even TM (transverse magnetic) and the odd TE (transverse electric) modes can exist. Therefore, at 9.21 GHz and a teflon skin thickness of 0.31 in. (0.79 cm), only the TMo and the TE1 leaky wave modes can exist. The cutoff thickness for the TE1 mode at 9.21 GHz is approximately 0.305 in. (0.77 cm). Thus, with more than 0.005 in. (0.013 cm) of heat-shield ablation, the TE1 leaky surface wave mode can no longer be excited. The TMO mode never cuts off except for a heat-shield thickness of zero.
The effects of leaky surface wave radiation can also be observed in the c ross -polarized component of the far-field pattern. Measured patterns depicting the c ross -polarized components are shown in figure B10. These patterns were measured in the same manner as those in figure B9 except for the polarization change. The high magnitude of the patterns demonstrates that considerable cross-polarized energy is coupled out of the leaky surface waves; this should not cause undue concern, since it is possible to use the cross-polarized component to advantage. With a polarization diversity ground station, the cross-polarized component can be used to fill in many nulls in the dominantly polarized pattern. An illustration of what should be recorded with a polarization diversity system is shown in figure B11.
63

APPENDIX B
Concluding Remarks
The trajectory for the RAM C-I experiment was very compatible with reception of a strong signal f rom the payload during the pr ime data period of the mission. The high level of pattern reception was due primarily to an aspect angle near 90' for much of the flight during pr ime data transmission.
Problems encountered in antenna design were mostly those of a minor nature such as the X-band matching plug and effects of leaky surface waves on far-field patterns. Since the matching plugs were designed properly, no ser ious detuning due to heat-shield ablation was expected from either the X-band or C-band antennas unless considerably more than 0.2 in. (0.51 cm) of teflon is lost during reentry. The leaky surface wave problem was overcome by choosing the proper polarization for the payload. On the basis of the results obtained during this flight, the antenna designs were adequate.
64

--
2: 50(
7
2c 12: 40( Command programer on
6
Separation
5 1oc
0 15 30C A-Begin , n j e c t i o n A
Q, Q< 4 ccc
E X- . -
Q)a h t Q c,40 3 . 2 10 20c 0 0 rl 4 rl 4 a, Q,> =.
2
5 1oc End i n j e c t i o n - \ 25 \ \
1
0 . o . o I I 1 0 380 400 420 440 460 480
Time from lift-off, sec
Figure 61.- RAM C - I reentry trajectory.

u
I
40-1.0
35 t- 35
-.a 30 - 30
M M u 2 5 - . 25
,-I
.6 0 e
3
C0 ..I
M
a 20 -m LI
0 P4 . 4 - ::
4 15
10 - 10
14 x lo3
12 i 10 - 10 - Ablation
Y
0 .Io a 8 - B 8
4 I- 4 '
-. 2
2 - 2 5 - 5
0- 0 - 0 - 0 - 0 -
I I I I
Time from lift-off, sec
Figure B2.- Variation of RAM C - l altitude, velocity, elevation angle, aspect angle, and ablation rate w i th time from lift-off.

in. cm) Teflon Plug
2.06 in. 2.06 in. (5.23 cm)l (5.23 cm)
t+:z H-Plane E-Plane
Figure B3.- C-band horn antenna on RAM C-I .

1.0 -I I I I
Figure 64.- Var iat ion of voltage standing wave rat io w i t h frequency of t h e C-band h o r n antenna.

1.64 in. I (4.17 em)
(2.16 em)
0.54 in. (1.37 cm)
0 . 5 4 in. 1.37 cm)
Teflon Plug
2.15 in.
2.15 in. (5.46 em)
(5.46 em)
H-Plane
Figure 65.- X-band horn antenna on RAM c-1.

4 0
W
1.05
1.00
9.00 9.05 9.10 9.15 9.20 9.25 9.30 9.35 9.40
Frequency, GHZ
Figure B6.- Var iat ion of voltage standing wave rat io with frequency of four -horn-ar ray X-band antenna.

APPENDIX B
m m
m ?
I I
ICI d ~ r p e c t Angle Id) sa0 Aspect Angle
F igu re B7.- Measured C-band rol l -p lane antenna patterns for var ious aspect angles.
71

APPENDIX B
? ?
le) @ Aspect Angle
m
Figure 87.- Concluded.
72

APPENDIX B
8
7
6
5
4 Pcl -0
2 3 8 QI4
c 2 Id 0)U U
x 1
...I9 x o 2
-1
-2
-3
-4
IllllllllIlIl 20 40 60 80 100 120 140
Aspect angle, deg
Figure B8.- Var ia t ion of maximum pattern level w i th aspect angle of C-band h o r n antenna.
73

? ? m
lbl 100 Aspact Angle IC)E@ As& Angle
m m 8": 00 3.:
'" 180 '" .-fal ?On Arpkt Angle le1 40' A s k d Angle 10 So0 A S & ~ Angle
Figure 69.- Measured X-band roll-plane antenna patterns for var ious aspect angles.

mm m
b I
igi m0 ASWI Angle
?
td
(W IC@ A s k t Angle
Figure B9.- Continued.

m
In1 l3O0 As& Angle
m
W
Iq l 160' As& Angle l r l 170' A s k t Angle
Figure B9.- Concluded.
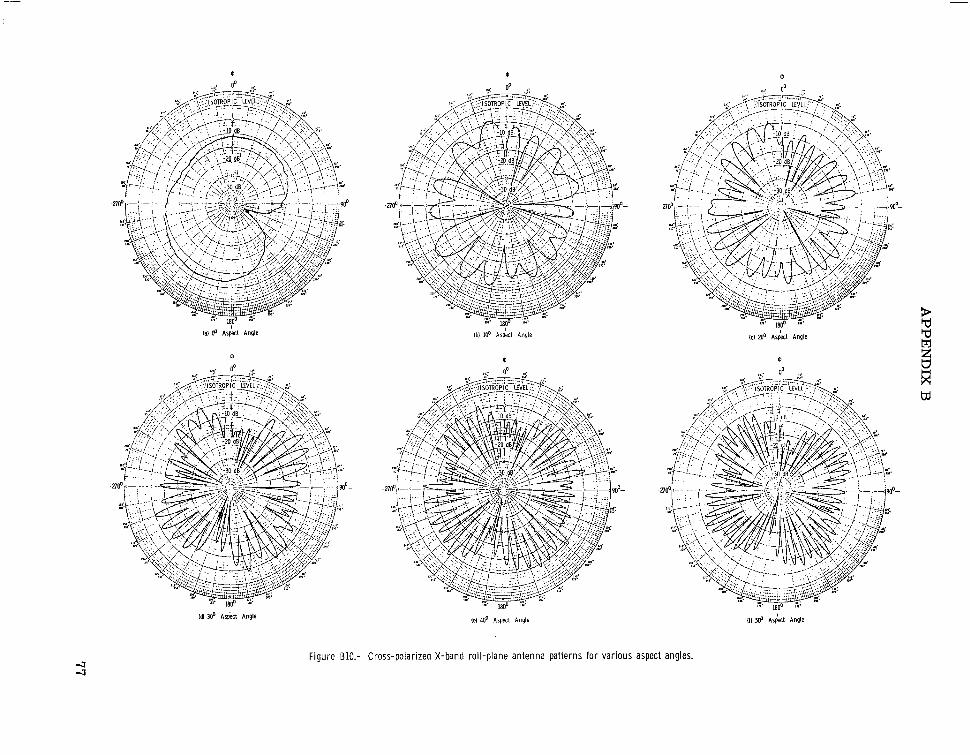
m m m
la1 ff A s h Angle Ibl I@ A r b c t Angle
m m 3%: 0'
I le1 40' Aspect Angle
Figure B10.- Cross-polarized X-band roll-plane antenna patterns fo r various aspect angles.

m m m
(gl 60' Aspect Angle Ihl 7Q0 Aspect Angle
? m
ljl 900 AS$, Angle
Figure 610.- Continued.

P m
Iql I@' A& Anglo
Figure B10.- Concluded.

APPENDIX B
m
la1 C+' Aspkt Angle
(GI 200 As& Angle Id) No A s k Angle
Figure 611.- Sum of dominant and cross-polarized far- f ie ld components as aI f u n c t i o n of roll angle for var ious aspect angles.
80

APPENDIX C
INTERPRETATION O F RAM C-I ELECTROSTATIC PROBE DATA
By W. Linwood Jones, Jr.
Introduction
The positive ion current collected by the electrostatic probe is used to measure the free-electron density of the flow-field plasma for altitudes greater than 180 000 ft (54.9 km). In relation to the flowing plasma, each ion collector appears t o be a cylindrical wire 0.010 in. (0.0254 cm) in diameter and 0.212 in. (0.5385 cm) long, which is inclined at an angle of 45O with respect t o the plasma flow. A classical electrostatic probe theory modified to account for the directed ion f lux resulting from the plasma flow is used to calculate the positive ion density. This theory has been experimentally verified to be applicable within a factor of *2 for the RAM C-I probe physical configuration at altitudes greater than 150 000 f t (45.7 km). (See ref. 15.)
Theory
In the positive-ion saturation region of the probe voltage-current characteristic, the current is
I+ = f(n+,T-,vf,m+,V,A) (C1)
where
I+ collected current
"+ positive-ion density
T, electron temperature
vf flow velocity
m+ ion mass
V probe potential
A probe area
81

APPENDIX C
Since there are four unknown variables (n+, T,, vf, m+) and only one measured quantity (I+),the quantities T,, vf, and m+ must be determined from theoretical flow-field calculations. The exact functional dependence of n+ on the other th ree unknowns is complicated; however, t o a first-order approximation
n+ v {-m+ f T,
To illustrate the data reduction procedure, a sample calculation is presented.
Sample Calculation
The following factors a r e given in the sample calculation:
Altitude 250 000 f t (76.2 km)
Ion collector 8
Measured current 50 X A
The first factor t o be calculated is the probe potential relative to the plasma potential V which is obtained from the following equation:.
v = / v o - J5kT
where
VO applied bias, -5 volts
k Boltzmann constant
e electronic charge
The electron temperature is assumed to be equal to the local gas temperature. A plot of gas temperature as a function of altitude for the ion collector locations is shown in figure C1. These temperature data as well as the flow velocity data given in figure C2 were generated by a nonequilibrium, boundary-layer-corrected flow-field analysis of the RAM C-I trajectory. For an altitude of 250 000 f t (76.2 km) and ion collector 8 , the electron temperature was calculated to be 3600O K. The probe potential V is therefore 6.551 volts.
82

APPENDIX C
The next factor to be determined is the potential-to-kinetic energy ratio for ions q, which is calculated to be
eVq = -= 21.12 (C4)kT -The ratio of ion-sheath radius to probe radius y is estimated by manipulating the
space-charge-limited diode equation in t e rms of the measured current, the probe potential, and the physical dimensions of the probe. The result is shown in figure C3 where (y - 1)is plotted as a function of the parameter 0,which is defined as
0=--(l+%) 2.66L V3/2 '�3 I+
where
probe length, 0.5385 cm
rP probe radius, 0.0127 cm
For a measured current of 50 PA, the value of 0 is 2.24 X lo7. The corresponding sheath-to-probe radius ratio y is 2.25.
The modified normalized probe current R is now determined. Figure C4 is a plot of R as a function of the modified potential-to-kinetic energy ratio H, which is defined as
H = (1 +q
s2) (C6)
The ion speed ratio s is vf sin 8
s = v+
where
Vf flow velocity, 6.35 X lo5 cm/sec
e angle between flow velocity and the cylindrical axis, 45O
v+ ion velocity, calculated to be
= 1.413 X 105 cm/sec
83
L

APPENDIX C
for m+ = 49.88 X g (theoretical positive ion concentration 95%NO+). From equation (C7) s = 3.180, and thus the value of H is 1.906. The corresponding value of R is 1.61, determined from the following equation:
R = - I+ 1
Ir (1 + s 2 y 2 where
A probe area, 0.0420 crn2
J random current density expressed as
Solving for n+ and equating n+ to Ne yields
= 3.40 X 1O1O cm-3Ne = RevJ(1 + s2)112
84
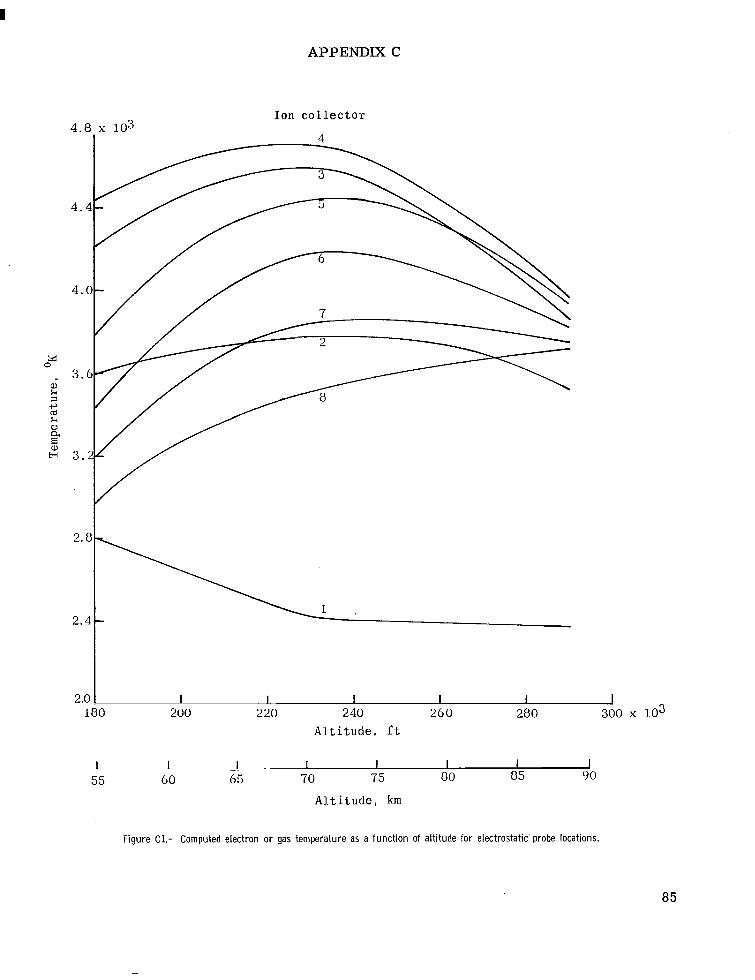
APPENDIX C
I o n co l l ec to r 4 .8 x 103
I I I I I I
85
2.0

APPENDIX C
I 300 103
I I - 1 I I I 1 J 55 60 65 70 75 a0 a5 90
A l t i t u d e , Icm
Figure C2.- Computed flow velocity as a funct ion of alt itude for electrostatic probe locations.
86
.- . ...... . ..

APPENDIX C
Y
( V o l t s 13/2 0,Ampere s
Figure C3.- (y - 1) a s a function of 0.
87

03 03
.1 1 10 100
H
Figure C4.- Normalized probe c u r r e n t R as a funct ion of modified potential-to-kinetic energy rat io H for var ious values of y .
1000
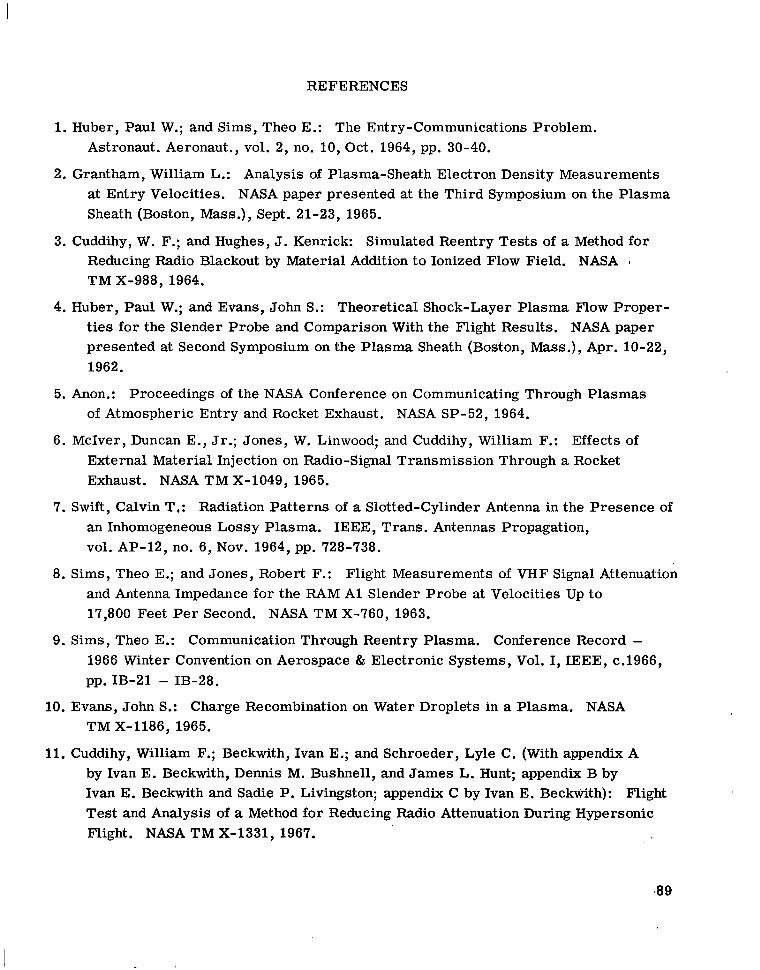
REFERENCES
1. Huber, Paul W.; and Sims, The0 E.: The Entry-Communications Problem. Astronaut. Aeronaut., vol. 2, no. 10, Oct. 1964, pp. 30-40.
2. Grantham, William L.: Analysis of Plasma-Sheath Electron Density Measurements at Entry Velocities. NASA paper presented at the Third Symposium on the Plasma Sheath (Boston, Mass.), Sept. 21-23, 1965.
3. Cuddihy, W. F.; and Hughes, J. Kenrick: Simulated Reentry Tests of a Method fo r Reducing Radio Blackout by Material Addition to Ionized Flow Field. NASA I
TM X-988, 1964.
4. Huber, Paul W.; and Evans, John S.: Theoretical Shock-Layer Plasma Flow Propert i e s for the Slender Probe and Comparison With the Flight Results. NASA paper presented at Second Symposium on the Plasma Sheath (Boston, Mass.), Apr. 10-22, 1962.
5. Anon.: Proceedings of the NASA Conference on Communicating Through Plasmas of Atmospheric Entry and Rocket Exhaust. NASA SP-52, 1964.
6. McIver, Duncan E., Jr.; Jones, W. Linwood; and Cuddihy, William F.: Effects of External Material Injection on Radio-Signal Transmission Through a Rocket Exhaust. NASA TM X-1049, 1965.
7. Swift,Calvin T,: Radiation Pat terns of a Slotted-Cylinder Antenna in the Presence of an Inhomogeneous Lossy Plasma. IEEE, Trans. Antennas Propagation, vol. AP-12, no. 6, Nov. 1964, pp. 728-738.
8. Sims, The0 E.; and Jones, Robert F.: Flight Measurements of VHF Signal Attenuation and Antenna Impedance for the RAM A1 Slender Probe at Velocities Up to 17,800 Feet Per Second. NASA TM X-760, 1963.
9. Sims, The0 E.: Communication Through Reentry Plasma. Conference Record 1966 Winter Convention on Aerospace & Electronic Systems, Vol. I, IEEE, c.1966, pp. IB-21 - IB-28.
10. Evans, John S.: Charge Recombination on Water Droplets in a Plasma. NASA TM X-1186, 1965.
11. Cuddihy, William F.; Beckwith, Ivan E.; and Schroeder, Lyle C. (With appendix A by Ivan E. Beckwith, Dennis M. Bushnell, and James L. Hunt; appendix B by Ivan E. Beckwith and Sadie P. Livingston; appendix C by Ivan E. Beckwith): Flight Test and Analysis of a Method for Reducing Radio Attenuation During Hypersonic Flight. NASA TM X-1331, 1967.

12, Evans, John S.: Reduction of Free Electron Concentration in a Reentry Plasma by Injection of Liquids. Vol. IJI of Proceedings of the Third Symposium on the Plasma Sheath - Plasma Electromagnetics of Hypersonic Flight, W. Rotman, H. Moore, R. Papa, and J. Lennon, eds., AFCRL-67-0280 (Vol. III), U.S. Air Force, May 1967, pp. 343-361.
13. Beckwith, Ivan E.; and Huffman, Jarrett K.: Injection and Distribution of Liquids in the Flow Fields of Blunt Shapes at Hypersonic Speeds. NASA TM X-989, 1964.
14. Beckwith, Ivan E.; and Bushnell, Dennis M.: Depletion of Free Electrons by Water Injection Into the Flow Fields of Hypersonic Vehicles. NASA paper presented at Third Symposium on the Plasma Sheath (Boston, Mass.), Sept. 21-23, 1965.
15. Scharfman, W. E.; and Bredfeldt, H. R.: Use of the Langmuir Probe To Determine the Electron Density and Temperature Surrounding Re-Entry Vehicles. NASA CR-66275, 1966.
16. Oseroff, Donald J.; and Pitkethly, John K.: Radio Attenuation Measurements -Series C, Flight A. NASA CR-66726, 1969.
17. Schroeder, Lyle C.; and Russo, Francis P. (With appendix by Francis P. Russo and Aubrey E. Cross): Flight Investigation and Analysis of Alleviation of Communications Blackout by Water Injection During Gemini 3 Reentry. NASA TM X-1521, 1968.
18. Sisco, W.; and Fiskin, J. M.: Shock Ionization Changes EM Propagation Characteristics. Space/Aeronaut., vol. 31, no. 3, Mar. 1959, pp. 66-70.
19. Ellis, Macon C., Jr.; and Huber, Paul W.: Radio Transmission Through the Plasma Sheath Around a Lifting Reentry Vehicle. NASA TN D-507, 1961.
20. Huber, Paul W.; and Nelson, Clifford H.: Plasma Frequency and Radio Attenuation. Proceedings of the NASA-University Conference on the Science and Technology of Space Exploration, Vol. 2, NASA SP-11, 1962, pp. 347-360. (Also available as NASA SP-25.)
21. Spencer, Dwain F.: An Evaluation of the Communication Blackout Problem for a Blunt Mars-Entry Capsule and a Potential Method for the Elimination of Blackout. Tech. Rep. No. 32-594 (Contract No. NAS 7-loo), Jet Propulsion Lab., California Inst. Technol., Apr. 15, 1964.
22. French, I. P.; and Bachynski, M. P.: The Radio Spectrum From 10 Gc to 300 Gc in Aerospace Communications. Volume V - Plasma Effects in Aerospace Communications. Res. Rep. No. 6-400-5(7-401-3)(ASD-TR-61-589, Vol. V), RCA Victor Co., Ltd. (Montreal), Mar. 1962.
90

23. Hodara, H.: The Use of Magnetic Fields in the Elimination of the Re-Entry Radio Blackout. Proc. IRE, vol. 49, no. 12, Dec. 1961, pp. 1825-1830.
24. Langberg, E.; Baldwin, K.; and Yos, J.: Radiation and Propagation of Telemetry Signals During Hypersonic Reentry. IRE Proceedings of the 1958 National Symposium on Telemetering, Section 3.2, Sept. 22-24, 1958, pp. 1-8.
25. Sutton, Kenneth; Zoby, Ernest V.; and Butler, David H.: An Evaluation Test of a fi l l-Scale Replica of the RAM-CA Flight Heat Shield in a Rocket-Engine Exhaust. NASA TM X-1841, 1969.
26. Kraus, John D.: Antennas. McGraw-Hill Book Co., Inc., 1950.
27. Elliott, Robert S.: Azimuthal Surface Waves On Circular Cylinders. J. Appl. Phys., vol. 26, no. 4,Apr. 1955, pp. 368-376.
28. Collin, Robert E.: Field Theory of Guided Waves. McGraw-Hill Book Co., Inc., 1960.
NASA-Langley, 1970 -7 L-6866 91

AERONAUTICSNATIONAL AND SPACEADMINISTRATION WASHINGTON,D. C. 20546
OFFICIAL BUSINESS FIRST CLASS MAIL
POSTAGE AND FEES PAID NATIONAL AERONAUTICS ANI
SPACE ADMINISTRATION
POSTMASTER:
"The aeroizaiitical mad space activities of the United Stntes shall be coizdztcted so as to contribute . . . to the expaizsioia of hziiiiaiz knowledge of phenomena iiz the atmosphere mad space. The Administratio.rt shall provide for the widest prncticnble and appropriate dissemi?an!io?z of inforiiintion coiacerniiag its activities and the results thereof."
-NATIONALAERONAUTICSAND SPACEACT OF 19%
If Undeliverable (Section 158 Postal Manual) Do Not Return
NASA SCIENTIFIC AND TECHNICAL PUBLICATIONS
TECHNICAL REPORTS: Scientific and technical informatiodconsidered important, complete, and a lasting contribution to existing knowledge.
TECHNICAL NOTES: Information less broad in scope but nevertheless of importance as a contribution to existing knowledge.
TECHNICAL MEMORANDUMS: Information receiving limited distribution because of preliminary data, security classification, or other reasons.
CONTRACTOR REPORTS: Scientific and technical information generated under a NASA contract or grant and considered an important contribution to existing knowledge.
TECHNICAL TRANSLATIONS: Information published in a foreign language considered to merit NASA distribution in English.
SPECIAL PUBLICATIONS: Information derived from or of value to NASA activities. Publications include conference proceedings, monographs, data compilations, handbooks, sourcebooks, and special bibliographies.
TECHNOLOGY UTILIZATION PUBLICATIONS: Information on technology used by NASA that may be of particular interest in commercial and other non-aerospace applications. Publications include Tech Briefs, Ttcllno~ogyUtilizationReports and N ~ ~ ~ ~ , and Technology Surveys.
Details on the availability of these publications may be obtained from:
SCIENTIFIC AND TECHNICAL INFORMATION DIVISION
NATIONAL AERONAUTICS AND SPACE ADMINISTRATION Washington, D.C. 20546