technical note amine reactive dyes: an effective tool to...
TRANSCRIPT

Journal of Immunological Methods 313 (2006) 199–208www.elsevier.com/locate/jim
Technical note
Amine reactive dyes: An effective tool to discriminate live and deadcells in polychromatic flow cytometry
Stephen P. Perfetto, Pratip K. Chattopadhyay, Laurie Lamoreaux, Richard Nguyen,David Ambrozak, Richard A. Koup, Mario Roederer ⁎
Immunology Laboratory, Vaccine Research Center, NIAID, NIH, 40 Convent Dr, Room 5509, Bethesda, MD 20892, United States
Received 19 January 2006; accepted 4 April 2006Available online 19 May 2006
Abstract
Membrane-damaged cells caused by either mechanical trauma or through normal biological processes can produce artifacts inimmunophenotyping analysis by flow cytometry. Dead cells can nonspecifically bind monoclonal antibody conjugates, potentiallyleading to erroneous conclusions, particularly when cell frequencies are low. To date, DNA intercalating dyes (Ethidium monoazaide(EMA), Propidium Iodide, 7AAD, etc.) or Annexin V have been commonly used to exclude dead cells; however, each suffer fromtechnical problems. The first issue with such dyes is the dependence on a consistent dead cell source for fluorescence compensation.Another major issue is the stability of the staining; except for EMA, fixation and permeablization used for intracellular stainingprocedures can cause loss of fluorescence. EMA requires a UVexposure to covalently bond to DNA; while this dye is effective and isnot affected by intracellular treatments it is weakly fluorescent. Here we report on the optimization of a new class of viability dyes, theamine reactive viability dyes (ViD) as a dead cell exclusion marker. The inclusion of ViD into the staining panel was found to besimple, reproducible and can have a significant benefit on the accuracy of identifying appropriate cell populations. We show thefluorescence of cells stained with these dyes correlates with traditional dead cell discriminating markers, even after fixation andpermeabilization. Amine reactive viability dyes are a powerful tool for fluorescence immunophenotyping experiments.Published by Elsevier B.V.
Keywords: Amine reactive dye; Cell viability; Non-specific MAB-conjugate binding
1. Introduction
Immune monitoring and vaccine immunogenicitystudies often require the measurement of low frequencycell populations. This inevitably leads to questions ofsensitivity and reproducibility, since non-specific bind-ing of monoclonal antibody (mAb)-conjugates to deadcells can lead to significant measurement errors
⁎ Corresponding author. Tel.: +1 301 594 8491; fax: +1 301 4802651.
E-mail address: [email protected] (M. Roederer).
0022-1759/$ - see front matter. Published by Elsevier B.V.doi:10.1016/j.jim.2006.04.007
(O'Brien and Bolton, 1995; Schmid et al., 1999;Perfetto et al., 2004; Maecker et al., 2005). Viabilitydyes may be used to exclude dead cells from analysis;intercalating viability dyes enter damaged cells throughopen membranes and bind DNA. However, the dye mayleak out of cells within a short period of time, leading tosignificant signal loss (Desrues et al., 1989; Costantinoet al., 1995; Clarke and Pinder, 1998). This isparticularly problematic when permeablization reagentsare used to stain intracellular molecules. This problem isavoided when using ethidium monoazide (EMA), whichcovalently binds to DNA after exposure to ultraviolet

200 S.P. Perfetto et al. / Journal of Immunological Methods 313 (2006) 199–208
(UV) light. While technically challenging, this dye isgenerally effective and unaffected by intracellulartreatments (Riedy et al., 1991).
Amine Reactive Viability Dyes (ViD) offer a newalternative to identifying dead cells. These dyes, in achemically reactive form, penetrate damaged cell mem-branes and react with amine groups in the cytoplasm. Afluorescent, and stable, product remains in the cyto-plasm. Surface amine groups also will react with thisdye, but contribute significantly less fluorescence due tothe much lower amount. These dyes come in a variety ofexcitation and emission wavelengths: green fluores-cence (GrViD) at 530±15 nm (excited by the 488 nmlaser), orange fluorescence (OrVid) at 630±11 nm(excited by the 638 nm laser), violet fluorescence(ViViD) at 430±11 (excited by the 407 nm laser) or aUVexcitable dye (UVid) emitting light at 430 nm. Thus,an important advantage offered by these dyes is theirdiversity, which allows great flexibility when designingstaining panels for multicolor flow cytometry. In thisreport, we report on the stability and reproducibility ofViD, compare their use to standard viability dyes, andfinally, examine the benefit of using them to identifydead cells in the analysis of cell populations under avariety of real-world test conditions.
2. Materials and methods
2.1. Preparation of the amine-reactive viability dye
Each amine reactive dye kit (Molecular Probes,Eugene, OR) comes as 25 μg of lyophilized dye andDMSO. DMSO is placed into a 37 °C waterbath untilcompletely thawed. Into a vial of lyophilized dye (25 ug),12.5 ul of DMSO is added (2 mg/ml) and mixedthoroughly with a pipet tip. Depending on the dye usedthe DMSO will turn from clear to colored solution,indicating the dye is dissolved. This stock sample is storedat −20 °C and vials of stock can be thawed and frozenuntil each aliquot is empty. Each working concentrationused must be pre-diluted into distilled water prior to use.Each lot is titered using cultured cells, which were pre-tested for viability using ethidium-bromide/acridineorange (green fluorescent cells are viable and the redfluorescent cells were dead) and counted on a fluorescentmicroscope. Cultures with greater than 10% cell deathwere used for titration experiments.
2.2. Amine labeled beads for fluorescence compensation
Beads coated with active amine groups (AmineModified Microspheres, Bangs Laboratories, Inc., Fish-
ers, IN) were used as compensation standards and intesting procedures. Stock beads were diluted in stainingmedia (1% heat inactivated fetal calf serum, 0.02%sodium azide in v/v of PBS) to a final concentration of40×106/ml. 40 ul of this bead preparation were mixedwith 60 ul of staining media containing a particularconcentration of ViD, as determined by preliminarytitration experiments (performed on cells). Beads wereshielded from light and incubated 20 min at roomtemperature. After incubation, 100 ul of 1%PFA wasadded for at least 30 min.
2.3. Labeling cells with ViD and monoclonal antibodies
For experiments requiring only cell surface mono-clonal antibody staining, peripheral blood mononuclearcells (PBMCs) at 1×10⁶ cells per 100 μl were stainedwith the following panel of monoclonal antibodies(mAbs, conjugated in-house unless otherwise noted):CD7-Fluorescein isothiocyanate (PharMingen), CD3-Cyanine 7-Allophycocyanin (PharMingen), CD11a-Alexa700-Phycoerythrin, CD28-Allophycocyanin(PharMingen), CD8-Quantum Dot 705, CD27-Cyanine5-Phycoerythrin, CD57-Quantum Dot 545, CD4-Cya-nine 5.5-Phycoerythrin, CCR7-Cyanine 7-Phycoery-thrin, CD45RO-Texas Red-Phycoerythrin (Coulter)and CD127-Phycoerythrin (Coulter). In addition, theappropriate amount of ViViD (Invitrogen) was added tothe antibody cocktail, which was subsequently broughtto a final volume of 100 ul in PBS. After incubation inthe dark, for 20 min (room temperature), cells werewashed twice in staining media and fixed in a finalconcentration of 0.5% paraformaldehyde.
2.4. Intracellular staining protocol
PBMCs (1×10⁶ cells/ml) were stimulated withstreptococcus enterotoxin B (SEB at 1 ug/ml) for 6h in the presence of brefeldin A (1 ug/ml) at 37 °C in aCO2 incubator. Cells were washed, resuspended in PBSand surfaced stained with the following monoclonalantibodies (mAbs, conjugated in-house unless otherwise)and ViViD (Invitrogen): CD45RO-Texas Red-Phycoer-ythrin (Coulter), CD107-Alexa680, CD8-Quantum Dot705, CD27-Cyanine 5-Phycoerythrin, CD57-QuantumDot 545, CD4-Cyanine 5.5-Phycoerythrin, ViViD (Invi-trogen) and CD14/CD20-Cascade Blue. Cells were fixedand permeabilized (Cytofix/Cytoperm, PharMingen, SanDiego, CA), then stained with CD3-Cyanine 7-Allophy-cocyanin, MIP1β-Phycoerythrin, INFγ-Fluoresceinisothiocyanate (PharMingen), IL2-Allophycocyanin(PharMingen) and TNFα-Cyanine 7-Phycoerythrin

201S.P. Perfetto et al. / Journal of Immunological Methods 313 (2006) 199–208
for 20 min at room temperature, while protected fromlight. Finally, cells were washed and fixed with a finalconcentration of 0.5% PFA.
2.5. Flow cytometry
Samples were collected using an LSR-II (BD, SanJose, CA; configured as described previously; Perfetto
Fig. 1. Staining with amine-reactive viability dyes. A) The top three histogramthree different types of amine-reactive viability dyes. Cells located to the rightthe left of this line are live cells (ViD−). The first histogram is of ViViD and fothird histograms illustrate staining of two other ViDs, the green amine-react(OrViD). The concentrations of the dyes used in the staining, shown in the g(B): The first curve is the median fluorescent intensity of the dead cells (red lilive cells (blue line) and the last curve represents the ratio of the median fluorthe live cells (black line).
et al., 2004). Various ViDs were collected using thefollowing laser and filter combinations: ViViD, 407 nmviolet DPSS laser and a 450/50 band-pass filter; GrVid,488 nm blue laser, with a 515/20 band-pass filter, and505 LP dichoric mirror; and OrVid, 532 nm green laser,with a 610/20 band-pass filter, and a 600 LP dichoricmirror. Data was analyzed using FlowJo version 6.4(Tree Star, Inc., Ashland, OR).
s illustrate the staining profile of a culture of live and dead cells usingof the black line on each histogram are dead cells (ViD+) while cells torward scatter, demonstrates a typical staining pattern and the second andive viability dye (GrViD) and the orange amine-reactive viability dyeraphics, was determined by titration experiments such as that shown inne), the second curve represents the median fluorescent intensity of theescent intensity of the dead cells to the median fluorescent intensity of

202 S.P. Perfetto et al. / Journal of Immunological Methods 313 (2006) 199–208
3. Results
3.1. Amine-reactive viability dye require titration
To ensure minimal background staining andmaximum separation, amine reactive viability dyeswere titrated using fresh PBMCs prior to use. Fig.1A (first histogram) shows the typical staining patternof PBMCs labeled with ViViD, which includes smallcells (lymphocytes and apoptotic cells) and largercells (likely monocytes). ViViD+ cells are clearlyseparated from negative cells. In general, we find thatviable monocytes stain to a larger extent with thisdye than lymphocytes, but could still be wellseparated from dead cells. Additionally, in Fig. 1A
Fig. 2. The cell morphology of ViViD+ cells is consistent with post apoptoticand stained with Wright's stain. The ViViD negative cells (live cells) showshow intact and compact nuclei with a small cytoplasmic compartment. The VThe cytoplasmic compartment was clear and the nuclei were non-compact, sare characteristic of post apoptotic or necrotic cells. B) Cells co-stained with Pshows three or perhaps four phenotypes; ViViD−PI−, ViViD+PI−, ViViD+Pconsistent with cells stained only with ViViD and described in part A of thilikely lost their nuclei or degraded the DNA to an extent that PI fluorescenc
we demonstrate the fluorescent intensity of two of theother amine reactive viability dyes, e.g. GrViD andOrViD. As would be expected from the fluorescencespectra, the relative brightness increases from ViViDto GrViD to OrViD. The optimal concentration foruse was determined as shown in Fig. 1B. For ViViD,we found that a 0.31 ug/ml concentration yieldedthe lowest background and the highest separationratio. In titrating these reagents, it may be advan-tageous to select a concentration which gives lowbackground (live cell) staining even if the signal tobackground is somewhat lower than maximum; thetrade-off is between increasing separation of thedead cells from the live cells and increasing stainingof live cells.
and/or necrotic cells. A) ViViD+ and ViViD negative cells were sortedcells with the typical morphology of normal lymphocytes. These cellsiViD+ cells (dead cells) show cells with deformed and bledding nuclei.uggesting membrane and DNA damage. These morphological changesI and ViViD were sorted and stained with Wright's stain. The histogramI+ and ViViD−PI+. The morphology of ViViD−PI− and ViViD+PI+ iss figure. ViViD+PI− cells show extreme cellular damage, which havee is absent.

203S.P. Perfetto et al. / Journal of Immunological Methods 313 (2006) 199–208
3.2. Cells stained with ViViD show characteristicmorphology of dead cells
ViViD+ cells were compared to ViViD negative(live cells) after cell sorting and staining with Wright'sstain. Fig. 2A shows ViViD negative cells withcompact nuclei and little cytoplasm, consistent withnormal lymphocyte morphology. ViViD+ cells show
Fig. 3. Correlation of ViViD staining with other viability dyes. A) This charsample stained with ViViD, annexin and EMA. The fraction of cells that falldead cells. The total fraction of the dead and apoptotic cells identified by eacthree viability markers were gated independently to calculate the individualdistribution of the total dead and apoptotic population (e.g. ViViD+ or EMA+by each of the stains (blue dots), and those that are identified only by each o
multi-lobular nuclei, increased cytoplasmic volumeand nuclear blebbing, suggesting that these cellsshow signs of morphological membrane damage andare either post apoptotic or necrotic. When cells werestained with a combination of propidium iodide (PI)and ViViD, three or perhaps four cell populations areevident (Fig. 2B). The ViViD−PI− cells were clearlylive cells and as described above demonstrated
t illustrates the percentage of all of the possible combinations of a cellinto each combination is shown for a cell sample that had nearly 40%h of the individual stains is shown in the legend. B) Cells stained withcell combinations as illustrated in Fig. 3A. Overlay plots indicate theorAnnexin+; red dots), together with the location of the cells identifiedf the stains (green dots).

204 S.P. Perfetto et al. / Journal of Immunological Methods 313 (2006) 199–208
normal lymphocyte morphology. ViViD+PI+ weredead cells displaying morphology consistent withcells with damaged membrane. ViViD+PI− cellsshow extensive membrane damage, and representcells that have lost nuclei or have degraded DNA toan extent that no PI fluorescence is detectable.Notably, these fragments may still stain with anti-bodies and yet would not be excluded by DNA-basedviability dyes.
Fig. 4. Amine beads (R-NH2) can be used as a control for compensation. Areactive viability dyes (ViViD, GrViD or OrViD). The resulting dot plot shopositively stained samples. This separation is greater than that seen for stainsetting fluorescence compensation. B) This graphic illustrates the spectral oveAs an example, the violet laser excites ViViD and the primary emission can bthe V520, V545 and V565 detectors. None of the other lasers used excited Vi(V, 405 nm violet; B, 488 nm blue; G, 532 nm green, and R, 638 nm red) andemission. The spectral profile of other detectors on a standard blue laser instrudetectors shown here.
3.3. Viability determined by ViD staining is comparableto EMA and annexin staining
Typically dead cells which have a low FSC and highSSC generally can be excluded by the lymphocyte gate(Ohen and Loken, 1982; McGann et al., 1988). However,some dead cells are found within the lymphocyte gate,indicating that gating by light scatter alone cannot excludeall dead cells. To demonstrate this, cells were stained with
) R-NH2 Beads were reacted with one of each of the different aminews the separation between the unstained bead sample (black) and theed cell populations, indicating that the beads can be good controls forrlap measured in various fluorescence detectors for all three of the ViDs.e detected in the V450 channel with only a fraction of light detected inViD. The channels are named by a letter identifying the excitation laserthe wavelength of the center of the bandpass filter in nm to detect thement (e.g. PE, Cy5PE, etc.) should be similar to that of the green-laser

Fig. 5. Amine reactive dyes are stable after fixation and permeablizationreagents. EMA labeled cells (A) andViViD labeled cells (B) show no lossof fluorescence after treatment with fixation and permeablizationreagents. As shown in Fig. 3, ViViD identifies a larger fraction of thedead cells present in the culture (prior to fixation and permeabilization).
205S.P. Perfetto et al. / Journal of Immunological Methods 313 (2006) 199–208
ViViD, Annexin and EMA and analyzed for all of thepossible staining combinations. Fig. 3A shows thepercentages associated with all combinations for theViViD positive and the ViViD negative cells. Data showthat themajority of dead cells identified by any of the threestains were identified by ViViD (Fig. 3A). The two majorpopulations were stained with all markers or co-stainedwithAnnexin andViViD. Fig. 3B shows the location of allcombinations tested as overlay plots gated on eitherViViD+ or the ViViD− cell populations. A smallpercentage of cells (Annexin+ in the first overlay asillustrated in red) are not stained with ViViD, suggestingthese cells represent a true apoptotic cell population thathas not yet suffered loss of membrane integrity. Further,we identified a small percentage of cells that stain onlywith ViViD, suggesting that this dye may be moresensitive for identification of dead cells. Back-gating onthis population shows that the vast majority of thisphenotype displays low FSC and high SSC, which ischaracteristic of dead cells (data not shown).
The next overlay illustrates the majority of the EMA+or ViViD+ are annexin+ (e.g. very few cells are coloredred). Cells, negative for both and positive for annexin(VI−AX+EM−, represented in green) are apoptoticcells, which have intact membranes. The last overlayplot (far right) illustrates the location of cells, which arenot stained by EMA (represented in red) from those thatare stained (represented by blue and green). The presenceof the VI+AX−EM− and VI+AX+EM− populationsreflect an increased level of sensitivity of the ViViDcompared to EMA. Such cells would not be excluded inan analysis procedure if EMA were used and thereforecould have an impact on background sensitivity.
3.4. ViD stained amine beads (R-NH2) for use asfluorescence compensation and stability testing
Data from beads coated with amine groups (R-NH2)and incubated separately with ViViD (purple), GrViD(green) and OrViD (red) and an unstained bead control(black) are overlayed in Fig. 4A. The results showed asignificant reaction of these dyes to the beads, as indicatedby a significant increase in fluorescent signal as comparedto the unstained control. Compared to ViD staining ofdead cells, the signal obtained with beads is much higherand therefore is ideal as a compensation control. As shownin Fig. 4B, ViViD, GrViD and OrViD-bound beads wereused to examine primary fluorescence spillover intoother (secondary) channels. ViViD fluoresces most inthe primary detector (V450, violet laser, peakemission=450 nm), with only minimal light contamina-tion in the neighboring violet detectors (V520>V545>
V565). No light was detected in any of the red, green orblue laser detectors. OrViD labeled beads showed a strongprimary signal into the G610 detector (the 610 nmemission as excited by either a 488 nm blue or 532 nmgreen laser). Finally, GrViD showed a strong primarysignal into the B515 (fluorescein) detector but was emittedinto the orange and red regions.
Stained beads incubated at 37 °C produced a slightlylower fluorescence signal than those incubated at roomtemperature, while incubation at 4 °C improved fluores-cence intensity slightly compared to RT. Comparison ofincubation periods indicated that 20 min was optimal,with slight reductions in fluorescence thereafter. LowerpH (pH=6.0) reduced fluorescence intensities comparedto neutral pH buffers (pH=7.2). ViD prepared and storedin DMSO (2 mg/ml) showed the best stability over the 6months tested without loss fluorescent intensity (data notshown, stability testing is still under investigation).
3.5. Cells retain ViD after treatment with permeabliza-tion reagents or PFA
Clinical and research studies of immune functionoften require cell stimulation and staining of intracellular
206 S.P. Perfetto et al. / Journal of Immunological Methods 313 (2006) 199–208
antigens such as cytokines; therefore, we tested ViDs andEMA after exposure to common fixation and permea-blization (fix/perm) reagents (Fig. 5). The proportion ofdead cells identified by EMA (17% and 20%, 5A) andViViD (27% and 34%, 5B) were similar, furthervalidating ViD as a method for detection of dead cells.Furthermore, with both dyes, the proportion of dead cellsincreased marginally but did not decrease after treatmentwith the fix/perm reagents. As expected this was coupledwith a typical decrease in FSC after treatment. As notedearlier, an increase in ViViD staining as compared toEMA demonstrates the increased sensitivity of thismarker.
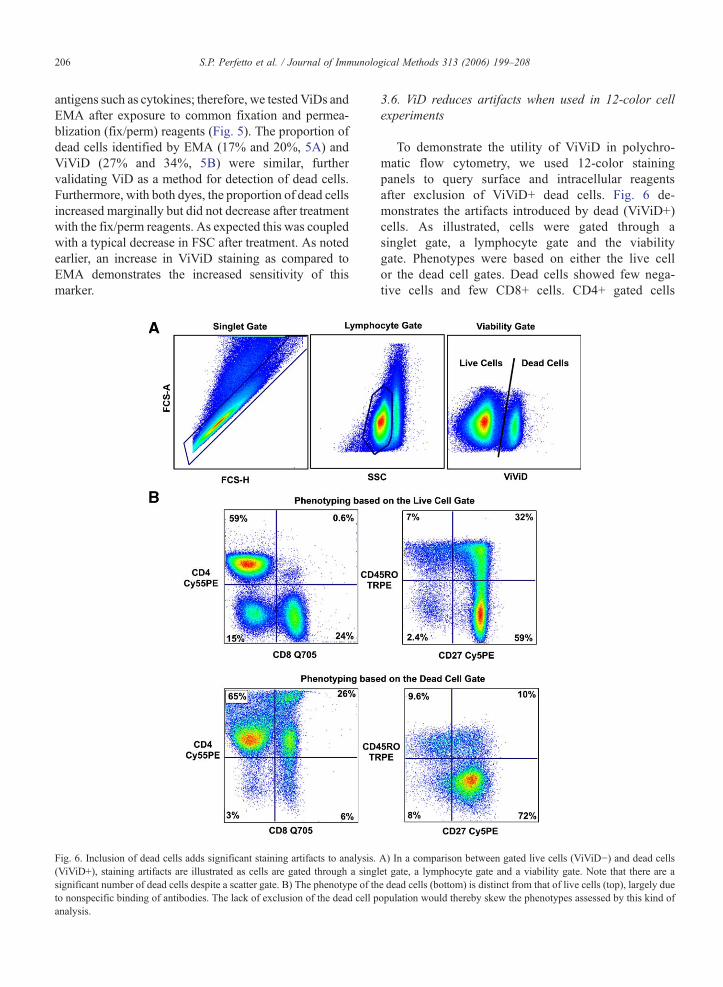
Fig. 6. Inclusion of dead cells adds significant staining artifacts to analysis.(ViViD+), staining artifacts are illustrated as cells are gated through a singsignificant number of dead cells despite a scatter gate. B) The phenotype of thto nonspecific binding of antibodies. The lack of exclusion of the dead cell panalysis.
3.6. ViD reduces artifacts when used in 12-color cellexperiments
To demonstrate the utility of ViViD in polychro-matic flow cytometry, we used 12-color stainingpanels to query surface and intracellular reagentsafter exclusion of ViViD+ dead cells. Fig. 6 de-monstrates the artifacts introduced by dead (ViViD+)cells. As illustrated, cells were gated through asinglet gate, a lymphocyte gate and the viabilitygate. Phenotypes were based on either the live cellor the dead cell gates. Dead cells showed few nega-tive cells and few CD8+ cells. CD4+ gated cells
A) In a comparison between gated live cells (ViViD−) and dead cellslet gate, a lymphocyte gate and a viability gate. Note that there are ae dead cells (bottom) is distinct from that of live cells (top), largely dueopulation would thereby skew the phenotypes assessed by this kind of

Fig. 7. Back-gated, ViViD+ cells show that the majority of “background” stimulated cells is due to the inclusion of dead cells. PBMC were treatedunder typical stimulatory conditions to identify antigen-specific T cells, but with no antigen stimulus. Cells producing cytokine under these conditionsare considered “background” stimulated cells; the more background stimulated cells, the less sensitive the assay for quantifying antigen-specific cells.A) When dead cells were not excluded, background-stimulated cells are apparent (0.55%) in a control sample. B) Back-gating on the apparentlyresponsive cells illustrates that these cells are all ViViD+; not necessarily low FSC. Using the live cell gate (C) to exclude the dead cells (ViViD+), thebackground staining was reduced to nearly zero (D).
207S.P. Perfetto et al. / Journal of Immunological Methods 313 (2006) 199–208
showed a completely different phenotype whencomparing the CD45RO vs. CD27 gated histograms.The inclusion of dead cells introduces a populationartifact, which in this example, as illustrated by un-usually high naïve CD4+ T cells (CD45RO−CD27+).Thus, the inclusion of dead cells can lead to errorsin CD4 and CD8+ T-cell enumeration and the sub-gated cell populations. The exclusion of ViViD+dead cells eliminated these problems, as most naïvecells displayed the expected CD45RO−CD27+phenotype.
In the setting of immunogenicity experiments, it isimportant to reduce background staining when tryingto detect low frequency T-cell populations (such asthose responding to peptide stimulation). Fig. 7Ashows that a sample stimulated only with CD28 andCD49d (no peptide) has 0.55% “background” stainingof CD107a+ CD4+ T-cells. Back-gating and overlay-ing the ViViD+ cells shows that all of the backgroundcells are ViViD positive (Fig. 7B). When excludingthe ViViD+ cells (excluding dead cells, Fig. 7C) thebackground staining in the CD107a+ gate decreased to0.001% (Fig. 7D).
4. Discussion
Amine reactive dyes are potentially powerful tools toidentify and remove dead cells which potentially bindmAb-conjugates non-specifically, thereby greatly im-proving the sensitivity and accuracy in immunologicalanalysis. Our results show that theViDs can be used as aneffective substitute for EMA, since all EMA positivecells are also ViD positive. Morphological changesconsistent with necrotic or post apoptotic cell character-istics was demonstrated in all sorted cell populationswhich were ViViD+. This demonstrated the specificityof the amine reactive dyes. Furthermore, cells that arePI−ViViD+ have likely lost so much DNA that PI will nolonger bind, suggesting ViViD staining is more sensitivethan DNA-intercalating dyes. When comparing ViViDto EMA and annexin, nearly all ViViD+ stained cellsaccounted for all “dead” cells, with or without annexin orEMA co-staining. Biological changes in the cellmembrane such as the increase in phosphotidylserine,which can potentially have compromised membraneintegrity and therefore bind antibody-conjugates non-specifically, should be removed from analysis. Hence,

208 S.P. Perfetto et al. / Journal of Immunological Methods 313 (2006) 199–208
the small population, which is positive only for annexin,most likely represents apoptotic cells with intactmembranes.
Staining with the ViD dyes is simple; they can beadded together with mAbs during any pre-fixationstaining step for 20 min. In addition, the amine-reactivebeads provide an effective, non-cellular based consistentfluorescence compensation control; they too require a20 min incubation at room temperature. Thus, the use ofthe ViDs introduces no significant change to standardstaining protocols.
Finally, these dyes were shown to be stable forextended periods of time under −20C conditions butstorage of pre-diluting aliquots in staining mediademonstrates a loss of activity. This suggests the dyeshould only be stored in DMSO at −20 °C until used.
ViD stained cells showed no loss of fluorescentintensity after standard fixation and permeablizationconditions. Surface stained cells with the ViD revealsdead cells, which produce artifactual cell populations.It is critical to point out that mAb-conjugates staineddead cells is a non-specific binding event and thepopulations shown in these results only representartificial cell staining patterns. Hence, a dead cellstained with an anti-CD4 conjugates may or may notrepresent cells with the CD4 molecule. Similarly, cellsstained with intracellular mAb-conjugates showedimproved functional measurement by the reduction inbackground staining as show in the example ofCD107a stained cells.
In summary, the amine reactive viability dyes aresimple to use, reproducible and eliminate cells withincreased background staining. These dyes were foundto be stable with no loss in fluorescent intensity whentreated with permeablization or fixation reagents. Sincethese dyes are excited by a variety of lasers and emitlight energy at a variety of detectors, they can be easilyincorporated into different panel strategies. In addition,other mAb-conjugates can be added with ViD to be used
as a dump channel (e.g. anti-B-cell, anti-monocyte andanti-NK cell markers for the analysis of T cell subsets).
References
Clarke, R.G., Pinder, A.C., 1998. Improved detection of bacteria byflow cytometry using a combination of antibody and viabilitymarkers. J. Appl. Microbiol. 84, 577.
Costantino, P.J., Budd, D.E., Gare, N.F., 1995. Enumeration of viableCandida albicans blastospores using tetrabromofluorescein (eosinY) and flow cytometry. Cytometry 19, 370.
Desrues, B., Collet, B., Rame, M.P., Bourel, D., Bourguet, P., Martin,A., Delaval, P., Toujas, L., Dazord, L., 1989. Distribution ofradiolabelled monoclonal antibody Po66 after intravenous injec-tion into nude mice bearing human lung cancer grafts. CancerImmunol. Immunother. 30, 295.
Maecker, H.T., Rinfret, A., D'Souza, P., Darden, J., Roig, E., Landry,C., Hayes, P., Birungi, J., Anzala, O., Garcia, M., Harari, A., Frank,I., Baydo, R., Baker, M., Holbrook, J., Ottinger, J., Lamoreaux, L.,Epling, C.L., Sinclair, E., Suni, M.A., Punt, K., Calarota, S., El-Bahi, S., Alter, G., Maila, H., Kuta, E., Cox, J., Gray, C., Altfeld,M., Nougarede, N., Boyer, J., Tussey, L., Tobery, T., Bredt, B.,Roederer, M., Koup, R., Maino, V.C., Weinhold, K., Pantaleo, G.,Gilmour, J., Horton, H., Sekaly, R.P., 2005. Standardization ofcytokine flow cytometry assays. BMC Immunol. 6, 13.
McGann, L.E., Walterson, M.L., Hogg, L.M., 1988. Light scatteringand cell volumes in osmotically stressed and frozen–thawed cells.Cytometry 9, 33.
O'Brien, M.C., Bolton, W.E., 1995. Comparison of cell viabilityprobes compatible with fixation and permeabilization for com-bined surface and intracellular staining in flow cytometry.Cytometry 19, 243.
Ohen, G.R., Loken, M.R., 1982. Two color light scattering identifiedphysical differences between lymphocyte subpopulations. Cyto-metry 3, 182.
Perfetto, S.P., Chattopadhyay, P.K., Roederer, M., 2004. Seventeen-colour flow cytometry: unravelling the immune system. Nat. Rev.,Immunol. 4, 648.
Riedy, M.C., Muirhead, K.A., Jensen, C.P., Stewart, C.C., 1991. Useof a photolabeling technique to identify nonviable cells in fixedhomologous or heterologous cell populations. Cytometry 12,133.
Schmid, I., Ferbas, J., Uittenbogaart, C.H., Giorgi, J.V., 1999. Flowcytometric analysis of live cell proliferation and phenotype inpopulations with low viability. Cytometry 35, 64.