technical level - easy way learn academy
TRANSCRIPT

Technical Level EASYWAYLEARN ACADEMY
SAHALSOFTWARE ndash SAHAL UNIVERSITY
Eng Mohamed Jama
Technical Analyses
1 Introduction Technical analysis MT4 and Tradingview
2 Part1 ndash Download Install and Demo Account ndash Laptop
3 Part2 ndash Environment Menu and Tools MT4 ndash Laptop
4 Part3 MT4 ndash Laptop ndash Drag - SL and TP and Save Template
5 Practical Tradingvewcom part1
6 Tradingvewcom part2
7 Candlesticks
8 Market Structure ndash SR and Trend
9 Price Reversal ZonendashDemand and Supply ndashRetest - Strategy
10 Trend-Lines ndash Uptrend amp Downtrend
11 Indicators (Leading and Lagging)
12 Confirmation Checklist = High Probability Trades
Technical Level EASYWAYLEARN ACADEMY
SAHALSOFTWARE ndash SAHAL UNIVERSITY
Eng Mohamed Jama
Lesson 01 Introduction Technical analysis MT4 and Tradingview
Technical analysis is a means of examining and predicting price movements in the financial
markets by using historical price charts and market statistics It is based on the idea that if a
trader can identify previous market patterns they can form a fairly accurate prediction of future
price trajectories
Technical analysis is the framework in which traders study price movement The theory is that a
person can look at historical price movements and determine the current trading conditions and
potential price movement Someone who uses technical analysis is called a technical analyst
What are the Technical Analyses
1 Technical analysis is an analysis methodology for forecasting the direction of prices
through the study of past market data
2 Technical analysis is a trading discipline employed to evaluate investments and identify
trading opportunities in price trends and patterns seen on charts Technical analysts believe
past trading activity and price changes of a security can be valuable indicators of the
securitys future price movements
3 Technical analysis is a means of examining and predicting price movements in the
financial markets by using historical price charts and market statistics It is based on the
idea that if a trader can identify previous market patterns they can form a fairly accurate
prediction of future price trajectories
Technical analysis
Technical Level EASYWAYLEARN ACADEMY
SAHALSOFTWARE ndash SAHAL UNIVERSITY
Eng Mohamed Jama
- Chart window
- Tools
- Indicators
- Candlestick Patterns
Technical Level EASYWAYLEARN ACADEMY
SAHALSOFTWARE ndash SAHAL UNIVERSITY
Eng Mohamed Jama
Technical Level EASYWAYLEARN ACADEMY
SAHALSOFTWARE ndash SAHAL UNIVERSITY
Eng Mohamed Jama
Technical Level EASYWAYLEARN ACADEMY
SAHALSOFTWARE ndash SAHAL UNIVERSITY
Eng Mohamed Jama
Technical Level EASYWAYLEARN ACADEMY
SAHALSOFTWARE ndash SAHAL UNIVERSITY
Eng Mohamed Jama
Technical Level EASYWAYLEARN ACADEMY
SAHALSOFTWARE ndash SAHAL UNIVERSITY
Eng Mohamed Jama
Technical Level EASYWAYLEARN ACADEMY
SAHALSOFTWARE ndash SAHAL UNIVERSITY
Eng Mohamed Jama
Lesson 02 Part1 ndash Download Install and Demo Account - Laptop
- Download and Install
- Demo Account
- Market Watch
- Chart Window
Technical Level EASYWAYLEARN ACADEMY
SAHALSOFTWARE ndash SAHAL UNIVERSITY
Eng Mohamed Jama
Lesson 03 Part2 ndash Environment Menu and Tools MT4 ndash Laptop
- Environment
- Menu
- Toolbars
- Tools
-----------gtgtgt Practical
Lesson 04 Part3 MT4 ndash Laptop ndash Drag - SL and TP and Save Template
-----------gtgtgt Practical
Lesson 05 Practical Tradingvewcom part1
--gtgt Practical
Lesson 06 Tradingvewcom part2
- Shortcut Tools
- Every 5 minute save
- Watchlist
- Change color background
Lesson 07 Candlesticks
Technical Level EASYWAYLEARN ACADEMY
SAHALSOFTWARE ndash SAHAL UNIVERSITY
Eng Mohamed Jama
History of candlesticks The Japanese were looking at charts as far back as the 17th century Munehisa Homma (aka Sokyu Honma) a Japanese rice trader born in the early 1700s is widely credited as being one of the early exponents of tracking price action
Each Candle Consist of 1 Open
2 Close
3 High (Upper Shaddow)
4 Low (Lower Shaddow)
5 BODY
Technical Level EASYWAYLEARN ACADEMY
SAHALSOFTWARE ndash SAHAL UNIVERSITY
Eng Mohamed Jama
Technical Level EASYWAYLEARN ACADEMY
SAHALSOFTWARE ndash SAHAL UNIVERSITY
Eng Mohamed Jama
Technical Level EASYWAYLEARN ACADEMY
SAHALSOFTWARE ndash SAHAL UNIVERSITY
Eng Mohamed Jama
Lesson 08 Market Structure ndash SR and Trend
- SUPPORT amp RESISTANCE
- Trend ndash Uptrend amp Downtrend Rang Market
- Chart Patterns Candlestick
Support and Resistance Support and Resistance is one of the most used techniques in technical analysis based on a concept thats easy to understand but difficult to master It identifies price levels where historically the price reacted either by reversing or at least by slowing down and prior price behavior at these levels can leave clues for future price behavior There are many different ways to identify these levels and to apply them in trading Support and Resistance levels can be identifiable turning points areas of congestion or psychological levels (round numbers that traders attach significance to) The higher the timeframe the more relevant the levels become
Technical Level EASYWAYLEARN ACADEMY
SAHALSOFTWARE ndash SAHAL UNIVERSITY
Eng Mohamed Jama
Technical Level EASYWAYLEARN ACADEMY
SAHALSOFTWARE ndash SAHAL UNIVERSITY
Eng Mohamed Jama
Support and Resistance trading strategy
Mark your areas of Support amp Resistance (SR)
Wait for a directional move into SR
Wait for price rejection at SR
Enter on the next candle
Use Risk Management
Create TK and SL
Note
Technical Level EASYWAYLEARN ACADEMY
SAHALSOFTWARE ndash SAHAL UNIVERSITY
Eng Mohamed Jama
Support ndash Area on your chart with potential buying pressure
Resistance ndash Area on your chart with potential selling pressure
Technical Level EASYWAYLEARN ACADEMY
SAHALSOFTWARE ndash SAHAL UNIVERSITY
Eng Mohamed Jama
Lesson 09 Price Reversal ZonendashDemand and Supply ndashRetest - Strategy
Technical Level EASYWAYLEARN ACADEMY
SAHALSOFTWARE ndash SAHAL UNIVERSITY
Eng Mohamed Jama
- Demand and Supply Zone ndash Strategy ndash
- Break out and Retest ndash Strategy
- Warning - Fake Break out -
Retracements are temporary price reversals that take place within a larger trend A reversal
on the other hand is when the trend changes direction With a reversal the price is likely to
continue in that reversal direction for an extended period
Technical Level EASYWAYLEARN ACADEMY
SAHALSOFTWARE ndash SAHAL UNIVERSITY
Eng Mohamed Jama
Technical Level EASYWAYLEARN ACADEMY
SAHALSOFTWARE ndash SAHAL UNIVERSITY
Eng Mohamed Jama
Technical Level EASYWAYLEARN ACADEMY
SAHALSOFTWARE ndash SAHAL UNIVERSITY
Eng Mohamed Jama
Technical Level EASYWAYLEARN ACADEMY
SAHALSOFTWARE ndash SAHAL UNIVERSITY
Eng Mohamed Jama
Technical Level EASYWAYLEARN ACADEMY
SAHALSOFTWARE ndash SAHAL UNIVERSITY
Eng Mohamed Jama
Technical Level EASYWAYLEARN ACADEMY
SAHALSOFTWARE ndash SAHAL UNIVERSITY
Eng Mohamed Jama
Technical Level EASYWAYLEARN ACADEMY
SAHALSOFTWARE ndash SAHAL UNIVERSITY
Eng Mohamed Jama
Technical Level EASYWAYLEARN ACADEMY
SAHALSOFTWARE ndash SAHAL UNIVERSITY
Eng Mohamed Jama
Technical Level EASYWAYLEARN ACADEMY
SAHALSOFTWARE ndash SAHAL UNIVERSITY
Eng Mohamed Jama
Lesson 10 Trend-Lines ndash Uptrend amp Downtrend
- Uptrend -gt HLHHHLHHHL ndash Swing High ndash Swing low
- Downtrend -gt HLLHLLLHLL ndash Swing low - Swing High
- Ranging Market ndash BOX
- Impulse or Run Pull Back or Correction or Retracement
Technical Level EASYWAYLEARN ACADEMY
SAHALSOFTWARE ndash SAHAL UNIVERSITY
Eng Mohamed Jama
Technical Level EASYWAYLEARN ACADEMY
SAHALSOFTWARE ndash SAHAL UNIVERSITY
Eng Mohamed Jama
Technical Level EASYWAYLEARN ACADEMY
SAHALSOFTWARE ndash SAHAL UNIVERSITY
Eng Mohamed Jama
Technical Level EASYWAYLEARN ACADEMY
SAHALSOFTWARE ndash SAHAL UNIVERSITY
Eng Mohamed Jama
Technical Level EASYWAYLEARN ACADEMY
SAHALSOFTWARE ndash SAHAL UNIVERSITY
Eng Mohamed Jama
Technical Level EASYWAYLEARN ACADEMY
SAHALSOFTWARE ndash SAHAL UNIVERSITY
Eng Mohamed Jama
Break and Retest Strategy
Waiting for a Retest Will Make You a Better Forex Trader
Technical Level EASYWAYLEARN ACADEMY
SAHALSOFTWARE ndash SAHAL UNIVERSITY
Eng Mohamed Jama
Technical Level EASYWAYLEARN ACADEMY
SAHALSOFTWARE ndash SAHAL UNIVERSITY
Eng Mohamed Jama
Lesson 11 Indicators (Leading and Lagging)
+ RSI Indicator
Leading and lagging indicators what you need to know
Technical traders use indicators to identify market patterns and
trends Most of these indicators fall into two categories leading
and lagging Discover some popular leading and lagging
indicators and how to use them
Technical Level EASYWAYLEARN ACADEMY
SAHALSOFTWARE ndash SAHAL UNIVERSITY
Eng Mohamed Jama
What is a leading technical indicator
A leading indicator is a tool designed to anticipate the future direction
of a market in order to enable traders to predict market movements
ahead of time
Technical Level EASYWAYLEARN ACADEMY
SAHALSOFTWARE ndash SAHAL UNIVERSITY
Eng Mohamed Jama
In theory if a leading indicator gives the correct signal a trader can
get in before the market movement and ride the entire trend However
leading indicators are by no means 100 accurate which is why they
are often combined with other forms of technical analysis
What is a lagging technical indicator
A lagging indicator is a tool that provides delayed feedback which
means it gives a signal once the price movement has already passed
Technical Level EASYWAYLEARN ACADEMY
SAHALSOFTWARE ndash SAHAL UNIVERSITY
Eng Mohamed Jama
or is in progress These are used by traders to confirm the price trend
before they enter a trade
These indicators are commonly used by trend traders ndash they donrsquot
show any upcoming price moves but confirm that a trend is underway
This tends to give traders more confidence that they are correct in
their assumptions rather than providing a specific trigger for entering
the market
Technical Level EASYWAYLEARN ACADEMY
SAHALSOFTWARE ndash SAHAL UNIVERSITY
Eng Mohamed Jama
Leading vs lagging technical indicators
whatrsquos the difference
The most obvious difference is that leading indicators predict market
movements while lagging indicators confirm trends that are already
taking place Both leading and lagging indicators have their own
advantages and drawbacks so itrsquos crucial to familiarise yourself with
how each works and decide which fits in with your strategy
Leading indicators react to prices quickly which can be great for
short-term traders but makes them prone to giving out false signals ndash
these happen when a signal indicates itrsquos time to enter the market but
the trend promptly reverses Conversely lagging indicators are far
slower to react which means that traders would have more accuracy
but could be late in entering the market
Relying solely on either could have negative effects on a strategy
which is why many traders will aim to find a balance of the two
Technical Level EASYWAYLEARN ACADEMY
SAHALSOFTWARE ndash SAHAL UNIVERSITY
Eng Mohamed Jama
Four popular leading indicators
Popular leading indicators include
1 The relative strength index (RSI)
2 The stochastic oscillator
3 Williams R
4 On-balance volume (OBV)
A lot of popular leading indicators fall into the category of oscillators as
these can identify a possible trend reversal before it happens
However not all leading indicators will use the same calculations so
there is the possibility that different indicators will show different
signals
Relative strength index (RSI)
The relative strength index (RSI) is a momentum indicator which
traders can use to identify whether a market is overbought or
Technical Level EASYWAYLEARN ACADEMY
SAHALSOFTWARE ndash SAHAL UNIVERSITY
Eng Mohamed Jama
oversold When the RSI gives a signal it is believed that the market
will reverse ndash this provides a leading sign that a trader should enter or
exit a position
The RSI is an oscillator so it is shown on a scale from zero to 100 If
the RSI is above 70 the market would often be thought of as
overbought and appear as red on the chart (below) And if the
indicator falls below the 30 level the market is usually considered
oversold and will appear in green on the chart
Technical Level EASYWAYLEARN ACADEMY
SAHALSOFTWARE ndash SAHAL UNIVERSITY
Eng Mohamed Jama
As mentioned the danger with leading indicators is that they can
provide premature or false signals With the RSI it is possible that the
market will sustain overbought or oversold conditions for long periods
of time without reversing This makes it important to have suitable risk
management measures in place such as stops and limits
Stochastic oscillator
Another popular example of a leading indicator is the stochastic
oscillator which is used to compare recent closing prices to the
previous trading range
The stochastic is based on the idea that market momentum changes
direction much faster than volume or price so it can be used to predict
the direction of market movements If the oscillator reaches a reading
of 80 or over the market would be considered overbought while
anything under 20 would be thought of as oversold
Technical Level EASYWAYLEARN ACADEMY
SAHALSOFTWARE ndash SAHAL UNIVERSITY
Eng Mohamed Jama
The oscillator is shown as two lines on the chart the K (the black
line on the chart below) and the D (the red dotted line below) When
these two lines cross it is seen as a leading signal that a change in
market direction is approaching
During volatile market conditions the stochastic is prone to false
signals To prevent this impacting your trades you could use the
stochastic in conjunction with other indicators or use it as a filter for
Technical Level EASYWAYLEARN ACADEMY
SAHALSOFTWARE ndash SAHAL UNIVERSITY
Eng Mohamed Jama
your trades rather than a trigger This would mean entering the market
once the trend is confirmed as you would with a lagging indicator
Williams R
The Williams percent range more commonly known as the Williams
R is very similar to the stochastic oscillator The main difference
being that it works on a negative scale ndash so it ranges between zero
and -100 and uses -20 and -80 as the overbought and oversold
signals respectively
So on the below chart the green line below -80 indicates that the
price is likely to rise While the red line above -20 indicates the price is
likely to fall
Technical Level EASYWAYLEARN ACADEMY
SAHALSOFTWARE ndash SAHAL UNIVERSITY
Eng Mohamed Jama
The indicator is highly responsive meaning it might start to move to
highs or lows even if the actual market price does not follow suit As
the Williams R is leading these signals can be premature and less
reliable than other entry signals which is why some traders prefer to
use -10 and -90 as more extreme price signals
On-balance volume (OBV)
Technical Level EASYWAYLEARN ACADEMY
SAHALSOFTWARE ndash SAHAL UNIVERSITY
Eng Mohamed Jama
On-balance volume (OBV) is another leading momentum-based
indicator It looks at volume to enable traders to make predictions
about the market price ndash OBV is largely used in shares trading as
volume is well documented by stock exchanges
Traders who use OBV as a leading indicator will focus on increases or
decreases in volume without the equivalent change in price This is
believed to be an indication that the price will increase or decrease
imminently
As a leading indicator OBV is prone to giving false signals especially
as the indicator can be thrown off by huge spikes in volume around
announcements that surprise the market Although volume changes
this is not always indicative of a trend and can cause traders to open
positions prematurely
As with the other leading indicators the OBV is often used in
conjunction with lagging indicators and a thorough risk management
strategy
Technical Level EASYWAYLEARN ACADEMY
SAHALSOFTWARE ndash SAHAL UNIVERSITY
Eng Mohamed Jama
Three popular lagging indicators
Popular lagging indicators include
1 Moving averages
2 The MACD indicator
3 Bollinger bands
Lagging indicators are primarily used to filter out the noise from short-
term market movements and confirm long-term trends They are
usually drawn onto the price chart itself unlike leading indicators
which usually appear in separate windows
Moving averages
Moving averages (MAs) are categorized as a lagging indicator
because they are based on historical data
Buy and sell signals are generated when the price line crosses the MA
or when two MA lines cross each other However because the moving
average is calculated using previous price points the current market
price will be ahead of the MA
Technical Level EASYWAYLEARN ACADEMY
SAHALSOFTWARE ndash SAHAL UNIVERSITY
Eng Mohamed Jama
In the below 50-day MA example the moving average has crossed
the price from above indicating an upward reversal is imminent
However we can see that the MA is slower to pick up the bullish trend
when it does occur
Moving averages can be calculated over any timeframe depending on
the traderrsquos goals ndash but the longer the time frame the longer the lag
Technical Level EASYWAYLEARN ACADEMY
SAHALSOFTWARE ndash SAHAL UNIVERSITY
Eng Mohamed Jama
So a MA of 300 days would have a far longer delay than an MA of 50
days
It is possible for lagging indicators to give off false signals but it is less
likely as they are slower to react
MACD indicator
Moving averages can be used on their own or they can be the basis
of other technical indicators such as the moving average
convergence divergence (MACD) As it is based on MAs the MACD is
inherently a trend-following or lagging indicator However it has been
argued that different components of the MACD provide traders with
different opportunities
There are three components to the tool two moving averages and a
histogram The two moving averages (the signal line and the MACD
line) are invariably lagging indicators as they only provide signals
once the two lines have crossed each other by which time the trend is
already in motion
Technical Level EASYWAYLEARN ACADEMY
SAHALSOFTWARE ndash SAHAL UNIVERSITY
Eng Mohamed Jama
Source IG charts
But the MACD histogram is sometimes considered a leading indicator
as it is used to anticipate signal crossovers in between the two moving
averages The bars on the histogram represents the difference
between the two MAs ndash as the bars move further away from the
central zero line it means the MAs are moving further apart Once this
expansion is over a lsquohumprsquo appears on the histogram which is a sign
the MAs will tighten again and a crossover will occur
Technical Level EASYWAYLEARN ACADEMY
SAHALSOFTWARE ndash SAHAL UNIVERSITY
Eng Mohamed Jama
Although the histogram can be used to enter positions ahead of the
crossovers the moving averages inherently fall behind the market
price So in general it is a lagging indicator This means that there are
instances where the market price may reach a reversal point before
the signal has even been generated ndash which would be deemed a false
signal
Bollinger bands
The Bollinger band tool is a lagging indicator as it is based on a 20-
day simple moving average (SMA) and two outer lines These outer
bands represent the positive and negative standard deviations away
from the SMA and are used as a measure of volatility When levels of
volatility increase the bands will widen and as volatility decreases
they will contract
When the price reaches the outer bands of the Bollinger it often acts
as a trigger for the market to rebound back towards the central 20-
period moving average
Technical Level EASYWAYLEARN ACADEMY
SAHALSOFTWARE ndash SAHAL UNIVERSITY
Eng Mohamed Jama
Source IG charts
There are strategies that suggest the bands have leading indicator
properties but alone they do not give out leading trading signals
Bollinger bands can give no indication of exactly when the change in
volatility might take place or which direction the price will move in
They are merely a sign that a breakout could soon take place giving
bullish and bearish signals
Technical Level EASYWAYLEARN ACADEMY
SAHALSOFTWARE ndash SAHAL UNIVERSITY
Eng Mohamed Jama
This is why traders will often confirm the Bollinger band signals with
price action or use the indicator in conjunction with other lagging tools
or leading indicators such as the RSI
Leading and lagging technical indicators
summed up
A leading indicator is a tool designed to anticipate the future direction
of a market
A lagging indicator is a tool that gives signal once the price movement
has already started
Leading indicators react to prices quickly but this makes them prone to
giving out false signals
Lagging indicators can be more accurate but this is because they are
far slower to react
A lot of popular leading indicators fall into the category of oscillators
including the RSI stochastic oscillator Williams R and OBV
Lagging indicators are drawn onto the price chart itself and include
moving averages the MACD and Bollinger bands
Technical Level EASYWAYLEARN ACADEMY
SAHALSOFTWARE ndash SAHAL UNIVERSITY
Eng Mohamed Jama
Relying solely on either could have negative effects on a strategy
which is why many traders will aim to find a balance of the two
If you feel ready to start using lagging and leading indicators on live
markets you can open an account with IG today Alternatively you
can learn more about financial markets with IG Academy
Lesson 12 Confirmation Checklist = High Probability Trades
Technical Level EASYWAYLEARN ACADEMY
SAHALSOFTWARE ndash SAHAL UNIVERSITY
Eng Mohamed Jama
SupportResistance
Price Reversal Zone
Trend-Line
Pull Back
Technical Level EASYWAYLEARN ACADEMY
SAHALSOFTWARE ndash SAHAL UNIVERSITY
Eng Mohamed Jama
Technical Level EASYWAYLEARN ACADEMY
SAHALSOFTWARE ndash SAHAL UNIVERSITY
Eng Mohamed Jama
Technical Level EASYWAYLEARN ACADEMY
SAHALSOFTWARE ndash SAHAL UNIVERSITY
Eng Mohamed Jama
Technical Level EASYWAYLEARN ACADEMY
SAHALSOFTWARE ndash SAHAL UNIVERSITY
Eng Mohamed Jama
END
Technical Level EASYWAYLEARN ACADEMY
SAHALSOFTWARE ndash SAHAL UNIVERSITY
Eng Mohamed Jama

Technical Level EASYWAYLEARN ACADEMY
SAHALSOFTWARE ndash SAHAL UNIVERSITY
Eng Mohamed Jama
Technical Level EASYWAYLEARN ACADEMY
SAHALSOFTWARE ndash SAHAL UNIVERSITY
Eng Mohamed Jama
Technical Level EASYWAYLEARN ACADEMY
SAHALSOFTWARE ndash SAHAL UNIVERSITY
Eng Mohamed Jama
Technical Level EASYWAYLEARN ACADEMY
SAHALSOFTWARE ndash SAHAL UNIVERSITY
Eng Mohamed Jama
Technical Level EASYWAYLEARN ACADEMY
SAHALSOFTWARE ndash SAHAL UNIVERSITY
Eng Mohamed Jama
Technical Level EASYWAYLEARN ACADEMY
SAHALSOFTWARE ndash SAHAL UNIVERSITY
Eng Mohamed Jama
Lesson 02 Part1 ndash Download Install and Demo Account - Laptop
- Download and Install
- Demo Account
- Market Watch
- Chart Window
Technical Level EASYWAYLEARN ACADEMY
SAHALSOFTWARE ndash SAHAL UNIVERSITY
Eng Mohamed Jama
Lesson 03 Part2 ndash Environment Menu and Tools MT4 ndash Laptop
- Environment
- Menu
- Toolbars
- Tools
-----------gtgtgt Practical
Lesson 04 Part3 MT4 ndash Laptop ndash Drag - SL and TP and Save Template
-----------gtgtgt Practical
Lesson 05 Practical Tradingvewcom part1
--gtgt Practical
Lesson 06 Tradingvewcom part2
- Shortcut Tools
- Every 5 minute save
- Watchlist
- Change color background
Lesson 07 Candlesticks
Technical Level EASYWAYLEARN ACADEMY
SAHALSOFTWARE ndash SAHAL UNIVERSITY
Eng Mohamed Jama
History of candlesticks The Japanese were looking at charts as far back as the 17th century Munehisa Homma (aka Sokyu Honma) a Japanese rice trader born in the early 1700s is widely credited as being one of the early exponents of tracking price action
Each Candle Consist of 1 Open
2 Close
3 High (Upper Shaddow)
4 Low (Lower Shaddow)
5 BODY
Technical Level EASYWAYLEARN ACADEMY
SAHALSOFTWARE ndash SAHAL UNIVERSITY
Eng Mohamed Jama
Technical Level EASYWAYLEARN ACADEMY
SAHALSOFTWARE ndash SAHAL UNIVERSITY
Eng Mohamed Jama
Technical Level EASYWAYLEARN ACADEMY
SAHALSOFTWARE ndash SAHAL UNIVERSITY
Eng Mohamed Jama
Lesson 08 Market Structure ndash SR and Trend
- SUPPORT amp RESISTANCE
- Trend ndash Uptrend amp Downtrend Rang Market
- Chart Patterns Candlestick
Support and Resistance Support and Resistance is one of the most used techniques in technical analysis based on a concept thats easy to understand but difficult to master It identifies price levels where historically the price reacted either by reversing or at least by slowing down and prior price behavior at these levels can leave clues for future price behavior There are many different ways to identify these levels and to apply them in trading Support and Resistance levels can be identifiable turning points areas of congestion or psychological levels (round numbers that traders attach significance to) The higher the timeframe the more relevant the levels become
Technical Level EASYWAYLEARN ACADEMY
SAHALSOFTWARE ndash SAHAL UNIVERSITY
Eng Mohamed Jama
Technical Level EASYWAYLEARN ACADEMY
SAHALSOFTWARE ndash SAHAL UNIVERSITY
Eng Mohamed Jama
Support and Resistance trading strategy
Mark your areas of Support amp Resistance (SR)
Wait for a directional move into SR
Wait for price rejection at SR
Enter on the next candle
Use Risk Management
Create TK and SL
Note
Technical Level EASYWAYLEARN ACADEMY
SAHALSOFTWARE ndash SAHAL UNIVERSITY
Eng Mohamed Jama
Support ndash Area on your chart with potential buying pressure
Resistance ndash Area on your chart with potential selling pressure
Technical Level EASYWAYLEARN ACADEMY
SAHALSOFTWARE ndash SAHAL UNIVERSITY
Eng Mohamed Jama
Lesson 09 Price Reversal ZonendashDemand and Supply ndashRetest - Strategy
Technical Level EASYWAYLEARN ACADEMY
SAHALSOFTWARE ndash SAHAL UNIVERSITY
Eng Mohamed Jama
- Demand and Supply Zone ndash Strategy ndash
- Break out and Retest ndash Strategy
- Warning - Fake Break out -
Retracements are temporary price reversals that take place within a larger trend A reversal
on the other hand is when the trend changes direction With a reversal the price is likely to
continue in that reversal direction for an extended period
Technical Level EASYWAYLEARN ACADEMY
SAHALSOFTWARE ndash SAHAL UNIVERSITY
Eng Mohamed Jama
Technical Level EASYWAYLEARN ACADEMY
SAHALSOFTWARE ndash SAHAL UNIVERSITY
Eng Mohamed Jama
Technical Level EASYWAYLEARN ACADEMY
SAHALSOFTWARE ndash SAHAL UNIVERSITY
Eng Mohamed Jama
Technical Level EASYWAYLEARN ACADEMY
SAHALSOFTWARE ndash SAHAL UNIVERSITY
Eng Mohamed Jama
Technical Level EASYWAYLEARN ACADEMY
SAHALSOFTWARE ndash SAHAL UNIVERSITY
Eng Mohamed Jama
Technical Level EASYWAYLEARN ACADEMY
SAHALSOFTWARE ndash SAHAL UNIVERSITY
Eng Mohamed Jama
Technical Level EASYWAYLEARN ACADEMY
SAHALSOFTWARE ndash SAHAL UNIVERSITY
Eng Mohamed Jama
Technical Level EASYWAYLEARN ACADEMY
SAHALSOFTWARE ndash SAHAL UNIVERSITY
Eng Mohamed Jama
Technical Level EASYWAYLEARN ACADEMY
SAHALSOFTWARE ndash SAHAL UNIVERSITY
Eng Mohamed Jama
Lesson 10 Trend-Lines ndash Uptrend amp Downtrend
- Uptrend -gt HLHHHLHHHL ndash Swing High ndash Swing low
- Downtrend -gt HLLHLLLHLL ndash Swing low - Swing High
- Ranging Market ndash BOX
- Impulse or Run Pull Back or Correction or Retracement
Technical Level EASYWAYLEARN ACADEMY
SAHALSOFTWARE ndash SAHAL UNIVERSITY
Eng Mohamed Jama
Technical Level EASYWAYLEARN ACADEMY
SAHALSOFTWARE ndash SAHAL UNIVERSITY
Eng Mohamed Jama
Technical Level EASYWAYLEARN ACADEMY
SAHALSOFTWARE ndash SAHAL UNIVERSITY
Eng Mohamed Jama
Technical Level EASYWAYLEARN ACADEMY
SAHALSOFTWARE ndash SAHAL UNIVERSITY
Eng Mohamed Jama
Technical Level EASYWAYLEARN ACADEMY
SAHALSOFTWARE ndash SAHAL UNIVERSITY
Eng Mohamed Jama
Technical Level EASYWAYLEARN ACADEMY
SAHALSOFTWARE ndash SAHAL UNIVERSITY
Eng Mohamed Jama
Break and Retest Strategy
Waiting for a Retest Will Make You a Better Forex Trader
Technical Level EASYWAYLEARN ACADEMY
SAHALSOFTWARE ndash SAHAL UNIVERSITY
Eng Mohamed Jama
Technical Level EASYWAYLEARN ACADEMY
SAHALSOFTWARE ndash SAHAL UNIVERSITY
Eng Mohamed Jama
Lesson 11 Indicators (Leading and Lagging)
+ RSI Indicator
Leading and lagging indicators what you need to know
Technical traders use indicators to identify market patterns and
trends Most of these indicators fall into two categories leading
and lagging Discover some popular leading and lagging
indicators and how to use them
Technical Level EASYWAYLEARN ACADEMY
SAHALSOFTWARE ndash SAHAL UNIVERSITY
Eng Mohamed Jama
What is a leading technical indicator
A leading indicator is a tool designed to anticipate the future direction
of a market in order to enable traders to predict market movements
ahead of time
Technical Level EASYWAYLEARN ACADEMY
SAHALSOFTWARE ndash SAHAL UNIVERSITY
Eng Mohamed Jama
In theory if a leading indicator gives the correct signal a trader can
get in before the market movement and ride the entire trend However
leading indicators are by no means 100 accurate which is why they
are often combined with other forms of technical analysis
What is a lagging technical indicator
A lagging indicator is a tool that provides delayed feedback which
means it gives a signal once the price movement has already passed
Technical Level EASYWAYLEARN ACADEMY
SAHALSOFTWARE ndash SAHAL UNIVERSITY
Eng Mohamed Jama
or is in progress These are used by traders to confirm the price trend
before they enter a trade
These indicators are commonly used by trend traders ndash they donrsquot
show any upcoming price moves but confirm that a trend is underway
This tends to give traders more confidence that they are correct in
their assumptions rather than providing a specific trigger for entering
the market
Technical Level EASYWAYLEARN ACADEMY
SAHALSOFTWARE ndash SAHAL UNIVERSITY
Eng Mohamed Jama
Leading vs lagging technical indicators
whatrsquos the difference
The most obvious difference is that leading indicators predict market
movements while lagging indicators confirm trends that are already
taking place Both leading and lagging indicators have their own
advantages and drawbacks so itrsquos crucial to familiarise yourself with
how each works and decide which fits in with your strategy
Leading indicators react to prices quickly which can be great for
short-term traders but makes them prone to giving out false signals ndash
these happen when a signal indicates itrsquos time to enter the market but
the trend promptly reverses Conversely lagging indicators are far
slower to react which means that traders would have more accuracy
but could be late in entering the market
Relying solely on either could have negative effects on a strategy
which is why many traders will aim to find a balance of the two
Technical Level EASYWAYLEARN ACADEMY
SAHALSOFTWARE ndash SAHAL UNIVERSITY
Eng Mohamed Jama
Four popular leading indicators
Popular leading indicators include
1 The relative strength index (RSI)
2 The stochastic oscillator
3 Williams R
4 On-balance volume (OBV)
A lot of popular leading indicators fall into the category of oscillators as
these can identify a possible trend reversal before it happens
However not all leading indicators will use the same calculations so
there is the possibility that different indicators will show different
signals
Relative strength index (RSI)
The relative strength index (RSI) is a momentum indicator which
traders can use to identify whether a market is overbought or
Technical Level EASYWAYLEARN ACADEMY
SAHALSOFTWARE ndash SAHAL UNIVERSITY
Eng Mohamed Jama
oversold When the RSI gives a signal it is believed that the market
will reverse ndash this provides a leading sign that a trader should enter or
exit a position
The RSI is an oscillator so it is shown on a scale from zero to 100 If
the RSI is above 70 the market would often be thought of as
overbought and appear as red on the chart (below) And if the
indicator falls below the 30 level the market is usually considered
oversold and will appear in green on the chart
Technical Level EASYWAYLEARN ACADEMY
SAHALSOFTWARE ndash SAHAL UNIVERSITY
Eng Mohamed Jama
As mentioned the danger with leading indicators is that they can
provide premature or false signals With the RSI it is possible that the
market will sustain overbought or oversold conditions for long periods
of time without reversing This makes it important to have suitable risk
management measures in place such as stops and limits
Stochastic oscillator
Another popular example of a leading indicator is the stochastic
oscillator which is used to compare recent closing prices to the
previous trading range
The stochastic is based on the idea that market momentum changes
direction much faster than volume or price so it can be used to predict
the direction of market movements If the oscillator reaches a reading
of 80 or over the market would be considered overbought while
anything under 20 would be thought of as oversold
Technical Level EASYWAYLEARN ACADEMY
SAHALSOFTWARE ndash SAHAL UNIVERSITY
Eng Mohamed Jama
The oscillator is shown as two lines on the chart the K (the black
line on the chart below) and the D (the red dotted line below) When
these two lines cross it is seen as a leading signal that a change in
market direction is approaching
During volatile market conditions the stochastic is prone to false
signals To prevent this impacting your trades you could use the
stochastic in conjunction with other indicators or use it as a filter for
Technical Level EASYWAYLEARN ACADEMY
SAHALSOFTWARE ndash SAHAL UNIVERSITY
Eng Mohamed Jama
your trades rather than a trigger This would mean entering the market
once the trend is confirmed as you would with a lagging indicator
Williams R
The Williams percent range more commonly known as the Williams
R is very similar to the stochastic oscillator The main difference
being that it works on a negative scale ndash so it ranges between zero
and -100 and uses -20 and -80 as the overbought and oversold
signals respectively
So on the below chart the green line below -80 indicates that the
price is likely to rise While the red line above -20 indicates the price is
likely to fall
Technical Level EASYWAYLEARN ACADEMY
SAHALSOFTWARE ndash SAHAL UNIVERSITY
Eng Mohamed Jama
The indicator is highly responsive meaning it might start to move to
highs or lows even if the actual market price does not follow suit As
the Williams R is leading these signals can be premature and less
reliable than other entry signals which is why some traders prefer to
use -10 and -90 as more extreme price signals
On-balance volume (OBV)
Technical Level EASYWAYLEARN ACADEMY
SAHALSOFTWARE ndash SAHAL UNIVERSITY
Eng Mohamed Jama
On-balance volume (OBV) is another leading momentum-based
indicator It looks at volume to enable traders to make predictions
about the market price ndash OBV is largely used in shares trading as
volume is well documented by stock exchanges
Traders who use OBV as a leading indicator will focus on increases or
decreases in volume without the equivalent change in price This is
believed to be an indication that the price will increase or decrease
imminently
As a leading indicator OBV is prone to giving false signals especially
as the indicator can be thrown off by huge spikes in volume around
announcements that surprise the market Although volume changes
this is not always indicative of a trend and can cause traders to open
positions prematurely
As with the other leading indicators the OBV is often used in
conjunction with lagging indicators and a thorough risk management
strategy
Technical Level EASYWAYLEARN ACADEMY
SAHALSOFTWARE ndash SAHAL UNIVERSITY
Eng Mohamed Jama
Three popular lagging indicators
Popular lagging indicators include
1 Moving averages
2 The MACD indicator
3 Bollinger bands
Lagging indicators are primarily used to filter out the noise from short-
term market movements and confirm long-term trends They are
usually drawn onto the price chart itself unlike leading indicators
which usually appear in separate windows
Moving averages
Moving averages (MAs) are categorized as a lagging indicator
because they are based on historical data
Buy and sell signals are generated when the price line crosses the MA
or when two MA lines cross each other However because the moving
average is calculated using previous price points the current market
price will be ahead of the MA
Technical Level EASYWAYLEARN ACADEMY
SAHALSOFTWARE ndash SAHAL UNIVERSITY
Eng Mohamed Jama
In the below 50-day MA example the moving average has crossed
the price from above indicating an upward reversal is imminent
However we can see that the MA is slower to pick up the bullish trend
when it does occur
Moving averages can be calculated over any timeframe depending on
the traderrsquos goals ndash but the longer the time frame the longer the lag
Technical Level EASYWAYLEARN ACADEMY
SAHALSOFTWARE ndash SAHAL UNIVERSITY
Eng Mohamed Jama
So a MA of 300 days would have a far longer delay than an MA of 50
days
It is possible for lagging indicators to give off false signals but it is less
likely as they are slower to react
MACD indicator
Moving averages can be used on their own or they can be the basis
of other technical indicators such as the moving average
convergence divergence (MACD) As it is based on MAs the MACD is
inherently a trend-following or lagging indicator However it has been
argued that different components of the MACD provide traders with
different opportunities
There are three components to the tool two moving averages and a
histogram The two moving averages (the signal line and the MACD
line) are invariably lagging indicators as they only provide signals
once the two lines have crossed each other by which time the trend is
already in motion
Technical Level EASYWAYLEARN ACADEMY
SAHALSOFTWARE ndash SAHAL UNIVERSITY
Eng Mohamed Jama
Source IG charts
But the MACD histogram is sometimes considered a leading indicator
as it is used to anticipate signal crossovers in between the two moving
averages The bars on the histogram represents the difference
between the two MAs ndash as the bars move further away from the
central zero line it means the MAs are moving further apart Once this
expansion is over a lsquohumprsquo appears on the histogram which is a sign
the MAs will tighten again and a crossover will occur
Technical Level EASYWAYLEARN ACADEMY
SAHALSOFTWARE ndash SAHAL UNIVERSITY
Eng Mohamed Jama
Although the histogram can be used to enter positions ahead of the
crossovers the moving averages inherently fall behind the market
price So in general it is a lagging indicator This means that there are
instances where the market price may reach a reversal point before
the signal has even been generated ndash which would be deemed a false
signal
Bollinger bands
The Bollinger band tool is a lagging indicator as it is based on a 20-
day simple moving average (SMA) and two outer lines These outer
bands represent the positive and negative standard deviations away
from the SMA and are used as a measure of volatility When levels of
volatility increase the bands will widen and as volatility decreases
they will contract
When the price reaches the outer bands of the Bollinger it often acts
as a trigger for the market to rebound back towards the central 20-
period moving average
Technical Level EASYWAYLEARN ACADEMY
SAHALSOFTWARE ndash SAHAL UNIVERSITY
Eng Mohamed Jama
Source IG charts
There are strategies that suggest the bands have leading indicator
properties but alone they do not give out leading trading signals
Bollinger bands can give no indication of exactly when the change in
volatility might take place or which direction the price will move in
They are merely a sign that a breakout could soon take place giving
bullish and bearish signals
Technical Level EASYWAYLEARN ACADEMY
SAHALSOFTWARE ndash SAHAL UNIVERSITY
Eng Mohamed Jama
This is why traders will often confirm the Bollinger band signals with
price action or use the indicator in conjunction with other lagging tools
or leading indicators such as the RSI
Leading and lagging technical indicators
summed up
A leading indicator is a tool designed to anticipate the future direction
of a market
A lagging indicator is a tool that gives signal once the price movement
has already started
Leading indicators react to prices quickly but this makes them prone to
giving out false signals
Lagging indicators can be more accurate but this is because they are
far slower to react
A lot of popular leading indicators fall into the category of oscillators
including the RSI stochastic oscillator Williams R and OBV
Lagging indicators are drawn onto the price chart itself and include
moving averages the MACD and Bollinger bands
Technical Level EASYWAYLEARN ACADEMY
SAHALSOFTWARE ndash SAHAL UNIVERSITY
Eng Mohamed Jama
Relying solely on either could have negative effects on a strategy
which is why many traders will aim to find a balance of the two
If you feel ready to start using lagging and leading indicators on live
markets you can open an account with IG today Alternatively you
can learn more about financial markets with IG Academy
Lesson 12 Confirmation Checklist = High Probability Trades
Technical Level EASYWAYLEARN ACADEMY
SAHALSOFTWARE ndash SAHAL UNIVERSITY
Eng Mohamed Jama
SupportResistance
Price Reversal Zone
Trend-Line
Pull Back
Technical Level EASYWAYLEARN ACADEMY
SAHALSOFTWARE ndash SAHAL UNIVERSITY
Eng Mohamed Jama
Technical Level EASYWAYLEARN ACADEMY
SAHALSOFTWARE ndash SAHAL UNIVERSITY
Eng Mohamed Jama
Technical Level EASYWAYLEARN ACADEMY
SAHALSOFTWARE ndash SAHAL UNIVERSITY
Eng Mohamed Jama
Technical Level EASYWAYLEARN ACADEMY
SAHALSOFTWARE ndash SAHAL UNIVERSITY
Eng Mohamed Jama
END
Technical Level EASYWAYLEARN ACADEMY
SAHALSOFTWARE ndash SAHAL UNIVERSITY
Eng Mohamed Jama

Technical Level EASYWAYLEARN ACADEMY
SAHALSOFTWARE ndash SAHAL UNIVERSITY
Eng Mohamed Jama
Technical Level EASYWAYLEARN ACADEMY
SAHALSOFTWARE ndash SAHAL UNIVERSITY
Eng Mohamed Jama
Technical Level EASYWAYLEARN ACADEMY
SAHALSOFTWARE ndash SAHAL UNIVERSITY
Eng Mohamed Jama
Technical Level EASYWAYLEARN ACADEMY
SAHALSOFTWARE ndash SAHAL UNIVERSITY
Eng Mohamed Jama
Technical Level EASYWAYLEARN ACADEMY
SAHALSOFTWARE ndash SAHAL UNIVERSITY
Eng Mohamed Jama
Lesson 02 Part1 ndash Download Install and Demo Account - Laptop
- Download and Install
- Demo Account
- Market Watch
- Chart Window
Technical Level EASYWAYLEARN ACADEMY
SAHALSOFTWARE ndash SAHAL UNIVERSITY
Eng Mohamed Jama
Lesson 03 Part2 ndash Environment Menu and Tools MT4 ndash Laptop
- Environment
- Menu
- Toolbars
- Tools
-----------gtgtgt Practical
Lesson 04 Part3 MT4 ndash Laptop ndash Drag - SL and TP and Save Template
-----------gtgtgt Practical
Lesson 05 Practical Tradingvewcom part1
--gtgt Practical
Lesson 06 Tradingvewcom part2
- Shortcut Tools
- Every 5 minute save
- Watchlist
- Change color background
Lesson 07 Candlesticks
Technical Level EASYWAYLEARN ACADEMY
SAHALSOFTWARE ndash SAHAL UNIVERSITY
Eng Mohamed Jama
History of candlesticks The Japanese were looking at charts as far back as the 17th century Munehisa Homma (aka Sokyu Honma) a Japanese rice trader born in the early 1700s is widely credited as being one of the early exponents of tracking price action
Each Candle Consist of 1 Open
2 Close
3 High (Upper Shaddow)
4 Low (Lower Shaddow)
5 BODY
Technical Level EASYWAYLEARN ACADEMY
SAHALSOFTWARE ndash SAHAL UNIVERSITY
Eng Mohamed Jama
Technical Level EASYWAYLEARN ACADEMY
SAHALSOFTWARE ndash SAHAL UNIVERSITY
Eng Mohamed Jama
Technical Level EASYWAYLEARN ACADEMY
SAHALSOFTWARE ndash SAHAL UNIVERSITY
Eng Mohamed Jama
Lesson 08 Market Structure ndash SR and Trend
- SUPPORT amp RESISTANCE
- Trend ndash Uptrend amp Downtrend Rang Market
- Chart Patterns Candlestick
Support and Resistance Support and Resistance is one of the most used techniques in technical analysis based on a concept thats easy to understand but difficult to master It identifies price levels where historically the price reacted either by reversing or at least by slowing down and prior price behavior at these levels can leave clues for future price behavior There are many different ways to identify these levels and to apply them in trading Support and Resistance levels can be identifiable turning points areas of congestion or psychological levels (round numbers that traders attach significance to) The higher the timeframe the more relevant the levels become
Technical Level EASYWAYLEARN ACADEMY
SAHALSOFTWARE ndash SAHAL UNIVERSITY
Eng Mohamed Jama
Technical Level EASYWAYLEARN ACADEMY
SAHALSOFTWARE ndash SAHAL UNIVERSITY
Eng Mohamed Jama
Support and Resistance trading strategy
Mark your areas of Support amp Resistance (SR)
Wait for a directional move into SR
Wait for price rejection at SR
Enter on the next candle
Use Risk Management
Create TK and SL
Note
Technical Level EASYWAYLEARN ACADEMY
SAHALSOFTWARE ndash SAHAL UNIVERSITY
Eng Mohamed Jama
Support ndash Area on your chart with potential buying pressure
Resistance ndash Area on your chart with potential selling pressure
Technical Level EASYWAYLEARN ACADEMY
SAHALSOFTWARE ndash SAHAL UNIVERSITY
Eng Mohamed Jama
Lesson 09 Price Reversal ZonendashDemand and Supply ndashRetest - Strategy
Technical Level EASYWAYLEARN ACADEMY
SAHALSOFTWARE ndash SAHAL UNIVERSITY
Eng Mohamed Jama
- Demand and Supply Zone ndash Strategy ndash
- Break out and Retest ndash Strategy
- Warning - Fake Break out -
Retracements are temporary price reversals that take place within a larger trend A reversal
on the other hand is when the trend changes direction With a reversal the price is likely to
continue in that reversal direction for an extended period
Technical Level EASYWAYLEARN ACADEMY
SAHALSOFTWARE ndash SAHAL UNIVERSITY
Eng Mohamed Jama
Technical Level EASYWAYLEARN ACADEMY
SAHALSOFTWARE ndash SAHAL UNIVERSITY
Eng Mohamed Jama
Technical Level EASYWAYLEARN ACADEMY
SAHALSOFTWARE ndash SAHAL UNIVERSITY
Eng Mohamed Jama
Technical Level EASYWAYLEARN ACADEMY
SAHALSOFTWARE ndash SAHAL UNIVERSITY
Eng Mohamed Jama
Technical Level EASYWAYLEARN ACADEMY
SAHALSOFTWARE ndash SAHAL UNIVERSITY
Eng Mohamed Jama
Technical Level EASYWAYLEARN ACADEMY
SAHALSOFTWARE ndash SAHAL UNIVERSITY
Eng Mohamed Jama
Technical Level EASYWAYLEARN ACADEMY
SAHALSOFTWARE ndash SAHAL UNIVERSITY
Eng Mohamed Jama
Technical Level EASYWAYLEARN ACADEMY
SAHALSOFTWARE ndash SAHAL UNIVERSITY
Eng Mohamed Jama
Technical Level EASYWAYLEARN ACADEMY
SAHALSOFTWARE ndash SAHAL UNIVERSITY
Eng Mohamed Jama
Lesson 10 Trend-Lines ndash Uptrend amp Downtrend
- Uptrend -gt HLHHHLHHHL ndash Swing High ndash Swing low
- Downtrend -gt HLLHLLLHLL ndash Swing low - Swing High
- Ranging Market ndash BOX
- Impulse or Run Pull Back or Correction or Retracement
Technical Level EASYWAYLEARN ACADEMY
SAHALSOFTWARE ndash SAHAL UNIVERSITY
Eng Mohamed Jama
Technical Level EASYWAYLEARN ACADEMY
SAHALSOFTWARE ndash SAHAL UNIVERSITY
Eng Mohamed Jama
Technical Level EASYWAYLEARN ACADEMY
SAHALSOFTWARE ndash SAHAL UNIVERSITY
Eng Mohamed Jama
Technical Level EASYWAYLEARN ACADEMY
SAHALSOFTWARE ndash SAHAL UNIVERSITY
Eng Mohamed Jama
Technical Level EASYWAYLEARN ACADEMY
SAHALSOFTWARE ndash SAHAL UNIVERSITY
Eng Mohamed Jama
Technical Level EASYWAYLEARN ACADEMY
SAHALSOFTWARE ndash SAHAL UNIVERSITY
Eng Mohamed Jama
Break and Retest Strategy
Waiting for a Retest Will Make You a Better Forex Trader
Technical Level EASYWAYLEARN ACADEMY
SAHALSOFTWARE ndash SAHAL UNIVERSITY
Eng Mohamed Jama
Technical Level EASYWAYLEARN ACADEMY
SAHALSOFTWARE ndash SAHAL UNIVERSITY
Eng Mohamed Jama
Lesson 11 Indicators (Leading and Lagging)
+ RSI Indicator
Leading and lagging indicators what you need to know
Technical traders use indicators to identify market patterns and
trends Most of these indicators fall into two categories leading
and lagging Discover some popular leading and lagging
indicators and how to use them
Technical Level EASYWAYLEARN ACADEMY
SAHALSOFTWARE ndash SAHAL UNIVERSITY
Eng Mohamed Jama
What is a leading technical indicator
A leading indicator is a tool designed to anticipate the future direction
of a market in order to enable traders to predict market movements
ahead of time
Technical Level EASYWAYLEARN ACADEMY
SAHALSOFTWARE ndash SAHAL UNIVERSITY
Eng Mohamed Jama
In theory if a leading indicator gives the correct signal a trader can
get in before the market movement and ride the entire trend However
leading indicators are by no means 100 accurate which is why they
are often combined with other forms of technical analysis
What is a lagging technical indicator
A lagging indicator is a tool that provides delayed feedback which
means it gives a signal once the price movement has already passed
Technical Level EASYWAYLEARN ACADEMY
SAHALSOFTWARE ndash SAHAL UNIVERSITY
Eng Mohamed Jama
or is in progress These are used by traders to confirm the price trend
before they enter a trade
These indicators are commonly used by trend traders ndash they donrsquot
show any upcoming price moves but confirm that a trend is underway
This tends to give traders more confidence that they are correct in
their assumptions rather than providing a specific trigger for entering
the market
Technical Level EASYWAYLEARN ACADEMY
SAHALSOFTWARE ndash SAHAL UNIVERSITY
Eng Mohamed Jama
Leading vs lagging technical indicators
whatrsquos the difference
The most obvious difference is that leading indicators predict market
movements while lagging indicators confirm trends that are already
taking place Both leading and lagging indicators have their own
advantages and drawbacks so itrsquos crucial to familiarise yourself with
how each works and decide which fits in with your strategy
Leading indicators react to prices quickly which can be great for
short-term traders but makes them prone to giving out false signals ndash
these happen when a signal indicates itrsquos time to enter the market but
the trend promptly reverses Conversely lagging indicators are far
slower to react which means that traders would have more accuracy
but could be late in entering the market
Relying solely on either could have negative effects on a strategy
which is why many traders will aim to find a balance of the two
Technical Level EASYWAYLEARN ACADEMY
SAHALSOFTWARE ndash SAHAL UNIVERSITY
Eng Mohamed Jama
Four popular leading indicators
Popular leading indicators include
1 The relative strength index (RSI)
2 The stochastic oscillator
3 Williams R
4 On-balance volume (OBV)
A lot of popular leading indicators fall into the category of oscillators as
these can identify a possible trend reversal before it happens
However not all leading indicators will use the same calculations so
there is the possibility that different indicators will show different
signals
Relative strength index (RSI)
The relative strength index (RSI) is a momentum indicator which
traders can use to identify whether a market is overbought or
Technical Level EASYWAYLEARN ACADEMY
SAHALSOFTWARE ndash SAHAL UNIVERSITY
Eng Mohamed Jama
oversold When the RSI gives a signal it is believed that the market
will reverse ndash this provides a leading sign that a trader should enter or
exit a position
The RSI is an oscillator so it is shown on a scale from zero to 100 If
the RSI is above 70 the market would often be thought of as
overbought and appear as red on the chart (below) And if the
indicator falls below the 30 level the market is usually considered
oversold and will appear in green on the chart
Technical Level EASYWAYLEARN ACADEMY
SAHALSOFTWARE ndash SAHAL UNIVERSITY
Eng Mohamed Jama
As mentioned the danger with leading indicators is that they can
provide premature or false signals With the RSI it is possible that the
market will sustain overbought or oversold conditions for long periods
of time without reversing This makes it important to have suitable risk
management measures in place such as stops and limits
Stochastic oscillator
Another popular example of a leading indicator is the stochastic
oscillator which is used to compare recent closing prices to the
previous trading range
The stochastic is based on the idea that market momentum changes
direction much faster than volume or price so it can be used to predict
the direction of market movements If the oscillator reaches a reading
of 80 or over the market would be considered overbought while
anything under 20 would be thought of as oversold
Technical Level EASYWAYLEARN ACADEMY
SAHALSOFTWARE ndash SAHAL UNIVERSITY
Eng Mohamed Jama
The oscillator is shown as two lines on the chart the K (the black
line on the chart below) and the D (the red dotted line below) When
these two lines cross it is seen as a leading signal that a change in
market direction is approaching
During volatile market conditions the stochastic is prone to false
signals To prevent this impacting your trades you could use the
stochastic in conjunction with other indicators or use it as a filter for
Technical Level EASYWAYLEARN ACADEMY
SAHALSOFTWARE ndash SAHAL UNIVERSITY
Eng Mohamed Jama
your trades rather than a trigger This would mean entering the market
once the trend is confirmed as you would with a lagging indicator
Williams R
The Williams percent range more commonly known as the Williams
R is very similar to the stochastic oscillator The main difference
being that it works on a negative scale ndash so it ranges between zero
and -100 and uses -20 and -80 as the overbought and oversold
signals respectively
So on the below chart the green line below -80 indicates that the
price is likely to rise While the red line above -20 indicates the price is
likely to fall
Technical Level EASYWAYLEARN ACADEMY
SAHALSOFTWARE ndash SAHAL UNIVERSITY
Eng Mohamed Jama
The indicator is highly responsive meaning it might start to move to
highs or lows even if the actual market price does not follow suit As
the Williams R is leading these signals can be premature and less
reliable than other entry signals which is why some traders prefer to
use -10 and -90 as more extreme price signals
On-balance volume (OBV)
Technical Level EASYWAYLEARN ACADEMY
SAHALSOFTWARE ndash SAHAL UNIVERSITY
Eng Mohamed Jama
On-balance volume (OBV) is another leading momentum-based
indicator It looks at volume to enable traders to make predictions
about the market price ndash OBV is largely used in shares trading as
volume is well documented by stock exchanges
Traders who use OBV as a leading indicator will focus on increases or
decreases in volume without the equivalent change in price This is
believed to be an indication that the price will increase or decrease
imminently
As a leading indicator OBV is prone to giving false signals especially
as the indicator can be thrown off by huge spikes in volume around
announcements that surprise the market Although volume changes
this is not always indicative of a trend and can cause traders to open
positions prematurely
As with the other leading indicators the OBV is often used in
conjunction with lagging indicators and a thorough risk management
strategy
Technical Level EASYWAYLEARN ACADEMY
SAHALSOFTWARE ndash SAHAL UNIVERSITY
Eng Mohamed Jama
Three popular lagging indicators
Popular lagging indicators include
1 Moving averages
2 The MACD indicator
3 Bollinger bands
Lagging indicators are primarily used to filter out the noise from short-
term market movements and confirm long-term trends They are
usually drawn onto the price chart itself unlike leading indicators
which usually appear in separate windows
Moving averages
Moving averages (MAs) are categorized as a lagging indicator
because they are based on historical data
Buy and sell signals are generated when the price line crosses the MA
or when two MA lines cross each other However because the moving
average is calculated using previous price points the current market
price will be ahead of the MA
Technical Level EASYWAYLEARN ACADEMY
SAHALSOFTWARE ndash SAHAL UNIVERSITY
Eng Mohamed Jama
In the below 50-day MA example the moving average has crossed
the price from above indicating an upward reversal is imminent
However we can see that the MA is slower to pick up the bullish trend
when it does occur
Moving averages can be calculated over any timeframe depending on
the traderrsquos goals ndash but the longer the time frame the longer the lag
Technical Level EASYWAYLEARN ACADEMY
SAHALSOFTWARE ndash SAHAL UNIVERSITY
Eng Mohamed Jama
So a MA of 300 days would have a far longer delay than an MA of 50
days
It is possible for lagging indicators to give off false signals but it is less
likely as they are slower to react
MACD indicator
Moving averages can be used on their own or they can be the basis
of other technical indicators such as the moving average
convergence divergence (MACD) As it is based on MAs the MACD is
inherently a trend-following or lagging indicator However it has been
argued that different components of the MACD provide traders with
different opportunities
There are three components to the tool two moving averages and a
histogram The two moving averages (the signal line and the MACD
line) are invariably lagging indicators as they only provide signals
once the two lines have crossed each other by which time the trend is
already in motion
Technical Level EASYWAYLEARN ACADEMY
SAHALSOFTWARE ndash SAHAL UNIVERSITY
Eng Mohamed Jama
Source IG charts
But the MACD histogram is sometimes considered a leading indicator
as it is used to anticipate signal crossovers in between the two moving
averages The bars on the histogram represents the difference
between the two MAs ndash as the bars move further away from the
central zero line it means the MAs are moving further apart Once this
expansion is over a lsquohumprsquo appears on the histogram which is a sign
the MAs will tighten again and a crossover will occur
Technical Level EASYWAYLEARN ACADEMY
SAHALSOFTWARE ndash SAHAL UNIVERSITY
Eng Mohamed Jama
Although the histogram can be used to enter positions ahead of the
crossovers the moving averages inherently fall behind the market
price So in general it is a lagging indicator This means that there are
instances where the market price may reach a reversal point before
the signal has even been generated ndash which would be deemed a false
signal
Bollinger bands
The Bollinger band tool is a lagging indicator as it is based on a 20-
day simple moving average (SMA) and two outer lines These outer
bands represent the positive and negative standard deviations away
from the SMA and are used as a measure of volatility When levels of
volatility increase the bands will widen and as volatility decreases
they will contract
When the price reaches the outer bands of the Bollinger it often acts
as a trigger for the market to rebound back towards the central 20-
period moving average
Technical Level EASYWAYLEARN ACADEMY
SAHALSOFTWARE ndash SAHAL UNIVERSITY
Eng Mohamed Jama
Source IG charts
There are strategies that suggest the bands have leading indicator
properties but alone they do not give out leading trading signals
Bollinger bands can give no indication of exactly when the change in
volatility might take place or which direction the price will move in
They are merely a sign that a breakout could soon take place giving
bullish and bearish signals
Technical Level EASYWAYLEARN ACADEMY
SAHALSOFTWARE ndash SAHAL UNIVERSITY
Eng Mohamed Jama
This is why traders will often confirm the Bollinger band signals with
price action or use the indicator in conjunction with other lagging tools
or leading indicators such as the RSI
Leading and lagging technical indicators
summed up
A leading indicator is a tool designed to anticipate the future direction
of a market
A lagging indicator is a tool that gives signal once the price movement
has already started
Leading indicators react to prices quickly but this makes them prone to
giving out false signals
Lagging indicators can be more accurate but this is because they are
far slower to react
A lot of popular leading indicators fall into the category of oscillators
including the RSI stochastic oscillator Williams R and OBV
Lagging indicators are drawn onto the price chart itself and include
moving averages the MACD and Bollinger bands
Technical Level EASYWAYLEARN ACADEMY
SAHALSOFTWARE ndash SAHAL UNIVERSITY
Eng Mohamed Jama
Relying solely on either could have negative effects on a strategy
which is why many traders will aim to find a balance of the two
If you feel ready to start using lagging and leading indicators on live
markets you can open an account with IG today Alternatively you
can learn more about financial markets with IG Academy
Lesson 12 Confirmation Checklist = High Probability Trades
Technical Level EASYWAYLEARN ACADEMY
SAHALSOFTWARE ndash SAHAL UNIVERSITY
Eng Mohamed Jama
SupportResistance
Price Reversal Zone
Trend-Line
Pull Back
Technical Level EASYWAYLEARN ACADEMY
SAHALSOFTWARE ndash SAHAL UNIVERSITY
Eng Mohamed Jama
Technical Level EASYWAYLEARN ACADEMY
SAHALSOFTWARE ndash SAHAL UNIVERSITY
Eng Mohamed Jama
Technical Level EASYWAYLEARN ACADEMY
SAHALSOFTWARE ndash SAHAL UNIVERSITY
Eng Mohamed Jama
Technical Level EASYWAYLEARN ACADEMY
SAHALSOFTWARE ndash SAHAL UNIVERSITY
Eng Mohamed Jama
END
Technical Level EASYWAYLEARN ACADEMY
SAHALSOFTWARE ndash SAHAL UNIVERSITY
Eng Mohamed Jama

Technical Level EASYWAYLEARN ACADEMY
SAHALSOFTWARE ndash SAHAL UNIVERSITY
Eng Mohamed Jama
Technical Level EASYWAYLEARN ACADEMY
SAHALSOFTWARE ndash SAHAL UNIVERSITY
Eng Mohamed Jama
Technical Level EASYWAYLEARN ACADEMY
SAHALSOFTWARE ndash SAHAL UNIVERSITY
Eng Mohamed Jama
Technical Level EASYWAYLEARN ACADEMY
SAHALSOFTWARE ndash SAHAL UNIVERSITY
Eng Mohamed Jama
Lesson 02 Part1 ndash Download Install and Demo Account - Laptop
- Download and Install
- Demo Account
- Market Watch
- Chart Window
Technical Level EASYWAYLEARN ACADEMY
SAHALSOFTWARE ndash SAHAL UNIVERSITY
Eng Mohamed Jama
Lesson 03 Part2 ndash Environment Menu and Tools MT4 ndash Laptop
- Environment
- Menu
- Toolbars
- Tools
-----------gtgtgt Practical
Lesson 04 Part3 MT4 ndash Laptop ndash Drag - SL and TP and Save Template
-----------gtgtgt Practical
Lesson 05 Practical Tradingvewcom part1
--gtgt Practical
Lesson 06 Tradingvewcom part2
- Shortcut Tools
- Every 5 minute save
- Watchlist
- Change color background
Lesson 07 Candlesticks
Technical Level EASYWAYLEARN ACADEMY
SAHALSOFTWARE ndash SAHAL UNIVERSITY
Eng Mohamed Jama
History of candlesticks The Japanese were looking at charts as far back as the 17th century Munehisa Homma (aka Sokyu Honma) a Japanese rice trader born in the early 1700s is widely credited as being one of the early exponents of tracking price action
Each Candle Consist of 1 Open
2 Close
3 High (Upper Shaddow)
4 Low (Lower Shaddow)
5 BODY
Technical Level EASYWAYLEARN ACADEMY
SAHALSOFTWARE ndash SAHAL UNIVERSITY
Eng Mohamed Jama
Technical Level EASYWAYLEARN ACADEMY
SAHALSOFTWARE ndash SAHAL UNIVERSITY
Eng Mohamed Jama
Technical Level EASYWAYLEARN ACADEMY
SAHALSOFTWARE ndash SAHAL UNIVERSITY
Eng Mohamed Jama
Lesson 08 Market Structure ndash SR and Trend
- SUPPORT amp RESISTANCE
- Trend ndash Uptrend amp Downtrend Rang Market
- Chart Patterns Candlestick
Support and Resistance Support and Resistance is one of the most used techniques in technical analysis based on a concept thats easy to understand but difficult to master It identifies price levels where historically the price reacted either by reversing or at least by slowing down and prior price behavior at these levels can leave clues for future price behavior There are many different ways to identify these levels and to apply them in trading Support and Resistance levels can be identifiable turning points areas of congestion or psychological levels (round numbers that traders attach significance to) The higher the timeframe the more relevant the levels become
Technical Level EASYWAYLEARN ACADEMY
SAHALSOFTWARE ndash SAHAL UNIVERSITY
Eng Mohamed Jama
Technical Level EASYWAYLEARN ACADEMY
SAHALSOFTWARE ndash SAHAL UNIVERSITY
Eng Mohamed Jama
Support and Resistance trading strategy
Mark your areas of Support amp Resistance (SR)
Wait for a directional move into SR
Wait for price rejection at SR
Enter on the next candle
Use Risk Management
Create TK and SL
Note
Technical Level EASYWAYLEARN ACADEMY
SAHALSOFTWARE ndash SAHAL UNIVERSITY
Eng Mohamed Jama
Support ndash Area on your chart with potential buying pressure
Resistance ndash Area on your chart with potential selling pressure
Technical Level EASYWAYLEARN ACADEMY
SAHALSOFTWARE ndash SAHAL UNIVERSITY
Eng Mohamed Jama
Lesson 09 Price Reversal ZonendashDemand and Supply ndashRetest - Strategy
Technical Level EASYWAYLEARN ACADEMY
SAHALSOFTWARE ndash SAHAL UNIVERSITY
Eng Mohamed Jama
- Demand and Supply Zone ndash Strategy ndash
- Break out and Retest ndash Strategy
- Warning - Fake Break out -
Retracements are temporary price reversals that take place within a larger trend A reversal
on the other hand is when the trend changes direction With a reversal the price is likely to
continue in that reversal direction for an extended period
Technical Level EASYWAYLEARN ACADEMY
SAHALSOFTWARE ndash SAHAL UNIVERSITY
Eng Mohamed Jama
Technical Level EASYWAYLEARN ACADEMY
SAHALSOFTWARE ndash SAHAL UNIVERSITY
Eng Mohamed Jama
Technical Level EASYWAYLEARN ACADEMY
SAHALSOFTWARE ndash SAHAL UNIVERSITY
Eng Mohamed Jama
Technical Level EASYWAYLEARN ACADEMY
SAHALSOFTWARE ndash SAHAL UNIVERSITY
Eng Mohamed Jama
Technical Level EASYWAYLEARN ACADEMY
SAHALSOFTWARE ndash SAHAL UNIVERSITY
Eng Mohamed Jama
Technical Level EASYWAYLEARN ACADEMY
SAHALSOFTWARE ndash SAHAL UNIVERSITY
Eng Mohamed Jama
Technical Level EASYWAYLEARN ACADEMY
SAHALSOFTWARE ndash SAHAL UNIVERSITY
Eng Mohamed Jama
Technical Level EASYWAYLEARN ACADEMY
SAHALSOFTWARE ndash SAHAL UNIVERSITY
Eng Mohamed Jama
Technical Level EASYWAYLEARN ACADEMY
SAHALSOFTWARE ndash SAHAL UNIVERSITY
Eng Mohamed Jama
Lesson 10 Trend-Lines ndash Uptrend amp Downtrend
- Uptrend -gt HLHHHLHHHL ndash Swing High ndash Swing low
- Downtrend -gt HLLHLLLHLL ndash Swing low - Swing High
- Ranging Market ndash BOX
- Impulse or Run Pull Back or Correction or Retracement
Technical Level EASYWAYLEARN ACADEMY
SAHALSOFTWARE ndash SAHAL UNIVERSITY
Eng Mohamed Jama
Technical Level EASYWAYLEARN ACADEMY
SAHALSOFTWARE ndash SAHAL UNIVERSITY
Eng Mohamed Jama
Technical Level EASYWAYLEARN ACADEMY
SAHALSOFTWARE ndash SAHAL UNIVERSITY
Eng Mohamed Jama
Technical Level EASYWAYLEARN ACADEMY
SAHALSOFTWARE ndash SAHAL UNIVERSITY
Eng Mohamed Jama
Technical Level EASYWAYLEARN ACADEMY
SAHALSOFTWARE ndash SAHAL UNIVERSITY
Eng Mohamed Jama
Technical Level EASYWAYLEARN ACADEMY
SAHALSOFTWARE ndash SAHAL UNIVERSITY
Eng Mohamed Jama
Break and Retest Strategy
Waiting for a Retest Will Make You a Better Forex Trader
Technical Level EASYWAYLEARN ACADEMY
SAHALSOFTWARE ndash SAHAL UNIVERSITY
Eng Mohamed Jama
Technical Level EASYWAYLEARN ACADEMY
SAHALSOFTWARE ndash SAHAL UNIVERSITY
Eng Mohamed Jama
Lesson 11 Indicators (Leading and Lagging)
+ RSI Indicator
Leading and lagging indicators what you need to know
Technical traders use indicators to identify market patterns and
trends Most of these indicators fall into two categories leading
and lagging Discover some popular leading and lagging
indicators and how to use them
Technical Level EASYWAYLEARN ACADEMY
SAHALSOFTWARE ndash SAHAL UNIVERSITY
Eng Mohamed Jama
What is a leading technical indicator
A leading indicator is a tool designed to anticipate the future direction
of a market in order to enable traders to predict market movements
ahead of time
Technical Level EASYWAYLEARN ACADEMY
SAHALSOFTWARE ndash SAHAL UNIVERSITY
Eng Mohamed Jama
In theory if a leading indicator gives the correct signal a trader can
get in before the market movement and ride the entire trend However
leading indicators are by no means 100 accurate which is why they
are often combined with other forms of technical analysis
What is a lagging technical indicator
A lagging indicator is a tool that provides delayed feedback which
means it gives a signal once the price movement has already passed
Technical Level EASYWAYLEARN ACADEMY
SAHALSOFTWARE ndash SAHAL UNIVERSITY
Eng Mohamed Jama
or is in progress These are used by traders to confirm the price trend
before they enter a trade
These indicators are commonly used by trend traders ndash they donrsquot
show any upcoming price moves but confirm that a trend is underway
This tends to give traders more confidence that they are correct in
their assumptions rather than providing a specific trigger for entering
the market
Technical Level EASYWAYLEARN ACADEMY
SAHALSOFTWARE ndash SAHAL UNIVERSITY
Eng Mohamed Jama
Leading vs lagging technical indicators
whatrsquos the difference
The most obvious difference is that leading indicators predict market
movements while lagging indicators confirm trends that are already
taking place Both leading and lagging indicators have their own
advantages and drawbacks so itrsquos crucial to familiarise yourself with
how each works and decide which fits in with your strategy
Leading indicators react to prices quickly which can be great for
short-term traders but makes them prone to giving out false signals ndash
these happen when a signal indicates itrsquos time to enter the market but
the trend promptly reverses Conversely lagging indicators are far
slower to react which means that traders would have more accuracy
but could be late in entering the market
Relying solely on either could have negative effects on a strategy
which is why many traders will aim to find a balance of the two
Technical Level EASYWAYLEARN ACADEMY
SAHALSOFTWARE ndash SAHAL UNIVERSITY
Eng Mohamed Jama
Four popular leading indicators
Popular leading indicators include
1 The relative strength index (RSI)
2 The stochastic oscillator
3 Williams R
4 On-balance volume (OBV)
A lot of popular leading indicators fall into the category of oscillators as
these can identify a possible trend reversal before it happens
However not all leading indicators will use the same calculations so
there is the possibility that different indicators will show different
signals
Relative strength index (RSI)
The relative strength index (RSI) is a momentum indicator which
traders can use to identify whether a market is overbought or
Technical Level EASYWAYLEARN ACADEMY
SAHALSOFTWARE ndash SAHAL UNIVERSITY
Eng Mohamed Jama
oversold When the RSI gives a signal it is believed that the market
will reverse ndash this provides a leading sign that a trader should enter or
exit a position
The RSI is an oscillator so it is shown on a scale from zero to 100 If
the RSI is above 70 the market would often be thought of as
overbought and appear as red on the chart (below) And if the
indicator falls below the 30 level the market is usually considered
oversold and will appear in green on the chart
Technical Level EASYWAYLEARN ACADEMY
SAHALSOFTWARE ndash SAHAL UNIVERSITY
Eng Mohamed Jama
As mentioned the danger with leading indicators is that they can
provide premature or false signals With the RSI it is possible that the
market will sustain overbought or oversold conditions for long periods
of time without reversing This makes it important to have suitable risk
management measures in place such as stops and limits
Stochastic oscillator
Another popular example of a leading indicator is the stochastic
oscillator which is used to compare recent closing prices to the
previous trading range
The stochastic is based on the idea that market momentum changes
direction much faster than volume or price so it can be used to predict
the direction of market movements If the oscillator reaches a reading
of 80 or over the market would be considered overbought while
anything under 20 would be thought of as oversold
Technical Level EASYWAYLEARN ACADEMY
SAHALSOFTWARE ndash SAHAL UNIVERSITY
Eng Mohamed Jama
The oscillator is shown as two lines on the chart the K (the black
line on the chart below) and the D (the red dotted line below) When
these two lines cross it is seen as a leading signal that a change in
market direction is approaching
During volatile market conditions the stochastic is prone to false
signals To prevent this impacting your trades you could use the
stochastic in conjunction with other indicators or use it as a filter for
Technical Level EASYWAYLEARN ACADEMY
SAHALSOFTWARE ndash SAHAL UNIVERSITY
Eng Mohamed Jama
your trades rather than a trigger This would mean entering the market
once the trend is confirmed as you would with a lagging indicator
Williams R
The Williams percent range more commonly known as the Williams
R is very similar to the stochastic oscillator The main difference
being that it works on a negative scale ndash so it ranges between zero
and -100 and uses -20 and -80 as the overbought and oversold
signals respectively
So on the below chart the green line below -80 indicates that the
price is likely to rise While the red line above -20 indicates the price is
likely to fall
Technical Level EASYWAYLEARN ACADEMY
SAHALSOFTWARE ndash SAHAL UNIVERSITY
Eng Mohamed Jama
The indicator is highly responsive meaning it might start to move to
highs or lows even if the actual market price does not follow suit As
the Williams R is leading these signals can be premature and less
reliable than other entry signals which is why some traders prefer to
use -10 and -90 as more extreme price signals
On-balance volume (OBV)
Technical Level EASYWAYLEARN ACADEMY
SAHALSOFTWARE ndash SAHAL UNIVERSITY
Eng Mohamed Jama
On-balance volume (OBV) is another leading momentum-based
indicator It looks at volume to enable traders to make predictions
about the market price ndash OBV is largely used in shares trading as
volume is well documented by stock exchanges
Traders who use OBV as a leading indicator will focus on increases or
decreases in volume without the equivalent change in price This is
believed to be an indication that the price will increase or decrease
imminently
As a leading indicator OBV is prone to giving false signals especially
as the indicator can be thrown off by huge spikes in volume around
announcements that surprise the market Although volume changes
this is not always indicative of a trend and can cause traders to open
positions prematurely
As with the other leading indicators the OBV is often used in
conjunction with lagging indicators and a thorough risk management
strategy
Technical Level EASYWAYLEARN ACADEMY
SAHALSOFTWARE ndash SAHAL UNIVERSITY
Eng Mohamed Jama
Three popular lagging indicators
Popular lagging indicators include
1 Moving averages
2 The MACD indicator
3 Bollinger bands
Lagging indicators are primarily used to filter out the noise from short-
term market movements and confirm long-term trends They are
usually drawn onto the price chart itself unlike leading indicators
which usually appear in separate windows
Moving averages
Moving averages (MAs) are categorized as a lagging indicator
because they are based on historical data
Buy and sell signals are generated when the price line crosses the MA
or when two MA lines cross each other However because the moving
average is calculated using previous price points the current market
price will be ahead of the MA
Technical Level EASYWAYLEARN ACADEMY
SAHALSOFTWARE ndash SAHAL UNIVERSITY
Eng Mohamed Jama
In the below 50-day MA example the moving average has crossed
the price from above indicating an upward reversal is imminent
However we can see that the MA is slower to pick up the bullish trend
when it does occur
Moving averages can be calculated over any timeframe depending on
the traderrsquos goals ndash but the longer the time frame the longer the lag
Technical Level EASYWAYLEARN ACADEMY
SAHALSOFTWARE ndash SAHAL UNIVERSITY
Eng Mohamed Jama
So a MA of 300 days would have a far longer delay than an MA of 50
days
It is possible for lagging indicators to give off false signals but it is less
likely as they are slower to react
MACD indicator
Moving averages can be used on their own or they can be the basis
of other technical indicators such as the moving average
convergence divergence (MACD) As it is based on MAs the MACD is
inherently a trend-following or lagging indicator However it has been
argued that different components of the MACD provide traders with
different opportunities
There are three components to the tool two moving averages and a
histogram The two moving averages (the signal line and the MACD
line) are invariably lagging indicators as they only provide signals
once the two lines have crossed each other by which time the trend is
already in motion
Technical Level EASYWAYLEARN ACADEMY
SAHALSOFTWARE ndash SAHAL UNIVERSITY
Eng Mohamed Jama
Source IG charts
But the MACD histogram is sometimes considered a leading indicator
as it is used to anticipate signal crossovers in between the two moving
averages The bars on the histogram represents the difference
between the two MAs ndash as the bars move further away from the
central zero line it means the MAs are moving further apart Once this
expansion is over a lsquohumprsquo appears on the histogram which is a sign
the MAs will tighten again and a crossover will occur
Technical Level EASYWAYLEARN ACADEMY
SAHALSOFTWARE ndash SAHAL UNIVERSITY
Eng Mohamed Jama
Although the histogram can be used to enter positions ahead of the
crossovers the moving averages inherently fall behind the market
price So in general it is a lagging indicator This means that there are
instances where the market price may reach a reversal point before
the signal has even been generated ndash which would be deemed a false
signal
Bollinger bands
The Bollinger band tool is a lagging indicator as it is based on a 20-
day simple moving average (SMA) and two outer lines These outer
bands represent the positive and negative standard deviations away
from the SMA and are used as a measure of volatility When levels of
volatility increase the bands will widen and as volatility decreases
they will contract
When the price reaches the outer bands of the Bollinger it often acts
as a trigger for the market to rebound back towards the central 20-
period moving average
Technical Level EASYWAYLEARN ACADEMY
SAHALSOFTWARE ndash SAHAL UNIVERSITY
Eng Mohamed Jama
Source IG charts
There are strategies that suggest the bands have leading indicator
properties but alone they do not give out leading trading signals
Bollinger bands can give no indication of exactly when the change in
volatility might take place or which direction the price will move in
They are merely a sign that a breakout could soon take place giving
bullish and bearish signals
Technical Level EASYWAYLEARN ACADEMY
SAHALSOFTWARE ndash SAHAL UNIVERSITY
Eng Mohamed Jama
This is why traders will often confirm the Bollinger band signals with
price action or use the indicator in conjunction with other lagging tools
or leading indicators such as the RSI
Leading and lagging technical indicators
summed up
A leading indicator is a tool designed to anticipate the future direction
of a market
A lagging indicator is a tool that gives signal once the price movement
has already started
Leading indicators react to prices quickly but this makes them prone to
giving out false signals
Lagging indicators can be more accurate but this is because they are
far slower to react
A lot of popular leading indicators fall into the category of oscillators
including the RSI stochastic oscillator Williams R and OBV
Lagging indicators are drawn onto the price chart itself and include
moving averages the MACD and Bollinger bands
Technical Level EASYWAYLEARN ACADEMY
SAHALSOFTWARE ndash SAHAL UNIVERSITY
Eng Mohamed Jama
Relying solely on either could have negative effects on a strategy
which is why many traders will aim to find a balance of the two
If you feel ready to start using lagging and leading indicators on live
markets you can open an account with IG today Alternatively you
can learn more about financial markets with IG Academy
Lesson 12 Confirmation Checklist = High Probability Trades
Technical Level EASYWAYLEARN ACADEMY
SAHALSOFTWARE ndash SAHAL UNIVERSITY
Eng Mohamed Jama
SupportResistance
Price Reversal Zone
Trend-Line
Pull Back
Technical Level EASYWAYLEARN ACADEMY
SAHALSOFTWARE ndash SAHAL UNIVERSITY
Eng Mohamed Jama
Technical Level EASYWAYLEARN ACADEMY
SAHALSOFTWARE ndash SAHAL UNIVERSITY
Eng Mohamed Jama
Technical Level EASYWAYLEARN ACADEMY
SAHALSOFTWARE ndash SAHAL UNIVERSITY
Eng Mohamed Jama
Technical Level EASYWAYLEARN ACADEMY
SAHALSOFTWARE ndash SAHAL UNIVERSITY
Eng Mohamed Jama
END
Technical Level EASYWAYLEARN ACADEMY
SAHALSOFTWARE ndash SAHAL UNIVERSITY
Eng Mohamed Jama

Technical Level EASYWAYLEARN ACADEMY
SAHALSOFTWARE ndash SAHAL UNIVERSITY
Eng Mohamed Jama
Technical Level EASYWAYLEARN ACADEMY
SAHALSOFTWARE ndash SAHAL UNIVERSITY
Eng Mohamed Jama
Technical Level EASYWAYLEARN ACADEMY
SAHALSOFTWARE ndash SAHAL UNIVERSITY
Eng Mohamed Jama
Lesson 02 Part1 ndash Download Install and Demo Account - Laptop
- Download and Install
- Demo Account
- Market Watch
- Chart Window
Technical Level EASYWAYLEARN ACADEMY
SAHALSOFTWARE ndash SAHAL UNIVERSITY
Eng Mohamed Jama
Lesson 03 Part2 ndash Environment Menu and Tools MT4 ndash Laptop
- Environment
- Menu
- Toolbars
- Tools
-----------gtgtgt Practical
Lesson 04 Part3 MT4 ndash Laptop ndash Drag - SL and TP and Save Template
-----------gtgtgt Practical
Lesson 05 Practical Tradingvewcom part1
--gtgt Practical
Lesson 06 Tradingvewcom part2
- Shortcut Tools
- Every 5 minute save
- Watchlist
- Change color background
Lesson 07 Candlesticks
Technical Level EASYWAYLEARN ACADEMY
SAHALSOFTWARE ndash SAHAL UNIVERSITY
Eng Mohamed Jama
History of candlesticks The Japanese were looking at charts as far back as the 17th century Munehisa Homma (aka Sokyu Honma) a Japanese rice trader born in the early 1700s is widely credited as being one of the early exponents of tracking price action
Each Candle Consist of 1 Open
2 Close
3 High (Upper Shaddow)
4 Low (Lower Shaddow)
5 BODY
Technical Level EASYWAYLEARN ACADEMY
SAHALSOFTWARE ndash SAHAL UNIVERSITY
Eng Mohamed Jama
Technical Level EASYWAYLEARN ACADEMY
SAHALSOFTWARE ndash SAHAL UNIVERSITY
Eng Mohamed Jama
Technical Level EASYWAYLEARN ACADEMY
SAHALSOFTWARE ndash SAHAL UNIVERSITY
Eng Mohamed Jama
Lesson 08 Market Structure ndash SR and Trend
- SUPPORT amp RESISTANCE
- Trend ndash Uptrend amp Downtrend Rang Market
- Chart Patterns Candlestick
Support and Resistance Support and Resistance is one of the most used techniques in technical analysis based on a concept thats easy to understand but difficult to master It identifies price levels where historically the price reacted either by reversing or at least by slowing down and prior price behavior at these levels can leave clues for future price behavior There are many different ways to identify these levels and to apply them in trading Support and Resistance levels can be identifiable turning points areas of congestion or psychological levels (round numbers that traders attach significance to) The higher the timeframe the more relevant the levels become
Technical Level EASYWAYLEARN ACADEMY
SAHALSOFTWARE ndash SAHAL UNIVERSITY
Eng Mohamed Jama
Technical Level EASYWAYLEARN ACADEMY
SAHALSOFTWARE ndash SAHAL UNIVERSITY
Eng Mohamed Jama
Support and Resistance trading strategy
Mark your areas of Support amp Resistance (SR)
Wait for a directional move into SR
Wait for price rejection at SR
Enter on the next candle
Use Risk Management
Create TK and SL
Note
Technical Level EASYWAYLEARN ACADEMY
SAHALSOFTWARE ndash SAHAL UNIVERSITY
Eng Mohamed Jama
Support ndash Area on your chart with potential buying pressure
Resistance ndash Area on your chart with potential selling pressure
Technical Level EASYWAYLEARN ACADEMY
SAHALSOFTWARE ndash SAHAL UNIVERSITY
Eng Mohamed Jama
Lesson 09 Price Reversal ZonendashDemand and Supply ndashRetest - Strategy
Technical Level EASYWAYLEARN ACADEMY
SAHALSOFTWARE ndash SAHAL UNIVERSITY
Eng Mohamed Jama
- Demand and Supply Zone ndash Strategy ndash
- Break out and Retest ndash Strategy
- Warning - Fake Break out -
Retracements are temporary price reversals that take place within a larger trend A reversal
on the other hand is when the trend changes direction With a reversal the price is likely to
continue in that reversal direction for an extended period
Technical Level EASYWAYLEARN ACADEMY
SAHALSOFTWARE ndash SAHAL UNIVERSITY
Eng Mohamed Jama
Technical Level EASYWAYLEARN ACADEMY
SAHALSOFTWARE ndash SAHAL UNIVERSITY
Eng Mohamed Jama
Technical Level EASYWAYLEARN ACADEMY
SAHALSOFTWARE ndash SAHAL UNIVERSITY
Eng Mohamed Jama
Technical Level EASYWAYLEARN ACADEMY
SAHALSOFTWARE ndash SAHAL UNIVERSITY
Eng Mohamed Jama
Technical Level EASYWAYLEARN ACADEMY
SAHALSOFTWARE ndash SAHAL UNIVERSITY
Eng Mohamed Jama
Technical Level EASYWAYLEARN ACADEMY
SAHALSOFTWARE ndash SAHAL UNIVERSITY
Eng Mohamed Jama
Technical Level EASYWAYLEARN ACADEMY
SAHALSOFTWARE ndash SAHAL UNIVERSITY
Eng Mohamed Jama
Technical Level EASYWAYLEARN ACADEMY
SAHALSOFTWARE ndash SAHAL UNIVERSITY
Eng Mohamed Jama
Technical Level EASYWAYLEARN ACADEMY
SAHALSOFTWARE ndash SAHAL UNIVERSITY
Eng Mohamed Jama
Lesson 10 Trend-Lines ndash Uptrend amp Downtrend
- Uptrend -gt HLHHHLHHHL ndash Swing High ndash Swing low
- Downtrend -gt HLLHLLLHLL ndash Swing low - Swing High
- Ranging Market ndash BOX
- Impulse or Run Pull Back or Correction or Retracement
Technical Level EASYWAYLEARN ACADEMY
SAHALSOFTWARE ndash SAHAL UNIVERSITY
Eng Mohamed Jama
Technical Level EASYWAYLEARN ACADEMY
SAHALSOFTWARE ndash SAHAL UNIVERSITY
Eng Mohamed Jama
Technical Level EASYWAYLEARN ACADEMY
SAHALSOFTWARE ndash SAHAL UNIVERSITY
Eng Mohamed Jama
Technical Level EASYWAYLEARN ACADEMY
SAHALSOFTWARE ndash SAHAL UNIVERSITY
Eng Mohamed Jama
Technical Level EASYWAYLEARN ACADEMY
SAHALSOFTWARE ndash SAHAL UNIVERSITY
Eng Mohamed Jama
Technical Level EASYWAYLEARN ACADEMY
SAHALSOFTWARE ndash SAHAL UNIVERSITY
Eng Mohamed Jama
Break and Retest Strategy
Waiting for a Retest Will Make You a Better Forex Trader
Technical Level EASYWAYLEARN ACADEMY
SAHALSOFTWARE ndash SAHAL UNIVERSITY
Eng Mohamed Jama
Technical Level EASYWAYLEARN ACADEMY
SAHALSOFTWARE ndash SAHAL UNIVERSITY
Eng Mohamed Jama
Lesson 11 Indicators (Leading and Lagging)
+ RSI Indicator
Leading and lagging indicators what you need to know
Technical traders use indicators to identify market patterns and
trends Most of these indicators fall into two categories leading
and lagging Discover some popular leading and lagging
indicators and how to use them
Technical Level EASYWAYLEARN ACADEMY
SAHALSOFTWARE ndash SAHAL UNIVERSITY
Eng Mohamed Jama
What is a leading technical indicator
A leading indicator is a tool designed to anticipate the future direction
of a market in order to enable traders to predict market movements
ahead of time
Technical Level EASYWAYLEARN ACADEMY
SAHALSOFTWARE ndash SAHAL UNIVERSITY
Eng Mohamed Jama
In theory if a leading indicator gives the correct signal a trader can
get in before the market movement and ride the entire trend However
leading indicators are by no means 100 accurate which is why they
are often combined with other forms of technical analysis
What is a lagging technical indicator
A lagging indicator is a tool that provides delayed feedback which
means it gives a signal once the price movement has already passed
Technical Level EASYWAYLEARN ACADEMY
SAHALSOFTWARE ndash SAHAL UNIVERSITY
Eng Mohamed Jama
or is in progress These are used by traders to confirm the price trend
before they enter a trade
These indicators are commonly used by trend traders ndash they donrsquot
show any upcoming price moves but confirm that a trend is underway
This tends to give traders more confidence that they are correct in
their assumptions rather than providing a specific trigger for entering
the market
Technical Level EASYWAYLEARN ACADEMY
SAHALSOFTWARE ndash SAHAL UNIVERSITY
Eng Mohamed Jama
Leading vs lagging technical indicators
whatrsquos the difference
The most obvious difference is that leading indicators predict market
movements while lagging indicators confirm trends that are already
taking place Both leading and lagging indicators have their own
advantages and drawbacks so itrsquos crucial to familiarise yourself with
how each works and decide which fits in with your strategy
Leading indicators react to prices quickly which can be great for
short-term traders but makes them prone to giving out false signals ndash
these happen when a signal indicates itrsquos time to enter the market but
the trend promptly reverses Conversely lagging indicators are far
slower to react which means that traders would have more accuracy
but could be late in entering the market
Relying solely on either could have negative effects on a strategy
which is why many traders will aim to find a balance of the two
Technical Level EASYWAYLEARN ACADEMY
SAHALSOFTWARE ndash SAHAL UNIVERSITY
Eng Mohamed Jama
Four popular leading indicators
Popular leading indicators include
1 The relative strength index (RSI)
2 The stochastic oscillator
3 Williams R
4 On-balance volume (OBV)
A lot of popular leading indicators fall into the category of oscillators as
these can identify a possible trend reversal before it happens
However not all leading indicators will use the same calculations so
there is the possibility that different indicators will show different
signals
Relative strength index (RSI)
The relative strength index (RSI) is a momentum indicator which
traders can use to identify whether a market is overbought or
Technical Level EASYWAYLEARN ACADEMY
SAHALSOFTWARE ndash SAHAL UNIVERSITY
Eng Mohamed Jama
oversold When the RSI gives a signal it is believed that the market
will reverse ndash this provides a leading sign that a trader should enter or
exit a position
The RSI is an oscillator so it is shown on a scale from zero to 100 If
the RSI is above 70 the market would often be thought of as
overbought and appear as red on the chart (below) And if the
indicator falls below the 30 level the market is usually considered
oversold and will appear in green on the chart
Technical Level EASYWAYLEARN ACADEMY
SAHALSOFTWARE ndash SAHAL UNIVERSITY
Eng Mohamed Jama
As mentioned the danger with leading indicators is that they can
provide premature or false signals With the RSI it is possible that the
market will sustain overbought or oversold conditions for long periods
of time without reversing This makes it important to have suitable risk
management measures in place such as stops and limits
Stochastic oscillator
Another popular example of a leading indicator is the stochastic
oscillator which is used to compare recent closing prices to the
previous trading range
The stochastic is based on the idea that market momentum changes
direction much faster than volume or price so it can be used to predict
the direction of market movements If the oscillator reaches a reading
of 80 or over the market would be considered overbought while
anything under 20 would be thought of as oversold
Technical Level EASYWAYLEARN ACADEMY
SAHALSOFTWARE ndash SAHAL UNIVERSITY
Eng Mohamed Jama
The oscillator is shown as two lines on the chart the K (the black
line on the chart below) and the D (the red dotted line below) When
these two lines cross it is seen as a leading signal that a change in
market direction is approaching
During volatile market conditions the stochastic is prone to false
signals To prevent this impacting your trades you could use the
stochastic in conjunction with other indicators or use it as a filter for
Technical Level EASYWAYLEARN ACADEMY
SAHALSOFTWARE ndash SAHAL UNIVERSITY
Eng Mohamed Jama
your trades rather than a trigger This would mean entering the market
once the trend is confirmed as you would with a lagging indicator
Williams R
The Williams percent range more commonly known as the Williams
R is very similar to the stochastic oscillator The main difference
being that it works on a negative scale ndash so it ranges between zero
and -100 and uses -20 and -80 as the overbought and oversold
signals respectively
So on the below chart the green line below -80 indicates that the
price is likely to rise While the red line above -20 indicates the price is
likely to fall
Technical Level EASYWAYLEARN ACADEMY
SAHALSOFTWARE ndash SAHAL UNIVERSITY
Eng Mohamed Jama
The indicator is highly responsive meaning it might start to move to
highs or lows even if the actual market price does not follow suit As
the Williams R is leading these signals can be premature and less
reliable than other entry signals which is why some traders prefer to
use -10 and -90 as more extreme price signals
On-balance volume (OBV)
Technical Level EASYWAYLEARN ACADEMY
SAHALSOFTWARE ndash SAHAL UNIVERSITY
Eng Mohamed Jama
On-balance volume (OBV) is another leading momentum-based
indicator It looks at volume to enable traders to make predictions
about the market price ndash OBV is largely used in shares trading as
volume is well documented by stock exchanges
Traders who use OBV as a leading indicator will focus on increases or
decreases in volume without the equivalent change in price This is
believed to be an indication that the price will increase or decrease
imminently
As a leading indicator OBV is prone to giving false signals especially
as the indicator can be thrown off by huge spikes in volume around
announcements that surprise the market Although volume changes
this is not always indicative of a trend and can cause traders to open
positions prematurely
As with the other leading indicators the OBV is often used in
conjunction with lagging indicators and a thorough risk management
strategy
Technical Level EASYWAYLEARN ACADEMY
SAHALSOFTWARE ndash SAHAL UNIVERSITY
Eng Mohamed Jama
Three popular lagging indicators
Popular lagging indicators include
1 Moving averages
2 The MACD indicator
3 Bollinger bands
Lagging indicators are primarily used to filter out the noise from short-
term market movements and confirm long-term trends They are
usually drawn onto the price chart itself unlike leading indicators
which usually appear in separate windows
Moving averages
Moving averages (MAs) are categorized as a lagging indicator
because they are based on historical data
Buy and sell signals are generated when the price line crosses the MA
or when two MA lines cross each other However because the moving
average is calculated using previous price points the current market
price will be ahead of the MA
Technical Level EASYWAYLEARN ACADEMY
SAHALSOFTWARE ndash SAHAL UNIVERSITY
Eng Mohamed Jama
In the below 50-day MA example the moving average has crossed
the price from above indicating an upward reversal is imminent
However we can see that the MA is slower to pick up the bullish trend
when it does occur
Moving averages can be calculated over any timeframe depending on
the traderrsquos goals ndash but the longer the time frame the longer the lag
Technical Level EASYWAYLEARN ACADEMY
SAHALSOFTWARE ndash SAHAL UNIVERSITY
Eng Mohamed Jama
So a MA of 300 days would have a far longer delay than an MA of 50
days
It is possible for lagging indicators to give off false signals but it is less
likely as they are slower to react
MACD indicator
Moving averages can be used on their own or they can be the basis
of other technical indicators such as the moving average
convergence divergence (MACD) As it is based on MAs the MACD is
inherently a trend-following or lagging indicator However it has been
argued that different components of the MACD provide traders with
different opportunities
There are three components to the tool two moving averages and a
histogram The two moving averages (the signal line and the MACD
line) are invariably lagging indicators as they only provide signals
once the two lines have crossed each other by which time the trend is
already in motion
Technical Level EASYWAYLEARN ACADEMY
SAHALSOFTWARE ndash SAHAL UNIVERSITY
Eng Mohamed Jama
Source IG charts
But the MACD histogram is sometimes considered a leading indicator
as it is used to anticipate signal crossovers in between the two moving
averages The bars on the histogram represents the difference
between the two MAs ndash as the bars move further away from the
central zero line it means the MAs are moving further apart Once this
expansion is over a lsquohumprsquo appears on the histogram which is a sign
the MAs will tighten again and a crossover will occur
Technical Level EASYWAYLEARN ACADEMY
SAHALSOFTWARE ndash SAHAL UNIVERSITY
Eng Mohamed Jama
Although the histogram can be used to enter positions ahead of the
crossovers the moving averages inherently fall behind the market
price So in general it is a lagging indicator This means that there are
instances where the market price may reach a reversal point before
the signal has even been generated ndash which would be deemed a false
signal
Bollinger bands
The Bollinger band tool is a lagging indicator as it is based on a 20-
day simple moving average (SMA) and two outer lines These outer
bands represent the positive and negative standard deviations away
from the SMA and are used as a measure of volatility When levels of
volatility increase the bands will widen and as volatility decreases
they will contract
When the price reaches the outer bands of the Bollinger it often acts
as a trigger for the market to rebound back towards the central 20-
period moving average
Technical Level EASYWAYLEARN ACADEMY
SAHALSOFTWARE ndash SAHAL UNIVERSITY
Eng Mohamed Jama
Source IG charts
There are strategies that suggest the bands have leading indicator
properties but alone they do not give out leading trading signals
Bollinger bands can give no indication of exactly when the change in
volatility might take place or which direction the price will move in
They are merely a sign that a breakout could soon take place giving
bullish and bearish signals
Technical Level EASYWAYLEARN ACADEMY
SAHALSOFTWARE ndash SAHAL UNIVERSITY
Eng Mohamed Jama
This is why traders will often confirm the Bollinger band signals with
price action or use the indicator in conjunction with other lagging tools
or leading indicators such as the RSI
Leading and lagging technical indicators
summed up
A leading indicator is a tool designed to anticipate the future direction
of a market
A lagging indicator is a tool that gives signal once the price movement
has already started
Leading indicators react to prices quickly but this makes them prone to
giving out false signals
Lagging indicators can be more accurate but this is because they are
far slower to react
A lot of popular leading indicators fall into the category of oscillators
including the RSI stochastic oscillator Williams R and OBV
Lagging indicators are drawn onto the price chart itself and include
moving averages the MACD and Bollinger bands
Technical Level EASYWAYLEARN ACADEMY
SAHALSOFTWARE ndash SAHAL UNIVERSITY
Eng Mohamed Jama
Relying solely on either could have negative effects on a strategy
which is why many traders will aim to find a balance of the two
If you feel ready to start using lagging and leading indicators on live
markets you can open an account with IG today Alternatively you
can learn more about financial markets with IG Academy
Lesson 12 Confirmation Checklist = High Probability Trades
Technical Level EASYWAYLEARN ACADEMY
SAHALSOFTWARE ndash SAHAL UNIVERSITY
Eng Mohamed Jama
SupportResistance
Price Reversal Zone
Trend-Line
Pull Back
Technical Level EASYWAYLEARN ACADEMY
SAHALSOFTWARE ndash SAHAL UNIVERSITY
Eng Mohamed Jama
Technical Level EASYWAYLEARN ACADEMY
SAHALSOFTWARE ndash SAHAL UNIVERSITY
Eng Mohamed Jama
Technical Level EASYWAYLEARN ACADEMY
SAHALSOFTWARE ndash SAHAL UNIVERSITY
Eng Mohamed Jama
Technical Level EASYWAYLEARN ACADEMY
SAHALSOFTWARE ndash SAHAL UNIVERSITY
Eng Mohamed Jama
END
Technical Level EASYWAYLEARN ACADEMY
SAHALSOFTWARE ndash SAHAL UNIVERSITY
Eng Mohamed Jama
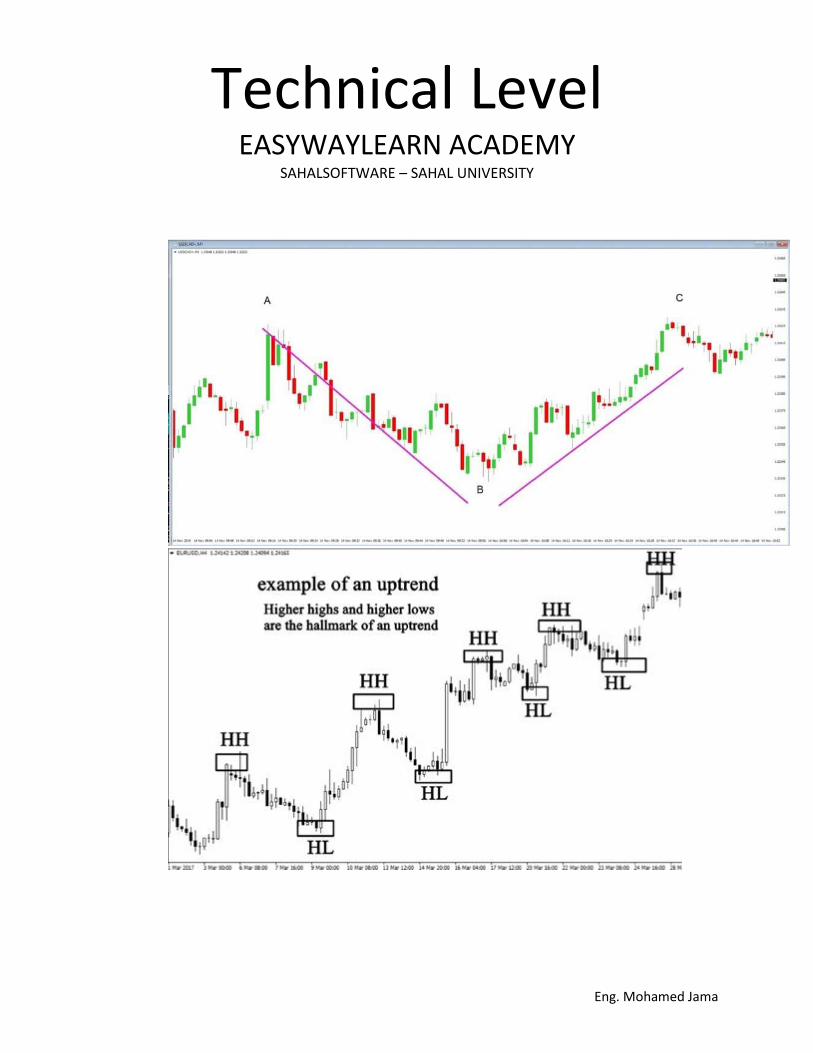
Technical Level EASYWAYLEARN ACADEMY
SAHALSOFTWARE ndash SAHAL UNIVERSITY
Eng Mohamed Jama
Technical Level EASYWAYLEARN ACADEMY
SAHALSOFTWARE ndash SAHAL UNIVERSITY
Eng Mohamed Jama
Lesson 02 Part1 ndash Download Install and Demo Account - Laptop
- Download and Install
- Demo Account
- Market Watch
- Chart Window
Technical Level EASYWAYLEARN ACADEMY
SAHALSOFTWARE ndash SAHAL UNIVERSITY
Eng Mohamed Jama
Lesson 03 Part2 ndash Environment Menu and Tools MT4 ndash Laptop
- Environment
- Menu
- Toolbars
- Tools
-----------gtgtgt Practical
Lesson 04 Part3 MT4 ndash Laptop ndash Drag - SL and TP and Save Template
-----------gtgtgt Practical
Lesson 05 Practical Tradingvewcom part1
--gtgt Practical
Lesson 06 Tradingvewcom part2
- Shortcut Tools
- Every 5 minute save
- Watchlist
- Change color background
Lesson 07 Candlesticks
Technical Level EASYWAYLEARN ACADEMY
SAHALSOFTWARE ndash SAHAL UNIVERSITY
Eng Mohamed Jama
History of candlesticks The Japanese were looking at charts as far back as the 17th century Munehisa Homma (aka Sokyu Honma) a Japanese rice trader born in the early 1700s is widely credited as being one of the early exponents of tracking price action
Each Candle Consist of 1 Open
2 Close
3 High (Upper Shaddow)
4 Low (Lower Shaddow)
5 BODY
Technical Level EASYWAYLEARN ACADEMY
SAHALSOFTWARE ndash SAHAL UNIVERSITY
Eng Mohamed Jama
Technical Level EASYWAYLEARN ACADEMY
SAHALSOFTWARE ndash SAHAL UNIVERSITY
Eng Mohamed Jama
Technical Level EASYWAYLEARN ACADEMY
SAHALSOFTWARE ndash SAHAL UNIVERSITY
Eng Mohamed Jama
Lesson 08 Market Structure ndash SR and Trend
- SUPPORT amp RESISTANCE
- Trend ndash Uptrend amp Downtrend Rang Market
- Chart Patterns Candlestick
Support and Resistance Support and Resistance is one of the most used techniques in technical analysis based on a concept thats easy to understand but difficult to master It identifies price levels where historically the price reacted either by reversing or at least by slowing down and prior price behavior at these levels can leave clues for future price behavior There are many different ways to identify these levels and to apply them in trading Support and Resistance levels can be identifiable turning points areas of congestion or psychological levels (round numbers that traders attach significance to) The higher the timeframe the more relevant the levels become
Technical Level EASYWAYLEARN ACADEMY
SAHALSOFTWARE ndash SAHAL UNIVERSITY
Eng Mohamed Jama
Technical Level EASYWAYLEARN ACADEMY
SAHALSOFTWARE ndash SAHAL UNIVERSITY
Eng Mohamed Jama
Support and Resistance trading strategy
Mark your areas of Support amp Resistance (SR)
Wait for a directional move into SR
Wait for price rejection at SR
Enter on the next candle
Use Risk Management
Create TK and SL
Note
Technical Level EASYWAYLEARN ACADEMY
SAHALSOFTWARE ndash SAHAL UNIVERSITY
Eng Mohamed Jama
Support ndash Area on your chart with potential buying pressure
Resistance ndash Area on your chart with potential selling pressure
Technical Level EASYWAYLEARN ACADEMY
SAHALSOFTWARE ndash SAHAL UNIVERSITY
Eng Mohamed Jama
Lesson 09 Price Reversal ZonendashDemand and Supply ndashRetest - Strategy
Technical Level EASYWAYLEARN ACADEMY
SAHALSOFTWARE ndash SAHAL UNIVERSITY
Eng Mohamed Jama
- Demand and Supply Zone ndash Strategy ndash
- Break out and Retest ndash Strategy
- Warning - Fake Break out -
Retracements are temporary price reversals that take place within a larger trend A reversal
on the other hand is when the trend changes direction With a reversal the price is likely to
continue in that reversal direction for an extended period
Technical Level EASYWAYLEARN ACADEMY
SAHALSOFTWARE ndash SAHAL UNIVERSITY
Eng Mohamed Jama
Technical Level EASYWAYLEARN ACADEMY
SAHALSOFTWARE ndash SAHAL UNIVERSITY
Eng Mohamed Jama
Technical Level EASYWAYLEARN ACADEMY
SAHALSOFTWARE ndash SAHAL UNIVERSITY
Eng Mohamed Jama
Technical Level EASYWAYLEARN ACADEMY
SAHALSOFTWARE ndash SAHAL UNIVERSITY
Eng Mohamed Jama
Technical Level EASYWAYLEARN ACADEMY
SAHALSOFTWARE ndash SAHAL UNIVERSITY
Eng Mohamed Jama
Technical Level EASYWAYLEARN ACADEMY
SAHALSOFTWARE ndash SAHAL UNIVERSITY
Eng Mohamed Jama
Technical Level EASYWAYLEARN ACADEMY
SAHALSOFTWARE ndash SAHAL UNIVERSITY
Eng Mohamed Jama
Technical Level EASYWAYLEARN ACADEMY
SAHALSOFTWARE ndash SAHAL UNIVERSITY
Eng Mohamed Jama
Technical Level EASYWAYLEARN ACADEMY
SAHALSOFTWARE ndash SAHAL UNIVERSITY
Eng Mohamed Jama
Lesson 10 Trend-Lines ndash Uptrend amp Downtrend
- Uptrend -gt HLHHHLHHHL ndash Swing High ndash Swing low
- Downtrend -gt HLLHLLLHLL ndash Swing low - Swing High
- Ranging Market ndash BOX
- Impulse or Run Pull Back or Correction or Retracement
Technical Level EASYWAYLEARN ACADEMY
SAHALSOFTWARE ndash SAHAL UNIVERSITY
Eng Mohamed Jama
Technical Level EASYWAYLEARN ACADEMY
SAHALSOFTWARE ndash SAHAL UNIVERSITY
Eng Mohamed Jama
Technical Level EASYWAYLEARN ACADEMY
SAHALSOFTWARE ndash SAHAL UNIVERSITY
Eng Mohamed Jama
Technical Level EASYWAYLEARN ACADEMY
SAHALSOFTWARE ndash SAHAL UNIVERSITY
Eng Mohamed Jama
Technical Level EASYWAYLEARN ACADEMY
SAHALSOFTWARE ndash SAHAL UNIVERSITY
Eng Mohamed Jama
Technical Level EASYWAYLEARN ACADEMY
SAHALSOFTWARE ndash SAHAL UNIVERSITY
Eng Mohamed Jama
Break and Retest Strategy
Waiting for a Retest Will Make You a Better Forex Trader
Technical Level EASYWAYLEARN ACADEMY
SAHALSOFTWARE ndash SAHAL UNIVERSITY
Eng Mohamed Jama
Technical Level EASYWAYLEARN ACADEMY
SAHALSOFTWARE ndash SAHAL UNIVERSITY
Eng Mohamed Jama
Lesson 11 Indicators (Leading and Lagging)
+ RSI Indicator
Leading and lagging indicators what you need to know
Technical traders use indicators to identify market patterns and
trends Most of these indicators fall into two categories leading
and lagging Discover some popular leading and lagging
indicators and how to use them
Technical Level EASYWAYLEARN ACADEMY
SAHALSOFTWARE ndash SAHAL UNIVERSITY
Eng Mohamed Jama
What is a leading technical indicator
A leading indicator is a tool designed to anticipate the future direction
of a market in order to enable traders to predict market movements
ahead of time
Technical Level EASYWAYLEARN ACADEMY
SAHALSOFTWARE ndash SAHAL UNIVERSITY
Eng Mohamed Jama
In theory if a leading indicator gives the correct signal a trader can
get in before the market movement and ride the entire trend However
leading indicators are by no means 100 accurate which is why they
are often combined with other forms of technical analysis
What is a lagging technical indicator
A lagging indicator is a tool that provides delayed feedback which
means it gives a signal once the price movement has already passed
Technical Level EASYWAYLEARN ACADEMY
SAHALSOFTWARE ndash SAHAL UNIVERSITY
Eng Mohamed Jama
or is in progress These are used by traders to confirm the price trend
before they enter a trade
These indicators are commonly used by trend traders ndash they donrsquot
show any upcoming price moves but confirm that a trend is underway
This tends to give traders more confidence that they are correct in
their assumptions rather than providing a specific trigger for entering
the market
Technical Level EASYWAYLEARN ACADEMY
SAHALSOFTWARE ndash SAHAL UNIVERSITY
Eng Mohamed Jama
Leading vs lagging technical indicators
whatrsquos the difference
The most obvious difference is that leading indicators predict market
movements while lagging indicators confirm trends that are already
taking place Both leading and lagging indicators have their own
advantages and drawbacks so itrsquos crucial to familiarise yourself with
how each works and decide which fits in with your strategy
Leading indicators react to prices quickly which can be great for
short-term traders but makes them prone to giving out false signals ndash
these happen when a signal indicates itrsquos time to enter the market but
the trend promptly reverses Conversely lagging indicators are far
slower to react which means that traders would have more accuracy
but could be late in entering the market
Relying solely on either could have negative effects on a strategy
which is why many traders will aim to find a balance of the two
Technical Level EASYWAYLEARN ACADEMY
SAHALSOFTWARE ndash SAHAL UNIVERSITY
Eng Mohamed Jama
Four popular leading indicators
Popular leading indicators include
1 The relative strength index (RSI)
2 The stochastic oscillator
3 Williams R
4 On-balance volume (OBV)
A lot of popular leading indicators fall into the category of oscillators as
these can identify a possible trend reversal before it happens
However not all leading indicators will use the same calculations so
there is the possibility that different indicators will show different
signals
Relative strength index (RSI)
The relative strength index (RSI) is a momentum indicator which
traders can use to identify whether a market is overbought or
Technical Level EASYWAYLEARN ACADEMY
SAHALSOFTWARE ndash SAHAL UNIVERSITY
Eng Mohamed Jama
oversold When the RSI gives a signal it is believed that the market
will reverse ndash this provides a leading sign that a trader should enter or
exit a position
The RSI is an oscillator so it is shown on a scale from zero to 100 If
the RSI is above 70 the market would often be thought of as
overbought and appear as red on the chart (below) And if the
indicator falls below the 30 level the market is usually considered
oversold and will appear in green on the chart
Technical Level EASYWAYLEARN ACADEMY
SAHALSOFTWARE ndash SAHAL UNIVERSITY
Eng Mohamed Jama
As mentioned the danger with leading indicators is that they can
provide premature or false signals With the RSI it is possible that the
market will sustain overbought or oversold conditions for long periods
of time without reversing This makes it important to have suitable risk
management measures in place such as stops and limits
Stochastic oscillator
Another popular example of a leading indicator is the stochastic
oscillator which is used to compare recent closing prices to the
previous trading range
The stochastic is based on the idea that market momentum changes
direction much faster than volume or price so it can be used to predict
the direction of market movements If the oscillator reaches a reading
of 80 or over the market would be considered overbought while
anything under 20 would be thought of as oversold
Technical Level EASYWAYLEARN ACADEMY
SAHALSOFTWARE ndash SAHAL UNIVERSITY
Eng Mohamed Jama
The oscillator is shown as two lines on the chart the K (the black
line on the chart below) and the D (the red dotted line below) When
these two lines cross it is seen as a leading signal that a change in
market direction is approaching
During volatile market conditions the stochastic is prone to false
signals To prevent this impacting your trades you could use the
stochastic in conjunction with other indicators or use it as a filter for
Technical Level EASYWAYLEARN ACADEMY
SAHALSOFTWARE ndash SAHAL UNIVERSITY
Eng Mohamed Jama
your trades rather than a trigger This would mean entering the market
once the trend is confirmed as you would with a lagging indicator
Williams R
The Williams percent range more commonly known as the Williams
R is very similar to the stochastic oscillator The main difference
being that it works on a negative scale ndash so it ranges between zero
and -100 and uses -20 and -80 as the overbought and oversold
signals respectively
So on the below chart the green line below -80 indicates that the
price is likely to rise While the red line above -20 indicates the price is
likely to fall
Technical Level EASYWAYLEARN ACADEMY
SAHALSOFTWARE ndash SAHAL UNIVERSITY
Eng Mohamed Jama
The indicator is highly responsive meaning it might start to move to
highs or lows even if the actual market price does not follow suit As
the Williams R is leading these signals can be premature and less
reliable than other entry signals which is why some traders prefer to
use -10 and -90 as more extreme price signals
On-balance volume (OBV)
Technical Level EASYWAYLEARN ACADEMY
SAHALSOFTWARE ndash SAHAL UNIVERSITY
Eng Mohamed Jama
On-balance volume (OBV) is another leading momentum-based
indicator It looks at volume to enable traders to make predictions
about the market price ndash OBV is largely used in shares trading as
volume is well documented by stock exchanges
Traders who use OBV as a leading indicator will focus on increases or
decreases in volume without the equivalent change in price This is
believed to be an indication that the price will increase or decrease
imminently
As a leading indicator OBV is prone to giving false signals especially
as the indicator can be thrown off by huge spikes in volume around
announcements that surprise the market Although volume changes
this is not always indicative of a trend and can cause traders to open
positions prematurely
As with the other leading indicators the OBV is often used in
conjunction with lagging indicators and a thorough risk management
strategy
Technical Level EASYWAYLEARN ACADEMY
SAHALSOFTWARE ndash SAHAL UNIVERSITY
Eng Mohamed Jama
Three popular lagging indicators
Popular lagging indicators include
1 Moving averages
2 The MACD indicator
3 Bollinger bands
Lagging indicators are primarily used to filter out the noise from short-
term market movements and confirm long-term trends They are
usually drawn onto the price chart itself unlike leading indicators
which usually appear in separate windows
Moving averages
Moving averages (MAs) are categorized as a lagging indicator
because they are based on historical data
Buy and sell signals are generated when the price line crosses the MA
or when two MA lines cross each other However because the moving
average is calculated using previous price points the current market
price will be ahead of the MA
Technical Level EASYWAYLEARN ACADEMY
SAHALSOFTWARE ndash SAHAL UNIVERSITY
Eng Mohamed Jama
In the below 50-day MA example the moving average has crossed
the price from above indicating an upward reversal is imminent
However we can see that the MA is slower to pick up the bullish trend
when it does occur
Moving averages can be calculated over any timeframe depending on
the traderrsquos goals ndash but the longer the time frame the longer the lag
Technical Level EASYWAYLEARN ACADEMY
SAHALSOFTWARE ndash SAHAL UNIVERSITY
Eng Mohamed Jama
So a MA of 300 days would have a far longer delay than an MA of 50
days
It is possible for lagging indicators to give off false signals but it is less
likely as they are slower to react
MACD indicator
Moving averages can be used on their own or they can be the basis
of other technical indicators such as the moving average
convergence divergence (MACD) As it is based on MAs the MACD is
inherently a trend-following or lagging indicator However it has been
argued that different components of the MACD provide traders with
different opportunities
There are three components to the tool two moving averages and a
histogram The two moving averages (the signal line and the MACD
line) are invariably lagging indicators as they only provide signals
once the two lines have crossed each other by which time the trend is
already in motion
Technical Level EASYWAYLEARN ACADEMY
SAHALSOFTWARE ndash SAHAL UNIVERSITY
Eng Mohamed Jama
Source IG charts
But the MACD histogram is sometimes considered a leading indicator
as it is used to anticipate signal crossovers in between the two moving
averages The bars on the histogram represents the difference
between the two MAs ndash as the bars move further away from the
central zero line it means the MAs are moving further apart Once this
expansion is over a lsquohumprsquo appears on the histogram which is a sign
the MAs will tighten again and a crossover will occur
Technical Level EASYWAYLEARN ACADEMY
SAHALSOFTWARE ndash SAHAL UNIVERSITY
Eng Mohamed Jama
Although the histogram can be used to enter positions ahead of the
crossovers the moving averages inherently fall behind the market
price So in general it is a lagging indicator This means that there are
instances where the market price may reach a reversal point before
the signal has even been generated ndash which would be deemed a false
signal
Bollinger bands
The Bollinger band tool is a lagging indicator as it is based on a 20-
day simple moving average (SMA) and two outer lines These outer
bands represent the positive and negative standard deviations away
from the SMA and are used as a measure of volatility When levels of
volatility increase the bands will widen and as volatility decreases
they will contract
When the price reaches the outer bands of the Bollinger it often acts
as a trigger for the market to rebound back towards the central 20-
period moving average
Technical Level EASYWAYLEARN ACADEMY
SAHALSOFTWARE ndash SAHAL UNIVERSITY
Eng Mohamed Jama
Source IG charts
There are strategies that suggest the bands have leading indicator
properties but alone they do not give out leading trading signals
Bollinger bands can give no indication of exactly when the change in
volatility might take place or which direction the price will move in
They are merely a sign that a breakout could soon take place giving
bullish and bearish signals
Technical Level EASYWAYLEARN ACADEMY
SAHALSOFTWARE ndash SAHAL UNIVERSITY
Eng Mohamed Jama
This is why traders will often confirm the Bollinger band signals with
price action or use the indicator in conjunction with other lagging tools
or leading indicators such as the RSI
Leading and lagging technical indicators
summed up
A leading indicator is a tool designed to anticipate the future direction
of a market
A lagging indicator is a tool that gives signal once the price movement
has already started
Leading indicators react to prices quickly but this makes them prone to
giving out false signals
Lagging indicators can be more accurate but this is because they are
far slower to react
A lot of popular leading indicators fall into the category of oscillators
including the RSI stochastic oscillator Williams R and OBV
Lagging indicators are drawn onto the price chart itself and include
moving averages the MACD and Bollinger bands
Technical Level EASYWAYLEARN ACADEMY
SAHALSOFTWARE ndash SAHAL UNIVERSITY
Eng Mohamed Jama
Relying solely on either could have negative effects on a strategy
which is why many traders will aim to find a balance of the two
If you feel ready to start using lagging and leading indicators on live
markets you can open an account with IG today Alternatively you
can learn more about financial markets with IG Academy
Lesson 12 Confirmation Checklist = High Probability Trades
Technical Level EASYWAYLEARN ACADEMY
SAHALSOFTWARE ndash SAHAL UNIVERSITY
Eng Mohamed Jama
SupportResistance
Price Reversal Zone
Trend-Line
Pull Back
Technical Level EASYWAYLEARN ACADEMY
SAHALSOFTWARE ndash SAHAL UNIVERSITY
Eng Mohamed Jama
Technical Level EASYWAYLEARN ACADEMY
SAHALSOFTWARE ndash SAHAL UNIVERSITY
Eng Mohamed Jama
Technical Level EASYWAYLEARN ACADEMY
SAHALSOFTWARE ndash SAHAL UNIVERSITY
Eng Mohamed Jama
Technical Level EASYWAYLEARN ACADEMY
SAHALSOFTWARE ndash SAHAL UNIVERSITY
Eng Mohamed Jama
END
Technical Level EASYWAYLEARN ACADEMY
SAHALSOFTWARE ndash SAHAL UNIVERSITY
Eng Mohamed Jama

Technical Level EASYWAYLEARN ACADEMY
SAHALSOFTWARE ndash SAHAL UNIVERSITY
Eng Mohamed Jama
Technical Level EASYWAYLEARN ACADEMY
SAHALSOFTWARE ndash SAHAL UNIVERSITY
Eng Mohamed Jama
Technical Level EASYWAYLEARN ACADEMY
SAHALSOFTWARE ndash SAHAL UNIVERSITY
Eng Mohamed Jama
Lesson 08 Market Structure ndash SR and Trend
- SUPPORT amp RESISTANCE
- Trend ndash Uptrend amp Downtrend Rang Market
- Chart Patterns Candlestick
Support and Resistance Support and Resistance is one of the most used techniques in technical analysis based on a concept thats easy to understand but difficult to master It identifies price levels where historically the price reacted either by reversing or at least by slowing down and prior price behavior at these levels can leave clues for future price behavior There are many different ways to identify these levels and to apply them in trading Support and Resistance levels can be identifiable turning points areas of congestion or psychological levels (round numbers that traders attach significance to) The higher the timeframe the more relevant the levels become
Technical Level EASYWAYLEARN ACADEMY
SAHALSOFTWARE ndash SAHAL UNIVERSITY
Eng Mohamed Jama
Technical Level EASYWAYLEARN ACADEMY
SAHALSOFTWARE ndash SAHAL UNIVERSITY
Eng Mohamed Jama
Support and Resistance trading strategy
Mark your areas of Support amp Resistance (SR)
Wait for a directional move into SR
Wait for price rejection at SR
Enter on the next candle
Use Risk Management
Create TK and SL
Note
Technical Level EASYWAYLEARN ACADEMY
SAHALSOFTWARE ndash SAHAL UNIVERSITY
Eng Mohamed Jama
Support ndash Area on your chart with potential buying pressure
Resistance ndash Area on your chart with potential selling pressure
Technical Level EASYWAYLEARN ACADEMY
SAHALSOFTWARE ndash SAHAL UNIVERSITY
Eng Mohamed Jama
Lesson 09 Price Reversal ZonendashDemand and Supply ndashRetest - Strategy
Technical Level EASYWAYLEARN ACADEMY
SAHALSOFTWARE ndash SAHAL UNIVERSITY
Eng Mohamed Jama
- Demand and Supply Zone ndash Strategy ndash
- Break out and Retest ndash Strategy
- Warning - Fake Break out -
Retracements are temporary price reversals that take place within a larger trend A reversal
on the other hand is when the trend changes direction With a reversal the price is likely to
continue in that reversal direction for an extended period
Technical Level EASYWAYLEARN ACADEMY
SAHALSOFTWARE ndash SAHAL UNIVERSITY
Eng Mohamed Jama
Technical Level EASYWAYLEARN ACADEMY
SAHALSOFTWARE ndash SAHAL UNIVERSITY
Eng Mohamed Jama
Technical Level EASYWAYLEARN ACADEMY
SAHALSOFTWARE ndash SAHAL UNIVERSITY
Eng Mohamed Jama
Technical Level EASYWAYLEARN ACADEMY
SAHALSOFTWARE ndash SAHAL UNIVERSITY
Eng Mohamed Jama
Technical Level EASYWAYLEARN ACADEMY
SAHALSOFTWARE ndash SAHAL UNIVERSITY
Eng Mohamed Jama
Technical Level EASYWAYLEARN ACADEMY
SAHALSOFTWARE ndash SAHAL UNIVERSITY
Eng Mohamed Jama
Technical Level EASYWAYLEARN ACADEMY
SAHALSOFTWARE ndash SAHAL UNIVERSITY
Eng Mohamed Jama
Technical Level EASYWAYLEARN ACADEMY
SAHALSOFTWARE ndash SAHAL UNIVERSITY
Eng Mohamed Jama
Technical Level EASYWAYLEARN ACADEMY
SAHALSOFTWARE ndash SAHAL UNIVERSITY
Eng Mohamed Jama
Lesson 10 Trend-Lines ndash Uptrend amp Downtrend
- Uptrend -gt HLHHHLHHHL ndash Swing High ndash Swing low
- Downtrend -gt HLLHLLLHLL ndash Swing low - Swing High
- Ranging Market ndash BOX
- Impulse or Run Pull Back or Correction or Retracement
Technical Level EASYWAYLEARN ACADEMY
SAHALSOFTWARE ndash SAHAL UNIVERSITY
Eng Mohamed Jama
Technical Level EASYWAYLEARN ACADEMY
SAHALSOFTWARE ndash SAHAL UNIVERSITY
Eng Mohamed Jama
Technical Level EASYWAYLEARN ACADEMY
SAHALSOFTWARE ndash SAHAL UNIVERSITY
Eng Mohamed Jama
Technical Level EASYWAYLEARN ACADEMY
SAHALSOFTWARE ndash SAHAL UNIVERSITY
Eng Mohamed Jama
Technical Level EASYWAYLEARN ACADEMY
SAHALSOFTWARE ndash SAHAL UNIVERSITY
Eng Mohamed Jama
Technical Level EASYWAYLEARN ACADEMY
SAHALSOFTWARE ndash SAHAL UNIVERSITY
Eng Mohamed Jama
Break and Retest Strategy
Waiting for a Retest Will Make You a Better Forex Trader
Technical Level EASYWAYLEARN ACADEMY
SAHALSOFTWARE ndash SAHAL UNIVERSITY
Eng Mohamed Jama
Technical Level EASYWAYLEARN ACADEMY
SAHALSOFTWARE ndash SAHAL UNIVERSITY
Eng Mohamed Jama
Lesson 11 Indicators (Leading and Lagging)
+ RSI Indicator
Leading and lagging indicators what you need to know
Technical traders use indicators to identify market patterns and
trends Most of these indicators fall into two categories leading
and lagging Discover some popular leading and lagging
indicators and how to use them
Technical Level EASYWAYLEARN ACADEMY
SAHALSOFTWARE ndash SAHAL UNIVERSITY
Eng Mohamed Jama
What is a leading technical indicator
A leading indicator is a tool designed to anticipate the future direction
of a market in order to enable traders to predict market movements
ahead of time
Technical Level EASYWAYLEARN ACADEMY
SAHALSOFTWARE ndash SAHAL UNIVERSITY
Eng Mohamed Jama
In theory if a leading indicator gives the correct signal a trader can
get in before the market movement and ride the entire trend However
leading indicators are by no means 100 accurate which is why they
are often combined with other forms of technical analysis
What is a lagging technical indicator
A lagging indicator is a tool that provides delayed feedback which
means it gives a signal once the price movement has already passed
Technical Level EASYWAYLEARN ACADEMY
SAHALSOFTWARE ndash SAHAL UNIVERSITY
Eng Mohamed Jama
or is in progress These are used by traders to confirm the price trend
before they enter a trade
These indicators are commonly used by trend traders ndash they donrsquot
show any upcoming price moves but confirm that a trend is underway
This tends to give traders more confidence that they are correct in
their assumptions rather than providing a specific trigger for entering
the market
Technical Level EASYWAYLEARN ACADEMY
SAHALSOFTWARE ndash SAHAL UNIVERSITY
Eng Mohamed Jama
Leading vs lagging technical indicators
whatrsquos the difference
The most obvious difference is that leading indicators predict market
movements while lagging indicators confirm trends that are already
taking place Both leading and lagging indicators have their own
advantages and drawbacks so itrsquos crucial to familiarise yourself with
how each works and decide which fits in with your strategy
Leading indicators react to prices quickly which can be great for
short-term traders but makes them prone to giving out false signals ndash
these happen when a signal indicates itrsquos time to enter the market but
the trend promptly reverses Conversely lagging indicators are far
slower to react which means that traders would have more accuracy
but could be late in entering the market
Relying solely on either could have negative effects on a strategy
which is why many traders will aim to find a balance of the two
Technical Level EASYWAYLEARN ACADEMY
SAHALSOFTWARE ndash SAHAL UNIVERSITY
Eng Mohamed Jama
Four popular leading indicators
Popular leading indicators include
1 The relative strength index (RSI)
2 The stochastic oscillator
3 Williams R
4 On-balance volume (OBV)
A lot of popular leading indicators fall into the category of oscillators as
these can identify a possible trend reversal before it happens
However not all leading indicators will use the same calculations so
there is the possibility that different indicators will show different
signals
Relative strength index (RSI)
The relative strength index (RSI) is a momentum indicator which
traders can use to identify whether a market is overbought or
Technical Level EASYWAYLEARN ACADEMY
SAHALSOFTWARE ndash SAHAL UNIVERSITY
Eng Mohamed Jama
oversold When the RSI gives a signal it is believed that the market
will reverse ndash this provides a leading sign that a trader should enter or
exit a position
The RSI is an oscillator so it is shown on a scale from zero to 100 If
the RSI is above 70 the market would often be thought of as
overbought and appear as red on the chart (below) And if the
indicator falls below the 30 level the market is usually considered
oversold and will appear in green on the chart
Technical Level EASYWAYLEARN ACADEMY
SAHALSOFTWARE ndash SAHAL UNIVERSITY
Eng Mohamed Jama
As mentioned the danger with leading indicators is that they can
provide premature or false signals With the RSI it is possible that the
market will sustain overbought or oversold conditions for long periods
of time without reversing This makes it important to have suitable risk
management measures in place such as stops and limits
Stochastic oscillator
Another popular example of a leading indicator is the stochastic
oscillator which is used to compare recent closing prices to the
previous trading range
The stochastic is based on the idea that market momentum changes
direction much faster than volume or price so it can be used to predict
the direction of market movements If the oscillator reaches a reading
of 80 or over the market would be considered overbought while
anything under 20 would be thought of as oversold
Technical Level EASYWAYLEARN ACADEMY
SAHALSOFTWARE ndash SAHAL UNIVERSITY
Eng Mohamed Jama
The oscillator is shown as two lines on the chart the K (the black
line on the chart below) and the D (the red dotted line below) When
these two lines cross it is seen as a leading signal that a change in
market direction is approaching
During volatile market conditions the stochastic is prone to false
signals To prevent this impacting your trades you could use the
stochastic in conjunction with other indicators or use it as a filter for
Technical Level EASYWAYLEARN ACADEMY
SAHALSOFTWARE ndash SAHAL UNIVERSITY
Eng Mohamed Jama
your trades rather than a trigger This would mean entering the market
once the trend is confirmed as you would with a lagging indicator
Williams R
The Williams percent range more commonly known as the Williams
R is very similar to the stochastic oscillator The main difference
being that it works on a negative scale ndash so it ranges between zero
and -100 and uses -20 and -80 as the overbought and oversold
signals respectively
So on the below chart the green line below -80 indicates that the
price is likely to rise While the red line above -20 indicates the price is
likely to fall
Technical Level EASYWAYLEARN ACADEMY
SAHALSOFTWARE ndash SAHAL UNIVERSITY
Eng Mohamed Jama
The indicator is highly responsive meaning it might start to move to
highs or lows even if the actual market price does not follow suit As
the Williams R is leading these signals can be premature and less
reliable than other entry signals which is why some traders prefer to
use -10 and -90 as more extreme price signals
On-balance volume (OBV)
Technical Level EASYWAYLEARN ACADEMY
SAHALSOFTWARE ndash SAHAL UNIVERSITY
Eng Mohamed Jama
On-balance volume (OBV) is another leading momentum-based
indicator It looks at volume to enable traders to make predictions
about the market price ndash OBV is largely used in shares trading as
volume is well documented by stock exchanges
Traders who use OBV as a leading indicator will focus on increases or
decreases in volume without the equivalent change in price This is
believed to be an indication that the price will increase or decrease
imminently
As a leading indicator OBV is prone to giving false signals especially
as the indicator can be thrown off by huge spikes in volume around
announcements that surprise the market Although volume changes
this is not always indicative of a trend and can cause traders to open
positions prematurely
As with the other leading indicators the OBV is often used in
conjunction with lagging indicators and a thorough risk management
strategy
Technical Level EASYWAYLEARN ACADEMY
SAHALSOFTWARE ndash SAHAL UNIVERSITY
Eng Mohamed Jama
Three popular lagging indicators
Popular lagging indicators include
1 Moving averages
2 The MACD indicator
3 Bollinger bands
Lagging indicators are primarily used to filter out the noise from short-
term market movements and confirm long-term trends They are
usually drawn onto the price chart itself unlike leading indicators
which usually appear in separate windows
Moving averages
Moving averages (MAs) are categorized as a lagging indicator
because they are based on historical data
Buy and sell signals are generated when the price line crosses the MA
or when two MA lines cross each other However because the moving
average is calculated using previous price points the current market
price will be ahead of the MA
Technical Level EASYWAYLEARN ACADEMY
SAHALSOFTWARE ndash SAHAL UNIVERSITY
Eng Mohamed Jama
In the below 50-day MA example the moving average has crossed
the price from above indicating an upward reversal is imminent
However we can see that the MA is slower to pick up the bullish trend
when it does occur
Moving averages can be calculated over any timeframe depending on
the traderrsquos goals ndash but the longer the time frame the longer the lag
Technical Level EASYWAYLEARN ACADEMY
SAHALSOFTWARE ndash SAHAL UNIVERSITY
Eng Mohamed Jama
So a MA of 300 days would have a far longer delay than an MA of 50
days
It is possible for lagging indicators to give off false signals but it is less
likely as they are slower to react
MACD indicator
Moving averages can be used on their own or they can be the basis
of other technical indicators such as the moving average
convergence divergence (MACD) As it is based on MAs the MACD is
inherently a trend-following or lagging indicator However it has been
argued that different components of the MACD provide traders with
different opportunities
There are three components to the tool two moving averages and a
histogram The two moving averages (the signal line and the MACD
line) are invariably lagging indicators as they only provide signals
once the two lines have crossed each other by which time the trend is
already in motion
Technical Level EASYWAYLEARN ACADEMY
SAHALSOFTWARE ndash SAHAL UNIVERSITY
Eng Mohamed Jama
Source IG charts
But the MACD histogram is sometimes considered a leading indicator
as it is used to anticipate signal crossovers in between the two moving
averages The bars on the histogram represents the difference
between the two MAs ndash as the bars move further away from the
central zero line it means the MAs are moving further apart Once this
expansion is over a lsquohumprsquo appears on the histogram which is a sign
the MAs will tighten again and a crossover will occur
Technical Level EASYWAYLEARN ACADEMY
SAHALSOFTWARE ndash SAHAL UNIVERSITY
Eng Mohamed Jama
Although the histogram can be used to enter positions ahead of the
crossovers the moving averages inherently fall behind the market
price So in general it is a lagging indicator This means that there are
instances where the market price may reach a reversal point before
the signal has even been generated ndash which would be deemed a false
signal
Bollinger bands
The Bollinger band tool is a lagging indicator as it is based on a 20-
day simple moving average (SMA) and two outer lines These outer
bands represent the positive and negative standard deviations away
from the SMA and are used as a measure of volatility When levels of
volatility increase the bands will widen and as volatility decreases
they will contract
When the price reaches the outer bands of the Bollinger it often acts
as a trigger for the market to rebound back towards the central 20-
period moving average
Technical Level EASYWAYLEARN ACADEMY
SAHALSOFTWARE ndash SAHAL UNIVERSITY
Eng Mohamed Jama
Source IG charts
There are strategies that suggest the bands have leading indicator
properties but alone they do not give out leading trading signals
Bollinger bands can give no indication of exactly when the change in
volatility might take place or which direction the price will move in
They are merely a sign that a breakout could soon take place giving
bullish and bearish signals
Technical Level EASYWAYLEARN ACADEMY
SAHALSOFTWARE ndash SAHAL UNIVERSITY
Eng Mohamed Jama
This is why traders will often confirm the Bollinger band signals with
price action or use the indicator in conjunction with other lagging tools
or leading indicators such as the RSI
Leading and lagging technical indicators
summed up
A leading indicator is a tool designed to anticipate the future direction
of a market
A lagging indicator is a tool that gives signal once the price movement
has already started
Leading indicators react to prices quickly but this makes them prone to
giving out false signals
Lagging indicators can be more accurate but this is because they are
far slower to react
A lot of popular leading indicators fall into the category of oscillators
including the RSI stochastic oscillator Williams R and OBV
Lagging indicators are drawn onto the price chart itself and include
moving averages the MACD and Bollinger bands
Technical Level EASYWAYLEARN ACADEMY
SAHALSOFTWARE ndash SAHAL UNIVERSITY
Eng Mohamed Jama
Relying solely on either could have negative effects on a strategy
which is why many traders will aim to find a balance of the two
If you feel ready to start using lagging and leading indicators on live
markets you can open an account with IG today Alternatively you
can learn more about financial markets with IG Academy
Lesson 12 Confirmation Checklist = High Probability Trades
Technical Level EASYWAYLEARN ACADEMY
SAHALSOFTWARE ndash SAHAL UNIVERSITY
Eng Mohamed Jama
SupportResistance
Price Reversal Zone
Trend-Line
Pull Back
Technical Level EASYWAYLEARN ACADEMY
SAHALSOFTWARE ndash SAHAL UNIVERSITY
Eng Mohamed Jama
Technical Level EASYWAYLEARN ACADEMY
SAHALSOFTWARE ndash SAHAL UNIVERSITY
Eng Mohamed Jama
Technical Level EASYWAYLEARN ACADEMY
SAHALSOFTWARE ndash SAHAL UNIVERSITY
Eng Mohamed Jama
Technical Level EASYWAYLEARN ACADEMY
SAHALSOFTWARE ndash SAHAL UNIVERSITY
Eng Mohamed Jama
END
Technical Level EASYWAYLEARN ACADEMY
SAHALSOFTWARE ndash SAHAL UNIVERSITY
Eng Mohamed Jama

Technical Level EASYWAYLEARN ACADEMY
SAHALSOFTWARE ndash SAHAL UNIVERSITY
Eng Mohamed Jama
Technical Level EASYWAYLEARN ACADEMY
SAHALSOFTWARE ndash SAHAL UNIVERSITY
Eng Mohamed Jama
Lesson 08 Market Structure ndash SR and Trend
- SUPPORT amp RESISTANCE
- Trend ndash Uptrend amp Downtrend Rang Market
- Chart Patterns Candlestick
Support and Resistance Support and Resistance is one of the most used techniques in technical analysis based on a concept thats easy to understand but difficult to master It identifies price levels where historically the price reacted either by reversing or at least by slowing down and prior price behavior at these levels can leave clues for future price behavior There are many different ways to identify these levels and to apply them in trading Support and Resistance levels can be identifiable turning points areas of congestion or psychological levels (round numbers that traders attach significance to) The higher the timeframe the more relevant the levels become
Technical Level EASYWAYLEARN ACADEMY
SAHALSOFTWARE ndash SAHAL UNIVERSITY
Eng Mohamed Jama
Technical Level EASYWAYLEARN ACADEMY
SAHALSOFTWARE ndash SAHAL UNIVERSITY
Eng Mohamed Jama
Support and Resistance trading strategy
Mark your areas of Support amp Resistance (SR)
Wait for a directional move into SR
Wait for price rejection at SR
Enter on the next candle
Use Risk Management
Create TK and SL
Note
Technical Level EASYWAYLEARN ACADEMY
SAHALSOFTWARE ndash SAHAL UNIVERSITY
Eng Mohamed Jama
Support ndash Area on your chart with potential buying pressure
Resistance ndash Area on your chart with potential selling pressure
Technical Level EASYWAYLEARN ACADEMY
SAHALSOFTWARE ndash SAHAL UNIVERSITY
Eng Mohamed Jama
Lesson 09 Price Reversal ZonendashDemand and Supply ndashRetest - Strategy
Technical Level EASYWAYLEARN ACADEMY
SAHALSOFTWARE ndash SAHAL UNIVERSITY
Eng Mohamed Jama
- Demand and Supply Zone ndash Strategy ndash
- Break out and Retest ndash Strategy
- Warning - Fake Break out -
Retracements are temporary price reversals that take place within a larger trend A reversal
on the other hand is when the trend changes direction With a reversal the price is likely to
continue in that reversal direction for an extended period
Technical Level EASYWAYLEARN ACADEMY
SAHALSOFTWARE ndash SAHAL UNIVERSITY
Eng Mohamed Jama
Technical Level EASYWAYLEARN ACADEMY
SAHALSOFTWARE ndash SAHAL UNIVERSITY
Eng Mohamed Jama
Technical Level EASYWAYLEARN ACADEMY
SAHALSOFTWARE ndash SAHAL UNIVERSITY
Eng Mohamed Jama
Technical Level EASYWAYLEARN ACADEMY
SAHALSOFTWARE ndash SAHAL UNIVERSITY
Eng Mohamed Jama
Technical Level EASYWAYLEARN ACADEMY
SAHALSOFTWARE ndash SAHAL UNIVERSITY
Eng Mohamed Jama
Technical Level EASYWAYLEARN ACADEMY
SAHALSOFTWARE ndash SAHAL UNIVERSITY
Eng Mohamed Jama
Technical Level EASYWAYLEARN ACADEMY
SAHALSOFTWARE ndash SAHAL UNIVERSITY
Eng Mohamed Jama
Technical Level EASYWAYLEARN ACADEMY
SAHALSOFTWARE ndash SAHAL UNIVERSITY
Eng Mohamed Jama
Technical Level EASYWAYLEARN ACADEMY
SAHALSOFTWARE ndash SAHAL UNIVERSITY
Eng Mohamed Jama
Lesson 10 Trend-Lines ndash Uptrend amp Downtrend
- Uptrend -gt HLHHHLHHHL ndash Swing High ndash Swing low
- Downtrend -gt HLLHLLLHLL ndash Swing low - Swing High
- Ranging Market ndash BOX
- Impulse or Run Pull Back or Correction or Retracement
Technical Level EASYWAYLEARN ACADEMY
SAHALSOFTWARE ndash SAHAL UNIVERSITY
Eng Mohamed Jama
Technical Level EASYWAYLEARN ACADEMY
SAHALSOFTWARE ndash SAHAL UNIVERSITY
Eng Mohamed Jama
Technical Level EASYWAYLEARN ACADEMY
SAHALSOFTWARE ndash SAHAL UNIVERSITY
Eng Mohamed Jama
Technical Level EASYWAYLEARN ACADEMY
SAHALSOFTWARE ndash SAHAL UNIVERSITY
Eng Mohamed Jama
Technical Level EASYWAYLEARN ACADEMY
SAHALSOFTWARE ndash SAHAL UNIVERSITY
Eng Mohamed Jama
Technical Level EASYWAYLEARN ACADEMY
SAHALSOFTWARE ndash SAHAL UNIVERSITY
Eng Mohamed Jama
Break and Retest Strategy
Waiting for a Retest Will Make You a Better Forex Trader
Technical Level EASYWAYLEARN ACADEMY
SAHALSOFTWARE ndash SAHAL UNIVERSITY
Eng Mohamed Jama
Technical Level EASYWAYLEARN ACADEMY
SAHALSOFTWARE ndash SAHAL UNIVERSITY
Eng Mohamed Jama
Lesson 11 Indicators (Leading and Lagging)
+ RSI Indicator
Leading and lagging indicators what you need to know
Technical traders use indicators to identify market patterns and
trends Most of these indicators fall into two categories leading
and lagging Discover some popular leading and lagging
indicators and how to use them
Technical Level EASYWAYLEARN ACADEMY
SAHALSOFTWARE ndash SAHAL UNIVERSITY
Eng Mohamed Jama
What is a leading technical indicator
A leading indicator is a tool designed to anticipate the future direction
of a market in order to enable traders to predict market movements
ahead of time
Technical Level EASYWAYLEARN ACADEMY
SAHALSOFTWARE ndash SAHAL UNIVERSITY
Eng Mohamed Jama
In theory if a leading indicator gives the correct signal a trader can
get in before the market movement and ride the entire trend However
leading indicators are by no means 100 accurate which is why they
are often combined with other forms of technical analysis
What is a lagging technical indicator
A lagging indicator is a tool that provides delayed feedback which
means it gives a signal once the price movement has already passed
Technical Level EASYWAYLEARN ACADEMY
SAHALSOFTWARE ndash SAHAL UNIVERSITY
Eng Mohamed Jama
or is in progress These are used by traders to confirm the price trend
before they enter a trade
These indicators are commonly used by trend traders ndash they donrsquot
show any upcoming price moves but confirm that a trend is underway
This tends to give traders more confidence that they are correct in
their assumptions rather than providing a specific trigger for entering
the market
Technical Level EASYWAYLEARN ACADEMY
SAHALSOFTWARE ndash SAHAL UNIVERSITY
Eng Mohamed Jama
Leading vs lagging technical indicators
whatrsquos the difference
The most obvious difference is that leading indicators predict market
movements while lagging indicators confirm trends that are already
taking place Both leading and lagging indicators have their own
advantages and drawbacks so itrsquos crucial to familiarise yourself with
how each works and decide which fits in with your strategy
Leading indicators react to prices quickly which can be great for
short-term traders but makes them prone to giving out false signals ndash
these happen when a signal indicates itrsquos time to enter the market but
the trend promptly reverses Conversely lagging indicators are far
slower to react which means that traders would have more accuracy
but could be late in entering the market
Relying solely on either could have negative effects on a strategy
which is why many traders will aim to find a balance of the two
Technical Level EASYWAYLEARN ACADEMY
SAHALSOFTWARE ndash SAHAL UNIVERSITY
Eng Mohamed Jama
Four popular leading indicators
Popular leading indicators include
1 The relative strength index (RSI)
2 The stochastic oscillator
3 Williams R
4 On-balance volume (OBV)
A lot of popular leading indicators fall into the category of oscillators as
these can identify a possible trend reversal before it happens
However not all leading indicators will use the same calculations so
there is the possibility that different indicators will show different
signals
Relative strength index (RSI)
The relative strength index (RSI) is a momentum indicator which
traders can use to identify whether a market is overbought or
Technical Level EASYWAYLEARN ACADEMY
SAHALSOFTWARE ndash SAHAL UNIVERSITY
Eng Mohamed Jama
oversold When the RSI gives a signal it is believed that the market
will reverse ndash this provides a leading sign that a trader should enter or
exit a position
The RSI is an oscillator so it is shown on a scale from zero to 100 If
the RSI is above 70 the market would often be thought of as
overbought and appear as red on the chart (below) And if the
indicator falls below the 30 level the market is usually considered
oversold and will appear in green on the chart
Technical Level EASYWAYLEARN ACADEMY
SAHALSOFTWARE ndash SAHAL UNIVERSITY
Eng Mohamed Jama
As mentioned the danger with leading indicators is that they can
provide premature or false signals With the RSI it is possible that the
market will sustain overbought or oversold conditions for long periods
of time without reversing This makes it important to have suitable risk
management measures in place such as stops and limits
Stochastic oscillator
Another popular example of a leading indicator is the stochastic
oscillator which is used to compare recent closing prices to the
previous trading range
The stochastic is based on the idea that market momentum changes
direction much faster than volume or price so it can be used to predict
the direction of market movements If the oscillator reaches a reading
of 80 or over the market would be considered overbought while
anything under 20 would be thought of as oversold
Technical Level EASYWAYLEARN ACADEMY
SAHALSOFTWARE ndash SAHAL UNIVERSITY
Eng Mohamed Jama
The oscillator is shown as two lines on the chart the K (the black
line on the chart below) and the D (the red dotted line below) When
these two lines cross it is seen as a leading signal that a change in
market direction is approaching
During volatile market conditions the stochastic is prone to false
signals To prevent this impacting your trades you could use the
stochastic in conjunction with other indicators or use it as a filter for
Technical Level EASYWAYLEARN ACADEMY
SAHALSOFTWARE ndash SAHAL UNIVERSITY
Eng Mohamed Jama
your trades rather than a trigger This would mean entering the market
once the trend is confirmed as you would with a lagging indicator
Williams R
The Williams percent range more commonly known as the Williams
R is very similar to the stochastic oscillator The main difference
being that it works on a negative scale ndash so it ranges between zero
and -100 and uses -20 and -80 as the overbought and oversold
signals respectively
So on the below chart the green line below -80 indicates that the
price is likely to rise While the red line above -20 indicates the price is
likely to fall
Technical Level EASYWAYLEARN ACADEMY
SAHALSOFTWARE ndash SAHAL UNIVERSITY
Eng Mohamed Jama
The indicator is highly responsive meaning it might start to move to
highs or lows even if the actual market price does not follow suit As
the Williams R is leading these signals can be premature and less
reliable than other entry signals which is why some traders prefer to
use -10 and -90 as more extreme price signals
On-balance volume (OBV)
Technical Level EASYWAYLEARN ACADEMY
SAHALSOFTWARE ndash SAHAL UNIVERSITY
Eng Mohamed Jama
On-balance volume (OBV) is another leading momentum-based
indicator It looks at volume to enable traders to make predictions
about the market price ndash OBV is largely used in shares trading as
volume is well documented by stock exchanges
Traders who use OBV as a leading indicator will focus on increases or
decreases in volume without the equivalent change in price This is
believed to be an indication that the price will increase or decrease
imminently
As a leading indicator OBV is prone to giving false signals especially
as the indicator can be thrown off by huge spikes in volume around
announcements that surprise the market Although volume changes
this is not always indicative of a trend and can cause traders to open
positions prematurely
As with the other leading indicators the OBV is often used in
conjunction with lagging indicators and a thorough risk management
strategy
Technical Level EASYWAYLEARN ACADEMY
SAHALSOFTWARE ndash SAHAL UNIVERSITY
Eng Mohamed Jama
Three popular lagging indicators
Popular lagging indicators include
1 Moving averages
2 The MACD indicator
3 Bollinger bands
Lagging indicators are primarily used to filter out the noise from short-
term market movements and confirm long-term trends They are
usually drawn onto the price chart itself unlike leading indicators
which usually appear in separate windows
Moving averages
Moving averages (MAs) are categorized as a lagging indicator
because they are based on historical data
Buy and sell signals are generated when the price line crosses the MA
or when two MA lines cross each other However because the moving
average is calculated using previous price points the current market
price will be ahead of the MA
Technical Level EASYWAYLEARN ACADEMY
SAHALSOFTWARE ndash SAHAL UNIVERSITY
Eng Mohamed Jama
In the below 50-day MA example the moving average has crossed
the price from above indicating an upward reversal is imminent
However we can see that the MA is slower to pick up the bullish trend
when it does occur
Moving averages can be calculated over any timeframe depending on
the traderrsquos goals ndash but the longer the time frame the longer the lag
Technical Level EASYWAYLEARN ACADEMY
SAHALSOFTWARE ndash SAHAL UNIVERSITY
Eng Mohamed Jama
So a MA of 300 days would have a far longer delay than an MA of 50
days
It is possible for lagging indicators to give off false signals but it is less
likely as they are slower to react
MACD indicator
Moving averages can be used on their own or they can be the basis
of other technical indicators such as the moving average
convergence divergence (MACD) As it is based on MAs the MACD is
inherently a trend-following or lagging indicator However it has been
argued that different components of the MACD provide traders with
different opportunities
There are three components to the tool two moving averages and a
histogram The two moving averages (the signal line and the MACD
line) are invariably lagging indicators as they only provide signals
once the two lines have crossed each other by which time the trend is
already in motion
Technical Level EASYWAYLEARN ACADEMY
SAHALSOFTWARE ndash SAHAL UNIVERSITY
Eng Mohamed Jama
Source IG charts
But the MACD histogram is sometimes considered a leading indicator
as it is used to anticipate signal crossovers in between the two moving
averages The bars on the histogram represents the difference
between the two MAs ndash as the bars move further away from the
central zero line it means the MAs are moving further apart Once this
expansion is over a lsquohumprsquo appears on the histogram which is a sign
the MAs will tighten again and a crossover will occur
Technical Level EASYWAYLEARN ACADEMY
SAHALSOFTWARE ndash SAHAL UNIVERSITY
Eng Mohamed Jama
Although the histogram can be used to enter positions ahead of the
crossovers the moving averages inherently fall behind the market
price So in general it is a lagging indicator This means that there are
instances where the market price may reach a reversal point before
the signal has even been generated ndash which would be deemed a false
signal
Bollinger bands
The Bollinger band tool is a lagging indicator as it is based on a 20-
day simple moving average (SMA) and two outer lines These outer
bands represent the positive and negative standard deviations away
from the SMA and are used as a measure of volatility When levels of
volatility increase the bands will widen and as volatility decreases
they will contract
When the price reaches the outer bands of the Bollinger it often acts
as a trigger for the market to rebound back towards the central 20-
period moving average
Technical Level EASYWAYLEARN ACADEMY
SAHALSOFTWARE ndash SAHAL UNIVERSITY
Eng Mohamed Jama
Source IG charts
There are strategies that suggest the bands have leading indicator
properties but alone they do not give out leading trading signals
Bollinger bands can give no indication of exactly when the change in
volatility might take place or which direction the price will move in
They are merely a sign that a breakout could soon take place giving
bullish and bearish signals
Technical Level EASYWAYLEARN ACADEMY
SAHALSOFTWARE ndash SAHAL UNIVERSITY
Eng Mohamed Jama
This is why traders will often confirm the Bollinger band signals with
price action or use the indicator in conjunction with other lagging tools
or leading indicators such as the RSI
Leading and lagging technical indicators
summed up
A leading indicator is a tool designed to anticipate the future direction
of a market
A lagging indicator is a tool that gives signal once the price movement
has already started
Leading indicators react to prices quickly but this makes them prone to
giving out false signals
Lagging indicators can be more accurate but this is because they are
far slower to react
A lot of popular leading indicators fall into the category of oscillators
including the RSI stochastic oscillator Williams R and OBV
Lagging indicators are drawn onto the price chart itself and include
moving averages the MACD and Bollinger bands
Technical Level EASYWAYLEARN ACADEMY
SAHALSOFTWARE ndash SAHAL UNIVERSITY
Eng Mohamed Jama
Relying solely on either could have negative effects on a strategy
which is why many traders will aim to find a balance of the two
If you feel ready to start using lagging and leading indicators on live
markets you can open an account with IG today Alternatively you
can learn more about financial markets with IG Academy
Lesson 12 Confirmation Checklist = High Probability Trades
Technical Level EASYWAYLEARN ACADEMY
SAHALSOFTWARE ndash SAHAL UNIVERSITY
Eng Mohamed Jama
SupportResistance
Price Reversal Zone
Trend-Line
Pull Back
Technical Level EASYWAYLEARN ACADEMY
SAHALSOFTWARE ndash SAHAL UNIVERSITY
Eng Mohamed Jama
Technical Level EASYWAYLEARN ACADEMY
SAHALSOFTWARE ndash SAHAL UNIVERSITY
Eng Mohamed Jama
Technical Level EASYWAYLEARN ACADEMY
SAHALSOFTWARE ndash SAHAL UNIVERSITY
Eng Mohamed Jama
Technical Level EASYWAYLEARN ACADEMY
SAHALSOFTWARE ndash SAHAL UNIVERSITY
Eng Mohamed Jama
END
Technical Level EASYWAYLEARN ACADEMY
SAHALSOFTWARE ndash SAHAL UNIVERSITY
Eng Mohamed Jama

Technical Level EASYWAYLEARN ACADEMY
SAHALSOFTWARE ndash SAHAL UNIVERSITY
Eng Mohamed Jama
Lesson 08 Market Structure ndash SR and Trend
- SUPPORT amp RESISTANCE
- Trend ndash Uptrend amp Downtrend Rang Market
- Chart Patterns Candlestick
Support and Resistance Support and Resistance is one of the most used techniques in technical analysis based on a concept thats easy to understand but difficult to master It identifies price levels where historically the price reacted either by reversing or at least by slowing down and prior price behavior at these levels can leave clues for future price behavior There are many different ways to identify these levels and to apply them in trading Support and Resistance levels can be identifiable turning points areas of congestion or psychological levels (round numbers that traders attach significance to) The higher the timeframe the more relevant the levels become
Technical Level EASYWAYLEARN ACADEMY
SAHALSOFTWARE ndash SAHAL UNIVERSITY
Eng Mohamed Jama
Technical Level EASYWAYLEARN ACADEMY
SAHALSOFTWARE ndash SAHAL UNIVERSITY
Eng Mohamed Jama
Support and Resistance trading strategy
Mark your areas of Support amp Resistance (SR)
Wait for a directional move into SR
Wait for price rejection at SR
Enter on the next candle
Use Risk Management
Create TK and SL
Note
Technical Level EASYWAYLEARN ACADEMY
SAHALSOFTWARE ndash SAHAL UNIVERSITY
Eng Mohamed Jama
Support ndash Area on your chart with potential buying pressure
Resistance ndash Area on your chart with potential selling pressure
Technical Level EASYWAYLEARN ACADEMY
SAHALSOFTWARE ndash SAHAL UNIVERSITY
Eng Mohamed Jama
Lesson 09 Price Reversal ZonendashDemand and Supply ndashRetest - Strategy
Technical Level EASYWAYLEARN ACADEMY
SAHALSOFTWARE ndash SAHAL UNIVERSITY
Eng Mohamed Jama
- Demand and Supply Zone ndash Strategy ndash
- Break out and Retest ndash Strategy
- Warning - Fake Break out -
Retracements are temporary price reversals that take place within a larger trend A reversal
on the other hand is when the trend changes direction With a reversal the price is likely to
continue in that reversal direction for an extended period
Technical Level EASYWAYLEARN ACADEMY
SAHALSOFTWARE ndash SAHAL UNIVERSITY
Eng Mohamed Jama
Technical Level EASYWAYLEARN ACADEMY
SAHALSOFTWARE ndash SAHAL UNIVERSITY
Eng Mohamed Jama
Technical Level EASYWAYLEARN ACADEMY
SAHALSOFTWARE ndash SAHAL UNIVERSITY
Eng Mohamed Jama
Technical Level EASYWAYLEARN ACADEMY
SAHALSOFTWARE ndash SAHAL UNIVERSITY
Eng Mohamed Jama
Technical Level EASYWAYLEARN ACADEMY
SAHALSOFTWARE ndash SAHAL UNIVERSITY
Eng Mohamed Jama
Technical Level EASYWAYLEARN ACADEMY
SAHALSOFTWARE ndash SAHAL UNIVERSITY
Eng Mohamed Jama
Technical Level EASYWAYLEARN ACADEMY
SAHALSOFTWARE ndash SAHAL UNIVERSITY
Eng Mohamed Jama
Technical Level EASYWAYLEARN ACADEMY
SAHALSOFTWARE ndash SAHAL UNIVERSITY
Eng Mohamed Jama
Technical Level EASYWAYLEARN ACADEMY
SAHALSOFTWARE ndash SAHAL UNIVERSITY
Eng Mohamed Jama
Lesson 10 Trend-Lines ndash Uptrend amp Downtrend
- Uptrend -gt HLHHHLHHHL ndash Swing High ndash Swing low
- Downtrend -gt HLLHLLLHLL ndash Swing low - Swing High
- Ranging Market ndash BOX
- Impulse or Run Pull Back or Correction or Retracement
Technical Level EASYWAYLEARN ACADEMY
SAHALSOFTWARE ndash SAHAL UNIVERSITY
Eng Mohamed Jama
Technical Level EASYWAYLEARN ACADEMY
SAHALSOFTWARE ndash SAHAL UNIVERSITY
Eng Mohamed Jama
Technical Level EASYWAYLEARN ACADEMY
SAHALSOFTWARE ndash SAHAL UNIVERSITY
Eng Mohamed Jama
Technical Level EASYWAYLEARN ACADEMY
SAHALSOFTWARE ndash SAHAL UNIVERSITY
Eng Mohamed Jama
Technical Level EASYWAYLEARN ACADEMY
SAHALSOFTWARE ndash SAHAL UNIVERSITY
Eng Mohamed Jama
Technical Level EASYWAYLEARN ACADEMY
SAHALSOFTWARE ndash SAHAL UNIVERSITY
Eng Mohamed Jama
Break and Retest Strategy
Waiting for a Retest Will Make You a Better Forex Trader
Technical Level EASYWAYLEARN ACADEMY
SAHALSOFTWARE ndash SAHAL UNIVERSITY
Eng Mohamed Jama
Technical Level EASYWAYLEARN ACADEMY
SAHALSOFTWARE ndash SAHAL UNIVERSITY
Eng Mohamed Jama
Lesson 11 Indicators (Leading and Lagging)
+ RSI Indicator
Leading and lagging indicators what you need to know
Technical traders use indicators to identify market patterns and
trends Most of these indicators fall into two categories leading
and lagging Discover some popular leading and lagging
indicators and how to use them
Technical Level EASYWAYLEARN ACADEMY
SAHALSOFTWARE ndash SAHAL UNIVERSITY
Eng Mohamed Jama
What is a leading technical indicator
A leading indicator is a tool designed to anticipate the future direction
of a market in order to enable traders to predict market movements
ahead of time
Technical Level EASYWAYLEARN ACADEMY
SAHALSOFTWARE ndash SAHAL UNIVERSITY
Eng Mohamed Jama
In theory if a leading indicator gives the correct signal a trader can
get in before the market movement and ride the entire trend However
leading indicators are by no means 100 accurate which is why they
are often combined with other forms of technical analysis
What is a lagging technical indicator
A lagging indicator is a tool that provides delayed feedback which
means it gives a signal once the price movement has already passed
Technical Level EASYWAYLEARN ACADEMY
SAHALSOFTWARE ndash SAHAL UNIVERSITY
Eng Mohamed Jama
or is in progress These are used by traders to confirm the price trend
before they enter a trade
These indicators are commonly used by trend traders ndash they donrsquot
show any upcoming price moves but confirm that a trend is underway
This tends to give traders more confidence that they are correct in
their assumptions rather than providing a specific trigger for entering
the market
Technical Level EASYWAYLEARN ACADEMY
SAHALSOFTWARE ndash SAHAL UNIVERSITY
Eng Mohamed Jama
Leading vs lagging technical indicators
whatrsquos the difference
The most obvious difference is that leading indicators predict market
movements while lagging indicators confirm trends that are already
taking place Both leading and lagging indicators have their own
advantages and drawbacks so itrsquos crucial to familiarise yourself with
how each works and decide which fits in with your strategy
Leading indicators react to prices quickly which can be great for
short-term traders but makes them prone to giving out false signals ndash
these happen when a signal indicates itrsquos time to enter the market but
the trend promptly reverses Conversely lagging indicators are far
slower to react which means that traders would have more accuracy
but could be late in entering the market
Relying solely on either could have negative effects on a strategy
which is why many traders will aim to find a balance of the two
Technical Level EASYWAYLEARN ACADEMY
SAHALSOFTWARE ndash SAHAL UNIVERSITY
Eng Mohamed Jama
Four popular leading indicators
Popular leading indicators include
1 The relative strength index (RSI)
2 The stochastic oscillator
3 Williams R
4 On-balance volume (OBV)
A lot of popular leading indicators fall into the category of oscillators as
these can identify a possible trend reversal before it happens
However not all leading indicators will use the same calculations so
there is the possibility that different indicators will show different
signals
Relative strength index (RSI)
The relative strength index (RSI) is a momentum indicator which
traders can use to identify whether a market is overbought or
Technical Level EASYWAYLEARN ACADEMY
SAHALSOFTWARE ndash SAHAL UNIVERSITY
Eng Mohamed Jama
oversold When the RSI gives a signal it is believed that the market
will reverse ndash this provides a leading sign that a trader should enter or
exit a position
The RSI is an oscillator so it is shown on a scale from zero to 100 If
the RSI is above 70 the market would often be thought of as
overbought and appear as red on the chart (below) And if the
indicator falls below the 30 level the market is usually considered
oversold and will appear in green on the chart
Technical Level EASYWAYLEARN ACADEMY
SAHALSOFTWARE ndash SAHAL UNIVERSITY
Eng Mohamed Jama
As mentioned the danger with leading indicators is that they can
provide premature or false signals With the RSI it is possible that the
market will sustain overbought or oversold conditions for long periods
of time without reversing This makes it important to have suitable risk
management measures in place such as stops and limits
Stochastic oscillator
Another popular example of a leading indicator is the stochastic
oscillator which is used to compare recent closing prices to the
previous trading range
The stochastic is based on the idea that market momentum changes
direction much faster than volume or price so it can be used to predict
the direction of market movements If the oscillator reaches a reading
of 80 or over the market would be considered overbought while
anything under 20 would be thought of as oversold
Technical Level EASYWAYLEARN ACADEMY
SAHALSOFTWARE ndash SAHAL UNIVERSITY
Eng Mohamed Jama
The oscillator is shown as two lines on the chart the K (the black
line on the chart below) and the D (the red dotted line below) When
these two lines cross it is seen as a leading signal that a change in
market direction is approaching
During volatile market conditions the stochastic is prone to false
signals To prevent this impacting your trades you could use the
stochastic in conjunction with other indicators or use it as a filter for
Technical Level EASYWAYLEARN ACADEMY
SAHALSOFTWARE ndash SAHAL UNIVERSITY
Eng Mohamed Jama
your trades rather than a trigger This would mean entering the market
once the trend is confirmed as you would with a lagging indicator
Williams R
The Williams percent range more commonly known as the Williams
R is very similar to the stochastic oscillator The main difference
being that it works on a negative scale ndash so it ranges between zero
and -100 and uses -20 and -80 as the overbought and oversold
signals respectively
So on the below chart the green line below -80 indicates that the
price is likely to rise While the red line above -20 indicates the price is
likely to fall
Technical Level EASYWAYLEARN ACADEMY
SAHALSOFTWARE ndash SAHAL UNIVERSITY
Eng Mohamed Jama
The indicator is highly responsive meaning it might start to move to
highs or lows even if the actual market price does not follow suit As
the Williams R is leading these signals can be premature and less
reliable than other entry signals which is why some traders prefer to
use -10 and -90 as more extreme price signals
On-balance volume (OBV)
Technical Level EASYWAYLEARN ACADEMY
SAHALSOFTWARE ndash SAHAL UNIVERSITY
Eng Mohamed Jama
On-balance volume (OBV) is another leading momentum-based
indicator It looks at volume to enable traders to make predictions
about the market price ndash OBV is largely used in shares trading as
volume is well documented by stock exchanges
Traders who use OBV as a leading indicator will focus on increases or
decreases in volume without the equivalent change in price This is
believed to be an indication that the price will increase or decrease
imminently
As a leading indicator OBV is prone to giving false signals especially
as the indicator can be thrown off by huge spikes in volume around
announcements that surprise the market Although volume changes
this is not always indicative of a trend and can cause traders to open
positions prematurely
As with the other leading indicators the OBV is often used in
conjunction with lagging indicators and a thorough risk management
strategy
Technical Level EASYWAYLEARN ACADEMY
SAHALSOFTWARE ndash SAHAL UNIVERSITY
Eng Mohamed Jama
Three popular lagging indicators
Popular lagging indicators include
1 Moving averages
2 The MACD indicator
3 Bollinger bands
Lagging indicators are primarily used to filter out the noise from short-
term market movements and confirm long-term trends They are
usually drawn onto the price chart itself unlike leading indicators
which usually appear in separate windows
Moving averages
Moving averages (MAs) are categorized as a lagging indicator
because they are based on historical data
Buy and sell signals are generated when the price line crosses the MA
or when two MA lines cross each other However because the moving
average is calculated using previous price points the current market
price will be ahead of the MA
Technical Level EASYWAYLEARN ACADEMY
SAHALSOFTWARE ndash SAHAL UNIVERSITY
Eng Mohamed Jama
In the below 50-day MA example the moving average has crossed
the price from above indicating an upward reversal is imminent
However we can see that the MA is slower to pick up the bullish trend
when it does occur
Moving averages can be calculated over any timeframe depending on
the traderrsquos goals ndash but the longer the time frame the longer the lag
Technical Level EASYWAYLEARN ACADEMY
SAHALSOFTWARE ndash SAHAL UNIVERSITY
Eng Mohamed Jama
So a MA of 300 days would have a far longer delay than an MA of 50
days
It is possible for lagging indicators to give off false signals but it is less
likely as they are slower to react
MACD indicator
Moving averages can be used on their own or they can be the basis
of other technical indicators such as the moving average
convergence divergence (MACD) As it is based on MAs the MACD is
inherently a trend-following or lagging indicator However it has been
argued that different components of the MACD provide traders with
different opportunities
There are three components to the tool two moving averages and a
histogram The two moving averages (the signal line and the MACD
line) are invariably lagging indicators as they only provide signals
once the two lines have crossed each other by which time the trend is
already in motion
Technical Level EASYWAYLEARN ACADEMY
SAHALSOFTWARE ndash SAHAL UNIVERSITY
Eng Mohamed Jama
Source IG charts
But the MACD histogram is sometimes considered a leading indicator
as it is used to anticipate signal crossovers in between the two moving
averages The bars on the histogram represents the difference
between the two MAs ndash as the bars move further away from the
central zero line it means the MAs are moving further apart Once this
expansion is over a lsquohumprsquo appears on the histogram which is a sign
the MAs will tighten again and a crossover will occur
Technical Level EASYWAYLEARN ACADEMY
SAHALSOFTWARE ndash SAHAL UNIVERSITY
Eng Mohamed Jama
Although the histogram can be used to enter positions ahead of the
crossovers the moving averages inherently fall behind the market
price So in general it is a lagging indicator This means that there are
instances where the market price may reach a reversal point before
the signal has even been generated ndash which would be deemed a false
signal
Bollinger bands
The Bollinger band tool is a lagging indicator as it is based on a 20-
day simple moving average (SMA) and two outer lines These outer
bands represent the positive and negative standard deviations away
from the SMA and are used as a measure of volatility When levels of
volatility increase the bands will widen and as volatility decreases
they will contract
When the price reaches the outer bands of the Bollinger it often acts
as a trigger for the market to rebound back towards the central 20-
period moving average
Technical Level EASYWAYLEARN ACADEMY
SAHALSOFTWARE ndash SAHAL UNIVERSITY
Eng Mohamed Jama
Source IG charts
There are strategies that suggest the bands have leading indicator
properties but alone they do not give out leading trading signals
Bollinger bands can give no indication of exactly when the change in
volatility might take place or which direction the price will move in
They are merely a sign that a breakout could soon take place giving
bullish and bearish signals
Technical Level EASYWAYLEARN ACADEMY
SAHALSOFTWARE ndash SAHAL UNIVERSITY
Eng Mohamed Jama
This is why traders will often confirm the Bollinger band signals with
price action or use the indicator in conjunction with other lagging tools
or leading indicators such as the RSI
Leading and lagging technical indicators
summed up
A leading indicator is a tool designed to anticipate the future direction
of a market
A lagging indicator is a tool that gives signal once the price movement
has already started
Leading indicators react to prices quickly but this makes them prone to
giving out false signals
Lagging indicators can be more accurate but this is because they are
far slower to react
A lot of popular leading indicators fall into the category of oscillators
including the RSI stochastic oscillator Williams R and OBV
Lagging indicators are drawn onto the price chart itself and include
moving averages the MACD and Bollinger bands
Technical Level EASYWAYLEARN ACADEMY
SAHALSOFTWARE ndash SAHAL UNIVERSITY
Eng Mohamed Jama
Relying solely on either could have negative effects on a strategy
which is why many traders will aim to find a balance of the two
If you feel ready to start using lagging and leading indicators on live
markets you can open an account with IG today Alternatively you
can learn more about financial markets with IG Academy
Lesson 12 Confirmation Checklist = High Probability Trades
Technical Level EASYWAYLEARN ACADEMY
SAHALSOFTWARE ndash SAHAL UNIVERSITY
Eng Mohamed Jama
SupportResistance
Price Reversal Zone
Trend-Line
Pull Back
Technical Level EASYWAYLEARN ACADEMY
SAHALSOFTWARE ndash SAHAL UNIVERSITY
Eng Mohamed Jama
Technical Level EASYWAYLEARN ACADEMY
SAHALSOFTWARE ndash SAHAL UNIVERSITY
Eng Mohamed Jama
Technical Level EASYWAYLEARN ACADEMY
SAHALSOFTWARE ndash SAHAL UNIVERSITY
Eng Mohamed Jama
Technical Level EASYWAYLEARN ACADEMY
SAHALSOFTWARE ndash SAHAL UNIVERSITY
Eng Mohamed Jama
END
Technical Level EASYWAYLEARN ACADEMY
SAHALSOFTWARE ndash SAHAL UNIVERSITY
Eng Mohamed Jama
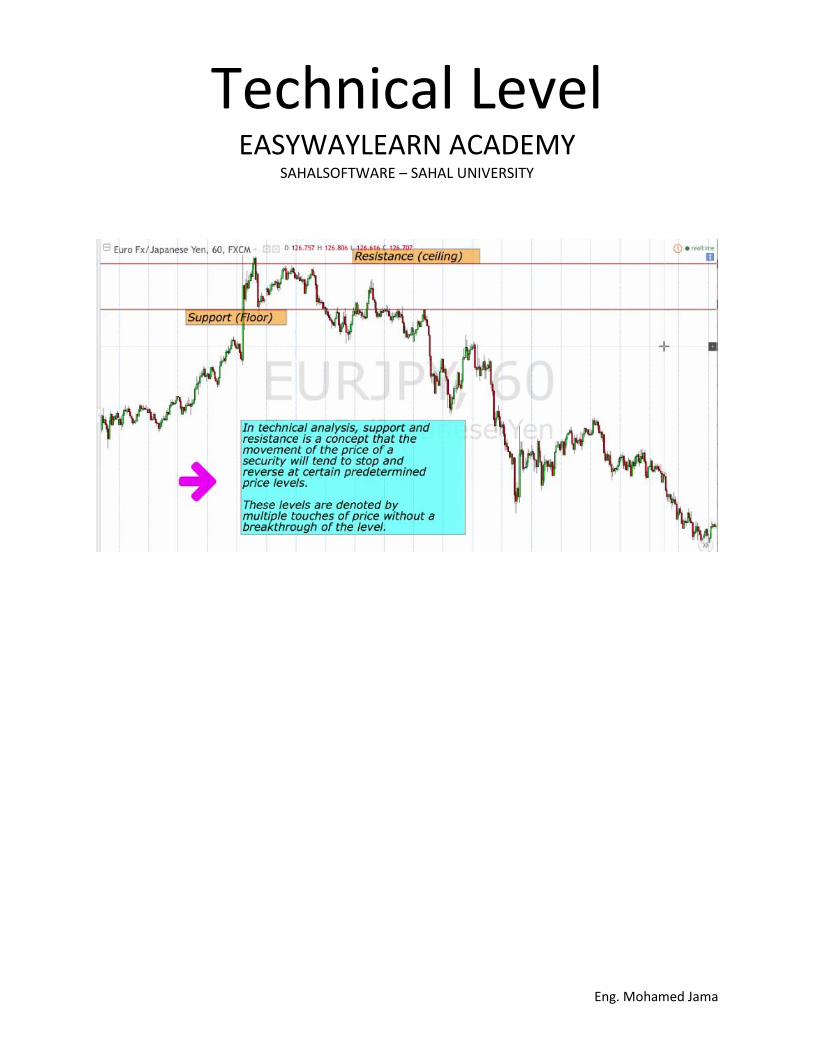
Technical Level EASYWAYLEARN ACADEMY
SAHALSOFTWARE ndash SAHAL UNIVERSITY
Eng Mohamed Jama
Technical Level EASYWAYLEARN ACADEMY
SAHALSOFTWARE ndash SAHAL UNIVERSITY
Eng Mohamed Jama
Support and Resistance trading strategy
Mark your areas of Support amp Resistance (SR)
Wait for a directional move into SR
Wait for price rejection at SR
Enter on the next candle
Use Risk Management
Create TK and SL
Note
Technical Level EASYWAYLEARN ACADEMY
SAHALSOFTWARE ndash SAHAL UNIVERSITY
Eng Mohamed Jama
Support ndash Area on your chart with potential buying pressure
Resistance ndash Area on your chart with potential selling pressure
Technical Level EASYWAYLEARN ACADEMY
SAHALSOFTWARE ndash SAHAL UNIVERSITY
Eng Mohamed Jama
Lesson 09 Price Reversal ZonendashDemand and Supply ndashRetest - Strategy
Technical Level EASYWAYLEARN ACADEMY
SAHALSOFTWARE ndash SAHAL UNIVERSITY
Eng Mohamed Jama
- Demand and Supply Zone ndash Strategy ndash
- Break out and Retest ndash Strategy
- Warning - Fake Break out -
Retracements are temporary price reversals that take place within a larger trend A reversal
on the other hand is when the trend changes direction With a reversal the price is likely to
continue in that reversal direction for an extended period
Technical Level EASYWAYLEARN ACADEMY
SAHALSOFTWARE ndash SAHAL UNIVERSITY
Eng Mohamed Jama
Technical Level EASYWAYLEARN ACADEMY
SAHALSOFTWARE ndash SAHAL UNIVERSITY
Eng Mohamed Jama
Technical Level EASYWAYLEARN ACADEMY
SAHALSOFTWARE ndash SAHAL UNIVERSITY
Eng Mohamed Jama
Technical Level EASYWAYLEARN ACADEMY
SAHALSOFTWARE ndash SAHAL UNIVERSITY
Eng Mohamed Jama
Technical Level EASYWAYLEARN ACADEMY
SAHALSOFTWARE ndash SAHAL UNIVERSITY
Eng Mohamed Jama
Technical Level EASYWAYLEARN ACADEMY
SAHALSOFTWARE ndash SAHAL UNIVERSITY
Eng Mohamed Jama
Technical Level EASYWAYLEARN ACADEMY
SAHALSOFTWARE ndash SAHAL UNIVERSITY
Eng Mohamed Jama
Technical Level EASYWAYLEARN ACADEMY
SAHALSOFTWARE ndash SAHAL UNIVERSITY
Eng Mohamed Jama
Technical Level EASYWAYLEARN ACADEMY
SAHALSOFTWARE ndash SAHAL UNIVERSITY
Eng Mohamed Jama
Lesson 10 Trend-Lines ndash Uptrend amp Downtrend
- Uptrend -gt HLHHHLHHHL ndash Swing High ndash Swing low
- Downtrend -gt HLLHLLLHLL ndash Swing low - Swing High
- Ranging Market ndash BOX
- Impulse or Run Pull Back or Correction or Retracement
Technical Level EASYWAYLEARN ACADEMY
SAHALSOFTWARE ndash SAHAL UNIVERSITY
Eng Mohamed Jama
Technical Level EASYWAYLEARN ACADEMY
SAHALSOFTWARE ndash SAHAL UNIVERSITY
Eng Mohamed Jama
Technical Level EASYWAYLEARN ACADEMY
SAHALSOFTWARE ndash SAHAL UNIVERSITY
Eng Mohamed Jama
Technical Level EASYWAYLEARN ACADEMY
SAHALSOFTWARE ndash SAHAL UNIVERSITY
Eng Mohamed Jama
Technical Level EASYWAYLEARN ACADEMY
SAHALSOFTWARE ndash SAHAL UNIVERSITY
Eng Mohamed Jama
Technical Level EASYWAYLEARN ACADEMY
SAHALSOFTWARE ndash SAHAL UNIVERSITY
Eng Mohamed Jama
Break and Retest Strategy
Waiting for a Retest Will Make You a Better Forex Trader
Technical Level EASYWAYLEARN ACADEMY
SAHALSOFTWARE ndash SAHAL UNIVERSITY
Eng Mohamed Jama
Technical Level EASYWAYLEARN ACADEMY
SAHALSOFTWARE ndash SAHAL UNIVERSITY
Eng Mohamed Jama
Lesson 11 Indicators (Leading and Lagging)
+ RSI Indicator
Leading and lagging indicators what you need to know
Technical traders use indicators to identify market patterns and
trends Most of these indicators fall into two categories leading
and lagging Discover some popular leading and lagging
indicators and how to use them
Technical Level EASYWAYLEARN ACADEMY
SAHALSOFTWARE ndash SAHAL UNIVERSITY
Eng Mohamed Jama
What is a leading technical indicator
A leading indicator is a tool designed to anticipate the future direction
of a market in order to enable traders to predict market movements
ahead of time
Technical Level EASYWAYLEARN ACADEMY
SAHALSOFTWARE ndash SAHAL UNIVERSITY
Eng Mohamed Jama
In theory if a leading indicator gives the correct signal a trader can
get in before the market movement and ride the entire trend However
leading indicators are by no means 100 accurate which is why they
are often combined with other forms of technical analysis
What is a lagging technical indicator
A lagging indicator is a tool that provides delayed feedback which
means it gives a signal once the price movement has already passed
Technical Level EASYWAYLEARN ACADEMY
SAHALSOFTWARE ndash SAHAL UNIVERSITY
Eng Mohamed Jama
or is in progress These are used by traders to confirm the price trend
before they enter a trade
These indicators are commonly used by trend traders ndash they donrsquot
show any upcoming price moves but confirm that a trend is underway
This tends to give traders more confidence that they are correct in
their assumptions rather than providing a specific trigger for entering
the market
Technical Level EASYWAYLEARN ACADEMY
SAHALSOFTWARE ndash SAHAL UNIVERSITY
Eng Mohamed Jama
Leading vs lagging technical indicators
whatrsquos the difference
The most obvious difference is that leading indicators predict market
movements while lagging indicators confirm trends that are already
taking place Both leading and lagging indicators have their own
advantages and drawbacks so itrsquos crucial to familiarise yourself with
how each works and decide which fits in with your strategy
Leading indicators react to prices quickly which can be great for
short-term traders but makes them prone to giving out false signals ndash
these happen when a signal indicates itrsquos time to enter the market but
the trend promptly reverses Conversely lagging indicators are far
slower to react which means that traders would have more accuracy
but could be late in entering the market
Relying solely on either could have negative effects on a strategy
which is why many traders will aim to find a balance of the two
Technical Level EASYWAYLEARN ACADEMY
SAHALSOFTWARE ndash SAHAL UNIVERSITY
Eng Mohamed Jama
Four popular leading indicators
Popular leading indicators include
1 The relative strength index (RSI)
2 The stochastic oscillator
3 Williams R
4 On-balance volume (OBV)
A lot of popular leading indicators fall into the category of oscillators as
these can identify a possible trend reversal before it happens
However not all leading indicators will use the same calculations so
there is the possibility that different indicators will show different
signals
Relative strength index (RSI)
The relative strength index (RSI) is a momentum indicator which
traders can use to identify whether a market is overbought or
Technical Level EASYWAYLEARN ACADEMY
SAHALSOFTWARE ndash SAHAL UNIVERSITY
Eng Mohamed Jama
oversold When the RSI gives a signal it is believed that the market
will reverse ndash this provides a leading sign that a trader should enter or
exit a position
The RSI is an oscillator so it is shown on a scale from zero to 100 If
the RSI is above 70 the market would often be thought of as
overbought and appear as red on the chart (below) And if the
indicator falls below the 30 level the market is usually considered
oversold and will appear in green on the chart
Technical Level EASYWAYLEARN ACADEMY
SAHALSOFTWARE ndash SAHAL UNIVERSITY
Eng Mohamed Jama
As mentioned the danger with leading indicators is that they can
provide premature or false signals With the RSI it is possible that the
market will sustain overbought or oversold conditions for long periods
of time without reversing This makes it important to have suitable risk
management measures in place such as stops and limits
Stochastic oscillator
Another popular example of a leading indicator is the stochastic
oscillator which is used to compare recent closing prices to the
previous trading range
The stochastic is based on the idea that market momentum changes
direction much faster than volume or price so it can be used to predict
the direction of market movements If the oscillator reaches a reading
of 80 or over the market would be considered overbought while
anything under 20 would be thought of as oversold
Technical Level EASYWAYLEARN ACADEMY
SAHALSOFTWARE ndash SAHAL UNIVERSITY
Eng Mohamed Jama
The oscillator is shown as two lines on the chart the K (the black
line on the chart below) and the D (the red dotted line below) When
these two lines cross it is seen as a leading signal that a change in
market direction is approaching
During volatile market conditions the stochastic is prone to false
signals To prevent this impacting your trades you could use the
stochastic in conjunction with other indicators or use it as a filter for
Technical Level EASYWAYLEARN ACADEMY
SAHALSOFTWARE ndash SAHAL UNIVERSITY
Eng Mohamed Jama
your trades rather than a trigger This would mean entering the market
once the trend is confirmed as you would with a lagging indicator
Williams R
The Williams percent range more commonly known as the Williams
R is very similar to the stochastic oscillator The main difference
being that it works on a negative scale ndash so it ranges between zero
and -100 and uses -20 and -80 as the overbought and oversold
signals respectively
So on the below chart the green line below -80 indicates that the
price is likely to rise While the red line above -20 indicates the price is
likely to fall
Technical Level EASYWAYLEARN ACADEMY
SAHALSOFTWARE ndash SAHAL UNIVERSITY
Eng Mohamed Jama
The indicator is highly responsive meaning it might start to move to
highs or lows even if the actual market price does not follow suit As
the Williams R is leading these signals can be premature and less
reliable than other entry signals which is why some traders prefer to
use -10 and -90 as more extreme price signals
On-balance volume (OBV)
Technical Level EASYWAYLEARN ACADEMY
SAHALSOFTWARE ndash SAHAL UNIVERSITY
Eng Mohamed Jama
On-balance volume (OBV) is another leading momentum-based
indicator It looks at volume to enable traders to make predictions
about the market price ndash OBV is largely used in shares trading as
volume is well documented by stock exchanges
Traders who use OBV as a leading indicator will focus on increases or
decreases in volume without the equivalent change in price This is
believed to be an indication that the price will increase or decrease
imminently
As a leading indicator OBV is prone to giving false signals especially
as the indicator can be thrown off by huge spikes in volume around
announcements that surprise the market Although volume changes
this is not always indicative of a trend and can cause traders to open
positions prematurely
As with the other leading indicators the OBV is often used in
conjunction with lagging indicators and a thorough risk management
strategy
Technical Level EASYWAYLEARN ACADEMY
SAHALSOFTWARE ndash SAHAL UNIVERSITY
Eng Mohamed Jama
Three popular lagging indicators
Popular lagging indicators include
1 Moving averages
2 The MACD indicator
3 Bollinger bands
Lagging indicators are primarily used to filter out the noise from short-
term market movements and confirm long-term trends They are
usually drawn onto the price chart itself unlike leading indicators
which usually appear in separate windows
Moving averages
Moving averages (MAs) are categorized as a lagging indicator
because they are based on historical data
Buy and sell signals are generated when the price line crosses the MA
or when two MA lines cross each other However because the moving
average is calculated using previous price points the current market
price will be ahead of the MA
Technical Level EASYWAYLEARN ACADEMY
SAHALSOFTWARE ndash SAHAL UNIVERSITY
Eng Mohamed Jama
In the below 50-day MA example the moving average has crossed
the price from above indicating an upward reversal is imminent
However we can see that the MA is slower to pick up the bullish trend
when it does occur
Moving averages can be calculated over any timeframe depending on
the traderrsquos goals ndash but the longer the time frame the longer the lag
Technical Level EASYWAYLEARN ACADEMY
SAHALSOFTWARE ndash SAHAL UNIVERSITY
Eng Mohamed Jama
So a MA of 300 days would have a far longer delay than an MA of 50
days
It is possible for lagging indicators to give off false signals but it is less
likely as they are slower to react
MACD indicator
Moving averages can be used on their own or they can be the basis
of other technical indicators such as the moving average
convergence divergence (MACD) As it is based on MAs the MACD is
inherently a trend-following or lagging indicator However it has been
argued that different components of the MACD provide traders with
different opportunities
There are three components to the tool two moving averages and a
histogram The two moving averages (the signal line and the MACD
line) are invariably lagging indicators as they only provide signals
once the two lines have crossed each other by which time the trend is
already in motion
Technical Level EASYWAYLEARN ACADEMY
SAHALSOFTWARE ndash SAHAL UNIVERSITY
Eng Mohamed Jama
Source IG charts
But the MACD histogram is sometimes considered a leading indicator
as it is used to anticipate signal crossovers in between the two moving
averages The bars on the histogram represents the difference
between the two MAs ndash as the bars move further away from the
central zero line it means the MAs are moving further apart Once this
expansion is over a lsquohumprsquo appears on the histogram which is a sign
the MAs will tighten again and a crossover will occur
Technical Level EASYWAYLEARN ACADEMY
SAHALSOFTWARE ndash SAHAL UNIVERSITY
Eng Mohamed Jama
Although the histogram can be used to enter positions ahead of the
crossovers the moving averages inherently fall behind the market
price So in general it is a lagging indicator This means that there are
instances where the market price may reach a reversal point before
the signal has even been generated ndash which would be deemed a false
signal
Bollinger bands
The Bollinger band tool is a lagging indicator as it is based on a 20-
day simple moving average (SMA) and two outer lines These outer
bands represent the positive and negative standard deviations away
from the SMA and are used as a measure of volatility When levels of
volatility increase the bands will widen and as volatility decreases
they will contract
When the price reaches the outer bands of the Bollinger it often acts
as a trigger for the market to rebound back towards the central 20-
period moving average
Technical Level EASYWAYLEARN ACADEMY
SAHALSOFTWARE ndash SAHAL UNIVERSITY
Eng Mohamed Jama
Source IG charts
There are strategies that suggest the bands have leading indicator
properties but alone they do not give out leading trading signals
Bollinger bands can give no indication of exactly when the change in
volatility might take place or which direction the price will move in
They are merely a sign that a breakout could soon take place giving
bullish and bearish signals
Technical Level EASYWAYLEARN ACADEMY
SAHALSOFTWARE ndash SAHAL UNIVERSITY
Eng Mohamed Jama
This is why traders will often confirm the Bollinger band signals with
price action or use the indicator in conjunction with other lagging tools
or leading indicators such as the RSI
Leading and lagging technical indicators
summed up
A leading indicator is a tool designed to anticipate the future direction
of a market
A lagging indicator is a tool that gives signal once the price movement
has already started
Leading indicators react to prices quickly but this makes them prone to
giving out false signals
Lagging indicators can be more accurate but this is because they are
far slower to react
A lot of popular leading indicators fall into the category of oscillators
including the RSI stochastic oscillator Williams R and OBV
Lagging indicators are drawn onto the price chart itself and include
moving averages the MACD and Bollinger bands
Technical Level EASYWAYLEARN ACADEMY
SAHALSOFTWARE ndash SAHAL UNIVERSITY
Eng Mohamed Jama
Relying solely on either could have negative effects on a strategy
which is why many traders will aim to find a balance of the two
If you feel ready to start using lagging and leading indicators on live
markets you can open an account with IG today Alternatively you
can learn more about financial markets with IG Academy
Lesson 12 Confirmation Checklist = High Probability Trades
Technical Level EASYWAYLEARN ACADEMY
SAHALSOFTWARE ndash SAHAL UNIVERSITY
Eng Mohamed Jama
SupportResistance
Price Reversal Zone
Trend-Line
Pull Back
Technical Level EASYWAYLEARN ACADEMY
SAHALSOFTWARE ndash SAHAL UNIVERSITY
Eng Mohamed Jama
Technical Level EASYWAYLEARN ACADEMY
SAHALSOFTWARE ndash SAHAL UNIVERSITY
Eng Mohamed Jama
Technical Level EASYWAYLEARN ACADEMY
SAHALSOFTWARE ndash SAHAL UNIVERSITY
Eng Mohamed Jama
Technical Level EASYWAYLEARN ACADEMY
SAHALSOFTWARE ndash SAHAL UNIVERSITY
Eng Mohamed Jama
END
Technical Level EASYWAYLEARN ACADEMY
SAHALSOFTWARE ndash SAHAL UNIVERSITY
Eng Mohamed Jama

Technical Level EASYWAYLEARN ACADEMY
SAHALSOFTWARE ndash SAHAL UNIVERSITY
Eng Mohamed Jama
Technical Level EASYWAYLEARN ACADEMY
SAHALSOFTWARE ndash SAHAL UNIVERSITY
Eng Mohamed Jama
Technical Level EASYWAYLEARN ACADEMY
SAHALSOFTWARE ndash SAHAL UNIVERSITY
Eng Mohamed Jama
Technical Level EASYWAYLEARN ACADEMY
SAHALSOFTWARE ndash SAHAL UNIVERSITY
Eng Mohamed Jama
Technical Level EASYWAYLEARN ACADEMY
SAHALSOFTWARE ndash SAHAL UNIVERSITY
Eng Mohamed Jama
Technical Level EASYWAYLEARN ACADEMY
SAHALSOFTWARE ndash SAHAL UNIVERSITY
Eng Mohamed Jama
Technical Level EASYWAYLEARN ACADEMY
SAHALSOFTWARE ndash SAHAL UNIVERSITY
Eng Mohamed Jama
Technical Level EASYWAYLEARN ACADEMY
SAHALSOFTWARE ndash SAHAL UNIVERSITY
Eng Mohamed Jama
Technical Level EASYWAYLEARN ACADEMY
SAHALSOFTWARE ndash SAHAL UNIVERSITY
Eng Mohamed Jama
Lesson 10 Trend-Lines ndash Uptrend amp Downtrend
- Uptrend -gt HLHHHLHHHL ndash Swing High ndash Swing low
- Downtrend -gt HLLHLLLHLL ndash Swing low - Swing High
- Ranging Market ndash BOX
- Impulse or Run Pull Back or Correction or Retracement
Technical Level EASYWAYLEARN ACADEMY
SAHALSOFTWARE ndash SAHAL UNIVERSITY
Eng Mohamed Jama
Technical Level EASYWAYLEARN ACADEMY
SAHALSOFTWARE ndash SAHAL UNIVERSITY
Eng Mohamed Jama
Technical Level EASYWAYLEARN ACADEMY
SAHALSOFTWARE ndash SAHAL UNIVERSITY
Eng Mohamed Jama
Technical Level EASYWAYLEARN ACADEMY
SAHALSOFTWARE ndash SAHAL UNIVERSITY
Eng Mohamed Jama
Technical Level EASYWAYLEARN ACADEMY
SAHALSOFTWARE ndash SAHAL UNIVERSITY
Eng Mohamed Jama
Technical Level EASYWAYLEARN ACADEMY
SAHALSOFTWARE ndash SAHAL UNIVERSITY
Eng Mohamed Jama
Break and Retest Strategy
Waiting for a Retest Will Make You a Better Forex Trader
Technical Level EASYWAYLEARN ACADEMY
SAHALSOFTWARE ndash SAHAL UNIVERSITY
Eng Mohamed Jama
Technical Level EASYWAYLEARN ACADEMY
SAHALSOFTWARE ndash SAHAL UNIVERSITY
Eng Mohamed Jama
Lesson 11 Indicators (Leading and Lagging)
+ RSI Indicator
Leading and lagging indicators what you need to know
Technical traders use indicators to identify market patterns and
trends Most of these indicators fall into two categories leading
and lagging Discover some popular leading and lagging
indicators and how to use them
Technical Level EASYWAYLEARN ACADEMY
SAHALSOFTWARE ndash SAHAL UNIVERSITY
Eng Mohamed Jama
What is a leading technical indicator
A leading indicator is a tool designed to anticipate the future direction
of a market in order to enable traders to predict market movements
ahead of time
Technical Level EASYWAYLEARN ACADEMY
SAHALSOFTWARE ndash SAHAL UNIVERSITY
Eng Mohamed Jama
In theory if a leading indicator gives the correct signal a trader can
get in before the market movement and ride the entire trend However
leading indicators are by no means 100 accurate which is why they
are often combined with other forms of technical analysis
What is a lagging technical indicator
A lagging indicator is a tool that provides delayed feedback which
means it gives a signal once the price movement has already passed
Technical Level EASYWAYLEARN ACADEMY
SAHALSOFTWARE ndash SAHAL UNIVERSITY
Eng Mohamed Jama
or is in progress These are used by traders to confirm the price trend
before they enter a trade
These indicators are commonly used by trend traders ndash they donrsquot
show any upcoming price moves but confirm that a trend is underway
This tends to give traders more confidence that they are correct in
their assumptions rather than providing a specific trigger for entering
the market
Technical Level EASYWAYLEARN ACADEMY
SAHALSOFTWARE ndash SAHAL UNIVERSITY
Eng Mohamed Jama
Leading vs lagging technical indicators
whatrsquos the difference
The most obvious difference is that leading indicators predict market
movements while lagging indicators confirm trends that are already
taking place Both leading and lagging indicators have their own
advantages and drawbacks so itrsquos crucial to familiarise yourself with
how each works and decide which fits in with your strategy
Leading indicators react to prices quickly which can be great for
short-term traders but makes them prone to giving out false signals ndash
these happen when a signal indicates itrsquos time to enter the market but
the trend promptly reverses Conversely lagging indicators are far
slower to react which means that traders would have more accuracy
but could be late in entering the market
Relying solely on either could have negative effects on a strategy
which is why many traders will aim to find a balance of the two
Technical Level EASYWAYLEARN ACADEMY
SAHALSOFTWARE ndash SAHAL UNIVERSITY
Eng Mohamed Jama
Four popular leading indicators
Popular leading indicators include
1 The relative strength index (RSI)
2 The stochastic oscillator
3 Williams R
4 On-balance volume (OBV)
A lot of popular leading indicators fall into the category of oscillators as
these can identify a possible trend reversal before it happens
However not all leading indicators will use the same calculations so
there is the possibility that different indicators will show different
signals
Relative strength index (RSI)
The relative strength index (RSI) is a momentum indicator which
traders can use to identify whether a market is overbought or
Technical Level EASYWAYLEARN ACADEMY
SAHALSOFTWARE ndash SAHAL UNIVERSITY
Eng Mohamed Jama
oversold When the RSI gives a signal it is believed that the market
will reverse ndash this provides a leading sign that a trader should enter or
exit a position
The RSI is an oscillator so it is shown on a scale from zero to 100 If
the RSI is above 70 the market would often be thought of as
overbought and appear as red on the chart (below) And if the
indicator falls below the 30 level the market is usually considered
oversold and will appear in green on the chart
Technical Level EASYWAYLEARN ACADEMY
SAHALSOFTWARE ndash SAHAL UNIVERSITY
Eng Mohamed Jama
As mentioned the danger with leading indicators is that they can
provide premature or false signals With the RSI it is possible that the
market will sustain overbought or oversold conditions for long periods
of time without reversing This makes it important to have suitable risk
management measures in place such as stops and limits
Stochastic oscillator
Another popular example of a leading indicator is the stochastic
oscillator which is used to compare recent closing prices to the
previous trading range
The stochastic is based on the idea that market momentum changes
direction much faster than volume or price so it can be used to predict
the direction of market movements If the oscillator reaches a reading
of 80 or over the market would be considered overbought while
anything under 20 would be thought of as oversold
Technical Level EASYWAYLEARN ACADEMY
SAHALSOFTWARE ndash SAHAL UNIVERSITY
Eng Mohamed Jama
The oscillator is shown as two lines on the chart the K (the black
line on the chart below) and the D (the red dotted line below) When
these two lines cross it is seen as a leading signal that a change in
market direction is approaching
During volatile market conditions the stochastic is prone to false
signals To prevent this impacting your trades you could use the
stochastic in conjunction with other indicators or use it as a filter for
Technical Level EASYWAYLEARN ACADEMY
SAHALSOFTWARE ndash SAHAL UNIVERSITY
Eng Mohamed Jama
your trades rather than a trigger This would mean entering the market
once the trend is confirmed as you would with a lagging indicator
Williams R
The Williams percent range more commonly known as the Williams
R is very similar to the stochastic oscillator The main difference
being that it works on a negative scale ndash so it ranges between zero
and -100 and uses -20 and -80 as the overbought and oversold
signals respectively
So on the below chart the green line below -80 indicates that the
price is likely to rise While the red line above -20 indicates the price is
likely to fall
Technical Level EASYWAYLEARN ACADEMY
SAHALSOFTWARE ndash SAHAL UNIVERSITY
Eng Mohamed Jama
The indicator is highly responsive meaning it might start to move to
highs or lows even if the actual market price does not follow suit As
the Williams R is leading these signals can be premature and less
reliable than other entry signals which is why some traders prefer to
use -10 and -90 as more extreme price signals
On-balance volume (OBV)
Technical Level EASYWAYLEARN ACADEMY
SAHALSOFTWARE ndash SAHAL UNIVERSITY
Eng Mohamed Jama
On-balance volume (OBV) is another leading momentum-based
indicator It looks at volume to enable traders to make predictions
about the market price ndash OBV is largely used in shares trading as
volume is well documented by stock exchanges
Traders who use OBV as a leading indicator will focus on increases or
decreases in volume without the equivalent change in price This is
believed to be an indication that the price will increase or decrease
imminently
As a leading indicator OBV is prone to giving false signals especially
as the indicator can be thrown off by huge spikes in volume around
announcements that surprise the market Although volume changes
this is not always indicative of a trend and can cause traders to open
positions prematurely
As with the other leading indicators the OBV is often used in
conjunction with lagging indicators and a thorough risk management
strategy
Technical Level EASYWAYLEARN ACADEMY
SAHALSOFTWARE ndash SAHAL UNIVERSITY
Eng Mohamed Jama
Three popular lagging indicators
Popular lagging indicators include
1 Moving averages
2 The MACD indicator
3 Bollinger bands
Lagging indicators are primarily used to filter out the noise from short-
term market movements and confirm long-term trends They are
usually drawn onto the price chart itself unlike leading indicators
which usually appear in separate windows
Moving averages
Moving averages (MAs) are categorized as a lagging indicator
because they are based on historical data
Buy and sell signals are generated when the price line crosses the MA
or when two MA lines cross each other However because the moving
average is calculated using previous price points the current market
price will be ahead of the MA
Technical Level EASYWAYLEARN ACADEMY
SAHALSOFTWARE ndash SAHAL UNIVERSITY
Eng Mohamed Jama
In the below 50-day MA example the moving average has crossed
the price from above indicating an upward reversal is imminent
However we can see that the MA is slower to pick up the bullish trend
when it does occur
Moving averages can be calculated over any timeframe depending on
the traderrsquos goals ndash but the longer the time frame the longer the lag
Technical Level EASYWAYLEARN ACADEMY
SAHALSOFTWARE ndash SAHAL UNIVERSITY
Eng Mohamed Jama
So a MA of 300 days would have a far longer delay than an MA of 50
days
It is possible for lagging indicators to give off false signals but it is less
likely as they are slower to react
MACD indicator
Moving averages can be used on their own or they can be the basis
of other technical indicators such as the moving average
convergence divergence (MACD) As it is based on MAs the MACD is
inherently a trend-following or lagging indicator However it has been
argued that different components of the MACD provide traders with
different opportunities
There are three components to the tool two moving averages and a
histogram The two moving averages (the signal line and the MACD
line) are invariably lagging indicators as they only provide signals
once the two lines have crossed each other by which time the trend is
already in motion
Technical Level EASYWAYLEARN ACADEMY
SAHALSOFTWARE ndash SAHAL UNIVERSITY
Eng Mohamed Jama
Source IG charts
But the MACD histogram is sometimes considered a leading indicator
as it is used to anticipate signal crossovers in between the two moving
averages The bars on the histogram represents the difference
between the two MAs ndash as the bars move further away from the
central zero line it means the MAs are moving further apart Once this
expansion is over a lsquohumprsquo appears on the histogram which is a sign
the MAs will tighten again and a crossover will occur
Technical Level EASYWAYLEARN ACADEMY
SAHALSOFTWARE ndash SAHAL UNIVERSITY
Eng Mohamed Jama
Although the histogram can be used to enter positions ahead of the
crossovers the moving averages inherently fall behind the market
price So in general it is a lagging indicator This means that there are
instances where the market price may reach a reversal point before
the signal has even been generated ndash which would be deemed a false
signal
Bollinger bands
The Bollinger band tool is a lagging indicator as it is based on a 20-
day simple moving average (SMA) and two outer lines These outer
bands represent the positive and negative standard deviations away
from the SMA and are used as a measure of volatility When levels of
volatility increase the bands will widen and as volatility decreases
they will contract
When the price reaches the outer bands of the Bollinger it often acts
as a trigger for the market to rebound back towards the central 20-
period moving average
Technical Level EASYWAYLEARN ACADEMY
SAHALSOFTWARE ndash SAHAL UNIVERSITY
Eng Mohamed Jama
Source IG charts
There are strategies that suggest the bands have leading indicator
properties but alone they do not give out leading trading signals
Bollinger bands can give no indication of exactly when the change in
volatility might take place or which direction the price will move in
They are merely a sign that a breakout could soon take place giving
bullish and bearish signals
Technical Level EASYWAYLEARN ACADEMY
SAHALSOFTWARE ndash SAHAL UNIVERSITY
Eng Mohamed Jama
This is why traders will often confirm the Bollinger band signals with
price action or use the indicator in conjunction with other lagging tools
or leading indicators such as the RSI
Leading and lagging technical indicators
summed up
A leading indicator is a tool designed to anticipate the future direction
of a market
A lagging indicator is a tool that gives signal once the price movement
has already started
Leading indicators react to prices quickly but this makes them prone to
giving out false signals
Lagging indicators can be more accurate but this is because they are
far slower to react
A lot of popular leading indicators fall into the category of oscillators
including the RSI stochastic oscillator Williams R and OBV
Lagging indicators are drawn onto the price chart itself and include
moving averages the MACD and Bollinger bands
Technical Level EASYWAYLEARN ACADEMY
SAHALSOFTWARE ndash SAHAL UNIVERSITY
Eng Mohamed Jama
Relying solely on either could have negative effects on a strategy
which is why many traders will aim to find a balance of the two
If you feel ready to start using lagging and leading indicators on live
markets you can open an account with IG today Alternatively you
can learn more about financial markets with IG Academy
Lesson 12 Confirmation Checklist = High Probability Trades
Technical Level EASYWAYLEARN ACADEMY
SAHALSOFTWARE ndash SAHAL UNIVERSITY
Eng Mohamed Jama
SupportResistance
Price Reversal Zone
Trend-Line
Pull Back
Technical Level EASYWAYLEARN ACADEMY
SAHALSOFTWARE ndash SAHAL UNIVERSITY
Eng Mohamed Jama
Technical Level EASYWAYLEARN ACADEMY
SAHALSOFTWARE ndash SAHAL UNIVERSITY
Eng Mohamed Jama
Technical Level EASYWAYLEARN ACADEMY
SAHALSOFTWARE ndash SAHAL UNIVERSITY
Eng Mohamed Jama
Technical Level EASYWAYLEARN ACADEMY
SAHALSOFTWARE ndash SAHAL UNIVERSITY
Eng Mohamed Jama
END
Technical Level EASYWAYLEARN ACADEMY
SAHALSOFTWARE ndash SAHAL UNIVERSITY
Eng Mohamed Jama

Technical Level EASYWAYLEARN ACADEMY
SAHALSOFTWARE ndash SAHAL UNIVERSITY
Eng Mohamed Jama
Technical Level EASYWAYLEARN ACADEMY
SAHALSOFTWARE ndash SAHAL UNIVERSITY
Eng Mohamed Jama
Technical Level EASYWAYLEARN ACADEMY
SAHALSOFTWARE ndash SAHAL UNIVERSITY
Eng Mohamed Jama
Technical Level EASYWAYLEARN ACADEMY
SAHALSOFTWARE ndash SAHAL UNIVERSITY
Eng Mohamed Jama
Technical Level EASYWAYLEARN ACADEMY
SAHALSOFTWARE ndash SAHAL UNIVERSITY
Eng Mohamed Jama
Technical Level EASYWAYLEARN ACADEMY
SAHALSOFTWARE ndash SAHAL UNIVERSITY
Eng Mohamed Jama
Technical Level EASYWAYLEARN ACADEMY
SAHALSOFTWARE ndash SAHAL UNIVERSITY
Eng Mohamed Jama
Technical Level EASYWAYLEARN ACADEMY
SAHALSOFTWARE ndash SAHAL UNIVERSITY
Eng Mohamed Jama
Lesson 10 Trend-Lines ndash Uptrend amp Downtrend
- Uptrend -gt HLHHHLHHHL ndash Swing High ndash Swing low
- Downtrend -gt HLLHLLLHLL ndash Swing low - Swing High
- Ranging Market ndash BOX
- Impulse or Run Pull Back or Correction or Retracement
Technical Level EASYWAYLEARN ACADEMY
SAHALSOFTWARE ndash SAHAL UNIVERSITY
Eng Mohamed Jama
Technical Level EASYWAYLEARN ACADEMY
SAHALSOFTWARE ndash SAHAL UNIVERSITY
Eng Mohamed Jama
Technical Level EASYWAYLEARN ACADEMY
SAHALSOFTWARE ndash SAHAL UNIVERSITY
Eng Mohamed Jama
Technical Level EASYWAYLEARN ACADEMY
SAHALSOFTWARE ndash SAHAL UNIVERSITY
Eng Mohamed Jama
Technical Level EASYWAYLEARN ACADEMY
SAHALSOFTWARE ndash SAHAL UNIVERSITY
Eng Mohamed Jama
Technical Level EASYWAYLEARN ACADEMY
SAHALSOFTWARE ndash SAHAL UNIVERSITY
Eng Mohamed Jama
Break and Retest Strategy
Waiting for a Retest Will Make You a Better Forex Trader
Technical Level EASYWAYLEARN ACADEMY
SAHALSOFTWARE ndash SAHAL UNIVERSITY
Eng Mohamed Jama
Technical Level EASYWAYLEARN ACADEMY
SAHALSOFTWARE ndash SAHAL UNIVERSITY
Eng Mohamed Jama
Lesson 11 Indicators (Leading and Lagging)
+ RSI Indicator
Leading and lagging indicators what you need to know
Technical traders use indicators to identify market patterns and
trends Most of these indicators fall into two categories leading
and lagging Discover some popular leading and lagging
indicators and how to use them
Technical Level EASYWAYLEARN ACADEMY
SAHALSOFTWARE ndash SAHAL UNIVERSITY
Eng Mohamed Jama
What is a leading technical indicator
A leading indicator is a tool designed to anticipate the future direction
of a market in order to enable traders to predict market movements
ahead of time
Technical Level EASYWAYLEARN ACADEMY
SAHALSOFTWARE ndash SAHAL UNIVERSITY
Eng Mohamed Jama
In theory if a leading indicator gives the correct signal a trader can
get in before the market movement and ride the entire trend However
leading indicators are by no means 100 accurate which is why they
are often combined with other forms of technical analysis
What is a lagging technical indicator
A lagging indicator is a tool that provides delayed feedback which
means it gives a signal once the price movement has already passed
Technical Level EASYWAYLEARN ACADEMY
SAHALSOFTWARE ndash SAHAL UNIVERSITY
Eng Mohamed Jama
or is in progress These are used by traders to confirm the price trend
before they enter a trade
These indicators are commonly used by trend traders ndash they donrsquot
show any upcoming price moves but confirm that a trend is underway
This tends to give traders more confidence that they are correct in
their assumptions rather than providing a specific trigger for entering
the market
Technical Level EASYWAYLEARN ACADEMY
SAHALSOFTWARE ndash SAHAL UNIVERSITY
Eng Mohamed Jama
Leading vs lagging technical indicators
whatrsquos the difference
The most obvious difference is that leading indicators predict market
movements while lagging indicators confirm trends that are already
taking place Both leading and lagging indicators have their own
advantages and drawbacks so itrsquos crucial to familiarise yourself with
how each works and decide which fits in with your strategy
Leading indicators react to prices quickly which can be great for
short-term traders but makes them prone to giving out false signals ndash
these happen when a signal indicates itrsquos time to enter the market but
the trend promptly reverses Conversely lagging indicators are far
slower to react which means that traders would have more accuracy
but could be late in entering the market
Relying solely on either could have negative effects on a strategy
which is why many traders will aim to find a balance of the two
Technical Level EASYWAYLEARN ACADEMY
SAHALSOFTWARE ndash SAHAL UNIVERSITY
Eng Mohamed Jama
Four popular leading indicators
Popular leading indicators include
1 The relative strength index (RSI)
2 The stochastic oscillator
3 Williams R
4 On-balance volume (OBV)
A lot of popular leading indicators fall into the category of oscillators as
these can identify a possible trend reversal before it happens
However not all leading indicators will use the same calculations so
there is the possibility that different indicators will show different
signals
Relative strength index (RSI)
The relative strength index (RSI) is a momentum indicator which
traders can use to identify whether a market is overbought or
Technical Level EASYWAYLEARN ACADEMY
SAHALSOFTWARE ndash SAHAL UNIVERSITY
Eng Mohamed Jama
oversold When the RSI gives a signal it is believed that the market
will reverse ndash this provides a leading sign that a trader should enter or
exit a position
The RSI is an oscillator so it is shown on a scale from zero to 100 If
the RSI is above 70 the market would often be thought of as
overbought and appear as red on the chart (below) And if the
indicator falls below the 30 level the market is usually considered
oversold and will appear in green on the chart
Technical Level EASYWAYLEARN ACADEMY
SAHALSOFTWARE ndash SAHAL UNIVERSITY
Eng Mohamed Jama
As mentioned the danger with leading indicators is that they can
provide premature or false signals With the RSI it is possible that the
market will sustain overbought or oversold conditions for long periods
of time without reversing This makes it important to have suitable risk
management measures in place such as stops and limits
Stochastic oscillator
Another popular example of a leading indicator is the stochastic
oscillator which is used to compare recent closing prices to the
previous trading range
The stochastic is based on the idea that market momentum changes
direction much faster than volume or price so it can be used to predict
the direction of market movements If the oscillator reaches a reading
of 80 or over the market would be considered overbought while
anything under 20 would be thought of as oversold
Technical Level EASYWAYLEARN ACADEMY
SAHALSOFTWARE ndash SAHAL UNIVERSITY
Eng Mohamed Jama
The oscillator is shown as two lines on the chart the K (the black
line on the chart below) and the D (the red dotted line below) When
these two lines cross it is seen as a leading signal that a change in
market direction is approaching
During volatile market conditions the stochastic is prone to false
signals To prevent this impacting your trades you could use the
stochastic in conjunction with other indicators or use it as a filter for
Technical Level EASYWAYLEARN ACADEMY
SAHALSOFTWARE ndash SAHAL UNIVERSITY
Eng Mohamed Jama
your trades rather than a trigger This would mean entering the market
once the trend is confirmed as you would with a lagging indicator
Williams R
The Williams percent range more commonly known as the Williams
R is very similar to the stochastic oscillator The main difference
being that it works on a negative scale ndash so it ranges between zero
and -100 and uses -20 and -80 as the overbought and oversold
signals respectively
So on the below chart the green line below -80 indicates that the
price is likely to rise While the red line above -20 indicates the price is
likely to fall
Technical Level EASYWAYLEARN ACADEMY
SAHALSOFTWARE ndash SAHAL UNIVERSITY
Eng Mohamed Jama
The indicator is highly responsive meaning it might start to move to
highs or lows even if the actual market price does not follow suit As
the Williams R is leading these signals can be premature and less
reliable than other entry signals which is why some traders prefer to
use -10 and -90 as more extreme price signals
On-balance volume (OBV)
Technical Level EASYWAYLEARN ACADEMY
SAHALSOFTWARE ndash SAHAL UNIVERSITY
Eng Mohamed Jama
On-balance volume (OBV) is another leading momentum-based
indicator It looks at volume to enable traders to make predictions
about the market price ndash OBV is largely used in shares trading as
volume is well documented by stock exchanges
Traders who use OBV as a leading indicator will focus on increases or
decreases in volume without the equivalent change in price This is
believed to be an indication that the price will increase or decrease
imminently
As a leading indicator OBV is prone to giving false signals especially
as the indicator can be thrown off by huge spikes in volume around
announcements that surprise the market Although volume changes
this is not always indicative of a trend and can cause traders to open
positions prematurely
As with the other leading indicators the OBV is often used in
conjunction with lagging indicators and a thorough risk management
strategy
Technical Level EASYWAYLEARN ACADEMY
SAHALSOFTWARE ndash SAHAL UNIVERSITY
Eng Mohamed Jama
Three popular lagging indicators
Popular lagging indicators include
1 Moving averages
2 The MACD indicator
3 Bollinger bands
Lagging indicators are primarily used to filter out the noise from short-
term market movements and confirm long-term trends They are
usually drawn onto the price chart itself unlike leading indicators
which usually appear in separate windows
Moving averages
Moving averages (MAs) are categorized as a lagging indicator
because they are based on historical data
Buy and sell signals are generated when the price line crosses the MA
or when two MA lines cross each other However because the moving
average is calculated using previous price points the current market
price will be ahead of the MA
Technical Level EASYWAYLEARN ACADEMY
SAHALSOFTWARE ndash SAHAL UNIVERSITY
Eng Mohamed Jama
In the below 50-day MA example the moving average has crossed
the price from above indicating an upward reversal is imminent
However we can see that the MA is slower to pick up the bullish trend
when it does occur
Moving averages can be calculated over any timeframe depending on
the traderrsquos goals ndash but the longer the time frame the longer the lag
Technical Level EASYWAYLEARN ACADEMY
SAHALSOFTWARE ndash SAHAL UNIVERSITY
Eng Mohamed Jama
So a MA of 300 days would have a far longer delay than an MA of 50
days
It is possible for lagging indicators to give off false signals but it is less
likely as they are slower to react
MACD indicator
Moving averages can be used on their own or they can be the basis
of other technical indicators such as the moving average
convergence divergence (MACD) As it is based on MAs the MACD is
inherently a trend-following or lagging indicator However it has been
argued that different components of the MACD provide traders with
different opportunities
There are three components to the tool two moving averages and a
histogram The two moving averages (the signal line and the MACD
line) are invariably lagging indicators as they only provide signals
once the two lines have crossed each other by which time the trend is
already in motion
Technical Level EASYWAYLEARN ACADEMY
SAHALSOFTWARE ndash SAHAL UNIVERSITY
Eng Mohamed Jama
Source IG charts
But the MACD histogram is sometimes considered a leading indicator
as it is used to anticipate signal crossovers in between the two moving
averages The bars on the histogram represents the difference
between the two MAs ndash as the bars move further away from the
central zero line it means the MAs are moving further apart Once this
expansion is over a lsquohumprsquo appears on the histogram which is a sign
the MAs will tighten again and a crossover will occur
Technical Level EASYWAYLEARN ACADEMY
SAHALSOFTWARE ndash SAHAL UNIVERSITY
Eng Mohamed Jama
Although the histogram can be used to enter positions ahead of the
crossovers the moving averages inherently fall behind the market
price So in general it is a lagging indicator This means that there are
instances where the market price may reach a reversal point before
the signal has even been generated ndash which would be deemed a false
signal
Bollinger bands
The Bollinger band tool is a lagging indicator as it is based on a 20-
day simple moving average (SMA) and two outer lines These outer
bands represent the positive and negative standard deviations away
from the SMA and are used as a measure of volatility When levels of
volatility increase the bands will widen and as volatility decreases
they will contract
When the price reaches the outer bands of the Bollinger it often acts
as a trigger for the market to rebound back towards the central 20-
period moving average
Technical Level EASYWAYLEARN ACADEMY
SAHALSOFTWARE ndash SAHAL UNIVERSITY
Eng Mohamed Jama
Source IG charts
There are strategies that suggest the bands have leading indicator
properties but alone they do not give out leading trading signals
Bollinger bands can give no indication of exactly when the change in
volatility might take place or which direction the price will move in
They are merely a sign that a breakout could soon take place giving
bullish and bearish signals
Technical Level EASYWAYLEARN ACADEMY
SAHALSOFTWARE ndash SAHAL UNIVERSITY
Eng Mohamed Jama
This is why traders will often confirm the Bollinger band signals with
price action or use the indicator in conjunction with other lagging tools
or leading indicators such as the RSI
Leading and lagging technical indicators
summed up
A leading indicator is a tool designed to anticipate the future direction
of a market
A lagging indicator is a tool that gives signal once the price movement
has already started
Leading indicators react to prices quickly but this makes them prone to
giving out false signals
Lagging indicators can be more accurate but this is because they are
far slower to react
A lot of popular leading indicators fall into the category of oscillators
including the RSI stochastic oscillator Williams R and OBV
Lagging indicators are drawn onto the price chart itself and include
moving averages the MACD and Bollinger bands
Technical Level EASYWAYLEARN ACADEMY
SAHALSOFTWARE ndash SAHAL UNIVERSITY
Eng Mohamed Jama
Relying solely on either could have negative effects on a strategy
which is why many traders will aim to find a balance of the two
If you feel ready to start using lagging and leading indicators on live
markets you can open an account with IG today Alternatively you
can learn more about financial markets with IG Academy
Lesson 12 Confirmation Checklist = High Probability Trades
Technical Level EASYWAYLEARN ACADEMY
SAHALSOFTWARE ndash SAHAL UNIVERSITY
Eng Mohamed Jama
SupportResistance
Price Reversal Zone
Trend-Line
Pull Back
Technical Level EASYWAYLEARN ACADEMY
SAHALSOFTWARE ndash SAHAL UNIVERSITY
Eng Mohamed Jama
Technical Level EASYWAYLEARN ACADEMY
SAHALSOFTWARE ndash SAHAL UNIVERSITY
Eng Mohamed Jama
Technical Level EASYWAYLEARN ACADEMY
SAHALSOFTWARE ndash SAHAL UNIVERSITY
Eng Mohamed Jama
Technical Level EASYWAYLEARN ACADEMY
SAHALSOFTWARE ndash SAHAL UNIVERSITY
Eng Mohamed Jama
END
Technical Level EASYWAYLEARN ACADEMY
SAHALSOFTWARE ndash SAHAL UNIVERSITY
Eng Mohamed Jama

Technical Level EASYWAYLEARN ACADEMY
SAHALSOFTWARE ndash SAHAL UNIVERSITY
Eng Mohamed Jama
Technical Level EASYWAYLEARN ACADEMY
SAHALSOFTWARE ndash SAHAL UNIVERSITY
Eng Mohamed Jama
Technical Level EASYWAYLEARN ACADEMY
SAHALSOFTWARE ndash SAHAL UNIVERSITY
Eng Mohamed Jama
Technical Level EASYWAYLEARN ACADEMY
SAHALSOFTWARE ndash SAHAL UNIVERSITY
Eng Mohamed Jama
Technical Level EASYWAYLEARN ACADEMY
SAHALSOFTWARE ndash SAHAL UNIVERSITY
Eng Mohamed Jama
Technical Level EASYWAYLEARN ACADEMY
SAHALSOFTWARE ndash SAHAL UNIVERSITY
Eng Mohamed Jama
Technical Level EASYWAYLEARN ACADEMY
SAHALSOFTWARE ndash SAHAL UNIVERSITY
Eng Mohamed Jama
Lesson 10 Trend-Lines ndash Uptrend amp Downtrend
- Uptrend -gt HLHHHLHHHL ndash Swing High ndash Swing low
- Downtrend -gt HLLHLLLHLL ndash Swing low - Swing High
- Ranging Market ndash BOX
- Impulse or Run Pull Back or Correction or Retracement
Technical Level EASYWAYLEARN ACADEMY
SAHALSOFTWARE ndash SAHAL UNIVERSITY
Eng Mohamed Jama
Technical Level EASYWAYLEARN ACADEMY
SAHALSOFTWARE ndash SAHAL UNIVERSITY
Eng Mohamed Jama
Technical Level EASYWAYLEARN ACADEMY
SAHALSOFTWARE ndash SAHAL UNIVERSITY
Eng Mohamed Jama
Technical Level EASYWAYLEARN ACADEMY
SAHALSOFTWARE ndash SAHAL UNIVERSITY
Eng Mohamed Jama
Technical Level EASYWAYLEARN ACADEMY
SAHALSOFTWARE ndash SAHAL UNIVERSITY
Eng Mohamed Jama
Technical Level EASYWAYLEARN ACADEMY
SAHALSOFTWARE ndash SAHAL UNIVERSITY
Eng Mohamed Jama
Break and Retest Strategy
Waiting for a Retest Will Make You a Better Forex Trader
Technical Level EASYWAYLEARN ACADEMY
SAHALSOFTWARE ndash SAHAL UNIVERSITY
Eng Mohamed Jama
Technical Level EASYWAYLEARN ACADEMY
SAHALSOFTWARE ndash SAHAL UNIVERSITY
Eng Mohamed Jama
Lesson 11 Indicators (Leading and Lagging)
+ RSI Indicator
Leading and lagging indicators what you need to know
Technical traders use indicators to identify market patterns and
trends Most of these indicators fall into two categories leading
and lagging Discover some popular leading and lagging
indicators and how to use them
Technical Level EASYWAYLEARN ACADEMY
SAHALSOFTWARE ndash SAHAL UNIVERSITY
Eng Mohamed Jama
What is a leading technical indicator
A leading indicator is a tool designed to anticipate the future direction
of a market in order to enable traders to predict market movements
ahead of time
Technical Level EASYWAYLEARN ACADEMY
SAHALSOFTWARE ndash SAHAL UNIVERSITY
Eng Mohamed Jama
In theory if a leading indicator gives the correct signal a trader can
get in before the market movement and ride the entire trend However
leading indicators are by no means 100 accurate which is why they
are often combined with other forms of technical analysis
What is a lagging technical indicator
A lagging indicator is a tool that provides delayed feedback which
means it gives a signal once the price movement has already passed
Technical Level EASYWAYLEARN ACADEMY
SAHALSOFTWARE ndash SAHAL UNIVERSITY
Eng Mohamed Jama
or is in progress These are used by traders to confirm the price trend
before they enter a trade
These indicators are commonly used by trend traders ndash they donrsquot
show any upcoming price moves but confirm that a trend is underway
This tends to give traders more confidence that they are correct in
their assumptions rather than providing a specific trigger for entering
the market
Technical Level EASYWAYLEARN ACADEMY
SAHALSOFTWARE ndash SAHAL UNIVERSITY
Eng Mohamed Jama
Leading vs lagging technical indicators
whatrsquos the difference
The most obvious difference is that leading indicators predict market
movements while lagging indicators confirm trends that are already
taking place Both leading and lagging indicators have their own
advantages and drawbacks so itrsquos crucial to familiarise yourself with
how each works and decide which fits in with your strategy
Leading indicators react to prices quickly which can be great for
short-term traders but makes them prone to giving out false signals ndash
these happen when a signal indicates itrsquos time to enter the market but
the trend promptly reverses Conversely lagging indicators are far
slower to react which means that traders would have more accuracy
but could be late in entering the market
Relying solely on either could have negative effects on a strategy
which is why many traders will aim to find a balance of the two
Technical Level EASYWAYLEARN ACADEMY
SAHALSOFTWARE ndash SAHAL UNIVERSITY
Eng Mohamed Jama
Four popular leading indicators
Popular leading indicators include
1 The relative strength index (RSI)
2 The stochastic oscillator
3 Williams R
4 On-balance volume (OBV)
A lot of popular leading indicators fall into the category of oscillators as
these can identify a possible trend reversal before it happens
However not all leading indicators will use the same calculations so
there is the possibility that different indicators will show different
signals
Relative strength index (RSI)
The relative strength index (RSI) is a momentum indicator which
traders can use to identify whether a market is overbought or
Technical Level EASYWAYLEARN ACADEMY
SAHALSOFTWARE ndash SAHAL UNIVERSITY
Eng Mohamed Jama
oversold When the RSI gives a signal it is believed that the market
will reverse ndash this provides a leading sign that a trader should enter or
exit a position
The RSI is an oscillator so it is shown on a scale from zero to 100 If
the RSI is above 70 the market would often be thought of as
overbought and appear as red on the chart (below) And if the
indicator falls below the 30 level the market is usually considered
oversold and will appear in green on the chart
Technical Level EASYWAYLEARN ACADEMY
SAHALSOFTWARE ndash SAHAL UNIVERSITY
Eng Mohamed Jama
As mentioned the danger with leading indicators is that they can
provide premature or false signals With the RSI it is possible that the
market will sustain overbought or oversold conditions for long periods
of time without reversing This makes it important to have suitable risk
management measures in place such as stops and limits
Stochastic oscillator
Another popular example of a leading indicator is the stochastic
oscillator which is used to compare recent closing prices to the
previous trading range
The stochastic is based on the idea that market momentum changes
direction much faster than volume or price so it can be used to predict
the direction of market movements If the oscillator reaches a reading
of 80 or over the market would be considered overbought while
anything under 20 would be thought of as oversold
Technical Level EASYWAYLEARN ACADEMY
SAHALSOFTWARE ndash SAHAL UNIVERSITY
Eng Mohamed Jama
The oscillator is shown as two lines on the chart the K (the black
line on the chart below) and the D (the red dotted line below) When
these two lines cross it is seen as a leading signal that a change in
market direction is approaching
During volatile market conditions the stochastic is prone to false
signals To prevent this impacting your trades you could use the
stochastic in conjunction with other indicators or use it as a filter for
Technical Level EASYWAYLEARN ACADEMY
SAHALSOFTWARE ndash SAHAL UNIVERSITY
Eng Mohamed Jama
your trades rather than a trigger This would mean entering the market
once the trend is confirmed as you would with a lagging indicator
Williams R
The Williams percent range more commonly known as the Williams
R is very similar to the stochastic oscillator The main difference
being that it works on a negative scale ndash so it ranges between zero
and -100 and uses -20 and -80 as the overbought and oversold
signals respectively
So on the below chart the green line below -80 indicates that the
price is likely to rise While the red line above -20 indicates the price is
likely to fall
Technical Level EASYWAYLEARN ACADEMY
SAHALSOFTWARE ndash SAHAL UNIVERSITY
Eng Mohamed Jama
The indicator is highly responsive meaning it might start to move to
highs or lows even if the actual market price does not follow suit As
the Williams R is leading these signals can be premature and less
reliable than other entry signals which is why some traders prefer to
use -10 and -90 as more extreme price signals
On-balance volume (OBV)
Technical Level EASYWAYLEARN ACADEMY
SAHALSOFTWARE ndash SAHAL UNIVERSITY
Eng Mohamed Jama
On-balance volume (OBV) is another leading momentum-based
indicator It looks at volume to enable traders to make predictions
about the market price ndash OBV is largely used in shares trading as
volume is well documented by stock exchanges
Traders who use OBV as a leading indicator will focus on increases or
decreases in volume without the equivalent change in price This is
believed to be an indication that the price will increase or decrease
imminently
As a leading indicator OBV is prone to giving false signals especially
as the indicator can be thrown off by huge spikes in volume around
announcements that surprise the market Although volume changes
this is not always indicative of a trend and can cause traders to open
positions prematurely
As with the other leading indicators the OBV is often used in
conjunction with lagging indicators and a thorough risk management
strategy
Technical Level EASYWAYLEARN ACADEMY
SAHALSOFTWARE ndash SAHAL UNIVERSITY
Eng Mohamed Jama
Three popular lagging indicators
Popular lagging indicators include
1 Moving averages
2 The MACD indicator
3 Bollinger bands
Lagging indicators are primarily used to filter out the noise from short-
term market movements and confirm long-term trends They are
usually drawn onto the price chart itself unlike leading indicators
which usually appear in separate windows
Moving averages
Moving averages (MAs) are categorized as a lagging indicator
because they are based on historical data
Buy and sell signals are generated when the price line crosses the MA
or when two MA lines cross each other However because the moving
average is calculated using previous price points the current market
price will be ahead of the MA
Technical Level EASYWAYLEARN ACADEMY
SAHALSOFTWARE ndash SAHAL UNIVERSITY
Eng Mohamed Jama
In the below 50-day MA example the moving average has crossed
the price from above indicating an upward reversal is imminent
However we can see that the MA is slower to pick up the bullish trend
when it does occur
Moving averages can be calculated over any timeframe depending on
the traderrsquos goals ndash but the longer the time frame the longer the lag
Technical Level EASYWAYLEARN ACADEMY
SAHALSOFTWARE ndash SAHAL UNIVERSITY
Eng Mohamed Jama
So a MA of 300 days would have a far longer delay than an MA of 50
days
It is possible for lagging indicators to give off false signals but it is less
likely as they are slower to react
MACD indicator
Moving averages can be used on their own or they can be the basis
of other technical indicators such as the moving average
convergence divergence (MACD) As it is based on MAs the MACD is
inherently a trend-following or lagging indicator However it has been
argued that different components of the MACD provide traders with
different opportunities
There are three components to the tool two moving averages and a
histogram The two moving averages (the signal line and the MACD
line) are invariably lagging indicators as they only provide signals
once the two lines have crossed each other by which time the trend is
already in motion
Technical Level EASYWAYLEARN ACADEMY
SAHALSOFTWARE ndash SAHAL UNIVERSITY
Eng Mohamed Jama
Source IG charts
But the MACD histogram is sometimes considered a leading indicator
as it is used to anticipate signal crossovers in between the two moving
averages The bars on the histogram represents the difference
between the two MAs ndash as the bars move further away from the
central zero line it means the MAs are moving further apart Once this
expansion is over a lsquohumprsquo appears on the histogram which is a sign
the MAs will tighten again and a crossover will occur
Technical Level EASYWAYLEARN ACADEMY
SAHALSOFTWARE ndash SAHAL UNIVERSITY
Eng Mohamed Jama
Although the histogram can be used to enter positions ahead of the
crossovers the moving averages inherently fall behind the market
price So in general it is a lagging indicator This means that there are
instances where the market price may reach a reversal point before
the signal has even been generated ndash which would be deemed a false
signal
Bollinger bands
The Bollinger band tool is a lagging indicator as it is based on a 20-
day simple moving average (SMA) and two outer lines These outer
bands represent the positive and negative standard deviations away
from the SMA and are used as a measure of volatility When levels of
volatility increase the bands will widen and as volatility decreases
they will contract
When the price reaches the outer bands of the Bollinger it often acts
as a trigger for the market to rebound back towards the central 20-
period moving average
Technical Level EASYWAYLEARN ACADEMY
SAHALSOFTWARE ndash SAHAL UNIVERSITY
Eng Mohamed Jama
Source IG charts
There are strategies that suggest the bands have leading indicator
properties but alone they do not give out leading trading signals
Bollinger bands can give no indication of exactly when the change in
volatility might take place or which direction the price will move in
They are merely a sign that a breakout could soon take place giving
bullish and bearish signals
Technical Level EASYWAYLEARN ACADEMY
SAHALSOFTWARE ndash SAHAL UNIVERSITY
Eng Mohamed Jama
This is why traders will often confirm the Bollinger band signals with
price action or use the indicator in conjunction with other lagging tools
or leading indicators such as the RSI
Leading and lagging technical indicators
summed up
A leading indicator is a tool designed to anticipate the future direction
of a market
A lagging indicator is a tool that gives signal once the price movement
has already started
Leading indicators react to prices quickly but this makes them prone to
giving out false signals
Lagging indicators can be more accurate but this is because they are
far slower to react
A lot of popular leading indicators fall into the category of oscillators
including the RSI stochastic oscillator Williams R and OBV
Lagging indicators are drawn onto the price chart itself and include
moving averages the MACD and Bollinger bands
Technical Level EASYWAYLEARN ACADEMY
SAHALSOFTWARE ndash SAHAL UNIVERSITY
Eng Mohamed Jama
Relying solely on either could have negative effects on a strategy
which is why many traders will aim to find a balance of the two
If you feel ready to start using lagging and leading indicators on live
markets you can open an account with IG today Alternatively you
can learn more about financial markets with IG Academy
Lesson 12 Confirmation Checklist = High Probability Trades
Technical Level EASYWAYLEARN ACADEMY
SAHALSOFTWARE ndash SAHAL UNIVERSITY
Eng Mohamed Jama
SupportResistance
Price Reversal Zone
Trend-Line
Pull Back
Technical Level EASYWAYLEARN ACADEMY
SAHALSOFTWARE ndash SAHAL UNIVERSITY
Eng Mohamed Jama
Technical Level EASYWAYLEARN ACADEMY
SAHALSOFTWARE ndash SAHAL UNIVERSITY
Eng Mohamed Jama
Technical Level EASYWAYLEARN ACADEMY
SAHALSOFTWARE ndash SAHAL UNIVERSITY
Eng Mohamed Jama
Technical Level EASYWAYLEARN ACADEMY
SAHALSOFTWARE ndash SAHAL UNIVERSITY
Eng Mohamed Jama
END
Technical Level EASYWAYLEARN ACADEMY
SAHALSOFTWARE ndash SAHAL UNIVERSITY
Eng Mohamed Jama

Technical Level EASYWAYLEARN ACADEMY
SAHALSOFTWARE ndash SAHAL UNIVERSITY
Eng Mohamed Jama
Technical Level EASYWAYLEARN ACADEMY
SAHALSOFTWARE ndash SAHAL UNIVERSITY
Eng Mohamed Jama
Technical Level EASYWAYLEARN ACADEMY
SAHALSOFTWARE ndash SAHAL UNIVERSITY
Eng Mohamed Jama
Technical Level EASYWAYLEARN ACADEMY
SAHALSOFTWARE ndash SAHAL UNIVERSITY
Eng Mohamed Jama
Technical Level EASYWAYLEARN ACADEMY
SAHALSOFTWARE ndash SAHAL UNIVERSITY
Eng Mohamed Jama
Technical Level EASYWAYLEARN ACADEMY
SAHALSOFTWARE ndash SAHAL UNIVERSITY
Eng Mohamed Jama
Lesson 10 Trend-Lines ndash Uptrend amp Downtrend
- Uptrend -gt HLHHHLHHHL ndash Swing High ndash Swing low
- Downtrend -gt HLLHLLLHLL ndash Swing low - Swing High
- Ranging Market ndash BOX
- Impulse or Run Pull Back or Correction or Retracement
Technical Level EASYWAYLEARN ACADEMY
SAHALSOFTWARE ndash SAHAL UNIVERSITY
Eng Mohamed Jama
Technical Level EASYWAYLEARN ACADEMY
SAHALSOFTWARE ndash SAHAL UNIVERSITY
Eng Mohamed Jama
Technical Level EASYWAYLEARN ACADEMY
SAHALSOFTWARE ndash SAHAL UNIVERSITY
Eng Mohamed Jama
Technical Level EASYWAYLEARN ACADEMY
SAHALSOFTWARE ndash SAHAL UNIVERSITY
Eng Mohamed Jama
Technical Level EASYWAYLEARN ACADEMY
SAHALSOFTWARE ndash SAHAL UNIVERSITY
Eng Mohamed Jama
Technical Level EASYWAYLEARN ACADEMY
SAHALSOFTWARE ndash SAHAL UNIVERSITY
Eng Mohamed Jama
Break and Retest Strategy
Waiting for a Retest Will Make You a Better Forex Trader
Technical Level EASYWAYLEARN ACADEMY
SAHALSOFTWARE ndash SAHAL UNIVERSITY
Eng Mohamed Jama
Technical Level EASYWAYLEARN ACADEMY
SAHALSOFTWARE ndash SAHAL UNIVERSITY
Eng Mohamed Jama
Lesson 11 Indicators (Leading and Lagging)
+ RSI Indicator
Leading and lagging indicators what you need to know
Technical traders use indicators to identify market patterns and
trends Most of these indicators fall into two categories leading
and lagging Discover some popular leading and lagging
indicators and how to use them
Technical Level EASYWAYLEARN ACADEMY
SAHALSOFTWARE ndash SAHAL UNIVERSITY
Eng Mohamed Jama
What is a leading technical indicator
A leading indicator is a tool designed to anticipate the future direction
of a market in order to enable traders to predict market movements
ahead of time
Technical Level EASYWAYLEARN ACADEMY
SAHALSOFTWARE ndash SAHAL UNIVERSITY
Eng Mohamed Jama
In theory if a leading indicator gives the correct signal a trader can
get in before the market movement and ride the entire trend However
leading indicators are by no means 100 accurate which is why they
are often combined with other forms of technical analysis
What is a lagging technical indicator
A lagging indicator is a tool that provides delayed feedback which
means it gives a signal once the price movement has already passed
Technical Level EASYWAYLEARN ACADEMY
SAHALSOFTWARE ndash SAHAL UNIVERSITY
Eng Mohamed Jama
or is in progress These are used by traders to confirm the price trend
before they enter a trade
These indicators are commonly used by trend traders ndash they donrsquot
show any upcoming price moves but confirm that a trend is underway
This tends to give traders more confidence that they are correct in
their assumptions rather than providing a specific trigger for entering
the market
Technical Level EASYWAYLEARN ACADEMY
SAHALSOFTWARE ndash SAHAL UNIVERSITY
Eng Mohamed Jama
Leading vs lagging technical indicators
whatrsquos the difference
The most obvious difference is that leading indicators predict market
movements while lagging indicators confirm trends that are already
taking place Both leading and lagging indicators have their own
advantages and drawbacks so itrsquos crucial to familiarise yourself with
how each works and decide which fits in with your strategy
Leading indicators react to prices quickly which can be great for
short-term traders but makes them prone to giving out false signals ndash
these happen when a signal indicates itrsquos time to enter the market but
the trend promptly reverses Conversely lagging indicators are far
slower to react which means that traders would have more accuracy
but could be late in entering the market
Relying solely on either could have negative effects on a strategy
which is why many traders will aim to find a balance of the two
Technical Level EASYWAYLEARN ACADEMY
SAHALSOFTWARE ndash SAHAL UNIVERSITY
Eng Mohamed Jama
Four popular leading indicators
Popular leading indicators include
1 The relative strength index (RSI)
2 The stochastic oscillator
3 Williams R
4 On-balance volume (OBV)
A lot of popular leading indicators fall into the category of oscillators as
these can identify a possible trend reversal before it happens
However not all leading indicators will use the same calculations so
there is the possibility that different indicators will show different
signals
Relative strength index (RSI)
The relative strength index (RSI) is a momentum indicator which
traders can use to identify whether a market is overbought or
Technical Level EASYWAYLEARN ACADEMY
SAHALSOFTWARE ndash SAHAL UNIVERSITY
Eng Mohamed Jama
oversold When the RSI gives a signal it is believed that the market
will reverse ndash this provides a leading sign that a trader should enter or
exit a position
The RSI is an oscillator so it is shown on a scale from zero to 100 If
the RSI is above 70 the market would often be thought of as
overbought and appear as red on the chart (below) And if the
indicator falls below the 30 level the market is usually considered
oversold and will appear in green on the chart
Technical Level EASYWAYLEARN ACADEMY
SAHALSOFTWARE ndash SAHAL UNIVERSITY
Eng Mohamed Jama
As mentioned the danger with leading indicators is that they can
provide premature or false signals With the RSI it is possible that the
market will sustain overbought or oversold conditions for long periods
of time without reversing This makes it important to have suitable risk
management measures in place such as stops and limits
Stochastic oscillator
Another popular example of a leading indicator is the stochastic
oscillator which is used to compare recent closing prices to the
previous trading range
The stochastic is based on the idea that market momentum changes
direction much faster than volume or price so it can be used to predict
the direction of market movements If the oscillator reaches a reading
of 80 or over the market would be considered overbought while
anything under 20 would be thought of as oversold
Technical Level EASYWAYLEARN ACADEMY
SAHALSOFTWARE ndash SAHAL UNIVERSITY
Eng Mohamed Jama
The oscillator is shown as two lines on the chart the K (the black
line on the chart below) and the D (the red dotted line below) When
these two lines cross it is seen as a leading signal that a change in
market direction is approaching
During volatile market conditions the stochastic is prone to false
signals To prevent this impacting your trades you could use the
stochastic in conjunction with other indicators or use it as a filter for
Technical Level EASYWAYLEARN ACADEMY
SAHALSOFTWARE ndash SAHAL UNIVERSITY
Eng Mohamed Jama
your trades rather than a trigger This would mean entering the market
once the trend is confirmed as you would with a lagging indicator
Williams R
The Williams percent range more commonly known as the Williams
R is very similar to the stochastic oscillator The main difference
being that it works on a negative scale ndash so it ranges between zero
and -100 and uses -20 and -80 as the overbought and oversold
signals respectively
So on the below chart the green line below -80 indicates that the
price is likely to rise While the red line above -20 indicates the price is
likely to fall
Technical Level EASYWAYLEARN ACADEMY
SAHALSOFTWARE ndash SAHAL UNIVERSITY
Eng Mohamed Jama
The indicator is highly responsive meaning it might start to move to
highs or lows even if the actual market price does not follow suit As
the Williams R is leading these signals can be premature and less
reliable than other entry signals which is why some traders prefer to
use -10 and -90 as more extreme price signals
On-balance volume (OBV)
Technical Level EASYWAYLEARN ACADEMY
SAHALSOFTWARE ndash SAHAL UNIVERSITY
Eng Mohamed Jama
On-balance volume (OBV) is another leading momentum-based
indicator It looks at volume to enable traders to make predictions
about the market price ndash OBV is largely used in shares trading as
volume is well documented by stock exchanges
Traders who use OBV as a leading indicator will focus on increases or
decreases in volume without the equivalent change in price This is
believed to be an indication that the price will increase or decrease
imminently
As a leading indicator OBV is prone to giving false signals especially
as the indicator can be thrown off by huge spikes in volume around
announcements that surprise the market Although volume changes
this is not always indicative of a trend and can cause traders to open
positions prematurely
As with the other leading indicators the OBV is often used in
conjunction with lagging indicators and a thorough risk management
strategy
Technical Level EASYWAYLEARN ACADEMY
SAHALSOFTWARE ndash SAHAL UNIVERSITY
Eng Mohamed Jama
Three popular lagging indicators
Popular lagging indicators include
1 Moving averages
2 The MACD indicator
3 Bollinger bands
Lagging indicators are primarily used to filter out the noise from short-
term market movements and confirm long-term trends They are
usually drawn onto the price chart itself unlike leading indicators
which usually appear in separate windows
Moving averages
Moving averages (MAs) are categorized as a lagging indicator
because they are based on historical data
Buy and sell signals are generated when the price line crosses the MA
or when two MA lines cross each other However because the moving
average is calculated using previous price points the current market
price will be ahead of the MA
Technical Level EASYWAYLEARN ACADEMY
SAHALSOFTWARE ndash SAHAL UNIVERSITY
Eng Mohamed Jama
In the below 50-day MA example the moving average has crossed
the price from above indicating an upward reversal is imminent
However we can see that the MA is slower to pick up the bullish trend
when it does occur
Moving averages can be calculated over any timeframe depending on
the traderrsquos goals ndash but the longer the time frame the longer the lag
Technical Level EASYWAYLEARN ACADEMY
SAHALSOFTWARE ndash SAHAL UNIVERSITY
Eng Mohamed Jama
So a MA of 300 days would have a far longer delay than an MA of 50
days
It is possible for lagging indicators to give off false signals but it is less
likely as they are slower to react
MACD indicator
Moving averages can be used on their own or they can be the basis
of other technical indicators such as the moving average
convergence divergence (MACD) As it is based on MAs the MACD is
inherently a trend-following or lagging indicator However it has been
argued that different components of the MACD provide traders with
different opportunities
There are three components to the tool two moving averages and a
histogram The two moving averages (the signal line and the MACD
line) are invariably lagging indicators as they only provide signals
once the two lines have crossed each other by which time the trend is
already in motion
Technical Level EASYWAYLEARN ACADEMY
SAHALSOFTWARE ndash SAHAL UNIVERSITY
Eng Mohamed Jama
Source IG charts
But the MACD histogram is sometimes considered a leading indicator
as it is used to anticipate signal crossovers in between the two moving
averages The bars on the histogram represents the difference
between the two MAs ndash as the bars move further away from the
central zero line it means the MAs are moving further apart Once this
expansion is over a lsquohumprsquo appears on the histogram which is a sign
the MAs will tighten again and a crossover will occur
Technical Level EASYWAYLEARN ACADEMY
SAHALSOFTWARE ndash SAHAL UNIVERSITY
Eng Mohamed Jama
Although the histogram can be used to enter positions ahead of the
crossovers the moving averages inherently fall behind the market
price So in general it is a lagging indicator This means that there are
instances where the market price may reach a reversal point before
the signal has even been generated ndash which would be deemed a false
signal
Bollinger bands
The Bollinger band tool is a lagging indicator as it is based on a 20-
day simple moving average (SMA) and two outer lines These outer
bands represent the positive and negative standard deviations away
from the SMA and are used as a measure of volatility When levels of
volatility increase the bands will widen and as volatility decreases
they will contract
When the price reaches the outer bands of the Bollinger it often acts
as a trigger for the market to rebound back towards the central 20-
period moving average
Technical Level EASYWAYLEARN ACADEMY
SAHALSOFTWARE ndash SAHAL UNIVERSITY
Eng Mohamed Jama
Source IG charts
There are strategies that suggest the bands have leading indicator
properties but alone they do not give out leading trading signals
Bollinger bands can give no indication of exactly when the change in
volatility might take place or which direction the price will move in
They are merely a sign that a breakout could soon take place giving
bullish and bearish signals
Technical Level EASYWAYLEARN ACADEMY
SAHALSOFTWARE ndash SAHAL UNIVERSITY
Eng Mohamed Jama
This is why traders will often confirm the Bollinger band signals with
price action or use the indicator in conjunction with other lagging tools
or leading indicators such as the RSI
Leading and lagging technical indicators
summed up
A leading indicator is a tool designed to anticipate the future direction
of a market
A lagging indicator is a tool that gives signal once the price movement
has already started
Leading indicators react to prices quickly but this makes them prone to
giving out false signals
Lagging indicators can be more accurate but this is because they are
far slower to react
A lot of popular leading indicators fall into the category of oscillators
including the RSI stochastic oscillator Williams R and OBV
Lagging indicators are drawn onto the price chart itself and include
moving averages the MACD and Bollinger bands
Technical Level EASYWAYLEARN ACADEMY
SAHALSOFTWARE ndash SAHAL UNIVERSITY
Eng Mohamed Jama
Relying solely on either could have negative effects on a strategy
which is why many traders will aim to find a balance of the two
If you feel ready to start using lagging and leading indicators on live
markets you can open an account with IG today Alternatively you
can learn more about financial markets with IG Academy
Lesson 12 Confirmation Checklist = High Probability Trades
Technical Level EASYWAYLEARN ACADEMY
SAHALSOFTWARE ndash SAHAL UNIVERSITY
Eng Mohamed Jama
SupportResistance
Price Reversal Zone
Trend-Line
Pull Back
Technical Level EASYWAYLEARN ACADEMY
SAHALSOFTWARE ndash SAHAL UNIVERSITY
Eng Mohamed Jama
Technical Level EASYWAYLEARN ACADEMY
SAHALSOFTWARE ndash SAHAL UNIVERSITY
Eng Mohamed Jama
Technical Level EASYWAYLEARN ACADEMY
SAHALSOFTWARE ndash SAHAL UNIVERSITY
Eng Mohamed Jama
Technical Level EASYWAYLEARN ACADEMY
SAHALSOFTWARE ndash SAHAL UNIVERSITY
Eng Mohamed Jama
END
Technical Level EASYWAYLEARN ACADEMY
SAHALSOFTWARE ndash SAHAL UNIVERSITY
Eng Mohamed Jama

Technical Level EASYWAYLEARN ACADEMY
SAHALSOFTWARE ndash SAHAL UNIVERSITY
Eng Mohamed Jama
Technical Level EASYWAYLEARN ACADEMY
SAHALSOFTWARE ndash SAHAL UNIVERSITY
Eng Mohamed Jama
Technical Level EASYWAYLEARN ACADEMY
SAHALSOFTWARE ndash SAHAL UNIVERSITY
Eng Mohamed Jama
Technical Level EASYWAYLEARN ACADEMY
SAHALSOFTWARE ndash SAHAL UNIVERSITY
Eng Mohamed Jama
Technical Level EASYWAYLEARN ACADEMY
SAHALSOFTWARE ndash SAHAL UNIVERSITY
Eng Mohamed Jama
Lesson 10 Trend-Lines ndash Uptrend amp Downtrend
- Uptrend -gt HLHHHLHHHL ndash Swing High ndash Swing low
- Downtrend -gt HLLHLLLHLL ndash Swing low - Swing High
- Ranging Market ndash BOX
- Impulse or Run Pull Back or Correction or Retracement
Technical Level EASYWAYLEARN ACADEMY
SAHALSOFTWARE ndash SAHAL UNIVERSITY
Eng Mohamed Jama
Technical Level EASYWAYLEARN ACADEMY
SAHALSOFTWARE ndash SAHAL UNIVERSITY
Eng Mohamed Jama
Technical Level EASYWAYLEARN ACADEMY
SAHALSOFTWARE ndash SAHAL UNIVERSITY
Eng Mohamed Jama
Technical Level EASYWAYLEARN ACADEMY
SAHALSOFTWARE ndash SAHAL UNIVERSITY
Eng Mohamed Jama
Technical Level EASYWAYLEARN ACADEMY
SAHALSOFTWARE ndash SAHAL UNIVERSITY
Eng Mohamed Jama
Technical Level EASYWAYLEARN ACADEMY
SAHALSOFTWARE ndash SAHAL UNIVERSITY
Eng Mohamed Jama
Break and Retest Strategy
Waiting for a Retest Will Make You a Better Forex Trader
Technical Level EASYWAYLEARN ACADEMY
SAHALSOFTWARE ndash SAHAL UNIVERSITY
Eng Mohamed Jama
Technical Level EASYWAYLEARN ACADEMY
SAHALSOFTWARE ndash SAHAL UNIVERSITY
Eng Mohamed Jama
Lesson 11 Indicators (Leading and Lagging)
+ RSI Indicator
Leading and lagging indicators what you need to know
Technical traders use indicators to identify market patterns and
trends Most of these indicators fall into two categories leading
and lagging Discover some popular leading and lagging
indicators and how to use them
Technical Level EASYWAYLEARN ACADEMY
SAHALSOFTWARE ndash SAHAL UNIVERSITY
Eng Mohamed Jama
What is a leading technical indicator
A leading indicator is a tool designed to anticipate the future direction
of a market in order to enable traders to predict market movements
ahead of time
Technical Level EASYWAYLEARN ACADEMY
SAHALSOFTWARE ndash SAHAL UNIVERSITY
Eng Mohamed Jama
In theory if a leading indicator gives the correct signal a trader can
get in before the market movement and ride the entire trend However
leading indicators are by no means 100 accurate which is why they
are often combined with other forms of technical analysis
What is a lagging technical indicator
A lagging indicator is a tool that provides delayed feedback which
means it gives a signal once the price movement has already passed
Technical Level EASYWAYLEARN ACADEMY
SAHALSOFTWARE ndash SAHAL UNIVERSITY
Eng Mohamed Jama
or is in progress These are used by traders to confirm the price trend
before they enter a trade
These indicators are commonly used by trend traders ndash they donrsquot
show any upcoming price moves but confirm that a trend is underway
This tends to give traders more confidence that they are correct in
their assumptions rather than providing a specific trigger for entering
the market
Technical Level EASYWAYLEARN ACADEMY
SAHALSOFTWARE ndash SAHAL UNIVERSITY
Eng Mohamed Jama
Leading vs lagging technical indicators
whatrsquos the difference
The most obvious difference is that leading indicators predict market
movements while lagging indicators confirm trends that are already
taking place Both leading and lagging indicators have their own
advantages and drawbacks so itrsquos crucial to familiarise yourself with
how each works and decide which fits in with your strategy
Leading indicators react to prices quickly which can be great for
short-term traders but makes them prone to giving out false signals ndash
these happen when a signal indicates itrsquos time to enter the market but
the trend promptly reverses Conversely lagging indicators are far
slower to react which means that traders would have more accuracy
but could be late in entering the market
Relying solely on either could have negative effects on a strategy
which is why many traders will aim to find a balance of the two
Technical Level EASYWAYLEARN ACADEMY
SAHALSOFTWARE ndash SAHAL UNIVERSITY
Eng Mohamed Jama
Four popular leading indicators
Popular leading indicators include
1 The relative strength index (RSI)
2 The stochastic oscillator
3 Williams R
4 On-balance volume (OBV)
A lot of popular leading indicators fall into the category of oscillators as
these can identify a possible trend reversal before it happens
However not all leading indicators will use the same calculations so
there is the possibility that different indicators will show different
signals
Relative strength index (RSI)
The relative strength index (RSI) is a momentum indicator which
traders can use to identify whether a market is overbought or
Technical Level EASYWAYLEARN ACADEMY
SAHALSOFTWARE ndash SAHAL UNIVERSITY
Eng Mohamed Jama
oversold When the RSI gives a signal it is believed that the market
will reverse ndash this provides a leading sign that a trader should enter or
exit a position
The RSI is an oscillator so it is shown on a scale from zero to 100 If
the RSI is above 70 the market would often be thought of as
overbought and appear as red on the chart (below) And if the
indicator falls below the 30 level the market is usually considered
oversold and will appear in green on the chart
Technical Level EASYWAYLEARN ACADEMY
SAHALSOFTWARE ndash SAHAL UNIVERSITY
Eng Mohamed Jama
As mentioned the danger with leading indicators is that they can
provide premature or false signals With the RSI it is possible that the
market will sustain overbought or oversold conditions for long periods
of time without reversing This makes it important to have suitable risk
management measures in place such as stops and limits
Stochastic oscillator
Another popular example of a leading indicator is the stochastic
oscillator which is used to compare recent closing prices to the
previous trading range
The stochastic is based on the idea that market momentum changes
direction much faster than volume or price so it can be used to predict
the direction of market movements If the oscillator reaches a reading
of 80 or over the market would be considered overbought while
anything under 20 would be thought of as oversold
Technical Level EASYWAYLEARN ACADEMY
SAHALSOFTWARE ndash SAHAL UNIVERSITY
Eng Mohamed Jama
The oscillator is shown as two lines on the chart the K (the black
line on the chart below) and the D (the red dotted line below) When
these two lines cross it is seen as a leading signal that a change in
market direction is approaching
During volatile market conditions the stochastic is prone to false
signals To prevent this impacting your trades you could use the
stochastic in conjunction with other indicators or use it as a filter for
Technical Level EASYWAYLEARN ACADEMY
SAHALSOFTWARE ndash SAHAL UNIVERSITY
Eng Mohamed Jama
your trades rather than a trigger This would mean entering the market
once the trend is confirmed as you would with a lagging indicator
Williams R
The Williams percent range more commonly known as the Williams
R is very similar to the stochastic oscillator The main difference
being that it works on a negative scale ndash so it ranges between zero
and -100 and uses -20 and -80 as the overbought and oversold
signals respectively
So on the below chart the green line below -80 indicates that the
price is likely to rise While the red line above -20 indicates the price is
likely to fall
Technical Level EASYWAYLEARN ACADEMY
SAHALSOFTWARE ndash SAHAL UNIVERSITY
Eng Mohamed Jama
The indicator is highly responsive meaning it might start to move to
highs or lows even if the actual market price does not follow suit As
the Williams R is leading these signals can be premature and less
reliable than other entry signals which is why some traders prefer to
use -10 and -90 as more extreme price signals
On-balance volume (OBV)
Technical Level EASYWAYLEARN ACADEMY
SAHALSOFTWARE ndash SAHAL UNIVERSITY
Eng Mohamed Jama
On-balance volume (OBV) is another leading momentum-based
indicator It looks at volume to enable traders to make predictions
about the market price ndash OBV is largely used in shares trading as
volume is well documented by stock exchanges
Traders who use OBV as a leading indicator will focus on increases or
decreases in volume without the equivalent change in price This is
believed to be an indication that the price will increase or decrease
imminently
As a leading indicator OBV is prone to giving false signals especially
as the indicator can be thrown off by huge spikes in volume around
announcements that surprise the market Although volume changes
this is not always indicative of a trend and can cause traders to open
positions prematurely
As with the other leading indicators the OBV is often used in
conjunction with lagging indicators and a thorough risk management
strategy
Technical Level EASYWAYLEARN ACADEMY
SAHALSOFTWARE ndash SAHAL UNIVERSITY
Eng Mohamed Jama
Three popular lagging indicators
Popular lagging indicators include
1 Moving averages
2 The MACD indicator
3 Bollinger bands
Lagging indicators are primarily used to filter out the noise from short-
term market movements and confirm long-term trends They are
usually drawn onto the price chart itself unlike leading indicators
which usually appear in separate windows
Moving averages
Moving averages (MAs) are categorized as a lagging indicator
because they are based on historical data
Buy and sell signals are generated when the price line crosses the MA
or when two MA lines cross each other However because the moving
average is calculated using previous price points the current market
price will be ahead of the MA
Technical Level EASYWAYLEARN ACADEMY
SAHALSOFTWARE ndash SAHAL UNIVERSITY
Eng Mohamed Jama
In the below 50-day MA example the moving average has crossed
the price from above indicating an upward reversal is imminent
However we can see that the MA is slower to pick up the bullish trend
when it does occur
Moving averages can be calculated over any timeframe depending on
the traderrsquos goals ndash but the longer the time frame the longer the lag
Technical Level EASYWAYLEARN ACADEMY
SAHALSOFTWARE ndash SAHAL UNIVERSITY
Eng Mohamed Jama
So a MA of 300 days would have a far longer delay than an MA of 50
days
It is possible for lagging indicators to give off false signals but it is less
likely as they are slower to react
MACD indicator
Moving averages can be used on their own or they can be the basis
of other technical indicators such as the moving average
convergence divergence (MACD) As it is based on MAs the MACD is
inherently a trend-following or lagging indicator However it has been
argued that different components of the MACD provide traders with
different opportunities
There are three components to the tool two moving averages and a
histogram The two moving averages (the signal line and the MACD
line) are invariably lagging indicators as they only provide signals
once the two lines have crossed each other by which time the trend is
already in motion
Technical Level EASYWAYLEARN ACADEMY
SAHALSOFTWARE ndash SAHAL UNIVERSITY
Eng Mohamed Jama
Source IG charts
But the MACD histogram is sometimes considered a leading indicator
as it is used to anticipate signal crossovers in between the two moving
averages The bars on the histogram represents the difference
between the two MAs ndash as the bars move further away from the
central zero line it means the MAs are moving further apart Once this
expansion is over a lsquohumprsquo appears on the histogram which is a sign
the MAs will tighten again and a crossover will occur
Technical Level EASYWAYLEARN ACADEMY
SAHALSOFTWARE ndash SAHAL UNIVERSITY
Eng Mohamed Jama
Although the histogram can be used to enter positions ahead of the
crossovers the moving averages inherently fall behind the market
price So in general it is a lagging indicator This means that there are
instances where the market price may reach a reversal point before
the signal has even been generated ndash which would be deemed a false
signal
Bollinger bands
The Bollinger band tool is a lagging indicator as it is based on a 20-
day simple moving average (SMA) and two outer lines These outer
bands represent the positive and negative standard deviations away
from the SMA and are used as a measure of volatility When levels of
volatility increase the bands will widen and as volatility decreases
they will contract
When the price reaches the outer bands of the Bollinger it often acts
as a trigger for the market to rebound back towards the central 20-
period moving average
Technical Level EASYWAYLEARN ACADEMY
SAHALSOFTWARE ndash SAHAL UNIVERSITY
Eng Mohamed Jama
Source IG charts
There are strategies that suggest the bands have leading indicator
properties but alone they do not give out leading trading signals
Bollinger bands can give no indication of exactly when the change in
volatility might take place or which direction the price will move in
They are merely a sign that a breakout could soon take place giving
bullish and bearish signals
Technical Level EASYWAYLEARN ACADEMY
SAHALSOFTWARE ndash SAHAL UNIVERSITY
Eng Mohamed Jama
This is why traders will often confirm the Bollinger band signals with
price action or use the indicator in conjunction with other lagging tools
or leading indicators such as the RSI
Leading and lagging technical indicators
summed up
A leading indicator is a tool designed to anticipate the future direction
of a market
A lagging indicator is a tool that gives signal once the price movement
has already started
Leading indicators react to prices quickly but this makes them prone to
giving out false signals
Lagging indicators can be more accurate but this is because they are
far slower to react
A lot of popular leading indicators fall into the category of oscillators
including the RSI stochastic oscillator Williams R and OBV
Lagging indicators are drawn onto the price chart itself and include
moving averages the MACD and Bollinger bands
Technical Level EASYWAYLEARN ACADEMY
SAHALSOFTWARE ndash SAHAL UNIVERSITY
Eng Mohamed Jama
Relying solely on either could have negative effects on a strategy
which is why many traders will aim to find a balance of the two
If you feel ready to start using lagging and leading indicators on live
markets you can open an account with IG today Alternatively you
can learn more about financial markets with IG Academy
Lesson 12 Confirmation Checklist = High Probability Trades
Technical Level EASYWAYLEARN ACADEMY
SAHALSOFTWARE ndash SAHAL UNIVERSITY
Eng Mohamed Jama
SupportResistance
Price Reversal Zone
Trend-Line
Pull Back
Technical Level EASYWAYLEARN ACADEMY
SAHALSOFTWARE ndash SAHAL UNIVERSITY
Eng Mohamed Jama
Technical Level EASYWAYLEARN ACADEMY
SAHALSOFTWARE ndash SAHAL UNIVERSITY
Eng Mohamed Jama
Technical Level EASYWAYLEARN ACADEMY
SAHALSOFTWARE ndash SAHAL UNIVERSITY
Eng Mohamed Jama
Technical Level EASYWAYLEARN ACADEMY
SAHALSOFTWARE ndash SAHAL UNIVERSITY
Eng Mohamed Jama
END
Technical Level EASYWAYLEARN ACADEMY
SAHALSOFTWARE ndash SAHAL UNIVERSITY
Eng Mohamed Jama

Technical Level EASYWAYLEARN ACADEMY
SAHALSOFTWARE ndash SAHAL UNIVERSITY
Eng Mohamed Jama
Technical Level EASYWAYLEARN ACADEMY
SAHALSOFTWARE ndash SAHAL UNIVERSITY
Eng Mohamed Jama
Technical Level EASYWAYLEARN ACADEMY
SAHALSOFTWARE ndash SAHAL UNIVERSITY
Eng Mohamed Jama
Technical Level EASYWAYLEARN ACADEMY
SAHALSOFTWARE ndash SAHAL UNIVERSITY
Eng Mohamed Jama
Lesson 10 Trend-Lines ndash Uptrend amp Downtrend
- Uptrend -gt HLHHHLHHHL ndash Swing High ndash Swing low
- Downtrend -gt HLLHLLLHLL ndash Swing low - Swing High
- Ranging Market ndash BOX
- Impulse or Run Pull Back or Correction or Retracement
Technical Level EASYWAYLEARN ACADEMY
SAHALSOFTWARE ndash SAHAL UNIVERSITY
Eng Mohamed Jama
Technical Level EASYWAYLEARN ACADEMY
SAHALSOFTWARE ndash SAHAL UNIVERSITY
Eng Mohamed Jama
Technical Level EASYWAYLEARN ACADEMY
SAHALSOFTWARE ndash SAHAL UNIVERSITY
Eng Mohamed Jama
Technical Level EASYWAYLEARN ACADEMY
SAHALSOFTWARE ndash SAHAL UNIVERSITY
Eng Mohamed Jama
Technical Level EASYWAYLEARN ACADEMY
SAHALSOFTWARE ndash SAHAL UNIVERSITY
Eng Mohamed Jama
Technical Level EASYWAYLEARN ACADEMY
SAHALSOFTWARE ndash SAHAL UNIVERSITY
Eng Mohamed Jama
Break and Retest Strategy
Waiting for a Retest Will Make You a Better Forex Trader
Technical Level EASYWAYLEARN ACADEMY
SAHALSOFTWARE ndash SAHAL UNIVERSITY
Eng Mohamed Jama
Technical Level EASYWAYLEARN ACADEMY
SAHALSOFTWARE ndash SAHAL UNIVERSITY
Eng Mohamed Jama
Lesson 11 Indicators (Leading and Lagging)
+ RSI Indicator
Leading and lagging indicators what you need to know
Technical traders use indicators to identify market patterns and
trends Most of these indicators fall into two categories leading
and lagging Discover some popular leading and lagging
indicators and how to use them
Technical Level EASYWAYLEARN ACADEMY
SAHALSOFTWARE ndash SAHAL UNIVERSITY
Eng Mohamed Jama
What is a leading technical indicator
A leading indicator is a tool designed to anticipate the future direction
of a market in order to enable traders to predict market movements
ahead of time
Technical Level EASYWAYLEARN ACADEMY
SAHALSOFTWARE ndash SAHAL UNIVERSITY
Eng Mohamed Jama
In theory if a leading indicator gives the correct signal a trader can
get in before the market movement and ride the entire trend However
leading indicators are by no means 100 accurate which is why they
are often combined with other forms of technical analysis
What is a lagging technical indicator
A lagging indicator is a tool that provides delayed feedback which
means it gives a signal once the price movement has already passed
Technical Level EASYWAYLEARN ACADEMY
SAHALSOFTWARE ndash SAHAL UNIVERSITY
Eng Mohamed Jama
or is in progress These are used by traders to confirm the price trend
before they enter a trade
These indicators are commonly used by trend traders ndash they donrsquot
show any upcoming price moves but confirm that a trend is underway
This tends to give traders more confidence that they are correct in
their assumptions rather than providing a specific trigger for entering
the market
Technical Level EASYWAYLEARN ACADEMY
SAHALSOFTWARE ndash SAHAL UNIVERSITY
Eng Mohamed Jama
Leading vs lagging technical indicators
whatrsquos the difference
The most obvious difference is that leading indicators predict market
movements while lagging indicators confirm trends that are already
taking place Both leading and lagging indicators have their own
advantages and drawbacks so itrsquos crucial to familiarise yourself with
how each works and decide which fits in with your strategy
Leading indicators react to prices quickly which can be great for
short-term traders but makes them prone to giving out false signals ndash
these happen when a signal indicates itrsquos time to enter the market but
the trend promptly reverses Conversely lagging indicators are far
slower to react which means that traders would have more accuracy
but could be late in entering the market
Relying solely on either could have negative effects on a strategy
which is why many traders will aim to find a balance of the two
Technical Level EASYWAYLEARN ACADEMY
SAHALSOFTWARE ndash SAHAL UNIVERSITY
Eng Mohamed Jama
Four popular leading indicators
Popular leading indicators include
1 The relative strength index (RSI)
2 The stochastic oscillator
3 Williams R
4 On-balance volume (OBV)
A lot of popular leading indicators fall into the category of oscillators as
these can identify a possible trend reversal before it happens
However not all leading indicators will use the same calculations so
there is the possibility that different indicators will show different
signals
Relative strength index (RSI)
The relative strength index (RSI) is a momentum indicator which
traders can use to identify whether a market is overbought or
Technical Level EASYWAYLEARN ACADEMY
SAHALSOFTWARE ndash SAHAL UNIVERSITY
Eng Mohamed Jama
oversold When the RSI gives a signal it is believed that the market
will reverse ndash this provides a leading sign that a trader should enter or
exit a position
The RSI is an oscillator so it is shown on a scale from zero to 100 If
the RSI is above 70 the market would often be thought of as
overbought and appear as red on the chart (below) And if the
indicator falls below the 30 level the market is usually considered
oversold and will appear in green on the chart
Technical Level EASYWAYLEARN ACADEMY
SAHALSOFTWARE ndash SAHAL UNIVERSITY
Eng Mohamed Jama
As mentioned the danger with leading indicators is that they can
provide premature or false signals With the RSI it is possible that the
market will sustain overbought or oversold conditions for long periods
of time without reversing This makes it important to have suitable risk
management measures in place such as stops and limits
Stochastic oscillator
Another popular example of a leading indicator is the stochastic
oscillator which is used to compare recent closing prices to the
previous trading range
The stochastic is based on the idea that market momentum changes
direction much faster than volume or price so it can be used to predict
the direction of market movements If the oscillator reaches a reading
of 80 or over the market would be considered overbought while
anything under 20 would be thought of as oversold
Technical Level EASYWAYLEARN ACADEMY
SAHALSOFTWARE ndash SAHAL UNIVERSITY
Eng Mohamed Jama
The oscillator is shown as two lines on the chart the K (the black
line on the chart below) and the D (the red dotted line below) When
these two lines cross it is seen as a leading signal that a change in
market direction is approaching
During volatile market conditions the stochastic is prone to false
signals To prevent this impacting your trades you could use the
stochastic in conjunction with other indicators or use it as a filter for
Technical Level EASYWAYLEARN ACADEMY
SAHALSOFTWARE ndash SAHAL UNIVERSITY
Eng Mohamed Jama
your trades rather than a trigger This would mean entering the market
once the trend is confirmed as you would with a lagging indicator
Williams R
The Williams percent range more commonly known as the Williams
R is very similar to the stochastic oscillator The main difference
being that it works on a negative scale ndash so it ranges between zero
and -100 and uses -20 and -80 as the overbought and oversold
signals respectively
So on the below chart the green line below -80 indicates that the
price is likely to rise While the red line above -20 indicates the price is
likely to fall
Technical Level EASYWAYLEARN ACADEMY
SAHALSOFTWARE ndash SAHAL UNIVERSITY
Eng Mohamed Jama
The indicator is highly responsive meaning it might start to move to
highs or lows even if the actual market price does not follow suit As
the Williams R is leading these signals can be premature and less
reliable than other entry signals which is why some traders prefer to
use -10 and -90 as more extreme price signals
On-balance volume (OBV)
Technical Level EASYWAYLEARN ACADEMY
SAHALSOFTWARE ndash SAHAL UNIVERSITY
Eng Mohamed Jama
On-balance volume (OBV) is another leading momentum-based
indicator It looks at volume to enable traders to make predictions
about the market price ndash OBV is largely used in shares trading as
volume is well documented by stock exchanges
Traders who use OBV as a leading indicator will focus on increases or
decreases in volume without the equivalent change in price This is
believed to be an indication that the price will increase or decrease
imminently
As a leading indicator OBV is prone to giving false signals especially
as the indicator can be thrown off by huge spikes in volume around
announcements that surprise the market Although volume changes
this is not always indicative of a trend and can cause traders to open
positions prematurely
As with the other leading indicators the OBV is often used in
conjunction with lagging indicators and a thorough risk management
strategy
Technical Level EASYWAYLEARN ACADEMY
SAHALSOFTWARE ndash SAHAL UNIVERSITY
Eng Mohamed Jama
Three popular lagging indicators
Popular lagging indicators include
1 Moving averages
2 The MACD indicator
3 Bollinger bands
Lagging indicators are primarily used to filter out the noise from short-
term market movements and confirm long-term trends They are
usually drawn onto the price chart itself unlike leading indicators
which usually appear in separate windows
Moving averages
Moving averages (MAs) are categorized as a lagging indicator
because they are based on historical data
Buy and sell signals are generated when the price line crosses the MA
or when two MA lines cross each other However because the moving
average is calculated using previous price points the current market
price will be ahead of the MA
Technical Level EASYWAYLEARN ACADEMY
SAHALSOFTWARE ndash SAHAL UNIVERSITY
Eng Mohamed Jama
In the below 50-day MA example the moving average has crossed
the price from above indicating an upward reversal is imminent
However we can see that the MA is slower to pick up the bullish trend
when it does occur
Moving averages can be calculated over any timeframe depending on
the traderrsquos goals ndash but the longer the time frame the longer the lag
Technical Level EASYWAYLEARN ACADEMY
SAHALSOFTWARE ndash SAHAL UNIVERSITY
Eng Mohamed Jama
So a MA of 300 days would have a far longer delay than an MA of 50
days
It is possible for lagging indicators to give off false signals but it is less
likely as they are slower to react
MACD indicator
Moving averages can be used on their own or they can be the basis
of other technical indicators such as the moving average
convergence divergence (MACD) As it is based on MAs the MACD is
inherently a trend-following or lagging indicator However it has been
argued that different components of the MACD provide traders with
different opportunities
There are three components to the tool two moving averages and a
histogram The two moving averages (the signal line and the MACD
line) are invariably lagging indicators as they only provide signals
once the two lines have crossed each other by which time the trend is
already in motion
Technical Level EASYWAYLEARN ACADEMY
SAHALSOFTWARE ndash SAHAL UNIVERSITY
Eng Mohamed Jama
Source IG charts
But the MACD histogram is sometimes considered a leading indicator
as it is used to anticipate signal crossovers in between the two moving
averages The bars on the histogram represents the difference
between the two MAs ndash as the bars move further away from the
central zero line it means the MAs are moving further apart Once this
expansion is over a lsquohumprsquo appears on the histogram which is a sign
the MAs will tighten again and a crossover will occur
Technical Level EASYWAYLEARN ACADEMY
SAHALSOFTWARE ndash SAHAL UNIVERSITY
Eng Mohamed Jama
Although the histogram can be used to enter positions ahead of the
crossovers the moving averages inherently fall behind the market
price So in general it is a lagging indicator This means that there are
instances where the market price may reach a reversal point before
the signal has even been generated ndash which would be deemed a false
signal
Bollinger bands
The Bollinger band tool is a lagging indicator as it is based on a 20-
day simple moving average (SMA) and two outer lines These outer
bands represent the positive and negative standard deviations away
from the SMA and are used as a measure of volatility When levels of
volatility increase the bands will widen and as volatility decreases
they will contract
When the price reaches the outer bands of the Bollinger it often acts
as a trigger for the market to rebound back towards the central 20-
period moving average
Technical Level EASYWAYLEARN ACADEMY
SAHALSOFTWARE ndash SAHAL UNIVERSITY
Eng Mohamed Jama
Source IG charts
There are strategies that suggest the bands have leading indicator
properties but alone they do not give out leading trading signals
Bollinger bands can give no indication of exactly when the change in
volatility might take place or which direction the price will move in
They are merely a sign that a breakout could soon take place giving
bullish and bearish signals
Technical Level EASYWAYLEARN ACADEMY
SAHALSOFTWARE ndash SAHAL UNIVERSITY
Eng Mohamed Jama
This is why traders will often confirm the Bollinger band signals with
price action or use the indicator in conjunction with other lagging tools
or leading indicators such as the RSI
Leading and lagging technical indicators
summed up
A leading indicator is a tool designed to anticipate the future direction
of a market
A lagging indicator is a tool that gives signal once the price movement
has already started
Leading indicators react to prices quickly but this makes them prone to
giving out false signals
Lagging indicators can be more accurate but this is because they are
far slower to react
A lot of popular leading indicators fall into the category of oscillators
including the RSI stochastic oscillator Williams R and OBV
Lagging indicators are drawn onto the price chart itself and include
moving averages the MACD and Bollinger bands
Technical Level EASYWAYLEARN ACADEMY
SAHALSOFTWARE ndash SAHAL UNIVERSITY
Eng Mohamed Jama
Relying solely on either could have negative effects on a strategy
which is why many traders will aim to find a balance of the two
If you feel ready to start using lagging and leading indicators on live
markets you can open an account with IG today Alternatively you
can learn more about financial markets with IG Academy
Lesson 12 Confirmation Checklist = High Probability Trades
Technical Level EASYWAYLEARN ACADEMY
SAHALSOFTWARE ndash SAHAL UNIVERSITY
Eng Mohamed Jama
SupportResistance
Price Reversal Zone
Trend-Line
Pull Back
Technical Level EASYWAYLEARN ACADEMY
SAHALSOFTWARE ndash SAHAL UNIVERSITY
Eng Mohamed Jama
Technical Level EASYWAYLEARN ACADEMY
SAHALSOFTWARE ndash SAHAL UNIVERSITY
Eng Mohamed Jama
Technical Level EASYWAYLEARN ACADEMY
SAHALSOFTWARE ndash SAHAL UNIVERSITY
Eng Mohamed Jama
Technical Level EASYWAYLEARN ACADEMY
SAHALSOFTWARE ndash SAHAL UNIVERSITY
Eng Mohamed Jama
END
Technical Level EASYWAYLEARN ACADEMY
SAHALSOFTWARE ndash SAHAL UNIVERSITY
Eng Mohamed Jama

Technical Level EASYWAYLEARN ACADEMY
SAHALSOFTWARE ndash SAHAL UNIVERSITY
Eng Mohamed Jama
Technical Level EASYWAYLEARN ACADEMY
SAHALSOFTWARE ndash SAHAL UNIVERSITY
Eng Mohamed Jama
Technical Level EASYWAYLEARN ACADEMY
SAHALSOFTWARE ndash SAHAL UNIVERSITY
Eng Mohamed Jama
Lesson 10 Trend-Lines ndash Uptrend amp Downtrend
- Uptrend -gt HLHHHLHHHL ndash Swing High ndash Swing low
- Downtrend -gt HLLHLLLHLL ndash Swing low - Swing High
- Ranging Market ndash BOX
- Impulse or Run Pull Back or Correction or Retracement
Technical Level EASYWAYLEARN ACADEMY
SAHALSOFTWARE ndash SAHAL UNIVERSITY
Eng Mohamed Jama
Technical Level EASYWAYLEARN ACADEMY
SAHALSOFTWARE ndash SAHAL UNIVERSITY
Eng Mohamed Jama
Technical Level EASYWAYLEARN ACADEMY
SAHALSOFTWARE ndash SAHAL UNIVERSITY
Eng Mohamed Jama
Technical Level EASYWAYLEARN ACADEMY
SAHALSOFTWARE ndash SAHAL UNIVERSITY
Eng Mohamed Jama
Technical Level EASYWAYLEARN ACADEMY
SAHALSOFTWARE ndash SAHAL UNIVERSITY
Eng Mohamed Jama
Technical Level EASYWAYLEARN ACADEMY
SAHALSOFTWARE ndash SAHAL UNIVERSITY
Eng Mohamed Jama
Break and Retest Strategy
Waiting for a Retest Will Make You a Better Forex Trader
Technical Level EASYWAYLEARN ACADEMY
SAHALSOFTWARE ndash SAHAL UNIVERSITY
Eng Mohamed Jama
Technical Level EASYWAYLEARN ACADEMY
SAHALSOFTWARE ndash SAHAL UNIVERSITY
Eng Mohamed Jama
Lesson 11 Indicators (Leading and Lagging)
+ RSI Indicator
Leading and lagging indicators what you need to know
Technical traders use indicators to identify market patterns and
trends Most of these indicators fall into two categories leading
and lagging Discover some popular leading and lagging
indicators and how to use them
Technical Level EASYWAYLEARN ACADEMY
SAHALSOFTWARE ndash SAHAL UNIVERSITY
Eng Mohamed Jama
What is a leading technical indicator
A leading indicator is a tool designed to anticipate the future direction
of a market in order to enable traders to predict market movements
ahead of time
Technical Level EASYWAYLEARN ACADEMY
SAHALSOFTWARE ndash SAHAL UNIVERSITY
Eng Mohamed Jama
In theory if a leading indicator gives the correct signal a trader can
get in before the market movement and ride the entire trend However
leading indicators are by no means 100 accurate which is why they
are often combined with other forms of technical analysis
What is a lagging technical indicator
A lagging indicator is a tool that provides delayed feedback which
means it gives a signal once the price movement has already passed
Technical Level EASYWAYLEARN ACADEMY
SAHALSOFTWARE ndash SAHAL UNIVERSITY
Eng Mohamed Jama
or is in progress These are used by traders to confirm the price trend
before they enter a trade
These indicators are commonly used by trend traders ndash they donrsquot
show any upcoming price moves but confirm that a trend is underway
This tends to give traders more confidence that they are correct in
their assumptions rather than providing a specific trigger for entering
the market
Technical Level EASYWAYLEARN ACADEMY
SAHALSOFTWARE ndash SAHAL UNIVERSITY
Eng Mohamed Jama
Leading vs lagging technical indicators
whatrsquos the difference
The most obvious difference is that leading indicators predict market
movements while lagging indicators confirm trends that are already
taking place Both leading and lagging indicators have their own
advantages and drawbacks so itrsquos crucial to familiarise yourself with
how each works and decide which fits in with your strategy
Leading indicators react to prices quickly which can be great for
short-term traders but makes them prone to giving out false signals ndash
these happen when a signal indicates itrsquos time to enter the market but
the trend promptly reverses Conversely lagging indicators are far
slower to react which means that traders would have more accuracy
but could be late in entering the market
Relying solely on either could have negative effects on a strategy
which is why many traders will aim to find a balance of the two
Technical Level EASYWAYLEARN ACADEMY
SAHALSOFTWARE ndash SAHAL UNIVERSITY
Eng Mohamed Jama
Four popular leading indicators
Popular leading indicators include
1 The relative strength index (RSI)
2 The stochastic oscillator
3 Williams R
4 On-balance volume (OBV)
A lot of popular leading indicators fall into the category of oscillators as
these can identify a possible trend reversal before it happens
However not all leading indicators will use the same calculations so
there is the possibility that different indicators will show different
signals
Relative strength index (RSI)
The relative strength index (RSI) is a momentum indicator which
traders can use to identify whether a market is overbought or
Technical Level EASYWAYLEARN ACADEMY
SAHALSOFTWARE ndash SAHAL UNIVERSITY
Eng Mohamed Jama
oversold When the RSI gives a signal it is believed that the market
will reverse ndash this provides a leading sign that a trader should enter or
exit a position
The RSI is an oscillator so it is shown on a scale from zero to 100 If
the RSI is above 70 the market would often be thought of as
overbought and appear as red on the chart (below) And if the
indicator falls below the 30 level the market is usually considered
oversold and will appear in green on the chart
Technical Level EASYWAYLEARN ACADEMY
SAHALSOFTWARE ndash SAHAL UNIVERSITY
Eng Mohamed Jama
As mentioned the danger with leading indicators is that they can
provide premature or false signals With the RSI it is possible that the
market will sustain overbought or oversold conditions for long periods
of time without reversing This makes it important to have suitable risk
management measures in place such as stops and limits
Stochastic oscillator
Another popular example of a leading indicator is the stochastic
oscillator which is used to compare recent closing prices to the
previous trading range
The stochastic is based on the idea that market momentum changes
direction much faster than volume or price so it can be used to predict
the direction of market movements If the oscillator reaches a reading
of 80 or over the market would be considered overbought while
anything under 20 would be thought of as oversold
Technical Level EASYWAYLEARN ACADEMY
SAHALSOFTWARE ndash SAHAL UNIVERSITY
Eng Mohamed Jama
The oscillator is shown as two lines on the chart the K (the black
line on the chart below) and the D (the red dotted line below) When
these two lines cross it is seen as a leading signal that a change in
market direction is approaching
During volatile market conditions the stochastic is prone to false
signals To prevent this impacting your trades you could use the
stochastic in conjunction with other indicators or use it as a filter for
Technical Level EASYWAYLEARN ACADEMY
SAHALSOFTWARE ndash SAHAL UNIVERSITY
Eng Mohamed Jama
your trades rather than a trigger This would mean entering the market
once the trend is confirmed as you would with a lagging indicator
Williams R
The Williams percent range more commonly known as the Williams
R is very similar to the stochastic oscillator The main difference
being that it works on a negative scale ndash so it ranges between zero
and -100 and uses -20 and -80 as the overbought and oversold
signals respectively
So on the below chart the green line below -80 indicates that the
price is likely to rise While the red line above -20 indicates the price is
likely to fall
Technical Level EASYWAYLEARN ACADEMY
SAHALSOFTWARE ndash SAHAL UNIVERSITY
Eng Mohamed Jama
The indicator is highly responsive meaning it might start to move to
highs or lows even if the actual market price does not follow suit As
the Williams R is leading these signals can be premature and less
reliable than other entry signals which is why some traders prefer to
use -10 and -90 as more extreme price signals
On-balance volume (OBV)
Technical Level EASYWAYLEARN ACADEMY
SAHALSOFTWARE ndash SAHAL UNIVERSITY
Eng Mohamed Jama
On-balance volume (OBV) is another leading momentum-based
indicator It looks at volume to enable traders to make predictions
about the market price ndash OBV is largely used in shares trading as
volume is well documented by stock exchanges
Traders who use OBV as a leading indicator will focus on increases or
decreases in volume without the equivalent change in price This is
believed to be an indication that the price will increase or decrease
imminently
As a leading indicator OBV is prone to giving false signals especially
as the indicator can be thrown off by huge spikes in volume around
announcements that surprise the market Although volume changes
this is not always indicative of a trend and can cause traders to open
positions prematurely
As with the other leading indicators the OBV is often used in
conjunction with lagging indicators and a thorough risk management
strategy
Technical Level EASYWAYLEARN ACADEMY
SAHALSOFTWARE ndash SAHAL UNIVERSITY
Eng Mohamed Jama
Three popular lagging indicators
Popular lagging indicators include
1 Moving averages
2 The MACD indicator
3 Bollinger bands
Lagging indicators are primarily used to filter out the noise from short-
term market movements and confirm long-term trends They are
usually drawn onto the price chart itself unlike leading indicators
which usually appear in separate windows
Moving averages
Moving averages (MAs) are categorized as a lagging indicator
because they are based on historical data
Buy and sell signals are generated when the price line crosses the MA
or when two MA lines cross each other However because the moving
average is calculated using previous price points the current market
price will be ahead of the MA
Technical Level EASYWAYLEARN ACADEMY
SAHALSOFTWARE ndash SAHAL UNIVERSITY
Eng Mohamed Jama
In the below 50-day MA example the moving average has crossed
the price from above indicating an upward reversal is imminent
However we can see that the MA is slower to pick up the bullish trend
when it does occur
Moving averages can be calculated over any timeframe depending on
the traderrsquos goals ndash but the longer the time frame the longer the lag
Technical Level EASYWAYLEARN ACADEMY
SAHALSOFTWARE ndash SAHAL UNIVERSITY
Eng Mohamed Jama
So a MA of 300 days would have a far longer delay than an MA of 50
days
It is possible for lagging indicators to give off false signals but it is less
likely as they are slower to react
MACD indicator
Moving averages can be used on their own or they can be the basis
of other technical indicators such as the moving average
convergence divergence (MACD) As it is based on MAs the MACD is
inherently a trend-following or lagging indicator However it has been
argued that different components of the MACD provide traders with
different opportunities
There are three components to the tool two moving averages and a
histogram The two moving averages (the signal line and the MACD
line) are invariably lagging indicators as they only provide signals
once the two lines have crossed each other by which time the trend is
already in motion
Technical Level EASYWAYLEARN ACADEMY
SAHALSOFTWARE ndash SAHAL UNIVERSITY
Eng Mohamed Jama
Source IG charts
But the MACD histogram is sometimes considered a leading indicator
as it is used to anticipate signal crossovers in between the two moving
averages The bars on the histogram represents the difference
between the two MAs ndash as the bars move further away from the
central zero line it means the MAs are moving further apart Once this
expansion is over a lsquohumprsquo appears on the histogram which is a sign
the MAs will tighten again and a crossover will occur
Technical Level EASYWAYLEARN ACADEMY
SAHALSOFTWARE ndash SAHAL UNIVERSITY
Eng Mohamed Jama
Although the histogram can be used to enter positions ahead of the
crossovers the moving averages inherently fall behind the market
price So in general it is a lagging indicator This means that there are
instances where the market price may reach a reversal point before
the signal has even been generated ndash which would be deemed a false
signal
Bollinger bands
The Bollinger band tool is a lagging indicator as it is based on a 20-
day simple moving average (SMA) and two outer lines These outer
bands represent the positive and negative standard deviations away
from the SMA and are used as a measure of volatility When levels of
volatility increase the bands will widen and as volatility decreases
they will contract
When the price reaches the outer bands of the Bollinger it often acts
as a trigger for the market to rebound back towards the central 20-
period moving average
Technical Level EASYWAYLEARN ACADEMY
SAHALSOFTWARE ndash SAHAL UNIVERSITY
Eng Mohamed Jama
Source IG charts
There are strategies that suggest the bands have leading indicator
properties but alone they do not give out leading trading signals
Bollinger bands can give no indication of exactly when the change in
volatility might take place or which direction the price will move in
They are merely a sign that a breakout could soon take place giving
bullish and bearish signals
Technical Level EASYWAYLEARN ACADEMY
SAHALSOFTWARE ndash SAHAL UNIVERSITY
Eng Mohamed Jama
This is why traders will often confirm the Bollinger band signals with
price action or use the indicator in conjunction with other lagging tools
or leading indicators such as the RSI
Leading and lagging technical indicators
summed up
A leading indicator is a tool designed to anticipate the future direction
of a market
A lagging indicator is a tool that gives signal once the price movement
has already started
Leading indicators react to prices quickly but this makes them prone to
giving out false signals
Lagging indicators can be more accurate but this is because they are
far slower to react
A lot of popular leading indicators fall into the category of oscillators
including the RSI stochastic oscillator Williams R and OBV
Lagging indicators are drawn onto the price chart itself and include
moving averages the MACD and Bollinger bands
Technical Level EASYWAYLEARN ACADEMY
SAHALSOFTWARE ndash SAHAL UNIVERSITY
Eng Mohamed Jama
Relying solely on either could have negative effects on a strategy
which is why many traders will aim to find a balance of the two
If you feel ready to start using lagging and leading indicators on live
markets you can open an account with IG today Alternatively you
can learn more about financial markets with IG Academy
Lesson 12 Confirmation Checklist = High Probability Trades
Technical Level EASYWAYLEARN ACADEMY
SAHALSOFTWARE ndash SAHAL UNIVERSITY
Eng Mohamed Jama
SupportResistance
Price Reversal Zone
Trend-Line
Pull Back
Technical Level EASYWAYLEARN ACADEMY
SAHALSOFTWARE ndash SAHAL UNIVERSITY
Eng Mohamed Jama
Technical Level EASYWAYLEARN ACADEMY
SAHALSOFTWARE ndash SAHAL UNIVERSITY
Eng Mohamed Jama
Technical Level EASYWAYLEARN ACADEMY
SAHALSOFTWARE ndash SAHAL UNIVERSITY
Eng Mohamed Jama
Technical Level EASYWAYLEARN ACADEMY
SAHALSOFTWARE ndash SAHAL UNIVERSITY
Eng Mohamed Jama
END
Technical Level EASYWAYLEARN ACADEMY
SAHALSOFTWARE ndash SAHAL UNIVERSITY
Eng Mohamed Jama

Technical Level EASYWAYLEARN ACADEMY
SAHALSOFTWARE ndash SAHAL UNIVERSITY
Eng Mohamed Jama
Technical Level EASYWAYLEARN ACADEMY
SAHALSOFTWARE ndash SAHAL UNIVERSITY
Eng Mohamed Jama
Lesson 10 Trend-Lines ndash Uptrend amp Downtrend
- Uptrend -gt HLHHHLHHHL ndash Swing High ndash Swing low
- Downtrend -gt HLLHLLLHLL ndash Swing low - Swing High
- Ranging Market ndash BOX
- Impulse or Run Pull Back or Correction or Retracement
Technical Level EASYWAYLEARN ACADEMY
SAHALSOFTWARE ndash SAHAL UNIVERSITY
Eng Mohamed Jama
Technical Level EASYWAYLEARN ACADEMY
SAHALSOFTWARE ndash SAHAL UNIVERSITY
Eng Mohamed Jama
Technical Level EASYWAYLEARN ACADEMY
SAHALSOFTWARE ndash SAHAL UNIVERSITY
Eng Mohamed Jama
Technical Level EASYWAYLEARN ACADEMY
SAHALSOFTWARE ndash SAHAL UNIVERSITY
Eng Mohamed Jama
Technical Level EASYWAYLEARN ACADEMY
SAHALSOFTWARE ndash SAHAL UNIVERSITY
Eng Mohamed Jama
Technical Level EASYWAYLEARN ACADEMY
SAHALSOFTWARE ndash SAHAL UNIVERSITY
Eng Mohamed Jama
Break and Retest Strategy
Waiting for a Retest Will Make You a Better Forex Trader
Technical Level EASYWAYLEARN ACADEMY
SAHALSOFTWARE ndash SAHAL UNIVERSITY
Eng Mohamed Jama
Technical Level EASYWAYLEARN ACADEMY
SAHALSOFTWARE ndash SAHAL UNIVERSITY
Eng Mohamed Jama
Lesson 11 Indicators (Leading and Lagging)
+ RSI Indicator
Leading and lagging indicators what you need to know
Technical traders use indicators to identify market patterns and
trends Most of these indicators fall into two categories leading
and lagging Discover some popular leading and lagging
indicators and how to use them
Technical Level EASYWAYLEARN ACADEMY
SAHALSOFTWARE ndash SAHAL UNIVERSITY
Eng Mohamed Jama
What is a leading technical indicator
A leading indicator is a tool designed to anticipate the future direction
of a market in order to enable traders to predict market movements
ahead of time
Technical Level EASYWAYLEARN ACADEMY
SAHALSOFTWARE ndash SAHAL UNIVERSITY
Eng Mohamed Jama
In theory if a leading indicator gives the correct signal a trader can
get in before the market movement and ride the entire trend However
leading indicators are by no means 100 accurate which is why they
are often combined with other forms of technical analysis
What is a lagging technical indicator
A lagging indicator is a tool that provides delayed feedback which
means it gives a signal once the price movement has already passed
Technical Level EASYWAYLEARN ACADEMY
SAHALSOFTWARE ndash SAHAL UNIVERSITY
Eng Mohamed Jama
or is in progress These are used by traders to confirm the price trend
before they enter a trade
These indicators are commonly used by trend traders ndash they donrsquot
show any upcoming price moves but confirm that a trend is underway
This tends to give traders more confidence that they are correct in
their assumptions rather than providing a specific trigger for entering
the market
Technical Level EASYWAYLEARN ACADEMY
SAHALSOFTWARE ndash SAHAL UNIVERSITY
Eng Mohamed Jama
Leading vs lagging technical indicators
whatrsquos the difference
The most obvious difference is that leading indicators predict market
movements while lagging indicators confirm trends that are already
taking place Both leading and lagging indicators have their own
advantages and drawbacks so itrsquos crucial to familiarise yourself with
how each works and decide which fits in with your strategy
Leading indicators react to prices quickly which can be great for
short-term traders but makes them prone to giving out false signals ndash
these happen when a signal indicates itrsquos time to enter the market but
the trend promptly reverses Conversely lagging indicators are far
slower to react which means that traders would have more accuracy
but could be late in entering the market
Relying solely on either could have negative effects on a strategy
which is why many traders will aim to find a balance of the two
Technical Level EASYWAYLEARN ACADEMY
SAHALSOFTWARE ndash SAHAL UNIVERSITY
Eng Mohamed Jama
Four popular leading indicators
Popular leading indicators include
1 The relative strength index (RSI)
2 The stochastic oscillator
3 Williams R
4 On-balance volume (OBV)
A lot of popular leading indicators fall into the category of oscillators as
these can identify a possible trend reversal before it happens
However not all leading indicators will use the same calculations so
there is the possibility that different indicators will show different
signals
Relative strength index (RSI)
The relative strength index (RSI) is a momentum indicator which
traders can use to identify whether a market is overbought or
Technical Level EASYWAYLEARN ACADEMY
SAHALSOFTWARE ndash SAHAL UNIVERSITY
Eng Mohamed Jama
oversold When the RSI gives a signal it is believed that the market
will reverse ndash this provides a leading sign that a trader should enter or
exit a position
The RSI is an oscillator so it is shown on a scale from zero to 100 If
the RSI is above 70 the market would often be thought of as
overbought and appear as red on the chart (below) And if the
indicator falls below the 30 level the market is usually considered
oversold and will appear in green on the chart
Technical Level EASYWAYLEARN ACADEMY
SAHALSOFTWARE ndash SAHAL UNIVERSITY
Eng Mohamed Jama
As mentioned the danger with leading indicators is that they can
provide premature or false signals With the RSI it is possible that the
market will sustain overbought or oversold conditions for long periods
of time without reversing This makes it important to have suitable risk
management measures in place such as stops and limits
Stochastic oscillator
Another popular example of a leading indicator is the stochastic
oscillator which is used to compare recent closing prices to the
previous trading range
The stochastic is based on the idea that market momentum changes
direction much faster than volume or price so it can be used to predict
the direction of market movements If the oscillator reaches a reading
of 80 or over the market would be considered overbought while
anything under 20 would be thought of as oversold
Technical Level EASYWAYLEARN ACADEMY
SAHALSOFTWARE ndash SAHAL UNIVERSITY
Eng Mohamed Jama
The oscillator is shown as two lines on the chart the K (the black
line on the chart below) and the D (the red dotted line below) When
these two lines cross it is seen as a leading signal that a change in
market direction is approaching
During volatile market conditions the stochastic is prone to false
signals To prevent this impacting your trades you could use the
stochastic in conjunction with other indicators or use it as a filter for
Technical Level EASYWAYLEARN ACADEMY
SAHALSOFTWARE ndash SAHAL UNIVERSITY
Eng Mohamed Jama
your trades rather than a trigger This would mean entering the market
once the trend is confirmed as you would with a lagging indicator
Williams R
The Williams percent range more commonly known as the Williams
R is very similar to the stochastic oscillator The main difference
being that it works on a negative scale ndash so it ranges between zero
and -100 and uses -20 and -80 as the overbought and oversold
signals respectively
So on the below chart the green line below -80 indicates that the
price is likely to rise While the red line above -20 indicates the price is
likely to fall
Technical Level EASYWAYLEARN ACADEMY
SAHALSOFTWARE ndash SAHAL UNIVERSITY
Eng Mohamed Jama
The indicator is highly responsive meaning it might start to move to
highs or lows even if the actual market price does not follow suit As
the Williams R is leading these signals can be premature and less
reliable than other entry signals which is why some traders prefer to
use -10 and -90 as more extreme price signals
On-balance volume (OBV)
Technical Level EASYWAYLEARN ACADEMY
SAHALSOFTWARE ndash SAHAL UNIVERSITY
Eng Mohamed Jama
On-balance volume (OBV) is another leading momentum-based
indicator It looks at volume to enable traders to make predictions
about the market price ndash OBV is largely used in shares trading as
volume is well documented by stock exchanges
Traders who use OBV as a leading indicator will focus on increases or
decreases in volume without the equivalent change in price This is
believed to be an indication that the price will increase or decrease
imminently
As a leading indicator OBV is prone to giving false signals especially
as the indicator can be thrown off by huge spikes in volume around
announcements that surprise the market Although volume changes
this is not always indicative of a trend and can cause traders to open
positions prematurely
As with the other leading indicators the OBV is often used in
conjunction with lagging indicators and a thorough risk management
strategy
Technical Level EASYWAYLEARN ACADEMY
SAHALSOFTWARE ndash SAHAL UNIVERSITY
Eng Mohamed Jama
Three popular lagging indicators
Popular lagging indicators include
1 Moving averages
2 The MACD indicator
3 Bollinger bands
Lagging indicators are primarily used to filter out the noise from short-
term market movements and confirm long-term trends They are
usually drawn onto the price chart itself unlike leading indicators
which usually appear in separate windows
Moving averages
Moving averages (MAs) are categorized as a lagging indicator
because they are based on historical data
Buy and sell signals are generated when the price line crosses the MA
or when two MA lines cross each other However because the moving
average is calculated using previous price points the current market
price will be ahead of the MA
Technical Level EASYWAYLEARN ACADEMY
SAHALSOFTWARE ndash SAHAL UNIVERSITY
Eng Mohamed Jama
In the below 50-day MA example the moving average has crossed
the price from above indicating an upward reversal is imminent
However we can see that the MA is slower to pick up the bullish trend
when it does occur
Moving averages can be calculated over any timeframe depending on
the traderrsquos goals ndash but the longer the time frame the longer the lag
Technical Level EASYWAYLEARN ACADEMY
SAHALSOFTWARE ndash SAHAL UNIVERSITY
Eng Mohamed Jama
So a MA of 300 days would have a far longer delay than an MA of 50
days
It is possible for lagging indicators to give off false signals but it is less
likely as they are slower to react
MACD indicator
Moving averages can be used on their own or they can be the basis
of other technical indicators such as the moving average
convergence divergence (MACD) As it is based on MAs the MACD is
inherently a trend-following or lagging indicator However it has been
argued that different components of the MACD provide traders with
different opportunities
There are three components to the tool two moving averages and a
histogram The two moving averages (the signal line and the MACD
line) are invariably lagging indicators as they only provide signals
once the two lines have crossed each other by which time the trend is
already in motion
Technical Level EASYWAYLEARN ACADEMY
SAHALSOFTWARE ndash SAHAL UNIVERSITY
Eng Mohamed Jama
Source IG charts
But the MACD histogram is sometimes considered a leading indicator
as it is used to anticipate signal crossovers in between the two moving
averages The bars on the histogram represents the difference
between the two MAs ndash as the bars move further away from the
central zero line it means the MAs are moving further apart Once this
expansion is over a lsquohumprsquo appears on the histogram which is a sign
the MAs will tighten again and a crossover will occur
Technical Level EASYWAYLEARN ACADEMY
SAHALSOFTWARE ndash SAHAL UNIVERSITY
Eng Mohamed Jama
Although the histogram can be used to enter positions ahead of the
crossovers the moving averages inherently fall behind the market
price So in general it is a lagging indicator This means that there are
instances where the market price may reach a reversal point before
the signal has even been generated ndash which would be deemed a false
signal
Bollinger bands
The Bollinger band tool is a lagging indicator as it is based on a 20-
day simple moving average (SMA) and two outer lines These outer
bands represent the positive and negative standard deviations away
from the SMA and are used as a measure of volatility When levels of
volatility increase the bands will widen and as volatility decreases
they will contract
When the price reaches the outer bands of the Bollinger it often acts
as a trigger for the market to rebound back towards the central 20-
period moving average
Technical Level EASYWAYLEARN ACADEMY
SAHALSOFTWARE ndash SAHAL UNIVERSITY
Eng Mohamed Jama
Source IG charts
There are strategies that suggest the bands have leading indicator
properties but alone they do not give out leading trading signals
Bollinger bands can give no indication of exactly when the change in
volatility might take place or which direction the price will move in
They are merely a sign that a breakout could soon take place giving
bullish and bearish signals
Technical Level EASYWAYLEARN ACADEMY
SAHALSOFTWARE ndash SAHAL UNIVERSITY
Eng Mohamed Jama
This is why traders will often confirm the Bollinger band signals with
price action or use the indicator in conjunction with other lagging tools
or leading indicators such as the RSI
Leading and lagging technical indicators
summed up
A leading indicator is a tool designed to anticipate the future direction
of a market
A lagging indicator is a tool that gives signal once the price movement
has already started
Leading indicators react to prices quickly but this makes them prone to
giving out false signals
Lagging indicators can be more accurate but this is because they are
far slower to react
A lot of popular leading indicators fall into the category of oscillators
including the RSI stochastic oscillator Williams R and OBV
Lagging indicators are drawn onto the price chart itself and include
moving averages the MACD and Bollinger bands
Technical Level EASYWAYLEARN ACADEMY
SAHALSOFTWARE ndash SAHAL UNIVERSITY
Eng Mohamed Jama
Relying solely on either could have negative effects on a strategy
which is why many traders will aim to find a balance of the two
If you feel ready to start using lagging and leading indicators on live
markets you can open an account with IG today Alternatively you
can learn more about financial markets with IG Academy
Lesson 12 Confirmation Checklist = High Probability Trades
Technical Level EASYWAYLEARN ACADEMY
SAHALSOFTWARE ndash SAHAL UNIVERSITY
Eng Mohamed Jama
SupportResistance
Price Reversal Zone
Trend-Line
Pull Back
Technical Level EASYWAYLEARN ACADEMY
SAHALSOFTWARE ndash SAHAL UNIVERSITY
Eng Mohamed Jama
Technical Level EASYWAYLEARN ACADEMY
SAHALSOFTWARE ndash SAHAL UNIVERSITY
Eng Mohamed Jama
Technical Level EASYWAYLEARN ACADEMY
SAHALSOFTWARE ndash SAHAL UNIVERSITY
Eng Mohamed Jama
Technical Level EASYWAYLEARN ACADEMY
SAHALSOFTWARE ndash SAHAL UNIVERSITY
Eng Mohamed Jama
END
Technical Level EASYWAYLEARN ACADEMY
SAHALSOFTWARE ndash SAHAL UNIVERSITY
Eng Mohamed Jama

Technical Level EASYWAYLEARN ACADEMY
SAHALSOFTWARE ndash SAHAL UNIVERSITY
Eng Mohamed Jama
Technical Level EASYWAYLEARN ACADEMY
SAHALSOFTWARE ndash SAHAL UNIVERSITY
Eng Mohamed Jama
Technical Level EASYWAYLEARN ACADEMY
SAHALSOFTWARE ndash SAHAL UNIVERSITY
Eng Mohamed Jama
Technical Level EASYWAYLEARN ACADEMY
SAHALSOFTWARE ndash SAHAL UNIVERSITY
Eng Mohamed Jama
Technical Level EASYWAYLEARN ACADEMY
SAHALSOFTWARE ndash SAHAL UNIVERSITY
Eng Mohamed Jama
Technical Level EASYWAYLEARN ACADEMY
SAHALSOFTWARE ndash SAHAL UNIVERSITY
Eng Mohamed Jama
Break and Retest Strategy
Waiting for a Retest Will Make You a Better Forex Trader
Technical Level EASYWAYLEARN ACADEMY
SAHALSOFTWARE ndash SAHAL UNIVERSITY
Eng Mohamed Jama
Technical Level EASYWAYLEARN ACADEMY
SAHALSOFTWARE ndash SAHAL UNIVERSITY
Eng Mohamed Jama
Lesson 11 Indicators (Leading and Lagging)
+ RSI Indicator
Leading and lagging indicators what you need to know
Technical traders use indicators to identify market patterns and
trends Most of these indicators fall into two categories leading
and lagging Discover some popular leading and lagging
indicators and how to use them
Technical Level EASYWAYLEARN ACADEMY
SAHALSOFTWARE ndash SAHAL UNIVERSITY
Eng Mohamed Jama
What is a leading technical indicator
A leading indicator is a tool designed to anticipate the future direction
of a market in order to enable traders to predict market movements
ahead of time
Technical Level EASYWAYLEARN ACADEMY
SAHALSOFTWARE ndash SAHAL UNIVERSITY
Eng Mohamed Jama
In theory if a leading indicator gives the correct signal a trader can
get in before the market movement and ride the entire trend However
leading indicators are by no means 100 accurate which is why they
are often combined with other forms of technical analysis
What is a lagging technical indicator
A lagging indicator is a tool that provides delayed feedback which
means it gives a signal once the price movement has already passed
Technical Level EASYWAYLEARN ACADEMY
SAHALSOFTWARE ndash SAHAL UNIVERSITY
Eng Mohamed Jama
or is in progress These are used by traders to confirm the price trend
before they enter a trade
These indicators are commonly used by trend traders ndash they donrsquot
show any upcoming price moves but confirm that a trend is underway
This tends to give traders more confidence that they are correct in
their assumptions rather than providing a specific trigger for entering
the market
Technical Level EASYWAYLEARN ACADEMY
SAHALSOFTWARE ndash SAHAL UNIVERSITY
Eng Mohamed Jama
Leading vs lagging technical indicators
whatrsquos the difference
The most obvious difference is that leading indicators predict market
movements while lagging indicators confirm trends that are already
taking place Both leading and lagging indicators have their own
advantages and drawbacks so itrsquos crucial to familiarise yourself with
how each works and decide which fits in with your strategy
Leading indicators react to prices quickly which can be great for
short-term traders but makes them prone to giving out false signals ndash
these happen when a signal indicates itrsquos time to enter the market but
the trend promptly reverses Conversely lagging indicators are far
slower to react which means that traders would have more accuracy
but could be late in entering the market
Relying solely on either could have negative effects on a strategy
which is why many traders will aim to find a balance of the two
Technical Level EASYWAYLEARN ACADEMY
SAHALSOFTWARE ndash SAHAL UNIVERSITY
Eng Mohamed Jama
Four popular leading indicators
Popular leading indicators include
1 The relative strength index (RSI)
2 The stochastic oscillator
3 Williams R
4 On-balance volume (OBV)
A lot of popular leading indicators fall into the category of oscillators as
these can identify a possible trend reversal before it happens
However not all leading indicators will use the same calculations so
there is the possibility that different indicators will show different
signals
Relative strength index (RSI)
The relative strength index (RSI) is a momentum indicator which
traders can use to identify whether a market is overbought or
Technical Level EASYWAYLEARN ACADEMY
SAHALSOFTWARE ndash SAHAL UNIVERSITY
Eng Mohamed Jama
oversold When the RSI gives a signal it is believed that the market
will reverse ndash this provides a leading sign that a trader should enter or
exit a position
The RSI is an oscillator so it is shown on a scale from zero to 100 If
the RSI is above 70 the market would often be thought of as
overbought and appear as red on the chart (below) And if the
indicator falls below the 30 level the market is usually considered
oversold and will appear in green on the chart
Technical Level EASYWAYLEARN ACADEMY
SAHALSOFTWARE ndash SAHAL UNIVERSITY
Eng Mohamed Jama
As mentioned the danger with leading indicators is that they can
provide premature or false signals With the RSI it is possible that the
market will sustain overbought or oversold conditions for long periods
of time without reversing This makes it important to have suitable risk
management measures in place such as stops and limits
Stochastic oscillator
Another popular example of a leading indicator is the stochastic
oscillator which is used to compare recent closing prices to the
previous trading range
The stochastic is based on the idea that market momentum changes
direction much faster than volume or price so it can be used to predict
the direction of market movements If the oscillator reaches a reading
of 80 or over the market would be considered overbought while
anything under 20 would be thought of as oversold
Technical Level EASYWAYLEARN ACADEMY
SAHALSOFTWARE ndash SAHAL UNIVERSITY
Eng Mohamed Jama
The oscillator is shown as two lines on the chart the K (the black
line on the chart below) and the D (the red dotted line below) When
these two lines cross it is seen as a leading signal that a change in
market direction is approaching
During volatile market conditions the stochastic is prone to false
signals To prevent this impacting your trades you could use the
stochastic in conjunction with other indicators or use it as a filter for
Technical Level EASYWAYLEARN ACADEMY
SAHALSOFTWARE ndash SAHAL UNIVERSITY
Eng Mohamed Jama
your trades rather than a trigger This would mean entering the market
once the trend is confirmed as you would with a lagging indicator
Williams R
The Williams percent range more commonly known as the Williams
R is very similar to the stochastic oscillator The main difference
being that it works on a negative scale ndash so it ranges between zero
and -100 and uses -20 and -80 as the overbought and oversold
signals respectively
So on the below chart the green line below -80 indicates that the
price is likely to rise While the red line above -20 indicates the price is
likely to fall
Technical Level EASYWAYLEARN ACADEMY
SAHALSOFTWARE ndash SAHAL UNIVERSITY
Eng Mohamed Jama
The indicator is highly responsive meaning it might start to move to
highs or lows even if the actual market price does not follow suit As
the Williams R is leading these signals can be premature and less
reliable than other entry signals which is why some traders prefer to
use -10 and -90 as more extreme price signals
On-balance volume (OBV)
Technical Level EASYWAYLEARN ACADEMY
SAHALSOFTWARE ndash SAHAL UNIVERSITY
Eng Mohamed Jama
On-balance volume (OBV) is another leading momentum-based
indicator It looks at volume to enable traders to make predictions
about the market price ndash OBV is largely used in shares trading as
volume is well documented by stock exchanges
Traders who use OBV as a leading indicator will focus on increases or
decreases in volume without the equivalent change in price This is
believed to be an indication that the price will increase or decrease
imminently
As a leading indicator OBV is prone to giving false signals especially
as the indicator can be thrown off by huge spikes in volume around
announcements that surprise the market Although volume changes
this is not always indicative of a trend and can cause traders to open
positions prematurely
As with the other leading indicators the OBV is often used in
conjunction with lagging indicators and a thorough risk management
strategy
Technical Level EASYWAYLEARN ACADEMY
SAHALSOFTWARE ndash SAHAL UNIVERSITY
Eng Mohamed Jama
Three popular lagging indicators
Popular lagging indicators include
1 Moving averages
2 The MACD indicator
3 Bollinger bands
Lagging indicators are primarily used to filter out the noise from short-
term market movements and confirm long-term trends They are
usually drawn onto the price chart itself unlike leading indicators
which usually appear in separate windows
Moving averages
Moving averages (MAs) are categorized as a lagging indicator
because they are based on historical data
Buy and sell signals are generated when the price line crosses the MA
or when two MA lines cross each other However because the moving
average is calculated using previous price points the current market
price will be ahead of the MA
Technical Level EASYWAYLEARN ACADEMY
SAHALSOFTWARE ndash SAHAL UNIVERSITY
Eng Mohamed Jama
In the below 50-day MA example the moving average has crossed
the price from above indicating an upward reversal is imminent
However we can see that the MA is slower to pick up the bullish trend
when it does occur
Moving averages can be calculated over any timeframe depending on
the traderrsquos goals ndash but the longer the time frame the longer the lag
Technical Level EASYWAYLEARN ACADEMY
SAHALSOFTWARE ndash SAHAL UNIVERSITY
Eng Mohamed Jama
So a MA of 300 days would have a far longer delay than an MA of 50
days
It is possible for lagging indicators to give off false signals but it is less
likely as they are slower to react
MACD indicator
Moving averages can be used on their own or they can be the basis
of other technical indicators such as the moving average
convergence divergence (MACD) As it is based on MAs the MACD is
inherently a trend-following or lagging indicator However it has been
argued that different components of the MACD provide traders with
different opportunities
There are three components to the tool two moving averages and a
histogram The two moving averages (the signal line and the MACD
line) are invariably lagging indicators as they only provide signals
once the two lines have crossed each other by which time the trend is
already in motion
Technical Level EASYWAYLEARN ACADEMY
SAHALSOFTWARE ndash SAHAL UNIVERSITY
Eng Mohamed Jama
Source IG charts
But the MACD histogram is sometimes considered a leading indicator
as it is used to anticipate signal crossovers in between the two moving
averages The bars on the histogram represents the difference
between the two MAs ndash as the bars move further away from the
central zero line it means the MAs are moving further apart Once this
expansion is over a lsquohumprsquo appears on the histogram which is a sign
the MAs will tighten again and a crossover will occur
Technical Level EASYWAYLEARN ACADEMY
SAHALSOFTWARE ndash SAHAL UNIVERSITY
Eng Mohamed Jama
Although the histogram can be used to enter positions ahead of the
crossovers the moving averages inherently fall behind the market
price So in general it is a lagging indicator This means that there are
instances where the market price may reach a reversal point before
the signal has even been generated ndash which would be deemed a false
signal
Bollinger bands
The Bollinger band tool is a lagging indicator as it is based on a 20-
day simple moving average (SMA) and two outer lines These outer
bands represent the positive and negative standard deviations away
from the SMA and are used as a measure of volatility When levels of
volatility increase the bands will widen and as volatility decreases
they will contract
When the price reaches the outer bands of the Bollinger it often acts
as a trigger for the market to rebound back towards the central 20-
period moving average
Technical Level EASYWAYLEARN ACADEMY
SAHALSOFTWARE ndash SAHAL UNIVERSITY
Eng Mohamed Jama
Source IG charts
There are strategies that suggest the bands have leading indicator
properties but alone they do not give out leading trading signals
Bollinger bands can give no indication of exactly when the change in
volatility might take place or which direction the price will move in
They are merely a sign that a breakout could soon take place giving
bullish and bearish signals
Technical Level EASYWAYLEARN ACADEMY
SAHALSOFTWARE ndash SAHAL UNIVERSITY
Eng Mohamed Jama
This is why traders will often confirm the Bollinger band signals with
price action or use the indicator in conjunction with other lagging tools
or leading indicators such as the RSI
Leading and lagging technical indicators
summed up
A leading indicator is a tool designed to anticipate the future direction
of a market
A lagging indicator is a tool that gives signal once the price movement
has already started
Leading indicators react to prices quickly but this makes them prone to
giving out false signals
Lagging indicators can be more accurate but this is because they are
far slower to react
A lot of popular leading indicators fall into the category of oscillators
including the RSI stochastic oscillator Williams R and OBV
Lagging indicators are drawn onto the price chart itself and include
moving averages the MACD and Bollinger bands
Technical Level EASYWAYLEARN ACADEMY
SAHALSOFTWARE ndash SAHAL UNIVERSITY
Eng Mohamed Jama
Relying solely on either could have negative effects on a strategy
which is why many traders will aim to find a balance of the two
If you feel ready to start using lagging and leading indicators on live
markets you can open an account with IG today Alternatively you
can learn more about financial markets with IG Academy
Lesson 12 Confirmation Checklist = High Probability Trades
Technical Level EASYWAYLEARN ACADEMY
SAHALSOFTWARE ndash SAHAL UNIVERSITY
Eng Mohamed Jama
SupportResistance
Price Reversal Zone
Trend-Line
Pull Back
Technical Level EASYWAYLEARN ACADEMY
SAHALSOFTWARE ndash SAHAL UNIVERSITY
Eng Mohamed Jama
Technical Level EASYWAYLEARN ACADEMY
SAHALSOFTWARE ndash SAHAL UNIVERSITY
Eng Mohamed Jama
Technical Level EASYWAYLEARN ACADEMY
SAHALSOFTWARE ndash SAHAL UNIVERSITY
Eng Mohamed Jama
Technical Level EASYWAYLEARN ACADEMY
SAHALSOFTWARE ndash SAHAL UNIVERSITY
Eng Mohamed Jama
END
Technical Level EASYWAYLEARN ACADEMY
SAHALSOFTWARE ndash SAHAL UNIVERSITY
Eng Mohamed Jama

Technical Level EASYWAYLEARN ACADEMY
SAHALSOFTWARE ndash SAHAL UNIVERSITY
Eng Mohamed Jama
Technical Level EASYWAYLEARN ACADEMY
SAHALSOFTWARE ndash SAHAL UNIVERSITY
Eng Mohamed Jama
Technical Level EASYWAYLEARN ACADEMY
SAHALSOFTWARE ndash SAHAL UNIVERSITY
Eng Mohamed Jama
Technical Level EASYWAYLEARN ACADEMY
SAHALSOFTWARE ndash SAHAL UNIVERSITY
Eng Mohamed Jama
Technical Level EASYWAYLEARN ACADEMY
SAHALSOFTWARE ndash SAHAL UNIVERSITY
Eng Mohamed Jama
Break and Retest Strategy
Waiting for a Retest Will Make You a Better Forex Trader
Technical Level EASYWAYLEARN ACADEMY
SAHALSOFTWARE ndash SAHAL UNIVERSITY
Eng Mohamed Jama
Technical Level EASYWAYLEARN ACADEMY
SAHALSOFTWARE ndash SAHAL UNIVERSITY
Eng Mohamed Jama
Lesson 11 Indicators (Leading and Lagging)
+ RSI Indicator
Leading and lagging indicators what you need to know
Technical traders use indicators to identify market patterns and
trends Most of these indicators fall into two categories leading
and lagging Discover some popular leading and lagging
indicators and how to use them
Technical Level EASYWAYLEARN ACADEMY
SAHALSOFTWARE ndash SAHAL UNIVERSITY
Eng Mohamed Jama
What is a leading technical indicator
A leading indicator is a tool designed to anticipate the future direction
of a market in order to enable traders to predict market movements
ahead of time
Technical Level EASYWAYLEARN ACADEMY
SAHALSOFTWARE ndash SAHAL UNIVERSITY
Eng Mohamed Jama
In theory if a leading indicator gives the correct signal a trader can
get in before the market movement and ride the entire trend However
leading indicators are by no means 100 accurate which is why they
are often combined with other forms of technical analysis
What is a lagging technical indicator
A lagging indicator is a tool that provides delayed feedback which
means it gives a signal once the price movement has already passed
Technical Level EASYWAYLEARN ACADEMY
SAHALSOFTWARE ndash SAHAL UNIVERSITY
Eng Mohamed Jama
or is in progress These are used by traders to confirm the price trend
before they enter a trade
These indicators are commonly used by trend traders ndash they donrsquot
show any upcoming price moves but confirm that a trend is underway
This tends to give traders more confidence that they are correct in
their assumptions rather than providing a specific trigger for entering
the market
Technical Level EASYWAYLEARN ACADEMY
SAHALSOFTWARE ndash SAHAL UNIVERSITY
Eng Mohamed Jama
Leading vs lagging technical indicators
whatrsquos the difference
The most obvious difference is that leading indicators predict market
movements while lagging indicators confirm trends that are already
taking place Both leading and lagging indicators have their own
advantages and drawbacks so itrsquos crucial to familiarise yourself with
how each works and decide which fits in with your strategy
Leading indicators react to prices quickly which can be great for
short-term traders but makes them prone to giving out false signals ndash
these happen when a signal indicates itrsquos time to enter the market but
the trend promptly reverses Conversely lagging indicators are far
slower to react which means that traders would have more accuracy
but could be late in entering the market
Relying solely on either could have negative effects on a strategy
which is why many traders will aim to find a balance of the two
Technical Level EASYWAYLEARN ACADEMY
SAHALSOFTWARE ndash SAHAL UNIVERSITY
Eng Mohamed Jama
Four popular leading indicators
Popular leading indicators include
1 The relative strength index (RSI)
2 The stochastic oscillator
3 Williams R
4 On-balance volume (OBV)
A lot of popular leading indicators fall into the category of oscillators as
these can identify a possible trend reversal before it happens
However not all leading indicators will use the same calculations so
there is the possibility that different indicators will show different
signals
Relative strength index (RSI)
The relative strength index (RSI) is a momentum indicator which
traders can use to identify whether a market is overbought or
Technical Level EASYWAYLEARN ACADEMY
SAHALSOFTWARE ndash SAHAL UNIVERSITY
Eng Mohamed Jama
oversold When the RSI gives a signal it is believed that the market
will reverse ndash this provides a leading sign that a trader should enter or
exit a position
The RSI is an oscillator so it is shown on a scale from zero to 100 If
the RSI is above 70 the market would often be thought of as
overbought and appear as red on the chart (below) And if the
indicator falls below the 30 level the market is usually considered
oversold and will appear in green on the chart
Technical Level EASYWAYLEARN ACADEMY
SAHALSOFTWARE ndash SAHAL UNIVERSITY
Eng Mohamed Jama
As mentioned the danger with leading indicators is that they can
provide premature or false signals With the RSI it is possible that the
market will sustain overbought or oversold conditions for long periods
of time without reversing This makes it important to have suitable risk
management measures in place such as stops and limits
Stochastic oscillator
Another popular example of a leading indicator is the stochastic
oscillator which is used to compare recent closing prices to the
previous trading range
The stochastic is based on the idea that market momentum changes
direction much faster than volume or price so it can be used to predict
the direction of market movements If the oscillator reaches a reading
of 80 or over the market would be considered overbought while
anything under 20 would be thought of as oversold
Technical Level EASYWAYLEARN ACADEMY
SAHALSOFTWARE ndash SAHAL UNIVERSITY
Eng Mohamed Jama
The oscillator is shown as two lines on the chart the K (the black
line on the chart below) and the D (the red dotted line below) When
these two lines cross it is seen as a leading signal that a change in
market direction is approaching
During volatile market conditions the stochastic is prone to false
signals To prevent this impacting your trades you could use the
stochastic in conjunction with other indicators or use it as a filter for
Technical Level EASYWAYLEARN ACADEMY
SAHALSOFTWARE ndash SAHAL UNIVERSITY
Eng Mohamed Jama
your trades rather than a trigger This would mean entering the market
once the trend is confirmed as you would with a lagging indicator
Williams R
The Williams percent range more commonly known as the Williams
R is very similar to the stochastic oscillator The main difference
being that it works on a negative scale ndash so it ranges between zero
and -100 and uses -20 and -80 as the overbought and oversold
signals respectively
So on the below chart the green line below -80 indicates that the
price is likely to rise While the red line above -20 indicates the price is
likely to fall
Technical Level EASYWAYLEARN ACADEMY
SAHALSOFTWARE ndash SAHAL UNIVERSITY
Eng Mohamed Jama
The indicator is highly responsive meaning it might start to move to
highs or lows even if the actual market price does not follow suit As
the Williams R is leading these signals can be premature and less
reliable than other entry signals which is why some traders prefer to
use -10 and -90 as more extreme price signals
On-balance volume (OBV)
Technical Level EASYWAYLEARN ACADEMY
SAHALSOFTWARE ndash SAHAL UNIVERSITY
Eng Mohamed Jama
On-balance volume (OBV) is another leading momentum-based
indicator It looks at volume to enable traders to make predictions
about the market price ndash OBV is largely used in shares trading as
volume is well documented by stock exchanges
Traders who use OBV as a leading indicator will focus on increases or
decreases in volume without the equivalent change in price This is
believed to be an indication that the price will increase or decrease
imminently
As a leading indicator OBV is prone to giving false signals especially
as the indicator can be thrown off by huge spikes in volume around
announcements that surprise the market Although volume changes
this is not always indicative of a trend and can cause traders to open
positions prematurely
As with the other leading indicators the OBV is often used in
conjunction with lagging indicators and a thorough risk management
strategy
Technical Level EASYWAYLEARN ACADEMY
SAHALSOFTWARE ndash SAHAL UNIVERSITY
Eng Mohamed Jama
Three popular lagging indicators
Popular lagging indicators include
1 Moving averages
2 The MACD indicator
3 Bollinger bands
Lagging indicators are primarily used to filter out the noise from short-
term market movements and confirm long-term trends They are
usually drawn onto the price chart itself unlike leading indicators
which usually appear in separate windows
Moving averages
Moving averages (MAs) are categorized as a lagging indicator
because they are based on historical data
Buy and sell signals are generated when the price line crosses the MA
or when two MA lines cross each other However because the moving
average is calculated using previous price points the current market
price will be ahead of the MA
Technical Level EASYWAYLEARN ACADEMY
SAHALSOFTWARE ndash SAHAL UNIVERSITY
Eng Mohamed Jama
In the below 50-day MA example the moving average has crossed
the price from above indicating an upward reversal is imminent
However we can see that the MA is slower to pick up the bullish trend
when it does occur
Moving averages can be calculated over any timeframe depending on
the traderrsquos goals ndash but the longer the time frame the longer the lag
Technical Level EASYWAYLEARN ACADEMY
SAHALSOFTWARE ndash SAHAL UNIVERSITY
Eng Mohamed Jama
So a MA of 300 days would have a far longer delay than an MA of 50
days
It is possible for lagging indicators to give off false signals but it is less
likely as they are slower to react
MACD indicator
Moving averages can be used on their own or they can be the basis
of other technical indicators such as the moving average
convergence divergence (MACD) As it is based on MAs the MACD is
inherently a trend-following or lagging indicator However it has been
argued that different components of the MACD provide traders with
different opportunities
There are three components to the tool two moving averages and a
histogram The two moving averages (the signal line and the MACD
line) are invariably lagging indicators as they only provide signals
once the two lines have crossed each other by which time the trend is
already in motion
Technical Level EASYWAYLEARN ACADEMY
SAHALSOFTWARE ndash SAHAL UNIVERSITY
Eng Mohamed Jama
Source IG charts
But the MACD histogram is sometimes considered a leading indicator
as it is used to anticipate signal crossovers in between the two moving
averages The bars on the histogram represents the difference
between the two MAs ndash as the bars move further away from the
central zero line it means the MAs are moving further apart Once this
expansion is over a lsquohumprsquo appears on the histogram which is a sign
the MAs will tighten again and a crossover will occur
Technical Level EASYWAYLEARN ACADEMY
SAHALSOFTWARE ndash SAHAL UNIVERSITY
Eng Mohamed Jama
Although the histogram can be used to enter positions ahead of the
crossovers the moving averages inherently fall behind the market
price So in general it is a lagging indicator This means that there are
instances where the market price may reach a reversal point before
the signal has even been generated ndash which would be deemed a false
signal
Bollinger bands
The Bollinger band tool is a lagging indicator as it is based on a 20-
day simple moving average (SMA) and two outer lines These outer
bands represent the positive and negative standard deviations away
from the SMA and are used as a measure of volatility When levels of
volatility increase the bands will widen and as volatility decreases
they will contract
When the price reaches the outer bands of the Bollinger it often acts
as a trigger for the market to rebound back towards the central 20-
period moving average
Technical Level EASYWAYLEARN ACADEMY
SAHALSOFTWARE ndash SAHAL UNIVERSITY
Eng Mohamed Jama
Source IG charts
There are strategies that suggest the bands have leading indicator
properties but alone they do not give out leading trading signals
Bollinger bands can give no indication of exactly when the change in
volatility might take place or which direction the price will move in
They are merely a sign that a breakout could soon take place giving
bullish and bearish signals
Technical Level EASYWAYLEARN ACADEMY
SAHALSOFTWARE ndash SAHAL UNIVERSITY
Eng Mohamed Jama
This is why traders will often confirm the Bollinger band signals with
price action or use the indicator in conjunction with other lagging tools
or leading indicators such as the RSI
Leading and lagging technical indicators
summed up
A leading indicator is a tool designed to anticipate the future direction
of a market
A lagging indicator is a tool that gives signal once the price movement
has already started
Leading indicators react to prices quickly but this makes them prone to
giving out false signals
Lagging indicators can be more accurate but this is because they are
far slower to react
A lot of popular leading indicators fall into the category of oscillators
including the RSI stochastic oscillator Williams R and OBV
Lagging indicators are drawn onto the price chart itself and include
moving averages the MACD and Bollinger bands
Technical Level EASYWAYLEARN ACADEMY
SAHALSOFTWARE ndash SAHAL UNIVERSITY
Eng Mohamed Jama
Relying solely on either could have negative effects on a strategy
which is why many traders will aim to find a balance of the two
If you feel ready to start using lagging and leading indicators on live
markets you can open an account with IG today Alternatively you
can learn more about financial markets with IG Academy
Lesson 12 Confirmation Checklist = High Probability Trades
Technical Level EASYWAYLEARN ACADEMY
SAHALSOFTWARE ndash SAHAL UNIVERSITY
Eng Mohamed Jama
SupportResistance
Price Reversal Zone
Trend-Line
Pull Back
Technical Level EASYWAYLEARN ACADEMY
SAHALSOFTWARE ndash SAHAL UNIVERSITY
Eng Mohamed Jama
Technical Level EASYWAYLEARN ACADEMY
SAHALSOFTWARE ndash SAHAL UNIVERSITY
Eng Mohamed Jama
Technical Level EASYWAYLEARN ACADEMY
SAHALSOFTWARE ndash SAHAL UNIVERSITY
Eng Mohamed Jama
Technical Level EASYWAYLEARN ACADEMY
SAHALSOFTWARE ndash SAHAL UNIVERSITY
Eng Mohamed Jama
END
Technical Level EASYWAYLEARN ACADEMY
SAHALSOFTWARE ndash SAHAL UNIVERSITY
Eng Mohamed Jama

Technical Level EASYWAYLEARN ACADEMY
SAHALSOFTWARE ndash SAHAL UNIVERSITY
Eng Mohamed Jama
Technical Level EASYWAYLEARN ACADEMY
SAHALSOFTWARE ndash SAHAL UNIVERSITY
Eng Mohamed Jama
Technical Level EASYWAYLEARN ACADEMY
SAHALSOFTWARE ndash SAHAL UNIVERSITY
Eng Mohamed Jama
Technical Level EASYWAYLEARN ACADEMY
SAHALSOFTWARE ndash SAHAL UNIVERSITY
Eng Mohamed Jama
Break and Retest Strategy
Waiting for a Retest Will Make You a Better Forex Trader
Technical Level EASYWAYLEARN ACADEMY
SAHALSOFTWARE ndash SAHAL UNIVERSITY
Eng Mohamed Jama
Technical Level EASYWAYLEARN ACADEMY
SAHALSOFTWARE ndash SAHAL UNIVERSITY
Eng Mohamed Jama
Lesson 11 Indicators (Leading and Lagging)
+ RSI Indicator
Leading and lagging indicators what you need to know
Technical traders use indicators to identify market patterns and
trends Most of these indicators fall into two categories leading
and lagging Discover some popular leading and lagging
indicators and how to use them
Technical Level EASYWAYLEARN ACADEMY
SAHALSOFTWARE ndash SAHAL UNIVERSITY
Eng Mohamed Jama
What is a leading technical indicator
A leading indicator is a tool designed to anticipate the future direction
of a market in order to enable traders to predict market movements
ahead of time
Technical Level EASYWAYLEARN ACADEMY
SAHALSOFTWARE ndash SAHAL UNIVERSITY
Eng Mohamed Jama
In theory if a leading indicator gives the correct signal a trader can
get in before the market movement and ride the entire trend However
leading indicators are by no means 100 accurate which is why they
are often combined with other forms of technical analysis
What is a lagging technical indicator
A lagging indicator is a tool that provides delayed feedback which
means it gives a signal once the price movement has already passed
Technical Level EASYWAYLEARN ACADEMY
SAHALSOFTWARE ndash SAHAL UNIVERSITY
Eng Mohamed Jama
or is in progress These are used by traders to confirm the price trend
before they enter a trade
These indicators are commonly used by trend traders ndash they donrsquot
show any upcoming price moves but confirm that a trend is underway
This tends to give traders more confidence that they are correct in
their assumptions rather than providing a specific trigger for entering
the market
Technical Level EASYWAYLEARN ACADEMY
SAHALSOFTWARE ndash SAHAL UNIVERSITY
Eng Mohamed Jama
Leading vs lagging technical indicators
whatrsquos the difference
The most obvious difference is that leading indicators predict market
movements while lagging indicators confirm trends that are already
taking place Both leading and lagging indicators have their own
advantages and drawbacks so itrsquos crucial to familiarise yourself with
how each works and decide which fits in with your strategy
Leading indicators react to prices quickly which can be great for
short-term traders but makes them prone to giving out false signals ndash
these happen when a signal indicates itrsquos time to enter the market but
the trend promptly reverses Conversely lagging indicators are far
slower to react which means that traders would have more accuracy
but could be late in entering the market
Relying solely on either could have negative effects on a strategy
which is why many traders will aim to find a balance of the two
Technical Level EASYWAYLEARN ACADEMY
SAHALSOFTWARE ndash SAHAL UNIVERSITY
Eng Mohamed Jama
Four popular leading indicators
Popular leading indicators include
1 The relative strength index (RSI)
2 The stochastic oscillator
3 Williams R
4 On-balance volume (OBV)
A lot of popular leading indicators fall into the category of oscillators as
these can identify a possible trend reversal before it happens
However not all leading indicators will use the same calculations so
there is the possibility that different indicators will show different
signals
Relative strength index (RSI)
The relative strength index (RSI) is a momentum indicator which
traders can use to identify whether a market is overbought or
Technical Level EASYWAYLEARN ACADEMY
SAHALSOFTWARE ndash SAHAL UNIVERSITY
Eng Mohamed Jama
oversold When the RSI gives a signal it is believed that the market
will reverse ndash this provides a leading sign that a trader should enter or
exit a position
The RSI is an oscillator so it is shown on a scale from zero to 100 If
the RSI is above 70 the market would often be thought of as
overbought and appear as red on the chart (below) And if the
indicator falls below the 30 level the market is usually considered
oversold and will appear in green on the chart
Technical Level EASYWAYLEARN ACADEMY
SAHALSOFTWARE ndash SAHAL UNIVERSITY
Eng Mohamed Jama
As mentioned the danger with leading indicators is that they can
provide premature or false signals With the RSI it is possible that the
market will sustain overbought or oversold conditions for long periods
of time without reversing This makes it important to have suitable risk
management measures in place such as stops and limits
Stochastic oscillator
Another popular example of a leading indicator is the stochastic
oscillator which is used to compare recent closing prices to the
previous trading range
The stochastic is based on the idea that market momentum changes
direction much faster than volume or price so it can be used to predict
the direction of market movements If the oscillator reaches a reading
of 80 or over the market would be considered overbought while
anything under 20 would be thought of as oversold
Technical Level EASYWAYLEARN ACADEMY
SAHALSOFTWARE ndash SAHAL UNIVERSITY
Eng Mohamed Jama
The oscillator is shown as two lines on the chart the K (the black
line on the chart below) and the D (the red dotted line below) When
these two lines cross it is seen as a leading signal that a change in
market direction is approaching
During volatile market conditions the stochastic is prone to false
signals To prevent this impacting your trades you could use the
stochastic in conjunction with other indicators or use it as a filter for
Technical Level EASYWAYLEARN ACADEMY
SAHALSOFTWARE ndash SAHAL UNIVERSITY
Eng Mohamed Jama
your trades rather than a trigger This would mean entering the market
once the trend is confirmed as you would with a lagging indicator
Williams R
The Williams percent range more commonly known as the Williams
R is very similar to the stochastic oscillator The main difference
being that it works on a negative scale ndash so it ranges between zero
and -100 and uses -20 and -80 as the overbought and oversold
signals respectively
So on the below chart the green line below -80 indicates that the
price is likely to rise While the red line above -20 indicates the price is
likely to fall
Technical Level EASYWAYLEARN ACADEMY
SAHALSOFTWARE ndash SAHAL UNIVERSITY
Eng Mohamed Jama
The indicator is highly responsive meaning it might start to move to
highs or lows even if the actual market price does not follow suit As
the Williams R is leading these signals can be premature and less
reliable than other entry signals which is why some traders prefer to
use -10 and -90 as more extreme price signals
On-balance volume (OBV)
Technical Level EASYWAYLEARN ACADEMY
SAHALSOFTWARE ndash SAHAL UNIVERSITY
Eng Mohamed Jama
On-balance volume (OBV) is another leading momentum-based
indicator It looks at volume to enable traders to make predictions
about the market price ndash OBV is largely used in shares trading as
volume is well documented by stock exchanges
Traders who use OBV as a leading indicator will focus on increases or
decreases in volume without the equivalent change in price This is
believed to be an indication that the price will increase or decrease
imminently
As a leading indicator OBV is prone to giving false signals especially
as the indicator can be thrown off by huge spikes in volume around
announcements that surprise the market Although volume changes
this is not always indicative of a trend and can cause traders to open
positions prematurely
As with the other leading indicators the OBV is often used in
conjunction with lagging indicators and a thorough risk management
strategy
Technical Level EASYWAYLEARN ACADEMY
SAHALSOFTWARE ndash SAHAL UNIVERSITY
Eng Mohamed Jama
Three popular lagging indicators
Popular lagging indicators include
1 Moving averages
2 The MACD indicator
3 Bollinger bands
Lagging indicators are primarily used to filter out the noise from short-
term market movements and confirm long-term trends They are
usually drawn onto the price chart itself unlike leading indicators
which usually appear in separate windows
Moving averages
Moving averages (MAs) are categorized as a lagging indicator
because they are based on historical data
Buy and sell signals are generated when the price line crosses the MA
or when two MA lines cross each other However because the moving
average is calculated using previous price points the current market
price will be ahead of the MA
Technical Level EASYWAYLEARN ACADEMY
SAHALSOFTWARE ndash SAHAL UNIVERSITY
Eng Mohamed Jama
In the below 50-day MA example the moving average has crossed
the price from above indicating an upward reversal is imminent
However we can see that the MA is slower to pick up the bullish trend
when it does occur
Moving averages can be calculated over any timeframe depending on
the traderrsquos goals ndash but the longer the time frame the longer the lag
Technical Level EASYWAYLEARN ACADEMY
SAHALSOFTWARE ndash SAHAL UNIVERSITY
Eng Mohamed Jama
So a MA of 300 days would have a far longer delay than an MA of 50
days
It is possible for lagging indicators to give off false signals but it is less
likely as they are slower to react
MACD indicator
Moving averages can be used on their own or they can be the basis
of other technical indicators such as the moving average
convergence divergence (MACD) As it is based on MAs the MACD is
inherently a trend-following or lagging indicator However it has been
argued that different components of the MACD provide traders with
different opportunities
There are three components to the tool two moving averages and a
histogram The two moving averages (the signal line and the MACD
line) are invariably lagging indicators as they only provide signals
once the two lines have crossed each other by which time the trend is
already in motion
Technical Level EASYWAYLEARN ACADEMY
SAHALSOFTWARE ndash SAHAL UNIVERSITY
Eng Mohamed Jama
Source IG charts
But the MACD histogram is sometimes considered a leading indicator
as it is used to anticipate signal crossovers in between the two moving
averages The bars on the histogram represents the difference
between the two MAs ndash as the bars move further away from the
central zero line it means the MAs are moving further apart Once this
expansion is over a lsquohumprsquo appears on the histogram which is a sign
the MAs will tighten again and a crossover will occur
Technical Level EASYWAYLEARN ACADEMY
SAHALSOFTWARE ndash SAHAL UNIVERSITY
Eng Mohamed Jama
Although the histogram can be used to enter positions ahead of the
crossovers the moving averages inherently fall behind the market
price So in general it is a lagging indicator This means that there are
instances where the market price may reach a reversal point before
the signal has even been generated ndash which would be deemed a false
signal
Bollinger bands
The Bollinger band tool is a lagging indicator as it is based on a 20-
day simple moving average (SMA) and two outer lines These outer
bands represent the positive and negative standard deviations away
from the SMA and are used as a measure of volatility When levels of
volatility increase the bands will widen and as volatility decreases
they will contract
When the price reaches the outer bands of the Bollinger it often acts
as a trigger for the market to rebound back towards the central 20-
period moving average
Technical Level EASYWAYLEARN ACADEMY
SAHALSOFTWARE ndash SAHAL UNIVERSITY
Eng Mohamed Jama
Source IG charts
There are strategies that suggest the bands have leading indicator
properties but alone they do not give out leading trading signals
Bollinger bands can give no indication of exactly when the change in
volatility might take place or which direction the price will move in
They are merely a sign that a breakout could soon take place giving
bullish and bearish signals
Technical Level EASYWAYLEARN ACADEMY
SAHALSOFTWARE ndash SAHAL UNIVERSITY
Eng Mohamed Jama
This is why traders will often confirm the Bollinger band signals with
price action or use the indicator in conjunction with other lagging tools
or leading indicators such as the RSI
Leading and lagging technical indicators
summed up
A leading indicator is a tool designed to anticipate the future direction
of a market
A lagging indicator is a tool that gives signal once the price movement
has already started
Leading indicators react to prices quickly but this makes them prone to
giving out false signals
Lagging indicators can be more accurate but this is because they are
far slower to react
A lot of popular leading indicators fall into the category of oscillators
including the RSI stochastic oscillator Williams R and OBV
Lagging indicators are drawn onto the price chart itself and include
moving averages the MACD and Bollinger bands
Technical Level EASYWAYLEARN ACADEMY
SAHALSOFTWARE ndash SAHAL UNIVERSITY
Eng Mohamed Jama
Relying solely on either could have negative effects on a strategy
which is why many traders will aim to find a balance of the two
If you feel ready to start using lagging and leading indicators on live
markets you can open an account with IG today Alternatively you
can learn more about financial markets with IG Academy
Lesson 12 Confirmation Checklist = High Probability Trades
Technical Level EASYWAYLEARN ACADEMY
SAHALSOFTWARE ndash SAHAL UNIVERSITY
Eng Mohamed Jama
SupportResistance
Price Reversal Zone
Trend-Line
Pull Back
Technical Level EASYWAYLEARN ACADEMY
SAHALSOFTWARE ndash SAHAL UNIVERSITY
Eng Mohamed Jama
Technical Level EASYWAYLEARN ACADEMY
SAHALSOFTWARE ndash SAHAL UNIVERSITY
Eng Mohamed Jama
Technical Level EASYWAYLEARN ACADEMY
SAHALSOFTWARE ndash SAHAL UNIVERSITY
Eng Mohamed Jama
Technical Level EASYWAYLEARN ACADEMY
SAHALSOFTWARE ndash SAHAL UNIVERSITY
Eng Mohamed Jama
END
Technical Level EASYWAYLEARN ACADEMY
SAHALSOFTWARE ndash SAHAL UNIVERSITY
Eng Mohamed Jama

Technical Level EASYWAYLEARN ACADEMY
SAHALSOFTWARE ndash SAHAL UNIVERSITY
Eng Mohamed Jama
Technical Level EASYWAYLEARN ACADEMY
SAHALSOFTWARE ndash SAHAL UNIVERSITY
Eng Mohamed Jama
Technical Level EASYWAYLEARN ACADEMY
SAHALSOFTWARE ndash SAHAL UNIVERSITY
Eng Mohamed Jama
Break and Retest Strategy
Waiting for a Retest Will Make You a Better Forex Trader
Technical Level EASYWAYLEARN ACADEMY
SAHALSOFTWARE ndash SAHAL UNIVERSITY
Eng Mohamed Jama
Technical Level EASYWAYLEARN ACADEMY
SAHALSOFTWARE ndash SAHAL UNIVERSITY
Eng Mohamed Jama
Lesson 11 Indicators (Leading and Lagging)
+ RSI Indicator
Leading and lagging indicators what you need to know
Technical traders use indicators to identify market patterns and
trends Most of these indicators fall into two categories leading
and lagging Discover some popular leading and lagging
indicators and how to use them
Technical Level EASYWAYLEARN ACADEMY
SAHALSOFTWARE ndash SAHAL UNIVERSITY
Eng Mohamed Jama
What is a leading technical indicator
A leading indicator is a tool designed to anticipate the future direction
of a market in order to enable traders to predict market movements
ahead of time
Technical Level EASYWAYLEARN ACADEMY
SAHALSOFTWARE ndash SAHAL UNIVERSITY
Eng Mohamed Jama
In theory if a leading indicator gives the correct signal a trader can
get in before the market movement and ride the entire trend However
leading indicators are by no means 100 accurate which is why they
are often combined with other forms of technical analysis
What is a lagging technical indicator
A lagging indicator is a tool that provides delayed feedback which
means it gives a signal once the price movement has already passed
Technical Level EASYWAYLEARN ACADEMY
SAHALSOFTWARE ndash SAHAL UNIVERSITY
Eng Mohamed Jama
or is in progress These are used by traders to confirm the price trend
before they enter a trade
These indicators are commonly used by trend traders ndash they donrsquot
show any upcoming price moves but confirm that a trend is underway
This tends to give traders more confidence that they are correct in
their assumptions rather than providing a specific trigger for entering
the market
Technical Level EASYWAYLEARN ACADEMY
SAHALSOFTWARE ndash SAHAL UNIVERSITY
Eng Mohamed Jama
Leading vs lagging technical indicators
whatrsquos the difference
The most obvious difference is that leading indicators predict market
movements while lagging indicators confirm trends that are already
taking place Both leading and lagging indicators have their own
advantages and drawbacks so itrsquos crucial to familiarise yourself with
how each works and decide which fits in with your strategy
Leading indicators react to prices quickly which can be great for
short-term traders but makes them prone to giving out false signals ndash
these happen when a signal indicates itrsquos time to enter the market but
the trend promptly reverses Conversely lagging indicators are far
slower to react which means that traders would have more accuracy
but could be late in entering the market
Relying solely on either could have negative effects on a strategy
which is why many traders will aim to find a balance of the two
Technical Level EASYWAYLEARN ACADEMY
SAHALSOFTWARE ndash SAHAL UNIVERSITY
Eng Mohamed Jama
Four popular leading indicators
Popular leading indicators include
1 The relative strength index (RSI)
2 The stochastic oscillator
3 Williams R
4 On-balance volume (OBV)
A lot of popular leading indicators fall into the category of oscillators as
these can identify a possible trend reversal before it happens
However not all leading indicators will use the same calculations so
there is the possibility that different indicators will show different
signals
Relative strength index (RSI)
The relative strength index (RSI) is a momentum indicator which
traders can use to identify whether a market is overbought or
Technical Level EASYWAYLEARN ACADEMY
SAHALSOFTWARE ndash SAHAL UNIVERSITY
Eng Mohamed Jama
oversold When the RSI gives a signal it is believed that the market
will reverse ndash this provides a leading sign that a trader should enter or
exit a position
The RSI is an oscillator so it is shown on a scale from zero to 100 If
the RSI is above 70 the market would often be thought of as
overbought and appear as red on the chart (below) And if the
indicator falls below the 30 level the market is usually considered
oversold and will appear in green on the chart
Technical Level EASYWAYLEARN ACADEMY
SAHALSOFTWARE ndash SAHAL UNIVERSITY
Eng Mohamed Jama
As mentioned the danger with leading indicators is that they can
provide premature or false signals With the RSI it is possible that the
market will sustain overbought or oversold conditions for long periods
of time without reversing This makes it important to have suitable risk
management measures in place such as stops and limits
Stochastic oscillator
Another popular example of a leading indicator is the stochastic
oscillator which is used to compare recent closing prices to the
previous trading range
The stochastic is based on the idea that market momentum changes
direction much faster than volume or price so it can be used to predict
the direction of market movements If the oscillator reaches a reading
of 80 or over the market would be considered overbought while
anything under 20 would be thought of as oversold
Technical Level EASYWAYLEARN ACADEMY
SAHALSOFTWARE ndash SAHAL UNIVERSITY
Eng Mohamed Jama
The oscillator is shown as two lines on the chart the K (the black
line on the chart below) and the D (the red dotted line below) When
these two lines cross it is seen as a leading signal that a change in
market direction is approaching
During volatile market conditions the stochastic is prone to false
signals To prevent this impacting your trades you could use the
stochastic in conjunction with other indicators or use it as a filter for
Technical Level EASYWAYLEARN ACADEMY
SAHALSOFTWARE ndash SAHAL UNIVERSITY
Eng Mohamed Jama
your trades rather than a trigger This would mean entering the market
once the trend is confirmed as you would with a lagging indicator
Williams R
The Williams percent range more commonly known as the Williams
R is very similar to the stochastic oscillator The main difference
being that it works on a negative scale ndash so it ranges between zero
and -100 and uses -20 and -80 as the overbought and oversold
signals respectively
So on the below chart the green line below -80 indicates that the
price is likely to rise While the red line above -20 indicates the price is
likely to fall
Technical Level EASYWAYLEARN ACADEMY
SAHALSOFTWARE ndash SAHAL UNIVERSITY
Eng Mohamed Jama
The indicator is highly responsive meaning it might start to move to
highs or lows even if the actual market price does not follow suit As
the Williams R is leading these signals can be premature and less
reliable than other entry signals which is why some traders prefer to
use -10 and -90 as more extreme price signals
On-balance volume (OBV)
Technical Level EASYWAYLEARN ACADEMY
SAHALSOFTWARE ndash SAHAL UNIVERSITY
Eng Mohamed Jama
On-balance volume (OBV) is another leading momentum-based
indicator It looks at volume to enable traders to make predictions
about the market price ndash OBV is largely used in shares trading as
volume is well documented by stock exchanges
Traders who use OBV as a leading indicator will focus on increases or
decreases in volume without the equivalent change in price This is
believed to be an indication that the price will increase or decrease
imminently
As a leading indicator OBV is prone to giving false signals especially
as the indicator can be thrown off by huge spikes in volume around
announcements that surprise the market Although volume changes
this is not always indicative of a trend and can cause traders to open
positions prematurely
As with the other leading indicators the OBV is often used in
conjunction with lagging indicators and a thorough risk management
strategy
Technical Level EASYWAYLEARN ACADEMY
SAHALSOFTWARE ndash SAHAL UNIVERSITY
Eng Mohamed Jama
Three popular lagging indicators
Popular lagging indicators include
1 Moving averages
2 The MACD indicator
3 Bollinger bands
Lagging indicators are primarily used to filter out the noise from short-
term market movements and confirm long-term trends They are
usually drawn onto the price chart itself unlike leading indicators
which usually appear in separate windows
Moving averages
Moving averages (MAs) are categorized as a lagging indicator
because they are based on historical data
Buy and sell signals are generated when the price line crosses the MA
or when two MA lines cross each other However because the moving
average is calculated using previous price points the current market
price will be ahead of the MA
Technical Level EASYWAYLEARN ACADEMY
SAHALSOFTWARE ndash SAHAL UNIVERSITY
Eng Mohamed Jama
In the below 50-day MA example the moving average has crossed
the price from above indicating an upward reversal is imminent
However we can see that the MA is slower to pick up the bullish trend
when it does occur
Moving averages can be calculated over any timeframe depending on
the traderrsquos goals ndash but the longer the time frame the longer the lag
Technical Level EASYWAYLEARN ACADEMY
SAHALSOFTWARE ndash SAHAL UNIVERSITY
Eng Mohamed Jama
So a MA of 300 days would have a far longer delay than an MA of 50
days
It is possible for lagging indicators to give off false signals but it is less
likely as they are slower to react
MACD indicator
Moving averages can be used on their own or they can be the basis
of other technical indicators such as the moving average
convergence divergence (MACD) As it is based on MAs the MACD is
inherently a trend-following or lagging indicator However it has been
argued that different components of the MACD provide traders with
different opportunities
There are three components to the tool two moving averages and a
histogram The two moving averages (the signal line and the MACD
line) are invariably lagging indicators as they only provide signals
once the two lines have crossed each other by which time the trend is
already in motion
Technical Level EASYWAYLEARN ACADEMY
SAHALSOFTWARE ndash SAHAL UNIVERSITY
Eng Mohamed Jama
Source IG charts
But the MACD histogram is sometimes considered a leading indicator
as it is used to anticipate signal crossovers in between the two moving
averages The bars on the histogram represents the difference
between the two MAs ndash as the bars move further away from the
central zero line it means the MAs are moving further apart Once this
expansion is over a lsquohumprsquo appears on the histogram which is a sign
the MAs will tighten again and a crossover will occur
Technical Level EASYWAYLEARN ACADEMY
SAHALSOFTWARE ndash SAHAL UNIVERSITY
Eng Mohamed Jama
Although the histogram can be used to enter positions ahead of the
crossovers the moving averages inherently fall behind the market
price So in general it is a lagging indicator This means that there are
instances where the market price may reach a reversal point before
the signal has even been generated ndash which would be deemed a false
signal
Bollinger bands
The Bollinger band tool is a lagging indicator as it is based on a 20-
day simple moving average (SMA) and two outer lines These outer
bands represent the positive and negative standard deviations away
from the SMA and are used as a measure of volatility When levels of
volatility increase the bands will widen and as volatility decreases
they will contract
When the price reaches the outer bands of the Bollinger it often acts
as a trigger for the market to rebound back towards the central 20-
period moving average
Technical Level EASYWAYLEARN ACADEMY
SAHALSOFTWARE ndash SAHAL UNIVERSITY
Eng Mohamed Jama
Source IG charts
There are strategies that suggest the bands have leading indicator
properties but alone they do not give out leading trading signals
Bollinger bands can give no indication of exactly when the change in
volatility might take place or which direction the price will move in
They are merely a sign that a breakout could soon take place giving
bullish and bearish signals
Technical Level EASYWAYLEARN ACADEMY
SAHALSOFTWARE ndash SAHAL UNIVERSITY
Eng Mohamed Jama
This is why traders will often confirm the Bollinger band signals with
price action or use the indicator in conjunction with other lagging tools
or leading indicators such as the RSI
Leading and lagging technical indicators
summed up
A leading indicator is a tool designed to anticipate the future direction
of a market
A lagging indicator is a tool that gives signal once the price movement
has already started
Leading indicators react to prices quickly but this makes them prone to
giving out false signals
Lagging indicators can be more accurate but this is because they are
far slower to react
A lot of popular leading indicators fall into the category of oscillators
including the RSI stochastic oscillator Williams R and OBV
Lagging indicators are drawn onto the price chart itself and include
moving averages the MACD and Bollinger bands
Technical Level EASYWAYLEARN ACADEMY
SAHALSOFTWARE ndash SAHAL UNIVERSITY
Eng Mohamed Jama
Relying solely on either could have negative effects on a strategy
which is why many traders will aim to find a balance of the two
If you feel ready to start using lagging and leading indicators on live
markets you can open an account with IG today Alternatively you
can learn more about financial markets with IG Academy
Lesson 12 Confirmation Checklist = High Probability Trades
Technical Level EASYWAYLEARN ACADEMY
SAHALSOFTWARE ndash SAHAL UNIVERSITY
Eng Mohamed Jama
SupportResistance
Price Reversal Zone
Trend-Line
Pull Back
Technical Level EASYWAYLEARN ACADEMY
SAHALSOFTWARE ndash SAHAL UNIVERSITY
Eng Mohamed Jama
Technical Level EASYWAYLEARN ACADEMY
SAHALSOFTWARE ndash SAHAL UNIVERSITY
Eng Mohamed Jama
Technical Level EASYWAYLEARN ACADEMY
SAHALSOFTWARE ndash SAHAL UNIVERSITY
Eng Mohamed Jama
Technical Level EASYWAYLEARN ACADEMY
SAHALSOFTWARE ndash SAHAL UNIVERSITY
Eng Mohamed Jama
END
Technical Level EASYWAYLEARN ACADEMY
SAHALSOFTWARE ndash SAHAL UNIVERSITY
Eng Mohamed Jama

Technical Level EASYWAYLEARN ACADEMY
SAHALSOFTWARE ndash SAHAL UNIVERSITY
Eng Mohamed Jama
Technical Level EASYWAYLEARN ACADEMY
SAHALSOFTWARE ndash SAHAL UNIVERSITY
Eng Mohamed Jama
Break and Retest Strategy
Waiting for a Retest Will Make You a Better Forex Trader
Technical Level EASYWAYLEARN ACADEMY
SAHALSOFTWARE ndash SAHAL UNIVERSITY
Eng Mohamed Jama
Technical Level EASYWAYLEARN ACADEMY
SAHALSOFTWARE ndash SAHAL UNIVERSITY
Eng Mohamed Jama
Lesson 11 Indicators (Leading and Lagging)
+ RSI Indicator
Leading and lagging indicators what you need to know
Technical traders use indicators to identify market patterns and
trends Most of these indicators fall into two categories leading
and lagging Discover some popular leading and lagging
indicators and how to use them
Technical Level EASYWAYLEARN ACADEMY
SAHALSOFTWARE ndash SAHAL UNIVERSITY
Eng Mohamed Jama
What is a leading technical indicator
A leading indicator is a tool designed to anticipate the future direction
of a market in order to enable traders to predict market movements
ahead of time
Technical Level EASYWAYLEARN ACADEMY
SAHALSOFTWARE ndash SAHAL UNIVERSITY
Eng Mohamed Jama
In theory if a leading indicator gives the correct signal a trader can
get in before the market movement and ride the entire trend However
leading indicators are by no means 100 accurate which is why they
are often combined with other forms of technical analysis
What is a lagging technical indicator
A lagging indicator is a tool that provides delayed feedback which
means it gives a signal once the price movement has already passed
Technical Level EASYWAYLEARN ACADEMY
SAHALSOFTWARE ndash SAHAL UNIVERSITY
Eng Mohamed Jama
or is in progress These are used by traders to confirm the price trend
before they enter a trade
These indicators are commonly used by trend traders ndash they donrsquot
show any upcoming price moves but confirm that a trend is underway
This tends to give traders more confidence that they are correct in
their assumptions rather than providing a specific trigger for entering
the market
Technical Level EASYWAYLEARN ACADEMY
SAHALSOFTWARE ndash SAHAL UNIVERSITY
Eng Mohamed Jama
Leading vs lagging technical indicators
whatrsquos the difference
The most obvious difference is that leading indicators predict market
movements while lagging indicators confirm trends that are already
taking place Both leading and lagging indicators have their own
advantages and drawbacks so itrsquos crucial to familiarise yourself with
how each works and decide which fits in with your strategy
Leading indicators react to prices quickly which can be great for
short-term traders but makes them prone to giving out false signals ndash
these happen when a signal indicates itrsquos time to enter the market but
the trend promptly reverses Conversely lagging indicators are far
slower to react which means that traders would have more accuracy
but could be late in entering the market
Relying solely on either could have negative effects on a strategy
which is why many traders will aim to find a balance of the two
Technical Level EASYWAYLEARN ACADEMY
SAHALSOFTWARE ndash SAHAL UNIVERSITY
Eng Mohamed Jama
Four popular leading indicators
Popular leading indicators include
1 The relative strength index (RSI)
2 The stochastic oscillator
3 Williams R
4 On-balance volume (OBV)
A lot of popular leading indicators fall into the category of oscillators as
these can identify a possible trend reversal before it happens
However not all leading indicators will use the same calculations so
there is the possibility that different indicators will show different
signals
Relative strength index (RSI)
The relative strength index (RSI) is a momentum indicator which
traders can use to identify whether a market is overbought or
Technical Level EASYWAYLEARN ACADEMY
SAHALSOFTWARE ndash SAHAL UNIVERSITY
Eng Mohamed Jama
oversold When the RSI gives a signal it is believed that the market
will reverse ndash this provides a leading sign that a trader should enter or
exit a position
The RSI is an oscillator so it is shown on a scale from zero to 100 If
the RSI is above 70 the market would often be thought of as
overbought and appear as red on the chart (below) And if the
indicator falls below the 30 level the market is usually considered
oversold and will appear in green on the chart
Technical Level EASYWAYLEARN ACADEMY
SAHALSOFTWARE ndash SAHAL UNIVERSITY
Eng Mohamed Jama
As mentioned the danger with leading indicators is that they can
provide premature or false signals With the RSI it is possible that the
market will sustain overbought or oversold conditions for long periods
of time without reversing This makes it important to have suitable risk
management measures in place such as stops and limits
Stochastic oscillator
Another popular example of a leading indicator is the stochastic
oscillator which is used to compare recent closing prices to the
previous trading range
The stochastic is based on the idea that market momentum changes
direction much faster than volume or price so it can be used to predict
the direction of market movements If the oscillator reaches a reading
of 80 or over the market would be considered overbought while
anything under 20 would be thought of as oversold
Technical Level EASYWAYLEARN ACADEMY
SAHALSOFTWARE ndash SAHAL UNIVERSITY
Eng Mohamed Jama
The oscillator is shown as two lines on the chart the K (the black
line on the chart below) and the D (the red dotted line below) When
these two lines cross it is seen as a leading signal that a change in
market direction is approaching
During volatile market conditions the stochastic is prone to false
signals To prevent this impacting your trades you could use the
stochastic in conjunction with other indicators or use it as a filter for
Technical Level EASYWAYLEARN ACADEMY
SAHALSOFTWARE ndash SAHAL UNIVERSITY
Eng Mohamed Jama
your trades rather than a trigger This would mean entering the market
once the trend is confirmed as you would with a lagging indicator
Williams R
The Williams percent range more commonly known as the Williams
R is very similar to the stochastic oscillator The main difference
being that it works on a negative scale ndash so it ranges between zero
and -100 and uses -20 and -80 as the overbought and oversold
signals respectively
So on the below chart the green line below -80 indicates that the
price is likely to rise While the red line above -20 indicates the price is
likely to fall
Technical Level EASYWAYLEARN ACADEMY
SAHALSOFTWARE ndash SAHAL UNIVERSITY
Eng Mohamed Jama
The indicator is highly responsive meaning it might start to move to
highs or lows even if the actual market price does not follow suit As
the Williams R is leading these signals can be premature and less
reliable than other entry signals which is why some traders prefer to
use -10 and -90 as more extreme price signals
On-balance volume (OBV)
Technical Level EASYWAYLEARN ACADEMY
SAHALSOFTWARE ndash SAHAL UNIVERSITY
Eng Mohamed Jama
On-balance volume (OBV) is another leading momentum-based
indicator It looks at volume to enable traders to make predictions
about the market price ndash OBV is largely used in shares trading as
volume is well documented by stock exchanges
Traders who use OBV as a leading indicator will focus on increases or
decreases in volume without the equivalent change in price This is
believed to be an indication that the price will increase or decrease
imminently
As a leading indicator OBV is prone to giving false signals especially
as the indicator can be thrown off by huge spikes in volume around
announcements that surprise the market Although volume changes
this is not always indicative of a trend and can cause traders to open
positions prematurely
As with the other leading indicators the OBV is often used in
conjunction with lagging indicators and a thorough risk management
strategy
Technical Level EASYWAYLEARN ACADEMY
SAHALSOFTWARE ndash SAHAL UNIVERSITY
Eng Mohamed Jama
Three popular lagging indicators
Popular lagging indicators include
1 Moving averages
2 The MACD indicator
3 Bollinger bands
Lagging indicators are primarily used to filter out the noise from short-
term market movements and confirm long-term trends They are
usually drawn onto the price chart itself unlike leading indicators
which usually appear in separate windows
Moving averages
Moving averages (MAs) are categorized as a lagging indicator
because they are based on historical data
Buy and sell signals are generated when the price line crosses the MA
or when two MA lines cross each other However because the moving
average is calculated using previous price points the current market
price will be ahead of the MA
Technical Level EASYWAYLEARN ACADEMY
SAHALSOFTWARE ndash SAHAL UNIVERSITY
Eng Mohamed Jama
In the below 50-day MA example the moving average has crossed
the price from above indicating an upward reversal is imminent
However we can see that the MA is slower to pick up the bullish trend
when it does occur
Moving averages can be calculated over any timeframe depending on
the traderrsquos goals ndash but the longer the time frame the longer the lag
Technical Level EASYWAYLEARN ACADEMY
SAHALSOFTWARE ndash SAHAL UNIVERSITY
Eng Mohamed Jama
So a MA of 300 days would have a far longer delay than an MA of 50
days
It is possible for lagging indicators to give off false signals but it is less
likely as they are slower to react
MACD indicator
Moving averages can be used on their own or they can be the basis
of other technical indicators such as the moving average
convergence divergence (MACD) As it is based on MAs the MACD is
inherently a trend-following or lagging indicator However it has been
argued that different components of the MACD provide traders with
different opportunities
There are three components to the tool two moving averages and a
histogram The two moving averages (the signal line and the MACD
line) are invariably lagging indicators as they only provide signals
once the two lines have crossed each other by which time the trend is
already in motion
Technical Level EASYWAYLEARN ACADEMY
SAHALSOFTWARE ndash SAHAL UNIVERSITY
Eng Mohamed Jama
Source IG charts
But the MACD histogram is sometimes considered a leading indicator
as it is used to anticipate signal crossovers in between the two moving
averages The bars on the histogram represents the difference
between the two MAs ndash as the bars move further away from the
central zero line it means the MAs are moving further apart Once this
expansion is over a lsquohumprsquo appears on the histogram which is a sign
the MAs will tighten again and a crossover will occur
Technical Level EASYWAYLEARN ACADEMY
SAHALSOFTWARE ndash SAHAL UNIVERSITY
Eng Mohamed Jama
Although the histogram can be used to enter positions ahead of the
crossovers the moving averages inherently fall behind the market
price So in general it is a lagging indicator This means that there are
instances where the market price may reach a reversal point before
the signal has even been generated ndash which would be deemed a false
signal
Bollinger bands
The Bollinger band tool is a lagging indicator as it is based on a 20-
day simple moving average (SMA) and two outer lines These outer
bands represent the positive and negative standard deviations away
from the SMA and are used as a measure of volatility When levels of
volatility increase the bands will widen and as volatility decreases
they will contract
When the price reaches the outer bands of the Bollinger it often acts
as a trigger for the market to rebound back towards the central 20-
period moving average
Technical Level EASYWAYLEARN ACADEMY
SAHALSOFTWARE ndash SAHAL UNIVERSITY
Eng Mohamed Jama
Source IG charts
There are strategies that suggest the bands have leading indicator
properties but alone they do not give out leading trading signals
Bollinger bands can give no indication of exactly when the change in
volatility might take place or which direction the price will move in
They are merely a sign that a breakout could soon take place giving
bullish and bearish signals
Technical Level EASYWAYLEARN ACADEMY
SAHALSOFTWARE ndash SAHAL UNIVERSITY
Eng Mohamed Jama
This is why traders will often confirm the Bollinger band signals with
price action or use the indicator in conjunction with other lagging tools
or leading indicators such as the RSI
Leading and lagging technical indicators
summed up
A leading indicator is a tool designed to anticipate the future direction
of a market
A lagging indicator is a tool that gives signal once the price movement
has already started
Leading indicators react to prices quickly but this makes them prone to
giving out false signals
Lagging indicators can be more accurate but this is because they are
far slower to react
A lot of popular leading indicators fall into the category of oscillators
including the RSI stochastic oscillator Williams R and OBV
Lagging indicators are drawn onto the price chart itself and include
moving averages the MACD and Bollinger bands
Technical Level EASYWAYLEARN ACADEMY
SAHALSOFTWARE ndash SAHAL UNIVERSITY
Eng Mohamed Jama
Relying solely on either could have negative effects on a strategy
which is why many traders will aim to find a balance of the two
If you feel ready to start using lagging and leading indicators on live
markets you can open an account with IG today Alternatively you
can learn more about financial markets with IG Academy
Lesson 12 Confirmation Checklist = High Probability Trades
Technical Level EASYWAYLEARN ACADEMY
SAHALSOFTWARE ndash SAHAL UNIVERSITY
Eng Mohamed Jama
SupportResistance
Price Reversal Zone
Trend-Line
Pull Back
Technical Level EASYWAYLEARN ACADEMY
SAHALSOFTWARE ndash SAHAL UNIVERSITY
Eng Mohamed Jama
Technical Level EASYWAYLEARN ACADEMY
SAHALSOFTWARE ndash SAHAL UNIVERSITY
Eng Mohamed Jama
Technical Level EASYWAYLEARN ACADEMY
SAHALSOFTWARE ndash SAHAL UNIVERSITY
Eng Mohamed Jama
Technical Level EASYWAYLEARN ACADEMY
SAHALSOFTWARE ndash SAHAL UNIVERSITY
Eng Mohamed Jama
END
Technical Level EASYWAYLEARN ACADEMY
SAHALSOFTWARE ndash SAHAL UNIVERSITY
Eng Mohamed Jama
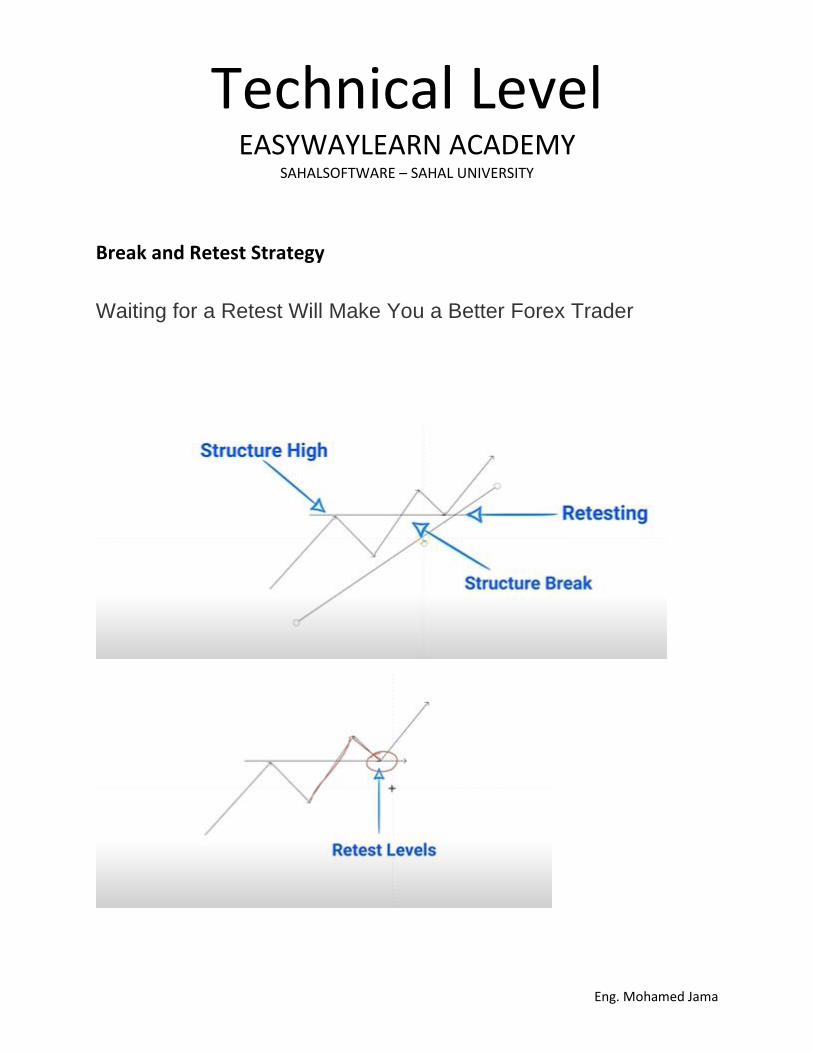
Technical Level EASYWAYLEARN ACADEMY
SAHALSOFTWARE ndash SAHAL UNIVERSITY
Eng Mohamed Jama
Technical Level EASYWAYLEARN ACADEMY
SAHALSOFTWARE ndash SAHAL UNIVERSITY
Eng Mohamed Jama
Lesson 11 Indicators (Leading and Lagging)
+ RSI Indicator
Leading and lagging indicators what you need to know
Technical traders use indicators to identify market patterns and
trends Most of these indicators fall into two categories leading
and lagging Discover some popular leading and lagging
indicators and how to use them
Technical Level EASYWAYLEARN ACADEMY
SAHALSOFTWARE ndash SAHAL UNIVERSITY
Eng Mohamed Jama
What is a leading technical indicator
A leading indicator is a tool designed to anticipate the future direction
of a market in order to enable traders to predict market movements
ahead of time
Technical Level EASYWAYLEARN ACADEMY
SAHALSOFTWARE ndash SAHAL UNIVERSITY
Eng Mohamed Jama
In theory if a leading indicator gives the correct signal a trader can
get in before the market movement and ride the entire trend However
leading indicators are by no means 100 accurate which is why they
are often combined with other forms of technical analysis
What is a lagging technical indicator
A lagging indicator is a tool that provides delayed feedback which
means it gives a signal once the price movement has already passed
Technical Level EASYWAYLEARN ACADEMY
SAHALSOFTWARE ndash SAHAL UNIVERSITY
Eng Mohamed Jama
or is in progress These are used by traders to confirm the price trend
before they enter a trade
These indicators are commonly used by trend traders ndash they donrsquot
show any upcoming price moves but confirm that a trend is underway
This tends to give traders more confidence that they are correct in
their assumptions rather than providing a specific trigger for entering
the market
Technical Level EASYWAYLEARN ACADEMY
SAHALSOFTWARE ndash SAHAL UNIVERSITY
Eng Mohamed Jama
Leading vs lagging technical indicators
whatrsquos the difference
The most obvious difference is that leading indicators predict market
movements while lagging indicators confirm trends that are already
taking place Both leading and lagging indicators have their own
advantages and drawbacks so itrsquos crucial to familiarise yourself with
how each works and decide which fits in with your strategy
Leading indicators react to prices quickly which can be great for
short-term traders but makes them prone to giving out false signals ndash
these happen when a signal indicates itrsquos time to enter the market but
the trend promptly reverses Conversely lagging indicators are far
slower to react which means that traders would have more accuracy
but could be late in entering the market
Relying solely on either could have negative effects on a strategy
which is why many traders will aim to find a balance of the two
Technical Level EASYWAYLEARN ACADEMY
SAHALSOFTWARE ndash SAHAL UNIVERSITY
Eng Mohamed Jama
Four popular leading indicators
Popular leading indicators include
1 The relative strength index (RSI)
2 The stochastic oscillator
3 Williams R
4 On-balance volume (OBV)
A lot of popular leading indicators fall into the category of oscillators as
these can identify a possible trend reversal before it happens
However not all leading indicators will use the same calculations so
there is the possibility that different indicators will show different
signals
Relative strength index (RSI)
The relative strength index (RSI) is a momentum indicator which
traders can use to identify whether a market is overbought or
Technical Level EASYWAYLEARN ACADEMY
SAHALSOFTWARE ndash SAHAL UNIVERSITY
Eng Mohamed Jama
oversold When the RSI gives a signal it is believed that the market
will reverse ndash this provides a leading sign that a trader should enter or
exit a position
The RSI is an oscillator so it is shown on a scale from zero to 100 If
the RSI is above 70 the market would often be thought of as
overbought and appear as red on the chart (below) And if the
indicator falls below the 30 level the market is usually considered
oversold and will appear in green on the chart
Technical Level EASYWAYLEARN ACADEMY
SAHALSOFTWARE ndash SAHAL UNIVERSITY
Eng Mohamed Jama
As mentioned the danger with leading indicators is that they can
provide premature or false signals With the RSI it is possible that the
market will sustain overbought or oversold conditions for long periods
of time without reversing This makes it important to have suitable risk
management measures in place such as stops and limits
Stochastic oscillator
Another popular example of a leading indicator is the stochastic
oscillator which is used to compare recent closing prices to the
previous trading range
The stochastic is based on the idea that market momentum changes
direction much faster than volume or price so it can be used to predict
the direction of market movements If the oscillator reaches a reading
of 80 or over the market would be considered overbought while
anything under 20 would be thought of as oversold
Technical Level EASYWAYLEARN ACADEMY
SAHALSOFTWARE ndash SAHAL UNIVERSITY
Eng Mohamed Jama
The oscillator is shown as two lines on the chart the K (the black
line on the chart below) and the D (the red dotted line below) When
these two lines cross it is seen as a leading signal that a change in
market direction is approaching
During volatile market conditions the stochastic is prone to false
signals To prevent this impacting your trades you could use the
stochastic in conjunction with other indicators or use it as a filter for
Technical Level EASYWAYLEARN ACADEMY
SAHALSOFTWARE ndash SAHAL UNIVERSITY
Eng Mohamed Jama
your trades rather than a trigger This would mean entering the market
once the trend is confirmed as you would with a lagging indicator
Williams R
The Williams percent range more commonly known as the Williams
R is very similar to the stochastic oscillator The main difference
being that it works on a negative scale ndash so it ranges between zero
and -100 and uses -20 and -80 as the overbought and oversold
signals respectively
So on the below chart the green line below -80 indicates that the
price is likely to rise While the red line above -20 indicates the price is
likely to fall
Technical Level EASYWAYLEARN ACADEMY
SAHALSOFTWARE ndash SAHAL UNIVERSITY
Eng Mohamed Jama
The indicator is highly responsive meaning it might start to move to
highs or lows even if the actual market price does not follow suit As
the Williams R is leading these signals can be premature and less
reliable than other entry signals which is why some traders prefer to
use -10 and -90 as more extreme price signals
On-balance volume (OBV)
Technical Level EASYWAYLEARN ACADEMY
SAHALSOFTWARE ndash SAHAL UNIVERSITY
Eng Mohamed Jama
On-balance volume (OBV) is another leading momentum-based
indicator It looks at volume to enable traders to make predictions
about the market price ndash OBV is largely used in shares trading as
volume is well documented by stock exchanges
Traders who use OBV as a leading indicator will focus on increases or
decreases in volume without the equivalent change in price This is
believed to be an indication that the price will increase or decrease
imminently
As a leading indicator OBV is prone to giving false signals especially
as the indicator can be thrown off by huge spikes in volume around
announcements that surprise the market Although volume changes
this is not always indicative of a trend and can cause traders to open
positions prematurely
As with the other leading indicators the OBV is often used in
conjunction with lagging indicators and a thorough risk management
strategy
Technical Level EASYWAYLEARN ACADEMY
SAHALSOFTWARE ndash SAHAL UNIVERSITY
Eng Mohamed Jama
Three popular lagging indicators
Popular lagging indicators include
1 Moving averages
2 The MACD indicator
3 Bollinger bands
Lagging indicators are primarily used to filter out the noise from short-
term market movements and confirm long-term trends They are
usually drawn onto the price chart itself unlike leading indicators
which usually appear in separate windows
Moving averages
Moving averages (MAs) are categorized as a lagging indicator
because they are based on historical data
Buy and sell signals are generated when the price line crosses the MA
or when two MA lines cross each other However because the moving
average is calculated using previous price points the current market
price will be ahead of the MA
Technical Level EASYWAYLEARN ACADEMY
SAHALSOFTWARE ndash SAHAL UNIVERSITY
Eng Mohamed Jama
In the below 50-day MA example the moving average has crossed
the price from above indicating an upward reversal is imminent
However we can see that the MA is slower to pick up the bullish trend
when it does occur
Moving averages can be calculated over any timeframe depending on
the traderrsquos goals ndash but the longer the time frame the longer the lag
Technical Level EASYWAYLEARN ACADEMY
SAHALSOFTWARE ndash SAHAL UNIVERSITY
Eng Mohamed Jama
So a MA of 300 days would have a far longer delay than an MA of 50
days
It is possible for lagging indicators to give off false signals but it is less
likely as they are slower to react
MACD indicator
Moving averages can be used on their own or they can be the basis
of other technical indicators such as the moving average
convergence divergence (MACD) As it is based on MAs the MACD is
inherently a trend-following or lagging indicator However it has been
argued that different components of the MACD provide traders with
different opportunities
There are three components to the tool two moving averages and a
histogram The two moving averages (the signal line and the MACD
line) are invariably lagging indicators as they only provide signals
once the two lines have crossed each other by which time the trend is
already in motion
Technical Level EASYWAYLEARN ACADEMY
SAHALSOFTWARE ndash SAHAL UNIVERSITY
Eng Mohamed Jama
Source IG charts
But the MACD histogram is sometimes considered a leading indicator
as it is used to anticipate signal crossovers in between the two moving
averages The bars on the histogram represents the difference
between the two MAs ndash as the bars move further away from the
central zero line it means the MAs are moving further apart Once this
expansion is over a lsquohumprsquo appears on the histogram which is a sign
the MAs will tighten again and a crossover will occur
Technical Level EASYWAYLEARN ACADEMY
SAHALSOFTWARE ndash SAHAL UNIVERSITY
Eng Mohamed Jama
Although the histogram can be used to enter positions ahead of the
crossovers the moving averages inherently fall behind the market
price So in general it is a lagging indicator This means that there are
instances where the market price may reach a reversal point before
the signal has even been generated ndash which would be deemed a false
signal
Bollinger bands
The Bollinger band tool is a lagging indicator as it is based on a 20-
day simple moving average (SMA) and two outer lines These outer
bands represent the positive and negative standard deviations away
from the SMA and are used as a measure of volatility When levels of
volatility increase the bands will widen and as volatility decreases
they will contract
When the price reaches the outer bands of the Bollinger it often acts
as a trigger for the market to rebound back towards the central 20-
period moving average
Technical Level EASYWAYLEARN ACADEMY
SAHALSOFTWARE ndash SAHAL UNIVERSITY
Eng Mohamed Jama
Source IG charts
There are strategies that suggest the bands have leading indicator
properties but alone they do not give out leading trading signals
Bollinger bands can give no indication of exactly when the change in
volatility might take place or which direction the price will move in
They are merely a sign that a breakout could soon take place giving
bullish and bearish signals
Technical Level EASYWAYLEARN ACADEMY
SAHALSOFTWARE ndash SAHAL UNIVERSITY
Eng Mohamed Jama
This is why traders will often confirm the Bollinger band signals with
price action or use the indicator in conjunction with other lagging tools
or leading indicators such as the RSI
Leading and lagging technical indicators
summed up
A leading indicator is a tool designed to anticipate the future direction
of a market
A lagging indicator is a tool that gives signal once the price movement
has already started
Leading indicators react to prices quickly but this makes them prone to
giving out false signals
Lagging indicators can be more accurate but this is because they are
far slower to react
A lot of popular leading indicators fall into the category of oscillators
including the RSI stochastic oscillator Williams R and OBV
Lagging indicators are drawn onto the price chart itself and include
moving averages the MACD and Bollinger bands
Technical Level EASYWAYLEARN ACADEMY
SAHALSOFTWARE ndash SAHAL UNIVERSITY
Eng Mohamed Jama
Relying solely on either could have negative effects on a strategy
which is why many traders will aim to find a balance of the two
If you feel ready to start using lagging and leading indicators on live
markets you can open an account with IG today Alternatively you
can learn more about financial markets with IG Academy
Lesson 12 Confirmation Checklist = High Probability Trades
Technical Level EASYWAYLEARN ACADEMY
SAHALSOFTWARE ndash SAHAL UNIVERSITY
Eng Mohamed Jama
SupportResistance
Price Reversal Zone
Trend-Line
Pull Back
Technical Level EASYWAYLEARN ACADEMY
SAHALSOFTWARE ndash SAHAL UNIVERSITY
Eng Mohamed Jama
Technical Level EASYWAYLEARN ACADEMY
SAHALSOFTWARE ndash SAHAL UNIVERSITY
Eng Mohamed Jama
Technical Level EASYWAYLEARN ACADEMY
SAHALSOFTWARE ndash SAHAL UNIVERSITY
Eng Mohamed Jama
Technical Level EASYWAYLEARN ACADEMY
SAHALSOFTWARE ndash SAHAL UNIVERSITY
Eng Mohamed Jama
END
Technical Level EASYWAYLEARN ACADEMY
SAHALSOFTWARE ndash SAHAL UNIVERSITY
Eng Mohamed Jama

Technical Level EASYWAYLEARN ACADEMY
SAHALSOFTWARE ndash SAHAL UNIVERSITY
Eng Mohamed Jama
What is a leading technical indicator
A leading indicator is a tool designed to anticipate the future direction
of a market in order to enable traders to predict market movements
ahead of time
Technical Level EASYWAYLEARN ACADEMY
SAHALSOFTWARE ndash SAHAL UNIVERSITY
Eng Mohamed Jama
In theory if a leading indicator gives the correct signal a trader can
get in before the market movement and ride the entire trend However
leading indicators are by no means 100 accurate which is why they
are often combined with other forms of technical analysis
What is a lagging technical indicator
A lagging indicator is a tool that provides delayed feedback which
means it gives a signal once the price movement has already passed
Technical Level EASYWAYLEARN ACADEMY
SAHALSOFTWARE ndash SAHAL UNIVERSITY
Eng Mohamed Jama
or is in progress These are used by traders to confirm the price trend
before they enter a trade
These indicators are commonly used by trend traders ndash they donrsquot
show any upcoming price moves but confirm that a trend is underway
This tends to give traders more confidence that they are correct in
their assumptions rather than providing a specific trigger for entering
the market
Technical Level EASYWAYLEARN ACADEMY
SAHALSOFTWARE ndash SAHAL UNIVERSITY
Eng Mohamed Jama
Leading vs lagging technical indicators
whatrsquos the difference
The most obvious difference is that leading indicators predict market
movements while lagging indicators confirm trends that are already
taking place Both leading and lagging indicators have their own
advantages and drawbacks so itrsquos crucial to familiarise yourself with
how each works and decide which fits in with your strategy
Leading indicators react to prices quickly which can be great for
short-term traders but makes them prone to giving out false signals ndash
these happen when a signal indicates itrsquos time to enter the market but
the trend promptly reverses Conversely lagging indicators are far
slower to react which means that traders would have more accuracy
but could be late in entering the market
Relying solely on either could have negative effects on a strategy
which is why many traders will aim to find a balance of the two
Technical Level EASYWAYLEARN ACADEMY
SAHALSOFTWARE ndash SAHAL UNIVERSITY
Eng Mohamed Jama
Four popular leading indicators
Popular leading indicators include
1 The relative strength index (RSI)
2 The stochastic oscillator
3 Williams R
4 On-balance volume (OBV)
A lot of popular leading indicators fall into the category of oscillators as
these can identify a possible trend reversal before it happens
However not all leading indicators will use the same calculations so
there is the possibility that different indicators will show different
signals
Relative strength index (RSI)
The relative strength index (RSI) is a momentum indicator which
traders can use to identify whether a market is overbought or
Technical Level EASYWAYLEARN ACADEMY
SAHALSOFTWARE ndash SAHAL UNIVERSITY
Eng Mohamed Jama
oversold When the RSI gives a signal it is believed that the market
will reverse ndash this provides a leading sign that a trader should enter or
exit a position
The RSI is an oscillator so it is shown on a scale from zero to 100 If
the RSI is above 70 the market would often be thought of as
overbought and appear as red on the chart (below) And if the
indicator falls below the 30 level the market is usually considered
oversold and will appear in green on the chart
Technical Level EASYWAYLEARN ACADEMY
SAHALSOFTWARE ndash SAHAL UNIVERSITY
Eng Mohamed Jama
As mentioned the danger with leading indicators is that they can
provide premature or false signals With the RSI it is possible that the
market will sustain overbought or oversold conditions for long periods
of time without reversing This makes it important to have suitable risk
management measures in place such as stops and limits
Stochastic oscillator
Another popular example of a leading indicator is the stochastic
oscillator which is used to compare recent closing prices to the
previous trading range
The stochastic is based on the idea that market momentum changes
direction much faster than volume or price so it can be used to predict
the direction of market movements If the oscillator reaches a reading
of 80 or over the market would be considered overbought while
anything under 20 would be thought of as oversold
Technical Level EASYWAYLEARN ACADEMY
SAHALSOFTWARE ndash SAHAL UNIVERSITY
Eng Mohamed Jama
The oscillator is shown as two lines on the chart the K (the black
line on the chart below) and the D (the red dotted line below) When
these two lines cross it is seen as a leading signal that a change in
market direction is approaching
During volatile market conditions the stochastic is prone to false
signals To prevent this impacting your trades you could use the
stochastic in conjunction with other indicators or use it as a filter for
Technical Level EASYWAYLEARN ACADEMY
SAHALSOFTWARE ndash SAHAL UNIVERSITY
Eng Mohamed Jama
your trades rather than a trigger This would mean entering the market
once the trend is confirmed as you would with a lagging indicator
Williams R
The Williams percent range more commonly known as the Williams
R is very similar to the stochastic oscillator The main difference
being that it works on a negative scale ndash so it ranges between zero
and -100 and uses -20 and -80 as the overbought and oversold
signals respectively
So on the below chart the green line below -80 indicates that the
price is likely to rise While the red line above -20 indicates the price is
likely to fall
Technical Level EASYWAYLEARN ACADEMY
SAHALSOFTWARE ndash SAHAL UNIVERSITY
Eng Mohamed Jama
The indicator is highly responsive meaning it might start to move to
highs or lows even if the actual market price does not follow suit As
the Williams R is leading these signals can be premature and less
reliable than other entry signals which is why some traders prefer to
use -10 and -90 as more extreme price signals
On-balance volume (OBV)
Technical Level EASYWAYLEARN ACADEMY
SAHALSOFTWARE ndash SAHAL UNIVERSITY
Eng Mohamed Jama
On-balance volume (OBV) is another leading momentum-based
indicator It looks at volume to enable traders to make predictions
about the market price ndash OBV is largely used in shares trading as
volume is well documented by stock exchanges
Traders who use OBV as a leading indicator will focus on increases or
decreases in volume without the equivalent change in price This is
believed to be an indication that the price will increase or decrease
imminently
As a leading indicator OBV is prone to giving false signals especially
as the indicator can be thrown off by huge spikes in volume around
announcements that surprise the market Although volume changes
this is not always indicative of a trend and can cause traders to open
positions prematurely
As with the other leading indicators the OBV is often used in
conjunction with lagging indicators and a thorough risk management
strategy
Technical Level EASYWAYLEARN ACADEMY
SAHALSOFTWARE ndash SAHAL UNIVERSITY
Eng Mohamed Jama
Three popular lagging indicators
Popular lagging indicators include
1 Moving averages
2 The MACD indicator
3 Bollinger bands
Lagging indicators are primarily used to filter out the noise from short-
term market movements and confirm long-term trends They are
usually drawn onto the price chart itself unlike leading indicators
which usually appear in separate windows
Moving averages
Moving averages (MAs) are categorized as a lagging indicator
because they are based on historical data
Buy and sell signals are generated when the price line crosses the MA
or when two MA lines cross each other However because the moving
average is calculated using previous price points the current market
price will be ahead of the MA
Technical Level EASYWAYLEARN ACADEMY
SAHALSOFTWARE ndash SAHAL UNIVERSITY
Eng Mohamed Jama
In the below 50-day MA example the moving average has crossed
the price from above indicating an upward reversal is imminent
However we can see that the MA is slower to pick up the bullish trend
when it does occur
Moving averages can be calculated over any timeframe depending on
the traderrsquos goals ndash but the longer the time frame the longer the lag
Technical Level EASYWAYLEARN ACADEMY
SAHALSOFTWARE ndash SAHAL UNIVERSITY
Eng Mohamed Jama
So a MA of 300 days would have a far longer delay than an MA of 50
days
It is possible for lagging indicators to give off false signals but it is less
likely as they are slower to react
MACD indicator
Moving averages can be used on their own or they can be the basis
of other technical indicators such as the moving average
convergence divergence (MACD) As it is based on MAs the MACD is
inherently a trend-following or lagging indicator However it has been
argued that different components of the MACD provide traders with
different opportunities
There are three components to the tool two moving averages and a
histogram The two moving averages (the signal line and the MACD
line) are invariably lagging indicators as they only provide signals
once the two lines have crossed each other by which time the trend is
already in motion
Technical Level EASYWAYLEARN ACADEMY
SAHALSOFTWARE ndash SAHAL UNIVERSITY
Eng Mohamed Jama
Source IG charts
But the MACD histogram is sometimes considered a leading indicator
as it is used to anticipate signal crossovers in between the two moving
averages The bars on the histogram represents the difference
between the two MAs ndash as the bars move further away from the
central zero line it means the MAs are moving further apart Once this
expansion is over a lsquohumprsquo appears on the histogram which is a sign
the MAs will tighten again and a crossover will occur
Technical Level EASYWAYLEARN ACADEMY
SAHALSOFTWARE ndash SAHAL UNIVERSITY
Eng Mohamed Jama
Although the histogram can be used to enter positions ahead of the
crossovers the moving averages inherently fall behind the market
price So in general it is a lagging indicator This means that there are
instances where the market price may reach a reversal point before
the signal has even been generated ndash which would be deemed a false
signal
Bollinger bands
The Bollinger band tool is a lagging indicator as it is based on a 20-
day simple moving average (SMA) and two outer lines These outer
bands represent the positive and negative standard deviations away
from the SMA and are used as a measure of volatility When levels of
volatility increase the bands will widen and as volatility decreases
they will contract
When the price reaches the outer bands of the Bollinger it often acts
as a trigger for the market to rebound back towards the central 20-
period moving average
Technical Level EASYWAYLEARN ACADEMY
SAHALSOFTWARE ndash SAHAL UNIVERSITY
Eng Mohamed Jama
Source IG charts
There are strategies that suggest the bands have leading indicator
properties but alone they do not give out leading trading signals
Bollinger bands can give no indication of exactly when the change in
volatility might take place or which direction the price will move in
They are merely a sign that a breakout could soon take place giving
bullish and bearish signals
Technical Level EASYWAYLEARN ACADEMY
SAHALSOFTWARE ndash SAHAL UNIVERSITY
Eng Mohamed Jama
This is why traders will often confirm the Bollinger band signals with
price action or use the indicator in conjunction with other lagging tools
or leading indicators such as the RSI
Leading and lagging technical indicators
summed up
A leading indicator is a tool designed to anticipate the future direction
of a market
A lagging indicator is a tool that gives signal once the price movement
has already started
Leading indicators react to prices quickly but this makes them prone to
giving out false signals
Lagging indicators can be more accurate but this is because they are
far slower to react
A lot of popular leading indicators fall into the category of oscillators
including the RSI stochastic oscillator Williams R and OBV
Lagging indicators are drawn onto the price chart itself and include
moving averages the MACD and Bollinger bands
Technical Level EASYWAYLEARN ACADEMY
SAHALSOFTWARE ndash SAHAL UNIVERSITY
Eng Mohamed Jama
Relying solely on either could have negative effects on a strategy
which is why many traders will aim to find a balance of the two
If you feel ready to start using lagging and leading indicators on live
markets you can open an account with IG today Alternatively you
can learn more about financial markets with IG Academy
Lesson 12 Confirmation Checklist = High Probability Trades
Technical Level EASYWAYLEARN ACADEMY
SAHALSOFTWARE ndash SAHAL UNIVERSITY
Eng Mohamed Jama
SupportResistance
Price Reversal Zone
Trend-Line
Pull Back
Technical Level EASYWAYLEARN ACADEMY
SAHALSOFTWARE ndash SAHAL UNIVERSITY
Eng Mohamed Jama
Technical Level EASYWAYLEARN ACADEMY
SAHALSOFTWARE ndash SAHAL UNIVERSITY
Eng Mohamed Jama
Technical Level EASYWAYLEARN ACADEMY
SAHALSOFTWARE ndash SAHAL UNIVERSITY
Eng Mohamed Jama
Technical Level EASYWAYLEARN ACADEMY
SAHALSOFTWARE ndash SAHAL UNIVERSITY
Eng Mohamed Jama
END
Technical Level EASYWAYLEARN ACADEMY
SAHALSOFTWARE ndash SAHAL UNIVERSITY
Eng Mohamed Jama
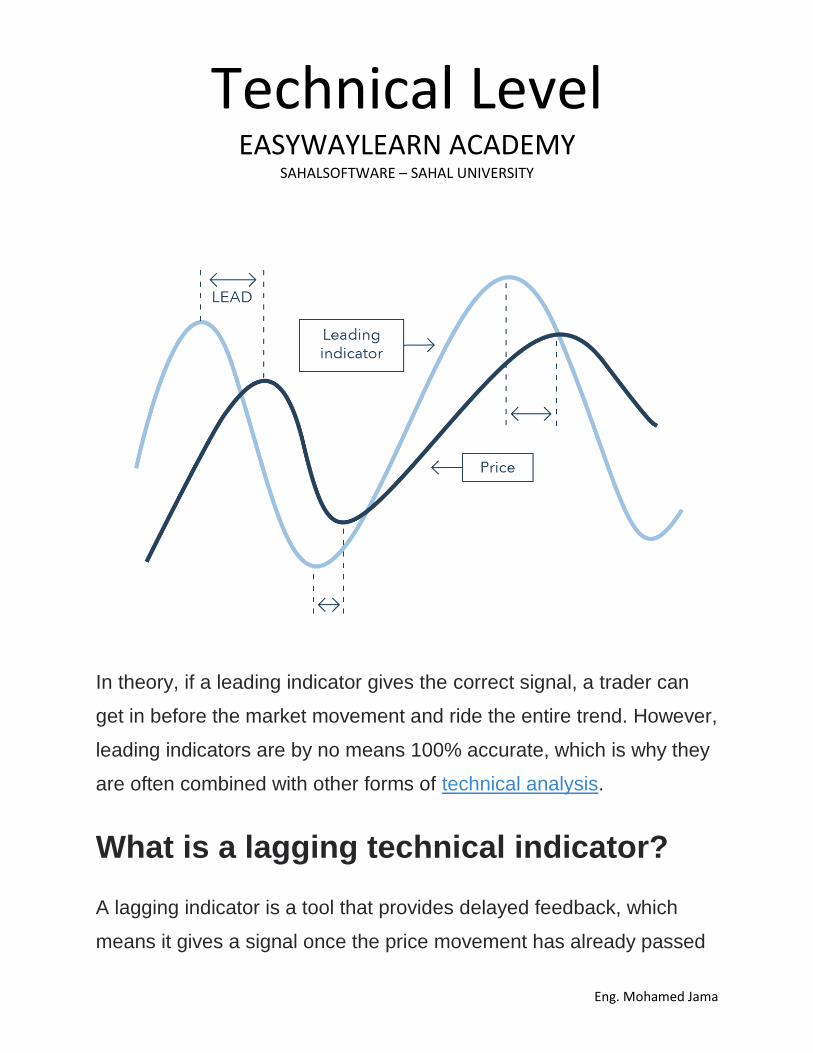
Technical Level EASYWAYLEARN ACADEMY
SAHALSOFTWARE ndash SAHAL UNIVERSITY
Eng Mohamed Jama
or is in progress These are used by traders to confirm the price trend
before they enter a trade
These indicators are commonly used by trend traders ndash they donrsquot
show any upcoming price moves but confirm that a trend is underway
This tends to give traders more confidence that they are correct in
their assumptions rather than providing a specific trigger for entering
the market
Technical Level EASYWAYLEARN ACADEMY
SAHALSOFTWARE ndash SAHAL UNIVERSITY
Eng Mohamed Jama
Leading vs lagging technical indicators
whatrsquos the difference
The most obvious difference is that leading indicators predict market
movements while lagging indicators confirm trends that are already
taking place Both leading and lagging indicators have their own
advantages and drawbacks so itrsquos crucial to familiarise yourself with
how each works and decide which fits in with your strategy
Leading indicators react to prices quickly which can be great for
short-term traders but makes them prone to giving out false signals ndash
these happen when a signal indicates itrsquos time to enter the market but
the trend promptly reverses Conversely lagging indicators are far
slower to react which means that traders would have more accuracy
but could be late in entering the market
Relying solely on either could have negative effects on a strategy
which is why many traders will aim to find a balance of the two
Technical Level EASYWAYLEARN ACADEMY
SAHALSOFTWARE ndash SAHAL UNIVERSITY
Eng Mohamed Jama
Four popular leading indicators
Popular leading indicators include
1 The relative strength index (RSI)
2 The stochastic oscillator
3 Williams R
4 On-balance volume (OBV)
A lot of popular leading indicators fall into the category of oscillators as
these can identify a possible trend reversal before it happens
However not all leading indicators will use the same calculations so
there is the possibility that different indicators will show different
signals
Relative strength index (RSI)
The relative strength index (RSI) is a momentum indicator which
traders can use to identify whether a market is overbought or
Technical Level EASYWAYLEARN ACADEMY
SAHALSOFTWARE ndash SAHAL UNIVERSITY
Eng Mohamed Jama
oversold When the RSI gives a signal it is believed that the market
will reverse ndash this provides a leading sign that a trader should enter or
exit a position
The RSI is an oscillator so it is shown on a scale from zero to 100 If
the RSI is above 70 the market would often be thought of as
overbought and appear as red on the chart (below) And if the
indicator falls below the 30 level the market is usually considered
oversold and will appear in green on the chart
Technical Level EASYWAYLEARN ACADEMY
SAHALSOFTWARE ndash SAHAL UNIVERSITY
Eng Mohamed Jama
As mentioned the danger with leading indicators is that they can
provide premature or false signals With the RSI it is possible that the
market will sustain overbought or oversold conditions for long periods
of time without reversing This makes it important to have suitable risk
management measures in place such as stops and limits
Stochastic oscillator
Another popular example of a leading indicator is the stochastic
oscillator which is used to compare recent closing prices to the
previous trading range
The stochastic is based on the idea that market momentum changes
direction much faster than volume or price so it can be used to predict
the direction of market movements If the oscillator reaches a reading
of 80 or over the market would be considered overbought while
anything under 20 would be thought of as oversold
Technical Level EASYWAYLEARN ACADEMY
SAHALSOFTWARE ndash SAHAL UNIVERSITY
Eng Mohamed Jama
The oscillator is shown as two lines on the chart the K (the black
line on the chart below) and the D (the red dotted line below) When
these two lines cross it is seen as a leading signal that a change in
market direction is approaching
During volatile market conditions the stochastic is prone to false
signals To prevent this impacting your trades you could use the
stochastic in conjunction with other indicators or use it as a filter for
Technical Level EASYWAYLEARN ACADEMY
SAHALSOFTWARE ndash SAHAL UNIVERSITY
Eng Mohamed Jama
your trades rather than a trigger This would mean entering the market
once the trend is confirmed as you would with a lagging indicator
Williams R
The Williams percent range more commonly known as the Williams
R is very similar to the stochastic oscillator The main difference
being that it works on a negative scale ndash so it ranges between zero
and -100 and uses -20 and -80 as the overbought and oversold
signals respectively
So on the below chart the green line below -80 indicates that the
price is likely to rise While the red line above -20 indicates the price is
likely to fall
Technical Level EASYWAYLEARN ACADEMY
SAHALSOFTWARE ndash SAHAL UNIVERSITY
Eng Mohamed Jama
The indicator is highly responsive meaning it might start to move to
highs or lows even if the actual market price does not follow suit As
the Williams R is leading these signals can be premature and less
reliable than other entry signals which is why some traders prefer to
use -10 and -90 as more extreme price signals
On-balance volume (OBV)
Technical Level EASYWAYLEARN ACADEMY
SAHALSOFTWARE ndash SAHAL UNIVERSITY
Eng Mohamed Jama
On-balance volume (OBV) is another leading momentum-based
indicator It looks at volume to enable traders to make predictions
about the market price ndash OBV is largely used in shares trading as
volume is well documented by stock exchanges
Traders who use OBV as a leading indicator will focus on increases or
decreases in volume without the equivalent change in price This is
believed to be an indication that the price will increase or decrease
imminently
As a leading indicator OBV is prone to giving false signals especially
as the indicator can be thrown off by huge spikes in volume around
announcements that surprise the market Although volume changes
this is not always indicative of a trend and can cause traders to open
positions prematurely
As with the other leading indicators the OBV is often used in
conjunction with lagging indicators and a thorough risk management
strategy
Technical Level EASYWAYLEARN ACADEMY
SAHALSOFTWARE ndash SAHAL UNIVERSITY
Eng Mohamed Jama
Three popular lagging indicators
Popular lagging indicators include
1 Moving averages
2 The MACD indicator
3 Bollinger bands
Lagging indicators are primarily used to filter out the noise from short-
term market movements and confirm long-term trends They are
usually drawn onto the price chart itself unlike leading indicators
which usually appear in separate windows
Moving averages
Moving averages (MAs) are categorized as a lagging indicator
because they are based on historical data
Buy and sell signals are generated when the price line crosses the MA
or when two MA lines cross each other However because the moving
average is calculated using previous price points the current market
price will be ahead of the MA
Technical Level EASYWAYLEARN ACADEMY
SAHALSOFTWARE ndash SAHAL UNIVERSITY
Eng Mohamed Jama
In the below 50-day MA example the moving average has crossed
the price from above indicating an upward reversal is imminent
However we can see that the MA is slower to pick up the bullish trend
when it does occur
Moving averages can be calculated over any timeframe depending on
the traderrsquos goals ndash but the longer the time frame the longer the lag
Technical Level EASYWAYLEARN ACADEMY
SAHALSOFTWARE ndash SAHAL UNIVERSITY
Eng Mohamed Jama
So a MA of 300 days would have a far longer delay than an MA of 50
days
It is possible for lagging indicators to give off false signals but it is less
likely as they are slower to react
MACD indicator
Moving averages can be used on their own or they can be the basis
of other technical indicators such as the moving average
convergence divergence (MACD) As it is based on MAs the MACD is
inherently a trend-following or lagging indicator However it has been
argued that different components of the MACD provide traders with
different opportunities
There are three components to the tool two moving averages and a
histogram The two moving averages (the signal line and the MACD
line) are invariably lagging indicators as they only provide signals
once the two lines have crossed each other by which time the trend is
already in motion
Technical Level EASYWAYLEARN ACADEMY
SAHALSOFTWARE ndash SAHAL UNIVERSITY
Eng Mohamed Jama
Source IG charts
But the MACD histogram is sometimes considered a leading indicator
as it is used to anticipate signal crossovers in between the two moving
averages The bars on the histogram represents the difference
between the two MAs ndash as the bars move further away from the
central zero line it means the MAs are moving further apart Once this
expansion is over a lsquohumprsquo appears on the histogram which is a sign
the MAs will tighten again and a crossover will occur
Technical Level EASYWAYLEARN ACADEMY
SAHALSOFTWARE ndash SAHAL UNIVERSITY
Eng Mohamed Jama
Although the histogram can be used to enter positions ahead of the
crossovers the moving averages inherently fall behind the market
price So in general it is a lagging indicator This means that there are
instances where the market price may reach a reversal point before
the signal has even been generated ndash which would be deemed a false
signal
Bollinger bands
The Bollinger band tool is a lagging indicator as it is based on a 20-
day simple moving average (SMA) and two outer lines These outer
bands represent the positive and negative standard deviations away
from the SMA and are used as a measure of volatility When levels of
volatility increase the bands will widen and as volatility decreases
they will contract
When the price reaches the outer bands of the Bollinger it often acts
as a trigger for the market to rebound back towards the central 20-
period moving average
Technical Level EASYWAYLEARN ACADEMY
SAHALSOFTWARE ndash SAHAL UNIVERSITY
Eng Mohamed Jama
Source IG charts
There are strategies that suggest the bands have leading indicator
properties but alone they do not give out leading trading signals
Bollinger bands can give no indication of exactly when the change in
volatility might take place or which direction the price will move in
They are merely a sign that a breakout could soon take place giving
bullish and bearish signals
Technical Level EASYWAYLEARN ACADEMY
SAHALSOFTWARE ndash SAHAL UNIVERSITY
Eng Mohamed Jama
This is why traders will often confirm the Bollinger band signals with
price action or use the indicator in conjunction with other lagging tools
or leading indicators such as the RSI
Leading and lagging technical indicators
summed up
A leading indicator is a tool designed to anticipate the future direction
of a market
A lagging indicator is a tool that gives signal once the price movement
has already started
Leading indicators react to prices quickly but this makes them prone to
giving out false signals
Lagging indicators can be more accurate but this is because they are
far slower to react
A lot of popular leading indicators fall into the category of oscillators
including the RSI stochastic oscillator Williams R and OBV
Lagging indicators are drawn onto the price chart itself and include
moving averages the MACD and Bollinger bands
Technical Level EASYWAYLEARN ACADEMY
SAHALSOFTWARE ndash SAHAL UNIVERSITY
Eng Mohamed Jama
Relying solely on either could have negative effects on a strategy
which is why many traders will aim to find a balance of the two
If you feel ready to start using lagging and leading indicators on live
markets you can open an account with IG today Alternatively you
can learn more about financial markets with IG Academy
Lesson 12 Confirmation Checklist = High Probability Trades
Technical Level EASYWAYLEARN ACADEMY
SAHALSOFTWARE ndash SAHAL UNIVERSITY
Eng Mohamed Jama
SupportResistance
Price Reversal Zone
Trend-Line
Pull Back
Technical Level EASYWAYLEARN ACADEMY
SAHALSOFTWARE ndash SAHAL UNIVERSITY
Eng Mohamed Jama
Technical Level EASYWAYLEARN ACADEMY
SAHALSOFTWARE ndash SAHAL UNIVERSITY
Eng Mohamed Jama
Technical Level EASYWAYLEARN ACADEMY
SAHALSOFTWARE ndash SAHAL UNIVERSITY
Eng Mohamed Jama
Technical Level EASYWAYLEARN ACADEMY
SAHALSOFTWARE ndash SAHAL UNIVERSITY
Eng Mohamed Jama
END
Technical Level EASYWAYLEARN ACADEMY
SAHALSOFTWARE ndash SAHAL UNIVERSITY
Eng Mohamed Jama
Technical Level EASYWAYLEARN ACADEMY
SAHALSOFTWARE ndash SAHAL UNIVERSITY
Eng Mohamed Jama
Leading vs lagging technical indicators
whatrsquos the difference
The most obvious difference is that leading indicators predict market
movements while lagging indicators confirm trends that are already
taking place Both leading and lagging indicators have their own
advantages and drawbacks so itrsquos crucial to familiarise yourself with
how each works and decide which fits in with your strategy
Leading indicators react to prices quickly which can be great for
short-term traders but makes them prone to giving out false signals ndash
these happen when a signal indicates itrsquos time to enter the market but
the trend promptly reverses Conversely lagging indicators are far
slower to react which means that traders would have more accuracy
but could be late in entering the market
Relying solely on either could have negative effects on a strategy
which is why many traders will aim to find a balance of the two
Technical Level EASYWAYLEARN ACADEMY
SAHALSOFTWARE ndash SAHAL UNIVERSITY
Eng Mohamed Jama
Four popular leading indicators
Popular leading indicators include
1 The relative strength index (RSI)
2 The stochastic oscillator
3 Williams R
4 On-balance volume (OBV)
A lot of popular leading indicators fall into the category of oscillators as
these can identify a possible trend reversal before it happens
However not all leading indicators will use the same calculations so
there is the possibility that different indicators will show different
signals
Relative strength index (RSI)
The relative strength index (RSI) is a momentum indicator which
traders can use to identify whether a market is overbought or
Technical Level EASYWAYLEARN ACADEMY
SAHALSOFTWARE ndash SAHAL UNIVERSITY
Eng Mohamed Jama
oversold When the RSI gives a signal it is believed that the market
will reverse ndash this provides a leading sign that a trader should enter or
exit a position
The RSI is an oscillator so it is shown on a scale from zero to 100 If
the RSI is above 70 the market would often be thought of as
overbought and appear as red on the chart (below) And if the
indicator falls below the 30 level the market is usually considered
oversold and will appear in green on the chart
Technical Level EASYWAYLEARN ACADEMY
SAHALSOFTWARE ndash SAHAL UNIVERSITY
Eng Mohamed Jama
As mentioned the danger with leading indicators is that they can
provide premature or false signals With the RSI it is possible that the
market will sustain overbought or oversold conditions for long periods
of time without reversing This makes it important to have suitable risk
management measures in place such as stops and limits
Stochastic oscillator
Another popular example of a leading indicator is the stochastic
oscillator which is used to compare recent closing prices to the
previous trading range
The stochastic is based on the idea that market momentum changes
direction much faster than volume or price so it can be used to predict
the direction of market movements If the oscillator reaches a reading
of 80 or over the market would be considered overbought while
anything under 20 would be thought of as oversold
Technical Level EASYWAYLEARN ACADEMY
SAHALSOFTWARE ndash SAHAL UNIVERSITY
Eng Mohamed Jama
The oscillator is shown as two lines on the chart the K (the black
line on the chart below) and the D (the red dotted line below) When
these two lines cross it is seen as a leading signal that a change in
market direction is approaching
During volatile market conditions the stochastic is prone to false
signals To prevent this impacting your trades you could use the
stochastic in conjunction with other indicators or use it as a filter for
Technical Level EASYWAYLEARN ACADEMY
SAHALSOFTWARE ndash SAHAL UNIVERSITY
Eng Mohamed Jama
your trades rather than a trigger This would mean entering the market
once the trend is confirmed as you would with a lagging indicator
Williams R
The Williams percent range more commonly known as the Williams
R is very similar to the stochastic oscillator The main difference
being that it works on a negative scale ndash so it ranges between zero
and -100 and uses -20 and -80 as the overbought and oversold
signals respectively
So on the below chart the green line below -80 indicates that the
price is likely to rise While the red line above -20 indicates the price is
likely to fall
Technical Level EASYWAYLEARN ACADEMY
SAHALSOFTWARE ndash SAHAL UNIVERSITY
Eng Mohamed Jama
The indicator is highly responsive meaning it might start to move to
highs or lows even if the actual market price does not follow suit As
the Williams R is leading these signals can be premature and less
reliable than other entry signals which is why some traders prefer to
use -10 and -90 as more extreme price signals
On-balance volume (OBV)
Technical Level EASYWAYLEARN ACADEMY
SAHALSOFTWARE ndash SAHAL UNIVERSITY
Eng Mohamed Jama
On-balance volume (OBV) is another leading momentum-based
indicator It looks at volume to enable traders to make predictions
about the market price ndash OBV is largely used in shares trading as
volume is well documented by stock exchanges
Traders who use OBV as a leading indicator will focus on increases or
decreases in volume without the equivalent change in price This is
believed to be an indication that the price will increase or decrease
imminently
As a leading indicator OBV is prone to giving false signals especially
as the indicator can be thrown off by huge spikes in volume around
announcements that surprise the market Although volume changes
this is not always indicative of a trend and can cause traders to open
positions prematurely
As with the other leading indicators the OBV is often used in
conjunction with lagging indicators and a thorough risk management
strategy
Technical Level EASYWAYLEARN ACADEMY
SAHALSOFTWARE ndash SAHAL UNIVERSITY
Eng Mohamed Jama
Three popular lagging indicators
Popular lagging indicators include
1 Moving averages
2 The MACD indicator
3 Bollinger bands
Lagging indicators are primarily used to filter out the noise from short-
term market movements and confirm long-term trends They are
usually drawn onto the price chart itself unlike leading indicators
which usually appear in separate windows
Moving averages
Moving averages (MAs) are categorized as a lagging indicator
because they are based on historical data
Buy and sell signals are generated when the price line crosses the MA
or when two MA lines cross each other However because the moving
average is calculated using previous price points the current market
price will be ahead of the MA
Technical Level EASYWAYLEARN ACADEMY
SAHALSOFTWARE ndash SAHAL UNIVERSITY
Eng Mohamed Jama
In the below 50-day MA example the moving average has crossed
the price from above indicating an upward reversal is imminent
However we can see that the MA is slower to pick up the bullish trend
when it does occur
Moving averages can be calculated over any timeframe depending on
the traderrsquos goals ndash but the longer the time frame the longer the lag
Technical Level EASYWAYLEARN ACADEMY
SAHALSOFTWARE ndash SAHAL UNIVERSITY
Eng Mohamed Jama
So a MA of 300 days would have a far longer delay than an MA of 50
days
It is possible for lagging indicators to give off false signals but it is less
likely as they are slower to react
MACD indicator
Moving averages can be used on their own or they can be the basis
of other technical indicators such as the moving average
convergence divergence (MACD) As it is based on MAs the MACD is
inherently a trend-following or lagging indicator However it has been
argued that different components of the MACD provide traders with
different opportunities
There are three components to the tool two moving averages and a
histogram The two moving averages (the signal line and the MACD
line) are invariably lagging indicators as they only provide signals
once the two lines have crossed each other by which time the trend is
already in motion
Technical Level EASYWAYLEARN ACADEMY
SAHALSOFTWARE ndash SAHAL UNIVERSITY
Eng Mohamed Jama
Source IG charts
But the MACD histogram is sometimes considered a leading indicator
as it is used to anticipate signal crossovers in between the two moving
averages The bars on the histogram represents the difference
between the two MAs ndash as the bars move further away from the
central zero line it means the MAs are moving further apart Once this
expansion is over a lsquohumprsquo appears on the histogram which is a sign
the MAs will tighten again and a crossover will occur
Technical Level EASYWAYLEARN ACADEMY
SAHALSOFTWARE ndash SAHAL UNIVERSITY
Eng Mohamed Jama
Although the histogram can be used to enter positions ahead of the
crossovers the moving averages inherently fall behind the market
price So in general it is a lagging indicator This means that there are
instances where the market price may reach a reversal point before
the signal has even been generated ndash which would be deemed a false
signal
Bollinger bands
The Bollinger band tool is a lagging indicator as it is based on a 20-
day simple moving average (SMA) and two outer lines These outer
bands represent the positive and negative standard deviations away
from the SMA and are used as a measure of volatility When levels of
volatility increase the bands will widen and as volatility decreases
they will contract
When the price reaches the outer bands of the Bollinger it often acts
as a trigger for the market to rebound back towards the central 20-
period moving average
Technical Level EASYWAYLEARN ACADEMY
SAHALSOFTWARE ndash SAHAL UNIVERSITY
Eng Mohamed Jama
Source IG charts
There are strategies that suggest the bands have leading indicator
properties but alone they do not give out leading trading signals
Bollinger bands can give no indication of exactly when the change in
volatility might take place or which direction the price will move in
They are merely a sign that a breakout could soon take place giving
bullish and bearish signals
Technical Level EASYWAYLEARN ACADEMY
SAHALSOFTWARE ndash SAHAL UNIVERSITY
Eng Mohamed Jama
This is why traders will often confirm the Bollinger band signals with
price action or use the indicator in conjunction with other lagging tools
or leading indicators such as the RSI
Leading and lagging technical indicators
summed up
A leading indicator is a tool designed to anticipate the future direction
of a market
A lagging indicator is a tool that gives signal once the price movement
has already started
Leading indicators react to prices quickly but this makes them prone to
giving out false signals
Lagging indicators can be more accurate but this is because they are
far slower to react
A lot of popular leading indicators fall into the category of oscillators
including the RSI stochastic oscillator Williams R and OBV
Lagging indicators are drawn onto the price chart itself and include
moving averages the MACD and Bollinger bands
Technical Level EASYWAYLEARN ACADEMY
SAHALSOFTWARE ndash SAHAL UNIVERSITY
Eng Mohamed Jama
Relying solely on either could have negative effects on a strategy
which is why many traders will aim to find a balance of the two
If you feel ready to start using lagging and leading indicators on live
markets you can open an account with IG today Alternatively you
can learn more about financial markets with IG Academy
Lesson 12 Confirmation Checklist = High Probability Trades
Technical Level EASYWAYLEARN ACADEMY
SAHALSOFTWARE ndash SAHAL UNIVERSITY
Eng Mohamed Jama
SupportResistance
Price Reversal Zone
Trend-Line
Pull Back
Technical Level EASYWAYLEARN ACADEMY
SAHALSOFTWARE ndash SAHAL UNIVERSITY
Eng Mohamed Jama
Technical Level EASYWAYLEARN ACADEMY
SAHALSOFTWARE ndash SAHAL UNIVERSITY
Eng Mohamed Jama
Technical Level EASYWAYLEARN ACADEMY
SAHALSOFTWARE ndash SAHAL UNIVERSITY
Eng Mohamed Jama
Technical Level EASYWAYLEARN ACADEMY
SAHALSOFTWARE ndash SAHAL UNIVERSITY
Eng Mohamed Jama
END
Technical Level EASYWAYLEARN ACADEMY
SAHALSOFTWARE ndash SAHAL UNIVERSITY
Eng Mohamed Jama

Technical Level EASYWAYLEARN ACADEMY
SAHALSOFTWARE ndash SAHAL UNIVERSITY
Eng Mohamed Jama
Three popular lagging indicators
Popular lagging indicators include
1 Moving averages
2 The MACD indicator
3 Bollinger bands
Lagging indicators are primarily used to filter out the noise from short-
term market movements and confirm long-term trends They are
usually drawn onto the price chart itself unlike leading indicators
which usually appear in separate windows
Moving averages
Moving averages (MAs) are categorized as a lagging indicator
because they are based on historical data
Buy and sell signals are generated when the price line crosses the MA
or when two MA lines cross each other However because the moving
average is calculated using previous price points the current market
price will be ahead of the MA
Technical Level EASYWAYLEARN ACADEMY
SAHALSOFTWARE ndash SAHAL UNIVERSITY
Eng Mohamed Jama
In the below 50-day MA example the moving average has crossed
the price from above indicating an upward reversal is imminent
However we can see that the MA is slower to pick up the bullish trend
when it does occur
Moving averages can be calculated over any timeframe depending on
the traderrsquos goals ndash but the longer the time frame the longer the lag
Technical Level EASYWAYLEARN ACADEMY
SAHALSOFTWARE ndash SAHAL UNIVERSITY
Eng Mohamed Jama
So a MA of 300 days would have a far longer delay than an MA of 50
days
It is possible for lagging indicators to give off false signals but it is less
likely as they are slower to react
MACD indicator
Moving averages can be used on their own or they can be the basis
of other technical indicators such as the moving average
convergence divergence (MACD) As it is based on MAs the MACD is
inherently a trend-following or lagging indicator However it has been
argued that different components of the MACD provide traders with
different opportunities
There are three components to the tool two moving averages and a
histogram The two moving averages (the signal line and the MACD
line) are invariably lagging indicators as they only provide signals
once the two lines have crossed each other by which time the trend is
already in motion
Technical Level EASYWAYLEARN ACADEMY
SAHALSOFTWARE ndash SAHAL UNIVERSITY
Eng Mohamed Jama
Source IG charts
But the MACD histogram is sometimes considered a leading indicator
as it is used to anticipate signal crossovers in between the two moving
averages The bars on the histogram represents the difference
between the two MAs ndash as the bars move further away from the
central zero line it means the MAs are moving further apart Once this
expansion is over a lsquohumprsquo appears on the histogram which is a sign
the MAs will tighten again and a crossover will occur
Technical Level EASYWAYLEARN ACADEMY
SAHALSOFTWARE ndash SAHAL UNIVERSITY
Eng Mohamed Jama
Although the histogram can be used to enter positions ahead of the
crossovers the moving averages inherently fall behind the market
price So in general it is a lagging indicator This means that there are
instances where the market price may reach a reversal point before
the signal has even been generated ndash which would be deemed a false
signal
Bollinger bands
The Bollinger band tool is a lagging indicator as it is based on a 20-
day simple moving average (SMA) and two outer lines These outer
bands represent the positive and negative standard deviations away
from the SMA and are used as a measure of volatility When levels of
volatility increase the bands will widen and as volatility decreases
they will contract
When the price reaches the outer bands of the Bollinger it often acts
as a trigger for the market to rebound back towards the central 20-
period moving average
Technical Level EASYWAYLEARN ACADEMY
SAHALSOFTWARE ndash SAHAL UNIVERSITY
Eng Mohamed Jama
Source IG charts
There are strategies that suggest the bands have leading indicator
properties but alone they do not give out leading trading signals
Bollinger bands can give no indication of exactly when the change in
volatility might take place or which direction the price will move in
They are merely a sign that a breakout could soon take place giving
bullish and bearish signals
Technical Level EASYWAYLEARN ACADEMY
SAHALSOFTWARE ndash SAHAL UNIVERSITY
Eng Mohamed Jama
This is why traders will often confirm the Bollinger band signals with
price action or use the indicator in conjunction with other lagging tools
or leading indicators such as the RSI
Leading and lagging technical indicators
summed up
A leading indicator is a tool designed to anticipate the future direction
of a market
A lagging indicator is a tool that gives signal once the price movement
has already started
Leading indicators react to prices quickly but this makes them prone to
giving out false signals
Lagging indicators can be more accurate but this is because they are
far slower to react
A lot of popular leading indicators fall into the category of oscillators
including the RSI stochastic oscillator Williams R and OBV
Lagging indicators are drawn onto the price chart itself and include
moving averages the MACD and Bollinger bands
Technical Level EASYWAYLEARN ACADEMY
SAHALSOFTWARE ndash SAHAL UNIVERSITY
Eng Mohamed Jama
Relying solely on either could have negative effects on a strategy
which is why many traders will aim to find a balance of the two
If you feel ready to start using lagging and leading indicators on live
markets you can open an account with IG today Alternatively you
can learn more about financial markets with IG Academy
Lesson 12 Confirmation Checklist = High Probability Trades
Technical Level EASYWAYLEARN ACADEMY
SAHALSOFTWARE ndash SAHAL UNIVERSITY
Eng Mohamed Jama
SupportResistance
Price Reversal Zone
Trend-Line
Pull Back
Technical Level EASYWAYLEARN ACADEMY
SAHALSOFTWARE ndash SAHAL UNIVERSITY
Eng Mohamed Jama
Technical Level EASYWAYLEARN ACADEMY
SAHALSOFTWARE ndash SAHAL UNIVERSITY
Eng Mohamed Jama
Technical Level EASYWAYLEARN ACADEMY
SAHALSOFTWARE ndash SAHAL UNIVERSITY
Eng Mohamed Jama
Technical Level EASYWAYLEARN ACADEMY
SAHALSOFTWARE ndash SAHAL UNIVERSITY
Eng Mohamed Jama
END
Technical Level EASYWAYLEARN ACADEMY
SAHALSOFTWARE ndash SAHAL UNIVERSITY
Eng Mohamed Jama
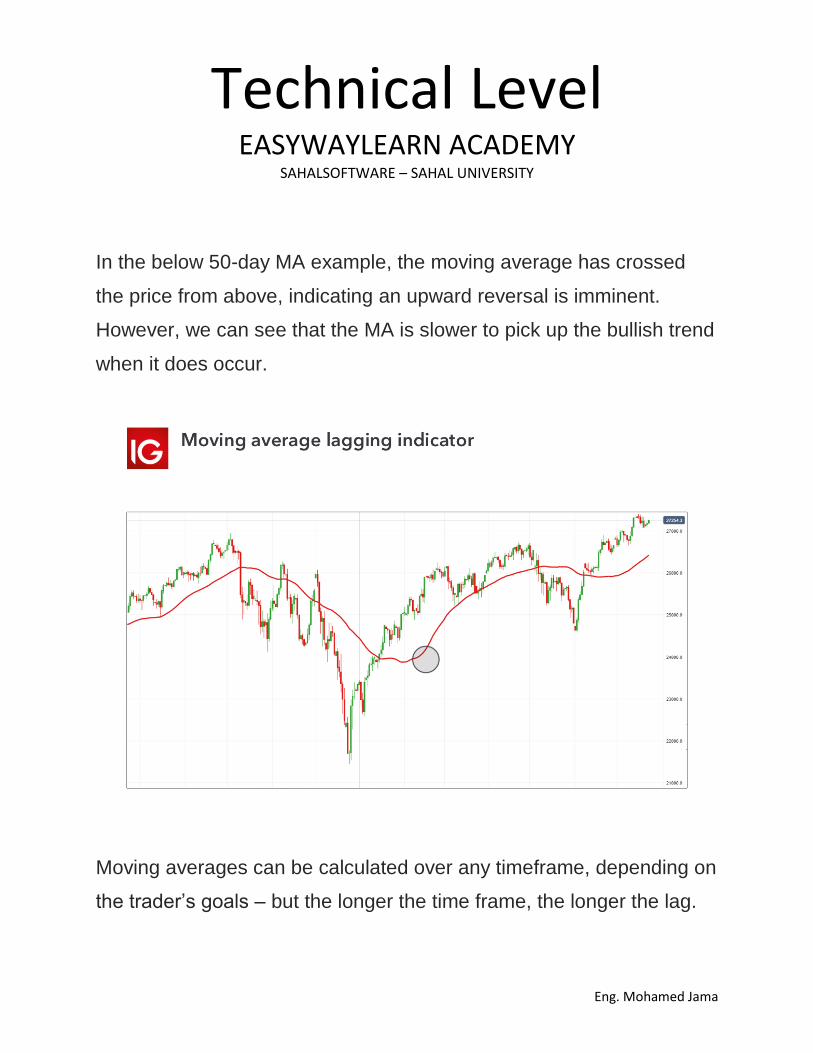
Technical Level EASYWAYLEARN ACADEMY
SAHALSOFTWARE ndash SAHAL UNIVERSITY
Eng Mohamed Jama
Source IG charts
But the MACD histogram is sometimes considered a leading indicator
as it is used to anticipate signal crossovers in between the two moving
averages The bars on the histogram represents the difference
between the two MAs ndash as the bars move further away from the
central zero line it means the MAs are moving further apart Once this
expansion is over a lsquohumprsquo appears on the histogram which is a sign
the MAs will tighten again and a crossover will occur
Technical Level EASYWAYLEARN ACADEMY
SAHALSOFTWARE ndash SAHAL UNIVERSITY
Eng Mohamed Jama
Although the histogram can be used to enter positions ahead of the
crossovers the moving averages inherently fall behind the market
price So in general it is a lagging indicator This means that there are
instances where the market price may reach a reversal point before
the signal has even been generated ndash which would be deemed a false
signal
Bollinger bands
The Bollinger band tool is a lagging indicator as it is based on a 20-
day simple moving average (SMA) and two outer lines These outer
bands represent the positive and negative standard deviations away
from the SMA and are used as a measure of volatility When levels of
volatility increase the bands will widen and as volatility decreases
they will contract
When the price reaches the outer bands of the Bollinger it often acts
as a trigger for the market to rebound back towards the central 20-
period moving average
Technical Level EASYWAYLEARN ACADEMY
SAHALSOFTWARE ndash SAHAL UNIVERSITY
Eng Mohamed Jama
Source IG charts
There are strategies that suggest the bands have leading indicator
properties but alone they do not give out leading trading signals
Bollinger bands can give no indication of exactly when the change in
volatility might take place or which direction the price will move in
They are merely a sign that a breakout could soon take place giving
bullish and bearish signals
Technical Level EASYWAYLEARN ACADEMY
SAHALSOFTWARE ndash SAHAL UNIVERSITY
Eng Mohamed Jama
This is why traders will often confirm the Bollinger band signals with
price action or use the indicator in conjunction with other lagging tools
or leading indicators such as the RSI
Leading and lagging technical indicators
summed up
A leading indicator is a tool designed to anticipate the future direction
of a market
A lagging indicator is a tool that gives signal once the price movement
has already started
Leading indicators react to prices quickly but this makes them prone to
giving out false signals
Lagging indicators can be more accurate but this is because they are
far slower to react
A lot of popular leading indicators fall into the category of oscillators
including the RSI stochastic oscillator Williams R and OBV
Lagging indicators are drawn onto the price chart itself and include
moving averages the MACD and Bollinger bands
Technical Level EASYWAYLEARN ACADEMY
SAHALSOFTWARE ndash SAHAL UNIVERSITY
Eng Mohamed Jama
Relying solely on either could have negative effects on a strategy
which is why many traders will aim to find a balance of the two
If you feel ready to start using lagging and leading indicators on live
markets you can open an account with IG today Alternatively you
can learn more about financial markets with IG Academy
Lesson 12 Confirmation Checklist = High Probability Trades
Technical Level EASYWAYLEARN ACADEMY
SAHALSOFTWARE ndash SAHAL UNIVERSITY
Eng Mohamed Jama
SupportResistance
Price Reversal Zone
Trend-Line
Pull Back
Technical Level EASYWAYLEARN ACADEMY
SAHALSOFTWARE ndash SAHAL UNIVERSITY
Eng Mohamed Jama
Technical Level EASYWAYLEARN ACADEMY
SAHALSOFTWARE ndash SAHAL UNIVERSITY
Eng Mohamed Jama
Technical Level EASYWAYLEARN ACADEMY
SAHALSOFTWARE ndash SAHAL UNIVERSITY
Eng Mohamed Jama
Technical Level EASYWAYLEARN ACADEMY
SAHALSOFTWARE ndash SAHAL UNIVERSITY
Eng Mohamed Jama
END
Technical Level EASYWAYLEARN ACADEMY
SAHALSOFTWARE ndash SAHAL UNIVERSITY
Eng Mohamed Jama

Technical Level EASYWAYLEARN ACADEMY
SAHALSOFTWARE ndash SAHAL UNIVERSITY
Eng Mohamed Jama
Technical Level EASYWAYLEARN ACADEMY
SAHALSOFTWARE ndash SAHAL UNIVERSITY
Eng Mohamed Jama
Technical Level EASYWAYLEARN ACADEMY
SAHALSOFTWARE ndash SAHAL UNIVERSITY
Eng Mohamed Jama
Technical Level EASYWAYLEARN ACADEMY
SAHALSOFTWARE ndash SAHAL UNIVERSITY
Eng Mohamed Jama
END
Technical Level EASYWAYLEARN ACADEMY
SAHALSOFTWARE ndash SAHAL UNIVERSITY
Eng Mohamed Jama

Technical Level EASYWAYLEARN ACADEMY
SAHALSOFTWARE ndash SAHAL UNIVERSITY
Eng Mohamed Jama
Technical Level EASYWAYLEARN ACADEMY
SAHALSOFTWARE ndash SAHAL UNIVERSITY
Eng Mohamed Jama
Technical Level EASYWAYLEARN ACADEMY
SAHALSOFTWARE ndash SAHAL UNIVERSITY
Eng Mohamed Jama
END
Technical Level EASYWAYLEARN ACADEMY
SAHALSOFTWARE ndash SAHAL UNIVERSITY
Eng Mohamed Jama

Technical Level EASYWAYLEARN ACADEMY
SAHALSOFTWARE ndash SAHAL UNIVERSITY
Eng Mohamed Jama
Technical Level EASYWAYLEARN ACADEMY
SAHALSOFTWARE ndash SAHAL UNIVERSITY
Eng Mohamed Jama
END
Technical Level EASYWAYLEARN ACADEMY
SAHALSOFTWARE ndash SAHAL UNIVERSITY
Eng Mohamed Jama

Technical Level EASYWAYLEARN ACADEMY
SAHALSOFTWARE ndash SAHAL UNIVERSITY
Eng Mohamed Jama
END
Technical Level EASYWAYLEARN ACADEMY
SAHALSOFTWARE ndash SAHAL UNIVERSITY
Eng Mohamed Jama

Technical Level EASYWAYLEARN ACADEMY
SAHALSOFTWARE ndash SAHAL UNIVERSITY
Eng Mohamed Jama