technical efficiency and economic performance: some
TRANSCRIPT

Technical Efficiency and Economic Performance: Some Evidence from GhanaAuthor(s): John M. Page, Jr.Source: Oxford Economic Papers, New Series, Vol. 32, No. 2 (Jul., 1980), pp. 319-339Published by: Oxford University PressStable URL: http://www.jstor.org/stable/2662688Accessed: 05/10/2010 09:24
Your use of the JSTOR archive indicates your acceptance of JSTOR's Terms and Conditions of Use, available athttp://www.jstor.org/page/info/about/policies/terms.jsp. JSTOR's Terms and Conditions of Use provides, in part, that unlessyou have obtained prior permission, you may not download an entire issue of a journal or multiple copies of articles, and youmay use content in the JSTOR archive only for your personal, non-commercial use.
Please contact the publisher regarding any further use of this work. Publisher contact information may be obtained athttp://www.jstor.org/action/showPublisher?publisherCode=oup.
Each copy of any part of a JSTOR transmission must contain the same copyright notice that appears on the screen or printedpage of such transmission.
JSTOR is a not-for-profit service that helps scholars, researchers, and students discover, use, and build upon a wide range ofcontent in a trusted digital archive. We use information technology and tools to increase productivity and facilitate new formsof scholarship. For more information about JSTOR, please contact [email protected].
Oxford University Press is collaborating with JSTOR to digitize, preserve and extend access to OxfordEconomic Papers.
http://www.jstor.org

TECHNICAL EFFICIENCY AND ECONOMIC PERFORMANCE: SOME EVIDENCE FROM
GHANA By JOHN M. PAGE, JR.
RECENT studies of the magnitude of inefficiency generated by distorted foreign trade structures have focused attention on the role of inappropriate choice of technique in reducing the social profitability of investments in LDC's. Steel (1972) examining the performance of thirty-nine industrial firms in Ghana, finds a significant relationship between low social profitabil- ity, inappropriate factor proportions, and excess capacity engendered by the structure of protection. Similar conclusions emerge from the work of Bela Balassa and Associates, (1971) and from project analyses of existing invest- ments in developing countries. These findings have produced substantial debate on the scope for factor substitution and the determination of the choice of technique in LDC manufacturing.'
Concurrently, a literature has developed suggesting that poor economic performance may arise largely from low levels of technical efficiency. Pack (1974) observed significant variations in technical or "X-efficiency" among firms in six industries across several countries, and in a more detailed study of the manufacturing sector in Kenya (1976) concluded that managerial training and competence exercise a major influence on economic perfor- mance. Leibenstein (1966) has argued that the social costs of "X- inefficiency" may substantially outweigh those arising from misallocation of resources, and Bergsman (1974) has attempted to quantify the costs of protection arising from tariff induced reductions in X-efficiency.
This paper seeks to clarify the relationship between technical (or mana- gerial) efficiency, the choice of technique, and economic performance. The first section draws upon the concepts of technical and price efficiency developed by Farrell (1957) to establish the relationship between technical efficiency, choice of technique, and a commonly used measure of economic performance, the "Domestic Resource Cost" (DRC) criterion. Section 2 summarizes the results of DRC estimates of economic efficiency for firms in three Ghanaian industries. In Section 3 estimates of the industry production function are employed to measure the extent of technical inefficiency and inappropriate choice of technique. Section 4 utilizes the computed indices of technical, price, and economic efficiency to assess the significance of the choice of technique, and technical inefficiency as components of measured
I would like to thank John Martin, Gerald C. Nelson, Scott R. Pearson, J. Dirck Stryker and Maurice Scott for their valuable comments.
1 Examples include contributions by Pack (1976), Forsyth and Solomon (1977), and Morley and Smith (1977).

320 TECHNICAL EFFICIENCY AND ECONOMIC PERFORMANCE
economic performance. Conclusions and some policy implications are pre- sented in Section 5.
1. Technical, price, and social efficiency
The relationship between technical efficiency, the choice of technique, and economic efficiency is illustrated in Fig. 1. If all firms in an industry employ two factors of production in a well-behaved linear homogenous production function,2 production decisions may be represented in input space by a point giving the combination of primary factors required to generate one unit of output. The input combinations of each firm give rise to a scatter of observations in the input plane. By joining the points that represent minimum input combinations a unit isoquant is drawn such that no observa- tion lies between the envelope and the origin. The frontier, thus defined, represents the minimum quantities of inputs required per unit of output given existing technology. Plants A, B, and C all lie on the isoquant, FF. At their respective levels of output they use no more of the two inputs than required and are said to be technically efficient. Firm D exhibits an input combination to the right of the frontier and is classified as technically inefficient.
L
A F
M D
C
0 Ar M' K
FIG. 1
2 We shall relax the assumption of constant returns to scale in the empirical work of Sections 2 and 3. It is retained here for expositional convenience. For an extension of the Farrell technique to industries with increasing returns to scale, see Farrell and Fieldhouse (1962).

J. M. PAGE, JR. 321
Farrell's method measures each firm's technical efficiency relative to the achieved frontier. Thus, in Fig. 1, the measure of Firm D's technical inefficiency is given by the ratio OA/OD, since Firm D, using techniques available to Firm A, could reduce its inputs in that proportion and continue to produce at its existing level of output.
Technical efficiency is a somewhat elusive concept, but it is most fre- quently associated with the role of management in the production process.3 Liebenstein (1966) has argued that firms may fail to produce on the outer boundary of their production surface due to the structure of preferences of managers and workers, giving rise to variations in the level of "X- efficiency." Shapiro and Muller (1977) in a recent study of modernization and production in traditional agriculture find a significant correlation be- tween technical efficiency and the entrepreneur's stock of information. Thus, variations in technical efficiency may arise from differences in the stock of knowledge possessed by managers and from differences in the quantity and quality of managerial effort supplied to the firm.
A scatter of observations such as that in Fig. 1 need not arise uniquely from variations in the managerial input. First, all firms may not have access to the same technology. If this is the case, there is no basis for measuring technical efficiency relative to a single frontier, since each firm may be efficient with regard to its own set of production possibilities. Second, the measure neglects differences in the physical environment of firms. If the environment varies between firms, apparent differences in efficiency may arise from the degree to which the environment of a particular firm is favorable or unfavorable.
The appropriateness of the choice of technique may also be measured within the context of the Farrell diagram. If MM' represents the relative factor price ratio facing all firms in the industry, the optimum input combination lies on the ray OB, and only Firm B is price efficient. Firms A and C although technically efficient are using inappropriate techniques at market prices. The degree of price inefficiency for Firm A is given by the ratio OR/OA. The basis for the measure is straightforward. Farrell's effi- ciency criterion may be expressed as:
rK + wL Q
3 In part this ambiguity is due to a wide range of conflicting definitions. The terms technical, managerial, and X-efficiency have been used interchangeably in the literature. In a recent contribution, Liebenstein (1977) argues that what we call technical efficiency is in fact a manifestation of X-efficiency. Pack (1974) differentiates between "technical efficiency" which arises from firms' access to technology and "X-efficiency" which he associates with the quality of management. In fact, as we shall argue below, each of these definitions is one component of measured technical efficiency.

322 TECHNICAL EFFICIENCY AND ECONOMIC PERFORMANCE
where: r = the rental cost of capital; w = the wage rate; K = the capital input; L =the labor input; and Q = the volume of output.
The relative price line MM' represents the total cost per unit of output at the most efficient input combination. Any relative price line to the right of MM' entails higher average costs per unit, and the index of inefficiency is given by the ratio of average costs.
In economies characterized by highly distorted product and factor mar- kets, relative factor prices may bias the choice of technique, and the literature on social cost-benefit analysis in less developed countries has devoted substantial attention to the estimation of shadow or accounting prices which reflect factor opportunity costs. If relative factor accounting prices are given by the slope AA', where the relative price of labor has declined, the efficiency criterion may be rewritten as:
. r*K+w*L (2)
where: r*=the accounting rental rate of capital w * = the shadow wage rate.
Firm B remains technically efficient but employs an inappropriate techni- que, while Firm A which is more labor intensive becomes both technically and price efficient, at accounting prices.
Distortions in the product market are also reflected in the market prices of output and intermediate inputs. Therefore, measures of social efficiency in small open economies with distorted foreign trade regimes have focused on the maximization of value added at international prices for a given input of domestic resources allocated to the production of traded goods. In terms of the Farrell diagram the unit isoquant may be constructed in value added at world prices and the efficiency criterion expressed as:
min r*K+w*L (3) PwQ-Z AiPwi
where:
Ai = quantity of input i employed in the production of Q Pwi= world price of intermediate input i
Pw= world price of output Q.

J. M. PAGE, JR. 323
Expression (3) is the familiar "Domestic Resource Cost of Foreign Exchange" (DRC) criterion which has been widely used as an index of economic efficiency in restrictionist trade regimes.4
Firm A in Fig. 1 would exhibit the minimum Domestic Resource Cost ratio. Firms B, C, and D all have higher unit social costs, and higher DRC's; they are therefore judged to be relatively less efficient. It is impossible to establish on the basis of the criterion, however, whether differences in relative efficiency arise from inappropriate choice of technique, technical inefficiency, or from a combination of the two. Thus Firms B and D have equal Domestic Resource Cost ratios although Firm D's inefficiency arises from inefficient use of an appropriate technique while Firm B efficiently employs inappropriate factor proportions.
The relationship between price and technical efficiency and the domestic resource cost measure may be further examined by rewriting (3) as
D = r*CK + W*C L, where CK K (PWQ - AiPwi)
CL=L (PwQ- AiPwi)
are the input-output coefficients for capital and labor, respectively, in terms of value added at world prices, and differentiating totally to obtain:
A A A A A
D = OKAK + OLAL + OkBK + OLBL (4)
where: A
D = dD/D is the proportionate change in the domestic resource cost ratio, OK= r*KI(r*K + w*L) is the share of capital costs in total factor social costs, and OL = w*LI(r*K+ w*L) is the share of labor costs in total factor social costs. The Ai = (1/CQ)(aCJak) dk are the proportionate changes in the coefficients of capital and labor arising from a change in capital-labor ratio, k (the partial derivative notation indicates that the level of technical efficiency is held constant) and the Bi = (1/C1)(aC/am) dm are the propor- tionate changes in the input-output coefficients arising from improvements in technical efficiency, m.
To determine the effect of price inefficiency on economic performance, the level of technical efficiency is held constant, dm =0, and the resource cost ratio is minimized by equating the rate of technical substitution to the shadow wage-rental ratio. The proportionate change in D is equal to the sum of the proportionate changes in the input-output coefficients of capital
4 Early contributions to the literature are Bruno (1967) and Krueger (1966). Empirical studies include Krueger (1966), Steel (1972), and forthcoming studies by Bela Balassa and associates of industry and agriculture in four West African nations. See also Pearson (1976) and the references cited therein.
324 TECHNICAL EFFICIENCY AND ECONOMIC PERFORMANCE
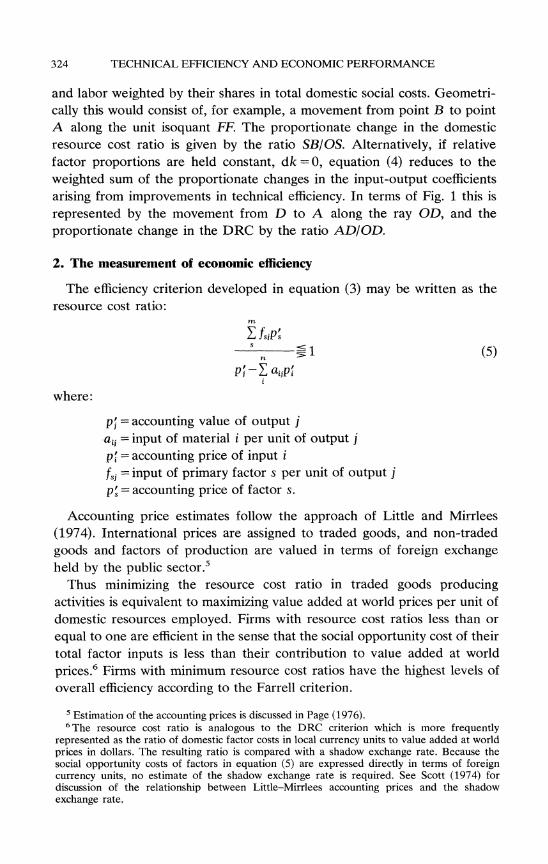
and labor weighted by their shares in total domestic social costs. Geometri- cally this would consist of, for example, a movement from point B to point A along the unit isoquant FF. The proportionate change in the domestic resource cost ratio is given by the ratio SB/OS. Alternatively, if relative factor proportions are held constant, dk =0, equation (4) reduces to the weighted sum of the proportionate changes in the input-output coefficients arising from improvements in technical efficiency. In terms of Fig. 1 this is represented by the movement from D to A along the ray OD, and the proportionate change in the DRC by the ratio AD/OD.
2. The measurement of economic efficiency
The efficiency criterion developed in equation (3) may be written as the resource cost ratio:
S (5)
p- - ajjpL
where:
pa = accounting value of output j aij = input of material i per unit of output j
Lp= accounting price of input i fsi = input of primary factor s per unit of output j
=p - accounting price of factor s.
Accounting price estimates follow the approach of Little and Mirrlees (1974). International prices are assigned to traded goods, and non-traded goods and factors of production are valued in terms of foreign exchange held by the public sector.5
Thus minimizing the resource cost ratio in traded goods producing activities is equivalent to maximizing value added at world prices per unit of domestic resources employed. Firms with resource cost ratios less than or equal to one are efficient in the sense that the social opportunity cost of their total factor inputs is less than their contribution to value added at world prices.6 Firms with minimum resource cost ratios have the highest levels of overall efficiency according to the Farrell criterion.
5 Estimation of the accounting prices is discussed in Page (1976). 6 The resource cost ratio is analogous to the DRC criterion which is more frequently
represented as the ratio of domestic factor costs in local currency units to value added at world prices in dollars. The resulting ratio is compared with a shadow exchange rate. Because the social opportunity costs of factors in equation (5) are expressed directly in terms of foreign currency units, no estimate of the shadow exchange rate is required. See Scott (1974) for discussion of the relationship between Little-Mirrlees accounting prices and the shadow exchange rate.
J. M. PAGE, JR. 325
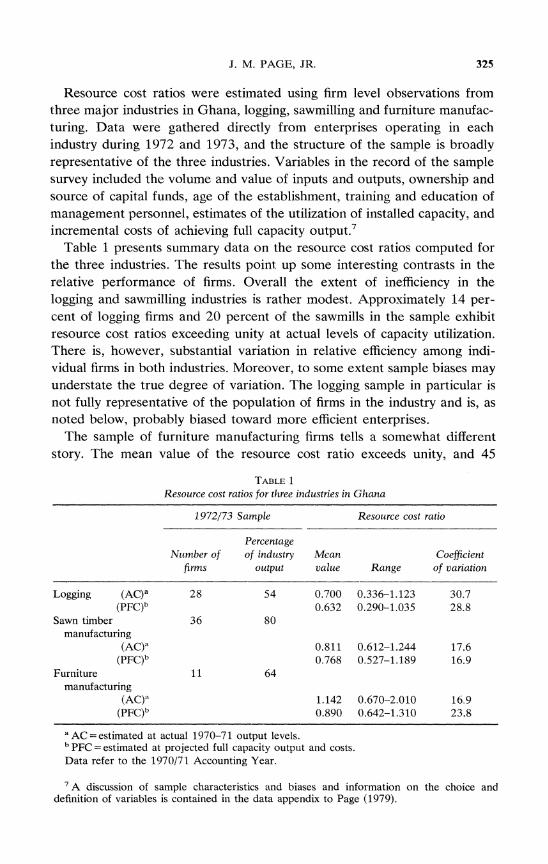
Resource cost ratios were estimated using firm level observations from three major industries in Ghana, logging, sawmilling and furniture manufac- turing. Data were gathered directly from enterprises operating in each industry during 1972 and 1973, and the structure of the sample is broadly representative of the three industries. Variables in the record of the sample survey included the volume and value of inputs and outputs, ownership and source of capital funds, age of the establishment, training and education of management personnel, estimates of the utilization of installed capacity, and incremental costs of achieving full capacity output.7
Table 1 presents summary data on the resource cost ratios computed for the three industries. The results point up some interesting contrasts in the relative performance of firms. Overall the extent of inefficiency in the logging and sawmilling industries is rather modest. Approximately 14 per- cent of logging firms and 20 percent of the sawmills in the sample exhibit resource cost ratios exceeding unity at actual levels of capacity utilization. There is, however, substantial variation in relative efficiency among indi- vidual firms in both industries. Moreover, to some extent sample biases may understate the true degree of variation. The logging sample in particular is not fully representative of the population of firms in the industry and is, as noted below, probably biased toward more efficient enterprises.
The sample of furniture manufacturing firms tells a somewhat different story. The mean value of the resource cost ratio exceeds unity, and 45
TABLE 1
Resource cost ratios for three industries in Ghana
1972/73 Sample Resource cost ratio
Percentage Number of of industry Mean Coefficient
firms output value Range of variation
Logging (AC)a 28 54 0.700 0.336-1.123 30.7 (PFC)b 0.632 0.290-1.035 28.8
Sawn timber 36 80 manufacturing
(AC)a 0.811 0.612-1.244 17.6 (PFC)b 0.768 0.527-1.1-89 16.9
Furniture 11 64 manufacturing
(AC)a 1.142 0.670-2.010 16,9 (PFC)b 0.890 0.642-1.310 23.8
aAC= estimated at actual 1970-71 output levels. b PFC = estimated at projected full capacity output and costs. Data refer to the 1970/71 Accounting Year.
'A discussion of sample characteristics and biases and information on the choice and definition of variables is contained in the data appendix to Page (1979).

326 TECHNICAL EFFICIENCY AND ECONOMIC PERFORMANCE
percent of firms in the sample, producing 36 percent of sample output, were inefficient at actual levels of capacity utilization. The contrast is not al- together surprising. Wooden furniture manufacturing is principally an im- port substitution activity protected by both tariff and quantitative restric- tions on imports. All of the inefficient firms were drawn from the subset of enterprises producing for import substitution, and each of the inefficient firms reported substantial excess capacity during the survey year. Logging and sawn timber production in contrast are principally export activities, characterized by higher levels of capacity utilization and negative rates of nominal and effective tariff protection.
The sensitivity of the rank ordering of firms to changes in central variables including the accounting rate of interest, the shadow wage rate, and com- modity accounting prices was extensively tested. Changes in each of these parameters did not substantially alter the relative ranking of firms in either industry. The greatest change in rank order occurred in the logging industry when the ARI was reduced from 10 to 5 percent, and in this case only three firms changed rank (each by one place).
The consequences of an expansion of output to projected full capacity are also presented in Table 1. In each industry full capacity utilization results in substantial improvements in average efficiency although some firms remain absolutely inefficient.
3. Technical and price efficiency: Some estimates
Measuring technical efficiency
A measure of relative technical efficiency was developed by Timmer (1971) from Farrell's concept of the frontier isoquant. Each firm in an industry is assumed to confront a production function of the form:
X = f(x1, X2,..., Xm; Y1, Y2, ---Y) (6)
where xi= measurable factor inputs (e.g., capital and labor) and yi = nonmeasurable inputs (for example, the levels of technical knowledge, managerial effort, and firm specific fixed factors). Because the yi are not observable, estimates of the industry production function based on meas- ured inputs will be biased and there will be an unexplained residual. By constraining all residuals to be positive it is possible to use a technique of linear programming to obtain an outer-bound production function of the Cobb-Douglas type:
logXi =logA + d i log xii (7) i =1
where X -predicted output of firm j, and the d, are the parameters of the

J. M. PAGE, JR. 327
outer-bound production function.8 Actual output Xi would equal predicted output only if the firm were technically efficient. The index of technical efficiency is given by the ratio of actual to predicted output XJXJ 6 1.
Frontier production functions estimated in this manner suffer from con- ceptual and econometric limitations. Stochastic variations and errors of observation and measurement will be captured by the efficiency index in addition to deviations which are the result of factors under the firm's control.9 To some extent this can be mitigated by allowing a specified proportion of the observations to lie above the frontier and observing the sensitivity of the estimated coefficients to possible outliers. This adjustment is essentially arbitrary, however, and lacks explicit economic or statistical justification.10
In addition the programming approach does not generate parameter estimates with known statistical properties. Schmidt (1976) has demon- strated that the linear programming technique can be derived from max- imum likelihood estimation of the production function where errors are one-sided and distributed exponentially. However, since the range of the dependent variable, X, depends on the parameters to be estimated, it is not possible to determine the asymptotic distributions of the parameter esti- mates."1
Thus the efficiency indices derived from the frontier production function must be interpreted with some caution. They provide a measure of relative efficiency, but little is known about the frontier from which they are estimated.
An alternative to the linear programming technique was developed by Richmond (1974) using ordinary least squares estimates of the Cobb- Douglas production function. Richmond assumes that the production func- tion may be written:
logX=log A + ai log xij - z1 (8) i =1
8The technique was developed by Aigner and Chu (1968) and extended by Timmer (1970) and (1971) to encompass a probabilistic frontier.
9 Another conceptual problem arises if technical knowledge is firm specific. In such cases there is no basis for measuring efficiency relative to a single frontier, since several vintages of technology may coexist within a single industry. The three industries in the sample, however, are well established in Ghana, and production techniques are of similar vintage across firms. Managers in each industry appear to be well acquainted with the range of production possibilities, and the choice of techniques reflects variations in relative factor costs arising from highly segmented capital and labor markets. A detailed evaluation of factor intensities and the choice of technique is contained in Page (1976).
1' It is customary to appeal to measurement error in the extreme observations as justification for the elimination of outliers.
11 See Aigner, Lovell, and Schmidt (1977) for additional discussion of the limitations of this type of parametric frontier production function. They propose an alternative formulation of the frontier using an error components model embodying both stochastic and one-sided errors. The production function is then estimated by maximum likelihood methods.

328 TECHNICAL EFFICIENCY AND ECONOMIC PERFORMANCE
where the z 's are a random sample from a Gamma distribution with parameter n. It is possible to transform equation (8) into
log X> = a +E ai log xiJ + vj (9)
where:
0=logA-n, v; = n- z, E(v)=0,
E(v2) = n, and E(vJvk) = 0, j/4 k.
Equation (9) may then be estimated by ordinary least squares to provide estimators of the a, and n. Richmond adopts as his measure of efficiency uj=XJ/f(xj), where x1 = (x, ... xm). Assuming that u = exp (-z) provides a measure of the average efficiency level for the industry ? = E(u) = 2n.12 The OLS estimator of n may then be employed to provide an upward biased but consistent estimator ? = 2-r.
Data are drawn from the record of the sample survey. The variables employed in the estimated equations were chosen after some experimenta- tion during which several alternative measures of output, capital and labor were tested.13 The definition of output is conventional. Value added is expressed in Cedis and is defined as the ex-factory value of output net of inputs external to the firm.'4 Labor inputs were converted to man-hours using data provided on the duration of shifts, overtime, and days worked per year. In order to adjust somewhat for differences in skill mix between firms, aggregation across skill categories was accomplished by taking wage weigh- ted unskilled labor equivalents.
The capital input variables required the greatest amount of manipulation and are probably subject to the greatest error in measurement. Capital stocks at original purchased value, were adjusted to 1970-71 values by means of a price index reflecting tariff, foreign price and exchange rate adjustments. The stock variables were then converted to an annual flow on the basis of an assumed 10 percent rate of discount and uniform economic lifetimes, and were adjusted for capacity under-utilization using managers' estimates of the percentage of full one-shift capacity worked during the accounting year.
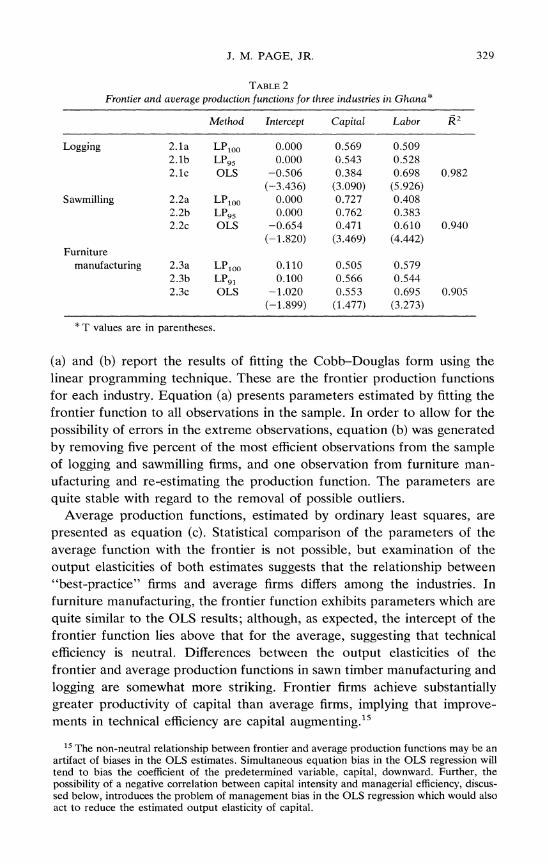
Estimates of the production functions are presented in Table 2. Equations
12E(u)= I exp (-z)G(z; n) dz, where z has the density function G(z; n)= 0
1 00_ --z exp (-z), O < z < o, n > O; = O, elsewhere, and F(n)= I z't1exp (-z) dz. FRn) o
13 For discussion of the choice of variables in the estimates see the appendix to Page (1979). 14Use of value added presented some problems in the logging industry where differential
resource-based rents are reflected in the unit value of output. These rents, unless the output measure is adjusted accordingly, will become part of measured efficiency. The approach adopted was to standarize value added by taking the product of the firm's volume of physical output and the national average price per cubic foot of timber.
J. M. PAGE, JR. 329
TABLE 2 Frontier and average production functions for three industries in Ghana*
Method Intercept Capital Labor Rn
Logging 2.1a LP1OO 0.000 0.569 0.509 2. lb LP95 0.000 G.543 0.528 2.1c OLS -0.506 0.384 0.698 0.982
(--3.436) (3.090) (5.926) Sawmilling 2.2a LP100 0.000 0.727 0.408
2.2b LP95 0.000 0.762 0.383 2.2c OLS -0.654 0.471 0.610 0.940
(-1.820) (3.469) (4.442) Furniture
manufacturing 2.3a LP1.00 0.110 0.505 0.579 2.3b LP91 0.100 0.566 0.544 2.3c OLS -1.020 0.553 0.695 0.905
(-1.899) (1.477) (3.273)
* T values are in parentheses.
(a) and (b) report the results of fitting the Cobb-Douglas form using the linear programming technique. These are the frontier production functions for each industry. Equation (a) presents parameters estimated by fitting the frontier function to all observations in the sample. In order to allow for the possibility of errors in the extreme observations, equation (b) was generated by removing five percent of the most efficient observations from the sample of logging and sawmilling firms, and one observation from furniture man- ufacturing and re-estimating the production function. The parameters are quite stable with regard to the removal of possible outliers.
Average production functions, estimated by ordinary least squares, are presented as equation (c). Statistical comparison of the parameters of the average function with the frontier is not possible, but examination of the output elasticities of both estimates suggests that the relationship between "best-practice" firms and average firms differs among the industries. In furniture manufacturing, the frontier function exhibits parameters which are quite similar to the OLS results; although, as expected, the intercept of the frontier function lies above that for the average, suggesting that technical efficiency is neutral. Differences between the output elasticities of the frontier and average production functions in sawn timber manufacturing and logging are somewhat more striking. Frontier firms achieve substantially greater productivity of capital than average firms, implying that improve- ments in technical efficiency are capital augmenting.15
15 The non-neutral relationship between frontier and average production functions may be an artifact of biases in the OLS estimates. Simultaneous equation bias in the OLS regression will tend to bias the coefficient of the predetermined variable, capital, downward. Further, the possibility of a negative correlation between capital intensity and managerial efficiency, discus- sed below, introduces the problem of management bias in the OLS regression which would also act to reduce the estimated output elasticity of capital.

330 TECHNICAL EFFICIENCY AND ECONOMIC PERFORMANCE
Technical and price efficiency
The production function estimates provide a vehicle for evaluating the extent of technical and price inefficiency in the three industries. Table 3 presents summary statistics concerning the indices of efficiency estimated from the frontier and average production functions.
Results of the estimates of technical efficiency are presented in Table 3a. All three industries exhibit relatively high levels of average efficiency. Actual output for the representative firm is more than 70 percent of predicted output using the linear programming production function and more than 90 percent of predicted output using the residuals of the OLS estimates.16
TABLE 3 Indices of technical and price efficiency for three industries in Ghana
(a) Index of technical efficiency
OLS residuals Outer bound production function
Industry Average index Average index Minimum index
Logging 0.920 0.709 0.407 Saw Milling 0.904 0.710 0.287 Furniture
manufacturing 0.938 0.743 0.493
(b) Index of price efficiency at accounting prices
OLS production function Outer bound production function Average index Range Average index Range
Logging 0.775 0.537-0.938 0.932 0.754-0.929 Sawmilling 0.969 0.899-0.991 0.852 0.687-0.996 Furniture
manufacturing 0.987 0.943-0.996 0.998 0.958-0.999
16The two estimating techniques probably bound the true value of the average index. The linear programming technique, because it places high weights on the extreme observations in determining the parameters of the production function represents a pessimistic approach to the measurement of relative efficiency. Use of the OLS residuals provides an upward biased estimate of the average efficiency level. Relative rankings of firms by each method are highly correlated. Spearmans rank correlation coefficients for the two indices are 0.858, 0.935, and 0.873 for logging, sawmilling, and furniture manufacturing respectively. All are significant at the 0.01 level or above. The apparently high levels of technical efficiency in logging and furniture manufacturing, however, may be partly artifacts of the structure of the sample. During the course of the survey the bulk of observations on smaller Ghanaian-owned firms had to be discarded due to incomplete or inconsistent responses to questions regarding the structure of costs. If the inability of firms to complete the survey questionnaire is indicative of low levels of managerial efficiency, the sample may be biased toward relatively more efficient firms. In sawn timber manufacturing where the sample coverage was more complete the average indices of technical efficiency are lower, and there is greater variation in the performance of individual firms relative to the frontier.

J. M. PAGE, JR. 331
These high average levels of efficiency probably reflect both the age and structure of the individual industries. Logging and sawmilling are among the oldest Ghanaian industrial activities and produce almost wholly for export. Under sustained competitive conditions one would expect highly inefficient firms to be driven out of business. Although furniture manufacturing is primarily an import substitution activity benefitting from substantial protec- tion, firms in the sample compete with a large number of small scale producers.
Within each industry there is substantial variation in the individual indices of efficiency derived from the linear programming production frontier. Data in the record of the sample survey can be used to explore the relationship between the firm specific level of technical efficiency and a number of management related variables. The results of this inquiry, which provide additional insights into the nature of technical efficiency at both the firm and industry level are reported below.
An index of price efficiency at accounting prices was constructed following Farrell's technique and employing the parameters of the average and frontier production functions."7 Factor social costs, the accounting cost of capital and labor services, were estimated for each firm at the optimum factor proportions, give its 1970/71 level of output. These projected social costs were then expressed as a percentage of actual factor social costs to provide an index of price efficiency at accounting prices. Price efficient firms, those with correct factor proportions at accounting prices, have an index value of one. Firms with capital labor ratios which diverge from the optimum have indices less than unity. The value of the index indicates the percentage by which social factor costs could be reduced if the firm were to shift to the appropriate technique.
The results are reported in Table 3b. In logging, where there is substantial variation in the choice of technique reductions in social factor costs arising from the shift to an appropriate technique based on the parameters of the average production function, would be on the order of 20 percent for the representative firm. These reductions decline to 3 and 1 percent, respectively, for sawn timber and furniture manufacturing. The parameters of the frontier production function yield higher indices of price efficiency for logging and furniture manufacturing and a substantially lower index for sawn timber manufacturing.
The results are not very surprising in light of the structure of the three industries. In logging where substantial government subsidies have been
17 Judgements concerning price efficiency are obviously crucially dependent upon the approp- riateness of the Cobb-Douglas specification. As a check on that assumption, Kmenta approxi- mations to the CES production function were also estimated. In no case was it possible to reject the assumption of unitary elasticity of substitution.

332 TECHNICAL EFFICIENCY AND ECONOMIC PERFORMANCE
offered on capital equipment, evidence from both the average and frontier production functions suggests that firms are using too much capital and too little labor.18 The results of the average production function estimates for both sawn timber and furniture manufacturing indicate that the representa- tive firm in each industry is quite close to being price efficient at accounting prices. There is substantial variation, however, in individual observations reflecting both failures in the decision-making process of individual firms and variations in factor prices. The capital using bias in technical efficiency implicit in the frontier production function improves the estimate of price efficiency at accounting prices for logging firms and gives the result that on average sawmilling firms are using too little capital relative to labor.
Sources of technical efficiency
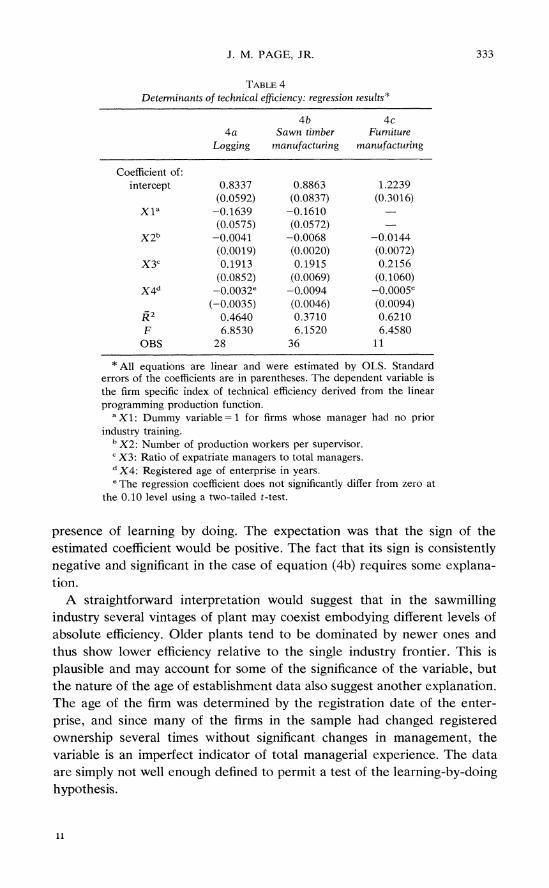
Table 4 reports the results of the most successful attempt to explain variations in relative technical efficiency in terms of the quality and quantity of managerial inputs supplied to the firm. Equations (4a)-(4c) present coefficients of an OLS regression of the linear programming efficiency index on four management-related variables contained in the record of the sample survey. It is possible to explain almost half of the variation in the efficiency index in terms of these factors, and analysis of the results yields some interesting insights into the nature of technical inefficiency in the three industries.
To test for the importance of education and information as determinants of technical efficiency, managers in the sample were classified into two groups, those with industry experience or formal training obtained prior to assuming their present position and those with neither training nor experi- ence. A dummy variable, assigned the value of one for those in the latter group, was introduced into the regression with the prior expectation that lack of formal training or industry experience would be negatively correlated with the level of technical efficiency. The coefficient of the education variable is of expected sign and significant at the 0.01 level in equations (4a) and (4b). Low levels of education and experience are reflected in lower technical efficiency in both logging and sawn timber manufacturing. In furniture manufacturing none of the reporting firms had managerial staffs which lacked prior experience and the variable was excluded from the regression.
The age of the enterprise was included in the analysis as a test for the
"8The Cobb-Douglas specification is particularly convenient for computation of the ratio of marginal revenue product to marginal factor cost. Ratios exceeding unity indicate that firms use relatively too little of the factor at accounting prices. A description of the factor price regimes faced by these three industries and of government programs of capital subsidies is contained in Page (1976).
J. M. PAGE, JR. 333
TABLE 4 Determinants of technical efficiency: regression results "
4b 4c 4a Sawn timber Furniture
Logging manufacturing manufacturing
Coefficient of: intercept 0.8337 0.8863 1.2239
(0.0592) (0.0837) (0.3016) Xja -0.1639 -0.1610
(0.0575) (0.0572) X2b -0.0041 -0.0068 -0.0144
(0.0019) (0.0020) (0.0072) X3C 0.1913 0.1915 0.2156
(0.0852) (0.0069) (0.1060) X4d -0.0032e -0.0094 -0.0005e
(--0.0035) (0.0046) (0.0094) 0.4640 0.3710 0.6210
F 6.8530 6.1520 6.4580 OBS 28 36 11
*All equations are linear and were estimated by OLS. Standard errors of the coefficients are in parentheses. The dependent variable is the firm specific index of technical efficiency derived from the linear programming production function.
a X1: Dummy variable= 1 for firms whose manager had no prior industry training.
b X2: Number of production workers per supervisor. c X3: Ratio of expatriate managers to total managers. d X4: Registered age of enterprise in years. e The regression coefficient does not significantly differ from zero at
the 0.10 level using a two-tailed t-test.
presence of learning by doing. The expectation was that the sign of the estimated coefficient would be positive. The fact that its sign is consistently negative and significant in the case of equation (4b) requires some explana- tion.
A straightforward interpretation would suggest that in the sawmilling industry several vintages of plant may coexist embodying different levels of absolute efficiency. Older plants tend to be dominated by newer ones and thus show lower efficiency relative to the single industry frontier. This is plausible and may account for some of the significance of the variable, but the nature of the age of establishment data also suggest another explanation. The age of the firm was determined by the registration date of the enter- prise, and since many of the firms in the sample had changed registered ownership several times without significant changes in management, the variable is an imperfect indicator of total managerial experience. The data are simply not well enough defined to permit a test of the learning-by-doing hypothesis.
11

334 TECHNICAL EFFICIENCY AND ECONOMIC PERFORMANCE
An important policy issue for many LDC's is the extent to which foreign ownership of enterprises results in higher levels of technical expertise and greater economic efficiency. In the present sample nationality of ownership does not appear to explain variations in technical efficiency. Firms were classified into three categories of ownership, multinational, resident expat- riate, and Ghanaian, and dummy variables for multinational and resident expatriate firms were introduced into the regression. Coefficients of both shift variables were insignificant.
Although foreign or expatriate ownership apparently has no significant influence on the level of technical efficiency, the nationality of management is a significant explanatory variable. When the ratio of expatriate managers to total managers is included in the regressions reported in Table 4, coefficients of the variable are positive and significant in all equations. Higher proportions of expatriates in management increase the level of technical efficiency. The positive correlation between foreign management and technical efficiency probably reflects the impact of training and experi- ence not captured by the education variable. Foreign nationals are distri- buted quite broadly among all ownership categories of firms in the three industries, and in general they have substantially greater industry experience than their Ghanaian counterparts. The results may also reflect, in some measure, differences in the level of managerial effort. The highest ratios of expatriate managers to total managers are encountered in single-proprietor, expatriate-owned firms. Impressionsitic evidence from the sample survey suggests that these entrepreneurs work longer hours and may more inten- sively manage their firms than managers in Ghanaian or multinational enterprises. Thus the results lend the X-efficiency arguments of Leibenstein and others some empirical support.
The number of production workers per supervisor was introduced into the analysis as a measure of the intensity of managerial effort. The three industries surveyed are relatively labor intensive and have substantial scope for idle or improperly organized labor in the absence of strict supervision."9 It was expected that as the number of production workers per supervisor increased, the level of technical efficiency would decline, and the results support this hypothesis. The number of production workers per supervisor is significantly and negatively correlated with the index of efficiency at the 0.10 level or greater in all three regressions. It is likely, however, that this variable also captures the effect of a bias introduced by the labor variable in the production function. Aggregation into unskilled labor equivalents is at best an imperfect method of adjusting for differences in skill mix. To the
19 In a ranking of Ghanaian industries by their capital labor ratios furniture manufacturing, sawmilling, and logging are first, fifth, and eleventh of 29 industrial groups in terms of labor intensity.

J. M. PAGE, JR. 335
extent that the production worker-supervisor ratio reflects variations in the skill intensity of firms, the explanatory variable may also be correcting for differences in skill intensity.
The results suggest that variations in managerial effort and ability are significant factors in explaining a firm's position relative to the industry production frontier. Technical inefficiency is not simply a reflection of differences in the physical environment and errors of measurement and specification. It also reflects the important influence of an excluded variable, management, from the production function.
4. Explaining inefficiency
It is now possible to draw together the estimates of social, price, and technical efficiency to explore the extent to which variations in the choice of technique and in the level of technical efficiency affect measured economic performance. Table 5 summarizes the results of applying the decomposition developed in equation (4) to the estimated resource cost ratio for each observation. Entries in the table show the percentage reduction in the resource cost ratio arising from expansion from actual to projected full
TABLE 5 Percentage reduction in the resource cost ratio due to technical and price efficiency and full
utilization of capacity
Price efficiency Expansion to at accounting full capacity Technical efficiency prices
Outer bound OLS production OLS Outer bound
residuals functioil parameters parameters
Logging Mean 9.7 8.0 29.1 22.5 6.8 Minimum 0 0 6.3 7.1 Maximum 31.6 59.1 46.3 24.6
Sawmilling Mean 5.3 9.6 28.9 3.1 14.8 Minimum 0 - 0 0.9 0.4 Maximum 23.9 - 71.3 10.1 31.4
Furniture manufacturing
Mean 22.1 6.2 25.7 1.3 0.2 Minimum 0 - 0 0.4 (.0 Maximum 34.8 - 50.7 5.7 4.2
336 TECHNICAL EFFICIENCY AND ECONOMIC PERFORMANCE
capacity output, from optimization of the capital-labor ratio, and from achieving full technical efficiency.
The percentage reduction in the resource cost ratio arising from expansion to projected full capacity output was estimated by questioning managers regarding the incremental costs of expansion to their desired level of capacity utilization, if inputs and sales were unconstrained at prevailing prices.20 Reductions in the resource cost ratio are quite modest for firms in logging and sawn timber manufacturing, averaging less than 10 percent. In furniture manufacturing which is primarily engaged in import substitution, however, the reduction in the resource cost ratio for the representative firm exceeds 20 percent. Investments in furniture manufacturing, which were made in response to the construction boom of the early 1960s, were particularly hard hit by declines in domestic demand and input supply constraints imposed by the exchange control regime. The results underscore the sensitivity of measurements of efficiency based on cross section data to the problems of capacity utilization.
The index of technical efficiency derived from the outer bound production function was used to establish projected input-output coefficients and re- source cost ratios for each firm at full technical efficiency, given existing factor proportions. Reductions in the resource cost ratio arising from projected improvements in technical efficiency are substantial, exceeding 25 percent for the average firm in all three industries. The gains for the average firm based on Richmond's method are modest. Reductions in the resource cost ratio are less than ten percent for the average firm in each industry.
Equally interesting are the apparently rather limited gains in social efficiency ascribed to optimization of the capital labor ratio at existing levels of technical efficiency. When the parameters of the average Cobb-Douglas production function are used to estimate proportionate reductions in the resource cost ratio due to price efficiency at accounting prices for firms in the logging industry, which is the least price efficient, the decline ranges from 6 to 46 percent. In sawmilling and furniture manufacturing however high average levels of price efficiency at accounting prices leave little scope for improvements in social efficiency. Using the parameter of the frontier production function to establish optimum factor proportions increases the estimated decline in the ratio for sawn timber manufacturing, but substan- tially reduces the projected benefits of improvements in the choice of technique in logging.
In all three industries, however, the projected gains from improvements in technical efficiency are of equal or greater magnitude than the potential
20The utilization rate thus defined was used to adjust the capital service variable in the production function estimates, allowing separate treatment of capacity utilization and technical efficiency.

J. M. PAGE, JR. 337
gains from optimization of the capital labor ratio. This result seems to run counter to much of the literature on the social evaluation of investments and the choice of technique in LDC's, which has tended to focus on the social costs of price inefficiency at accounting prices. In part the difference stems from the limited focus of this study. Trade distortions in particular affect not only the choice of technique within industries, but also product choice and, hence, the overall level of factor intensity. Thus, although there is substan- tial variation in factor intensity among firms within the industries studied, the impact of inappropriately capital intensive processes on economic effi- ciency may appear less striking than in a more broadly based sample. Moreover, sawmilling and furniture manufacturing are among the oldest industries in Ghana and carry forward much of their plant and equipment from the period preceding the exchange control regime. It is therefore likely that representative firms in these industries would be closer to price effi- ciency at accounting prices than firms in industries established later in the period of exchange control.
Several recent studies of industrial enterprises in LDCs have examined the hypothesis that managers who are ignorant of technical possibilities tend to select inappropriately capital intensive techniques, imitating the industrial technology of machinery supplying countries.2' Thus there may exist a positive relationship between technical and price efficiency. Correlation analysis of the indices of technical and price efficiency supports such an interpretation for logging where the two indices are significantly and posi- tively correlated, suggesting that managers who are technically inefficient may also be unaware of opportunity costs and alternative techniques. But the relationship between the choice of technique and technical efficiency may be more complex. Variations in capital intensity may reflect different relative factor prices faced by individual firms. Capital intensive firms should be those with access to the most highly subsidized segments of the capital market. Such subsidies may have an income effect tending to reduce the amount of managerial effort supplied to the firm, and may, therefore, lower the level of technical efficiency. In Ghana's logging industry approximately 30 percent of firms received capital related subsidies during the survey period. Thus the positive correlation between the two indices may reflect the negative impact of subsidies on managerial effort and efficiency rather than a positive association between price and technical efficiency. This argument receives some additional support from the results for sawn timber and furniture manufacturing which fail to reveal significant relationships between technical and price inefficiency.
21 Pack (1976) makes this observation for Kenya, and White (1976) hypothesizes a significant association between capital intensity and X-inefficiency in Pakistan.

338 TECHNICAL EFFICIENCY AND ECONOMIC PERFORMANCE
5. Conclusions
This paper has explored the relationship between choice of technique, technical efficiency, and economic performance. Studies of distorted foreign trade regimes have, in general, focused on the costs engendered by distor- tions in the choice of technique and product, largely ignoring the relation- ship between technical or managerial inefficiency and increased social costs. The results of the preceding analysis suggest that the level of technical efficiency may be an equally important determinant of economic perfor- mance in developing countries.
It is unlikely that for most industries a change in relative factor prices can have much impact on current production methods. Equipment already in place is likely to have limited substitution potential and changes in relative factor prices will have their main effect on expansion and replacement decisions. In the short run the results suggest that substantial scope for improvement in the social performance of firms within existing industries may derive from programs to improve the technical efficiency of individual enterprises. Rudimentary attempts to explain the sources of technical effi- ciency indicate that efforts to increase the level of education of managers with regard to technical aspects of the production process, more intensive supervision of labor, and policies designed to increase the utilization of installed capacity should yield benefits in terms of improved performance and reduced social costs.
The results also have some interesting implications for project formulation and appraisal. Heretofore project analyses have explored the sensitivity of social profitability calculations to assumed product and factor accounting prices and to the level of capacity utilization, assuming constant levels of technical efficiency. Given the sensitivity of economic performance to varia- tions in technical efficiency, efforts should be directed as well toward determining the level and variability of technical efficiency in a project and to assessing the sensitivity of project returns to changes in these parameters.
Princeton University
REFERENCES
t. AIGNER, D. J. and CHU, S. F. 1968, "On Estimating the Industry Production Function," American Economic Review, 58, 826-39.
2. AIGNER, DENNIS, KNOX LOVELL C. A. and SCHMIDT PETER, 1977, "Formulation and Estimation of Stochastic Frontier Production Function Models," Journal of Econometrics, 6, 21-37.
3. BALASSA, Bela and Associates, 1971, The Structure of Protection in Developing Countries, Baltimore: Johns Hopkins University Press.
4. BERGSMAN, J., 1974, "Commercial Policy, Allocative and X-Efficiency," Quarterly Journal of Economics, 88, 409-33.

J. M. PAGE, JR. 339
5. BRUNO, MICHAEL, 1967, "The Optimal Selection of Export Promoting and Import Sub- stituting Projects," in Planning the External Sector: Techniques, Problems and Policies, New York: United Nations.
6. FARRELL, M. J., 1957, "The Measurement of Productive Efficiency," Journal of the Royal Statistical Society (ser. A, General), 120, 253-81.
7. FARRELL, M. J. and FIELDHOUJSE, M., 1962, "Estimating Efficient Production Functions Under Increasing Returns to Scale," Journal of the Royal Statistical Society (ser. A, General), 125, 252-67.
8. FORSYTH, D. J. C. and SOLOMON, R. F., 1977, "Nationality of Ownership and Choice of Technology in a Developing Country," Oxford Economic Papers (New Series), 29, 258-82.
9. GRILICHES, ZVI, 1957, "Specification Bias in Estimates of Production Functions," Journal of Farm Economics, 39, 8-20.
10. KRUEGER, ANNE O., 1966, "Some Economic Costs of Exchange Control: The Turkish Case," Journal of Political Economy, 74.
11. LIEBENSTEIN, HARVEY, 1966, "Allocative Efficiency vs. X-Efficiency," American Economic Review, 56, 382-415.
12. LIEBENSTEIN, HARVEY, 1977, "X-Efficiency, Technical Efficiency, and Incomplete Infor- mation Use: A Comment," Economic Development and Cultural Change, 25, 311-16.
13. LITTLE, I. M. D. and MIRRLEES, J. A., 1974, Project Appraisal and Planning for Developing Countries, London: Heineman Educational Books.
14. MORLEY, SAMUEL A. and SMITH, GORDON W., 1977, "The Choice of Technology: Multinational Firms in Brazil," Economic Development and Cultural Change, 25, 239-64.
15. PACK, HOWARD, 1974, "The Employment-Output Tradeoff in LDC's-A Microeconomnic Approach," Oxford Economic Papers (New Series), 26, 388-404.
16. PACK, HOWARD, 1976, "The Substitution of Labor for Capital in Kenyan Manufacturing," Economic Journal, 86, 45-58.
17. PAGE, JOHN M., 1976, "The Social Efficiency of the Timber Industries in Ghana," in I. M. D. Little and M. FG. Scott (eds.), Using Shadow Prices, London: Heineman Educational Books.
18. PAGE, JOHN M., 1979, "Technical Efficiency and Economic Performance: Some Evidence from Ghana," Princeton University Research Program in Development Studies Discussion Paper No. 85, April.
19. PEARSON, SCOTT R., 1976, "Net Social Profitability, Domestic Resource Costs, and Effective Rate of Protection," The Journal of Developnlent Studies, 12, 320-33.
20. RICHMOND, J., 1974, "Estimating the Efficiency of Production," International Economic Review, 15, 515-521.
21. SCHMIDT, P., 1976, "On the Statistical Estimation of Parametric Frontier Production Functions," Review of Economics and Statistics, 58, 238-239.
22. SCOTT, M. FG., 1974, "How to Use and Estimate Shadow Exchange Rates," Oxford Economic Papers, (New Series), 26, 169-189.
23. SHAPIRO, KENNETH H. and MULLER, JURGEN, 1977, "Sources of Techlical Efficiency: The Roles of Modernization and Information," Economic Development and Cultural Change, 25, 293-310.
24. STEEL, W. F., 1972, "Import Substitution and Excess Capacity in Ghana," Oxford Economic Papers (New Series), 24, 212-40.
25. TIMMER, C. PETER, 1971, "Using a Probabilistic Frontier Production Function to Measure Technical Efficiency," Journal of Political Economy, 79, 776-94.
26. TIMMER, C. PETER, 1970, "On Measuring Technical Efficiency," Food Research Institute Studies, 9, 99-171.
27. WHITE, LAWRENCE J., 1976, "Appropriate Technology, X-Efficiency, and a Competitive Environment: Some Evidence from Pakistan," The Quarterly Journal of Economics, 40, 575-90.