technical details of sample design i. sample …bos.gop.pk/system/files/appendix a-sample...
TRANSCRIPT
AP PEND IX -A275
SAMPLE DESIGN APPENDIX-A
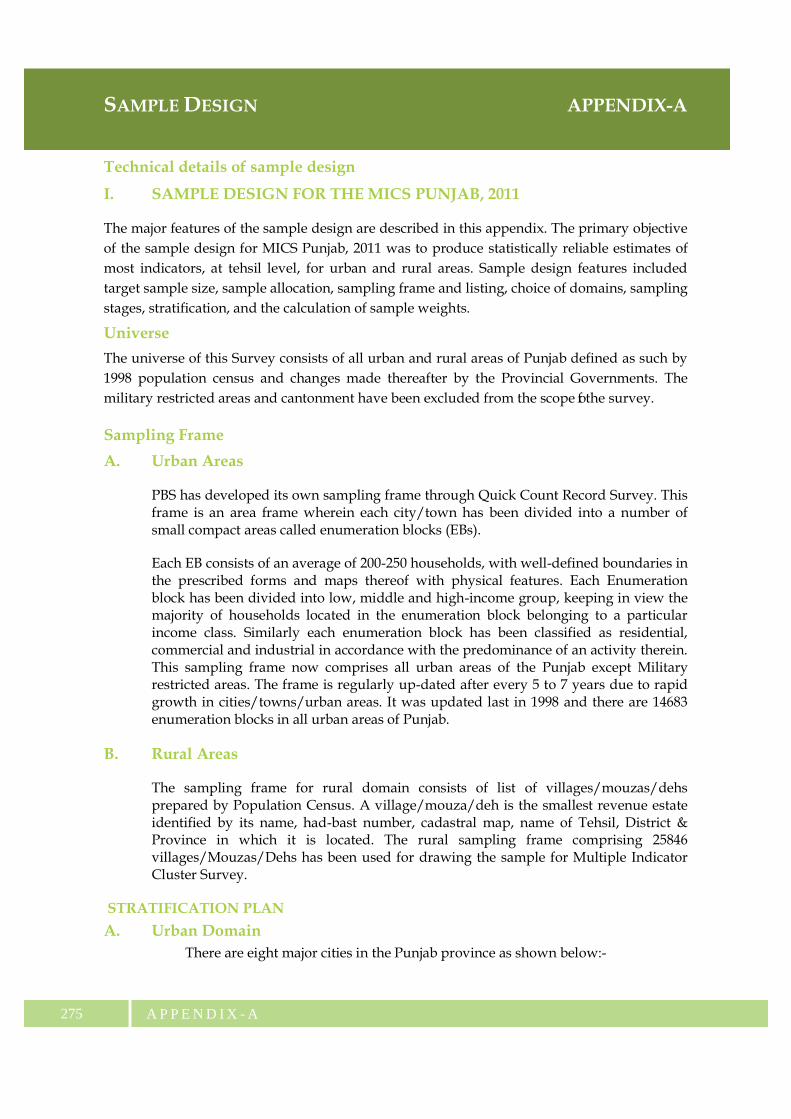
Technical details of sample design
I. SAMPLE DESIGN FOR THE MICS PUNJAB, 2011
The major features of the sample design are described in this appendix. The primary objective of the sample design for MICS Punjab, 2011 was to produce statistically reliable estimates of most indicators, at tehsil level, for urban and rural areas. Sample design features included target sample size, sample allocation, sampling frame and listing, choice of domains, sampling stages, stratification, and the calculation of sample weights.
Universe
The universe of this Survey consists of all urban and rural areas of Punjab defined as such by 1998 population census and changes made thereafter by the Provincial Governments. The military restricted areas and cantonment have been excluded from the scope of the survey.
Sampling Frame
A. Urban Areas
PBS has developed its own sampling frame through Quick Count Record Survey. This frame is an area frame wherein each city/town has been divided into a number of small compact areas called enumeration blocks (EBs).
Each EB consists of an average of 200-250 households, with well-defined boundaries in the prescribed forms and maps thereof with physical features. Each Enumeration block has been divided into low, middle and high-income group, keeping in view the majority of households located in the enumeration block belonging to a particular income class. Similarly each enumeration block has been classified as residential, commercial and industrial in accordance with the predominance of an activity therein. This sampling frame now comprises all urban areas of the Punjab except Military restricted areas. The frame is regularly up-dated after every 5 to 7 years due to rapid growth in cities/towns/urban areas. It was updated last in 1998 and there are 14683 enumeration blocks in all urban areas of Punjab.
B. Rural Areas
The sampling frame for rural domain consists of list of villages/mouzas/dehs prepared by Population Census. A village/mouza/deh is the smallest revenue estate identified by its name, had-bast number, cadastral map, name of Tehsil, District & Province in which it is located. The rural sampling frame comprising 25846 villages/Mouzas/Dehs has been used for drawing the sample for Multiple Indicator Cluster Survey.
STRATIFICATION PLAN
A. Urban Domain There are eight major cities in the Punjab province as shown below:-

AP PEND IX -A 276
City Approximate Population
1. Lahore 5,000,000 2. Faisalabad 2,000,000 3. Rawalpindi 1,500,000 4. Gujranwala 1,210,000 5. Multan 1,180,000 6. Sargodha 455,000 7. Sialkot 417,000 8. Bahawalpur 404,000
All the major cities were further subdivided into towns except Sargodha, Sialkot and Bahawalpur. Each of these towns/tehsils constitutes a separate stratum. The smallest domain of estimation is tehsil/town.
B. Rural Domain
In the rural domain, each administrative tehsil and some towns in big cities in Punjab Province constituted separate and an independent stratum. The sample selection has been undertaken separately within each rural part of corresponding tehsils/towns.
Sample size and its Allocation:
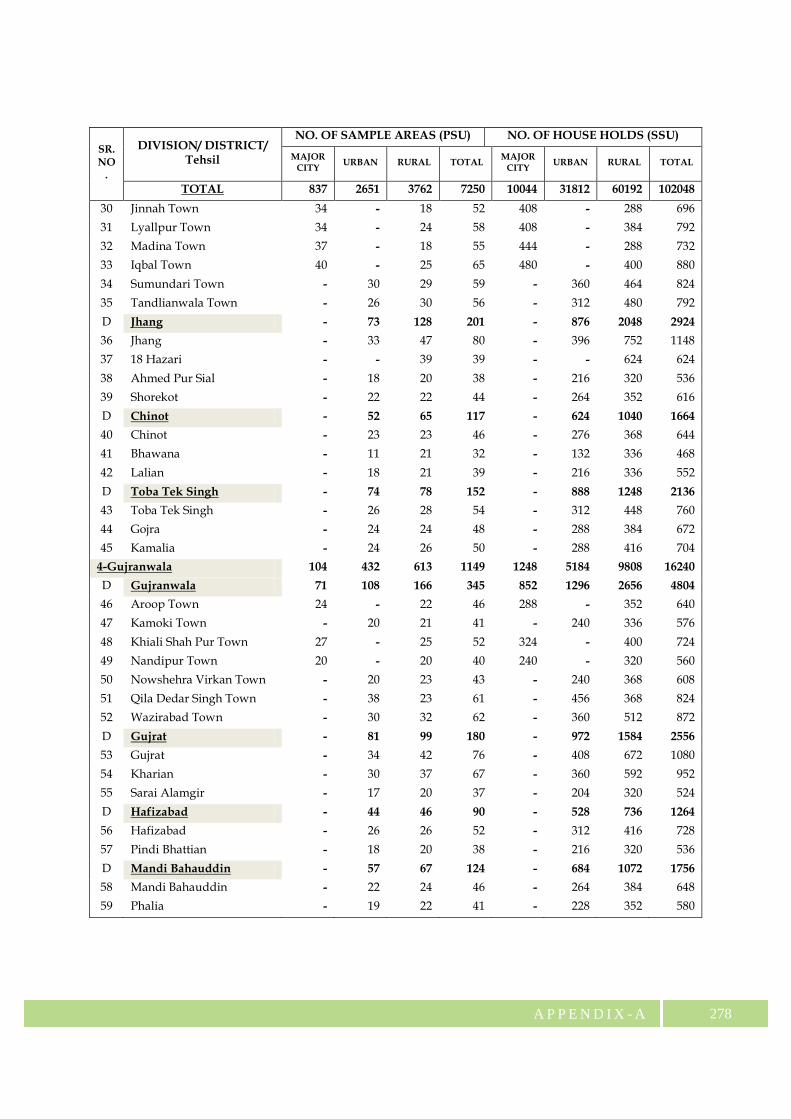
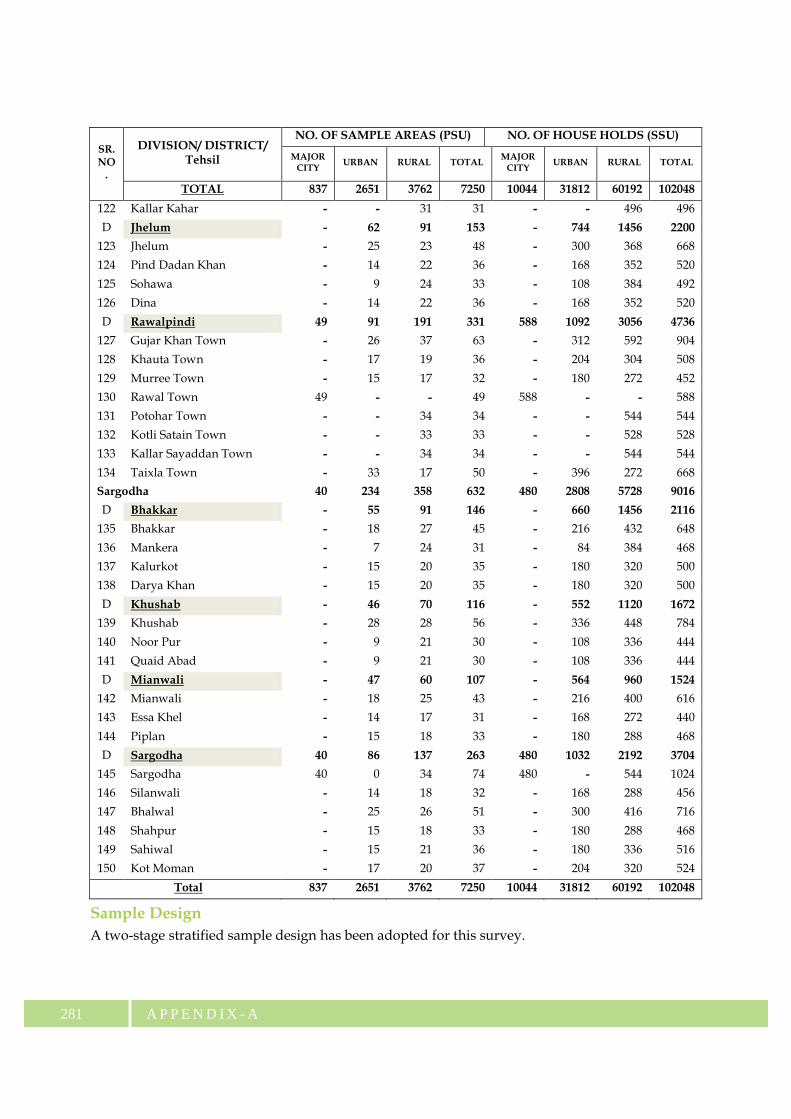
Keeping in view of the variability for the characteristics for which estimates are to be prepared, requirements of provincial government in terms of logistic cost, population distribution and main objectives of the survey, a sample of 102048 households has been considered appropriate to provide reliable estimates of population parameters within acceptable reliability limits. This sample size is capable to yield estimates of literacy related variable at 95% of confidence level at 5% margin of error. Meanwhile, for other variables like child mortality, net primary school attendance, contraceptive prevalence and use of improved water and sanitation etc. Coefficient of variation (CV) will be expected about 8%. The entire sample of households, i.e., Secondary Sampling Units (SSUs) is drawn from 7249 Primary Sampling Units (PSUs) out of which 3488 are urban and 3761 are rural. The sample households have been allocated to 150 domains i.e., tehsils/towns in proportion to their population according to the 1998 population census with adjustment. The distribution of sample (PSUs & SSUs) in 150 tehsil/towns is given in the table below:

A P P E N D I X - A277
NUMBER OF SAMPLE EBs AND VILLAGES FOR MICS PUNJAB, 2011
SR. NO.
DIVISION/ DISTRICT/ Tehsil
NO. OF SAMPLE AREAS (PSU) NO. OF HOUSE HOLDS (SSU)
MAJOR CITY
URBAN RURAL TOTAL MAJOR
CITY URBAN RURAL TOTAL
TOTAL 837 2651 3762 7250 10044 31812 60192 102048
1-Bahawalpur 24 323 442 789 288 3876 7072 11236
D Bahawalnagar - 98 117 215 - 1176 1872 3048
1 Bahawalnagar - 24 27 51 - 288 432 720
2 Haroonabad - 18 20 38 - 216 320 536
3 Minchinabad - 18 21 39 - 216 336 552
4 Chishtian - 23 26 49 - 276 416 692
5 Fort Abbas - 15 23 38 - 180 368 548
D Bahawalpur 24 101 168 293 288 1212 2688 4188
6 Bahawalpur City 24 - 21 45 288 - 336 624
7 Bahawalpur Sadar - 17 20 37 - 204 320 524
8 Hasil Pur - 18 21 39 - 216 336 552
9 Khair Pur Tamewali - 17 20 37 - 204 320 524
10 Yazman - 19 53 72 - 228 848 1076
11 Ahmed Pue East - 30 33 63 - 360 528 888
D Rahim Yar Khan - 124 157 281 - 1488 2512 4000
12 Rahim Yar Khan - 37 39 76 - 444 624 1068
13 Khan Pur - 32 34 66 - 384 544 928
14 Sadiqabad - 35 38 73 - 420 608 1028
15 Liaqat Pur - 20 46 66 - 240 736 976
2-D.G Khan - 248 368 616 - - 5888 8864
D D.G.Khan - 54 72 126 - 648 1152 1800
16 Dera Ghazi Khan - 34 51 85 - 408 816 1224
17 Tounsa - 20 21 41 - 240 336 576
D Layyah - 44 94 138 - 528 1504 2032
18 Layyah - 26 32 58 - 312 512 824
19 Karore Lal Esan - 18 27 45 - 216 432 648
20 Choubara - 0 35 35 - - 560 560
D Muzaffargarh - 102 121 223 - 1224 1936 3160
21 Muzaffargarh - 36 40 76 - 432 640 1072
22 Kot Adu - 30 35 65 - 360 560 920
23 Ali Pur - 15 24 39 - 180 384 564
24 Jatoi - 21 22 43 - 252 352 604
D Rajanpur - 48 81 129 - 576 1296 1872
25 Rajanpur - 20 28 48 - 240 448 688
26 Jampur - 23 27 50 - 276 432 708
27 Rojhan - 5 26 31 - 60 416 476 3-Faisalabad 145 317 470 932 1740 3804 7520 13064
D Faisalabad 145 118 199 462 1740 1416 3184 6340
28 Chak Jhumra Town - 23 20 43 - 276 320 596
29 Jaranwala Town - 39 35 74 - 468 560 1028
A P P E N D I X - A 278
SR. NO
.
DIVISION/ DISTRICT/ Tehsil
NO. OF SAMPLE AREAS (PSU) NO. OF HOUSE HOLDS (SSU)
MAJOR CITY
URBAN RURAL TOTAL MAJOR
CITY URBAN RURAL TOTAL
TOTAL 837 2651 3762 7250 10044 31812 60192 102048
30 Jinnah Town 34 - 18 52 408 - 288 696
31 Lyallpur Town 34 - 24 58 408 - 384 792
32 Madina Town 37 - 18 55 444 - 288 732
33 Iqbal Town 40 - 25 65 480 - 400 880
34 Sumundari Town - 30 29 59 - 360 464 824
35 Tandlianwala Town - 26 30 56 - 312 480 792
D Jhang - 73 128 201 - 876 2048 2924
36 Jhang - 33 47 80 - 396 752 1148
37 18 Hazari - - 39 39 - - 624 624
38 Ahmed Pur Sial - 18 20 38 - 216 320 536
39 Shorekot - 22 22 44 - 264 352 616
D Chinot - 52 65 117 - 624 1040 1664
40 Chinot - 23 23 46 - 276 368 644
41 Bhawana - 11 21 32 - 132 336 468
42 Lalian - 18 21 39 - 216 336 552
D Toba Tek Singh - 74 78 152 - 888 1248 2136
43 Toba Tek Singh - 26 28 54 - 312 448 760
44 Gojra - 24 24 48 - 288 384 672
45 Kamalia - 24 26 50 - 288 416 704
4-Gujranwala 104 432 613 1149 1248 5184 9808 16240
D Gujranwala 71 108 166 345 852 1296 2656 4804
46 Aroop Town 24 - 22 46 288 - 352 640
47 Kamoki Town - 20 21 41 - 240 336 576
48 Khiali Shah Pur Town 27 - 25 52 324 - 400 724
49 Nandipur Town 20 - 20 40 240 - 320 560
50 Nowshehra Virkan Town - 20 23 43 - 240 368 608
51 Qila Dedar Singh Town - 38 23 61 - 456 368 824
52 Wazirabad Town - 30 32 62 - 360 512 872
D Gujrat - 81 99 180 - 972 1584 2556
53 Gujrat - 34 42 76 - 408 672 1080
54 Kharian - 30 37 67 - 360 592 952
55 Sarai Alamgir - 17 20 37 - 204 320 524
D Hafizabad - 44 46 90 - 528 736 1264
56 Hafizabad - 26 26 52 - 312 416 728
57 Pindi Bhattian - 18 20 38 - 216 320 536
D Mandi Bahauddin - 57 67 124 - 684 1072 1756
58 Mandi Bahauddin - 22 24 46 - 264 384 648
59 Phalia - 19 22 41 - 228 352 580
A P P E N D I X - A279
SR. NO
.
DIVISION/ DISTRICT/ Tehsil
NO. OF SAMPLE AREAS (PSU) NO. OF HOUSE HOLDS (SSU)
MAJOR CITY
URBAN RURAL TOTAL MAJOR
CITY URBAN RURAL TOTAL
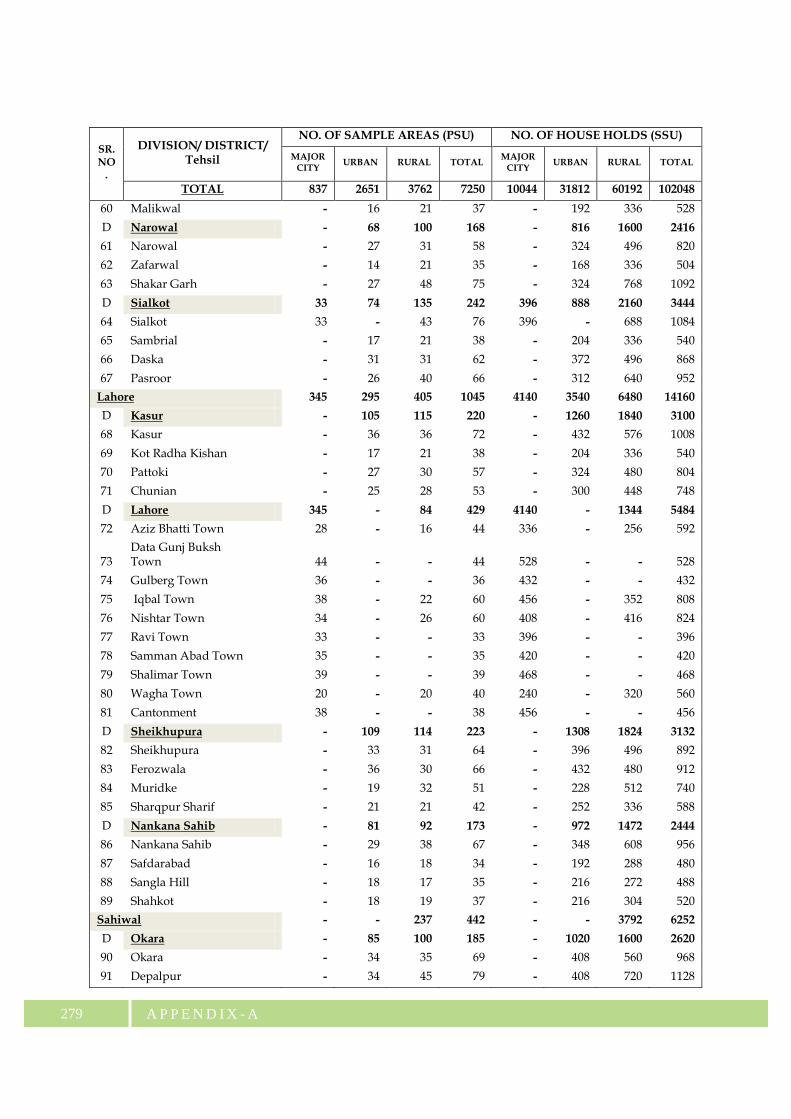
TOTAL 837 2651 3762 7250 10044 31812 60192 102048
60 Malikwal - 16 21 37 - 192 336 528
D Narowal - 68 100 168 - 816 1600 2416
61 Narowal - 27 31 58 - 324 496 820
62 Zafarwal - 14 21 35 - 168 336 504
63 Shakar Garh - 27 48 75 - 324 768 1092
D Sialkot 33 74 135 242 396 888 2160 3444
64 Sialkot 33 - 43 76 396 - 688 1084
65 Sambrial - 17 21 38 - 204 336 540
66 Daska - 31 31 62 - 372 496 868
67 Pasroor - 26 40 66 - 312 640 952 Lahore 345 295 405 1045 4140 3540 6480 14160
D Kasur - 105 115 220 - 1260 1840 3100
68 Kasur - 36 36 72 - 432 576 1008
69 Kot Radha Kishan - 17 21 38 - 204 336 540
70 Pattoki - 27 30 57 - 324 480 804
71 Chunian - 25 28 53 - 300 448 748
D Lahore 345 - 84 429 4140 - 1344 5484
72 Aziz Bhatti Town 28 - 16 44 336 - 256 592
73 Data Gunj Buksh Town 44 - - 44 528 - - 528
74 Gulberg Town 36 - - 36 432 - - 432
75 Iqbal Town 38 - 22 60 456 - 352 808
76 Nishtar Town 34 - 26 60 408 - 416 824
77 Ravi Town 33 - - 33 396 - - 396
78 Samman Abad Town 35 - - 35 420 - - 420
79 Shalimar Town 39 - - 39 468 - - 468
80 Wagha Town 20 - 20 40 240 - 320 560
81 Cantonment 38 - - 38 456 - - 456
D Sheikhupura - 109 114 223 - 1308 1824 3132
82 Sheikhupura - 33 31 64 - 396 496 892
83 Ferozwala - 36 30 66 - 432 480 912
84 Muridke - 19 32 51 - 228 512 740
85 Sharqpur Sharif - 21 21 42 - 252 336 588
D Nankana Sahib - 81 92 173 - 972 1472 2444
86 Nankana Sahib - 29 38 67 - 348 608 956
87 Safdarabad - 16 18 34 - 192 288 480
88 Sangla Hill - 18 17 35 - 216 272 488
89 Shahkot - 18 19 37 - 216 304 520 Sahiwal - - 237 442 - - 3792 6252
D Okara - 85 100 185 - 1020 1600 2620
90 Okara - 34 35 69 - 408 560 968
91 Depalpur - 34 45 79 - 408 720 1128
A P P E N D I X - A 280
SR. NO
.
DIVISION/ DISTRICT/ Tehsil
NO. OF SAMPLE AREAS (PSU) NO. OF HOUSE HOLDS (SSU)
MAJOR CITY
URBAN RURAL TOTAL MAJOR
CITY URBAN RURAL TOTAL
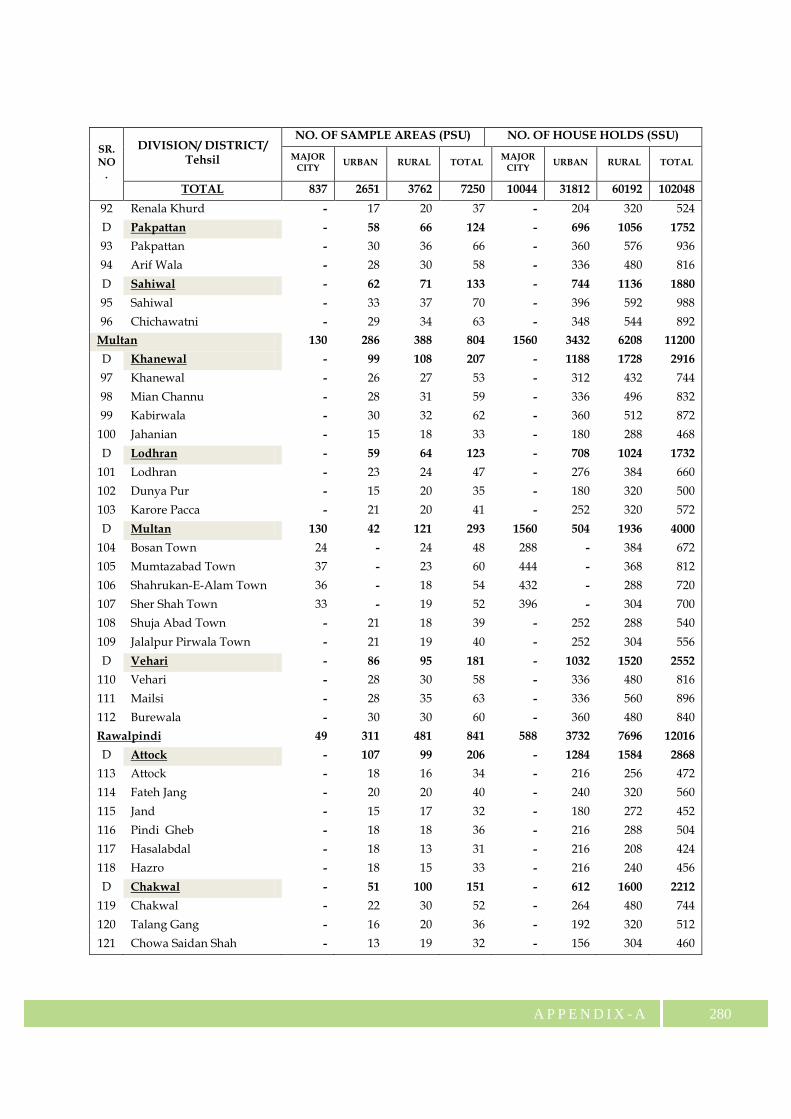
TOTAL 837 2651 3762 7250 10044 31812 60192 102048
92 Renala Khurd - 17 20 37 - 204 320 524
D Pakpattan - 58 66 124 - 696 1056 1752
93 Pakpattan - 30 36 66 - 360 576 936
94 Arif Wala - 28 30 58 - 336 480 816
D Sahiwal - 62 71 133 - 744 1136 1880
95 Sahiwal - 33 37 70 - 396 592 988
96 Chichawatni - 29 34 63 - 348 544 892 Multan 130 286 388 804 1560 3432 6208 11200
D Khanewal - 99 108 207 - 1188 1728 2916
97 Khanewal - 26 27 53 - 312 432 744
98 Mian Channu - 28 31 59 - 336 496 832
99 Kabirwala - 30 32 62 - 360 512 872
100 Jahanian - 15 18 33 - 180 288 468
D Lodhran - 59 64 123 - 708 1024 1732
101 Lodhran - 23 24 47 - 276 384 660
102 Dunya Pur - 15 20 35 - 180 320 500
103 Karore Pacca - 21 20 41 - 252 320 572
D Multan 130 42 121 293 1560 504 1936 4000
104 Bosan Town 24 - 24 48 288 - 384 672
105 Mumtazabad Town 37 - 23 60 444 - 368 812
106 Shahrukan-E-Alam Town 36 - 18 54 432 - 288 720
107 Sher Shah Town 33 - 19 52 396 - 304 700
108 Shuja Abad Town - 21 18 39 - 252 288 540
109 Jalalpur Pirwala Town - 21 19 40 - 252 304 556
D Vehari - 86 95 181 - 1032 1520 2552
110 Vehari - 28 30 58 - 336 480 816
111 Mailsi - 28 35 63 - 336 560 896
112 Burewala - 30 30 60 - 360 480 840
Rawalpindi 49 311 481 841 588 3732 7696 12016
D Attock - 107 99 206 - 1284 1584 2868
113 Attock - 18 16 34 - 216 256 472
114 Fateh Jang - 20 20 40 - 240 320 560
115 Jand - 15 17 32 - 180 272 452
116 Pindi Gheb - 18 18 36 - 216 288 504
117 Hasalabdal - 18 13 31 - 216 208 424
118 Hazro - 18 15 33 - 216 240 456
D Chakwal - 51 100 151 - 612 1600 2212
119 Chakwal - 22 30 52 - 264 480 744
120 Talang Gang - 16 20 36 - 192 320 512
121 Chowa Saidan Shah - 13 19 32 - 156 304 460
AP PEND IX -A281
SR. NO
.
DIVISION/ DISTRICT/ Tehsil
NO. OF SAMPLE AREAS (PSU) NO. OF HOUSE HOLDS (SSU)
MAJOR CITY
URBAN RURAL TOTAL MAJOR
CITY URBAN RURAL TOTAL
TOTAL 837 2651 3762 7250 10044 31812 60192 102048
122 Kallar Kahar - - 31 31 - - 496 496
D Jhelum - 62 91 153 - 744 1456 2200
123 Jhelum - 25 23 48 - 300 368 668
124 Pind Dadan Khan - 14 22 36 - 168 352 520
125 Sohawa - 9 24 33 - 108 384 492
126 Dina - 14 22 36 - 168 352 520
D Rawalpindi 49 91 191 331 588 1092 3056 4736
127 Gujar Khan Town - 26 37 63 - 312 592 904
128 Khauta Town - 17 19 36 - 204 304 508
129 Murree Town - 15 17 32 - 180 272 452
130 Rawal Town 49 - - 49 588 - - 588
131 Potohar Town - - 34 34 - - 544 544
132 Kotli Satain Town - - 33 33 - - 528 528
133 Kallar Sayaddan Town - - 34 34 - - 544 544
134 Taixla Town - 33 17 50 - 396 272 668 Sargodha 40 234 358 632 480 2808 5728 9016
D Bhakkar - 55 91 146 - 660 1456 2116
135 Bhakkar - 18 27 45 - 216 432 648
136 Mankera - 7 24 31 - 84 384 468
137 Kalurkot - 15 20 35 - 180 320 500
138 Darya Khan - 15 20 35 - 180 320 500
D Khushab - 46 70 116 - 552 1120 1672
139 Khushab - 28 28 56 - 336 448 784
140 Noor Pur - 9 21 30 - 108 336 444
141 Quaid Abad - 9 21 30 - 108 336 444
D Mianwali - 47 60 107 - 564 960 1524
142 Mianwali - 18 25 43 - 216 400 616
143 Essa Khel - 14 17 31 - 168 272 440
144 Piplan - 15 18 33 - 180 288 468
D Sargodha 40 86 137 263 480 1032 2192 3704
145 Sargodha 40 0 34 74 480 - 544 1024
146 Silanwali - 14 18 32 - 168 288 456
147 Bhalwal - 25 26 51 - 300 416 716
148 Shahpur - 15 18 33 - 180 288 468
149 Sahiwal - 15 21 36 - 180 336 516
150 Kot Moman - 17 20 37 - 204 320 524
Total 837 2651 3762 7250 10044 31812 60192 102048
Sample Design A two-stage stratified sample design has been adopted for this survey.

A P P E N D I X - A 282
Enumeration blocks demarcated as part of urban sampling frame in urban domain, mouzas/dehs/villages whose lists were prepared by Population Census Organization at the time of 1998 Population Census have been taken as PSUs. Sample PSUs from each stratum/sub-stratum have been selected with probability proportionate to size. The numbers of households and population have been considered as measure of size pertaining to urban and rural domain respectively.
Selection of Secondary Sampling Units
Based on actual listing undertaking in respect of each sample PSU by the Field Staff 16 and 12 households have been selected from rural and urban sample areas respectively adopting systematic sampling technique with a random start. Households have been considered as secondary sampling units for urban while population has been taken as measure of size in respect to rural areas.
Procedure to Select Housing Units
Whatever the distribution of sample Enumeration Blocks (EBs) in the different substrata might be, the selection of Housing Units (HUs) (or dwelling units, as were defined above), will follow the same procedure in all substrata.
If the sample will be spread during a one-year period, each week, the sampler will have at his/ her disposal the Listing Form (obtained after the listing operation) pertaining to the corresponding updated sample EBs for the corresponding period. A fixed number of valid HUs (12 in the urban area, 16 in the rural area) will be selected systematically and with equal probability from the Listing Form
In general, it is good practice to select reserve units in case there are no responses or refusals to keep the actual sample size. However, in Pakistan, the response rate is very high (almost 99% in the MICS Punjab, 2007-08) and therefore, it will not be necessary to select reserve units. Within each sample EB i of socioeconomic substratum h, we must identify and number the valid HUs, that is, the HUs that are occupied by one household on a permanent basis. They must have a correlative number between 1 and M'hi, the total number of valid HUs in the EB i and socioeconomic substratum h, after having listed the EB. The value M'hi will then be inserted in a spreadsheet from where a systematic sample of 12 units (16 in the urban area) will be selected.
The j-th HU to be selected within the EB i of socioeconomic substratum h is obtained during the following expression:
[Ahi+ (j–1) * Ihi] + 1 for j = 1,..., mhi
omitting the decimals in the results, without rounding (truncation process).where, Ihi = M'hi/mhi = sampling interval within the i-th EB and socioeconomic
stratum h. M'hi = number of valid HUs in the i-th EB of socioeconomic stratum h. Mhi = m = fixed number of HUs to be selected within the i-th EB and
socioeconomic stratum h. Ahi = a random number between 0 and Ihi, including 0 but excluding Ihi
Selection of Primary Sampling Units

AP PEND IX -A283
ESTIMATION PROCEDURE ADOPTED FOR MICS PUNJAB, 2011II
Probabilities of Selection and Sampling Weights
In order to expand the data from the MICS Punjab, 2011 to the provincial or domain levels(tehsils), it is necessary to apply a weight (expansion factor) to the data from each surveyquestionnaire. The basic weight for a sample household would be equal to the inverse of theits probability of selection. Since the Ebs will be selected independently with probabilityproportional to size (PPS) within each domain of estimation, the probability of selection of anEB is given by:

A P P E N D I X - A 284
NOTATIONS
ESTIMATION FORMULAE FOR TOTALS AND THEIR VARIANCES(i):

A P P E N D I X - A 285
FORMULA FOR RATIO ESTIMATES(ii):