technical assistance final report€¦ · bvf bulk volume fermenter (proprietary technology of adi...
TRANSCRIPT
Technical Assistance Final Report
Project Number: 43251-012 Technical Assistance Number: 7993 August 2013
Republic of Indonesia: Metropolitan Sanitation
Management Investment Project
Prepared by Lahmeyer IDP Consult Inc. in association with P.T. Bina Asih Consultants, Indonesia and P.T. Dwikarsa Envacotama, Indonesia for the Asian Development Bank. This report is a document of the borrower. The views expressed herein do not necessarily represent those of ADB's Board of Directors, Management, or staff, and may be preliminary in nature. Your attention is directed to the “terms of use” section of this website. In preparing any country program or strategy, financing any project, or by making any designation of or reference to a particular territory or geographic area in this document, the Asian Development Bank does not intend to make any judgments as to the legal or other status of any territory or area.

Asian Development Bank
����������������� ���
������������������� ����������������������
FINAL REPORT MAIN REPORT (UPDATED)
��� ���������
��������������������� �
�����������!����
� " �#���������������$��%�����
� " ��!�&���'�����$��%������

Table of Contents
I. Executive Summary......................................................................................................................1
A. Availability of land for the WWTP…………………………………………………………………… 1
B. Technical and Costings review of the WWTP……………………………………………………... 2
C. Costings review for the planned wastewater collection systems for the Cities………………… 2
D. Review of the Financial Analysis for the Sub-Projects…………………………………………… 3
E. Review of the Economic Analysis for the Sub-Projects………………………………………….. 4
F. Review of Social, Gender and Poverty Analysis for the Sub-Project Areas……………………. 4
G. Review of Resettlement requirements for the Sub-Projects…………………………………….. 5
H. Review of Environmental Safeguards Studies for the Subprojects…………………………….. 5
I. Institutional Proposals for the Operation of the Sub-Projects…………………………………… 6
J. Detailed Engineering Design proposals…………………………………………………………….. 8
K. Procurement and Consulting Services…………………………………………………………….. 9
L. Potential Loan Amount……………………………………………………………………………….. 11
II. Introduction .................................................................................................................................13
A. Background to Proposed Project……………………………………………………………………. 13
B. Background to the Preparation of this Report……………………………………………………... 14
C. Scope of Report………………………………………………………………………………………. 14
D. Objectives……………………………………………………………………………………………… 15
E. Report Structure………………………………………………………………………………………. 15
III. Cimahi City Off-site Wastewater Collection System and Treatment....................................16
A. Cimahi Physical Setting……………………………………………………………………………… 16
B. Rationale for Selection of Priority Projects………………………………………………………… 17
C. Proposed Wastewater Collection System………………………………………………………….. 18
D. Proposed Waste Water Treatment Plant…………………………………………………………... 20
E. Cost Estimates and Implementation Schedule……………………………………………………. 24
F. Financial Analysis…………………………………………………………………………………….. 27
G. Economic Analysis…………………………………………………………………………………… 39
H. Gender Analysis and Gender Action Plan…………………………………………………………. 42
I. Poverty and Social Analysis…………………………………………………………………………. 49
J. Social Safeguard Studies – Involuntary Resettlement…………………………………………… 57
K. Environmental Safeguards Study…………………………………………………………………… 58
L. Cimahi Institutional Proposals………………………………………………………………………. 62
IV. Jambi City Off-site Wastewater Collection System and Treatment.....................................68
A. Jambi Physical Setting……………………………………………………………………………….. 68
B. Rationale for Selection of Priority Projects…………………………………………………………. 70
C. Proposed Wastewater Collection System…………………………………………………………. 71
D. Proposed Waste Water Treatment Plant…………………………………………………………... 73
E. Cost Estimates and Implementation Schedule…………………………………………………… 77
F. Financial Analysis…………………………………………………………………………………….. 79
G. Economic Analysis…………………………………………………………………………………… 91

H. Gender Analysis and Gender Action Plan…………………………………………………………. 94
I. Poverty and Social Analysis…………………………………………………………………………. 100
J. Social Safeguard Studies – Involuntary Resettlement……………………………………………. 110
K. Environmental Safeguards Study…………………………………………………………………… 110
L. Institutional Proposals………………………………………………………………………………… 114
V. Makassar, Losari Off-site Wastewater Collection System and Treatment........................120
A. Makassar, Losari Physical Setting………………………………………………………………….. 120
B. Rationale for Selection of Priority Projects…………………………………………………………. 121
C. Proposed Wastewater Collection System………………………………………………………….. 122
D. Proposed Waste Water Treatment Plant…………………………………………………………... 124
F. Financial Analysis…………………………………………………………………………………….. 130
G. Economic Analysis…………………………………………………………………………………… 142
H. Gender Analysis and Gender Action Plan…………………………………………………………. 145
I. Poverty and Social Analysis…………………………………………………………………………. 150
J. Social Safeguard Studies – Involuntary Resettlement……………………………………………. 157
K. Environmental Safeguards Study…………………………………………………………………… 157
L. Makassar Institutional Proposals……………………………………………………………………. 161
VI. Palembang City Off-site Wastewater Collection System and Treatment..........................168
A. Palembang Physical Setting…………………………………………………………………………. 168
B. Rationale for Selection of Priority Projects………………………………………………………… 171
C. Proposed Wastewater Collection System………………………………………………………….. 171
D. Proposed Waste Water Treatment Plant………………………………………………………….. 173
E. Cost Estimates and Implementation Schedule……………………………………………………. 178
F. Financial Analysis…………………………………………………………………………………….. 182
G. Economic Analysis…………………………………………………………………………………… 197
H. Gender Analysis and Gender Action Plan…………………………………………………………. 200
I. Poverty and Social Analysis………………………………………………………………………….. 207
J. Social Safeguard Studies – Involuntary Resettlement……………………………………………. 214
K. Environmental Safeguards Study…………………………………………………………………… 214
L. Palembang Institutional Proposals………………………………………………………………….. 218
VII. Pekanbaru City Off-site Wastewater Collection System and Treatment..........................226
A. Pekanbaru Physical Setting………………………………………………………………………… 226
B. Rationale for Selection of Priority Projects………………………………………………………… 229
C. Proposed Wastewater Collection System…………………………………………………………. 229
D. Proposed Waste Water Treatment Plant…………………………………………………………... 232
E. Cost Estimates and Implementation Schedule……………………………………………………. 235
F. Financial Analysis…………………………………………………………………………………….. 238
G. Economic Analysis…………………………………………………………………………………… 250
H. Gender Analysis and Gender Action Plan…………………………………………………………. 254
I. Poverty and Social Analysis…………………………………………………………………………. 260
J. Social Safeguard Studies – Involuntary Resettlement……………………………………………. 269
K. Environmental Safeguards Study…………………………………………………………………… 270

L. Pekanbaru Institutional Proposals………………………………………………………………….. 276
VIII. Summary of Institutional Proposals for Operation............................................................283
A. Project Implementation………………………………………………………………………………. 283
B. Proposed Institutional Arrangements for Operation………………………………………………. 285
C. Institutional Development and Capacity Development Component…………………………….. 290
D. Project Readiness of the Cities……………………………………………………………………… 292
IX. Sanitation Promotion and Public Awareness Campaign Plan ...........................................294
A. Waste Water and Sanitation Conditions in Indonesia and in MSMIP Cities…………………… 296
B. Media Role in Sanitation Improvement and Perception of the Project………………………….. 304
C. Target Audiences for Public Awareness…………………………………………………………… 306
D. Framework for Community Education and Public Awareness………………………………….. 310
E. Principles in Implementing Community Education and Public Awareness Strategy………….. 312
F. Phases and Activities of Public Awareness……………………………………………………….. 315
G. Monitoring and Evaluation…………………………………………………………………………… 337
H. Budget…………………………………………………………………………………………………. 337
X. Implementation Arrangements ..............................................................................................340
A.Proposed Institutional Arrangements for Project Implementation……………………… 340
B. Implementation Plan…………………………………………………………………………………. 348
C. Investment and Financing Plan…………………………………………………………………….. 349
D.Procurement Plan……………………………………………………………………………………... 350
E. Consulting services…………………………………………………………………………………… 362

LIST OF ANNEXES Annex Document A - TECHNICAL
1. CIMAHI Wastewater Collection System 2. JAMBI Wastewater Collection System 3. MAKASSAR LOSARI Wastewater Collection System 4. PALEMBANG Wastewater Collection System 5. PEKANBARU Wastewater Collection System 6. Final MSMIP Technical Review - CIMAHI 7. Final MSMIP Technical Review -JAMBI 8. Final MSMIP Technical Review - MAKASSAR LOSARI 9. Final MSMIP Technical Review - PALEMBANG 10. Final MSMIP Technical Review - PEKANBARU 11. CIMAHI – Financing Paln and Implementation Schedules 12. JAMBI - Financing Paln and Implementation Schedules 13. MAKASSAR LOSARI - Financing Paln and Implementation Schedules 14. PALEMBANG - Financing Paln and Implementation Schedules 15. PEKANBARU - Financing Paln and Implementation Schedules
Annex Document B - FINANCIAL AND ECONOMIC ANALYSIS
1. FINANCIAL ANALYSIS A. Introduction
B. Methodology and Assumptions C. Affordability of Fees D. Results of Financial Analysis E. Project Financial Sustainability and Implementation Risks
2. ECONOMIC ANALYSIS A. Introduction B. Macroeconomic and Sector Context C. Economic rationale of the Project D. Basic Approach and assumptions in Economic Analysis E. Economic Costs and Benefits
Annex Document C - GENDER ANALYSIS AND GENDER ACTION PLAN 1. Gender Analysis and Action Plan Background Issues a. Analysis of Problems and Opportunities b. Mitigation Measures and Gender Mainstreaming Strategies c. Implementation arrangements d. Monitoring and Evaluation e. Gender Action Plan Framework f. Subproject Gender Action Plan Content Outline Annex Document D - POVERTY AND SOCIAL ANALYSIS
1. Poverty and Social Analysis 2. Summary Population Characteristics of Project Sites
Annex Document E - SOCIAL STAKEHOLDER CONSULTATIONS 1. Summary of Stakeholder Consultations 2. Attendance List of Stakeholders Consultation
Annex Document F - SOCIAL SAFEGUARDS STUDIES – INVOLUNTARY RESETTLEMENT
1. Land Acquisition and Resettlement Plan – Cimahi 2. Due Diligence Report - Jambi

3. Due Diligence Report - Makassar 4. Land Acquisition and Resettlement Plan - Palembang 5. Land Acquisition and Resettlement Plan – Pekanbaru 6. Summary of IR Impacts and Mitigation Measures 7. Public Information Booklet
8. Comparison of Land Acquisition and Involuntary Resettlement Policies 9. Entitlement Matrix
Annex Document G - ENVIRONMENTAL SAFEGUARDS STUDIES
1. CIMAHI IEE and Rapid Environmental Assessment (REA) Checklist 2. JAMBI IEE and Rapid Environmental Assessment (REA) Checklist 3. MAKASSAR LOSARI IEE and Rapid Environmental Assessment (REA) Checklist 4. PALEMBANG IEE and Rapid Environmental Assessment (REA) Checklist 5. PEKANBARU IEE and Rapid Environmental Assessment (REA) Checklist
Annex Document H - INSTITUTIONAL Summary of Institutional Proposals for Operation
1. WWIMP Capacity Building Approaches 2. Central Laws and Regulations 3. SDO Selection 4. Outline Terms of Reference for CDTA Consultants 5. Proposed Utility Management Workshop Outlines 6. Cost Estimate for CDTA Consultancy 7. Cimahi Institutional Report 8. Jambi Institutional Report 9. Makassar Institutional Report 10. Palembang Institutional Report 11. Pekanbaru Institutional Report
Annex Document I - GENERAL 1. Sanitation Working Group, Status and On-going Public Awareness Campaigns 2. MSMIP Stakeholder Communication Strategy 3. Draft Workplan for Public Awareness Campaign 4. Indicative Budget Public Awareness Campaign MSMI Project 5. Abbreviations and Acronyms 6. Consultation and Participation Plan 7. Institutional Arrangements
Annex Document J – PISC TOR 1. Terms of reference for MSMIP Project Implementation Support Consultants (PISC)
ACRONYMS – GENERAL
ADB Asian Development Bank
APs affected persons
BAPPEDA Regional Development Planning Agency
BAPPENAS National Planning Agency
BLH or BLHD Environmental Agency or Regional Environmental Agency
BPHTB Acquisition Tax for Land and Building Rights (Bea Perolehan
Hak Atas Tanah dan Bangunan)
CSS City Sanitation Strategy
DAK Special Allocation Fund (Dana Alokasi Khusus)
DAU Public Allocation Fund (Dana Alokasi Umum)
DGHS
DKP
Directorate General of Human Settlements
Cleanliness and Parks Agency
EMP Environmental Management Plan
ESAR Environmental and Social Appraisal Report
FIRR financial internal rate of return
FMA financial management assessment (FMA)
FOPIP Financial & Organizational Performance Improvement Plan
GOI Government of Indonesia
IndII Indonesia Infrastructure Initiative
IOL inventory of losses
IPLT Septage Treatment Plant (Instalasi Pengolahan Limbah Tinja)
IPAL Wastewater Treatment Plant
LAR land acquisition and resettlement
KK Householder
LIDAP Local Institutional Development Action Plan
MCK Public bathing, washing, and toilet facilities
MOHA Minster of Home Affairs
MPW Ministry of Public Works
MSMIP Metropolitan Sanitation Management Investment Management
Program (ADB TA 7993-INO)
O&M Operation and maintenance
PBB Land and Building Tax (Pajak Bumidan Bangunan)
PDAM Government-owned Water Supply Enterprise
PDAM Way Rilau Bandar Lampung Water Authority
PHBS Promotion for a healthy and clean lifestyle
PIUs Programme Implementation Units
PIB project information booklet
PMU Programme Management Unit
POKJA Working Group (Kelompok Kerja)
PPSP Acceleration of Urban Sanitation Development Program
RJMPN The National Medium Term Development Plan
PPTA Program/Project Preparatory Technical Assistance
RPJMD Local Medium Term Development Plan (Rencana Program
Janka Menengah Daerah)
RPJPN National Long-Term Planning
RTRW Regional Spacial Plan (Rencana Tata Ruang Wilayah)

SANIMAS Community Based Sanitation (Sanitasi Berbasis Masyarakat)
SATGAS PPLP Task Force of Directorate of Environmental Sanitation
SC Steering Committee
SDOs Service Delivery Organisations
SSK City Sanitation Strategy
SES socio-economic survey
STED Septic Tank Effluent Disposal
UASB or UASBR Upflow Anaerobic Sludge Blanket Reactor
USAID IUWSHP United States International Agency for Development Indonesia
Urban Water, Sanitation and Hygiene Project
WSP Water and Sanitation Program
WWTP or WWTW Wastewater Treatment Plant or Works
ACRONYMS - TECHNICAL
AC Activated Carbon
ADWF Average Dry Weather Flow (without storm water)
AS Activated Sludge, type of Biological Treatment for Sewage
BAF Bulk Anaerobic Fermenter; also Biological Aerated Filter
BOD Biological Oxygen Demand (5-day), usually mg/L, can be filtered
or total
BVF Bulk Volume Fermenter (proprietary technology of ADI Canada)
CEPT Chemically Enhanced Primary Treatment
CERA Currency Exchange Rate Adjustment
COD Chemical Oxygen Demand, mg/L
d day
DAF Dissolved Air Flotation
DAB Gravity Solids Concentration Unit for Septage
DBP Disinfection By-Product
DED Detailed engineering design
NGO Non-Government Organisation
DO Dissolved Oxygen, mg/L
DS Dry Solids
e- Electricity
EA Extended Aeration
EP or ep Equivalent Population
FC Faecal Coliform, MPN/100 mL
FS Feasibility study
FOG Fats, Oils & Greases, mg/L
h hour
ha hectare
HP horsepower
kg kilogram
km kilometre
km2 square kilometre
kW kilowatts
L litre
LCA Life cycle analysis (technique for evaluating sustainability)

L/s litres per second
LPG Liquefied Propane Gas
LPD Low Pressure Dosed Drainfields (for septic tank overflow)
m metre
M million or Mega
m/s metres per second
m2 square metre
m3 cubic metre (equivalent to kL)
MBAS Methyl Blue Active Substances (measure of surfactants), mg/L
MCK Public Toilet and Washing Facility (Mandi Cuci Kakas)
mg/L milligrams per litre
mL millilitre
ML million litres (mega litres)
CITY INSTITUTIONS - ABBREVIATIONS
Abbreviation Bahasa Indonesian Meaning English Equivalent
AMPL
Air Minum dan Penyehatan
Lingkungan
Working Group for Water Supply and
Sanitation
BAPPEDA
Badan Perencanaan Pembangunan
Daerah
Regional Development Planning
Agency
BLHD or BLH Badan Lingkungan Hidup Daerah Environmental Agency
BLUD Badan Layanan Umum Daerah Regional Public Service Agency
BPMPPKB
Badan Pemberdayaan Perempuan
dan Keluarga Berencana
Women Empowerment and Family
Planning Agency
BUMD Badan Usaha Milik Daerah
Regional Government-owned
Enterprises
Dinas Agency
Dinas Tata
Bangunan Construction Agency
Dinas Tata Ruang City Planning Agency
DKP Dinas Kebersihan dan Pertamanan Cleanliness and Parks Agency
DKP Dinas Kesehatan Health Agency
DKPP
Dinas Kebersihan, Pertamanan dan
Pemakaman
Cleanliness, Parks and Cemetery
Agency
DPRD Dewan Perwakilan Rakyat Daerah Local Legislative Body
DPU Dinas Pekerjaan Umum Public Works Agency
IPLT Instalasi Pengolahan Limbah Tinja Septage Treatment Plant
PD Perusahaan Daerah Kota
Government- owned Municipality
Development Enterprise
PD PAL
Perusahaan Daerah Pengelolaan
Air Limbah
Government-owned Wastewater
Enterprise
PDAM Perusahaan Daerah Air Minum
Government-owned Water Supply
Enterprise
PEMDA Pemerintah Daerah Regional Government
PEMKO Pemerintah Kota City Government
PERDA Peraturan Daerah City Regulation

Perwali Peraturan Walikota Mayor's Decree
POKJA Kelompok Kerja Working Group
PP Peraturan Pemerintah Government Policy
SKPD Satuan Kerja Perangkat Daerah Regional Works Unit
TUPOKSI Tugas dan Fungsi Duties and Functions
UPTD Unit Pelaksanaan Teknis Daerah
Regional Technical Implementation
Unit
UU Undang Undang Laws

TA 7993 - INO: Metropolitan Sanitation Management Investment Project – MSMIP Final Report 1
I. Executive Summary The following summary is for each of the main interest areas of this PPTA. The summary gives the main findings of the reviews that have been undertaken since the ADB Loan Fact Finding Mission in April 2013.
A. Availability of land for the WWTP
All the sub-project cities have been visited and specifically asked about the availability of land for the WWTP and asked to confirm that the land has either been purchased or will be purchased in the immediate future. The most recent meeting was on the 27th November 2012 with representatives of all 5 Cities, they all confirmed their commitment to purchase the required land as quickly as they can. The results of the discussions are included in the following Table. Land Availability For the WWTP
Cimahi During 2011/12, the government of Cimahi has purchased 1 Ha of land and a 6,000 m2 pond for construction of the WWTW. During 2013 they have bought another 2,520m2 of land. Giving a total area of 1.852 Ha.
Jambi Land survey to identify the borders of lands for individual owners was recently completed, the survey has identified that the land proposed for the WWTW is only 4.3 Ha. 6 Ha is needed for the WWTW, an additional 1.7Ha of land was to be purchased. Negotiations for the purchase of the additional land was being progressed at the same time as the negotiations for the purchase of the original 5.3 Ha. Negotiations were expected to be complete by March 2013. However issues were experienced during the land negotiations where the landowner of a specific plot demanded prices several times the land valuation. Bappeda has moved the location of the WWTW to a different plot of land in the same area identified in the WWMP for future phases of the WWTW. This alternative plot has a single landowner who was amenable to the sale of his land. This 6.1241 Ha of land has now been purchased at a reasonable price of Rp. 5.765 billion.
Makassar 5.1443 Ha of land has been acquired since 2009, costing Rp19 billion. Land Certification process will be carried out using APBDP 2012 budget. It was proposed transfer an additional 1 Ha of land from GMTDC to give the required 6 Ha of land that is needed for the construction of the WWTW. However recently the City has decided to get access to the land that has been purchased along the Jongaya canal embankment. Accordingly only 5.1443 Ha is available for the WWTW.
Palembang 5.7 Ha of land has been agreed for sale by the 3 landowners. Of this 1.092 ha has already been purchased and the acquisition of the remaining 5.7138 ha is in the process. Acquisition is likely to be completed by March 2013.
Pekanbaru 11.31 ha of land has already been purchased by the local government and acquisition proceedings for another 2.139 ha is at an advance stage. The acquisition is likely to be completed by March 2013.
It is our opinion that the availability of land for the construction of the WWTP is confirmed and that there is unlikely to be any occurrence that would prevent construction starting on the sites by Q4 2014.

TA 7993 - INO: Metropolitan Sanitation Management Investment Project – MSMIP Final Report 2
B. Technical and Costings review of the WWTP
The International Wastewater Treatment Specialist reviewed the four (4) IndII WWMPs and the available Feasibility Studies for Cimahi, Palembang and Pekanbaru. The WWMP for Makassar did not include a Feasibility Study. He has also reviewed the Cipta Karya PU WWMP prepared for Jambi This report was originally only available in Bahasa and has only recently been translated into English. See Chapter IV of this Report for details of the review. The following table gives a summary of the review with regard to changes to the connection rates, capacity of the WWTPs, process technology, land requirement and costs. Comparison of the WWMP proposals for the WWTP and this PPTA review.
City Source of DataPlanned Domestic
Connections
Planned Commercial
Connections*
Total
ConectionsADWF Flow (MLD)
Treatment Process (Screening +
Degritting Included)Land Area Requirements
Capex
($m)
Cost per Total
Connections
($/conn.)
Annual Opex
($ 000s)
IndII MP Recommendations 23,800 2,300 26,100 21.4 Pretreatment (screens/degri tting) + Flow
Balancing + UASBRs + Trickling Filter + Mech.
Dewatering
WWTP Site: 2 Ha
Stage 1: 2 Ha
17.1 $655 210
MSMIP PPTA Review 23,800 2,300 26,100 21.4 Pretreatment (screens/degri tting) + Flow
Balancing + 6 UASBRs + 2 Stripping Filters + 2
Covered TFs + Mech. Dewatering + Substantial
Odour Control
Stage 1: 2 Ha
(no site fill)
21.3 $816 399
MSMIP PPTA Revised 8,873 1,000 9,873 11.1 Pretreatment (screens/degri tting) + Flow
Splitting + 2 SBRs [6 m tall] (allowance for 2
more in future) + 1 Sludge Thickener + 2 Belt
Presses + Solids to Skip Bins for Disposal +
Odour Control for Solids Building + Chlorine
Disinfection
Stage 1: 2 Ha
(no site fill)
12.8 $1,299 378
IndII MP Recommendations 19,000 2,225 21,225 22 Oxidation Ditch + Clarifiers + Drying Beds WWTP Site: 5.7 Ha
Stage 1: ca. 2.3 Ha
37.3 $1,757 945
MSMIP PPTA Review
Option 3
19,000 2,336 21,336 23.1 2 ODs + 2 Clarifiers + 1 Thickener + 4 ADs +
Sludge Drying BedsWWTP Site: 5.7 Ha
Stage 1: ca. 2.1 Ha
12.1 $567 424
MSMIP PPTA Review
Option 2B
19,000 2,336 21,336 23.1 2 Covered Anae. Ponds + 2 FAPs + 2 Mat. Ponds Stage 1: 5.7 Ha
(no site fill)
10.5 $492 207
Jambi City MP 17,700 2,571 20,271 15 Aerated Ponds + Maturation Ponds WWTP Site: 6 Ha 11.6 $572 175
MSMIP PPTA Review 17,700 2,571 20,271 15.0 2 Covered Anae. Ponds + 2 FAPs + 2 Mat. Ponds Stage 1: ca 5 Ha
(Site Dev. Allowed for 6 Ha
of 1m of Fill)
10.9 $538 149
IndII MP Recommendations 13,374 1,249 14,623 13.2 Covered Anae. Ponds + FAPs + Maturation
PondsWWTP Site: 20 Ha 14.1 $964 275
MSMIP PPTA Review 15,800 1,468 17,268 14.7 2 Covered Anae. Ponds + 2 FAPs + 2 Mat. Ponds Stage 1: ca. 6 Ha;
(Site Dev. Allowed for 8 Ha
of 1m of Fill)
13.5 $779 186
IndII MP Recommendations 9,700 5,300 15,000 16.3 Facultative Aerated Ponds WWTP Site: 6 Ha
Stage 1: ca. 5.3 Ha
16.0 $1,064 319
MSMIP PPTA Review 9,000 5,405 14,405 19.1 2 Covered Anae. Ponds + 2 FAPs + 2 Mat. Ponds Stage 1: 6 Ha
(Site Dev. Allowed for 6 Ha
of 1m of Fill)
12.2 $847 195
Note: AD - Anaerobic Digester; AF - Aerated Filter; FAP - Facultative Aerated Pond; UASBR - Upflow Anaerobic Sludge Blanket Reactor; OD - Oxidation Ditch; Capex - Capital Expenditures; Opex - Annual Operational Expenditures
CIMAHI
JAMBI
MAKASSAR
PALEMBANG
PEKANBARU
* Commercial connection calculated from projected flows, assuming 1.5 m3/d/commercial connection.
(as amended by City)
C. Costings review for the planned wastewater collection systems for the Cities
The National Sewerage Specialists revised the WWMP wastewater collection system proposals to match the treatment pants now proposed for the Cities. The City proposals for the Phase 1 sewerage to be included in the loans by Palembang and Makassar PEMDA were seen to be too expensive by PU-CK, accordingly the extent of the wastewater collection system has been reduced while retaining the planned Phase 1 property connections to the system. The wastewater system analysis was categorised into Rising Mains, Trunk Mains, Main Sewers and Laterals/Interceptors. Costs have been updated from the WWMP 2011 price time base and any missing items have been corrected. See Section 3 of this report for plans

TA 7993 - INO: Metropolitan Sanitation Management Investment Project – MSMIP Final Report 3
of the sewerage systems and detailed costing for the proposals. The table below gives a brief summary of the costs in US$. Reviewed proposals for the wastewater collection systems Cost Summary, Sewers: All Project Cities
(USD million - Base Cost)
LATERALS & STORMWATER SERVICE PPTA REVIEW-
CITY TRUNK SEWERS MAIN SEWERS INTERCEPTORS DRAINAGE CONNECTIONS ALL SEWERS
Cimahi 3.08 0.62 2.19 0.87 2.00 8.76
Jambi 1.29 3.64 3.36 - 7.73 16.02
Makassar 6.62 6.86 11.09 - 5.76 30.33
Palembang 3.58 5.46 5.94 - 7.85 22.82
Pekanbaru 2.85 1.99 4.51 0.12 6.62 18.18
Total cost 17.42 18.57 27.09 0.99 29.96 96.11
D. Review of the Financial Analysis for the Sub-Projects The financial analyses undertaken were three-fold: analysis of financial viability of the proposed sub-projects; analysis of affordability of proposed wastewater fees; and analysis of sustainability of the proposed subprojects and availability of subsidy from the city government, as necessary. A total of about 83,000 property connections, both households and commercial establishments are expected to connect to the system. The base case analysis shows that the five sub-projects are financially viable although in various levels. Full cost recovery is not targeted. Partial cost recovery which involves the recovery of operation and maintenance costs through collection of wastewater fees is the viable scenario. Financial Internal Rate of Return, while calculated for each subproject, is deemed not relevant since the final target is not full cost recovery of costs. The proposed wastewater fees for both Cimahi and Pekanbaru are higher than the willingness to pay of target beneficiaries. Furthermore, the city government of Cimahi hase to put up additional subsidy for the first 2 years of operation to cover negative cash flows in the amount of $0.58 million. For Makassar, tthe FIRR is negative. However, the cash flow is positive which shows that the proposed fee (equivalent to the willingness to pay) is sufficient to cover O&M costs For Jambi, the proposed fee is equal to the willingness to pay and no additional subsidy for operation is required from the city government. Palembang has a different fee structure since it will be operated by PDAM. The proposed wastewater fee will be included in the existing water fee so that some form of cross subsidy among water consumers will in fact be applied. Summary is presented in the following table: Cimahi Jambi Makassar Pekanbaru Palembang Average monthly household income
($/hh/month)a
245 198 302 247 260
Proposed monthly wastewater fee ($/ connection/month)
2.20 1.20 1.50 1.90 0.30
Fee as a % of monthly income b
Minimum Maximum
0.86% 1.06%
0.60% 0.70%
0.5% 0.6%
0.73% 0.91%
0.11%
a Estimated average household incomes in 2016 which are projected to increase by 5% annually.
Minimum and maximum percentages over the 10-year analysis period (2016 to 2025).

TA 7993 - INO: Metropolitan Sanitation Management Investment Project – MSMIP Final Report 4
E. Review of the Economic Analysis for the Sub-Projects
The economic feasibility of the proposed sub-projects was evaluated considering the following benefits: (i) health impact in terms of health care costs; (ii) income and productivity savings; (iii) cost savings in accessing clean water for drinking and domestic uses; and (iv) obviated costs of constructing septic tanks and their desludging. The ENPV and EIRR of all five sub-projects under the “base case” scenario are positive, with EIRRs that are above the minimum threshold of 12%. Therefore, all proposed sub-projects are economically feasible. Sensitivity tests assuming: (i) a 10%-increase in investments, (ii) a 10%- increase in O&M costs, and (iii) a 10%-reduction in total benefits indicate that the five subprojects remain basically robust. A one-year delay in total project benefits and under a “worse case” scenario involving simultaneous 10%-increases in investments and O&M costs combined with a 10% reduction in total benefits result in EIRRs for Cimahi, Jambi, Palembang and Pekanbaru subprojects that are slightly below the 12% threshold. All sub-projects are very sensitive to reductions in benefits followed closely by increases in investments. Overall, the five sub-projects will directly benefit a total of 70,373 urban households (equivalent population: 312,000) and 12,780 commercial establishments with beneficiary households comprising around 43% of the total projected number of households in the sub-project areas by the end of investment implementation in 2018. About 10%-28% of the benefits were estimated to accrue to the poor in each Project city.
F. Review of Social, Gender and Poverty Analysis for the Sub-Project Areas
Due diligence for gender and poverty and social analysis was completed for most of the cities through the analysis of survey and other studies that were conducted for the Wastewater Master Plans. These were augmented with field consultations with key stakeholders at the institutional and community levels. Gender awareness was also conducted at the community level as well as with the Sanitation Pokja as part of the process for gender analysis that was conducted to validate gender issues, preferences and recommendations. Sanitation hot spots were identified and small group meetings were conducted there to discuss needs, constraints and opportunities for project participation. Meetings with city partners in the Sanitation Pokja discussed identified issues such as on affordability and pro-poor measures based on which targets and proposed actions were included in project design. A summary of results are reflected in sections for Gender Analysis as well as for Poverty and Social Analysis per city in this Report. A Project-level Poverty and Social Analysis is in Annex Document D and a Gender Analysis with Framework Gender Action Plan is in Annex Document C. A Socio-economic Survey for Jambi was commissioned and was conducted. Survey results still have to be released by the contractor. In the meantime, a preliminary profile and analysis is included in section IV.H and IV.I pending submission of the completed report by the contractor. Other outputs delivered here based on the processes thus far undertaken include a Stakeholder Communications Strategy in the Recommendations Report to the President (RRP) and a Consultation and Participation Plan in the Project Administration Manual (PAM). Annex Document E includes a Summary of Stakeholder Consultations. Minutes and documentation reports will be included in the Final Report. Social and Poverty Analysis was conducted to examine social development issues and the project’s potential effects, especially on poor people. Based on this, the Summary Poverty Reduction and Social Strategy, a linked document, summarizes pro-poor measures and recommendations to address identified social risks. A Gender Action Plan, a linked document, enhances sanitation awareness, access to sewerage benefits and strengthen
TA 7993 - INO: Metropolitan Sanitation Management Investment Project – MSMIP Final Report 5
management and operational capacity while facilitating women’s participation and benefit through i) female quotas for consultations, training and subsidized sewerage monthly fees for poor, ii) targets for women’s inclusion in hygiene sanitation campaign delivery and in working groups on sanitation and on land acquisition and resettlement, iii) female quotas in staffing and promotion, iv) equal pay for equal work in civil works construction and sanitation management jobs, and v) through gender-specific baseline data and reporting. Social inclusion and pro-poor measures include vi) provision of onsite sanitation with livelihood options, as needed, near WWTPs.
G. Review of Resettlement requirements for the Sub-Projects
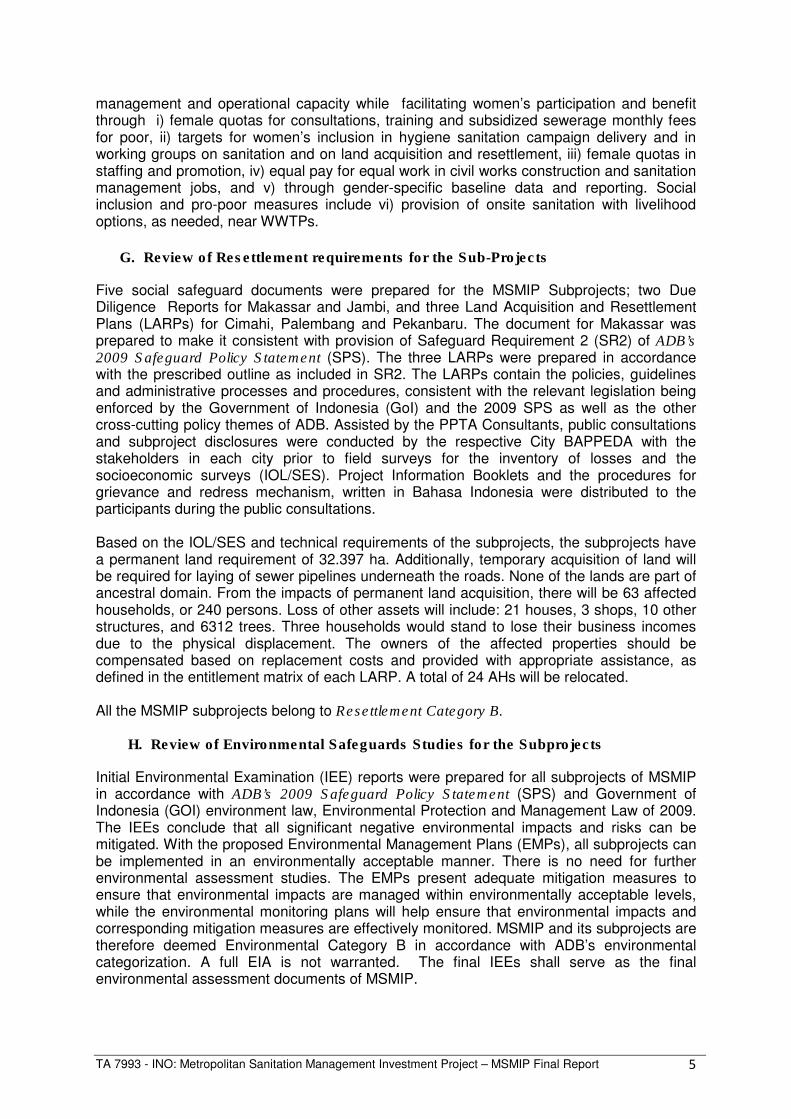
Five social safeguard documents were prepared for the MSMIP Subprojects; two Due Diligence Reports for Makassar and Jambi, and three Land Acquisition and Resettlement Plans (LARPs) for Cimahi, Palembang and Pekanbaru. The document for Makassar was prepared to make it consistent with provision of Safeguard Requirement 2 (SR2) of ADB’s 2009 Safeguard Policy Statement (SPS). The three LARPs were prepared in accordance with the prescribed outline as included in SR2. The LARPs contain the policies, guidelines and administrative processes and procedures, consistent with the relevant legislation being enforced by the Government of Indonesia (GoI) and the 2009 SPS as well as the other cross-cutting policy themes of ADB. Assisted by the PPTA Consultants, public consultations and subproject disclosures were conducted by the respective City BAPPEDA with the stakeholders in each city prior to field surveys for the inventory of losses and the socioeconomic surveys (IOL/SES). Project Information Booklets and the procedures for grievance and redress mechanism, written in Bahasa Indonesia were distributed to the participants during the public consultations. Based on the IOL/SES and technical requirements of the subprojects, the subprojects have a permanent land requirement of 32.397 ha. Additionally, temporary acquisition of land will be required for laying of sewer pipelines underneath the roads. None of the lands are part of ancestral domain. From the impacts of permanent land acquisition, there will be 63 affected households, or 240 persons. Loss of other assets will include: 21 houses, 3 shops, 10 other structures, and 6312 trees. Three households would stand to lose their business incomes due to the physical displacement. The owners of the affected properties should be compensated based on replacement costs and provided with appropriate assistance, as defined in the entitlement matrix of each LARP. A total of 24 AHs will be relocated. All the MSMIP subprojects belong to Resettlement Category B.
H. Review of Environmental Safeguards Studies for the Subprojects
Initial Environmental Examination (IEE) reports were prepared for all subprojects of MSMIP in accordance with ADB’s 2009 Safeguard Policy Statement (SPS) and Government of Indonesia (GOI) environment law, Environmental Protection and Management Law of 2009. The IEEs conclude that all significant negative environmental impacts and risks can be mitigated. With the proposed Environmental Management Plans (EMPs), all subprojects can be implemented in an environmentally acceptable manner. There is no need for further environmental assessment studies. The EMPs present adequate mitigation measures to ensure that environmental impacts are managed within environmentally acceptable levels, while the environmental monitoring plans will help ensure that environmental impacts and corresponding mitigation measures are effectively monitored. MSMIP and its subprojects are therefore deemed Environmental Category B in accordance with ADB’s environmental categorization. A full EIA is not warranted. The final IEEs shall serve as the final environmental assessment documents of MSMIP.

TA 7993 - INO: Metropolitan Sanitation Management Investment Project – MSMIP Final Report 6
All IEEs have complied with ADB’s SPS (2009) and the requirements describe in its Appendix 1 (Safeguards Requirement 1: Environment). These IEEs therefore have the following sections: (i) executive summary, (ii) introduction, (iii) policy, legal, and administrative framework, (iv) description of the environment, (v) anticipated environmental impacts and mitigation measures, (vi) information disclosure, consultation, and participation, (vii) grievance redress mechanism, (viii) environmental management plan, and (ix) conclusion and recommendations. With the concern for infrastructures sustainability due to the potential impacts of climate change on investments, the EMPs highlighted the need to include measures for climate change adaptation. A hydrology and flooding study shall be conducted during the design phase for all WWTPs to ensure that occurrence of flooding due to climate change is properly evaluated. Results of the study shall be used for designing the proposed WWTPs and the preparation of engineering specifications to ensure that these infrastructures will be less vulnerable to extreme flood events. The IEEs present GOI’s regulatory requirements regarding the AMDAL system (EIA system) and Environmental Permit. Application for Environmental Permit and AMDAL shall be done at the same time as provided for by Environmental Permit Regulation (No.27/2012). Only the Makassar subproject has already complied with the AMDAL requirements. The other 4 subprojects shall prepare an AMDAL. Preparation of the AMDAL will be done by the detailed design consultants during the detailed design phase as agreed by ADB and GOI. This will be funded by the Indonesia Infrastructure Initiative (IndII) or the GOI. AMDAL preparation shall be completed prior to any bidding/procurement process. In addition, all subprojects are also required to apply for a permit to discharge under each city’s regulation for WWTPs.
I. Institutional Proposals for the Operation of the Sub-Projects
Institutional proposals focus on two phases of the MSMIP project namely, the project implementation phase and the operation phase.
1. Proposed Institutional Arrangements for Project Implementation The Ministry of Public Works, Directorate General for Human Settlements (DGHS or Cipta Karya) is the Executing Agency for the MSMIP. DGHS will establish a central project management unit (CPMU) composed of technical and administrative staff from the Directorate of Environmental and Sanitation Development (DESD). At the regional level, two units will work jointly to manage and implement the project, the SATKER (Provincial Unit of Cipta Karya) as the Provincial Project Implementation Unit (PPIU) and the city local project management unit. There are two models being considered, namely Model 1 where the SATKER as the PPIU, is the key implementing agency, and Model 2 where the city LPMU is the key implementing agency. Model 1 (SATKER Model) for Cimahi, Jambi, Makassar and Pekanbaru. Under this arrangement, Cipta Karya plays an active role in providing technical supervision and responsibility over the investment through the SATKER. While the SATKER is the key implementation unit in the field, substantial involvement of the city government is needed. For this reason, a LPMU will be created in each city. The SATKER takes full responsibility for the planning and implementation of all aspects and components of the Project in the city. It will be assisted by the central project consultants comprising the following:
• Project Implementation Support Consultants (PISC) funded by ADB loan (for Cimahi, Makassar, Jambi and Pekanbaru)
• PISC funded by INDII (for Palembang)

TA 7993 - INO: Metropolitan Sanitation Management Investment Project – MSMIP Final Report 7
• Capacity Development Technical Assistance (CDTA) Consultants funded by ADB grant
• Detailed Engineering Design (DED) Consultants funded and hired by INDII (for Cimahi, Makassar, Palembang and Pekanbaru)
• DED Consultants funded and hired by the central government (for Jambi) • DED for connection network funded and hired by the city government except
Palembang
The PISC consultants will provide overall project management support including procurement and construction supervision in their respective cities. It is their responsibility to ensure that activities are coordinated and synchronized to ensure that project objectives are met. Detailed engineering design will be done by another set of consultants as discussed above. Model 2 (PEMKO Model) for Palembang. Under a pilot initiative to reinforce project ownership and local autonomy, the Palembang city government will be the IA, instead of the Provincial SATKER as in other cities. In Palembang, the city-owned water company (PDAM) already manages several water treatment plants and has the capacity to implement its subproject. The LPMU will coordinate with the SATKER of South Sumatera.
2. Proposed Institutional Arrangements for Operation
Sector direction and investments are still largely overseen by the central-government although the local authorities are recently starting to take a more active role. To further strengthen the sector, the city governments established the POKJA Sanitasi (Working Group for Sanitation) headed by the head of BAPPEDA. The role of POKJA Sanitasi as a “sector coordinator” is gradually evolving and needs to be strengthened. Management of service delivery is generally done by the Dinas Kebersihan dan Pertamanan (Cleanliness and Parks Agency or DKP) or the Dinas Pekerjaan Umum (Public Works Agency or DPU). Key issues include weak government overview or supervision due to lack of regulations, sanctions and enforcement. In view of the weaknesses discussed above, the key institutional proposals involve selection of autonomous and sustainable service delivery organizations (SDOs) and a Capacity Development Technical Assistance (CDTA) to strengthen the sector and the SDO. Selection of SDOs. The WWMP1 proposals for the SDO to manage and operate the wastewater systems are a Badan Layanan Umum Daerah (BLUD) in 4 cities (Cimahi, Jambi, Makassar, and Pekanbaru) and a wastewater department under the PDAM for Palembang. A BLUD is a semi-autonomous service provider created by the city to provide public services on a not-for-profit basis. It is intended to enjoy more flexibilities (and responsibilities) compared with the normal Dinas (government agency). Except for Palembang, UPTDs are currently in various stages of being formed under various Dinas to handle the preparatory activities pending the creation of the BLUD. A UPTD (Unit
1 A Wastewater Investment Master Plan Project (WWIMP) under the AusAID-funded Indonesia Infrastructure
Initiative (IndII), which supports wastewater planning in several cities, was implemented up to 2011 to support the roll out of the Acceleration of Urban Sanitation Development Program 2010‐2014 (PPSP) by the
Government of Indonesia. Fundamental to this Project is the establishment of an effective, efficient and responsive wastewater management and sanitation service delivery organization or SDO that supports the project’s vision and mission, provides sufficient information on development directions, provides authority to decide and calls its attention when performance is below expectation. The promotion of two (2) critical conditions – 1) a supportive sector, and 2) an effective service delivery organization (SDO) – is the overall goal of this capacity building plan.
TA 7993 - INO: Metropolitan Sanitation Management Investment Project – MSMIP Final Report 8
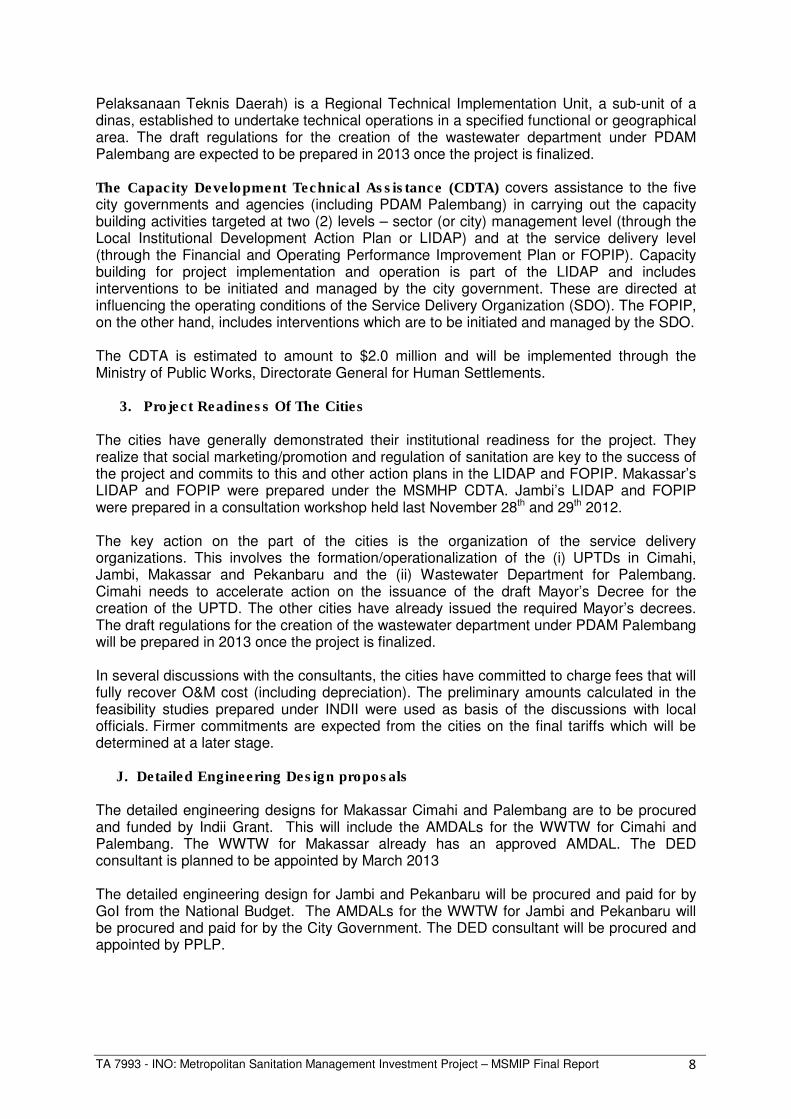
Pelaksanaan Teknis Daerah) is a Regional Technical Implementation Unit, a sub-unit of a dinas, established to undertake technical operations in a specified functional or geographical area. The draft regulations for the creation of the wastewater department under PDAM Palembang are expected to be prepared in 2013 once the project is finalized. The Capacity Development Technical Assistance (CDTA) covers assistance to the five city governments and agencies (including PDAM Palembang) in carrying out the capacity building activities targeted at two (2) levels – sector (or city) management level (through the Local Institutional Development Action Plan or LIDAP) and at the service delivery level (through the Financial and Operating Performance Improvement Plan or FOPIP). Capacity building for project implementation and operation is part of the LIDAP and includes interventions to be initiated and managed by the city government. These are directed at influencing the operating conditions of the Service Delivery Organization (SDO). The FOPIP, on the other hand, includes interventions which are to be initiated and managed by the SDO. The CDTA is estimated to amount to $2.0 million and will be implemented through the Ministry of Public Works, Directorate General for Human Settlements.
3. Project Readiness Of The Cities The cities have generally demonstrated their institutional readiness for the project. They realize that social marketing/promotion and regulation of sanitation are key to the success of the project and commits to this and other action plans in the LIDAP and FOPIP. Makassar’s LIDAP and FOPIP were prepared under the MSMHP CDTA. Jambi’s LIDAP and FOPIP were prepared in a consultation workshop held last November 28th and 29th 2012. The key action on the part of the cities is the organization of the service delivery organizations. This involves the formation/operationalization of the (i) UPTDs in Cimahi, Jambi, Makassar and Pekanbaru and the (ii) Wastewater Department for Palembang. Cimahi needs to accelerate action on the issuance of the draft Mayor’s Decree for the creation of the UPTD. The other cities have already issued the required Mayor’s decrees. The draft regulations for the creation of the wastewater department under PDAM Palembang will be prepared in 2013 once the project is finalized. In several discussions with the consultants, the cities have committed to charge fees that will fully recover O&M cost (including depreciation). The preliminary amounts calculated in the feasibility studies prepared under INDII were used as basis of the discussions with local officials. Firmer commitments are expected from the cities on the final tariffs which will be determined at a later stage. J. Detailed Engineering Design proposals The detailed engineering designs for Makassar Cimahi and Palembang are to be procured and funded by Indii Grant. This will include the AMDALs for the WWTW for Cimahi and Palembang. The WWTW for Makassar already has an approved AMDAL. The DED consultant is planned to be appointed by March 2013 The detailed engineering design for Jambi and Pekanbaru will be procured and paid for by GoI from the National Budget. The AMDALs for the WWTW for Jambi and Pekanbaru will be procured and paid for by the City Government. The DED consultant will be procured and appointed by PPLP.

TA 7993 - INO: Metropolitan Sanitation Management Investment Project – MSMIP Final Report 9
K. Procurement and Consulting Services
1. Procurement Plan All advance contracting will conform to ADB’s Procurement Guidelines (2010) and ADB’s Guidelines on the Use of Consultants (April 2010). The Borrower undertakes such advance contracting at its own risk, and any concurrence or “no objection” issued by the ADB with regard to the procedures, documentation, or proposal for award does not commit ADB to finance or make a loan for the project in question. In particular circumstances, advance recruitment action may be applied to recruitment of consultants for ADB TA or delegated TA. All procurement of Goods and Works will be in accordance with ADB’s Procurement Guidelines (2010). Civil Works will be procured through International Competitive Bidding (ICB) procedures for packages exceeding $10.0M equivalent and Goods will be procured through ICB exceeding $2.0M. National Competitive Bidding (NCB) procedures acceptable to ADB will be used to procure Civil Works and Goods up to their respective thresholds. Packages amounting to the equivalent of $100,000 or less may be procured through Shopping. These thresholds are in accordance with Presidential Decree 70/2012 of the Indonesian Government. Before the start of any procurement, ADB and the Government will review the public procurement laws of the Central and State Governments to ensure consistency with ADB’s Procurement Guidelines. A Procurement Plan will be prepared by the borrower and submitted to the ADB as part of the preparation of the project covering the procurement of works, goods, and recruitment of consulting services required to carry out the project during the initial period of at least 18 months. The contents of this Procurement Plan will comply with the ADB Guidelines. The Procurement Plan consists of 8 ICB Contract Packages and 11 NCB Contract Packages. There will be no separate procurement for Goods as equipment, pipes, and other materials will be procured as part of Capital Works. The procedures to be followed for National Competitive Bidding shall be those set forth in Presidential Decree No. 70/2012 or the New Procurement Law of the Republic of Indonesia.
2. Consultants’ Terms of Reference The ADB and the Government of Indonesia (GOI) intends to procure the services of a reputable consultant firm to provide technical advisory services to government institutions in Cimahi, Jambi, Makassar and Pekanbaru to support the implementation of the proposed ADB-funded capacity development technical Assistance (TA) on Capacity Development for Metropolitan Sanitation Management Investment Project (MSMIP). A total of 118 person-months (34 person-months international and 84 person-months national) will be recruited for TA implementation support for 2 years. Consultants will be selected in accordance with ADB’s Guidelines on the Use of Consultants by ADB and its Borrowers (2010, as amended from time to time). ADB will recruit the consultants, in close coordination with AusAID and the Directorate General of Human Settlements (DGHS) in the Ministry of Public Works through quality and cost-based selection procedures (80:20), using a simplified technical proposal. The consulting firm will also be responsible for procuring equipment and administering the costs associated with training and workshops. The consulting firm will work in close coordination with government officials particularly the (i) POKJA (City Technical Working Group), the (ii) LPMU (City Local Project Management Unit), and the (iii) proposed UPTDs (Regional Technical Implementation Unit), for Cimahi, Jambi, Makassar, and Pekanbaru.

TA 7993 - INO: Metropolitan Sanitation Management Investment Project – MSMIP Final Report 10
Consulting services for the TA will provide technical expertise and support in 2 areas, namely, Capacity Building and Project Management Assistance. The ADB CDTA covers assistance to the 4 city governments and agencies. The INDII PISC Consultant will support PDAM for Palembang. The capacity building activities are targeted at 2 levels – sector (or city) management level (through the Local Institutional Development Action Plan or LIDAP) and at the service delivery level (through the Financial and Operating Performance Improvement Plan or FOPIP). Capacity building for project implementation and operation is part of the LIDAP and includes interventions to be initiated and managed by the City Government. These are directed at influencing the operating conditions of the Service Delivery Organization (SDO). The FOPIP, on the other hand, includes interventions that are to be initiated and managed by the SDO. The CDTA consultancy services also aims to provide initial Project Management Assistance during the period prior to mobilization and during the initial years of the Project Implementation Support Consultants (PSIC). Implementation of the project will be handled by the PISC and it is necessary that activities of the various project consultants are coordinated and synchronized to ensure that project objectives are met. The Technical Audit component is more of an initial project management assistance which is completed after the procurement is finalized, and contracts are awarded and signed. A proposal to establish the Indonesia Waste Water Institute is timely and very relevant to the CDTA.2 The IWWI model proposes professional certification as a means of i) testing the level of competence of professionals; ii) defining the minimum professional standards for certain roles; and iii) incentivizing the pursuit of continuing development among staff in the sector, based on the idea that the certification –provided that it has credibility and good reputation in the sector- will serve as a differentiating element of professional excellence.
Initially, the IWWI 5-year working plan includes a first batch of people to be trained and certified from existing offsite system operators. The results of the IWWI model evaluation and improvement task that will take place at the end of 2014 should be taken into account in the CDTA (at FOPIP and LIDAP levels).It is proposed that the MSMIP cities (Makassar, Pekanbaru, Jambi, Palembang and Cimahi) will be targeted for the second batch training in 2015 (for the current UPTD head) and in 2016 (for the off site system manager/operator). Funding for this will be provided by the ADB WOPs project. The key points of interrelationships between IWWI and this CDTA include:
• The incorporation of knowledge products resulting from the MSMIP CDTA into the IWWI for further replication
• All IWWI trainees could very much benefit from making site visits during the installation and testing of the electromechanical equipment at the MSMIP plants, as well as during commissioning.
• Once trained, the SDO managers will be involved in the specific area of the FOPIP that deals with the definition of work competencies and recruitment processes
2 In September 2012 the Asian Development Bank appointed consultants to undertake the study ADB TA-7739 -
Indonesia Water Supply and Sanitation Institute (IWSSI). The main objective of the project is to accelerate the building of capacity in urban water and sanitation services in Indonesia, through the creation of a training and professional certification body for water and wastewater operators that has initially been given the name of Indonesian Water Supply and Sanitation Institute (IWSSI). Eventually, the institute was referred to as the Indonesian Waste Water Institute (IWWI).The main outcome of this project is a 5-year plan for the creation and operation of the training and certification institution, along with a set of recommendations for policy-making measures that should support and safeguard its consolidation for the benefit of the people of Indonesia.

TA 7993 - INO: Metropolitan Sanitation Management Investment Project – MSMIP Final Report 11
• Future managers of the MSMIP assets could also benefit from the WOPs activities that happen in parallel to the IWWI, for example joining the training courses carried out at the premises and offices of the international mentor operators (in the second part of 2015).
The cost for the ADB CDTA for the 4 Cities is estimated to be $2.0M for a total of 118 Person-Months. About 34 PMs will be allocated to international consultants and 84 PMs will be allocated to national consultants. Monitoring and evaluation of project benefits will likewise be included as part of the CDTA and PISC. These call for the development and implementation of a Project Performance Monitoring System, conduct of a baseline study, and setting-up of all institutional requirements in order to be able to monitor and evaluate project benefits after its completion. Consulting Services will be provided (funded by INDII) for the detailed engineering design for Cimahi, Makassar and Palembang. Consulting services will be provided (funded by the Central Government) for the detailed engineering design for Jambi and Pekanbaru. Detailed engineering design consultants of the property connections will be funded by the City Governments except Palembang where it will be funded by INDII.
Consulting services will be provided (funded by the ADB) for the project management including construction supervision for Cimahi, Jambi, Makassar, and Pekanbaru. Consulting services will be provided (funded by INDII) for the project management including construction supervision for Palembang. The INDII consultancy will also include capacity building to assist the city government of Palembang in the implementation of the LIDAP and to assist the wastewater department under PDAM Palembang (the SDO for the wastewater operations) in the implementation of the FOPIP.
L. Potential Loan Amount
The table below shows the current funding proposals for the WWTP and wastewater collection systems in US$ for each of the Cities.
Cimahi Jambi Makassar Palembang Pekanbaru
I. Investment Costs
A. Involuntary Resettlement 0.04 0.12 0.38 0.54 0.39
B. Civil Works 18.74 29.65 44.59 36.19 32.47
C. Consulting Services 1.01 1.75 2.48 2.88 1.91
D. Land Acquisition 0.07 0.58 1.91 2.33 1.62
Total Base Costs (A to D) 19.86 32.09 49.36 41.93 36.38
Physical Contingencies 2.14 3.40 5.12 4.84 3.75
Price Contingencies 2.18 4.20 6.18 5.13 4.29
T O T A L 24.18 39.69 60.66 51.90 44.43

TA 7993 - INO: Metropolitan Sanitation Management Investment Project – MSMIP Final Report 12
The total investment cost will be financed from various sources—ADB Ordinary Capital Resources (OCR), ADB ASEAN Infrastructure Fund (AIF), AusAID Indonesia Infrastructure Initiative (INDII), Central Government and City Governments of Cimahi, Jambi, Makassar, Palembang and Pekanbaru. The distribution of funds is detailed in the following table:
ADB AusAID Government
OCR AIF INDII Central Local Total
A. Cimahi
Waste Water Treatment Works 8.42 4.21 0.60 1.47 - 14.71
Waste Water Sewer System 3.54 1.77 0.25 0.74 - 6.30
Property Connections - - - 0.31 2.75 3.06
Land Acquisition - - - - 0.07 0.07
Involuntary Resettlement - - - - 0.05 0.05
Subtotal 11.96 5.98 0.85 2.52 2.86 24.18
B. Jambi
Waste Water Treatment Works 7.18 3.59 - 1.76 - 12.52
Waste Water Sewer System 7.85 3.92 - 2.88 - 14.65
Property Connections - - - 1.49 10.33 11.82
Land Acquisition - - - - 0.58 0.58
Involuntary Resettlement - - - - 0.13 0.13
Subtotal 15.02 7.51 - 6.13 11.03 39.69
C. Makassar
Waste Water Treatment Works 8.08 4.04 0.57 1.41 - 14.10
Waste Water Sewer System 17.98 8.99 1.28 4.61 - 32.85
Property Connections - - - 1.14 10.24 11.38
Land Acquisition - - - - 1.91 1.91
Involuntary Resettlement - - - - 0.42 0.42
Subtotal 26.06 13.03 1.85 7.15 12.57 60.66
D. Palembang
Waste Water Treatment Works - - 12.87 1.43 - 14.30
Waste Water Sewer System - - 20.24 2.25 - 22.49
Property Connections - - 10.97 1.22 - 12.19
Land Acquisition - - - - 2.33 2.33
Involuntary Resettlement - - - - 0.59 0.59
Subtotal - - 44.08 4.90 2.92 51.90
E. Pekanbaru
Waste Water Treatment Works 8.96 4.48 - 2.19 - 15.63
Waste Water Sewer System 8.87 4.44 - 3.26 - 16.57
Property Connections - - - 1.02 9.17 10.19
Land Acquisition - - - - 1.62 1.62
Involuntary Resettlement - - - - 0.43 0.43
Subtotal 17.83 8.92 - 6.47 11.21 44.43

TA 7993 - INO: Metropolitan Sanitation Management Investment Project – MSMIP Final Report 13
II. Introduction
A. Background to Proposed Project
The proposed INDII WWMP project began its selection of beneficiary cities under the Australian Government Initiative at the end of 2009. The ADB has extended considerable support towards institutionalized sanitation development in Indonesia. The ADB has been a key stakeholder in the process observing and contributing to the outcomes of the Australian Government’s support. It has been the ADB’s clear intention to review and use the INDII Project documents as the basis for future loan negotiations. The urban infrastructure programs that were identified during the INDII master planning process require further, technical, economic, financial, governance, poverty and social safeguards due diligence. To ensure that the projects comply with accepted standards and requirements, the ADB PPTA – MSMIP was developed.
Initial INDII long-list of 10 cities
Amended list of 8 INDII cities, following the
selection workshop held January 2010
Final list of 5 cities
Batam
Pekanbaru Pekanbaru Pekanbaru
Jambi Jambi Jambi
Palembang Palembang Palembang
Bandar Lampung Bandar Lampung
Bogor Bogor
Bekasi
Cimahi Cimahi Cimahi
Surabaya Surabaya
Pontianak
Makassar Makassar Makassar
The initial long-list of cities named in this selection process were the ten cities that responded to a questionnaire sent out by the INDII project, and which subsequently received letters of support from the Mayor (Walikota) from each of the cities. During the City selection and scoring process and the subsequent workshop held on 20th to 22nd January 2010, the cities of Bekasi and Pontianak were eliminated. There were no reasons given to the team as to why the deleted cities were selected. INDII afterwards employed three consulting teams to prepare master plans and feasibility studies for seven cities (excluding Jambi) by the end of 2011. The Government injected APBN funding for ARSS BARU, an Indonesian consulting company to prepare the master

TA 7993 - INO: Metropolitan Sanitation Management Investment Project – MSMIP Final Report 14
plan for Jambi. Makassar was included at a later date and a masterplan and feasibility studies were also prepared for a section of the city. The team was not party to a number of the decisions made by the government relating to the selection of the cities. Details as to why some were selected and others excluded, was not disclosed. It is understood that much of the “readiness” of the cities was decided by the PPLP project, which was implemented by BAPPANAS. This is thought to be linked to the completion of the City Sanitation Strategies prepared by the Cities and their financial commitment to providing funding for sanitation/wastewater infrastructure. There was no feasibility studies prepared for Jambi or Makassar as this was not a requirement of the relevant Consultant’s ToR’s.
B. Background to the Preparation of this Report
With the exception of Jambi, 4 of the cities in the selection for Phase 2 of this TA were included in the PPLP, for the INDII project. The investigation for Jambi was funded by the Government of Indonesia APBN and completed in 2011. Phase 1 of the PPTA study included a first phase of visits to the 8 Cities initially included in the PPTA was carried out during April and May 2012, findings are included in the Inception Report issued in May 2012. 5 Cities were selected for further studies under the PPTA. The early stages of Phase 2 of the PPTA study, involved reviewing a large number of documents and reports relevant to the Masterplans and the associated WWMP Period 1, Sub-project Feasibility Studies where they exist and to consolidate technical inputs that were relevant to the PPTA preparation. A second phase of City visits to the 5 Cities was carried out to visit the sites of the WWTW and to collect additional information from the Cities. These visits commenced in Cimahi on 27th June and completed on the 1st August in Pekanbaru, the findings from these visits were included in the Interim Report issued in September. The third phase of City visits commenced on the 12th September in Cimahi and completed on the 24th October in Pekanbaru. All Cities have been visited by the Finance Experts, the Economist, the Institutional Experts and the Social Safeguards Experts. The Resettlement and Environmental Specialist have held Public Consultations meetings in all 5 Cities and carried out further site inspections. A fourth phase of City Visits commenced in early November to finish collecting information and interviewing interested parties. Pekanbaru was the last City to be visited, the visit completed on the 22nd of November. The SES survey in Jambi was held, week commencing 12th November and a FOPIP/LIDAP awareness workshop was held in Jambi on the 28th and 29th November. The lateness of these meetings has contributed to the delay in submission of the DFR from the 30th of November to the 4th of December.
C. Scope of Report
This Final Report is a statement of work carried out during the final phase of the MSMIP PPTA. The report covers the period up to the 31st November. This Report includes the draft recommendations and analysis required by the PPTA TOR for the 5 Cities. This report will form the basis for the detailed discussion and site visits that will take place during the December ADB Field Mission that is programmed for the period 10th to 14th December.

TA 7993 - INO: Metropolitan Sanitation Management Investment Project – MSMIP Final Report 15
D. Objectives
The overall objective of the project is improved quality of life in Cimahi, Jambi, Makassar, Palembang and Pekanbaru through reduced wastewater pollution levels, improved urban wastewater infrastructure and services. This goal is consistent with the Government’s policy of decentralisation and Millennium Development Goals. The specific outcome of the project is the provision of off-site wastewater systems and treatment for the central commercial districts (CBD’s) of the Cities. The residential areas around the CBD will also be connected to the wastewater collection systems. Accordingly the communities and residents of the central part of Cimahi, Jambi, Makassar, Palembang and Pekanbaru will benefit from service delivery by the Municipalities and an improved environmental situation. This will help to alleviate poverty and improve community health and the urban environment. The project will assist the GoI in achieving the Millennium Development Goals of halving the proportion of people without sustainable access to safe drinking water and adequate sanitation by 2015.
E. Report Structure
The Final Report is made of 9 separate documents. The Main Report (this document) and 10 associated Annex Documents. The associated Annex Documents are as follows:
• A - Technical • B - Finances and Economics • C - Gender Analysis and Gender Action Plan • D - Poverty and Social Analysis
• E - Social Stakeholder Consultations • F - Social Safeguards – Involuntary Resettlement • G - Environmental Safeguards Studies • H - Institutional • I - General
TA 7993 - INO: Metropolitan Sanitation Management Investment Project – MSMIP Final Report 16
III. Cimahi City Off-site Wastewater Collection System and Treatment
A. Cimahi Physical Setting Cimahi is a small city with an area of just over 40 km2, but relatively densely populated with a population of 566,000 (2009) and a population density of 141 people/ha. The elevation of Cimahi ranges from 1,050 m above mean sea level (MSL) in the north (Kelurahan Cipageran) to 690 m above MSL in the south (Kelurahan Melong). Cimahi has a monsoonal climate with a distinct dry season from June through to October and a wet season from November to May. The monthly rainfall varies from only 4 mm in September to 420 mm in March. The combination of extensive intense rainfall periods and steep slopes creates significant surface runoff. The projected 2030 population in Cimahi is expected to be 842,000, with growth rates exceeding 3 percent. Cimahi City has a generally steep topography that sits entirely within the watershed of the Citarum River, one of the primary sources of water supply for greater Jakarta. There are five primary catchments within the city, namely: Cihaur, Sisangkan, Cimahi, Cimancong and Cibeureum rivers. All of the rivers are typical mountain streams but none meet the West Java Provincial standards for water quality. The Cisangkan River has the worst downstream water quality of the four rivers with 12 parameters exceeding the threshold water quality standard. Most current sanitation facilities in Cimahi are septic tanks and pit latrines, while some 30 percent of the population do not have a septic tank and dispose their waste straight to the drains or rivers; others who do not have access to a family/individual toilet use public toilets. Many Cimahi residents suffer from waterborne diseases such as diarrheal diseases and gastroenteritis, which were ranked number 4 out of 10 major illnesses suffered by residents. In 2009, 6 percent of the population was identified to have suffered from diarrheal disease. Diarrheal cases increased in 2009 in most kelurahans, especially in Cibeureum which includes the industrial zone and the residential area for transient workers for the industries. Kelurahan Cibeureum includes much rental accommodation with shared latrines or no access to adequate sanitation facilities. Significant space is allocated in the city for industrial uses and for the military. However, land availability is one of the major issues in Cimahi City development as 57 percent of the total land is already built upon. The city is congested with only 1 percent of land allocated to road reserves, compared with 5-8 percent in many comparable Asian cities. Some 88 percent of all the houses own a family toilet (71 percent of those are equipped with either a septic tank or a cubluk) and 17 percent are not equipped with septic tank. The lowest family latrine ownership (46 percent) is in kelurahan Cibeureum, where transient workers reside that service adjacent industrial areas. Generally, the steep gradients in the city are not well suited for onsite disposal of treated effluent as the leached liquid from the cess pits, and the less common absorption trenches, could run onto the downhill neighbouring properties. There are a number of on-site communal sanitation facilities throughout Cimahi. In FY2009-2010, 30 MCKs equipped with biofilter septic tanks and seven units of communal septic tanks were constructed by DKP Cimahi City using the local budget of the city. In addition an AG tank with 200 household capacity was built in kelurahan Cimahi in 2004 using the local Provincial Budget. There are several privately owned companies involved in the desludging of septic tanks in the city and adjacent areas like Kabupaten Bandung, Kabupaten West Bandung and

TA 7993 - INO: Metropolitan Sanitation Management Investment Project – MSMIP Final Report 17
Kotamadya Bandung. These companies can pay to discharge their loads into wastewater network connected to the Bojong Soang Wastewater Treatment Plant in Bandung. Environmental drivers include the need to reduce pollution in rivers traversing Cimahi that are tributaries to the Citarum River which is a major water source for Bandung and Jakarta, as well as the prospect of Cimahi rivers at some time becoming a water source for Cimahi. Health drivers include the lack of adequate sanitation in several areas within the city, especially in the residential areas housing workers in the industrial zone and the consequent high levels of waterborne diseases recorded in these areas. Relevant Environmental Standards
Domestic: The National Standard for Effluent Quality is 100 mg /L for BOD and SS. The Oil and Grease standard is 10 mg/L (National Standards for Effluent Quality, Ministry of Environment Decree 112, 2003). Industrial: Local regulations in Cimahi basically stipulate the standard of industrial effluent, fees for waste disposal and waste licenses, standard design of waste related construction, management of ground water and standard cleaning management. Monitoring of the activities of the private septic tank cleaning contractors is minimal and enforcement of the environmental standards is ineffective. There are still septic tank contractors who dispose of the septage incorrectly. Sanitation: Local Government of Cimahi City Regulation No 18/2003, regarding the obligation for companies, houses, housing, hospitals and offices making absorption wells Article 5 (1) provisions are determined based on the number of wells recharge area enclosed building; (2) every building that covers an area of land of at least 50 m² (fifty square metres) are required to make an absorption wells. Article 10; The minimum distance of infiltration wells: septic tank tanks: 2 m, septic tank leach field / cubluk / sewage / garbage disposal: 5 m, clean water wells: 2 m. This IndII Master Plan (2011) employed a wastewater design discharge standard of 50 mgBOD5/L. B. Rationale for Selection of Priority Projects The sub-projects included for implementation during Phase 1 (by 2014) of the IndII Masterplan that was produced for Cimahi City were identified. The City has been visited to ascertain which of the Phase 1 sub-projects are the priorities of the City Government, in that they represent the selected sub-projects that the City would wish to implement in the event of limited loan funds. Cimahi City was visited on the 27th June. Minutes of the Meeting were included in the PPTA Interim Report dated September 2012. At the meeting a presentation was made on the specific “Readiness of the City” with regard to the sub-projects recommended in the WWMPs for the Phase 1 period. In particular, emphasis was placed on the confirmation of the availability of the land for the construction of the WWTP. The City confirmed the land is either now available or will be in the near future. The City has prioritized the sub-projects that they would wish to be included in this MSMIP TA. The following table shows the sub-projects that have been requested for consideration under this PPTA.

TA 7993 - INO: Metropolitan Sanitation Management Investment Project – MSMIP Final Report 18
Table III-B 1: SUB-PROJECTS SELECTED BY THE CITIES FOR FUNDING
City Description of Sub-Project
Cimahi
1. Septage Trucks, (23 No) and Motor Bike tankers, (11 No)
2. Rehabilitation of existing public toilet facilities and 104 new
facilities
3. Rehabilitation of existing communal septic tanks in 5
Kelurahan
4. WWTP and Central Area wastewater collection system
In this PPTA Report we have only evaluated the WWTP and the Central Area wastewater collection system. C. Proposed Wastewater Collection System For details of the proposed wastewater collection system and costings please see the following plans and costings table.

TA 7993 - INO: Metropolitan Sanitation Management Investment Project – MSMIP Final Report 19

TA 7993 - INO: Metropolitan Sanitation Management Investment Project – MSMIP Final Report 20
D. Proposed Waste Water Treatment Plant The site for the Leuwigajah WWTP is only 1.6 Ha (presently) but is expected to expand to 2.0 ha by 2013. The small site translates into an intensive wastewater treatment scheme and higher costs. The site location is in close proximity to local residents and a mosque and odour minimisation would be a major consideration. The MSMIP Review ultimately reduced the flow (and load) from treating 28 MLD of sewage plus commercial wastewater in the IndII MP for Stage 1 to 11.1 MLD of sewage plus commercial wastewater for Stage 1. The change reflects that in the IndII MP the whole of Leuwigajah WWTP was scheduled for Stage 1 with other treatment plants to follow. The MSMIP Review had to account for staging the Leuwigajah WWTP itself. The revised flow will originate from about 8,873 domestic connections and about 1,000 commercial connections by 2020. The treatment process selected by the IndII MP involved: pretreatment + balancing + UASBR (anaerobic treatment) + trickling filter + the option of chlorine disinfection + mechanical sludge dewatering via belt press (inside building). The Reviewer subsequently
SEWERAGE PROPOSED BY CITY FOR ADB LOAN (BASIC DIRECT COST)
Diameter LengthUnit cost
PPTA
(mm) m ( xRp 1000) ( xRp 1000) ($'million)
1 Rising Main - - - - -
Concrete DN 900 mm 2,050 2,100 4,305,000 0.45
Concrete DN 750 mm 900 1,800 1,620,000 0.17
Concrete DN 600 mm 649 1,100 713,900 0.07
6,638,900 0.69
Concrete DN 600 mm 944 1,100 1,038,400 0.11
Concrete DN 450 mm 2,598 720 1,870,560 0.19
Concrete DN 375 mm 460 670 308,200 0.03
3,217,160 0.34
Lateral and Interceptors
26 321,000 8,346,000 0.87
Storm Water Interception
5 58,100 290,500 0.03
6
7
70 12,270 858,900 0.09
1,950 6,510 12,694,500 1.32
8
200 3,150 630,000 0.07
300 3,150 945,000 0.10
9
2,244 3,721 8,351,040 0.87
10
6,000 3,200 19,200,000 2.00
11
1 12,600,000 12,600,000 1.31
*) By MSMHP Yogja: Lateral to the control box - Rp 2 Million + Box control to house - Rp 1.5 Million.
NO ITEMPPTA Reviewed cost
City : CIMAHI
2 Trunk Sewers
3 Main Sewers
Pipe jacking under railway and highway
Storm Water Drain Rehabilitation
Drainage Rehabilitation
Property Connections *)
5
Sewer Manholes - Depth 2.0 - 6.0 meters
4
Sub Total 2 :
Sub Total 3 :
Estimated per hectare
Interception Chambers (No)
Pumping Stations
Manholes and Chambers
Pipe jacking under river
Lateral Sewer Chambers - Depth 1.5 - 2.0 meters
Pipe Work Crossing
Land Acquisition for the WWTP
2.0 Hectare
Total Rupiah (x 1000) 7.68 73,772,000
TA 7993 - INO: Metropolitan Sanitation Management Investment Project – MSMIP Final Report 21
changed the treatment process configuration to one more appropriate for the reduced flows and load with the thought of minimising odour generation sources. The proposed revised process configuration is shown on the next page.

TA 7993 - INO: Metropolitan Sanitation Management Investment Project – MSMIP Final Report 22
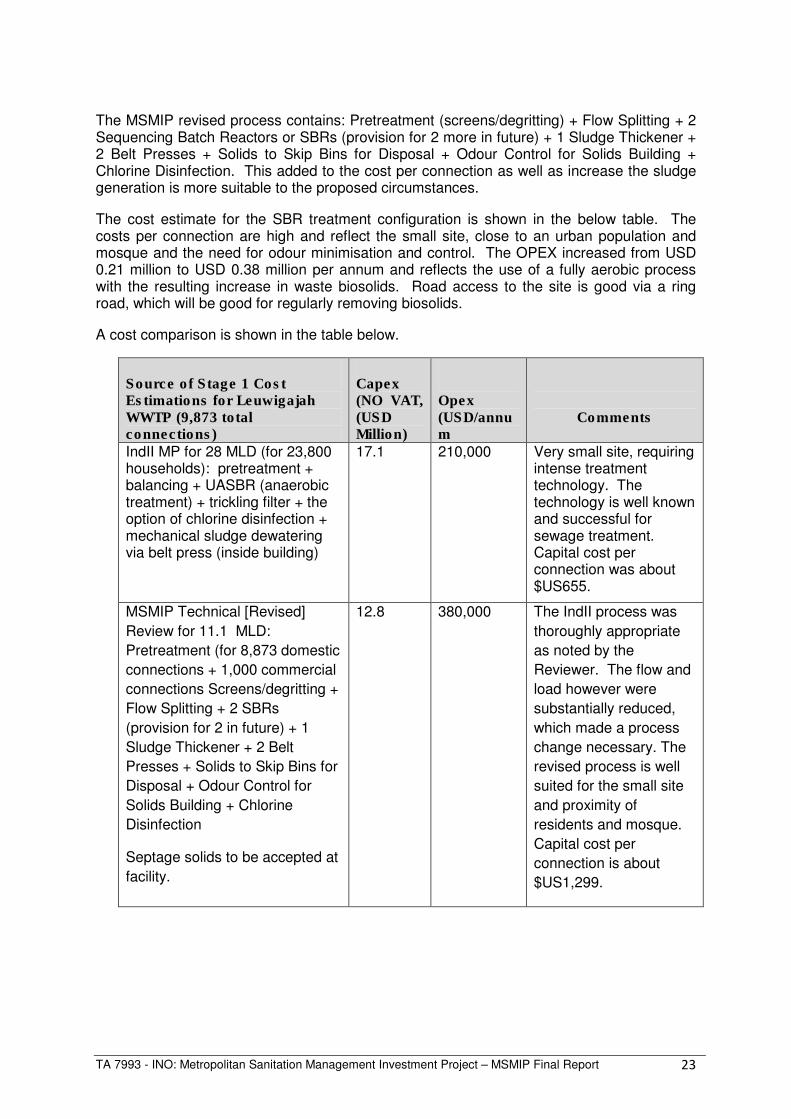
TA 7993 - INO: Metropolitan Sanitation Management Investment Project – MSMIP Final Report 23
The MSMIP revised process contains: Pretreatment (screens/degritting) + Flow Splitting + 2 Sequencing Batch Reactors or SBRs (provision for 2 more in future) + 1 Sludge Thickener + 2 Belt Presses + Solids to Skip Bins for Disposal + Odour Control for Solids Building + Chlorine Disinfection. This added to the cost per connection as well as increase the sludge generation is more suitable to the proposed circumstances.
The cost estimate for the SBR treatment configuration is shown in the below table. The costs per connection are high and reflect the small site, close to an urban population and mosque and the need for odour minimisation and control. The OPEX increased from USD 0.21 million to USD 0.38 million per annum and reflects the use of a fully aerobic process with the resulting increase in waste biosolids. Road access to the site is good via a ring road, which will be good for regularly removing biosolids.
A cost comparison is shown in the table below.
Source of Stage 1 Cost Estimations for Leuwigajah WWTP (9,873 total connections)
Capex (NO VAT, (USD Million)
Opex (USD/annum
Comments
IndII MP for 28 MLD (for 23,800 households): pretreatment + balancing + UASBR (anaerobic treatment) + trickling filter + the option of chlorine disinfection + mechanical sludge dewatering via belt press (inside building)
17.1 210,000 Very small site, requiring intense treatment technology. The technology is well known and successful for sewage treatment. Capital cost per connection was about $US655.
MSMIP Technical [Revised]
Review for 11.1 MLD:
Pretreatment (for 8,873 domestic
connections + 1,000 commercial
connections Screens/degritting +
Flow Splitting + 2 SBRs
(provision for 2 in future) + 1
Sludge Thickener + 2 Belt
Presses + Solids to Skip Bins for
Disposal + Odour Control for
Solids Building + Chlorine
Disinfection
Septage solids to be accepted at
facility.
12.8 380,000 The IndII process was
thoroughly appropriate
as noted by the
Reviewer. The flow and
load however were
substantially reduced,
which made a process
change necessary. The
revised process is well
suited for the small site
and proximity of
residents and mosque.
Capital cost per
connection is about
$US1,299.

TA 7993 - INO: Metropolitan Sanitation Management Investment Project – MSMIP Final Report 24
For a more detailed analysis of the proposals see the table below and Annex Document A -
Technical
Million (IDR)
or Other
Million
(USD)
Percent of
Total
1 Biotreatment Unit Process Area Reqmts, ha 2.0 NA NA
2 5,518 0.40 3%
3 19,943 2.12 17%
4 15,970 1.70 13%
5 4,684 0.50 4%
6 Contingency for Unknown Site Constraints 13,033 1.39 11%
7 Engineering & Construction Management 6,951 0.74 6%
8 Other 58,489 6.22 49%
TOTAL ESTIMATED CAPITAL COSTS: 119,905 12.82Avg Capex/Conn (Mil. IRP/conn. or USD/Dom. conn.): 4.6 491
TOTAL EST. ANNUAL O&M COSTS: 3,551 0.3777Avg. Annual Opex/Conn. (IDR or USD/Dom. conn.): 136,047 14.5
Annual Opex as % of Capex: 2.9%
Note: NA (not applicable); costing does NOT include VAT; Opex = Operating + Maintenance Costs; Capex = Capital Cost
Pretreatment (screens/degritting) + Flow Balancing + 2 SBRs (provision for 2 more) + 1 Sludge Thickener + 2 Belt Presses +
Solids to Skip Bins for Disposal + Odour Control for Solids Building + Chlorine Disinfection
Electrical
REVIEWER LEUWIGAJAH WWTP:
COST SUMMARY
STAGE 1: 11.1 MLD
Approximately 8,873 Domestic Connections + ~1,000
commercial connections
Sequencing Batch Reactors
Estimated Cost for Site Prepatation
Estimated Mechanical Cost
Estimated Civil Cost
E. Cost Estimates and Implementation Schedule Total subproject cost for Cimahi City is $24.18 million equivalent. This is based on the direct costs estimated in the technical study and discussed in previous sections. The subproject cost includes taxes and duties, detailed engineering design, physical and price contingencies, land acquisition and involuntary resettlement cost. Details of the estimate are shown in the following table:

TA 7993 - INO: Metropolitan Sanitation Management Investment Project – MSMIP Final Report 25
Table III-E 1: Summary of Cost Estimates ($ million)
Breakdown of Totals Incl. Cont.
Local
Base For. (Excl. Duties &
Cost a
Exch. Taxes) Taxes Total
1 Wastewater Treatment Works
a. Civil Works 11.73 14.04 8.22 4.42 1.40 14.04
b. Detailed Engineering Design 0.59 0.67 0.20 0.40 0.07 0.67
Subtotal 12.32 14.71 8.42 4.82 1.47 14.71
2 Wastewater Collection System
a. Civil Works 4.81 6.03 1.99 3.43 0.60 6.03
b. Detailed Engineering Design 0.24 0.27 0.08 0.17 0.03 0.27
Subtotal 5.05 6.30 2.07 3.60 0.63 6.30
3 Property Connections
a. Civil Works 2.20 2.82 1.06 1.48 0.28 2.82
b. Detailed Engineering Design 0.11 0.14 0.03 0.10 0.01 0.14
c. Construction Supervision 0.07 0.09 0.02 0.07 0.01 0.09
Subtotal 2.38 3.06 1.10 1.65 0.31 3.06
4 Land Acquisition 0.07 0.07 - 0.07 - 0.07
5 Involuntary Resettlement 0.04 0.05 - 0.05 - 0.05
T O T A L 19.86 24.18 11.59 10.18 2.41 24.18
Total
Cost b
Source: PPTA Consultant’s estimates. a Based on estimates in the technical study.
b Includes taxes, duties, and contingencies (physical and price).
The total investment cost will be financed from various sources: ADB Ordinary Capital Resources (OCR), ASEAN Infrastructure Fund (AIF), AusAID Indonesia Infrastructure Initiative (Aus-AID-INDII), Central Government and City Government of Cimahi.
The available financing will be allocated as follows: ADB OCR and AIF will finance $11.96 million equivalent and $5.98 million equivalent, respectively; AusAID-INDII will finance $0.85 million equivalent for the detailed engineering design; the Central Government will shoulder all taxes and duties of $2.52 million equivalent while the City Government will cover land acquisition, involuntary resettlement and property connections amounting to $2.86 million equivalent. The distribution of fund sources is detailed in the following table:

TA 7993 - INO: Metropolitan Sanitation Management Investment Project – MSMIP Final Report 26
Table III-E 3: Financing Plan ($ million)
AusAID
OCR AIF INDII Central City
1 Wastewater Treatment Works
a. Civil Works 8.42 4.21 - 1.40 - 14.04
b. Detailed Engineering Design - - 0.60 0.07 - 0.67
Subtotal 8.42 4.21 0.60 1.47 - 14.71
2 Wastewater Collection System -
a. Civil Works 3.54 1.77 - 0.72 - 6.03
b. Detailed Engineering Design - - 0.25 0.03 - 0.27
Subtotal 3.54 1.77 0.25 0.74 - 6.30
3 Property Connections -
a. Civil Works - - - 0.28 2.54 2.82
b. Detailed Engineering Design - - - 0.01 0.13 0.14
c. Construction Supervision - - - 0.01 0.08 0.09
Subtotal - - - 0.31 2.75 3.06
4 Land Acquisition - - - - 0.07 0.07
5 Involuntary Resettlement - - - - 0.05 0.05
T O T A L 11.96 5.98 0.85 2.52 2.86 24.18
Government Total
Cost
ADB
Source: PPTA Consultant’s estimates. ADB = Asian Development Bank, AIF = ASEAN Infrastructure Fund, AusAID = Australian Assistance for International Development, INDII = Indonesian Infrastructure Initiative, OCR = Ordinary Capital Resources.
The subproject is proposed to be implemented over six years commencing in 2013 and to be completed by 2018. Operation of the wastewater system is targeted to start as soon as the wastewater treatment works are completed and property connections are installed. The indicative implementation schedule is shown in the following figure:
Figure III-E 4: Indicative Implementation Schedule
1 2 3 4 1 2 3 4 1 2 3 4 1 2 3 4 1 2 3 4 1 2 3 4
Loan negotiation
Loan signing
Loan effectivity
Subproject Investments (for 5 Cities)
Main Works
Detailed engineering design (Grant)
Land acquisition and involuntary resettlement
Compensation for the WCS
Prequalification and bidding
Awarding of contracts
Construction of civil works
Waste Water Treatment Works
Trunk Sewers
Main Sewers
Storm Water Drainage
Laterals and Interceptors
Property Connections
Detailed engineering design
Prequalification and bidding
Awarding of contracts
Construction of civil works
WCS/ WWTW LATERALS
2013 2014 2015 2016 2017 2018

TA 7993 - INO: Metropolitan Sanitation Management Investment Project – MSMIP Final Report 27
The annual breakdown of costs by component is shown in the following table:
Table III-E 5: Estimated Annual Subproject Costs by Component
Totals Including Contingencies (US$ Million)
2013 2014 2015 2016 2017 2018 Total
1 Wastewater Treatment Works
a. Civil Works - 1.90 7.97 4.17 - - 14.04
b. Detailed Engineering Design 0.67 - - - - - 0.67
Subtotal 0.67 1.90 7.97 4.17 - - 14.71
2 Wastewater Collection System
a. Civil Works - 0.34 1.93 2.18 1.06 0.52 6.03
b. Detailed Engineering Design 0.20 0.07 - - - - 0.27
Subtotal 0.20 0.41 1.93 2.18 1.06 0.52 6.30
3 Property Connections
a. Civil Works - - 0.35 0.80 0.82 0.85 2.82
b. Detailed Engineering Design - - 0.02 0.04 0.04 0.04 0.14
c. Construction Supervision - - 0.01 0.03 0.03 0.03 0.09
Subtotal - - 0.37 0.86 0.89 0.92 3.06
4 Land Acquisition 0.07 - - - - - 0.07
5 Involuntary Resettlement - 0.00 0.01 0.01 0.01 0.01 0.05
T O T A L 0.94 2.31 10.28 7.22 1.97 1.45 24.18 Source: PPTA Consultant’s estimates.
F. Financial Analysis 1. Methodology and Assumptions. The financial analysis followed the guidelines described in ADB’s Financial Management and Analysis of Project (2005). Three indicators for the financial viability of the subproject have been identified:
• Financial Internal Rate of Return (FIRR). It is the discount rate at which the net revenues generated by the subproject are equal to zero. A project is considered financially viable if the computed FIRR is at least equal to the weighted average cost of capital (WACC) applicable to the proposed subproject;
• Tariff affordability. The wastewater tariff should be affordable to low income households.
• Subproject sustainability. The funds will be on-granted to the City; however, the subproject should still generate sufficient cash flow from wastewater tariffs to cover annual operations and maintenance requirements.
The key financial and technical assumptions used in the projections are the following:
• Cost estimates at constant October 2012 prices. • Domestic and foreign cost escalations3 are as follows:
3 ADB SERD, Domestic Cost Escalation Factors Update, October 2012 and World Bank projections as of
September 2012 for international cost escalation factors.

TA 7993 - INO: Metropolitan Sanitation Management Investment Project – MSMIP Final Report 28
2013 2014 2015 2016 onwards
Domestic cost escalation 5.1% 4.8% 4.4% 4.4% Foreign cost escalation 1.9% 2.2% 1.9% 1.8%
• Exchange rate at Rp9,600 to US$1.004.
• Physical contingencies at 10% to 15% of direct costs. • Constant costs used in the computation of FIRR while current costs are used in the
financial statements. • Operation and maintenance (O&M) expenses based on technical projections and
escalated at 4.4% annually. • Number of property connections (8,873 domestic and 1,000 non-domestic) based on
plant capacity as presented in the technical evaluation. • Gross revenues equal to number of connections by type, multiplied by the
appropriate tariff. • Collection efficiency of 95%, based on the reported collection efficiency for similar
services (solid waste management). • Loan proceeds from ADB will be passed on by the Central Government to the City as
a grant (i.e. the Central Government will pay all principal and interest due on the loan).
• Cimahi City will set up a Badan Layanan Umum Daerah (BLUD or Regional Public Service Agency) as the service delivery organization (SDO) to operate the wastewater system. A BLUD is a semi-autonomous service provider created for the provision of public service on a non-profit basis. Pending the establishment of the BLUD, a Unit Pelaksanaan Teknis Daerah (UPTD or Regional Technical Implementation Unit) is in the process of being formed under the DInas Kebersihan dan Pertamanan (DKP or Cleanliness and Parks Agency) to handle the preparatory, implementation and initial operational activities. a. Capital Costs
The total development cost for the subproject is $24.18 million equivalent. This is based on the costs presented in the technical study, plus physical and price contingencies.5
The basic development (investment) cost and the O&M costs are projected on an annual basis for the purpose of the financial analysis. The total costs include physical and price contingencies to allow for the timing of implementation, both for local and foreign cost components.
Acquisition of the land required for the subproject and detailed engineering design are scheduled in 2013 prior to construction works. Construction will start by the second half of year 2014 and is targeted to be completed by the end of 2018. Operations will commence in 2016, with full operations expected by 2019.
b. Operations and Maintenance
The proposed subproject is a new system and the SDO is a new entity, so there is no “without project” scenario. O&M costs are estimated by the technical engineers and are
4 Bank of Indonesia. Average rate for period June to December, 2012.
5 To provide an effective wastewater treatment and collection service, the subproject will involve the construction
of a wastewater treatment plant. trunk and main sewers, laterals and interceptors; rehabilitation of selected storm drainage lines; installation of property connections; acquisition of land; and involuntary resettlement activities.
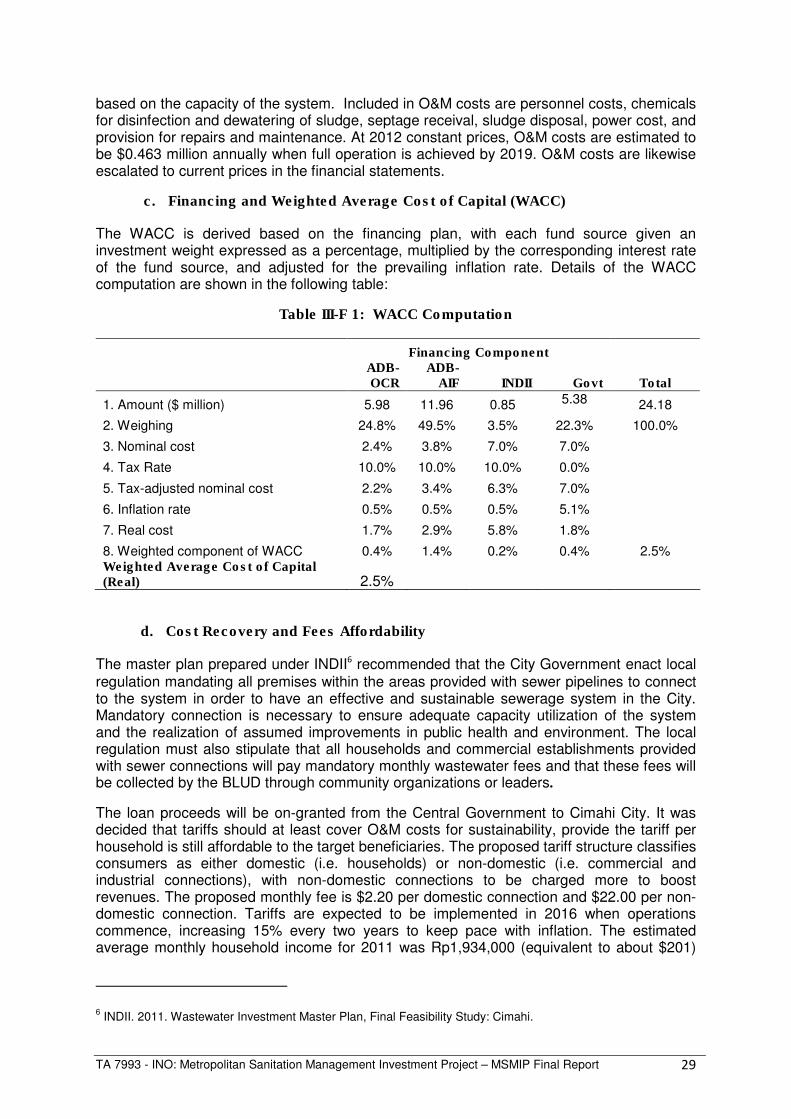
TA 7993 - INO: Metropolitan Sanitation Management Investment Project – MSMIP Final Report 29
based on the capacity of the system. Included in O&M costs are personnel costs, chemicals for disinfection and dewatering of sludge, septage receival, sludge disposal, power cost, and provision for repairs and maintenance. At 2012 constant prices, O&M costs are estimated to be $0.463 million annually when full operation is achieved by 2019. O&M costs are likewise escalated to current prices in the financial statements.
c. Financing and Weighted Average Cost of Capital (WACC)
The WACC is derived based on the financing plan, with each fund source given an investment weight expressed as a percentage, multiplied by the corresponding interest rate of the fund source, and adjusted for the prevailing inflation rate. Details of the WACC computation are shown in the following table:
Table III-F 1: WACC Computation
Financing Component
ADB-OCR
ADB-AIF INDII Govt Total
1. Amount ($ million) 5.98 11.96 0.85 5.38 24.18
2. Weighing 24.8% 49.5% 3.5% 22.3% 100.0%
3. Nominal cost 2.4% 3.8% 7.0% 7.0%
4. Tax Rate 10.0% 10.0% 10.0% 0.0%
5. Tax-adjusted nominal cost 2.2% 3.4% 6.3% 7.0%
6. Inflation rate 0.5% 0.5% 0.5% 5.1%
7. Real cost 1.7% 2.9% 5.8% 1.8%
8. Weighted component of WACC 0.4% 1.4% 0.2% 0.4% 2.5% Weighted Average Cost of Capital (Real) 2.5%
d. Cost Recovery and Fees Affordability
The master plan prepared under INDII6 recommended that the City Government enact local regulation mandating all premises within the areas provided with sewer pipelines to connect to the system in order to have an effective and sustainable sewerage system in the City. Mandatory connection is necessary to ensure adequate capacity utilization of the system and the realization of assumed improvements in public health and environment. The local regulation must also stipulate that all households and commercial establishments provided with sewer connections will pay mandatory monthly wastewater fees and that these fees will be collected by the BLUD through community organizations or leaders.
The loan proceeds will be on-granted from the Central Government to Cimahi City. It was decided that tariffs should at least cover O&M costs for sustainability, provide the tariff per household is still affordable to the target beneficiaries. The proposed tariff structure classifies consumers as either domestic (i.e. households) or non-domestic (i.e. commercial and industrial connections), with non-domestic connections to be charged more to boost revenues. The proposed monthly fee is $2.20 per domestic connection and $22.00 per non-domestic connection. Tariffs are expected to be implemented in 2016 when operations commence, increasing 15% every two years to keep pace with inflation. The estimated average monthly household income for 2011 was Rp1,934,000 (equivalent to about $201)
6 INDII. 2011. Wastewater Investment Master Plan, Final Feasibility Study: Cimahi.

TA 7993 - INO: Metropolitan Sanitation Management Investment Project – MSMIP Final Report 30
based on the results of socio-economic survey conducted in a previous study7. The $2.20 domestic tariff will be 0.9% of the monthly household income, well within the 2% limit under DGHS’ policy for household wastewater charge.8 In all subsequent years, the domestic tariff is expected to remain below 1.06% of household income. It should be noted, however, that the proposed tariff is above the $1.50 tariff target beneficiaries indicated they were willing to pay.
Initially it was assumed that domestic and non-domestic accounts would pay a one-time connection fee. City officials subsequently informed the study team that the City’s current intention is to charge non-domestic connections outright for a one-time connection fee while households will pay in instalment basis to encourage them to connect to the system. The investment cost includes the cost of connections, and as shown in the financing plan, this will initially be funded by the City Government from its own funds.
2. Result of Financial Analysis
The FIRR of the subproject is measured as the discount rate that equalizes the present value cost stream associated with the project to the present value of the project’s benefit stream. A subproject is considered financially viable if the resulting FIRR is higher than the WACC applicable to the subproject. Sensitivity analysis is conducted under four scenarios such as a one-year delay in operation, a 10% increase in project cost, a 10% increase in O&M costs and a 10% decrease in revenues.
The analysis shows that full recovery of the cost of the wastewater system and O&M costs through tariffs alone is not possible, due to affordability constraints and very low willingness to pay for this kind of service. Three scenarios were evaluated: Scenario 1 with tariffs equivalent to the tariff target beneficiaries indicated they were willing to pay; Scenario 2 with tariffs sufficient only to cover O&M costs resulting in a slight positive cash flow (but not sufficient to cover depreciation); and Scenario 3 with full cost recovery of investment and O&M costs. The following table shows the tariffs required for each category and results as to affordability, FIRR, net income and cash flow:
Table III-F 2: Summary Result of Evaluation
Proposed monthly
fee per HH connection
a
Affordability over 10-
year projection period
b
FIRR Net Income after
depreciation
Cash Flow
Willingness to pay
$1.50 0.58% to 0.73%
-1.29% Negative Negative This requires a $2.35 million subsidy from the City for the first 10 years of operation.
Partial Cost Recovery (to cover O&M)
$2.20 0.86%to 1.06%
1.66% Negative Negative This requires a $0.98 million subsidy from the City for the first 2 years of operation only (assuming only those connected are charged), with no additional subsidy
7 INDII. 2011. Cimahi City Master Development Plan - Socioeconomic Survey Report on Domestic Wastewater
Management and Wastewater Investment Program. 8 INDII. 2011. Wastewater Investment Master Plan Package 1: Makassar.

TA 7993 - INO: Metropolitan Sanitation Management Investment Project – MSMIP Final Report 31
required thereafter. Full Cost Recovery
$5.64 2.19% to 2.73%
9.81% Positive Positive No subsidy required.
a Monthly fees are proposed to be increased by 15% every two years.
b Monthly fee as a percentage of average monthly household income. The percentage range represents the
minimum and maximum percentages during the 10-year projection period.
It is recommended that the wastewater fees should at least cover O&M costs to result in a positive cash flow for the SDO. Partial cost recovery ($2.20 per household connection and $22.00 per non-domestic connection) should be the minimum objective since if fees are lower (say, following the willingness to pay of $1.50 per household per month), a significant subsidy from the City Government will be required to make the operation sustainable.
The FIRR results for the recommended partial cost recovery option are provided in the
following table:
Table III-F 3: Summary Result of Financial Evaluation
NPV ($ m) FIRR (%) SI %
Change SV
Base case (2.54) 1.7%
1-Year Delay in Operation (4.27) 1.1% 3.55 10% 28%
Capital cost plus 10% (4.36) 1.2% 2.99 10% 33%
O & M costs plus 10% (3.38) 1.4% 1.60 10% 62%
Revenues less 10% (4.95) 0.8% 5.00 10% 20% FIRR = financial internal rate of return, NPV = net present value SI = sensitivity indicator (ratio of % change in EIRR to % change in a variable) SV = switching value (% change in variable required for EIRR to fall below cut-off rate)
3. Project Financial Sustainability and Implementation Risks
a. Financial Projections for SDO
The financial sustainability and performance of BLUD, the operating entity, was projected over the ten years immediately following full system operation in 2019. The BLUD’s projected financial statements (balance sheet, income statement and cash flow statement for the period 2013 to 2025) are summarized and presented in Tables III-F 4, III-F 5, and III-F 6. Selected financial ratios and performance indicators were used to analyse the results of operations and project viability. Several risks which may impact the BLUD’s financial performance including:
• Uncertainty regarding the implementation of tariff increases;
• Uncertainty on the provision of public service obligation or PSO9 for O&M
costs, as maybe required;
• Inadequate resources for counterpart funding; and
• Inefficiency of its collections.
Tariffs must be periodically raised to keep pace with inflation (the projections assumed tariffs increase by 15% every two years), and the City Government’s approval is required for these increases. If tariffs are not periodically increased, the City Government must provide a
9 Public Service Obligation (PSO) is a form of subsidy provided by the City Government to the SDO.

TA 7993 - INO: Metropolitan Sanitation Management Investment Project – MSMIP Final Report 32
support fund or subsidy to ensure its financial sustainability. These factors should be properly addressed to mitigate the risks enumerated above. The projected revenues were based on the projected increase in the number of connections multiplied by the monthly wastewater service fees, initially $2.20 and $22.00 for domestic and non-domestic consumers, respectively. O&M costs were assumed at current prices. The projected income statements show that the wastewater fees cannot adequately cover the costs of O&M during the initial operating stage from 2016 up to 2018; the City Government will have to cover the operating cost shortfall. However, from 2019 onwards, assuming 95% collection efficiency, results of operations improve with an average net income before depreciation of $0.09 million per year. Net losses arise as revenues are insufficient to cover the full depreciation cost of the system. Depreciation expense is estimated at $0.962 million per year based on straight line computation and assuming an estimated useful life of 25 years. The projected balance sheet for the ten-year period includes the projected assets, liabilities and equity, as presented in Table III-F 6. Total fixed assets reflect mainly the project cost of $24.06 million, comprising roughly 98% of total assets. The debt to equity ratios are expected to be low as the proceeds of the project are on-granted from the Central Government to the City Government. The SDO’s liquidity position has an average ratio of 3:1. Selected financial ratios are presented in the financial statements. Projected cash flows were also developed and showed that capital infusion amounting to $0.98 million will be required in the first two years of operation to cover shortfalls in cash. The cash balances are expected to improve in the following years as a result of the proposed 15% increases in tariff every two years providing for cash sufficiency for operations and maintenance.

TA 7993 - INO: Metropolitan Sanitation Management Investment Project – MSMIP Final Report 33
Table III-F 4 Projected Income Statement ($ million)
2016 2017 2018 2019 2020 2021 2022 2023 2024 2025
Operating Revenues
Water Sales 0.076 0.229 0.438 0.492 0.628 0.659 0.758 0.758 0.871 0.871
Domestic 0.023 0.070 0.135 0.189 0.279 0.310 0.356 0.356 0.410 0.410
Commercial 0.053 0.158 0.304 0.304 0.349 0.349 0.402 0.402 0.462 0.462
Other Operating Revenues 0.034 0.069 0.069 0.049 0.063 0.066 0.076 0.076 0.087 0.087
Total Revenues 0.111 0.297 0.507 0.541 0.691 0.725 0.834 0.834 0.959 0.959
Operating Expenses
Payroll 0.084 0.096 0.109 0.114 0.119 0.124 0.130 0.135 0.141 0.148
Power Cost 0.033 0.034 0.036 0.037 0.039 0.041 0.042 0.044 0.046 0.048
Chemicals 0.186 0.194 0.203 0.212 0.221 0.231 0.241 0.252 0.263 0.274
Maintenance 0.088 0.102 0.116 0.122 0.127 0.132 0.138 0.144 0.151 0.157
Other O & M 0.118 0.126 0.135 0.141 0.147 0.154 0.161 0.168 0.175 0.183
Total 0.509 0.553 0.600 0.626 0.654 0.683 0.713 0.744 0.777 0.811
Net Income before depreciation (0.399) (0.256) (0.093) (0.085) 0.037 0.042 0.121 0.089 0.181 0.147
Depreciation 0.414 0.868 0.936 0.964 0.964 0.964 0.964 0.964 0.964 0.964
Net Operating Income (Loss) (0.813) (1.123) (1.028) (1.049) (0.927) (0.922) (0.844) (0.875) (0.783) (0.817)
Less: Interest Expense - - - - - - - - - -
Net Income (0.813) (1.123) (1.028) (1.049) (0.927) (0.922) (0.844) (0.875) (0.783) (0.817)

TA 7993 - INO: Metropolitan Sanitation Management Investment Project – MSMIP Final Report 34
Table III-F 5 – Projected Balance Sheet ($ million)
2013 2014 2015 2016 2017 2018 2019 2020 2021 2022 2023 2024 2025
ASSETS
Fixed Assets
Fixed Assets in Operation 0.00 0.00 0.00 20.72 22.67 24.11 24.11 24.11 24.11 24.11 24.11 24.11 24.11
Less: Accum. Depreciation 0.00 0.00 0.00 0.41 1.28 2.22 3.18 4.15 5.11 6.07 7.04 8.00 8.97
Net Fixed Assets in Operation 0.00 0.00 0.00 20.31 21.39 21.89 20.92 19.96 19.00 18.03 17.07 16.10 15.14
Add: Work-in-Progress 0.94 3.25 13.52
Total Fixed Assets 0.94 3.25 13.52 20.31 21.39 21.89 20.92 19.96 19.00 18.03 17.07 16.10 15.14
Current Assets
Cash 0.00 0.00 0.01 0.10 0.10 0.10 0.10 0.08 0.05 0.11 0.13 0.24 0.30
Accounts Receivable (net) 0.00 0.00 0.00 0.00 0.01 0.02 0.04 0.05 0.07 0.07 0.08 0.08 0.10
Inventory 0.00 0.00 0.00 0.00 0.04 0.04 0.04 0.04 0.04 0.04 0.04 0.04 0.04
Other Current Assets 0.00 0.00 0.00 0.04 0.04 0.04 0.04 0.04 0.05 0.05 0.05 0.05 0.06
Total Current Assets 0.00 0.00 0.01 0.13 0.18 0.20 0.23 0.22 0.21 0.27 0.30 0.41 0.49
Reserves 0.00 0.00 0.00 0.00 0.01 0.04 0.08 0.13 0.18 0.24 0.30 0.37 0.44
TOTAL ASSETS 0.94 3.25 13.53 20.45 21.59 22.13 21.23 20.30 19.38 18.54 17.67 16.89 16.07
LIABILITIES AND EQUITY
Current Liabilities
Accounts Payable 0.00 0.00 0.00 0.04 0.08 0.08 0.08 0.09 0.09 0.09 0.09 0.09 0.10
Total Current Liabilities 0.00 0.00 0.00 0.04 0.08 0.08 0.08 0.09 0.09 0.09 0.09 0.09 0.10
Equity
Donated Capital 0.94 3.25 13.53 21.22 23.45 25.01 25.16 25.16 25.16 25.16 25.16 25.16 25.16
Retained Earnings 0.00 0.00 0.00 (0.81) (1.94) (2.96) (4.01) (4.94) (5.86) (6.71) (7.58) (8.36) (9.18)
Total Equity 0.94 3.25 13.53 20.41 21.51 22.05 21.14 20.22 19.29 18.45 17.57 16.79 15.97
TOTAL LIABILITIES AND EQUITY 0.94 3.25 13.53 20.45 21.59 22.13 21.23 20.30 19.38 18.54 17.67 16.89 16.07
Projected

TA 7993 - INO: Metropolitan Sanitation Management Investment Project – MSMIP Final Report 35
Table III-F 6: Projected Cash Flow Statement ($ million)
2013 2014 2015 2016 2017 2018 2019 2020 2021 2022 2023 2024 2025
Sources of Cash
Collection of Revenues - CY - - - 0.076 0.221 0.415 0.448 0.576 0.592 0.687 0.675 0.789 0.776
Collection of Receivables - PY - - - - - 0.008 0.023 0.045 0.052 0.067 0.071 0.083 0.083
Other Receipts - - - 0.034 0.069 0.069 0.049 0.063 0.066 0.076 0.076 0.087 0.087
Grant Funds - INDII 0.935 0.303 1.410 1.552 1.034 0.996 -
Central Government 0.087 0.238 1.064 0.762 0.216 0.154
INDII 0.783 0.063 - - - -
City Government 0.065 0.002 0.345 0.790 0.818 0.842
Proceeds of Loan - 2.010 8.874 5.668 0.937 0.456
ADB-OCR 0.670 2.959 1.890 0.313 0.152
ADB-AIF 1.340 5.915 3.778 0.624 0.304
Capital Contribution 0.471 0.255 0.109 0.146
Total Sources of Cash 0.935 2.314 10.284 7.802 2.515 2.053 0.666 0.684 0.709 0.830 0.822 0.958 0.946
Uses of Cash
Equity
Project Investment 0.935 2.314 10.275 7.200 1.950 1.432
O & M Expenses and Working Capital - - - 0.509 0.553 0.600 0.626 0.654 0.683 0.713 0.744 0.777 0.811
Reserves - - - 0.002 0.011 0.022 0.039 0.050 0.053 0.061 0.061 0.070 0.070
Total Uses of Cash 0.935 2.314 10.275 7.712 2.514 2.053 0.666 0.704 0.735 0.774 0.805 0.847 0.881
Increase(Decrease) in Cash - - 0.009 0.090 0.001 (0.000) 0.000 (0.020) (0.026) 0.056 0.017 0.111 0.065
Add: Cash Balance, Beg. - - - 0.009 0.100 0.100 0.100 0.100 0.080 0.053 0.109 0.126 0.238
Cash Balance, End. - - 0.009 0.100 0.100 0.100 0.100 0.080 0.053 0.109 0.126 0.238 0.303
Projected

TA 7993 - INO: Metropolitan Sanitation Management Investment Project – MSMIP Final Report 36
4. Municipal Finance
Currently, the Dinas Kebersihan dan Pertamanan (DKP or Environmental Health and Hygiene Agency) undertakes the City’s environmental sanitation activities, with funding of its capital investments and O&M costs coming from the City Government’s annual budget. The DKP prepares an annual program and the annual budget ceiling is consolidated into the City Government’s annual budget. The DKP’s annual budget is not linked or limited to the revenues it expects to generate; as one of the agencies of the City, its budget allocation depends on the City Government’s environmental sanitation priorities and projects.
Historical Income and Expenditures
Aside from fund transfers from the Central Government, major sources of the City Government’s local source revenues (PAD) during the period 2008-2012 were local taxes for street lights and the service income of the local general hospital. With the enactment of Law No. 28/2009, effective 1 January 2011, taxes on transfers of ownership of land and building (BPHTB) are now administered by the City Government as local source revenue (i.e. no longer shared revenues (Dana Bagi Hasil)). Taxes on land and buildings (PBB) will be treated as local source revenues effective 31 December 2013 at the latest. Historical data on the city’s financial performance is presented in Table III-F 7.
Projected Income and Expenditures Individual revenue and expenditure items have been projected using historical trends and best estimates of local officials. When the City Government takes full control of the land and building tax administration (i.e. from both PBB and BPHTB), the City Government’s revenues are expected to increase significantly. The surplus projected in the short term is assumed to be available for some of the investments required for improved urban sanitation services. Surplus income can be used by the City Government to finance the PSO that the City Government will be required to provide to the SDO responsible for sanitation (including O&M and periodic major capital expenditures). Table III-F 8 presents income projections before MSMIP. From this, the requirements of MSMIP in terms of equity for the investment amounting to $2.85 million and subsidy for the initial years of operation amounting to $0.63 million were included. The evaluation shows that the City Government will have sufficient funds to cover the equity and initial O&M requirements of the subproject.

TA 7993 - INO: Metropolitan Sanitation Management Investment Project – MSMIP Final Report 37
Table III-F 7:
HISTORICAL MUNICIPAL FINANCE - CIMAHI
FISCAL YEARS 2008 - 2012
(In Million Rupiah)
Item 2008 2009 2010 2011 2012 '08 - '09 '09 - '10 '10 - '11 '11 - '12 Average
REVENUE 501,737 592,054 619,489 721,747 905,511
Local Revenue 64,965 75,037 87,321 116,678 110,096 1.16 1.16 1.34 0.94 1.15
Local tax 15,919 17,089 19,711 42,614 40,278 1.07 1.15 2.16 0.95 1.33
Retribution 38,341 47,616 7,917 8,382 6,700 1.24 0.17 1.06 0.80 0.82
Income from state-owned enterprises 4,035 5,448 7,162 6,206 8,206 1.35 1.31 0.87 1.32 1.21
Others 6,670 4,884 52,532 59,477 54,912 0.73 10.76 1.13 0.92 3.39
Transfer from Central Government 385,340 439,802 468,222 422,164 535,081 1.14 1.06 0.90 1.27 1.09
Tax/non tax revenue 52,654 69,056 71,843 65,451 67,305 1.31 1.04 0.91 1.03 1.07
General allocation fund 305,009 339,000 333,439 354,745 440,860 1.11 0.98 1.06 1.24 1.10
Special allocation fund 27,677 31,746 62,939 1,967 26,916 1.15 1.98 0.03 13.68 4.21
From Province & Other 51,432 77,215 63,946 182,905 197,915 1.50 0.83 2.86 1.08 1.57
Allocation of tax revenue from Province 30,422 31,577 31,446 43,969 38,048 1.04 1.00 1.40 0.87 1.07
Autonomy fund 2,426 8,616 0 148,867 3.55 -
Support from Province 18,470 35,407 31,782 46,607 11,000 1.92 0.90 1.47 0.24 1.13
Others 114 1,615 718 92,328 14.17 0.44 128.63 - 7.31
Municipal Saving (From Previous Surplus) 62,419
EXPENSES 511,382 541,072 636,203 738,304 905,511 1.06 1.18 1.16 1.23 1.16
Operating Expenses 250,119 291,189 543,375 633,959 500,941 1.16 1.87 1.17 0.79 1.25
Employees 350,650 423,061 447,266 1.21 1.06 1.13
Grant 30,704 27,881 48,541 0.91 1.74 1.32
Financial Assistance 781
Social Assitance 7,343 7,361 332 1.00 0.05 0.52
Interest 1,281 1,316 1,232 1.03 0.94 0.98
Goods 153,396 174,340 1.14 - 0.57
Subsidy
Capital Expenses 261,263 249,883 92,828 104,344 404,570 0.96 0.37 1.12 3.88 1.50
Surplus/(Deficit ) Before MSMIP (Rp mil) (9,645) 50,982 (16,714) (16,557) - (5.29) (0.33) 0.99 -
Growth RateActual

TA 7993 - INO: Metropolitan Sanitation Management Investment Project – MSMIP Final Report 38
Table III-F 8:
PROJECTED MUNICIPAL FINANCE - CIMAHI
FISCAL YEARS 2013 - 2025
(In Million Rupiah)
Projection --->
Item 2013 2014 2015 2016 2017 2018 2019 2020 2025
REVENUE 1,087,098 1,204,494 1,342,041 1,505,843 1,704,641 1,841,013 1,988,294 2,147,357 3,155,172
Local Revenue 122,584 136,611 152,378 170,110 190,063 205,268 221,689 239,425 351,793
Local tax 46,320 53,268 61,258 70,446 81,013 87,495 94,494 102,054 149,950
Retribution 6,834 6,971 7,110 7,252 7,397 7,989 8,628 9,319 13,692
Income from state-owned enterprises 9,027 9,929 10,922 12,014 13,216 14,273 15,415 16,648 24,462
Others 60,403 66,444 73,088 80,397 88,436 95,511 103,152 111,404 163,689
Transfer from Central Government 634,860 714,495 810,169 927,522 1,074,780 1,160,762 1,253,623 1,353,913 1,989,342
Tax/non tax revenue 87,497 96,246 105,871 116,458 128,104 138,352 149,420 161,374 237,111
General allocation fund 506,989 557,688 613,457 674,802 742,283 801,665 865,798 935,062 1,373,913
Special allocation fund 40,374 60,561 90,842 136,262 204,393 220,745 238,404 257,477 378,318
From Province & Other 329,655 353,388 379,494 408,211 439,799 474,983 512,981 554,020 814,037
Allocation of tax revenue from Province 41,853 46,038 50,642 55,706 61,277 66,179 71,473 77,191 113,419
Autonomy fund 148,867 163,754 180,129 198,142 217,956 235,393 254,224 274,562 403,422
Support from Province 46,607 51,268 56,395 62,034 68,238 73,697 79,593 85,960 126,304
Others 92,328 92,328 92,328 92,328 92,328 99,714 107,691 116,307 170,893
Municipal Saving (From Previous Surplus)
EXPENSES 1,081,878 1,189,804 1,308,529 1,439,135 1,582,801 1,721,272 1,872,005 2,036,100 3,103,006
Operating Expenses 677,308 744,777 818,999 900,652 990,470 1,069,708 1,155,285 1,247,707 1,833,292
Employees 447,266 491,993 541,192 595,311 654,842 707,230 763,808 824,913 1,212,067
Grant 53,395 58,735 64,608 71,069 78,176 84,430 91,184 98,479 144,698
Financial Assistance 820 861 904 949 997 1,077 1,163 1,256 1,845
Social Assitance 349 366 384 404 424 458 494 534 784
Interest 1,139 1,050 960 873 782 844 912 985 1,447
Goods 174,340 191,773 210,951 232,046 255,250 275,670 297,724 321,542 472,451
Subsidy
Capital Expenses 404,570 445,027 489,530 538,483 592,331 651,564 716,720 788,392 1,269,714
Surplus/(Deficit ) Before MSMIP (Rp mil) 5,220 14,690 33,512 66,708 121,840 119,741 116,289 111,257 52,167
Surplus/(Deficit ) Before MSMIP ($ mil) 0.54 1.53 3.49 6.95 12.69 12.47 12.11 11.59 5.43
Required subsidy for MSMIP 0.065 0.00 0.35 1.26 1.07 0.95 0.15 0.00 0.00
Surplus/(Deficit ) After MSMIP ($ mil) 0.48 1.53 3.15 5.69 11.62 11.52 11.97 11.59 5.43

TA 7993 - INO: Metropolitan Sanitation Management Investment Project – MSMIP Final Report 39
G. Economic Analysis
1. Scope of analysis Economic analysis was undertaken for the proposed investments in off-site sewerage system in Cimahi City. The proposed investments include: (i) a piped network of trunk sewers, main sewers, laterals and interceptors, including property connections, for collecting wastewater from sources within the city’s central business district (CBD), and (ii) a centralized wastewater treatment plant to be built in Leuwigajah which is located about 3 km from the city center. The economic analysis includes an evaluation of the economic feasibility of the proposed subproject and the impact of changes in key variables on the economic feasibility of the investments. The analysis also includes an analysis of the distribution of economic benefits to stakeholders, including the poor.
2. Economic costs and benefits
Economic costs and benefits are expressed in constant October 2012 prices using domestic price numeraire. Costs include capital investments for the piped sewerage network, treatment plant, land, resettlement and O&M costs. The economic benefits considered in the analysis consist, among others, of (i) savings in health care costs for major sanitation-related diseases in the city such as diarrhea, typhoid and dengue resulting from reduced morbidity incidence due to improved wastewater management, (ii) avoided loss of income or productivity savings, (iii) avoided costs of desludging/constructing septic tanks, and (iv) averted costs of accessing polluted water for drinking and other domestic uses. The economic analysis was performed over a period of 25 years, including 5 years of investment implementation. Civil works construction was assumed to commence in 2014, with benefits starting to accrue in 2016.
Financial investments at constant October 2012 prices amount to approximately Rp249.8 billion, of which 54% is for the treatment plant, 39% for sewer network, and the remainder for land and related investments. By excluding taxes/duties and applying a conversion factor of 0.91, the total economic cost of the proposed subproject was estimated at about Rp204.6 billion.
3. Valuation of economic benefits
The economic benefits of the proposed sewerage system which were considered in the analysis and the bases for their valuation are as follows (see Annex B – Financial and Economic Analysis):
a. Health benefits. Providing wastewater collection and treatment facilities is expected to reduce the incidence of sanitation-related diseases and reduce the costs of medical treatment as well as related health care services. The analysis considered diarrhea/gastroenteritis, typhoid and dengue which are among the major leading causes of morbidity in the city. Valuation of health benefits was based on the incidence rate of diseases, average cost of treatment, the proportion of cases seeking medical treatment in medical care facilities, and the average duration of illness. In Cimahi City, the average cost of hospital treatment for diarrhea patients is Rp222,000/patient/day while for non-severe cases that do not require hospitalization, cost is around Rp80,000/day. For typhoid and dengue, the respective costs are Rp272,000

TA 7993 - INO: Metropolitan Sanitation Management Investment Project – MSMIP Final Report 40
and Rp377,000/day. Reduction in disease incidence was assumed at 35%10. The present value (PV) of health care cost savings within the subproject area over the 25-year period was estimated at Rp10.1 billion.
b. Avoided loss of income/productivity savings. People afflicted with the diseases are kept out of work and other daily activities resulting in loss of income or productivity. The economic impact of illness becomes critical especially when the patient is the sole or major income earner in the family. Reduced morbidity reduces income/productivity losses. The value of this benefit was computed based on the proportion of patients who are economically active and the compensation that a person receives for being on the job. Compensation was based on minimum wage in the city. For in-patients, total loss of income also includes the foregone income of household member(s) who would otherwise provide care if a sick member is confined in a hospital/clinic. It was assumed in the analysis that one household member assumes this role. Valuation of the additional foregone income also takes into account the number of days that a patient is sick, employment rate and average income of the person involved. PV of this benefit was estimated at Rp6.6 billion.
c. Avoided costs of desludging/constructing septic tanks. This benefit is generated because once a property is connected to the sewerage network it foregoes the need for regular desludging or emptying of septic tank. The current cost of desludging in Cimahi City is Rp300,000 per service. Desludging frequency was assumed at once every three years.11 For properties with no septic tanks but are connected to the sewerage system, the amount that is saved for not constructing a septic tank is an added benefit of having access to the network. Septic tank in the city costs about Rp4.0 million. The present value of this benefit is about Rp18.2 billion.
d. Averted costs of accessing polluted water for drinking/domestic use.
Unabated pollution of water sources because of uncontrolled and improper disposal of wastewater, including human excreta, correspondingly increases the cost of water especially for drinking and other domestic uses. Pollution leads to avertive behavior on the part of water users either through the use of more costly technologies to improve water quality, increased treatment or resort to alternative supplies (e.g., bottled water) which generally cost higher. This benefit was valued by estimating the total cost of water for both PDAM and non-PDAM users based on consumption rate, price of piped and non-piped water and attribution rate of pollution to total cost of water. In West Java, domestic sources of pollution such as households, commercial establishments and institutions were assessed to contribute 15% to overall water pollution, with industry contributing 70% and agriculture, 10%12. In the case of Cimahi City, however, a higher attribution rate of 50% from domestic sources was assumed in the analysis considering that the CBD, and more specifically the subproject area, has barely any industrial and agricultural sources of pollution and that direct disposal of human excreta and wastewater
10 Based on WHO data which estimated morbidity reduction rate for diarrhea of 22.7%-37.5% due to improved
excreta disposal. A survey and review of literature conducted by Esrey, et. al. also showed a 36% reduction in diarrhea incidence because of improved water supply and sanitation (Esrey, S.A, Potash, J.B. Roberts, and Shiff, C. Health Benefits for Improvements in Water Supply and Sanitation–Survey and Analysis of Literature on Selected Diseases, WASH Technical Report No. 66. 11
Based on SNI 03-2001: Tata Cara Perencanaan Tangki Septik Dengan Resapan, 2001. 12
World Bank Water and Sanitation Program, Economic Impacts of Sanitation in Indonesia, August 2008.

TA 7993 - INO: Metropolitan Sanitation Management Investment Project – MSMIP Final Report 41
from individual houses and commercial establishments to waterways was observed to be common and widespread. Based on these assumptions, the PV of total averted costs over the 25-year period was estimated at Rp182.3 billion.
4. Un-quantified benefits
There are other economic benefits to be derived from improved wastewater management system which were not included in the analysis for lack of data and consequently, the difficulty of valuing their respective economic impact. These un-quantified benefits include, among others, the following:
a. Health care cost savings from reduced incidence of other sanitation-related
diseases; b. Value of sludge derived from the wastewater treatment process for use in
agriculture either as soil conditioner or fertilizer; c. Increased agricultural productivity and value of fish catch due to reduced
water pollution; d. Increased value of land previously made unusable or became marginally
productive because of pollution; and e. Impact of improved wastewater management on local tourism and economy. 5. Results of the economic analysis
Under the “base case”, the economic internal rate of return (EIRR) of the proposed investments exceeds the assumed 12% economic opportunity cost of capital (EOCC), hence, the subproject is deemed economically feasible (Table III-G 1). The present value of total net economic benefits (ENPV) amounts to Rp17.1 billion.
Table III-G 1: Results of Economic Analysis (Base Case)
Subproject EIRR (%)
ENPV (Rp billion)
Cimahi sewerage system 13.7 17.1
EIRR = economic internal rate of return, ENPV = economic net present value
6. Sensitivity analysis
Sensitivity tests assuming (i) a 10%-increase in capital investments, (ii) a 10%-increase in O&M costs, (iii) a 10%-reduction in total benefits, and (iv) one-year delay in total benefits indicate that the subproject remains economically feasible, with EIRR remaining at or above the threshold. A combination of the first three cases where investments and O&M costs simultaneously increase by 10% while total benefits are 10% below the “base case” estimate - a condition that might be considered “worse case” scenario – results in EIRR that are slightly below the benchmark (Table III-G 2).

TA 7993 - INO: Metropolitan Sanitation Management Investment Project – MSMIP Final Report 42
Table III-G 2: Results of Sensitivity Analysis
Case
Change from Base Case (%)
EIRR (%)
ENPV (Rp billion)
Switching Value (%)
Capital investment O&M costs Total benefits 1-yr delay in benefits Combination (Cases 1, 2, 3)
+10 +10 -10
12.3 13.5 12.0 11.7 10.5
3.0
15.4 -.2
-3.2
-16.0
+12
+103 -10
-
-
EIRR = economic internal rate of return, ENPV = economic net present value, O&M = operation and maintenance.
The sensitivity analysis shows that the investments are most sensitive to reductions in total benefits, followed closely by increase in capital costs or cost overruns. Changes in O&M costs were found to have very little impact on the economic feasibility of the investments.
7. Distribution of benefits
The sewerage system investments will directly benefit a total of about 53,238 people (8,873 households) and 1,000 commercial establishments within the CBD.
Households and commercial establishments are therefore the principal direct beneficiaries of the subproject. In addition to the afore-mentioned beneficiaries is the Cimahi City government itself, through its service delivery organization (SDO). Of the estimated total economic benefits of Rp228.3 billion, about 70% (consisting of health and productivity savings, averted costs of accessing clean water, and cost savings from desludging/constructing septic tanks) will directly accrue to households. Commercial establishments will gain 25% of the benefits in terms of averted costs of accessing clean water and cost savings on septic tank maintenance. About 5% of the benefits will go to the SDO in the form of service payments from those that are connected to the system and avail of the wastewater treatment service.
The poverty impact ratio (PIR) of the investments was computed at 16%, which means that about one-fifth of the subproject benefits will go to the poor.
H. Gender Analysis and Gender Action Plan
1. Background and Objective A gender-responsive project such as the MSMIP is one that involves an understanding of issues and problems from the perspectives of both men and women in the development process. Mainstreaming gender entails the integration of a gender perspective in the project design. Thus, a Gender Analysis is undertaken for ADB projects to identify project design elements that will enable women to participate in and benefit from the Project. It is identified factors that have the potential to exclude women from participating in or benefiting from the Project. Data for this analysis are obtained from available material from socio-economic surveys that were prepared during the preparation of a Master Plan for Wastewater Management. Under the PPTA, gender analysis made use of qualitative methods in addition to reviewing documents from Cimahi City. Gender analysis looked into gender issues and

TA 7993 - INO: Metropolitan Sanitation Management Investment Project – MSMIP Final Report 43
differences in the roles and responsibilities of women and men, their participation in social and economic life and the differential impacts on their lives of sanitation programs and services. Women were a key part of PPTA process.
2. Gender Characteristics Of the 381 respondents who represent their households, 86.9% represent the households headed by men while 13.1% represented households headed by women. All respondents were functionally literate but of different levels of education; 30.4% have completed primary education while the rest belong to respondents with high school or college education. Data were not disaggregated by sex, but interview results indicate that younger women tended to pursue education just as men did. Women could work in textile factories in jobs that did not afford tenure security. Lack of access to capital and livelihood opportunities was identified as a problem for women.13
3. Decision Making and Gender Roles
From the a review of the Master Plan, decision making of household economic activities by women (wife) was at 50%, while men was at 32%; activities such as ensuring that monthly payments (water service, electricity, etc) were the responsibilities of women (58%) as against 19% for both men and women; decisions for making new toilets by both is (50%), while decisions by just men is 32%. This indicates a tendency towards shared decision-making for major family decisions. These highlight the need to involve women and not just heads of households in community meetings, informational activities and project processes to decide on whether or not to connect to sewerage services. Since women play an important role in child rearing and socialization, they can serve as important channels for education campaign on hygiene and sanitation.
4. Women’s Perceptions on the Project For the Cimahi community, any improvement in sanitation is perceived to benefit all, women and men alike, including those at various economic levels. The communities agreed that the project will benefit the overall well-being of the community. Some, such as those related to the street food industry, acknowledged benefit to their livelihood. Technically, women recognized possible constraints to connection. Some houses are in lower elevations; in flood-prone areas. Some point out lack of space for sewer lines to homes. A solution is that where there are onsite sanitation systems, sewer lines may connect to communal septic tanks instead of directly to homes. Another acknowledged benefit is that their environment will be cleaner and there will be no unpleasant odor anymore, especially in areas that are prone to flooding. On project participation, women look forward to being involved in sanitation planning as well as in socialization and project promotion in their neighborhoods. People around the proposed Waste Water Treatment Plant hoped to benefit as well but no sewer lines are planned for the area. Women participants observed that there was a general lack of awareness and understanding of the benefits of improved sanitation. They noted that some of houses along the waterways were big houses of permanent structures. They pointed out that just like
13
Additional/comparative data are included in the Poverty and Social Analysis, Annex D of the MSMIP Final Report.

TA 7993 - INO: Metropolitan Sanitation Management Investment Project – MSMIP Final Report 44
those with less income, they also disposed of wastewater into rivers and waterways. They see the importance of public raising awareness on sanitation with the help of village officials.
5. Willingness to Connect
In follow-up discussions with women and community members, the community’s intended participation was high, if connection did not entail heavy cost. Intended cost sharing was largely through monthly fees that used current benchmark for communal sanitation (Rp5,000) as the preferred rate. They also pointed that sliding fee scale may be adopted for those who are truly unable to pay. This would be based on existing programs for determining eligibility for subsidy for other government services. There were various levels of willingness to pay which were unrelated to economic standing. On the other hand, all those asked had women expressing willingness to contribute to sanitation improvement activities in the form of planning, development and maintenance. The most common contribution that was offered was labor; some were willing to contribute material and money as well towards sewerage connection. Most women also expressed a willingness to provide food and drink during construction. There were concerns of possible high cost of connection. The community’s spirit of contribution to sanitation improvement was very high and the community was well-organized through their current roles in sanitation to help implement the project. This willingness needs to be leveraged in mobilizing community participation in the project. Women leaders also recognized the need for facilitation in community sanitation management as well as in the operation and maintenance of onsite sanitation. A women leader at WWTP site requested representation in monitoring committee for resettlement and in construction and monitoring of operations of the WWTP.
6. Sanitation Hot Spots
The area around the proposed site for the WWTP at Leuwigajah Village is highly populated. Laborers and informal settlers reside in rental properties. There is inadequate sanitation. Waste water is disposed directly into canals and into open space. Women expressed interest in the project and willingness to connect if service would be available and affordable. On the other hand, WWTP site is outside the sewerage service area. Women would like to be represented in monitoring body/mechanism on WWTP site operations.
7. Projected Impact of Construction for Women
Women did not expect to get jobs from construction. On the other hand, Key Informants from the WWTP site noted that construction camps are frequently poorly serviced and unsafe for children; construction sites may give little attention to occupational health and safety. Some temporary disturbance identified were reduction in livelihood (business owner, shops, stores, kiosk, food stalls); people with physical defects and elderly may have difficulty with mobility. During construction, it may become very noisy and people cannot sleep well or children cannot play freely anymore at project areas. They feel that mitigation measures will be needed and that contractors coordinate with residents on temporary disturbances. Given concerns for construction site occupational health and safety (section 7), suggest insert mitigation measures - for example, "Consult with men and women, especially mothers, during the design finalization of XX schemes to ensure children's safety is considered" and "Ensure contractor provides safe working conditions, work environment free of harassment and separate sanitation facilities for women".

TA 7993 - INO: Metropolitan Sanitation Management Investment Project – MSMIP Final Report 45
8. Local Organizations
The following is a report on local organizations and their contribution to sanitation
improvement.
• In Cimahi there is no NGO that is concerned only with sanitation. There may be NGOs in Bandung with projects in Cimahi, but Bappeda did not have the list of the NGOs. Because there is not any NGO with a concern in sanitation and environment, the city has not involved them yet in SKPD (Satuan Kerja Perangkat Daerah).
• In Cimahi there are some women organizations and local community groups concerned with environmental activities including water and sanitation, for example, some public toilets are managed by them. These organizations (Sanitation Management Institution) are PKK, KSM, PSM, LPM, PKM, Pokmas, RT/RW, and some cadres of Posyandu. These organizations expressed interest and have potential as partners for improved sanitation education in and outside the project site. Therefore, for the IPAL project, these community organizations may have a big chance to contribute in the areas for planning, monitoring and training.
• Women representatives in Cimahi City are active in community affairs. They expressed willingness to contribute to the project through socialization in their neighborhood as well as with their families to contribute to connection costs – e.g. food preparation for workers, labor and materials.
• The PMJK study (Study of Community and Gender Empowerment and Poverty) showed that the organizations PKK and RT/RW have a big role in coordinating institutions and communities towards accelerating the campaign on sanitation. These organizations have great potential contribution to the campaign of socialization on sanitation including at the IPAL project. It can be expected that in Cimahi, women and their organizations could facilitate socialization for household connection and on sanitation and hygiene promotion.
9. Institutional Gender Assessment POKJA Sanitasi in Cimahi City has a consultant (Konsultan Pendampingan) to assist in water sanitation activities including gender aspects. Sanitation Pokja with SK Walikota and Forum Kota Sehat are active in facilitating health public campaign in sanitation promotion and development of sanitation based community. The members of the board of Sanitation Pokja are also in the board of Forum Kota Sehat. These are the Health Office, DKP, BPMPKB which have a public awareness campaign on health and sanitation.
There were no gender action plans for Bappeda or members of the Sanitation Pokja or in Dinas Kebersihan dan Pertamanan (DKP). It is their assessment that these can accommodate gender equity issues on the management of waste water and in developing strategies to maximize positive impacts on women. Dinas Kebersihan dan Pertamanan (DKP) can accommodate gender equity issues regarding management waste water in developing strategies to maximize impacts on women, although recently the DKP has not yet conducted socialization on the project. Also there is no gender focal person in the city. Cimahi city set aside budget from Central Government Budget for Income and Expenditure (APBN) and Local Government Budget for Income and Expenditure (APBD) as gender fund. In addition, the Agency for Community Empowerment, Women Empowerment and Family Planning (BPMPPKB) is a key supporter of the Mayor’s tasks. Their role of community empowerment is contributing to the formal empowerment of the community (Organization for Community Empowerment/LPM, RW, RT). The agency is expected to participate in development activities for the welfare of the community, including in the field of environment and sanitation.

TA 7993 - INO: Metropolitan Sanitation Management Investment Project – MSMIP Final Report 46
In terms of staffing pattern, at the BAPPEDA office, women staff was as many as men (21 persons each) though more males were in management positions. DKPP has 60% male and 40% female staff. It is the perception that there are no gender issues of staff such as lower wages or positions for women. The city applied criteria such as competency, education, etc, for staff positions. There was reportedly no discrimination based on sex. Women will benefit by being mainstreamed into decisions about waste water services through participation in community groups/local organizations, and in project management structures. Through their participation in the project, it’s expected that women will have more balanced representation on operations and monitoring. Feedback was obtained from DKPP and BAPPEDA and the Sanitation Pokja on possible pro-poor measures for the project. It is the idea that house connection would not be free of charge though there was agreement that subsidies should be given for connection and monthly fees. This will depend on income class. Proposed tariffs will be studied and regulated under the Regional Regulation (Peraturan Daerah) for 2013. Now the draft (clausal) regulation for Waste Water Management prepared subject to discussion by the Local Legislative Body (DPRD). Setting of minimum charges on Waste Water Expenditure/Fees will be set as a Major Regulation (Peraturan Walikota).
10. Gender Analysis and Strategy Lack of awareness by men and especially women and satisfaction on existing sanitation services is seen as a constraint to achieving high rates of sewerage connection. Increased hygiene and sanitation information is perceived as a help which is consistent with the designation of hygiene and sanitation awareness as a component of the project. Joint sanitation awareness planning puts a focus on collective decision-making strategies and mobilizing authorities and stakeholders for sustained behavior change on hygiene and sanitation. It is designed to influence social acceptance for sewerage connection and behavior change on sanitation not only within the project site but the entire city as well. Affordability is perceived as a bar to participation if this means a high connection cost or monthly bill. There is consensus among community members and implementing agencies on the importance of pro-poor measures for those who are identified to need assistance which can be based on existing government subsidy programs for the poor with IEC in sanitation hot spots. The strategy is for free domestic connection for all and for targeted subsidy for monthly fees for vulnerable groups including the poor, elderly and female-headed households. Further discussion among stakeholders is strategic to consider willingness to contribute to part of cost of connection consistent with recommendations to charge an affordable connection rate. There are sanitation hot spots along waterways and around the WWTP site where there is need for sanitation improvement but where there is lack of affordability. Universal connection and subsidies help low income households. Proposed interventions for onsite sanitation improvement as well as livelihood development assistance promotes social inclusion for the WWTP sites which are outside of coverage area for sewerage improvement. Technical constraints such as lack of PDAM/steady supply of water, satisfaction with onsite connection, tight space, connection to onsite systems, renters and absentee house owners, and the like, will need active consideration by village authorities and residents and designers during the sanitation audit and design, construction and connection phases. A pro-poor measure is included to address sanitation and income lack in WWTP sites. Installing onsite

TA 7993 - INO: Metropolitan Sanitation Management Investment Project – MSMIP Final Report 47
sanitation or establishing livelihood development needs to be assessed for viability of preferred livelihood options. Thus, problem solving on connection and implementation issues shall be facilitated through participatory processes and collective decision making by the Social Development and Sanitation Advocacy Unit as proposed in Implementation Arrangement Plans for Gender and Social Development, Gender Action Plan, Stakeholder Communication Strategy and Community Participation Plan. Women, community organizations and institutional partners in Cimahi City agree that gender analysis and women participation in sanitation promotion can ensure maximum participation by women. A Gender Action Plan, gender specialists and gender inclusive capacity building and joint sanitation advocacy planning promotes active roles of stakeholders where the needs of both women and men are addressed and women’s organizations are enlisted for sanitation advocacy and implementation and monitoring of WWTP operations and impacts for better social, environmental and economic outcomes. Benefit enhancement measures such as quotas for female recruitment and promotion (at least 10% more women in technical and management positions) and training (50%) and consultations and decision making (40%) promote women empowerment at staff and community levels. Given lack of gender expertise within PU and the implementing agencies and the absence of gender action plans, the Project shall include a full-time Social/Gender specialist to be hired in PMU. Potential social risks are also managed such as the influx of migrant workers exacerbating sanitation and social and health concerns such as waterborne diseases through poor sanitation and sexually transmitted diseases due to workers camps. Pro-poor and inclusive measures are quotas for local workers (at least 35%) with preferential hiring from low income communities with requirements for sanitation standards at workers camps. HIV/AIDS education will also be implemented by the construction contractor and under the GAP. Given concerns for construction site occupational health and safety (section 7), the project shall consult with men and women, especially mothers, during the design finalization of WWTP schemes to ensure that children's safety is considered. Moreover, the project shall also ensure that the contractor provides safe working conditions, a work environment free of harassment and separate sanitation facilities for women.
11. Gender Action Plan The Gender Action Plan below (under category of Effective Gender Mainstreaming) summarizes how the Project will benefit both men and women and how different components of the Project will address gender disparities and enhancement opportunities in plan implementation. Targets may be revisited during project implementation.
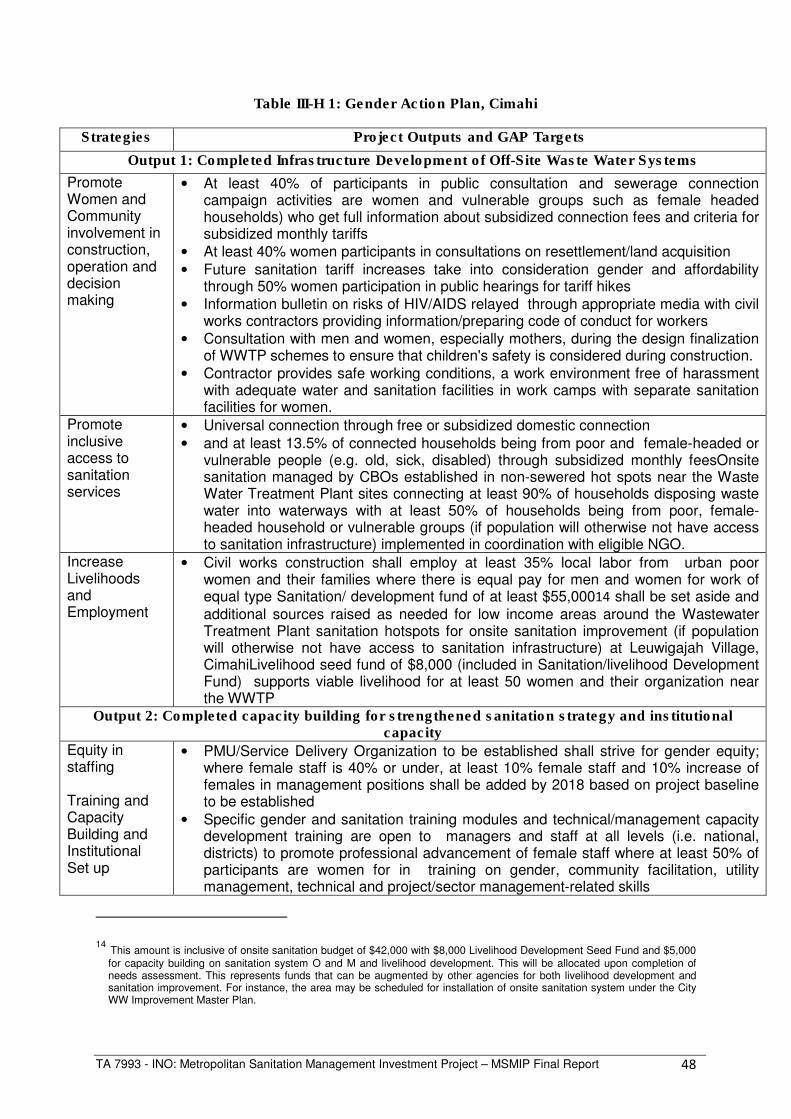
TA 7993 - INO: Metropolitan Sanitation Management Investment Project – MSMIP Final Report 48
Table III-H 1: Gender Action Plan, Cimahi
Strategies Project Outputs and GAP Targets
Output 1: Completed Infrastructure Development of Off-Site Waste Water Systems
Promote Women and Community involvement in construction, operation and decision making
• At least 40% of participants in public consultation and sewerage connection campaign activities are women and vulnerable groups such as female headed households) who get full information about subsidized connection fees and criteria for subsidized monthly tariffs
• At least 40% women participants in consultations on resettlement/land acquisition • Future sanitation tariff increases take into consideration gender and affordability
through 50% women participation in public hearings for tariff hikes • Information bulletin on risks of HIV/AIDS relayed through appropriate media with civil
works contractors providing information/preparing code of conduct for workers • Consultation with men and women, especially mothers, during the design finalization
of WWTP schemes to ensure that children's safety is considered during construction. • Contractor provides safe working conditions, a work environment free of harassment
with adequate water and sanitation facilities in work camps with separate sanitation facilities for women.
Promote inclusive access to sanitation services
• Universal connection through free or subsidized domestic connection • and at least 13.5% of connected households being from poor and female-headed or
vulnerable people (e.g. old, sick, disabled) through subsidized monthly feesOnsite sanitation managed by CBOs established in non-sewered hot spots near the Waste Water Treatment Plant sites connecting at least 90% of households disposing waste water into waterways with at least 50% of households being from poor, female-headed household or vulnerable groups (if population will otherwise not have access to sanitation infrastructure) implemented in coordination with eligible NGO.
Increase Livelihoods and Employment
• Civil works construction shall employ at least 35% local labor from urban poor women and their families where there is equal pay for men and women for work of equal type Sanitation/ development fund of at least $55,00014 shall be set aside and additional sources raised as needed for low income areas around the Wastewater Treatment Plant sanitation hotspots for onsite sanitation improvement (if population will otherwise not have access to sanitation infrastructure) at Leuwigajah Village, CimahiLivelihood seed fund of $8,000 (included in Sanitation/livelihood Development Fund) supports viable livelihood for at least 50 women and their organization near the WWTP
Output 2: Completed capacity building for strengthened sanitation strategy and institutional capacity
Equity in staffing Training and Capacity Building and Institutional Set up
• PMU/Service Delivery Organization to be established shall strive for gender equity; where female staff is 40% or under, at least 10% female staff and 10% increase of females in management positions shall be added by 2018 based on project baseline to be established
• Specific gender and sanitation training modules and technical/management capacity development training are open to managers and staff at all levels (i.e. national, districts) to promote professional advancement of female staff where at least 50% of participants are women for in training on gender, community facilitation, utility management, technical and project/sector management-related skills
14 This amount is inclusive of onsite sanitation budget of $42,000 with $8,000 Livelihood Development Seed Fund and $5,000 for capacity building on sanitation system O and M and livelihood development. This will be allocated upon completion of needs assessment. This represents funds that can be augmented by other agencies for both livelihood development and sanitation improvement. For instance, the area may be scheduled for installation of onsite sanitation system under the City WW Improvement Master Plan.

TA 7993 - INO: Metropolitan Sanitation Management Investment Project – MSMIP Final Report 49
• At least 50% are women who participate in capacity building on hygiene and sanitation education, promotion, planning and participatory monitoring – e.g. WWTP impacts, etc.
• At least 40% of women in key decision-making and working groups such as Resettlement Committees, monitoring committees, Community supervision mechanism for Joint Sanitation Plan implementation, O and M structure and for onsite sanitation systems
• Gendered indicators in PPMS and GAP are subject to quarterly reporting • A qualified full-time Social/Gender specialist shall be hired in PMU.
Output 3: Improved communication and public information on hygiene and sanitation Improved mechanism for public feedback and hygiene and sanitation promotion
• Women and community organizations such as PKK are partners in IEC and Joint Sanitation planning and delivery where at least 50% are women.
• 50%-50% male and female for community facilitators for awareness raising where male facilitators target male population to share responsibility for complaint reporting/management and sanitation promotion
• Joint sanitation marketing and sustainability planning and implementation with at least 50% female attendance in consultations and membership in implementation mechanisms
I. Poverty and Social Analysis The Asian Development Bank supports equitable and sustainable social development outcomes by giving attention to the social dimensions of its operations. A Social and Poverty Analysis is mandatory for all ADB projects to examine social development issues and a project’s potential effects, especially on poor people. Social analysis and poverty analysis are critical tools in ADB’s efforts to reduce poverty since these address the processes and structures that exclude some groups from participating in and benefiting from economic development. Thus, ADB adopted social development policies and strategies covering such issues as gender and development, social protection, and cooperation with nongovernment organizations (NGOs); social safeguard policies on involuntary resettlement and indigenous peoples as reflected in the ADB’s Operations Manual.
1. Key Findings of Socio-economic Survey (SES) and Stakeholder Consultations
In preparing the Poverty and Social Analysis, surveys were conducted in earlier phases of project preparation. The following is based on a 2011 socio-economic survey for Cimahi that was prepared by UNPAD (Padjadjaran University) with Sinclair Knight Merz (SKM) for the Waste Water Investment Master Plan through the Indonesia Infrastructure Initiative (IndII) and AusAid. Survey data were augmented with information gathered from communities, women and vulnerable groups, as well as with village officials and concerned agencies during project preparation. In addition, a limited survey of target households and business establishments was also undertaken in September 2012. Updated health and official data were also obtained from the city. Critical outputs were presented to key partners for a consensus on the findings and needed interventions. Key findings of the Socio-Economic Survey and stakeholder consultations are summarized in Table III-G 4 below.
a. Population Characteristics The census population of Cimahi is 607,514 individuals, with a population density of 15,470 people per square kilometer, making it the most densely populated city of the project. There are no significant numbers of indigenous people in the project area. Of the 381 respondents

TA 7993 - INO: Metropolitan Sanitation Management Investment Project – MSMIP Final Report 50
who represented their households, 86.9% were male-headed; 13.1% were headed by women. All respondents were functionally literate but of different levels of education; 30.4% completed primary education while the rest of the respondents have gone to high school, with less having completed college education (4%). The average household income was Rp. 1,934,222 with the minimum wage set at Rp 1,107,304 in 2010. Average household (HH) income was lower than the poverty threshold of Rp 2,689,488 for the city. With poverty incidence as high as 13%, affordability could be a factor in the acceptance of improved services for a significant sector of the population. More than 50% of the respondents lived in houses made of permanent materials, 39.1% occupied semi-permanent structures, while 10.7% lived in houses made of light materials. About 75.2% of the respondents declared themselves as owners of the houses they lived in; the rests were renters or lived with family in extended structures. Home ownership is related to interest to connect so care shall be taken to inform absentee home owners on the availability of sewerage services.
b. Need for Improved Sanitation Services
Findings reveal that there is a high need for improved sanitation services in the project site. Of the surveyed households in Cimahi, 95.3% had private toilets, those using public toilets were at 3,60%, and 2% for others. Sanitation coverage is deceptive in that there was a high percentage of toilets but only 15% had septic tanks; those without septic tanks constituted the majority at 71%. This may have been influenced by the price of septic tanks. A tank with bio filter cost 8 million rupiah/unit. A plain septic tank was 4 million rupiah/unit. Interviews confirmed that most septic tanks were sub-standard and leached into the ground or wastes were directly released into yards and water bodies. Moreover, septic tank management tended to be a problem (maintenance, complaint management). In Kelurahan Cimahi, 60% of households owned sealed septic tanks. When the septic tanks were full, 66.7% of the population said that they looked for sludge suction services while 15.2% built new septic tanks. Many owners had no idea what to do when the septic tanks became full. There were public toilets found in the surveyed villages; 76% were managed by non-government organizations who charged users’ fees that were based on capacity to pay. Survey showed that open defecation still occurred at 2%. Sanitation hot spots were slums and populated riverside settlements where open defecation still occurred. Flooding which affected low lying areas exacerbated spread of disease and bad smell from waterways. Groundwater contamination was possible since septic tanks in the villages were located less than 10 meters from water sources, less than 15 – 25 meters that is considered safe distance to a water source.
c. Affordability and Demand for Improved Sanitation Services The city has an average income of Rp1,934,222 and a minimum wage of 1,107,000 per month with women tending to contribute to family incomes due to work in textile and manufacturing jobs in and around the city. The IndII survey showed that 75% of respondents said that their sanitation facilities were not in good condition but there was relatively low demand for sanitation improvement that ranged from 5% - 37% in surveyed villages. On the other hand, an indicative survey of 22 households by the PPTA showed that there was general satisfaction (55%) with existing disposal facilities. However, this time, 91% were

TA 7993 - INO: Metropolitan Sanitation Management Investment Project – MSMIP Final Report 51
willing to connect to the sewerage system with the introduction on the benefits of the project. Issues raised for existing sanitation system were backflow (29%), no security or privacy (50%), other reasons at 21%. Connection rates that respondents were willing to pay had a wide range in the IndII Master Plan survey. Respondents from Cimahi village of the Project site proposed a maximum of Rp100,000 for connection fee. The average was at 75,000. Results were not sex or income differentiated. At FGDs during the PPTA, meetings among women in lower income neighborhoods showed willingness to connect to free service. They also conceded willingness to connect with a fee if made affordable with extended terms of payment. Indicative rates were equivalent or not much more than current expenses on communal sanitation at Rp5,000/month. A follow-up FGD and key informant interviews with women leaders with variable income ranges confirmed this pattern. Most were willing to connect to sewerage services but only if connection rates were no more than 100,000 or free. Others favored free connection for those who were poor enough to receive government subsidies for health, water and other services. Their suggested socialized pricing scheme was based on income and vulnerability (e.g. sick, disabled) – as with socialized water tariff structures. The preference is for free connection with affordable monthly fees. With low rates offered for connection, most, however, offered contributions such as – labor, food for workers, socialization of neighborhoods, etc. The limited-sample PPTA survey yielded an average rate of Rp. 12,381 for monthly fee. One of 4 respondents who earned over Rp2M was willing to pay slightly higher at Rp15,001 – Rp20,000. This was the maximum amount offered. The rest of those earning more than Rp2 M wanted to pay just like most (48%) which was no more than Rp 10,001– Rp 15,000. The rest (24%) of those earning less than Rp2M were willing to pay from Rp 5,000 – Rp 10,000 with the remainder (5%) willing to pay even less than Rp 5,000. Women leaders were confident that with proper “socialization,” most, even the poor would be willing to connect. Possible reasons by those that they thought were not sure to connect were lack of information and fears of high monthly charges and/or high connection fees as well as high cost of repair of damages to the house due to connection. Amounts that target clientele were willing to pay monthly for sanitation service/improvement were lower than actual average water bill of Rp50,000/month and Rp97,358 for electricity. Proposed rates were just about current onsite sanitation monthly charges of Rp5,000 and Rp8,700 for garbage. . On the other hand, preferred rates are within a range that is lower than 2% (Rp 38,000) of the average household income Rp 1,934,222.
d. Health, Hygiene Practices
Morbidity in 2012 for the city shows that there was a high incidence of water-related diseases such as diarrhea 28,012 and dengue fever, 1,995, as against other diseases such as tuberculosis, 24. Illness took a toll on respondents’ productive time; for instance, respondents reported diarrhea cases lasted from 1 to 5 days. From the survey, majority, or 58.1%, of the respondents said that they washed their hands with soap and water after work; 41.9% washed their hands with water alone. Before cooking, about 81.1% washed their hands with water while the rests used soap and water. Hand washing practices and disease prevention especially when dealing with children, also needed to be improved.

TA 7993 - INO: Metropolitan Sanitation Management Investment Project – MSMIP Final Report 52
e. Expenditure on Utilities Average expenditure for electricity is Rp. 97.358 and it is Rp. 26.690 for PDAM water. Sanitation bill is Rp5,000/month which was charged whether a house was connected to communal water (PDAM) septic tank or not. For those connected, this is inclusive of desludging services for communal septic tanks. Bills were collected by women organization volunteers. Sludge collection fee for individual homes was between Rp 200,000 – Rp 500,000 based on volume. Sludge removal service firms were based in Bandung. Proposed connection and monthly fees were way below current expenditure on utilities showing lower priority of sanitation improvement. These can be used in sanitation marketing to point out the comparative costs and benefits of sanitation services and as basis for discussion by all concerned on optimum rates to allow the utility to provide service and cover its costs in a way that customers could afford.
f. Impact on Affected Persons
The proposed area for the waste water treatment plant is vacant land with one landowner. The landowner was willing to sell his land to government with price currently under negotiation. The area is close to a densely populated zone, a golf course and public facilities such as mosques and a cemetery. There were three private graves in the area. No relocation is needed and there is a chance that the tombs may be avoided in laying out the WWTP. There was awareness of the project by neighboring communities. But there was lack of awareness of possible negative impacts of a WWTP in their vicinity. On the other hand, a woman leader from the area sought participation in a monitoring body that would be set up during project construction and operation.
g. Indigenous Peoples and Vulnerable Groups
The urban poor are often landless in informal settlements by rivers and shores and lacked water and sanitation facilities. Some are women-headed households that did not have water connection; a number had a disability or sickness. Urban poor were also migrant workers who rented rooms in the city. They worked in nearby garment and other factories and could be temporarily unemployed following short term contracting practices of local industries. Some areas along waterways risked flooding of water source and septic tanks. Many were willing to connect if connection fees were free and monthly charges were no more than Rp10,000 or on sliding scale as is the case with subsidized water rates for poor households. h. Community Organizations
Several women and community organizations exist that have sanitation functions – e.g. maintaining communal septage services. These look forward to collaborating with the project on sanitation and health promotion. i. Issues and Concerns
Concerns raised that are relevant to connection and behavior change on sanitation are: low-lying areas get flooded and could not connect to communal septic tanks due to elevation; narrow access roads and lack of space for pipe connections; fears that high cost of WWTP and operations may translate to high cost for clients; renters who do not make decisions on sewer connection occupied some houses and lands. These need to be addressed with communities during detailed design and in designing sanitation awareness campaigns. Sustainability of water sources is a concern for Cimahi and the entire Bandung District. Higher rates of services are partly attributable to the loss/lack of access to gravity water

TA 7993 - INO: Metropolitan Sanitation Management Investment Project – MSMIP Final Report 53
sources and pollution of ground and surface water sources. Moreover, underground sources have high mineral residues. Garbage is a serious problem contributing to the pollution of fresh water resources. With a growth rate of 1.8%, the demand for water for domestic needs is continually increasing. Increasing use of groundwater by industry puts pressure on water resource quantity, particularly groundwater. At present, nearly 70% of domestic water and approximately 60% of industrial water needs are satisfied by the use of groundwater, though groundwater accounts for only 10–15% of the available water supply. Meanwhile, increasing water pollution from both industrial and domestic wastewater puts pressure on the quality of surface water.15 Wastewater disposal in the commercial district is also a problem. Taking three traditional markets as examples, Pasar Cimindi, Pasar Rancabentang, and Pasar Atas, wastewater is disposed into the gutter or into the surrounding land. Furthermore, during the rainy season, rain causes the overflow of ditches and trenches in some parts of Cimahi City. Overall, the problem of water quality and waste water disposal is related to other sanitation problems such as open defecation and garbage disposal of project area. People, whether poor or not, dispose wastes directly into the river and waterways causing drainage problems, seasonal and chronic flooding and lack of clean water. Moreover, there are no sanctions by city government for substandard septic tanks. Sanitation promotion needs to address the interlocking problems in sanitation for the proposed wastewater services to make a dent in improving sanitation practices and water and environmental quality. j. Recommendations by Stakeholders
Proposals from consultations on needs, issues, constraints and opportunities for participation are summarized below:
• Socialized Connection Rate and Monthly Fees for Poor and Vulnerable - Changes were noted for responses for willingness to connect since the INDII survey was done a year ago. An increase was noted in willingness to connect since then. On the other hand, proposed connection rates are still much lower than the proposed connection fee of Rp500,000 (domestic) and Rp1,650,000 as calculated in the feasibility study to allow for cost recovery. Higher income household did not offer to pay significantly higher connection and monthly fees. This can be the subject of further discussion between the Implementing Agency and project beneficiaries to find the optimum rate between affordability and willingness to pay. However, all acknowledged the importance of providing subsidy for vulnerable groups for connection and monthly fees since they are in a position of greatest need.
• Hot spots are settlements near waterways – not all people in these areas are poor and yet most dispose waste water into waterways. Due to space, land tenure, flooding, capacity to pay and other concerns, individual sewerage connection may not be feasible. Communal septic tanks can serve as collection point to avoid disturbance of individual properties. It is the consensus that sanitation hot spots require attention. Appropriate solutions may be in coordination with other septage management options and subject to community assessment and planning.
• Proposed role of village government, women and community organizations in sanitation promotion and project monitoring highlights the importance of mechanisms
151515 Alternative Water Resources and Recycle Program as Effort to Strengthen Ground Water Management in
Metropolitan Bandung, http://enviroscope.iges.or.jp/modules/envirolib/upload/981/attach/05_chapter3-2bandung.pdf, accessed Nov 20, 2012

TA 7993 - INO: Metropolitan Sanitation Management Investment Project – MSMIP Final Report 54
for cooperation and joint action for on sewerage connection and related sanitation problems.
• Narrow passages and space between houses is seen as a possible constraint during construction. Cost of repairs of tiles, etc. as a result of home connection is another deterrent to immediate connection. Construction disturbances need to be coordinated and planned for with affected communities. Sewerage connection to communal septic tanks a possibility.
• Lack of water connection – Low water levels especially during the dry season and lack of water connection in the city (14%) may be an impediment to sewerage connection. Landownership and sanitation audit during detailed design can ascertain implications of these for sewerage connection planning to ensure that measures are set in place to address constraint in coordination with water utility.
• Gender Mainstreaming, Public Awareness and Pro-Poor Measures - Institutions such as the Pokja, NGOs and Bappeda acknowledged the need to firm up measures for pro-poor policies for sewerage connection. Some form of subsidy is seen which should be subject to further analysis and discussion among all concerned to arrive at an amount that has a bearing on the true costs of connection and maintenance. Gender mainstreaming of policies for customer and staff development was supported even while no major gender issues were identified. A proposed training need relates to gender mainstreaming.
Table III-I 1: CIMAHI Key Findings of Socio-Economic Survey and Stakeholder
Consultation
Parameter Survey Result Basic Data for Cimahi City
The population of Cimahi in 2010 is 566,220 141,555 households. The annual growth rate is 1.8%; serves most densely populated center including D’Edge.
Respondents’ Characteristics
The monthly household income, on average is Rp. 1,950,000 but for low-income households it is Rp. 570,000; 13.6% of respondents live below the poverty line; most were workers and employees; served population for PDAM water is 14% of households for city but higher for Central Business District; 75% own houses while 11% rent, remaining, other arrangements
Needs High need; lower but increasing demand for sanitation improvement. Sanitation coverage was high for toilet (75%) but only 15% had septic tanks; low satisfaction with (75%) current service; disease and bad smell caused by flooding, lack of clean water; from White Book there is 40.27% incidence of babs or open defecation which is held in rivers, ditches, “WC helicopters” or toilets that do not have a septic tanks. Another study by EHRA noted that most respondents used private toilet for bowel movement (95.3%), although there was a small portion that still used MCK/public toilets (3.6%). In Kota Cimahi open defecation was close to 2%, Village Padasuka (1.3%), Village Baros (0.6%), Utama Village (2.5%).
Affordability and Willingness to Pay (WTP)
IndII - The proposed rate for domestic connection was Rp. 500,000 while for non-domestic it was Rp. 1,650,000; (PPTA) - WTP monthly fee was Rp 12,381 for domestic while it was Rp 42,361 for non-domestic. (FGD with women) - There were those who would connect to sewerage system only if connection is free or cheaper than the cost of removal of sludge from communal septic tank at Rp 5.000/month/household or adjusted to the economic level of the household. It is their assessment that with proper orientation on benefits, many would connect.

TA 7993 - INO: Metropolitan Sanitation Management Investment Project – MSMIP Final Report 55
Parameter Survey Result Basic Data for Cimahi City
The population of Cimahi in 2010 is 566,220 141,555 households. The annual growth rate is 1.8%; serves most densely populated center including D’Edge.
Health, Hygiene and Sanitation
Awareness and practice of hand washing for activities involving children not well developed. Top two diseases for children: diarrhea and cough. Some hygiene and sanitation public awareness activities by concerned agencies and women’s groups and NGOs; incidence of HIV/AIDS is at 4107 and 1948, in 2012, respectively.
Gender Roles, Issues, Organizations
13.1% were women-headed households; some women organization and local community groups had environmental activities including on water and sanitation. These organizations (Sanitation Management Institution) are PKK, KASM, PSM< LPM, PKM, Pokmas, RT/RW, Cadres of posyandu. Roles in decision making in the home were shared or women-led on child-rearing, sanitation and home care. Gender issues on water sanitation among others are lack awareness and understanding of benefit of improved sanitation.
Indigenous Peoples
There are no significant populations of indigenous peoples in the project sites. Indigenous people are the Penduduk Asli – local-born resident who were the majority - Sundanese/Ethnic Sunda. There were migrant workers renting rooms within the service area stand to benefit from improved sanitation services.
Poverty and Vulnerable Groups
Some of the urban poor lived by the waterways, in flood-prone areas, discharging wastewater directly into river; women-headed households were significant (13%) some with no water connection; a small percentage exists with disability; Migrant workers generally renting rooms with low income (work as laborers, or are unemployed). There are also vulnerable people such as the elderly, the sick, disabled and poor. These vulnerable get government subsidies for visits to public hospitals, water tariffs, etc. Socialized pricing of sewerage service recommended by women organizations
Affected Persons
One landowner in WWTP site who is willing to sell his land to the city; surrounding areas too close to WWTP; not served by project
Issues and Concerns
Low-lying areas are flooded and could not connect to communal septic tanks; fear that high cost of WWTP and operations would translate to high cost for clients; Narrow access roads and lack of space for pipe connections; problems on garbage disposal (solid waste), clogged drainage, flooding (seasonal and chronic); poor people dispose waste everywhere (direct to river) with no sanctions from city government on building sub-standard septic tanks; low connection rate to PDAM
2. Analysis The overarching goal of MSMIP is improvement in the overall well-being of the city population within the Project area through sewerage connection. This is through improved water quality and decreased incidence of water-related diseases, especially among children.

TA 7993 - INO: Metropolitan Sanitation Management Investment Project – MSMIP Final Report 56
These help achieve Indonesia’s targets for urban sanitation in a manner that is inclusive and empowering. The project contributes to poverty reduction by helping attain national targets for urban sanitation and that of the Millennium Development Goal (MDG) Goal 7 for improved coverage of safe water and sanitation. Through the investment, MSMIP can also contribute to the attainment of other MDG goals such as eradicating extreme poverty and hunger through provision of safe water (Goal 1), reducing child mortality and morbidity (Goal 4), gender mainstreaming (Goal 3), and (iii) combating major diseases (Goal 7). The expected outcomes of the Project for Cimahi City are: improved sewerage services and environmental quality in served areas, improved sewerage management services, and improved public awareness on sanitation. Improved sanitation outcomes will be measured in terms of the number of new service connections (i.e., residential, commercial/industrial, institutional), including women and poor households that will directly benefit from pro-poor policies for connection. Sanitation outcomes may also be measured by the reduction in direct disposal of waste water into water bodies, thereby reducing water pollution and resulting bad color and smell of waterways. These can also be measured by improved ground water quality that could contaminate wells that supply drinking water to the population. Served households can also enjoy savings in the medium term through reduced cost of septic tank construction and maintenance. Primary outcomes are the total number of residential and commercial sewerage connections made and reduced incidence of water-related diseases in the Project area. The Project stands to benefit the Central Business District and surrounding communities where people’s need for improved sanitation services was critical and urgent. Specifically, the proposed investment shall provide access to sewerage service for an initial target of 6,000 HHs and 1.500 commercial establishments in the most densely populated center of the city. It will also serve The Edge, a new high rise housing development complex. The investment in sanitation stands to benefit all in the service area through universal free connection. Benefits include improved sanitation service and improved hygiene, solid waste management and access to safe water through sanitation awareness campaign. Attainment of these goals, however, depends on whether intended beneficiaries connect to developed sewerage system and institute behavior change in other areas of environmental sanitation – e.g. disposal of garbage and other wastes into rivers. To do so, measures will be made to reach the poor and vulnerable groups and involve villages and organizations in discussing appropriate strategies to benefit slums and sanitation hot spots. Key issues such as disposal of solid wastes and grey and black wastes into waterways in slums, upstream and in unserved areas can cancel out any gains from sewerage connection within the Project Site. This calls for cooperation on a wider plan to address behavior change on hygiene and sanitation for the entire city and not just within the target beneficiary zone. Partnerships shall be established through joint planning on the contribution of city and village governments, Sanitation Pokja agencies, NGOs and desludging companies with community organizations for a common plan to address city sanitation challenges. Improved water access as a condition for connection also needs to be coordinated with PDAM early on. No risks of negative social impacts were noted. The property for the WWTP has one landowner with no major properties to be disturbed. Some three graves in the area may be avoided in the construction of the facility. However, the proposed facility will be very close to a community. Care shall be taken to avoid negative impacts during construction and during operation of the facility.

TA 7993 - INO: Metropolitan Sanitation Management Investment Project – MSMIP Final Report 57
A sanitation promotion strategy shall help ensure higher connection rates as Indonesian experience shows that free connection, by itself, cannot assure participation. Constraints to connection shall be assessed with concerned villages and their organizations with a view to accommodating appropriate implementation options given constraints on land, affordability, etc. for sanitation hot spots. A capacity building component of MSMIP is expected to result in more inclusive and gender-sensitive operations and monitoring indicators and mechanisms for the implementing agency including village governments and communities in performing their respective roles in the Project. Village governments, women and community organizations, desludging companies which serve households outside the Project Site are potential partners in project implementation and sanitation promotion. The Project shall empower women and vulnerable groups through affirmative action policies for their participation in project design, sewerage connection and monitoring and evaluation. Along with village structures, community organizations will also be active partners in sanitation assessment, action planning as well as sanitation promotion. Pro-poor targets as well as gender targets at the level of the Implementing Agency and customer are included relative to hiring and promotion and giving them equitable access to sewerage service and training opportunities. The project is expected to bring jobs at construction and operations. The observance of core labor standards is prescribed and mitigation measures are set in place for identified risks such as on poor living conditions at worker camps and on sexually transmitted diseases/HIV/AIDS among workers and communities. J. Social Safeguard Studies – Involuntary Resettlement A total of 18,520 m² (1.852 ha) of lands is recommended for the WWTP. Of this, 1.6 ha has already been acquired in the year 2010-11. The remaining 2,520 m² (0.252 ha) is yet to be acquired permanently from 5 affected households (AHs). The land adjoins the 1.6 ha that has already been acquired in advance which was subjected to due diligence. The findings of DD are included in the LARP for the subproject. Acquisition of 1.6 ha affected 15 households. None of the five households affected by the acquisition of the remaining 2,520 m2 belongs to any indigenous groups. There will be no impacts on structures, trees or any other fixed assets. Since all the five households live outside the affected land, relocation of their houses is not an issue under the Subproject.
Vulnerability of the AHs is not an issue although their lands in the proposed WWTP site are severely affected. The AHs, including the owners of the 0.252 ha, are engaged in various livelihood occupations. Affected land parcels are rocky, without irrigation system, and are cultivated in small patches with cassava and maize for personal consumption.
Due Diligence. The subject 1.6 ha land was acquired in two occasions: (i) the first was in 2010 when the 6,000 m² (0.6 ha) were fully acquired for flood control; and (ii) the second in 2011 that covered 10,000 m² (or 1.0 ha) of lands for the WWTP. Owing to the land requirements recommended in the INDII study, the 6,000 m² land became part of the WWTP investment. Supported with documents, the lands were acquired in compliance with the procedures prescribed in Chapter IV of Presidential National Land Agency (BPN) Regulation No. 3/2007. The AHs were compensated based on the price range reported by an independent appraiser which was higher than the rate set up by NJOP and the amount offered by the City Government. The owners of the 0.6 ha land was paid in late 2010 while owners of the 1.0 ha received their compensation in August 2011. Land acquisition has no

TA 7993 - INO: Metropolitan Sanitation Management Investment Project – MSMIP Final Report 58
impact on the incomes and standard of living of the AHs since their livelihoods are not dependent on the acquired agricultural lands, which are infertile.
The Initial Public Consultation and Information Disclosure was held on 24 September 2012 in compliance with the Government Regulation and ADB’s 2009 SPS and Public Communication Policy (2 April 2012). Public consultation with the affected households and randomly selected residences along the roads covered under the WCC component was carried out in February 2013. A copy of the PIB in Bahasa Indonesia was also provided to the randomly selected roadside occupants. Public consultation with affected communities will continue throughout the planning and implementation phase of the subproject.
Resettlement Budget. A total of` Rp 0.835 billion (US$0.086 million) was estimated for LARP updating and implementation for inclusion in the Subproject investment. The estimated resettlement cost includes a contingency of 20% to cover any unexpected expenses including compensation for loss of income of businesses along the roads covered under the WCS component caused by restricted access during the implementation phase. The City Government of Cimahi will finance the LARP implementation. The LARP shall be implemented in eight months.
The Subproject is Resettlement Category B since only 30 persons shall be affected by the acquisition of the 0.252 ha.
K. Environmental Safeguards Study
An environmental assessment was made for the proposed Cimahi City Off-site Wastewater Collection System and Treatment. Based on the significance of its environmental impacts and risks, the Cimahi City subproject is deemed Environmental Category B in accordance with ADB’s environmental categorization and the type of assessment warranted only the preparation of an Initial Environmental Examination (IEE) report. The IEE was carried out under ADB’s TA 7993-INO and in accordance with ADB’s 2009 Safeguard Policy Statement (SPS) and Government of Indonesia (GOI) environment law, Environmental Protection and Management Law of 2009. A copy of the final Cimahi City subproject IEE is presented in Annex Document - G. An important consideration in analyzing the environmental impacts of the proposed Cimahi City subproject is the fact that its components are infrastructures for environmental improvement and for reducing the risk to public health from untreated sewage. The screening for potential environmental impacts and risks of the proposed Cimahi City subproject showed that there are no significant negative environmental impacts and risks that cannot be mitigated. With its Environmental Management Plan (EMP), the proposed Cimahi City subproject can be implemented in an environmentally acceptable manner. There is no need for furtherenvironmental assessment study. A full EIA is not warranted and the subproject’s environmental classification as Category B is deemed appropriate. An REA checklist was prepared to support the environmental categorization of this subproject. The IEE shall serve as the final environmental assessment document of the proposed Cimahi City’s sewerage system subproject. Implementation of the proposed Cimahi City’s subproject is recommended with emphasis on the following: (i) EMP of Cimahi City’s sewerage system subproject shall be included in the design process; (ii) IEE Report/EMP shall be forwarded to the design consultant for consideration in the design process; (iii) Tendering process shall advocate environmentally responsible procurement by ensuring the inclusion of EMP provisions in the bidding and construction contract documents; (iv) Contractor’s submittal of a contractor’s EMP (CEMP)

TA 7993 - INO: Metropolitan Sanitation Management Investment Project – MSMIP Final Report 59
shall be included in the construction contract; (v) Contract provisions on creation and operation of the ad-hoc City Sewerage Environmental Complaints Committee (CSECC) shall be included in construction contracts; (vi) Training of the WWTP operators on operation and maintenance of the WWTP shall be completed before actual operation; (vii) a WWTP advisor (consultant) shall be provided intermittently during the initial 3 months of operation to assist the operators in the start-up phase and also to correct any undesirable operating practices; (viii) Monitoring of health and safety requirements shall be given more importance during construction and operation to reduce risks to the public and to personnel; and (ix) Cimahi City government, its LPMU, and the West Java Province’s PPIU shall continue the process of public consultation and information disclosure during detailed design and construction phases. 1. Compliance to ADB’s SPS Requirements In compliance with ADB’s SPS (2009) and the requirements describe in its Appendix 1 (Safeguards Requirement 1: Environment), the final IEE for Cimahi City’s sewerage subproject contains sections of the following: (i) executive summary, (ii) introduction, (iii) policy, legal, and administrative framework, (iv) description of the environment, (v) anticipated environmental impacts and mitigation measures, (vi) information disclosure, consultation, and participation, (vii) grievance redress mechanism, (viii) environmental management plan, and (ix) conclusion and recommendations. Environmental Management Plan. The EMP section addresses the need for mitigation and management measures for Cimahi City’s subproject. Information includes: (i) mitigating measures to be implemented, (ii) required monitoring associated with the mitigating measures, and (iii) implementation arrangement. A tabulated mitigation plan presents the information on: (i) required measures for each environmental impact that requires mitigation, (ii) locations where the measures apply, (iii) associated cost, and (iv) responsibility for implementing the measures. Details of mitigating measures are discussed in the screening process for environmental impacts. A tabulated monitoring plan presents the information on: (i) aspects or parameter to be monitored, (ii) location where monitoring is applicable, (iii) means of monitoring, (iv) frequency of monitoring, (v) responsibility of compliance monitoring, and (vi) cost of monitoring. One of the pre-construction considerations discussed in the EMP is the need to include measures for climate change adaptation and mitigation. A hydrology and flooding study shall be conducted during the design phase for the proposed Cimahi City’s WWTP to ensure that occurrence of flooding is properly evaluated. Results of the study shall be used for designing the proposed WWTP and the preparation of engineering specifications to ensure that it is less vulnerable to extreme flood events. Climate change mitigation is by connecting the WWTP’s Upflow Anaerobic Sludge Blanket Reactor (UASBR) to a gas stripping unit and flare to avoid releasing the generated methane. However, during detailed design, potential use of the generated methane shall be evaluated with due considerations to financial and economic factors. EMP Cost. The IEE points to the need of ensuring funds for EMP implementation. The suggested approach is to allocate funds for EMP implementation by requiring that the tender documents of Cimahi City’s sewerage subproject shall include a lump sum bid item in the bill of quantities to be titled “Environmental Mitigation Measures”. Furthermore, it shall be clarified in the specification documents that the environmental mitigating measures identified in the construction EMP are to be charged to this item. This will allow the construction supervision engineer of Cimahi City’s sewerage subproject to require the contractors to quickly address the environmental issues during construction. For budgetary purposes, this EMP fund of the proposed Cimahi City’s sewerage system is estimated at 1% of the total direct cost of the WWTP and the sewer lines. Relative to this, the CPMU and the West Java

TA 7993 - INO: Metropolitan Sanitation Management Investment Project – MSMIP Final Report 60
Province’s PPIU shall ensure that this provision for “Environmental Mitigation Measures” is included in the bidding documents and civil works contracts. Institutional Setup. Similar to the 4 other MSMIP subprojects, there is a need to ensure that the environmental aspects of the proposed Cimahi City’s sewerage system is effectively addressed through a well-defined institutional setup. The roles of the various GOI units and consultants for the environmental aspects are discussed in the sections for institutional aspects of the final IEE. The setup presents the proposed PPIU of West Java Province as the key implementation unit responsible for construction contracts’ supervision of the Cimahi City subproject, while the Cimahi City’s LPMU coordinates the needed local inputs and resources. Capacity Building for WWTP Operators. The final IEE recognizes the fact that a newly constructed WWTP might discharge poor quality effluents due to operators that are not properly trained. One of the proactive ways to prevent this from happening is to provide capacity building for the operators of the new Cimahi City’s WWTP during pre-operation phase and continue during the initial few months of the operation phase. The proposed capacity building shall be divided into 2 parts and shall be facilitated by local consultants. The first part shall be a one month hands-on training on operating and maintaining a WWTP in a similarly operating WWTP in Indonesia. The second part shall be the actual operation of the new Cimahi City’s WWTP with inputs from a WWTP advisor for a 3-month period intermittently. This type of advisory services is very important since the new WWTP will be in the start-up phase and also to correct any undesirable operating practices of the newly hired operators. Estimated cost of the initial capacity building is US$7,600 while the cost of advisory services of the WWTP advisor for a 3-month period intermittently at the new WWTP is US$14,000. This capacity building for WWTP operators is also reflected in the overall capacity building plan for MSMIP. Grievance Redress Mechanism. The IEE presents a local grievance redress mechanism (GRM) for environmental complaints during the construction phase of the Cimahi City’s sewerage subproject. The GRM has three levels and calls for the creation of an ad-hoc City Sewerage Environmental Complaints Committee (CSECC). This shall be chaired by Cimahi City’s Chief of the LPMU. CSECC members shall include the: (i) contractor’s highest official at the site such as the Construction Manager or Construction Superintendent, (ii) village (Kelurahan) Chief or his representative, and (iii) a women organization’s representative. The draft GRM was presented to stakeholders during the initial public consultation meeting. Public Consultation and Information Disclosure. Last 24 September 2012, Cimahi City’s BAPPEDA conducted an initial public consultation and formally discussed the proposed sewerage subproject with the stakeholders and requested their views. A total of 18 stakeholders and representatives participated. The discussions included issues regarding the state of Cimahi City’s sanitation, land acquisition for the proposed WWTP at Leuwigajah, the proposed construction of the sewerage system, and the need for more information campaign and consultation. This initial public consultation meeting is fully documented in the final Cimahi City subproject IEE. A summary of the issues raised during the initial public consultation in Cimahi City and how the project addressed them is presented in Table III-K 1.

TA 7993 - INO: Metropolitan Sanitation Management Investment Project – MSMIP Final Report 61
Table III-K 1: Summary of Issues Raised and Project’s Response during Public Consultation
Group Represented Issues/ Concerns Raised Project’s Response
Karang Mekar Village How will the pipelaying works
be done? Earthwork activities,
such as the one done by the
telephone company, left a lot
of wastes and debris.
Clean construction will be introduced to avoid
leaving wastes at the sites. This approach
has been implemented in Bali.
Karang Mekar Village The project needs to acquire
land, what is the follow up
action?
This meeting is just the first meeting. There
will be another meeting. Land acquisition for
2,500 m2 is planned for proposed WWTP site
at Leuwigajah
Cimahi Village Public information campaign
on sanitation should be
intensified since majority of
communities dispose their
waste into the river and only
few use septic tanks.
The expression of support is well appreciated
Leuwigajah Village There is a very small pond that
has been used for fishing.
Sometimes, its water is used
for plant watering. Will this
pond remain in the site when
the WWTP facility is
developed?
Recreational activity and fishing will be
relocated outside of the WWTP site
Government sector For WWTP investment and
development there is
information campaign and
consultation
Despite intensive information campaign, not
all people have same understanding.
Support of village leaders will be necessary
to map those who have yet to understand the
program.
Government sector Experience shows that
acceptance of stakeholders will
be necessary before a project
is about to be executed.
Otherwise, there will be
rejection by local communities.
Cimahi City government has long experience
in regarding project implementation including
those financed by other donors. The city
government is also experienced in managing
resettlement and has managed to address
such issue.
2. Compliance to GOI’s Environmental Requirements The final Cimahi City subproject IEE presents GOI’s regulatory requirements regarding the AMDAL system (EIA system) and discharge permit for WWTPs. Under AMDAL regulation, a proposed WWTP for domestic wastewater that will require an area of more than 3 hectares or will serve a population of more than 100,000 shall be required to prepare an AMDAL report. The Cimahi subproject will have a sewer network capacity for a population of 150,000, while its WWTP will initially serve a population of less than 100,000. The Cimahi subproject will therefore be required to prepare an AMDAL report due to the large capacity of its sewer network. Preparation of the AMDAL will be done by the detailed design consultants

TA 7993 - INO: Metropolitan Sanitation Management Investment Project – MSMIP Final Report 62
during the detailed design phase as agreed by ADB and GOI. This will be funded by the Indonesia Infrastructure Initiative. AMDAL preparation shall be completed prior to any bidding/procurement process. A permit to discharge will also be required for the proposed Cimahi City WWTP under the city’s regulation for WWTPs. Information on the process for discharge permit application is presented in the final IEE’s appendices. L. Cimahi Institutional Proposals 1. The Project and Schedule
During the consultation meeting with the PPTA consultants in June 2012, the Mayor and the Technical Working Group (POKJA) confirmed the following MSMIP project scope:
• IPAL Leuwigajah (wastewater treatment plant), • Sewerage area covering the central business district (CBD) of Kelurahan Cimahi
and Karangmekar and apartment block "The Edge", • Septage Trucks (23) and Motor Bike tankers (11), • Rehabilitation of existing public facilities and 104 new facilities, • Rehabilitation of existing communal septic tanks in 5 Kelurahan (villages),
The schedule of project implementation as well as the supporting institutional development activities is presented in Table III-L 1.
Table III-L 1: Project Implementation and Supporting Activities
A. PROJECT IMPLEMENTATION
Procurement, Detailed Design, Construction
B. CONSULTANCY ASSISTANCE
Detailed Engineering Design (DED) Consultants
Capacity Development Technical Assistance (CDTA) Consultants
Project Implementation Support Consultants (PISC)
C. PREPARING FOR MSMIP IMPLEMENTATION
Organizing Implementation Units
CPMU
SATKER (PPIU)
LPMU
D. PREPARING FOR WASTEWATER OPERATIONS
1 UPTD
Issuance of Decrees for creation
of UPTD, and UPTD Job Descriptions
1 Operationalization of UPTD
Capacity Building for UPTD
2 BLUD
Issuance of Decree for creation of BLUD, and
for BLUD Job Descriptions
Capacity Building for BLUD
Operationalizaiton of BLUD
20182012 2013 2014 2015 2016 2017
Cimahi city has selected a Badan Layanan Umum Daerah (Regional Public Service Agency or BLUD) as the preferred service delivery organization (SDO) to operate the wastewater system. A BLUD is a semi-autonomous service provider created by the city to provide public

TA 7993 - INO: Metropolitan Sanitation Management Investment Project – MSMIP Final Report 63
services on a non-profit basis. It is intended to enjoy more flexibilities and responsibilities compared with the normal government agency (Dinas). Due to time it takes to create a BLUD, a Unit Pelaksanaan Teknis Daerah (Regional Technical Implementation Unit or UPTD) is now in the process of being formed under the DInas Kebersihan dan Pertamanan (Cleanliness and Parks Agency or DKP) to handle the preparatory, implementation and operational activities pending the BLUD’s creation. A UPTD is a sub-unit of a dinas which is established to undertake technical operations in a specified functional or geographical area. The draft of the Mayor’s decree to create the UPTD is ready. The city government commits to the institutional change needed by MSMIP and is determined to ensure that the operations of the UPTD is sustainable on which basis they will eventually create the BLUD to be operational by 2016. a. Proposed Institutional Arrangements for Project Implementation The Ministry of Public Works, Directorate General for Human Settlements (DGHS) is the Executing Agency for the MSMIP. DGHS will establish a central project management unit (CPMU) composed of technical and administrative staff from Directorate of Environmental and Sanitation Development (DESD). The CPMU will likely be headed by a Senior Officer of the DESD. At the regional level, two units will work jointly to manage and implement the project: the SATKER as the Provincial Project Implementation Unit (PPIU) and the city Local Project Management Unit (LPMU). Under this arrangement, DGHS plays an active role in providing technical supervision and responsibility over the investment (the Satuan Kerja or SATKER model). The PPIU or the SATKER comprises full time staff detailed from DGHS to the provinces to implement specific projects of DGHS. The projects in the four cities above will be implemented through the SATKER in their respective provinces. Based on discussions with the city of Cimahi, the LPMU will be the DKP. The LPMU will coordinate closely with the Technical Working Group on Sanitation (POKJA) and the UPTD. This way, the UPTD also becomes involved in the project in the early stages and develops a sense of ownership over the project. See Figure III-L 1.

TA 7993 - INO: Metropolitan Sanitation Management Investment Project – MSMIP Final Report 64
Figure III-L 1. Implementation Arrangement
DGHS
(Executing Agency)
Central Steering
Commitee
Central Project
Management Unit
(CPMU)
Central Project
Implementation Unit (CPIU)
/ Satker Pusat
Central Support team
(CST) a
Provincial Project
Management Unit
(PPMU)
Provincial Project
Implementation Unit
(PPIU) / Satker Provinsi
Provincial Support team
(PST) a
Local Support team
(LST) a
Local Project Management
Unit
(LPMU)
Local Project
Implementation Unit
(LPIU) / SKPD
Dinas Provinsi b
Implementing Agency
Provincial Steering
Committee (CWSG, various
Dinas Provinsi )
Dinas Kota c
(Implementing Agency ABPD-
Kota)
City Sanitation Working
Group
(CSWG)
(chair: DGHS)
(chair: BAPPEDA-Prov.)
(chair: deputy mayor)
National Level
Provincial Level
City Level
Consultant Support
a Support teams consist of consultants for: (i) project implementation support,
and (ii) institutional development and capacity buildingb
Provincial Governmentc City Government
Supervision, guidance
reporting
Institutional arrangements include mechanisms for environmental management and resettlement. See Annex Document H6 for details. b. Proposed Institutional Arrangements for Operation
The focus of the capacity building is on establishing an autonomous and accountable SDO for wastewater management. To do this, the city of Cimahi plans to operationalize the UPTD in early 2013 as a preparatory step towards the creation of a BLUD by 2016.

TA 7993 - INO: Metropolitan Sanitation Management Investment Project – MSMIP Final Report 65
i. Organization and Operationalization of the UPTD Currently, a UPTD is in the process of being formed under DKP to handle the preparatory activities pending the creation of the BLUD. The Mayor’s decree for the creation of the UPTD and the Statement of Job Descriptions and Functions are already in draft form and are expected to be issued soon. The proposed organization for the UPTD is shown in Figure III-L 2.
Figure III-L 2. Proposed Organization Chart of the UPTD
HEAD
Administrative Dept
Head, Functional Group Head, Functional GroupHead, Functional Group
Based on the draft Mayor’s Decree, the UPTD will consist of the head, the administrative department, and several functional groups. The Administrative Department will handle hiring and training of staff in coordination with the Administrative Division of the DKP. The number of functional groups, levels, and functional staff appointed by the Mayor will be based on the nature and volume of work load16. Each group is headed by a senior functional staff appointed by the Mayor as proposed by DKP. The head of the wastewater group will manage, coordinate, and integrate all wastewater activities of the city. Prior to completion of the MSMIP wastewater project, the UPTD Administrative Department, with assistance from the capacity development technical assistance (CDTA) consultants, will start the hiring process and training of staff to allow it to handle technical, commercial, finance/administrative operations of the wastewater system. It is planned that collection of sewage fees will be done by utilizing the community neighborhood organizations as the collecting agents. This process is currently being done in the collection of the solid waste fee and the current collection efficiency of solid waste fees using this mode is 100%. A combined collection of water supply and wastewater fees has many advantages and is usually the preferred mode. However this is not practical in the case of Cimahi where only about 12% of Cimahi residents are served by PDAM Tirta Raharja. Cimahi city plans to hire a consultant in 2013 to prepare draft of regulations concerning the institutional, tariff, and billing of wastewater. The proposed capacity development technical assistance (CDTA) for MSMIP also provides for policy/ guideline and procedures manual preparation to cover operation and maintenance including commercial and financial systems.
16 In Makassar for example, the functional groups comprise centralized WWTP, Septage Treatment and Communal system.s

TA 7993 - INO: Metropolitan Sanitation Management Investment Project – MSMIP Final Report 66
ii. Creation of the BLUD
It is expected that during the 2 year capacity building assistance, the consultants will be able to assist and guide the city to eventually create the BLUD as planned. The city realizes that under the UPTD, wastewater operations cannot fully be autonomous and will continue to depend on city government budgets. The consultants will assist the city prepare draft legislation including the necessary PERDAs (or city regulations). Details of proposals on how the BLUD will be organized are provided in Annex G6. c. Institutional Development and Capacity Development Component The CDTA comprises two components, namely the capacity building plan and project management assistance. i. Capacity Building Plan Methodology and Approach The capacity building plan is directed at two (2) distinct levels – sector (or city) management level (through the Local Institutional Development Action Plan or LIDAP) and at the service delivery level (through the Financial and Operating Improvement Plan or FOPIP). The LIDAP includes interventions to be initiated and managed by the city government which influences the operating conditions of the Service Delivery Organization (SDO). The FOPIP, on the other hand, includes interventions which are to be initiated and managed by the SDO. See Figure III-L 3 below.
Figure III-L 3: Capacity Development Plan Approach
1) policy formulation, sector
management
(2) management of service delivery
(human resources, pricing the service,
etc.)
(3) community involvement
(4) regulation of service provision.
FOPIP
CAPACITY DEVELOPMENT
Establish
ment of
Effective
Service
by SDO
LIDAPSector
Reform
The sector interventions to be provided by the capacity building component can be grouped into three types:
• Assistance in the preparation of policies, guidelines, and manuals; • Advisory services, technical assistance and progress monitoring; • Training and Workshops.

TA 7993 - INO: Metropolitan Sanitation Management Investment Project – MSMIP Final Report 67
ii. Project Management Assistance Project management assistance covers technical audit and benefit monitoring. Technical Audit. The consultancy services also aims to provide initial project management assistance during the 12 month period prior to mobilization of the PISC and during the 12 months of the PISC contract. This primarily covers assistance in the procurement activities.
Benefit Monitoring and Evaluation. Monitoring and evaluation of project benefits calls for the development and implementation of a Project Performance Monitoring System which covers the, conduct of a baseline study and setting up of all institutional requirements in order to be able monitor and evaluate the benefits of the project after its completion. d. Project Readiness of the City Cimahi city has demonstrated its institutional readiness. The only area of concern is the need to accelerate action on the issuance of the Mayor’s Decrees for the creation and staffing/ of the UPTD. The city also realizes that social marketing/ promotion and issuance and enforcement of sanitation regulation are key to the success of the project and commits to this and other action plans in the LIDAP and FOPIP. Once the proposed tariffs are determined, the city will determine strategies to be able to implement the needed charges to make the wastewater operations sustainable. In several discussions of the consultants with the city, they have committed to charge fees that will fully recover O&M cost (including depreciation). The preliminary amounts calculated in the feasibility studies prepared under INDII were used as basis of the discussions with local officials. Firmer commitments are expected from the cities on the final tariffs which will be determined at a later stage.

TA 7993 - INO: Metropolitan Sanitation Management Investment Project – MSMIP Final Report 68
IV. Jambi City Off-site Wastewater Collection System and Treatment A. Jambi Physical Setting The total area of the City of Jambi is approximately 205.38 km2, with 8 sub-districts within the administrative area as seen below:
• Danau Teluk (1,570 ha) • Kota Baru (7,778 ha) • Jambi Selatan (3,407 ha) • Pasar Jambi (402 ha) • Jambi Timur (2,201 ha) • Pelayangan (1,529 ha) • Jelutung (792 ha) • Telanaipura (3,039 ha)
The coordinates of Jambi City are given below: 01° 30’ 2.98" - 01° 7’ 1.07" South Latitude 103° 40’ 1.67" - 103° 40 0.23" East Longitude Jambi City is in the centre of Sumatra Island and is under the Regency of Muaro Jambi.
Figure IV-A 1 – Location of Jambi City
No Kecamatan Luas Wilayah (Km2) Jumlah Kelurahan
1 Kota Baru 77,8 10
2 Jambi Selatan 34,07 9
3 Jelutung 7,92 7
4 Pasar Jambi 4,02 4
5 Telanaipura 30,39 11
6 Danau Teluk 15,70 5
7 Pelayangan 15,29 6
8 Jambi Timur 20,21 10
Jumlah 205,38 62

TA 7993 - INO: Metropolitan Sanitation Management Investment Project – MSMIP Final Report 69
The general topography is flat (0-2% slope), undulating (2-15% slope), and slightly steep (15-40% slope). The detailed area of each topographic area as follow:
• Flat (0-2% slope): 11,326 ha • Undulating (2-15% slope): 8,081 ha • Slightly steep (15-40% slope): 41 ha
Jambi City is located at an altitude of 10 to 60 m above sea level (asl). Most parts of Pasar Jambi, Parlaying and Danau Teluk sub-districts are located at an altitude of 0 to 10m asl, whilst most parts of Telanaipura, South Jambi, East Jambi and Kotabaru sub-districts are located an altitude of 10 to 40m asl. Land Use Land use patterns for Jambi are estimated at about 28% for plantations, 18% is forested, 20% in fields and 20% in residential areas. The remaining is distributed for roads (4%), rivers (4%), industrial (0.6%) within an total area of about 17,781 ha (according to Jambi City Spatial Planning, 2011). Water The rainy season runs from October to March, when it rains on average 20 days/month; during the dry season in April to September it rains less with only 16 days/month. The annual average rainfall is 2,296 mm/year (191.34 mm/month). The maximum temperature is 30.8-32.6 °C with air humidity from 82-87%. Potential areas of high ground water are at the south of the city towards the Jambi coastal plain area. The ground water table can be found at 0-14 meter under the local ground surface. The ground water quality generally satisfies the drinking water requirements. However, the presence of nearby septic tanks in many cases contaminates the bores with nitrate, nitrite and E. coli. Of those surveyed 54.5% of the respondents noted for drinking water the use of bottled water, 19% buy their drinking water from vendors, 1.6% buy from water trucks and only a very small proportion of the respondents collect their drinking water from a public tap (1.3%). The PDAM Tirta Mayang Kota Jambi as of 2011 serves 60.5% of the city population with the water sourced from the Batang Hari River. The major rivers that flow through the City of Jambi are the tributaries of Batang Hari River:
• Kenali Kecil River, • Kenali Besar River, • Asam River (central part of the city), and • Lubuk Raman River, Talang Goyang River and Pasir Putih River (on the eastern part
of the City) are the main drainage system in addition to domestic wastewater receiving bodies.
Potential areas of medium ground water level are located at the valley between the hills in Jambi City towards the west. The aquifer system is found at depths of 150 to 170 meters below ground level; ground water table depth is between 0.5 to 12.2 meters under the local ground surface, the average of which generally satisfies the quality for drinking water. Population Population growth between the years 2005 – 2010 averaged 3.1% per annum. This value was used by the Jambi MP in projecting population in the years 2015, 2020 and 2030 as seen in Table IV-A 1.

TA 7993 - INO: Metropolitan Sanitation Management Investment Project – MSMIP Final Report 70
Table IV-A 1: Projected population growth for Jambi City
Sanitation Based on a Puskesmas inspection (survey) carried out in the first trimester year 2011 on household sanitation risk, it was recorded that 6% of the households do not own a toilet. Inspections on the quality of the toilets indicated that about 36% belong to medium to high sanitation risk, with high deleterious environmental pollution potential. The general wastewater management practice (between 2005 to 2008, for various types of housing) uses a septic tank with infiltration (bottomless septic tank). The general waste management practice for the CBD is also the use of a septic tank aor cubluk with the grey water discharged into the nearest drainage channel. The most common wastewater management for slum areas is the use of a cubluk and discharging grey water directly to the environment. In 2005, poor sanitation as marked by the occurrence of diarrhoea cases, showed 2% of the population afflicted or 13,145 people. In 2009, the condition improved to only 1% cases or 10,079 people had diarrhoea. Some of this can be attributed to facts highlighted in the survey in which 8.6% have their toilet next to their water source (i.e. a bore) and 37% indicated the distance between them was less than 10 m. Moreover, 31.6% of those surveyed have had their house flooded, with 25% commenting that this is a yearly occurrence and 23% a bi-annual occurrence. Flooding by 26.4% of the respondents is attributed to a low house elevation, 16.9% due to tide, 10.5% due to clogged drainage, 10.1% due to overflow rainfall, and 4.3% due to poor drainage system. As with many cities 60.5% of those surveyed have never emptied their septic tanks. Those that employ a pit toilet simply move to a new pit when the old one is full, although 40% have never emptied or moved their pit. B. Rationale for Selection of Priority Projects The sub-projects included for implementation during Phase 1 (by 2014) of the WWMP that was produced for the Jambi Masterplan were identified. The City has been visited to ascertain which of the Phase 1 sub-projects are the priority of the City Government, in that they represent the selected sub-projects that the Cities would wish to implement in the event of limited loan funds. Jambi was visited on the 24th July. Minutes of the Meeting were included in the PPTA Interim Report dated September 2012. At the meeting a presentation was made on the specific “Readiness of the City” with regard to the sub-projects recommended in the WWMPs for the Phase 1 period. In particular,

TA 7993 - INO: Metropolitan Sanitation Management Investment Project – MSMIP Final Report 71
emphasis was placed on the confirmation of the availability of the land for the construction of the WWTP. The City confirmed the land is either now available or will be in the near future. The City has prioritized the sub-projects that they would wish to be included in this MSMIP TA. The following table shows the sub-projects that have been requested for consideration under this PPTA. The City has prioritized the sub-projects that they would wish to be included in this MSMIP TA. The following table shows the sub-projects that have been requested for consideration under this PPTA.
Table IV-B 1: SUB-PROJECTS SELECTED BY THE CITIES FOR FUNDING
City Description of Sub-Project Jambi WWTP and Central Area wastewater collection system
In this PPTA Report we have evaluated the WWTP and the Central Area wastewater collection systems. C. Proposed Wastewater Collection System For details of the proposed wastewater collection system and costings please see the following plans and costings table.

TA 7993 - INO: Metropolitan Sanitation Management Investment Project – MSMIP Final Report 72
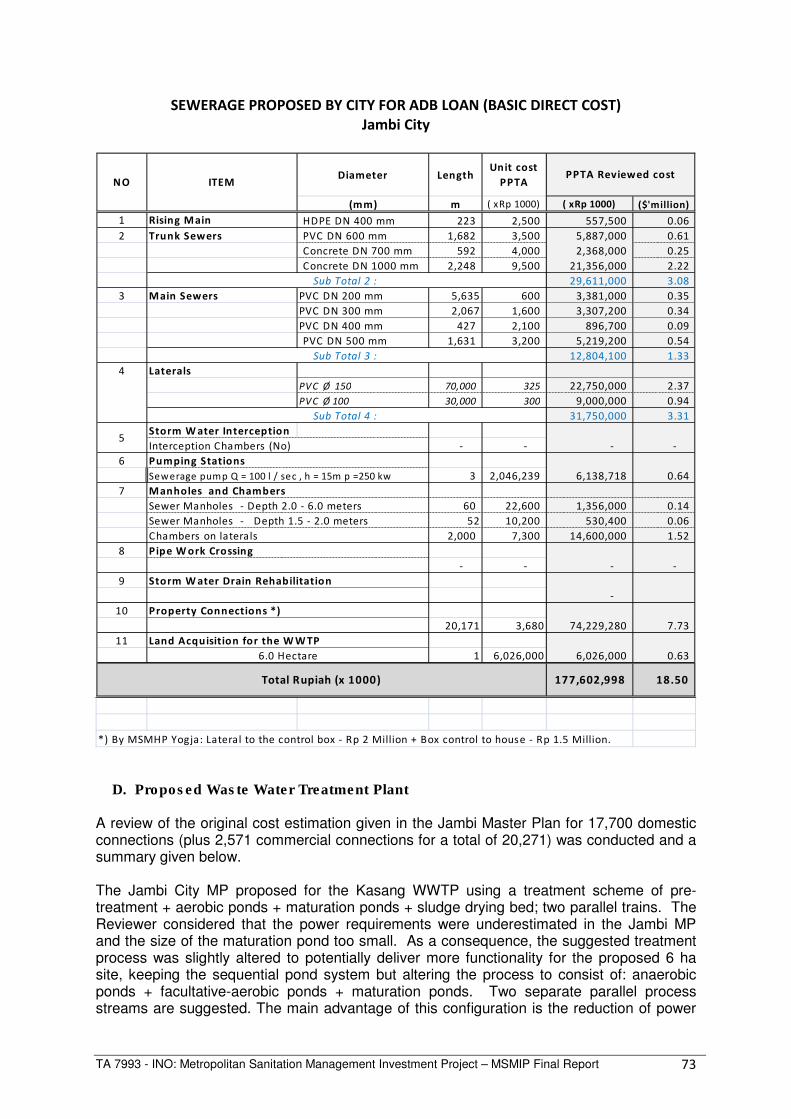
TA 7993 - INO: Metropolitan Sanitation Management Investment Project – MSMIP Final Report 73
SEWERAGE PROPOSED BY CITY FOR ADB LOAN (BASIC DIRECT COST)
Jambi City
Diameter LengthUnit cost
PPTA
(mm) m ( xRp 1000) ( xRp 1000) ($'million)
1 Rising Main HDPE DN 400 mm 223 2,500 557,500 0.06
2 Trunk Sewers PVC DN 600 mm 1,682 3,500 5,887,000 0.61
Concrete DN 700 mm 592 4,000 2,368,000 0.25
Concrete DN 1000 mm 2,248 9,500 21,356,000 2.22
29,611,000 3.08
3 Main Sewers PVC DN 200 mm 5,635 600 3,381,000 0.35
PVC DN 300 mm 2,067 1,600 3,307,200 0.34
PVC DN 400 mm 427 2,100 896,700 0.09
PVC DN 500 mm 1,631 3,200 5,219,200 0.54
12,804,100 1.33
Laterals
PVC Ø 150 70,000 325 22,750,000 2.37
PVC Ø 100 30,000 300 9,000,000 0.94
31,750,000 3.31
Storm W ater Interception
- - - -
6
3 2,046,239 6,138,718 0.64
7
60 22,600 1,356,000 0.14
52 10,200 530,400 0.06
2,000 7,300 14,600,000 1.52
8
- - - -
9
-
10
20,171 3,680 74,229,280 7.73
11
1 6,026,000 6,026,000 0.63
*) By MSMHP Yogja: Lateral to the control box - Rp 2 Million + Box control to house - Rp 1.5 Million.
NO ITEMPPTA Reviewed cost
Sub Total 2 :
Sub Total 3 :
4
Sub Total 4 :
5Interception Chambers (No)
Pumping Stations
Sewerage pump Q = 100 l / sec , h = 15m p =250 kw
Manholes and Chambers
Sewer Manholes - Depth 2.0 - 6.0 meters
Chambers on laterals
Pipe W ork Crossing
Property Connections *)
Sewer Manholes - Depth 1.5 - 2.0 meters
6.0 Hectare
Total Rupiah (x 1000) 177,602,998
Land Acquisition for the W W TP
Storm W ater Drain Rehabilitation
18.50
D. Proposed Waste Water Treatment Plant A review of the original cost estimation given in the Jambi Master Plan for 17,700 domestic connections (plus 2,571 commercial connections for a total of 20,271) was conducted and a summary given below. The Jambi City MP proposed for the Kasang WWTP using a treatment scheme of pre-treatment + aerobic ponds + maturation ponds + sludge drying bed; two parallel trains. The Reviewer considered that the power requirements were underestimated in the Jambi MP and the size of the maturation pond too small. As a consequence, the suggested treatment process was slightly altered to potentially deliver more functionality for the proposed 6 ha site, keeping the sequential pond system but altering the process to consist of: anaerobic ponds + facultative-aerobic ponds + maturation ponds. Two separate parallel process streams are suggested. The main advantage of this configuration is the reduction of power

TA 7993 - INO: Metropolitan Sanitation Management Investment Project – MSMIP Final Report 74
usage as well the elimination of daily sludge management. The ponds can be designed to be desludged every 8 to 10 years. The process flow diagram (PFD) is shown in the following page. A cost comparison is shown in the table below.
Source of Costs Estimations (for 17,600 connections or 15 MLD)
Capex (NO VAT, (USD Million)
Opex (USD/annum
Comments
Jambi City MP (pre-treatment + aerobic ponds + maturation ponds + sludge drying bed; two parallel trains)
11.6 175,000 (estimate revised by Reviewer)
Includes sludge drying bed and malodour is possible from the first lagoon. Lagoon desludging would be needed every 2 to 3 years. Maturation pond only has 6 hours of HRT (hydraulic residence time) and would quickly fill with solids. Capital cost per connection is about $US572.
MSMIP Technical Review (Alternative 2B: pre-treatment + covered anaerobic ponds + facultative aerobic ponds + maturation ponds; two parallel trains) Septage solids to be accepted at facility.
10.9 149,000 Odour is contained at the front of the process with a membrane cover, pond desludging only needed every 8 to 10 years or so, no drying beds included, aerobic lagoons are actually facultative-aerobic, thus lowering energy requirements, maturation pond has 1 day HRT. Capital cost per connection is about $US538.

TA 7993 - INO: Metropolitan Sanitation Management Investment Project – MSMIP Final Report 75
3:1(H:V)DH
L1
L2
AT
AB
Dewater / Desludge
Every5 to 10+ years
Surface Aerators
3:1(H:V)DH
L1
L2
AT
AB
FACULTATIVE
AEROBIC PONDS
3:1(H:V)DH
L1
L2
AT
AB
MATURATION PONDS
Proposed AnFAP TREATMENT PROCESS
(Two Parallel Trains or 6 ponds)
COVERED ANAEROBIC PONDS
TRUCK OFFLOAD
CHAMBER
MECHANICAL
SCREENS
Domestic + Commercial Wastewater
GRIT
Screenings & Grit to Landfill
ST PumpoutTrucks
Possible Grinder
OVERFLOW Biogas
FLARE
Geo-Plastic
Membrane
Cover
Treated WW to Discharge
M
M
M
M
Optionale- gen
MM
M
BYPASS Flows > 2xADWF

TA 7993 - INO: Metropolitan Sanitation Management Investment Project – MSMIP Final Report 76
The capital costs (Capex) reflect the use of earthen ponds with uncertain site conditions. A contingency was consequently included for unknowns. No cutting into the existing ground level was proposed because of the high water table. It was presumed that the whole site would be raised by about 1000 mm (the site is low lying, next to other fish ponds and groundwater would almost certainly be at the surface) with clean fill and the ponds would sit upon this. The walls of the ponds (i.e. the dykes or birms) would also be made of clean fill. A polymer lining (chlorinated polyethylene was assumed but another could be used) was assumed for all the ponds. The preferred alternative also has the anaerobic pond covered with a polymer (Hypalon was assumed) to capture odour and biogas for flaring (or other uses, but only a flare was included for costing). Mechanical 8 mm step screens and vortex degritting were assumed prior to the ponds. No costing was allowed for chlorine disinfection facilities as disinfection will be provided (to some extent) by the maturation ponds. The Capex also included a two level (400 m2/level) Office Building that would house a laboratory, offices, plus a control room. No allowance was made for sludge dewatering or for sludge drying beds, which would need future attention in about ten (10) years when the ponds need dewatering. Allowance was made for site fencing and illumination as well for a septage receival station at the WWTP. The operating and maintenance costs (Opex) took into account the mechanical screens, degritting, surface aerators, site lighting and air conditioning (for the laboratory and control room). Maintenance was assumed at 3% of the mechanical component. Personnel included one plant manager, one supervising engineer, two operators, one chemist, one mechanic one labourer and 25% of an electrician. The cost of future sludge disposal at $USD50/tonne was factored into the Opex. For a more detailed analysis of the proposals see the table below and Annex Document A – Technical.
Million (IDR) or
Other
Million
(USD)
Percent of
Total
Million (IDR)
or Other
Million
(USD)
Percent of
Total
1 Biotreatment Liquid Surface Area Reqmts, ha 4.0 NA NA 3.8 NA NA
2 16,842 1.79 17% 16,842 1.79 16%
3 7,874 0.84 8% 6,135 0.65 6%
4 28,140 2.99 28% 11,140 1.19 11%
5 24,375 2.59 24% 23,292 2.48 23%
6 NA NA NA 4,644 0.49 5%
7 Contingency for Unknown Site Constraints 10,873 1.16 11% 11,090 1.18 11%
8 Engineering & Construction Management 5,074 0.54 5% 5,175 0.55 5%
9 Other 6,129 0.65 6% 22,974 2.44 22%
TOTAL ESTIMATED CAPITAL COSTS: 99,308 10.69 101,291.79 10.91Avg Capex/Conn (Mil. IRP/conn. or USD/conn.): 5.6 608 5.8 620
TOTAL EST. ANNUAL O&M COSTS: 1,311 0.1637 1,168 0.1484Avg. Annual Opex/Conn. (IDR or USD/conn. ): 74,553 9.31 66,409 8.44
Annual Opex as % of Capex: 1.5% 1.4%
Note: NA (not applicable); costing does NOT include VAT; Opex = Operating + Maintenance Costs; Capex = Capital Cost
Alternative 2A: Anaerobic Pond followed by Facultative Aerated Pond + Maturation Pond
Alternative 2B: Membrane Covered Anaerobic Pond+ Facultative Aerated Pond + Maturation Pond
ALTERNATIVE 2A ALTERNATIVE 2BREVIEWER KASANG WWTP:
COST SUMMARY
(Does not include pump station)
STAGE 1: 15 MLD
17,600 dom. + 2571 comm. connections
Estimated Civil Cost of Ponds (ponds to sit on top of
site fill, no cut; dykes to be made of clean fill)
Estimated Cost of Pond's CPE (plastic) Liner +
Protective Sand Top + Bottom
Estimated Cost of Cover for Anaerobic Pond +
Biogas Piping + Flare
Estimated Cost for Site Prep. Including Raising whole
Site by 1.0 m
Estimated Mechanical Cost

TA 7993 - INO: Metropolitan Sanitation Management Investment Project – MSMIP Final Report 77
E. Cost Estimates and Implementation Schedule Total subproject cost for Jambi City is $39.69 million equivalent. This is based on the direct costs estimated in the technical study and discussed in previous sections. The subproject cost includes taxes and duties, detailed engineering design, physical and price contingencies, land acquisition and involuntary resettlement cost. Details of the estimate are shown in the following table:
Table IV-E 1: Summary of Cost Estimates ($ million)
Breakdown of Totals Incl. Cont.
Local
Base For. (Excl. Duties &
Cost Exch. Taxes) Taxes Total
1 Wastewater Treatment Works
a. Civil Works 9.99 11.96 7.00 3.76 1.20 11.96
b. Detailed Engineering Design 0.50 0.57 0.17 0.34 0.06 0.57
Subtotal 10.49 12.52 7.17 4.10 1.25 12.52
2 Wastewater Collection System
a. Civil Works 11.15 14.02 4.63 7.99 1.40 14.02
b. Detailed Engineering Design 0.56 0.63 0.19 0.38 0.06 0.63
Subtotal 11.71 14.65 4.82 8.37 1.46 14.65
3 Property Connections
a. Civil Works 8.51 10.91 4.09 5.73 1.09 10.91
b. Detailed Engineering Design 0.43 0.56 0.10 0.41 0.06 0.56
c. Construction Supervision 0.26 0.34 0.06 0.24 0.03 0.34
Subtotal 9.20 11.82 4.26 6.38 1.18 11.82
4 Land Acquisition 0.58 0.58 - 0.58 - 0.58
5 Involuntary Resettlement 0.12 0.13 - 0.13 - 0.13
T O T A L 32.09 39.69 16.24 19.55 3.90 39.69
Total
Cost
Source: PPTA Consultant’s estimates. a Based on estimates in the technical study.
b Includes taxes, duties and contingencies (physical and price).
The total investment cost will be financed from various sources: ADB Ordinary Capital Resources (OCR), ASEAN Infrastructure Fund (AIF), Central Government and City Government of Jambi. The available financing will be allocated as follows: ADB OCR and AIF will finance $15.02 million equivalent and $7.51 million equivalent, respectively; the Central Government will shoulder all taxes and duties of $6.13 million equivalent while the City Government will cover land acquisition, involuntary resettlement and property connections amounting to $11.03 million equivalent. The distribution of fund sources is detailed in the following table:
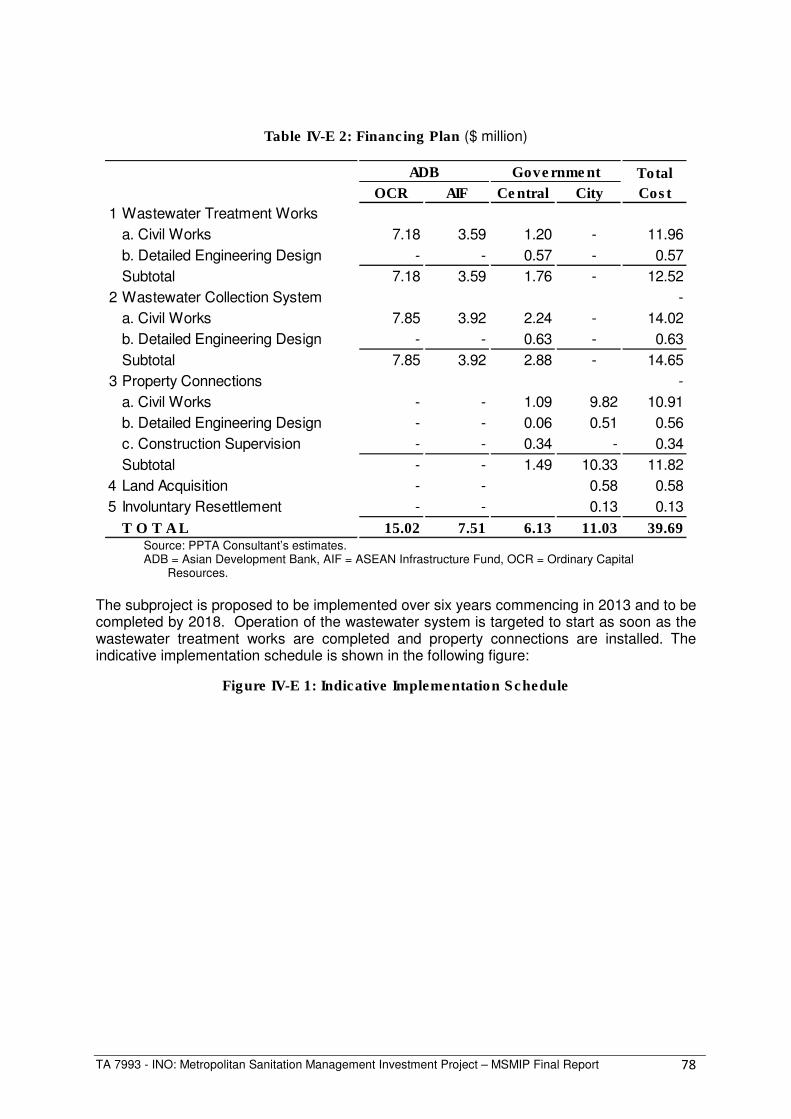
TA 7993 - INO: Metropolitan Sanitation Management Investment Project – MSMIP Final Report 78
Table IV-E 2: Financing Plan ($ million)
ADB
OCR AIF Central City
1 Wastewater Treatment Works
a. Civil Works 7.18 3.59 1.20 - 11.96
b. Detailed Engineering Design - - 0.57 - 0.57
Subtotal 7.18 3.59 1.76 - 12.52
2 Wastewater Collection System -
a. Civil Works 7.85 3.92 2.24 - 14.02
b. Detailed Engineering Design - - 0.63 - 0.63
Subtotal 7.85 3.92 2.88 - 14.65
3 Property Connections -
a. Civil Works - - 1.09 9.82 10.91
b. Detailed Engineering Design - - 0.06 0.51 0.56
c. Construction Supervision - - 0.34 - 0.34
Subtotal - - 1.49 10.33 11.82
4 Land Acquisition - - 0.58 0.58
5 Involuntary Resettlement - - 0.13 0.13
T O T A L 15.02 7.51 6.13 11.03 39.69
Total
Cost
Government
Source: PPTA Consultant’s estimates. ADB = Asian Development Bank, AIF = ASEAN Infrastructure Fund, OCR = Ordinary Capital
Resources.
The subproject is proposed to be implemented over six years commencing in 2013 and to be completed by 2018. Operation of the wastewater system is targeted to start as soon as the wastewater treatment works are completed and property connections are installed. The indicative implementation schedule is shown in the following figure:
Figure IV-E 1: Indicative Implementation Schedule

TA 7993 - INO: Metropolitan Sanitation Management Investment Project – MSMIP Final Report 79
1 2 3 4 1 2 3 4 1 2 3 4 1 2 3 4 1 2 3 4 1 2 3 4
Loan negotiation
Loan signing
Loan effectivity
Subproject Investments (for 5 Cities)
Main Works
Detailed engineering design (Grant)
Land acquisition and involuntary resettlement
Compensation for the WCS
Prequalification and bidding
Awarding of contracts
Construction of civil works
Waste Water Treatment Works
Trunk Sewers
Main Sewers
Storm Water Drainage
Laterals and Interceptors
Property Connections
Detailed engineering design
Prequalification and bidding
Awarding of contracts
Construction of civil works
WCS/ WWTW LATERALS
2013 2014 2015 2016 2017 2018
The annual breakdown of costs by component is shown in the following table:
Table IV-E 4: Estimated Annual Subproject Costs by Component
Totals Including Contingencies (US$ Million)
2013 2014 2015 2016 2017 2018 Total
1 Wastewater Treatment Works
a. Civil Works - 1.62 6.79 3.55 - - 11.96
b. Detailed Engineering Design 0.57 - - - - - 0.57
Subtotal 0.57 1.62 6.79 3.55 - - 12.52
2 Wastewater Collection System
a. Civil Works - 0.65 4.20 4.91 2.75 1.50 14.02
b. Detailed Engineering Design 0.63 - - - - - 0.63
Subtotal 0.63 0.65 4.20 4.91 2.75 1.50 14.65
3 Property Connections
a. Civil Works - - 1.34 3.09 3.19 3.29 10.91
b. Detailed Engineering Design - - 0.07 0.16 0.17 0.17 0.56
c. Construction Supervision - - 0.04 0.10 0.10 0.10 0.34
Subtotal - - 1.45 3.34 3.45 3.57 11.82
4 Land Acquisition 0.58 - - - - - 0.58
5 Involuntary Resettlement - 0.01 0.04 0.04 0.02 0.01 0.13
T O T A L 1.77 2.28 12.48 11.84 6.23 5.08 39.69 Source: PPTA Consultant’s estimates.
F. Financial Analysis 1. Methodology and Assumptions. The financial analysis followed the guidelines described in ADB’s Financial Management and Analysis of Project (2005). Three indicators for the financial viability of the subproject have been identified:
• Financial Internal Rate of Return (FIRR). It is the discount rate at which the net revenues generated by the subproject are equal to zero. A project is considered

TA 7993 - INO: Metropolitan Sanitation Management Investment Project – MSMIP Final Report 80
financially viable if the computed FIRR is at least equal to the weighted average cost of capital (WACC) applicable to the proposed subproject;
• Tariff affordability. The wastewater tariff should be affordable to low income households.
• Subproject sustainability. The funds will be on-granted to the City; however, the subproject should still generate sufficient cash flow from wastewater tariffs to cover annual operations and maintenance requirements.
The key financial and technical assumptions used in the projections are the following:
• Cost estimates at constant October 2012 prices. • Domestic and foreign cost escalations17 are as follows:
2013 2014 2015 2016 onwards
Domestic cost escalation 5.1% 4.8% 4.4% 4.4%
Foreign cost escalation 1.9% 2.2% 1.9% 1.8%
• Exchange rate at Rp9,600 to US$1.0018.
• Physical contingencies at 10% to 15% of direct costs. • Constant costs used in the computation of FIRR while current costs are used in the
financial statements. • Operation and maintenance (O&M) expenses based on technical projections and
escalated at 4.4% annually. • Number of property connections (17,700 domestic and 2.571 non-domestic) based
on plant capacity as presented in the technical evaluation. • Gross revenues equal to number of connections by type, multiplied by the
appropriate tariff. • Collection efficiency of 95%, based on the reported collection efficiency for similar
services (solid waste management). • Loan proceeds from ADB will be passed on by the Central Government to the City as
a grant (i.e. the Central Government will pay all principal and interest due on the loan).
• Jambi City will set up a Badan Layanan Umum Daerah (BLUD or Regional Public Service Agency) as the service delivery organization (SDO) to operate the wastewater system. A BLUD is a semi-autonomous service provider created for the provision of public service on a non-profit basis. Pending the establishment of the BLUD, a Unit Pelaksanaan Teknis Daerah (UPTD or Regional Technical Implementation Unit) is in the process of being formed under the Dinas Kebersihan Pertamanan dan Pemakaman or DKPP (Agency for Cleanliness, Parks and Cemetery) to handle the preparatory, implementation and initial operational activities a. Capital Costs
The total development cost for the subproject is $39.69 million equivalent. This is based on the costs presented in the technical study, plus physical and price contingencies.19
17 ADB SERD, Domestic Cost Escalation Factors Update, October 2012 and World Bank projections as of September 2012 for international cost escalation factors.
18 Bank of Indonesia. Average rate for period June to December, 2012.
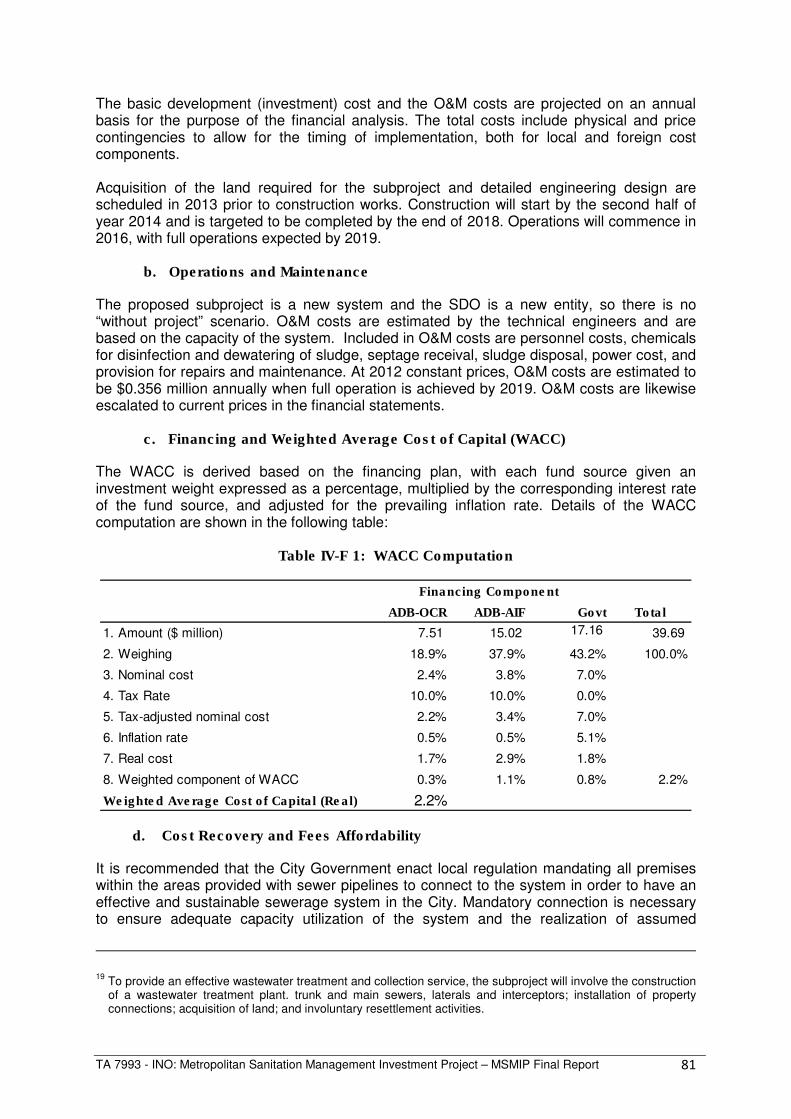
TA 7993 - INO: Metropolitan Sanitation Management Investment Project – MSMIP Final Report 81
The basic development (investment) cost and the O&M costs are projected on an annual basis for the purpose of the financial analysis. The total costs include physical and price contingencies to allow for the timing of implementation, both for local and foreign cost components. Acquisition of the land required for the subproject and detailed engineering design are scheduled in 2013 prior to construction works. Construction will start by the second half of year 2014 and is targeted to be completed by the end of 2018. Operations will commence in 2016, with full operations expected by 2019.
b. Operations and Maintenance
The proposed subproject is a new system and the SDO is a new entity, so there is no “without project” scenario. O&M costs are estimated by the technical engineers and are based on the capacity of the system. Included in O&M costs are personnel costs, chemicals for disinfection and dewatering of sludge, septage receival, sludge disposal, power cost, and provision for repairs and maintenance. At 2012 constant prices, O&M costs are estimated to be $0.356 million annually when full operation is achieved by 2019. O&M costs are likewise escalated to current prices in the financial statements. c. Financing and Weighted Average Cost of Capital (WACC)
The WACC is derived based on the financing plan, with each fund source given an investment weight expressed as a percentage, multiplied by the corresponding interest rate of the fund source, and adjusted for the prevailing inflation rate. Details of the WACC computation are shown in the following table:
Table IV-F 1: WACC Computation
ADB-OCR ADB-AIF Govt Total
1. Amount ($ million) 7.51 15.02 17.16 39.69
2. Weighing 18.9% 37.9% 43.2% 100.0%
3. Nominal cost 2.4% 3.8% 7.0%
4. Tax Rate 10.0% 10.0% 0.0%
5. Tax-adjusted nominal cost 2.2% 3.4% 7.0%
6. Inflation rate 0.5% 0.5% 5.1%
7. Real cost 1.7% 2.9% 1.8%
8. Weighted component of WACC 0.3% 1.1% 0.8% 2.2%
Weighted Average Cost of Capital (Real) 2.2%
Financing Component
d. Cost Recovery and Fees Affordability
It is recommended that the City Government enact local regulation mandating all premises within the areas provided with sewer pipelines to connect to the system in order to have an effective and sustainable sewerage system in the City. Mandatory connection is necessary to ensure adequate capacity utilization of the system and the realization of assumed
19 To provide an effective wastewater treatment and collection service, the subproject will involve the construction of a wastewater treatment plant. trunk and main sewers, laterals and interceptors; installation of property connections; acquisition of land; and involuntary resettlement activities.

TA 7993 - INO: Metropolitan Sanitation Management Investment Project – MSMIP Final Report 82
improvements in public health and environment. The local regulation must also stipulate that all households and commercial establishments provided with sewer connections will pay mandatory monthly wastewater fees and these will be collected by the BLUD through community organizations or leaders. The loan proceeds will be on-granted from the Central Government to Jambi City. It was decided that tariffs should at least cover O&M costs for sustainability, provide the tariff per household is still affordable to the target beneficiaries. The proposed tariff structure classifies consumers as either domestic (i.e. households) or non-domestic (i.e. commercial and industrial connections), with non-domestic connections to be charged more to boost revenues. The proposed monthly fee is $1.20 per domestic connection and $12.00 per non-domestic connection. Tariffs are expected to be implemented in 2016 when operations commence, increasing 15% every two years to keep pace with inflation. The estimated average monthly household income for 2011 was Rp1,563,000 (equivalent to about $163) based on the results of socio-economic survey conducted as part of this study20. The $1.20 domestic tariff will be 0.6% of the monthly household income, well within the 2% limit under DGHS’ policy for household wastewater charge.21 In all subsequent years, the domestic tariff is expected to remain below 1% of household income. It should be noted, however, that the proposed tariff is also the monthly tariff target beneficiaries indicated they were willing to pay. Initially it was assumed that domestic and non-domestic accounts would pay a one-time connection fee. City officials subsequently informed the study team that the City’s current intention is to charge non-domestic connections with connection fee of Rp1,650,000 which may be paid in instalment basis. Households will not be charged, to encourage them to connect to the system. The investment cost includes the cost of connections, and as shown in the financing plan, this will be funded by the City Government from its own funds. 2. Result of Financial Analysis
The FIRR of the subproject is measured as the discount rate that equalizes the present value cost stream associated with the project to the present value of the project’s benefit stream. A subproject is considered financially viable if the resulting FIRR is higher than the WACC applicable to the subproject. Sensitivity analysis is conducted under four scenarios such as a one-year delay in operation, a 10% increase in project cost, a 10% increase in O&M costs and a 10% decrease in revenues. The analysis shows that full recovery of the cost of the wastewater system and O&M costs through tariffs alone is not possible, due to affordability constraints and very low willingness to pay for this kind of service. Two scenarios were evaluated: Scenario 1 with tariffs equivalent to the tariff target beneficiaries indicated they were willing to pay and will cover O&M costs resulting in a slight positive cash flow (but not sufficient to cover depreciation); and Scenario 2 with full cost recovery of investment and O&M costs. The following table shows the tariffs required for each category and results as to affordability, FIRR, net income and cash flow:
Table IV-F 2: Summary Result of Evaluation
Proposed monthly fee
per HH
Affordability over 10-
year
FIRR Net Income after
depreciation
Cash Flow
20 Based on limited survey conducted as part of this PPTA study.
21 INDII. 2011. Wastewater Investment Master Plan Package 1: Makassar.

TA 7993 - INO: Metropolitan Sanitation Management Investment Project – MSMIP Final Report 83
connection a projection
period b
Partial Cost Recovery (to cover O&M and equivalent to willingness to pay)
$1.20 0.58%to 0.72%
1.3% Negative This requires a $0.18 million subsidy from the City for the first year of operation.
Full Cost Recovery
$2.98 1.43% to 1.78%
9.4% Positive Positive No subsidy required.
a Monthly fee is proposed to be increased by 15% every two years.
b Monthly fee as a percentage of average monthly household income. The percentage range represents the
minimum and maximum percentages during the 10-year projection period.
It is recommended that the wastewater fees should at least cover O&M costs to result in a positive cash flow for the SDO. Partial cost recovery ($1.20 per household connection and $12.00 per non-domestic connection) should be the minimum objective since if fees are lower, a significant subsidy from the City Government will be required to make the operation sustainable. The FIRR results for the recommended partial cost recovery option are provided in the following table:
Table IV-F 3: Summary Result of Financial Analysis
NPV ($ m) FIRR (%) SI % Change SV
Base case (4.11) 1.3%
1-Year Delay in Operation (6.62) 0.8% 4.23 10% 24%
Capital cost plus 10% (7.07) 0.8% 4.02 10% 25%
O & M costs plus 10% (4.77) 1.2% 1.05 10% 95%
Revenues less 10% (7.32) 0.6% 5.56 10% 18% FIRR = financial internal rate of return, NPV = net present value SI = sensitivity indicator (ratio of % change in EIRR to % change in a variable) SV = switching value (% change in variable required for EIRR to fall below cut-off rate)
3. Project Financial Sustainability and Implementation Risks
a. Financial Projections for SDO
The financial sustainability and performance of BLUD, the operating entity, was projected over the ten years immediately following full system operation in 2019. The BLUD’s projected financial statements (balance sheet, income statement and cash flow statement for the period 2013 to 2025) are summarized and presented in Tables IV-F 5 and IV-F 6. Selected financial ratios and performance indicators were used to analyse the results of operations and project viability. Several risks which may impact the BLUD’s financial performance including:
• Uncertainty regarding the implementation of tariff increases; • Uncertainty on the provision of public service obligation or PSO22 for O&M
costs, as maybe required;
22 Public Service Obligation (PSO) is a form of subsidy provided by the City Government to the SDO.

TA 7993 - INO: Metropolitan Sanitation Management Investment Project – MSMIP Final Report 84
• Inadequate resources for counterpart funding; and • Inefficiency of its collections.
Tariffs must be periodically raised to keep pace with inflation (the projections assumed tariffs increase by 15% every two years), and the City Government’s approval is required for these increases. If tariffs are not periodically increased, the City Government must provide a support fund or subsidy to ensure its financial sustainability. These factors should be properly addressed to mitigate the risks enumerated above. The projected revenues were based on the projected increase in the number of connections multiplied by the monthly wastewater service fees, initially $1.20 and $12.00 for domestic and non-domestic consumers, respectively. O&M costs were assumed at current prices. The projected income statements show that the wastewater fees can adequately cover the costs of O&M even during the initial operating stage; there is no need for the City Government to cover any operating cost shortfall. From 2018 onwards, assuming 95% collection efficiency, results of operations further improve with an average net income before depreciation of $0.38 million per year. Net losses arise as revenues are insufficient to cover the full depreciation cost of the system. Depreciation expense is estimated at $1.44 million per year based on straight line computation and assuming 25 years of estimated useful life.
The projected balance sheet for the ten-year period includes the projected assets, liabilities and equity, as presented in Table IV-F 4. Total fixed assets reflect mainly the project cost of $39.64 million, comprising roughly 98% of total assets. The debt to equity ratios are expected to be low as the proceeds of the project are on-granted from the Central Government to the City Government. The SDO’s liquidity position has an average ratio of 16:1. Selected financial ratios are presented in the financial statements.
Projected cash flows were also developed and showed positive cash balances all throughout the projection period as shown in Table IV-F 6. Collection efficiency is assumed at 95% with average collection period of 15 days, providing for cash sufficiency for operations and maintenance.

TA 7993 - INO: Metropolitan Sanitation Management Investment Project – MSMIP Final Report 85
Tables IV-F 4: Projected Income Statement (% million)
2016 2017 2018 2019 2020 2021 2022 2023 2024 2025
Operating Revenues
Water Sales 0.10 0.30 0.57 0.63 0.79 0.83 0.95 0.95 1.09 1.09
Domestic 0.03 0.08 0.15 0.21 0.30 0.34 0.39 0.39 0.45 0.45
Institutional 0.00 0.00 0.00 0.00 0.00 0.00 0.00 0.00 0.00 0.00
Commercial 0.07 0.22 0.43 0.43 0.49 0.49 0.56 0.56 0.65 0.65
Other Operating Revenues 0.09 0.18 0.18 0.06 0.08 0.08 0.10 0.10 0.11 0.11
Total Revenues 0.19 0.48 0.75 0.69 0.87 0.91 1.05 1.05 1.20 1.20
Operating Expenses
Payroll 0.14 0.16 0.18 0.19 0.19 0.20 0.21 0.22 0.23 0.24
Power Cost 0.04 0.08 0.12 0.12 0.13 0.13 0.14 0.14 0.15 0.16
Chemicals 0.00 0.00 0.00 0.00 0.00 0.00 0.00 0.00 0.00 0.00
Maintenance 0.04 0.08 0.11 0.12 0.12 0.13 0.13 0.14 0.14 0.15
Other O & M 0.04 0.05 0.06 0.06 0.06 0.07 0.07 0.07 0.07 0.08
Franchise Tax 0.00 0.00 0.00 0.00 0.00 0.00 0.00 0.00 0.00 0.00
Bad Debts 0.00 0.00 0.00 0.00 0.00 0.00 0.00 0.00 0.00 0.00
Total Operating Exp. 0.27 0.37 0.46 0.48 0.50 0.53 0.55 0.57 0.60 0.62
Net Income (loss) before Depreciation -0.08 0.11 0.29 0.21 0.37 0.38 0.50 0.47 0.60 0.58
Depreciation 0.57 1.26 1.49 1.59 1.59 1.59 1.59 1.59 1.59 1.59
Net Operating Income (Loss) -0.65 -1.15 -1.20 -1.38 -1.22 -1.20 -1.09 -1.11 -0.98 -1.01
Less: Interest Expense 0.00 0.00 0.00 0.00 0.00 0.00 0.00 0.00 0.00 0.00
Foreign Exchange Loss 0.00 0.00 0.00 0.00 0.00 0.00 0.00 0.00
Net Income (Loss) -0.65 -1.15 -1.20 -1.38 -1.22 -1.20 -1.09 -1.11 -0.98 -1.01
Projected

TA 7993 - INO: Metropolitan Sanitation Management Investment Project – MSMIP Final Report 86
Table IV-F 5: Projected Balance Sheet ($ million)
2013 2014 2015 2016 2017 2018 2019 2020 2021 2022 2023 2024 2025
ASSETS
Fixed Assets
Fixed Assets in Operation 0.00 0.00 0.00 28.37 34.61 39.69 39.69 39.69 39.69 39.69 39.69 39.69 39.69
Less: Accum. Depreciation 0.00 0.00 0.00 0.57 1.83 3.31 4.90 6.49 8.08 9.66 11.25 12.84 14.43
Net Fixed Assets in Operation 0.00 0.00 0.00 27.81 32.78 36.38 34.79 33.20 31.61 30.03 28.44 26.85 25.26
Add: Work-in-Progress 1.77 4.05 16.53
Total Fixed Assets 1.77 4.05 16.53 27.81 32.78 36.38 34.79 33.20 31.61 30.03 28.44 26.85 25.26
Current Assets
Cash 0.00 0.00 0.00 0.10 0.18 0.42 0.56 0.85 1.15 1.57 1.95 2.47 2.94
Accounts Receivable (net) 0.00 0.00 0.00 0.00 0.01 0.03 0.06 0.07 0.09 0.09 0.10 0.10 0.12
Inventory 0.00 0.00 0.00 0.00 0.01 0.01 0.01 0.01 0.01 0.01 0.01 0.01 0.01
Other Current Assets 0.00 0.00 0.00 0.00 0.01 0.01 0.02 0.02 0.02 0.02 0.02 0.02 0.02
Total Current Assets 0.00 0.00 0.00 0.10 0.21 0.48 0.64 0.95 1.27 1.69 2.09 2.60 3.10
Reserves 0.00 0.00 0.00 0.00 0.02 0.05 0.10 0.16 0.23 0.30 0.38 0.47 0.55
TOTAL ASSETS 1.77 4.05 16.53 27.91 33.01 36.90 35.53 34.31 33.11 32.02 30.91 29.92 28.91
LIABILITIES AND EQUITY
Current Liabilities
Accounts Payable 0.00 0.00 0.00 0.00 0.02 0.02 0.03 0.03 0.03 0.03 0.03 0.03 0.03
Total Current Liabilities 0.00 0.00 0.00 0.00 0.02 0.02 0.03 0.03 0.03 0.03 0.03 0.03 0.03
Equity 0.00
Donated Capital 1.77 4.05 16.53 28.55 34.79 39.87 39.87 39.87 39.87 39.87 39.87 39.87 39.87
Retained Earnings 0.00 0.00 0.00 (0.65) (1.80) (2.99) (4.37) (5.59) (6.79) (7.88) (9.00) (9.98) (10.99)
Total Equity 1.77 4.05 16.53 27.91 32.99 36.88 35.50 34.28 33.08 31.99 30.87 29.89 28.88
TOTAL LIABILITIES AND EQUITY 1.77 4.05 16.53 27.91 33.01 36.90 35.53 34.31 33.11 32.02 30.91 29.92 28.91
0.000 0.000 0.000 0.000 0.000 0.000 0.000 0.000 0.000 0.000 0.000 0.000 0.000
Projected

TA 7993 - INO: Metropolitan Sanitation Management Investment Project – MSMIP Final Report 87
Table IV-F 6: Projected Cash Flow Statement ($ million)
2013 2014 2015 2016 2017 2018 2019 2020 2021 2022 2023 2024 2025
Sources of Cash
Collection of Revenues - CY - - - 0.10 0.29 0.54 0.57 0.73 0.74 0.86 0.85 0.99 0.97
Collection of Receivables - PY - - - - - 0.01 0.03 0.06 0.07 0.09 0.09 0.10 0.10
Other Receipts - - - 0.09 0.18 0.18 0.06 0.08 0.08 0.10 0.10 0.11 0.11
Grant Funds - INDII 1.77 0.27 2.84 4.53 3.92 3.82
Central Government 1.20 0.27 1.53 1.56 0.88 0.69
City Government 0.58 0.01 1.31 2.97 3.04 3.13
Proceeds of Loan - 2.01 9.64 7.31 2.31 1.26
ADB-OCR 0.67 3.21 2.44 0.77 0.42
ADB-AIF 1.34 6.43 4.88 1.54 0.84
Capital Contribution 0.18
Total Sources of Cash 1.77 2.28 12.48 12.21 6.70 5.81 0.67 0.86 0.89 1.04 1.03 1.20 1.19
Uses of Cash
Project Investment 1.77 2.28 12.48 11.84 6.23 5.08
O & M Expenses and Working Capita - - - 0.27 0.37 0.46 0.48 0.50 0.53 0.55 0.57 0.60 0.62
Reserves - - - 0.00 0.01 0.03 0.05 0.06 0.07 0.08 0.08 0.09 0.09
Total Uses of Cash 1.77 2.28 12.48 12.11 6.61 5.57 0.53 0.57 0.59 0.62 0.65 0.69 0.71
Increase(Decrease) in Cash - - - 0.10 0.09 0.24 0.13 0.30 0.30 0.42 0.38 0.52 0.48
Add: Cash Balance, Beg. - - - - 0.10 0.18 0.42 0.56 0.85 1.15 1.57 1.95 2.47
Cash Balance, End. - - - 0.10 0.18 0.42 0.56 0.85 1.15 1.57 1.95 2.47 2.94
Projected

TA 7993 - INO: Metropolitan Sanitation Management Investment Project – MSMIP Final Report 88
4. Municipal Finance
Dinas Kebersihan Pertamanan dan Pemakaman or DKPP (Agency for Cleanliness, Parks and Cemetery) undertakes the City’s environmental sanitation activities, with funding of its capital investments and O&M costs coming from the City Government’s annual budget. Similar to PDU, the DKPP prepares an annual program and the annual budget ceiling is consolidated into the City Government’s annual budget. The DKPP’s annual budget is not linked or limited to the revenues it expects to generate; as one of the agencies of the City, its budget allocation depends on the City Government’s environmental sanitation priorities and projects.
Historical Income and Expenditures
Aside from fund transfers from the Central Government, major sources of the City Government’s local source revenues (PAD) during the period 2008-2012 were local taxes and service incomes. With the enactment of Law No. 28/2009, effective 1 January 2011, taxes on transfers of ownership of land and building (BPHTB) are now administered by the City Government as local source revenue (i.e. no longer shared revenues (Dana Bagi Hasil)). Taxes on land and buildings (PBB) will be treated as local source revenues effective 31 December 2013 at the latest. Historical data on the city’s financial performance is presented in Table IV-F 7.
Projected Income and Expenditures Individual revenue and expenditure items have been projected using historical trends and best estimates of local officials. When the City Government takes full control of the land and building tax administration (i.e. from both PBB and BPHTB), the City Government’s revenues are expected to increase significantly. The surplus projected in the short term is assumed to be available for some of the investments required for improved urban sanitation services. Surplus income can be used by the City Government to finance the PSO that the City Government will be required to provide to the SDO responsible for sanitation (including O&M and periodic major capital expenditures). Table IV-F 8 presents income projections before MSMIP. From this, the requirements of MSMIP in terms of equity for the investment amounting to $10.99 million were included. The evaluation shows that the City Government will have sufficient funds to cover the equity and initial O&M requirements of the subproject.

TA 7993 - INO: Metropolitan Sanitation Management Investment Project – MSMIP Final Report 89
Table IV-F 7
HISTORICAL MUNICIPAL FINANCE - JAMBI
FISCAL YEARS 2009 - 2012
(In Million Rupiah)
Items Budget Average
2009 2010 2011 2012 09 - 10 10 - 11 11 - 12
REVENUE 608,555 692,169 869,967 883,399
Local Revenue 55,671 70,842 99,000 91,180 1.27 1.40 0.92
Local tax 28,842 35,539 59,570 55,382 1.23 1.68 0.93 1.28
Retribution 18,309 20,366 22,224 24,041 1.11 1.09 1.08 1.10
Income of Local Equity 2,786 2,862 5,472 5,472 1.03 1.91 1.00 1.31
Others 5,735 12,075 11,734 6,285 2.11 0.97 0.54 1.20
Transfer from Central Government) 501,409 535,587 603,816 687,181
Tax revenue 61,796 66,339 63,986 54,792 1.07 0.96 0.86 0.96
Non tax revenue tax/natural resources 32,412 57,823 63,608 48,801 1.78 1.10 0.77 1.22
General allocation fund 370,765 379,189 441,549 543,578 1.02 1.16 1.23 1.14
Special allocation fund 36,436 32,236 34,673 40,010 0.88 1.08 1.15 1.04
Transfer from Province /Other 51,475 85,740 167,151 105,038 1.67 1.95 0.63 1.41
Grant 5,186 1,800 0.35
Tax revenue from province 40,294 36,821 43,930 36,562 0.91 1.19 0.83 0.98
Autonomy fund 11,181 48,919 118,035 66,676 4.38 2.41 0.56 2.45
Municipal Saving (from surplus of previous year)
EXPENDITURE 612,700 673,011 856,744 902,006
Operating Expenses 497,712 584,120 705,882 755,977 1.17 1.21 1.07 1.15
Employees 366,168 454,817 527,533 564,169 1.24 1.16 1.07 1.16
Grant 21,763 10,663 15,202 8,896 0.49 1.43 0.59 0.83
Goods and services 101,455 110,112 153,007 177,346 1.09 1.39 1.16 1.21
Financial Assistance 1,924 1,856 1,877 836 0.96 1.01 0.45 0.81
Social Assitance 2,979 4,468 4,681 1.50 1.05 - 0.85
Interest Expense 353 0
Subsidy 924
Transfers to the Kabupaten/City villlage 1,750 1,720 2,020 2,020 0.98 1.17 1.00 1.05
Contingencies 396 484 1,562 2,710 1.22 3.23 1.74 2.06
Capital Expenses 114,988 88,891 150,862 146,029 0.77 1.70 0.97 1.15
Surplus/(Deficit ) Before MSMIP (Rp mil) (4,144) 19,158 13,223 (18,606)
Actual Growth Rate

TA 7993 - INO: Metropolitan Sanitation Management Investment Project – MSMIP Final Report 90
Table IV-F 8
MUNICIPAL FINANCE PROJECTION - JAMBI
FISCAL YEARS 2013 - 2025
(In Million Rupiah)
Items
2013 2014 2015 2016 2017 2018 2019 2020 2025
REVENUE 1,044,128 1,232,015 1,416,830 1,635,178 1,894,329 2,083,762 2,292,138 2,521,352 4,060,663
Local Revenue 113,097 140,983 176,555 222,036 280,304 308,335 339,168 373,085 600,857
Local tax 71,997 93,596 121,675 158,177 205,631 226,194 248,813 273,694 440,787
Retribution 26,445 29,089 31,998 35,198 38,718 42,589 46,848 51,533 82,995
Income of Local Equity 7,113 9,247 12,021 15,628 20,316 22,348 24,583 27,041 43,550
Others 7,542 9,051 10,861 13,033 15,640 17,204 18,924 20,816 33,525
Transfer from Central Government) 795,960 910,535 1,043,744 1,199,074 1,380,773 1,518,850 1,670,735 1,837,808 2,959,809
Tax revenue 71,230 78,353 86,188 94,807 104,287 114,716 126,188 138,806 223,549
Non tax revenue tax/natural resources 63,441 82,473 107,215 139,379 181,193 199,313 219,244 241,168 388,404
General allocation fund 619,679 706,434 805,335 918,082 1,046,614 1,151,275 1,266,402 1,393,043 2,243,509
Special allocation fund 41,611 43,275 45,006 46,806 48,678 53,546 58,901 64,791 104,347
Transfer from Province /Other 135,071 180,497 196,531 214,068 233,252 256,578 282,235 310,459 499,997
Grant -
Tax revenue from province 38,390 40,310 42,325 44,441 46,663 51,330 56,463 62,109 100,027
Autonomy fund 96,681 140,187 154,206 169,626 186,589 205,248 225,773 248,350 399,970
Municipal Saving (from surplus of previous year)
EXPENDITURE 1,037,306 1,192,902 1,371,838 1,577,613 1,814,255 1,995,681 2,195,249 2,414,774 3,889,018
Operating Expenses 869,373 999,779 1,149,746 1,322,208 1,520,539 1,672,593 1,839,852 2,023,837 3,259,410
Capital Expenses 167,933 193,123 222,092 255,406 293,717 323,088 355,397 390,937 629,607
Surplus/(Deficit ) Before MSMIP (Rp mil) 6,822 39,113 44,992 57,565 80,074 88,081 96,889 106,578 171,645
Surplus/(Deficit ) Before MSMIP ($ mil) 0.71 4.07 4.69 6.00 8.34 9.18 10.09 11.10 17.88
Required subsidy for MSMIP 0.58 0.01 1.31 2.97 3.04 3.13 0.00 0.00 0.00
Surplus/(Deficit ) After MSMIP ($ mil) 0.13 4.07 3.38 3.03 5.30 6.04 10.09 11.10 17.88
Projection

TA 7993 - INO: Metropolitan Sanitation Management Investment Project – MSMIP Final Report 91
G. Economic Analysis
1. Scope of analysis Economic analysis was undertaken for the proposed investments in off-site sewerage system in Jambi City. The proposed investments include: (i) piped network of trunk sewers, main sewers, laterals and interceptors, including property connections, for collecting wastewater from sources within the city center23, and (ii) a 15 MLD central wastewater treatment plant in Kecamatan Pasar Jambi. The economic analysis includes an evaluation of the economic feasibility of the proposed subproject and the impact of changes in key variables on the economic feasibility of the investments. The analysis also includes an analysis of the distribution of economic benefits to stakeholders, including the poor.
2. Economic costs and benefits
Economic costs and benefits are expressed in constant October 2012 prices using domestic price numeraire. Costs include capital investments for the piped sewerage network, treatment plant, land, resettlement and O&M costs. The economic benefits considered in the analysis consist, among others, of (i) savings in health care costs for major sanitation-related diseases in the city such as diarrhea/gastroenteritis, dengue and skin diseases resulting from reduced morbidity incidence due to improved wastewater management, (ii) avoided loss of income or productivity savings, (iii) avoided costs of desludging/constructing septic tanks, and (iv) averted costs of accessing polluted water for drinking and other domestic uses. The economic analysis was performed over a period of 25 years, including 5 years of investment implementation. Civil works construction was assumed to commence in 2014, with benefits starting to accrue in 2016.
Financial investments at constant prices amount to approximately Rp437.4 billion, of which 26% is for the treatment plant, 69% for the sewer network, and the remaining costs for land and related investments. The total economic costs of the proposed subproject were estimated at around Rp358.2 billion.
3. Valuation of economic benefits
The economic benefits of the proposed sewerage system which were considered in the analysis and the bases for their valuation are as follows (see Annex B – Financial and Economic Analysis):
a. Health benefits. Providing wastewater collection and treatment facilities is expected to reduce the incidence of sanitation-related diseases which leads to reduced costs of medical treatment and related health care services. The analysis considered diarrhea/gastroenteritis, dengue and skin diseases which are among the major causes of morbidity in the city. Valuation of health benefits was based on the incidence rate of the diseases, average cost of treatment, the proportion of cases seeking medical treatment in existing medical care facilities, and the average duration of illness. In Jambi City, the average hospital treatment cost for diarrhea was assumed at Rp235,000/patient/day24 while for non-severe cases, cost is about Rp80,000/day. For dengue and skin diseases, the respective costs are Rp205,000 and Rp185,000/day. Reduction in the incidence of the
23 Subproject coverage area includes two of eight kecamatans i.e., Pasar Jambi and Jambi Timur.
24 Cost data for Palembang which was assumed for Jambi in the absence of such data in the latter city.

TA 7993 - INO: Metropolitan Sanitation Management Investment Project – MSMIP Final Report 92
disease was assumed at 35%25. The present value of health care cost savings within the subproject area over the 25-year period was estimated at Rp110.5 billion.
b. Avoided loss of income/productivity savings. People afflicted with the above
diseases are kept out of work and other daily activities which results in loss of income or productivity. The economic impact of illness becomes critical especially when the patient is the sole or major income earner in the family. Reduced morbidity reduces income/productivity losses. The value of this benefit was computed based on the proportion of patients who are economically active and compensation that the person receives for being on the job or is actively engaged in income generation. Compensation was based on the minimum wage in the city. For in-patients, total loss of income also includes the foregone income of household member(s) who provides care while the patient is confined in hospital/clinic. It was assumed in the analysis that one household member assumes this role. Valuation of the additional foregone income also takes into account the number of days that a patient is sick, employment rate and average income of the person involved. The PV of this benefit in Jambi City is about Rp29.1 billion.
c. Avoided costs of desludging/constructing septic tanks. This benefit is
generated because once a property is connected to the sewerage network it foregoes the need for regular desludging of the septic tank. The current cost of desludging septic tanks in Jambi City is Rp280,000 per service. Desludging frequency was assumed at once every three years.26 For properties with no septic tanks but are connected to the sewerage system, the amount saved for not constructing a septic tank is an added benefit of the connecting to the network. Septic tank costs about Rp3.5 million. The present value of this benefit was computed at Rp32.7 billion.
d. Averted costs of accessing polluted water for drinking/domestic use.
Unabated pollution of water sources because of uncontrolled and improper disposal of wastewater, including human excreta, correspondingly increases the cost of water especially for drinking and other domestic uses. Pollution leads to avertive behavior on the part of water users either through the use of more costly technologies to improve water quality, increased treatment or resort to alternative supplies (e.g., bottled water) which generally costs higher. This benefit was valued by estimating the total cost of water for both PDAM and non-PDAM users based on consumption rate, price of piped and non-piped water and attribution rate of pollution to total cost of water. In Jambi, domestic sources of pollution such as households, commercial and institutional establishments have been assessed to contribute 39% to overall water pollution, with industry contributing 49% and agriculture, 11%27. In the case of Jambi City, however, a higher attribution rate from domestic sources was assumed in the analysis considering that no significant industrial and agricultural sources of pollution exist in the subproject area, only 69% of households have septic tanks and open defecation
25 Based on WHO data which estimated morbidity reduction rate for diarrhea of 22.7%-37.5% due to improved
excreta disposal. A survey and review of literature conducted by Esrey, et. al. also showed a 36% reduction in diarrhea incidence because of improved water supply and sanitation (Esrey, S.A, Potash, J.B. Roberts, and Shiff, C. Health Benefits for Improvements in Water Supply and Sanitation–Survey and Analysis of Literature on Selected Diseases, WASH Technical Report No. 66. 26
Based on SNI 03-2001: Tata Cara Perencanaan Tangki Septik Dengan Resapan, 2001. 27
World Bank Water and Sanitation Program, Economic Impacts of Sanitation in Indonesia, August 2008.

TA 7993 - INO: Metropolitan Sanitation Management Investment Project – MSMIP Final Report 93
is practiced by about 27% of the population. On the basis of these assumptions, the PV of total averted costs was estimated at Rp163.9 billion.
4. Un-quantified benefits
There are other economic benefits to be derived from improved wastewater management system which were not included in the analysis because of lack of data and consequently, the difficulty of valuing their respective economic impact. These un-quantified benefits include the following:
a. Health care cost savings from reduced incidence of other sanitation-related
diseases; b. Value of sludge derived from the wastewater treatment process for use in
agriculture either as soil conditioner or fertilizer; c. Increased agricultural productivity and value of fish catch due to reduced
water pollution; d. Increased value of land previously made unusable or rendered marginally
productive because of pollution; and e. Impact of improved wastewater management and reduced pollution on local
tourism and economy. 5. Results of the economic analysis
Under the “base case” scenario, the economic internal rate of return (EIRR) of the proposed investments exceeds the assumed 12% economic opportunity cost of capital (EOCC), hence, the subproject is deemed economically feasible (Table IV-G 1). The present value of total net economic benefits (ENPV) amounts to Rp16.9 billion.
Table IV-G 1: Results of Economic Analysis (Base Case)
Subproject EIRR (%)
ENPV (Rp billion)
Jambi sewerage system 13.1 16.9
EIRR = economic internal rate of return, ENPV = economic net present value
6. Sensitivity analysis Sensitivity tests assuming (i) a 10%-increase in capital investments, (ii) a 10%-increase in O&M costs, (iii) a 10%-reduction in total economic benefits, and (iv) one-year delay in benefits result in EIRRs that are above or slightly below the assumed 12% threshold. Under a condition where capital investments and O&M costs both increase by 10% while total benefits are reduced by the same rate results in an EIRR of 9.9% (Table IV-G 2).

TA 7993 - INO: Metropolitan Sanitation Management Investment Project – MSMIP Final Report 94
Table IV-G 2: Results of Sensitivity Analysis
Case
Change from Base Case (%)
EIRR (%)
ENPV (Rp billion)
Switching Value (%)
Capital investment O&M costs Total benefits 1-yr delay in benefits Combination (Cases 1, 2, 3)
+10 +10 -10
11.6 13.0 11.4 11.2 9.9
-7.2 15.6 -9.9
-14.1
-35.3
+7
+131 -6 -
-
EIRR = economic internal rate of return, ENPV = economic net present value, O&M = operation and maintenance.
The sensitivity tests also indicate that the investments are almost equally sensitive to both reductions in total benefits and increases in capital investments. Changes in O&M costs have very little impact on the EIRR of the investments.
7. Distribution of benefits
The sewerage system investments will directly benefit a total of about 69,030 people (17,700 households) and 2,571 commercial establishments within the subproject coverage area.
Households and commercial establishments are therefore the principal direct beneficiaries of the subproject. In addition to the afore-mentioned beneficiaries is Jambi City government itself, through its service delivery organization (SDO). Of the estimated present value of total economic benefits of Rp347.5 billion, about 84% will directly accrue to households. Commercial establishments will gain 13% of the benefits in terms of averted costs of accessing clean water and cost savings on septic tank maintenance. About 3% of the benefits will go to SDO in the form of service payments from those that are connected to the system and avail of the wastewater treatment service.
The poverty impact ratio (PIR) of the investments is 11%, which means that about one-tenth of the subproject benefits will accrue to the poor.
H. Gender Analysis and Gender Action Plan
1. Background and Objective A gender-responsive project such as the MSMIP is one that involves an understanding of issues and problems from the perspectives of both men and women in the development process. Mainstreaming gender entails the integration of a gender perspective in the project design. Thus, a Gender Analysis is undertaken for ADB projects to identify project design elements that will enable women to participate in and benefit from the Project. It is identified factors that have the potential to exclude women from participating in or benefiting from the Project. Data for this analysis are obtained from available material from socio-economic surveys that were prepared during the preparation of a Master Plan for Wastewater Management. Under the PPTA, gender analysis made use of qualitative methods in addition to reviewing documents from Jambi City. Gender analysis looked into gender issues and differences in the roles and responsibilities of women and men, their participation in social and economic life and the differential impacts on their lives of sanitation programs and services. Women and their organizations were a key part of the PPTA consultation process.

TA 7993 - INO: Metropolitan Sanitation Management Investment Project – MSMIP Final Report 95
Moreover, gender and social development concerns were also discussed at the Institutional Planning workshop to formulate Jambi’s Local Institutional Development Action Plan on November 28, 2012 to confirm proposed design measures. 2. Gender Characteristics In Jambi for the year 2012, a survey commissioned for the PPTA reveals that Jambi ruhmatangga or households with women as heads of household represent 4.6% of surveyed households. The survey shows that, graduates of senior high school and college is 41% for men and 21.4% for women. Women tended to lag in relation to higher education where more men earned a college diploma (16%) compared to 10% for women; 70% of those who were unable to attend primary education were women. Consultations indicate that female-headed households tended to have lower incomes than men-headed households; 71% of female-headed households had incomes below the poverty line of Rp 1,563,000 per month. This is compared to 48% for men-headed households. In terms of employment profile, of the 27% who indicated that they were entrepreneurs/self-employed, 19% were women. And of 15% who were unemployed, 79% were women; 8% were laborers and of this 3% were women; 0.2% who happened to be women were involved in cottage industry.28
3. Decision Making and Gender Roles Household matters are decided by both spouses. However, women have more responsibility in decision making on domestic concerns such as care of the house, water and sanitation. Men dominate decisions concerning renovating the house and building toilet. The FGD with women pointed out that there are perceptions that the husband is the provider and has the responsibility to make the major decisions for the family. They also point out that it may be a challenge to encourage women to participate and become involved in the infrastructure component of sewerage development because of the community perception that women’s activities should remain in the domestic area only.
4. Sanitation Hot Spots
The area around the proposed site for the WWTP at Rajawali village, Kangkung farm, Jambi, is swampy. Laborers and informal settlers reside in rental properties. There are inadequate sanitation facilities. Waste water is disposed directly into canals and into open space. (Overall, open defecation is also significant in Jambi which survey indicates was at 12% in rivers and 15% on land.) There is interest in the project and willingness to connect if service would be available. Workers do not have steady employment but affordability measures to address delayed monthly payments of workers who are laid off were considered to be a help. The WWTP site is outside the sewerage service area. 5. Willingness to Connect and Affordability
From the Socio-Economic Survey, most respondents are willing to connect at 85.2%. Of respondents who are willing to connect, women showed less willingness than men at 35% and 52.2%, respectively. For monthly payment rates, most respondents (73%) are willing to pay Rp 5000 or less. Less respondents (22.5%) are willing to pay Rp 10.000 and more. Of
28 Additional/comparative data are included in the Poverty and Social Analysis, Annex D of the MSMIP Final Report.

TA 7993 - INO: Metropolitan Sanitation Management Investment Project – MSMIP Final Report 96
the respondents who are willing to pay, the percentage of women is less (26.4%) than men for (43.7%). Jambi city will duplicate PDAM (clean water) house connection system by doing connection free of charge for the poor. Tariff/monthly fee depends on income class. The tariff will be regulated in Regional Regulation (Peraturan Daerah) in 2014 regarding tariff for waste water. Consultation among women revealed that they want to connect, but only if this is inexpensive. They are willing to pay for connection up to Rp 500.000,- or less. If they have to pay Rp 1.000.000,- or more, they say that most of the community could no longer cannot afford it. As a PDAM system, they think that the community will only buy the rest of pipe which will connect to their house. This is considered very helpful, especially for communties with low income. 6. Willingness to Contribute for Sanitation Improvement Activities About 58% respondents will contribute or participate in the project, with higher percentage for men (60.1%) compared with wome (39.7%). They will contribute among others, labor force (17.8%), sewerage cost of pipe installation to be paid in 12-36 months (21.0%) . Willingness to contribute was slightly less for women than for men.
From consultation with women local leaders, women expressed a willingness to participate in socialization of the project. According to members of Pokja, women were less willing to participate in infrastructure project because they may have thought it would interfere with domestic work to be so active in sanitation as well. The feedback is that women prefer to participate in ‘women” activities such as PKK, pengajian, and PNPM. However, women would be willing to be involved in the project as support and in monitoring; they say they need more information about the project and need to be treated as active participants whose opinions and knowledge matters for the improvement of sanitation and health in the community. 7. Local Organizations and Gender Mainstreaming Women see a benefit in their participation in the project and that of their organizations. Women organizations manage community sanitation facilities. However, from the SES, about 55% respondents were members of local organizations; the involvement of men is still higher than women at 37.5% and 17.6% respectively.
There are some local community organizations, such as PKK, PNPM committee, RT heads which have women members (PNPM and PKK), while RT heads are balanced between women and men. There are no specific programs for gender. At the kelurahan level, there is the Community Empowerment Organization (LPM/Lembaga Pemberdayaan Masyarakat) with women members: PKK, cadres, RT heads. There is also a neighborhood Forum at the kelurahan level. There is an NGO in Jambi City (LSM Brantas) that is concerned with environmental and sanitation issues; it conducts activities in the form of socializing people, promoting hygiene, giving technical assistance in designing and building septic tanks and communal septage facilities and empowering youth manpower. Women leaders at IPAL area and along sewerage pipeline requested representation in monitoring committee for resettlement and in construction of WWTP.

TA 7993 - INO: Metropolitan Sanitation Management Investment Project – MSMIP Final Report 97
8. Perceived Benefits and Concerns Women may benefit from the project by being mainstreamed into decisions about waste water services through participation in community groups, local organizations, and in project management structures. Through their participation in the sanitation improvement project, women will have a more balanced representation in operations and monitoring. This would give them confidence in themselves to be trusted with the added responsibility that the sanitation improvement project will bring. From the consultation, the feedback is that people who live alongside the river are vulnerable because they use the river for many activities, such as bathing, washing, cooking, even defecating, even while such practices are no longer considered healthy or safe, not only for women but especially for children and the entire family. The project according to them will make drainage and the river cleaner. For people who have septic tank, the benefit for their household is cost saving because it eliminates the need to remove sludge from the septic tank. While this is so, a constraint is that some of the critical areas are not within the sewerage area. Sanitation hot spots are important to reach for improvement. This includes the WWTP site which is on swamp lands which are not within the sewerage coverage area. Here, expected concerns are lack of affordability and unsteady income of workers living here, many of whom are renters. 9. Institutional Gender Analysis A gender assessment was undertaken for PU and partner agencies in the Sanitation Pokja. Moreover, gender and pro-poor measures were also discussed at a workshop on the Local Institutional Development Action Plan in November 2012. Central Government Budget for Income and Expenditure (APBN) and Local Government Budget for Income and Expenditure (APBD) are available to fund gender mainstreaming. For Sanitation Pokja members, gender focus is provided by the Social Institution (Dinas Sosial) and the Female Empowerment and Family Planning Board (BPPKB Badan Keluarga Berencana dan Pemberdayaan Perempuan). At the BAPPEDA, there are 50% (30) male and 50% (30) female staff; DKP has 85% (85) males and 15% (15) females; Females in management positions are estimated at 30%. There is no gender focal person or programs but there is a claim of no gender differentiation in terms of employment opportunities; criteria for hiring and promotion are based on merit. Feedback was obtained from PU, the executing agency, on possible pro-poor measures for the project. It is the idea that house connection would not be free of charge though there was agreement that subsidies should be given for connection and monthly fees. This will depend on income class. Proposed tariffs will be studied and regulated under the Regional Regulation (Peraturan Daerah) for 2013. Now the draft (clausal) regulation for Waste Water Management prepared subject to discussion by the Local Legislative Body (DPRD). Setting of minimum charges on Waste Water Expenditure/Fees will be set as a Major Regulation (Peraturan Walikota).
10. Gender Analysis and Strategy Lack of awareness by men and especially women and satisfaction on existing sanitation services is seen as a constraint to achieving high rates of sewerage connection. Increased hygiene and sanitation information is perceived as a help which is consistent with the designation of hygiene and sanitation awareness as a component of the project. Joint sanitation awareness planning puts a focus on collective decision-making strategies and
TA 7993 - INO: Metropolitan Sanitation Management Investment Project – MSMIP Final Report 98
mobilizing authorities and stakeholders for sustained behavior change on hygiene and sanitation. It is designed to influence social acceptance for sewerage connection and behavior change on sanitation not only within the project site but the entire city as well. Affordability is perceived as a bar to participation if this means a high connection cost or monthly bill. There is consensus among community members and implementing agencies on the importance of pro-poor measures for those who are identified to need assistance which can be based on existing government subsidy programs for the poor with IEC in sanitation hot spots. The strategy is for free domestic connection and targeted subsidy for monthly fees for vulnerable groups including the poor, elderly and female-headed households. Further discussion among stakeholders is strategic to consider willingness to contribute to part of cost of connection consistent with recommendations to charge an affordable connection rate. There are sanitation hot spots along waterways and floating villages. Around the WWTP site there is need for sanitation improvement but where there are workers with unsteady income. Universal connection and subsidies help low income households. Proposed interventions for onsite sanitation improvement as well as livelihood development assistance promotes social inclusion for the WWTP sites which are outside of coverage area for sewerage improvement. Technical constraints such as lack of PDAM/steady supply of water, satisfaction with onsite connection, tight space, connection to onsite systems and the like will need active consideration by village authorities and residents and designers during the sanitation audit and design and construction phases. Strategies to reach absentee homeowners will also need to be discussed at connection phase since significant numbers are renters. A pro-poor measure is included to address sanitation and income lack in WWTP sites. Installing onsite sanitation or establishing livelihood development needs to be assessed for viability of livelihood options. Thus, problem solving on connection and implementation issues shall be facilitated through participatory processes and collective decision making as proposed in Implementation Arrangement Plans for Gender and Social Development, Stakeholder Communication Strategy and Community Participation Plan. Women, community organizations and institutional partners in Jambi City agree that gender analysis and women participation in sanitation promotion can ensure maximum participation by women. A Gender Action Plan and gender inclusive capacity building and joint sanitation advocacy planning promotes active roles of stakeholders where the needs of both women and men are addressed and women’s organizations are enlisted for sanitation advocacy and implementation and monitoring of WWTP operations and impacts for better social, environmental and economic outcomes. Benefit enhancement measures such as quotas for female recruitment (5 – 10% more by 2018) and female promotion (at least 10% by 2018) and training (50%) and decision making promote women empowerment at staff and community levels. Potential social risks are also managed such as the influx of migrant workers exacerbating sanitation and social and health concerns such as waterborne diseases through poor sanitation and sexually transmitted diseases due to workers camps. Pro-poor and inclusive measures are quotas for local workers (at least 35%) with preferential hiring from low income communities with requirements for sanitation standards at workers camps. HIV/AIDS education will also be implemented by contractor and under the GAP. 11. Gender Action Plan The Gender Action Plan below (under category of Effective Gender Mainstreaming) summarizes how the Project will benefit both men and women and how different

TA 7993 - INO: Metropolitan Sanitation Management Investment Project – MSMIP Final Report 99
components of the Project will address gender disparities and enhancement opportunities in plan implementation. Targets may be revisited during project implementation.
Table IV-H 1: Gender Action Plan, Jambi
Strategies Project Outputs and GAP Targets Output 1: Completed Infrastructure Development of Off-Site Waste Water Systems
Promote Women and Community involvement in construction, operation and decision making
• At least 40% of participants in public consultation and sewerage connection campaign activities are women and vulnerable groups such as female headed households) who get full information about subsidized connection fees and criteria for subsidized monthly tariffs
• At least 40% women participants in consultations on resettlement/land acquisition • Future sanitation tariff increases take into consideration gender and affordability
through 50% women participation in public hearings for tariff hikes • Information bulletin on risks of HIV/AIDS relayed through appropriate media with
civil works contractors providing information/preparing code of conduct for workers • Consultation with men and women, especially mothers, during the design
finalization of WWTP schemes to ensure that children's safety is considered during construction.
• Contractor provides safe working conditions, a work environment free of harassment with adequate water and sanitation facilities in work camps with separate sanitation facilities for women.
Promote inclusive access to sanitation services
• Universal connection through free or subsidized domestic connection • At least 10% of connected households being from poor and female-headed or
vulnerable people (e.g. old, sick, disabled) through subsidized monthly fees • Onsite sanitation managed by CBOs established in non-sewered hot spots near the
Waste Water Treatment Plant sites connecting at least 90% of households disposing waste water into waterways with at least 50% of households being from poor, female-headed household or vulnerable groups (if population will otherwise not have access to sanitation infrastructure) implemented in coordination with eligible NGO.
Increase Livelihoods and Employment
• Civil works construction shall employ at least 35% local labor from urban poor women and their families where there is equal pay for men and women for work of equal type Sanitation/ development fund of at least $55,00029 shall be set aside and additional sources raised as needed for low income areas around the Wastewater Treatment Plant sanitation hotspots for onsite sanitation improvement (if population will otherwise not have access to sanitation infrastructure) at Rajawali village, Kangkung farm, Jambi
• Livelihood seed fund of $8,000 (included in Sanitation/livelihood Development Fund) supports viable livelihood for at least 50 female-headed households and women and their organization near the WWTP with additional resources to be accessed from external sources for other sanitation hot spots
29 This amount is inclusive of onsite sanitation budget of $42,000 with $8,000 Livelihood Development Seed Fund and $5,000 for capacity building on sanitation system O and M and livelihood development. This will be allocated upon completion of needs assessment. This represents funds that can be augmented by other agencies for both livelihood development and sanitation improvement. For instance, the area may be scheduled for installation of onsite sanitation system under the City WW Improvement Master Plan.

TA 7993 - INO: Metropolitan Sanitation Management Investment Project – MSMIP Final Report 100
Output 2: Completed capacity building for strengthened sanitation strategy and institutional capacity
Equity in staffing Training and Capacity Building and Institutional Set up
• PMU/SDO with additional 15% female staff with 10% increase of females in management positions by 2018
• PMU, IA and the Service Delivery Organization to be established shall strive for gender equity; where female staff is 40% or under, at least 10% female staff and 10% females in management positions shall be added by 2018 based on project baseline to be established. (The target is at least 20% for DKP based on existing rate of 15% female staff; at least 10% females shall be added to existing 30% in management position.)
• Specific gender and sanitation training modules and technical/management capacity development training are open to managers and staff at all levels (i.e. national, districts) to promote professional advancement of female staff where at least 50% of participants are women for in training on gender, community facilitation, utility management, technical and project/sector management-related skills
• At least 50% are women who participate in capacity building on hygiene and sanitation education, promotion, planning and participatory monitoring – e.g. WWTP impacts, etc.
• At least 40% of women in key decision-making and working groups such as Resettlement Committees, monitoring committees, Community supervision mechanism for Joint Sanitation Plan implementation, O and M structure and for onsite sanitation systems
• Gendered indicators in PPMS and GAP in quarterly reporting • A full-time Social/Gender specialist to be hired in PMU
Output 3: Improved communication and public information on hygiene and sanitation Improved mechanism for public feedback and hygiene and sanitation promotion
• Women and community organizations such as PKK are partners in IEC and Joint Sanitation planning and delivery where at least 50% are women.
• 50%-50% male and female for community facilitators for awareness raising where male facilitators target male population to share responsibility for complaint reporting/management and sanitation promotion
• Joint sanitation marketing and sustainability planning and implementation with at least 50% female attendance in consultations and membership in implementation mechanisms
I. Poverty and Social Analysis The Asian Development Bank supports equitable and sustainable social development outcomes by giving attention to the social dimensions of its operations. A Social and Poverty Analysis is mandatory for all ADB projects to examine social development issues and a project’s potential effects, especially on poor people. Social analysis and poverty analysis are critical tools in ADB’s efforts to reduce poverty since these address the processes and structures that exclude some groups from participating in and benefiting from economic development. Thus, ADB adopted social development policies and strategies covering such issues as gender development and, social protection, and cooperation with nongovernment organizations (NGOs); social safeguard policies on involuntary resettlement and indigenous peoples as reflected in the ADB’s Operations Manual. 1. Key Findings of Socio-economic Survey (SES) and Stakeholder Consultations In preparing the Poverty and Social Analysis, surveys were conducted in earlier phases of project preparation. The following is based on preliminary results from a 2012 socio-

TA 7993 - INO: Metropolitan Sanitation Management Investment Project – MSMIP Final Report 101
economic survey for Jambi that was conducted under the PPTA through Yayasan Persada Mandiri, one of the survey providers for Jambi City. Survey data was augmented with information gathered from communities, women and vulnerable groups, as well as with village officials and concerned agencies during project preparation. In addition, a limited survey of target households and business establishments was also undertaken in November 2012. Updated health and official data were also obtained from the city. Critical outputs were presented to key partners for a consensus on the findings and needed interventions. This includes questions served at a workshop conducted on November 28 in Jambi. a. Population Characteristics The census population of Jambi is 607,514 individuals, with a population density of 5,394 people per square kilometer, that is much greater than the national average (73/sq km.) for Indonesia or than the provincial average of 61/sq. km. There are no significant numbers of indigenous people in the project area. Of the 375 respondents who represented their households, 93.1% were male-headed; 4,5% were headed by women. All respondents were functionally literate but of different levels of education; 48.2% completed senior high school; less had college education (diploma and bachelor) at 13,6%. The average household income was Rp. 1,563,000 with the minimum wage set at Rp 1,024,000 in 2010. Average household (HH) income was higher than the poverty threshold of Rp 1,035,532 for the city. The average for male income was Rp.1.561.190 and the average female income was slightly lower at Rp.1.514.931. With poverty incidence as high as 10%, and with unemployment as high as 14.9%, affordability could be a factor in the acceptance of improved sanitation services.
Table IV-I 1: Employment of Respondents, Jambi
Job Male % for both
sexes
Female % for both sexes
Total Percentage
Farmer/fisherman 3 100 0 0 3 0.8% PNS/TNI/POLRI 83 80.6 20 19.4 103 27.5%
Entrepreneur 22 81.5 5 18.5 27 7% Private employee 30 83.3 6 16.7 36 9.6%
Vendor 11 91.7 1 8.3 12 3.2% Laborer/freelance
worker 31 96.9 1 3.1 32 8.5%
Cottage industry 0 0 1 100 1 0.2% Pensioner 11 73.3 4 26.7 15 4
Not working/unemploy
ed
12 21.4 44 78.6 56 14.9%
Others 22 25.6 64 74.4 86 22.9% No answer 1 3.1 3 96.9 4 1%
225 149 375 100% PPTA Socioeconomic Survey, YPM Jambi The respondents who lived in houses made of strong material was at 23,3%, light material at 10,6%, mixed but predominantly strong materials at 37,8%, while 27.4% lived in houses made of mixed but predominantly light materials. About 65.1% of the respondents declared themselves as owners of the houses they lived in and renters were about 25,2%; the rest
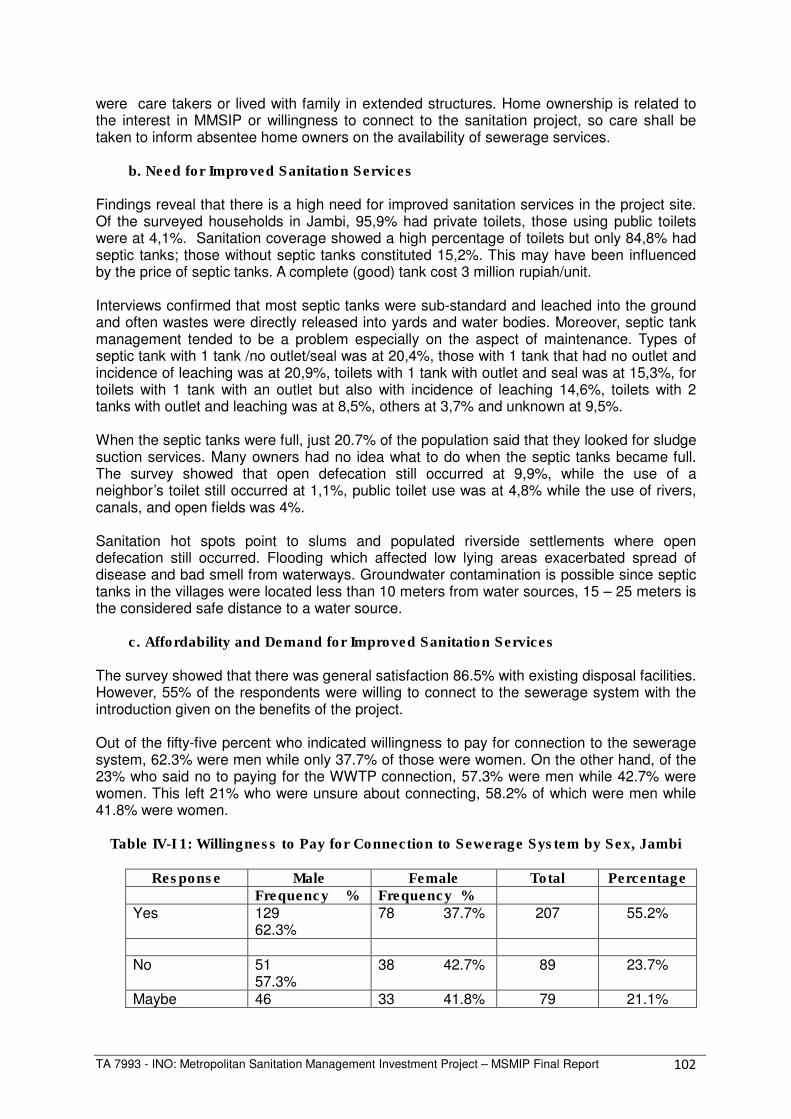
TA 7993 - INO: Metropolitan Sanitation Management Investment Project – MSMIP Final Report 102
were care takers or lived with family in extended structures. Home ownership is related to the interest in MMSIP or willingness to connect to the sanitation project, so care shall be taken to inform absentee home owners on the availability of sewerage services. b. Need for Improved Sanitation Services
Findings reveal that there is a high need for improved sanitation services in the project site. Of the surveyed households in Jambi, 95,9% had private toilets, those using public toilets were at 4,1%. Sanitation coverage showed a high percentage of toilets but only 84,8% had septic tanks; those without septic tanks constituted 15,2%. This may have been influenced by the price of septic tanks. A complete (good) tank cost 3 million rupiah/unit. Interviews confirmed that most septic tanks were sub-standard and leached into the ground and often wastes were directly released into yards and water bodies. Moreover, septic tank management tended to be a problem especially on the aspect of maintenance. Types of septic tank with 1 tank /no outlet/seal was at 20,4%, those with 1 tank that had no outlet and incidence of leaching was at 20,9%, toilets with 1 tank with outlet and seal was at 15,3%, for toilets with 1 tank with an outlet but also with incidence of leaching 14,6%, toilets with 2 tanks with outlet and leaching was at 8,5%, others at 3,7% and unknown at 9,5%. When the septic tanks were full, just 20.7% of the population said that they looked for sludge suction services. Many owners had no idea what to do when the septic tanks became full. The survey showed that open defecation still occurred at 9,9%, while the use of a neighbor’s toilet still occurred at 1,1%, public toilet use was at 4,8% while the use of rivers, canals, and open fields was 4%. Sanitation hot spots point to slums and populated riverside settlements where open defecation still occurred. Flooding which affected low lying areas exacerbated spread of disease and bad smell from waterways. Groundwater contamination is possible since septic tanks in the villages were located less than 10 meters from water sources, 15 – 25 meters is the considered safe distance to a water source. c. Affordability and Demand for Improved Sanitation Services The survey showed that there was general satisfaction 86.5% with existing disposal facilities. However, 55% of the respondents were willing to connect to the sewerage system with the introduction given on the benefits of the project. Out of the fifty-five percent who indicated willingness to pay for connection to the sewerage system, 62.3% were men while only 37.7% of those were women. On the other hand, of the 23% who said no to paying for the WWTP connection, 57.3% were men while 42.7% were women. This left 21% who were unsure about connecting, 58.2% of which were men while 41.8% were women.
Table IV-I 1: Willingness to Pay for Connection to Sewerage System by Sex, Jambi
Response Male Female Total Percentage Frequency % Frequency %
Yes 129 62.3%
78 37.7% 207 55.2%
No 51
57.3% 38 42.7% 89 23.7%
Maybe 46 33 41.8% 79 21.1%

TA 7993 - INO: Metropolitan Sanitation Management Investment Project – MSMIP Final Report 103
58.2% Total 226
60.3% 149 39.7% 375 100%
PPTA Survey During the FGDs conducted by the PPTA, meetings among women in lower income neighborhoods showed more willingness to connect to a free sanitation service. They also conceded willingness to connect with a fee if made affordable with extended terms of payment. From the survey, there was slightly less readiness to connect coming from women than by men. The response for those not wanting to connect was not affected by gender. Both men and women who answered with an unwillingness to pay for the WWTP service have relatively equal proportions. The majority of the respondents (88%) did not see the need, and do not see the health risks. Of this majority, 60.3% are men while 39.7% are women. Women leaders were confident that with proper “socialization,” most, even the poor would be willing to connect. Possible reasons by those that they thought were not sure to connect were lack of information and fear of high monthly charges and/or high connection fees. Based on the SES survey, the average for monthly payment is Rp.5.500. A follow-up FGD and a key informant interview in a slum as well as with women leaders with variable income ranges confirmed this pattern. A similar rate of Rp5000 for monthly fee was chosen by communities in a low income area. This is similar to current expenses on communal sanitation which is currently at Rp 5,000 each month. Most were willing to connect to sewerage services but only if connection rates were cheap or free. Others favored free connection for those who were poor enough to receive government subsidies for health, water and other services. The suggested socialized pricing scheme was based on income and vulnerability (e.g. sick, disabled) – as with socialized water tariff structures. The preference is for free connection with affordable monthly fees. With their proposed low rates are, most offered contributions such as – labor, food for workers, socialization of neighborhoods, etc. Amounts that target clientele were willing to pay monthly for sanitation service/improvement were lower than the actual average PDAM bill of Rp148,814/month and Rp78,600 for electricity. At Rp5,500, proposed rates were just about current onsite sanitation monthly charges of Rp5,000. On the other hand, 15% were willing to pay more at Rp10,000 with another 7% prepared to pay up to Rp15,000. Preferred rates are within a range that is lower than 2% (Rp 31,300) of the average household income Rp 1,563,000. A good sanitation awareness campaign may be able to shift willingness-to-pay values to higher rates with people having to pay a whole lot more for other city services. d. Health, Hygiene Practices
Based on data from the Health Office (Dinas Kesehatan) in 2010, for Jambi city, there was a high incidence of water-related diseases such as diarrhea 15,25%, acute infection, 12.15% and skin disease 10.17%. From the survey by ARSS Baru Consultants, on personal hygiene, 89.2% of the respondents disclosed that they used soap in washing their hands after coming from the toilet; however, only 9% washed their hands after defecation. Before cooking food, 51.1% washed their hands; 41% sometimes forgot to do this and 5.9% admitted to not or rarely practicing it. Concerning eating habits, majority (72.7%) of respondents regularly washed their hands while 27.3% sometimes forgot this practice.

TA 7993 - INO: Metropolitan Sanitation Management Investment Project – MSMIP Final Report 104
On their health conditions for the last six months, 15.9% of the households have had a family member who had suffered from diarrhea while 18.3% had suffered from dengue fever (DB). There were also family members who have had skin diseases (18.9%). About 32.1% of the households reasoned that the causes of diseases were likely related to improper handling of wastes and garbage, 30.8% blamed it to poor wastewater condition. However, majority (72.1%) believed that the diseases were caused by the changes in weather condition shows a general lack of awareness on the linkages of health and sanitation. Based on the Ministry of Public Health, incidence of HIV/AIDS in the city was at 303 and 302, respectively, in 2012. e. Expenditure on Utilities
Based on SES Jambi, average expenditure for electricity is Rp.78,600 and it is Rp.148.814 for PDAM water. Sanitation bill is Rp5,000/month which was charged whether a house was connected to communal water (PDAM) septic tank or not. For those connected, this is inclusive of desludging services for communal septic tanks. Bills were collected by women organization volunteers. Sludge collection fee for individual homes was between Rp 100,000 – Rp 400,000 based on volume and category. Some sludge-removal service firms were based in Jambi. The proposed connection and monthly fees were way below current expenditure on utilities showing the lower priority respondents had for sanitation improvement. These can be used in sanitation marketing to point out the comparative costs and benefits of sanitation services and as basis for discussion by all concerned on optimum rates to allow the utility to provide service and cover its costs in a way that customers could afford. f. Impact on Affected Persons The proposed area for the waste water treatment plant is vacant land with 41 landowners (land certificates). The landowners are willing to sell their land to government with price currently under negotiation. Meetings to discuss the price of land and socialization about the plan of WWTP have taken place already. The area is close to a densely populated zone, and public facilities such as mosques and a school. For now, no relocation is needed and there is a kale (kangkung) plantation that may be compensated. There was awareness of the project by the neighboring communities. But there was general lack of awareness of possible negative impacts of a WWTP in their vicinity. On the other hand, a community from the area sought participation in a monitoring body that would be set up during project construction and operation and have willingness to connect and pay according to their economic affordability. According to them if the said project brought about positive impacts to the health of local communities, they would fully support the program. g. Indigenous Peoples and Vulnerable Groups
There are no significant populations of indigenous peoples in the project sites. Dominant ethnic groups in WWTP Area are Melayu Jambi and Java Ethnic. From ocular inspection and informal interviews with people, the urban poor are often landless in settlements by rivers and shores and lacked water and sanitation facilities. Many were workers who rented rooms in the city. The area around the Wastewater Treatment Plant, like the WWTP location, is on marshland. It used to be subject to regular flooding until a drainage system was constructed along the property. Houses are on stilts. Septic tanks discharged to canal. Many were willing to connect if connection fees were free and monthly charges were no more than Rp5,000 or on

TA 7993 - INO: Metropolitan Sanitation Management Investment Project – MSMIP Final Report 105
sliding scale. There were those with irregular jobs and unable to pay monthly fees regularly. The people who were spoken to were still willing to pay, however, if a delay in monthly payments could be accommodated when a family worker is laid off. h. Sanitation Hot Spots
The area around the proposed site for the WWTP at Rajawali village, Kangkung farm, Jambi, is swampy. Laborers and informal settlers reside in rental properties. There are inadequate sanitation facilities. Waste water is disposed directly into canals and into open space. (Overall, open defecation is also significant in Jambi which survey indicates was at 12% in rivers and 15% on land.) There is interest in the project and willingness to connect if service would be available. Workers do not have steady employment but affordability measures to address delayed monthly payments of workers who are laid off were considered to be a help. The WWTP site is outside the sewerage service area. i. Community Organizations
In Jambi, there are youth organizations (IKP/Ikatan Pemuda Rajawali) and community organizations, such as KSM/LKM, Mangkubumi, Nuri, Pemuda Pancasila and women and health organization such (PKK, Posyandu, Puskesmas, Puskesmas Pembantu). Based on interview with a key informant from an NGO, there are communal septic tanks which serve 15 – 20 households which are managed by KSM, a community organization. The maintenance fee is charged at Rp. 5000/household/month. The key informant suggested that septic tanks should be set as a requirement for IMB (building permit) issuance. He noted no problems in community participation. There were initial constraints specifically on the lack of awareness on maintenance of sanitation facilities and on general sanitation. The experience of the NGO was that demonstrating the benefits of sanitation helps gain the support of the people. KMS/community is willing to pay based on a preliminary agreement achieved during early socialization. Communities now abide with terms of agreement on use of communal sanitation facilities. j. Issues and Concerns
Low-lying areas get flooded and could not connect to communal septic tanks due to elevation; access roads are narrow and there is a lack of space for pipe connections; there are fears that high cost of WWTP and operations may translate to high cost for clients; renters who do not make decisions on sewer connection occupied some houses and lands. These need to be addressed with communities during detailed design and implementation planning and in designing sanitation awareness campaigns. In the survey, the Sustainability of water sources is a concern for Jambi. Almost 67.7% of the population has water coverage under PDAM but higher rates of services are partly attributable to the loss/lack of access to gravity water sources and pollution of ground and surface water sources. Moreover, underground sources have high mineral residues. Garbage is a serious problem contributing to the pollution of fresh water resources. With a growth rate of 3.08% since 2005 - 2010, the demand for water for domestic needs is continually increasing. Overall, the problem of water quality and waste water disposal is related to other sanitation problems such as open defecation and garbage disposal. Poor people dispose wastes directly into the river and waterways causing drainage problems, seasonal and chronic flooding and lack of clean water. Moreover, there are no sanctions by city government for substandard septic tanks. Sanitation promotion needs to

TA 7993 - INO: Metropolitan Sanitation Management Investment Project – MSMIP Final Report 106
address the interlocking problems in sanitation for the proposed wastewater services to make a dent in improving sanitation practices and water and environmental quality. k. Recommendations from Stakeholder Consultations
Proposals from consultations on needs, issues, constraints and opportunities for participation are summarized below:
• Socialized Connection Rate and Monthly Fees for Poor and Vulnerable - Proposed connection average rates are still much lower than the proposed connection fee of Rp.504,250 as calculated in the feasibility study to allow for cost recovery. Higher income households did not offer to pay significantly higher connection and monthly fees. This can be the subject of further discussion between the Implementing Agency and project beneficiaries to find the optimum rate between affordability and willingness to pay. However, all acknowledged the importance of providing subsidy for vulnerable groups for connection and monthly fees since they are in a position of greatest need.
• Hot spots are settlements near waterways – not all people in these areas are poor and yet most dispose waste water into waterways. Due to space, land tenure, flooding, capacity to pay and other concerns, individual sewerage connection may not be feasible. Communal septic tanks can serve as collection points to avoid the disturbance of individual properties. It is the consensus that sanitation hot spots require attention. Appropriate solutions may be in coordination with other septage management options and subject to community assessment and planning.
• Proposed role of village government, women and community organizations in sanitation promotion and project monitoring highlights the importance of mechanisms for cooperation and joint action for sewerage connection and related sanitation problems.
• The narrow passages between houses are seen as a possible constraint during construction. The cost of repairing tiles and other negative results to their home another deterrent to immediate connection. Construction disturbances need to be coordinated and planned for with affected communities. Sewerage connection to communal septic tanks is a possibility.
• Water connection – Water connection in the city is estimated at 60% (67% in survey); lack of adequate water may be a constraint to sewerage connection for those that are not connected to PDAM. Landownership and sanitation audit during detailed design can ascertain implications of these for sewerage connection planning to ensure that measures are set in place to address constraint in coordination with water utility.
• Gender Mainstreaming, Public Awareness and Pro-Poor Measures - Institutions such as the Pokja, NGOs and Bappeda acknowledged the need to firm up measures for pro-poor policies for sewerage connection. Some form of subsidy is seen which should be subject to further analysis and discussion among all concerned to arrive at an amount that has a bearing on the true costs of connection and maintenance. The Bappeda does not recommend that connection be free of charge; subsidies on connection tariff and monthly fees will depend on income class. The tariff will be set through a Regional Regulation (Peraturan Daerah) to be reviewed in 2013. Draft (clausal) “Waste Water Management” tariffs are up for discussion at the Local Legislative Body (DPRD).
• Training Needs - Based on interviewed NGO officer, women should be more engaged in sanitation. They are suitable as the treasurer or collector. One (1) KSM normally consists of one chairman and a treasurer. An activity advocated by KSM is the so-called “Pedas” program, i.e. Concern to Keep the Cleanliness of Local Neighborhood.
• On corruption and project implementation, the view from an NGO is that government

TA 7993 - INO: Metropolitan Sanitation Management Investment Project – MSMIP Final Report 107
should ensure transparency regarding all project activities, especially budget issues. As long the budget is used in accordance with the plans and needs, it will not be a problem for NGOs. Involvement of communities and NGOs may be important so that these projects will be run well.
Table IV-I 2: JAMBI Key Findings of Socio-Economic Survey and Stakeholder
Parameter Survey Result
Basic Data for Jambi City
The population of Jambi in 2010 is 558,500, while there were 139,625 households. The annual growth rate was 3.08% since 2005 – 2010. The average household income is 1,563,000, with a minimum wage (2011) of 1,124,000 per month.
Respondents’ Characteristics
10% of respondents live below the poverty line; The occupations were 26.6% for those with own business while 15,4% were labor. 93.1% of households were male-headed; 4,6% were headed by women. The respondents lived in houses made of strong material, 23,3% light material 10,6%, mixed but predominantly strong materials 37,8% while 27.4% lived in houses made of mixed but predominantly light materials. About 65.1% of the respondents declared themselves as owners of the houses they lived in; renters about 25,2% the rest were caretakers or lived with family in extended structures; 48.2% completed senior high school; The served population for PDAM water is 67.7% of households in survey are but for city 60% served by PDAM.
Needs High need and increasing demand for sanitation improvement. Sanitation coverage was high for toilet 95.5% but 15.2% had septic tanks with no standard (complete) of septic tank; satisfaction with toilet condition was (86.5%%) High incidence of water-related diseases such as diarrhea 15.26%, upper respiration acute infection 148.88%, and skin disease 10.17%.
Affordability and Willingness to Pay (WTP) – disaggregate WTC/WTP by sex
SES Jambi - The proposed average rate for domestic connection was Rp. 504,250; with a WTP monthly fee at Rp 5,500; from FGD with women, there were those who would connect to sewerage system only if connection is free or cheaper than the cost of removal of sludge from communal septic tank at Rp 5.000-10.000/month/household or adjusted to the economic level of the household. It is their assessment that with proper orientation on benefits, many would connect.
Health, Hygiene and Sanitation
Awareness and practice of hand washing for children was not well developed. Top two diseases for children were diarrhea and cough. Some hygiene and sanitation public awareness activities by concerned agencies and women’s groups and NGOs. Survey figures of respondent’s health conditions for the last six months reflect 15.9% of the households have a family member who had suffered from diarrhea while 18.3% were from dengue fever (DB). There were also family members who have had flu, cough and colds (59.3%) and skin pains (18.9%). About 32.1% of the households have reasoned out that the causes of diseases could be due to the improper handling of waste of waste and garbage, 30.8% blamed it to poor wastewater condition; HIV/AIDS incidence – 303, 302, respectively, in 2012
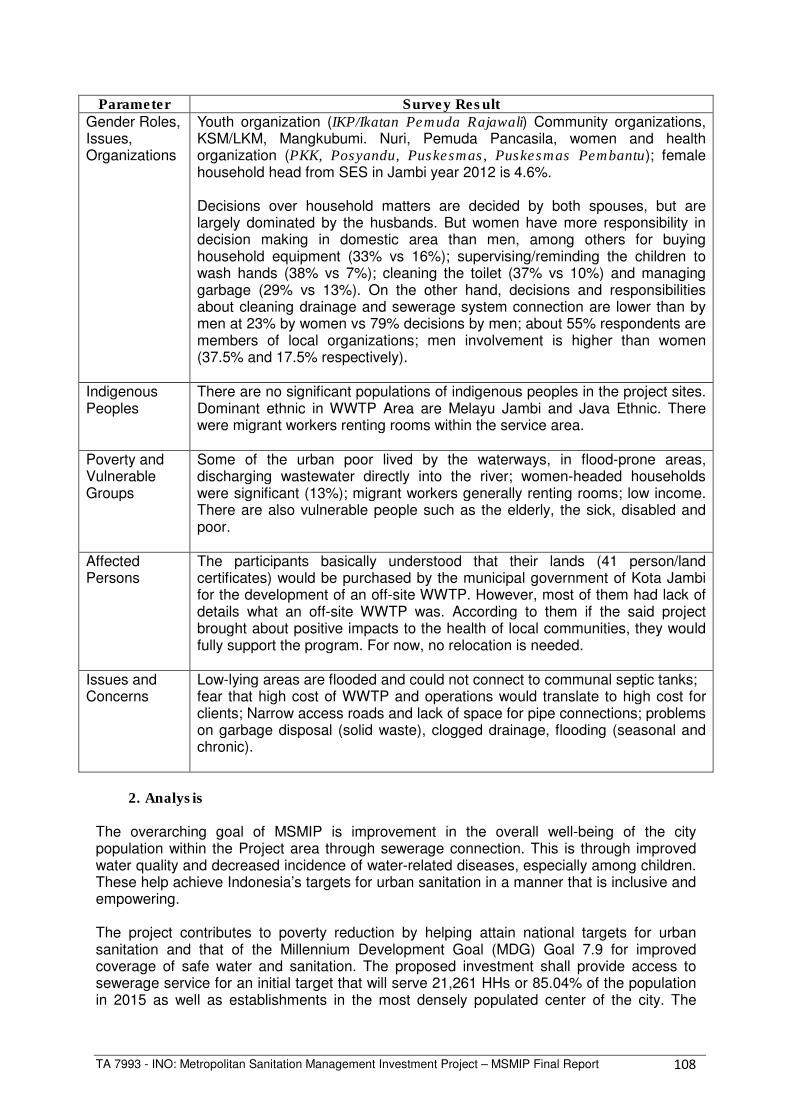
TA 7993 - INO: Metropolitan Sanitation Management Investment Project – MSMIP Final Report 108
Parameter Survey Result Gender Roles, Issues, Organizations
Youth organization (IKP/Ikatan Pemuda Rajawali) Community organizations, KSM/LKM, Mangkubumi. Nuri, Pemuda Pancasila, women and health organization (PKK, Posyandu, Puskesmas, Puskesmas Pembantu); female household head from SES in Jambi year 2012 is 4.6%. Decisions over household matters are decided by both spouses, but are largely dominated by the husbands. But women have more responsibility in decision making in domestic area than men, among others for buying household equipment (33% vs 16%); supervising/reminding the children to wash hands (38% vs 7%); cleaning the toilet (37% vs 10%) and managing garbage (29% vs 13%). On the other hand, decisions and responsibilities about cleaning drainage and sewerage system connection are lower than by men at 23% by women vs 79% decisions by men; about 55% respondents are members of local organizations; men involvement is higher than women (37.5% and 17.5% respectively).
Indigenous Peoples
There are no significant populations of indigenous peoples in the project sites. Dominant ethnic in WWTP Area are Melayu Jambi and Java Ethnic. There were migrant workers renting rooms within the service area.
Poverty and Vulnerable Groups
Some of the urban poor lived by the waterways, in flood-prone areas, discharging wastewater directly into the river; women-headed households were significant (13%); migrant workers generally renting rooms; low income. There are also vulnerable people such as the elderly, the sick, disabled and poor.
Affected Persons
The participants basically understood that their lands (41 person/land certificates) would be purchased by the municipal government of Kota Jambi for the development of an off-site WWTP. However, most of them had lack of details what an off-site WWTP was. According to them if the said project brought about positive impacts to the health of local communities, they would fully support the program. For now, no relocation is needed.
Issues and Concerns
Low-lying areas are flooded and could not connect to communal septic tanks; fear that high cost of WWTP and operations would translate to high cost for clients; Narrow access roads and lack of space for pipe connections; problems on garbage disposal (solid waste), clogged drainage, flooding (seasonal and chronic).
2. Analysis The overarching goal of MSMIP is improvement in the overall well-being of the city population within the Project area through sewerage connection. This is through improved water quality and decreased incidence of water-related diseases, especially among children. These help achieve Indonesia’s targets for urban sanitation in a manner that is inclusive and empowering. The project contributes to poverty reduction by helping attain national targets for urban sanitation and that of the Millennium Development Goal (MDG) Goal 7.9 for improved coverage of safe water and sanitation. The proposed investment shall provide access to sewerage service for an initial target that will serve 21,261 HHs or 85.04% of the population in 2015 as well as establishments in the most densely populated center of the city. The

TA 7993 - INO: Metropolitan Sanitation Management Investment Project – MSMIP Final Report 109
expected outcomes of the Project for Jambi City are: improved sewerage services and environmental quality in served areas, improved sewerage management services, and improved public awareness on sanitation. Improved sanitation outcomes will be measured in terms of the number of new service connections (i.e., residential, commercial/industrial, institutional), including women and poor households that will directly benefit from pro-poor policies for connection. Sanitation outcomes may also be measured by the reduction in direct disposal of waste water into water bodies, thereby reducing water pollution and resulting bad color and smell of waterways. These can also be measured by improved ground water quality that could contaminate wells that supply drinking water to the population. Served households can also enjoy savings in the medium term through reduced cost of septic tank construction and maintenance. Primary outcomes are the total number of residential and commercial sewerage connections made and reduced incidence of water-related diseases in the Project area. The investment in sanitation stands to benefit all in the service area through universal free connection. Fifty-five percent were willing to pay for sewerage connection. Affordability was a concern for many. Thus, the strategy adopted by the city is universal connection for domestic users. The challenge of inaccessible monthly fees is addressed through affordable tariffs and subsidies for monthly fees for the poor and vulnerable. Public awareness and connection campaigns in sanitation hot spots promote increased participation of the homeowners and of the renters that reside here. Benefits include improved sanitation service and improved hygiene, solid waste management and access to safe water through sanitation awareness campaign. Attainment of these goals, however, depends on whether intended beneficiaries connect to developed sewerage system and institute behavior change in other areas of environmental sanitation – e.g. disposal of garbage and other wastes into rivers. To do so, measures will be made to reach the poor and vulnerable groups and involve villages and organizations in discussing appropriate strategies to benefit slums and sanitation hot spots. Key issues such as disposal of solid wastes and grey and black wastes into waterways in slums, upstream and in unserved areas can cancel out any gains from sewerage connection within the Project Site. This calls for cooperation on a wider plan to address behavior change on hygiene and sanitation for the entire city and not just within the target beneficiary zone. Partnerships shall be established through joint planning on the contribution of city and village governments, Sanitation Pokja agencies, NGOs and desludging companies with community organizations for a common plan to address city sanitation challenges. Improved water access as a condition for connection also needs to be coordinated with PDAM early on. There are sanitation hot spots along waterways. Around the WWTP site there is need for sanitation improvement but this is not within the sewerage area. Proposed interventions for onsite sanitation improvement, as well as livelihood development assistance promote social inclusion for the WWTP site. Livelihood enhancement opportunities shall be further assessed during project implementation though employment data indicate that women are less likely to be employed. The Project shall empower women and vulnerable groups through affirmative action policies for their participation in project design, sewerage connection and monitoring and evaluation. Along with village structures, community organizations will also be active partners in sanitation assessment, action planning as well as sanitation promotion. Pro-poor targets as well as gender targets at the level of the Implementing Agency and customer are included relative to hiring and promotion and giving them equitable access to sewerage service and training opportunities.
TA 7993 - INO: Metropolitan Sanitation Management Investment Project – MSMIP Final Report 110
A sanitation promotion strategy shall help ensure higher connection rates as survey shows high satisfaction with current sanitation facilities and Indonesian experience shows that free connection, by itself, cannot assure participation. Constraints to connection shall be addressed through joint problem solving of identified connection and sanitation awareness issues. A Stakeholder Communication Strategy shall guide the project in engaging its publics and in facilitating behavior change for improved hygiene and sanitation. A Consultation and Participation Plan will serve as guide in engaging key stakeholders at various stages of project life with special attention to affected persons and vulnerable groups. A capacity building component of MSMIP is expected to result in more inclusive and gender-sensitive operations and monitoring indicators and mechanisms for the implementing agency including village governments and communities in performing their respective roles in the Project. Village governments, women and community organizations, communal sanitation programs and desludging companies which serve households outside the Project Site are potential partners in project implementation and sanitation promotion. Cooperation can be facilitated through joint planning for a sanitation action plan. The project is expected to bring jobs at construction and operations. The observance of core labor standards is prescribed and mitigation measures are set in place for identified risks such as on poor living conditions at worker camps and on sexually transmitted diseases/HIV/AIDS among workers and communities. J. Social Safeguard Studies – Involuntary Resettlement A total of 61,241 m² (6.1241 ha) of lands shall be permanently acquired from the 4 affected households (AHs). All the four land owners are related to one family and own several oil palm and rubber plantations, oil factories and oil export business. The land is low-lying, flood prone, unproductive grassland. The acquisition of the land will not make any adverse impact whatsoever on the livelihood and household incomes of the family. The land owners do not belong to any indigenous group. The land for the subproject has already been acquired following the Indonesia laws and regulations. Compensation was paid to the land owner in December 2012 based on the rate negotiated between BAPPEDA and the owners. There are no outstanding resettlement issues pertaining to the acquisition and compensation.
Information Disclosure, Participatory Consultation and Grievance Redress. The Initial Public Consultation and Information Disclosure was held on 21 September 2012 in compliance with the Government Regulation and ADB’s 2009 SPS and Public Communication Policy (2 April 2012). Further public consultation with randomly selected businesses and households along some selected narrow roads covered under the WCS components was also carried out in February 2013 and copies of PIB were provided to them. Public consultation will continue throughout the project cycle.
The Subproject is Resettlement Category B, since only four AHs with 20 members were affected and none was relocated.
K. Environmental Safeguards Study An environmental assessment was made for the proposed Jambi City’s Off-site Wastewater Collection System and Treatment. Based on the significance of its environmental impacts and risks, the Jambi City subproject is deemed Environmental Category B in accordance with ADB’s environmental categorization and the type of assessment warranted only the preparation of an Initial Environmental Examination (IEE) report. The IEE was carried out under ADB’s TA 7993-

TA 7993 - INO: Metropolitan Sanitation Management Investment Project – MSMIP Final Report 111
INO and in accordance with ADB’s 2009 Safeguard Policy Statement (SPS) and Government of Indonesia (GOI) environment law, Environmental Protection and Management Law of 2009. A copy of the final Jambi City subproject IEE is presented in Annex Document - G. An important consideration in analyzing the environmental impacts of the proposed Jambi City subproject is the fact that its components are infrastructures for environmental improvement and for reducing the risk to public health from untreated sewage. The screening for potential environmental impacts and risks of the proposed Jambi City subproject showed that there are no significant negative environmental impacts and risks that cannot be mitigated. With its Environmental Management Plan (EMP), the proposed Jambi City subproject can be implemented in an environmentally acceptable manner. There is no need for further environmental assessment study. A full EIA is not warranted and the subproject’s environmental classification as Category B is deemed appropriate. An REA checklist was prepared to support the environmental categorization of this subproject. The IEE shall serve as the final environmental assessment document of the proposed Jambi City’s sewerage system subproject. Implementation of the proposed Jambi City’s subproject is recommended with emphasis on the following: (i) EMP of Jambi City’s sewerage system subproject shall be included in the design process; (ii) IEE Report/EMP shall be forwarded to the design consultant for consideration in the design process; (iii) Tendering process shall advocate environmentally responsible procurement by ensuring the inclusion of EMP provisions in the bidding and construction contract documents; (iv) Contractor’s submittal of a contractor’s EMP (CEMP) shall be included in the construction contract; (v) Contract provisions on creation and operation of the ad-hoc City Sewerage Environmental Complaints Committee (CSECC) shall be included in construction contracts; (vi) Training of the WWTP operators on operation and maintenance of the WWTP shall be completed before actual operation; (vii) a WWTP advisor (consultant) shall be provided intermittently during the initial 3 months of operation to assist the operators in the start-up phase and also to correct any undesirable operating practices; (viii) Monitoring of health and safety requirements shall be given more importance during construction and operation to reduce risks to the public and to personnel; and (ix) Jambi City government, its LPMU, and the Jambi Province’s PPIU shall continue the process of public consultation and information disclosure during detailed design and construction phases. 1. Compliance to ADB’s SPS Requirements In compliance with ADB’s SPS (2009) and the requirements describe in its Appendix 1 (Safeguards Requirement 1: Environment), the final IEE for Jambi City’s sewerage subproject contains sections of the following: (i) executive summary, (ii) introduction, (iii) policy, legal, and administrative framework, (iv) description of the environment, (v) anticipated environmental impacts and mitigation measures, (vi) information disclosure, consultation, and participation, (vii) grievance redress mechanism, (viii) environmental management plan, and (ix) conclusion and recommendations. Environmental Management Plan. The EMP section addresses the need for mitigation and management measures for Jambi City’s subproject. Information includes: (i) mitigating measures to be implemented, (ii) required monitoring associated with the mitigating measures, and (iii) implementation arrangement. A tabulated mitigation plan presents the information on: (i) required measures for each environmental impact that requires mitigation, (ii) locations where the measures apply, (iii) associated cost, and (iv) responsibility for implementing the measures. Details of mitigating measures are discussed in the screening process for environmental impacts. A tabulated monitoring plan presents the information on: (i) aspects or parameter to be monitored, (ii) location where monitoring is applicable, (iii)

TA 7993 - INO: Metropolitan Sanitation Management Investment Project – MSMIP Final Report 112
means of monitoring, (iv) frequency of monitoring, (v) responsibility of compliance monitoring, and (vi) cost of monitoring. One of the pre-construction considerations discussed in the EMP is the need to include measures for climate change adaptation and mitigation. A hydrology and flooding study shall be conducted during the design phase for the proposed Jambi City’s WWTP to ensure that occurrence of flooding is properly evaluated. Results of the study shall be used for designing the proposed WWTP and the preparation of engineering specifications to ensure that it is less vulnerable to extreme flood events. Climate change mitigation is by connecting the WWTP’s membrane covered anaerobic ponds to a flare to avoid releasing the generated methane. However, during detailed design, potential use of the generated methane shall be evaluated with due considerations to financial and economic factors. EMP Cost. The IEE points to the need of ensuring funds for EMP implementation. The suggested approach is to allocate funds for EMP implementation by requiring that the tender documents of Jambi City’s sewerage subproject shall include a lump sum bid item in the bill of quantities to be titled “Environmental Mitigation Measures”. Furthermore, it shall be clarified in the specification documents that the environmental mitigating measures identified in the construction EMP are to be charged to this item. This will allow the construction supervision engineer of Jambi City’s sewerage subproject to require the contractors to quickly address the environmental issues during construction. For budgetary purposes, this EMP fund of the proposed Jambi City’s sewerage system is estimated at 1% of the total direct cost of the WWTP and the sewer lines. Relative to this, the CPMU and the Jambi Province’s PPIU shall ensure that this provision for “Environmental Mitigation Measures” is included in the bidding documents and civil works contracts. Institutional Setup. Similar to the 4 other MSMIP subprojects, there is a need to ensure that the environmental aspects of the proposed Jambi City’s sewerage system is effectively addressed through a well-defined institutional setup. The roles of the various GOI units and consultants for the environmental aspects are discussed in the sections for institutional aspects of the final IEE. The setup presents the proposed PPIU of Jambi Province as the key implementation unit responsible for construction contracts’ supervision of the Jambi City subproject, while the Jambi City’s LPMU coordinates the needed local inputs and resources. Capacity Building for WWTP Operators. The final IEE recognizes the fact that a newly constructed WWTP might discharge poor quality effluents due to operators that are not properly trained. One of the proactive ways to prevent this from happening is to provide capacity building for the operators of the new Jambi City’s WWTP during pre-operation phase and continue during the initial few months of the operation phase. The proposed capacity building shall be divided into 2 parts and shall be facilitated by local consultants. The first part shall be a one month hands-on training on operating and maintaining a WWTP in a similarly operating WWTP in Indonesia. The second part shall be the actual operation of the new Jambi City’s WWTP with inputs from a WWTP advisor for a 3-month period intermittently. This type of advisory services is very important since the new WWTP will be in the start-up phase and also to correct any undesirable operating practices of the newly hired operators. Estimated cost of the initial capacity building is US$7,600 while the cost of advisory services of the WWTP advisor for a 3-month period intermittently at the new WWTP is US$14,000. This capacity building for WWTP operators is also reflected in the overall capacity building plan for MSMIP. Grievance Redress Mechanism. The IEE presents a local grievance redress mechanism (GRM) for environmental complaints during the construction phase of the Jambi City’s sewerage subproject. The GRM has three levels and calls for the creation of an ad-hoc City Sewerage Environmental Complaints Committee (CSECC). This shall be chaired by Jambi

TA 7993 - INO: Metropolitan Sanitation Management Investment Project – MSMIP Final Report 113
City’s Chief of the LPMU. CSECC members shall include the: (i) contractor’s highest official at the site such as the Construction Manager or Construction Superintendent, (ii) village (Kelurahan) Chief or his representative, and (iii) a women organization’s representative. The draft GRM was presented to stakeholders during the initial public consultation meeting. Public Consultation and Information Disclosure. There were two initial public consultations conducted for this subproject during the PPTA. The first was last 21 September 2012, while another one was conducted last 18 March 2013. Another public consultation was conducted due to Jambi City’s government decision to change the location of the proposed WWTP to a nearby new site due to unsuccessful purchase of the previous site. Jambi City’s government has purchased the new site. The new site for the WWTP is in the same general area as the previously identified site (Kasang Village). The new site is the nearby Kasang Jaya Village. A total of 18 stakeholders and representatives participated for the first public consultations, while another 18 for the second. The discussions included the issues on an ongoing land acquisition of the site at Kasang village for the proposed WWTP. It also included issues on potential disturbances during construction , WWTP odor during operation, WWTP discharges effects on creek and groundwater, and WWTP effects on flooding. The public consultation meetings are fully documented in the final Jambi City subproject IEE. A summary of the issues raised during the initial public consultation in Jambi City and how the project addressed them is presented in Table IV-K 1.
Table IV-K 1: Summary of Issues Raised and Project’s Response during Public Consultation
Group Represented Issues/ Concerns Raised Project’s Response
Kasang Jaya Village What is the technology to be used for the proposed WWTP
WWTP will use an aerated lagoon technology, a wastewater treatment system that is widely used in Indonesia
Kasang Jaya Village Will the WWTP wastewater affect the surrounding area?
WWTP will not pollute the environment since it will comply with the government's standards for wastewater discharges to surface waters
Kasang Jaya Village Will the WWTP wastewater affect the groundwater of the surrounding area?
Groundwater will not be affected since the proposed WWTP will be impermeable
Kasang Jaya Village What about odor problems during operation of wastewater treatment plant?
The aerated lagoon technology will not create odor problems and odor will be similar to smell of paddy field. In some countries, WWTP is in the centre of the city. If WWTP is well managed, odor will not be a problem. An existing example is the Yogyakarta WWTP
Kasang Jaya Village What about construction disturbance?
Construction activities will be conducted is such a way that impacts will be minimized. The city

TA 7993 - INO: Metropolitan Sanitation Management Investment Project – MSMIP Final Report 114
government will also recommend to the contractors the employment of villagers for the labor requirement of the construction activities.
Kasang Village What will be done in order for the WWTP not to affect the flooding of the surrounding areas?
Flooding effects of the WWTP will be studied in detail during the detailed design phase of the proposed WWTP.
2. Compliance to GOI’s Environmental Requirements The final Jambi City subproject IEE presents GOI’s regulatory requirements regarding the AMDAL system (EIA system) and discharge permit for WWTPs. Under AMDAL regulation, a proposed WWTP for domestic wastewater that will require an area of more than 3 hectares or will serve a population of more than 100,000 shall be required to prepare an AMDAL report. The Jambi subproject will require an area of 6 hectares, more than the 3-hectare criterion. It will therefore be required to prepare an AMDAL. Preparation of the AMDAL will be done by the detailed design consultants during the detailed design phase as agreed by ADB and GOI. AMDAL preparation will be funded by the GOI and shall be completed prior to any bidding/procurement process. A permit to discharge will also be required for the proposed Jambi City WWTP under the city’s regulation for WWTPs. Information on the process for discharge permit application is presented in the final IEE’s appendices.
L. Institutional Proposals
1. The Project and Schedule
During the consultation meeting with the PPTA consultants last July 24, 2012, the Pokja confirmed the project scope to cover the Central Business District (CBD) Wastewater Collection and Treatment system. The schedule of project implementation as well as the supporting institutional development activities is presented in Table IV-L 1.
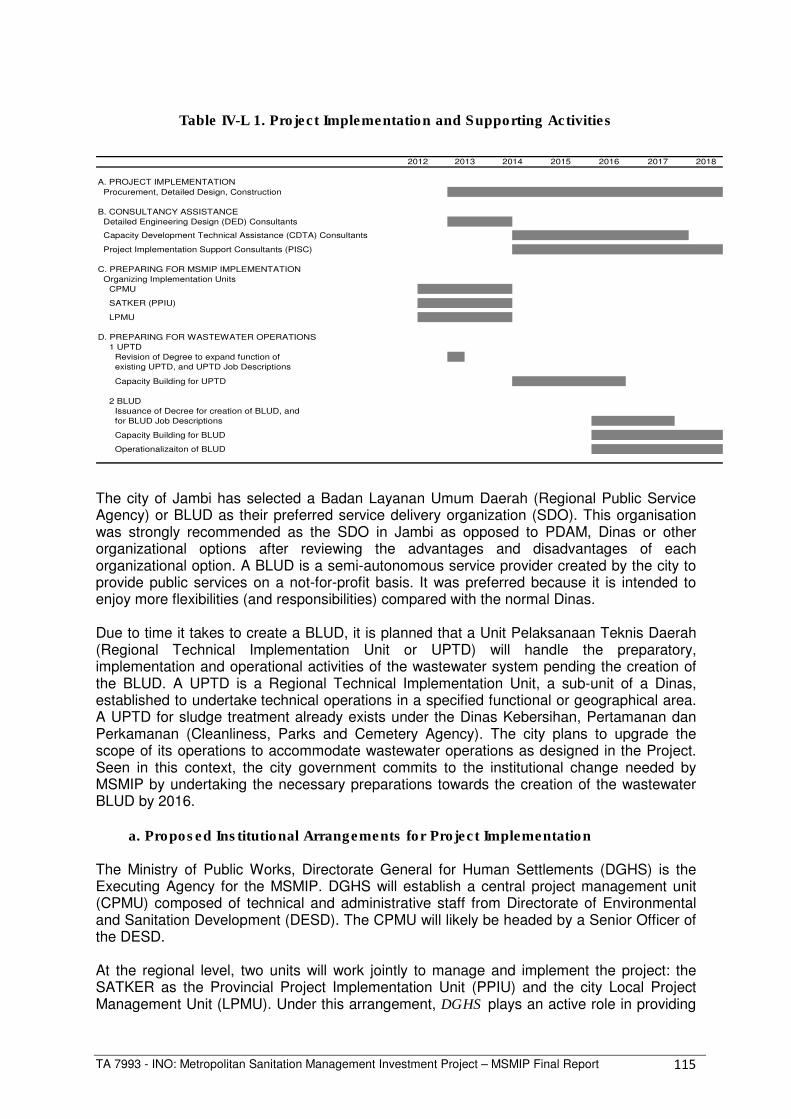
TA 7993 - INO: Metropolitan Sanitation Management Investment Project – MSMIP Final Report 115
Table IV-L 1. Project Implementation and Supporting Activities
A. PROJECT IMPLEMENTATION
Procurement, Detailed Design, Construction
B. CONSULTANCY ASSISTANCE
Detailed Engineering Design (DED) Consultants
Capacity Development Technical Assistance (CDTA) Consultants
Project Implementation Support Consultants (PISC)
C. PREPARING FOR MSMIP IMPLEMENTATION
Organizing Implementation Units
CPMU
SATKER (PPIU)
LPMU
D. PREPARING FOR WASTEWATER OPERATIONS
1 UPTD
Revision of Degree to expand function of
existing UPTD, and UPTD Job Descriptions
Capacity Building for UPTD
2 BLUD
Issuance of Decree for creation of BLUD, and
for BLUD Job Descriptions
Capacity Building for BLUD
Operationalizaiton of BLUD
2017 20182012 2013 2014 2015 2016
The city of Jambi has selected a Badan Layanan Umum Daerah (Regional Public Service Agency) or BLUD as their preferred service delivery organization (SDO). This organisation was strongly recommended as the SDO in Jambi as opposed to PDAM, Dinas or other organizational options after reviewing the advantages and disadvantages of each organizational option. A BLUD is a semi-autonomous service provider created by the city to provide public services on a not-for-profit basis. It was preferred because it is intended to enjoy more flexibilities (and responsibilities) compared with the normal Dinas. Due to time it takes to create a BLUD, it is planned that a Unit Pelaksanaan Teknis Daerah (Regional Technical Implementation Unit or UPTD) will handle the preparatory, implementation and operational activities of the wastewater system pending the creation of the BLUD. A UPTD is a Regional Technical Implementation Unit, a sub-unit of a Dinas, established to undertake technical operations in a specified functional or geographical area. A UPTD for sludge treatment already exists under the Dinas Kebersihan, Pertamanan dan Perkamanan (Cleanliness, Parks and Cemetery Agency). The city plans to upgrade the scope of its operations to accommodate wastewater operations as designed in the Project. Seen in this context, the city government commits to the institutional change needed by MSMIP by undertaking the necessary preparations towards the creation of the wastewater BLUD by 2016.
a. Proposed Institutional Arrangements for Project Implementation The Ministry of Public Works, Directorate General for Human Settlements (DGHS) is the Executing Agency for the MSMIP. DGHS will establish a central project management unit (CPMU) composed of technical and administrative staff from Directorate of Environmental and Sanitation Development (DESD). The CPMU will likely be headed by a Senior Officer of the DESD. At the regional level, two units will work jointly to manage and implement the project: the SATKER as the Provincial Project Implementation Unit (PPIU) and the city Local Project Management Unit (LPMU). Under this arrangement, DGHS plays an active role in providing

TA 7993 - INO: Metropolitan Sanitation Management Investment Project – MSMIP Final Report 116
technical supervision and responsibility over the investment (the Satuan Kerja or SATKER model). The PPIU or the SATKER comprises full time staff detailed from DGHS to the provinces to implement specific projects of DGHS. The projects in the four cities above will be implemented through the SATKER in their respective provinces. Following above arrangements, the Jambi subproject will be implemented through the SATKER Jambi Province acting as the PPIU or the implementing agency for the MSMIP. The LPMU will be the Dinas Kebersihan Pertamanan dan Perkamanan (Cleanliness, Parks and Cemetery Agency or DKPP). The DKPP will coordinate closely with the POJKA AMPL, as to strengthen the involvement of the UPTD in the project during the early stages, and to establish a sound sense of project ownership. See Figure IV-L 1.
Figure IV-L 1. Implementation Arrangements
DGHS
(Executing Agency)
Central Steering
Commitee
Central Project
Management Unit
(CPMU)
Central Project
Implementation Unit (CPIU)
/ Satker Pusat
Central Support team
(CST) a
Provincial Project
Management Unit
(PPMU)
Provincial Project
Implementation Unit
(PPIU) / Satker Provinsi
Provincial Support team
(PST) a
Local Support team
(LST) a
Local Project Management
Unit
(LPMU)
Local Project
Implementation Unit
(LPIU) / SKPD
Dinas Provinsi b
Implementing Agency
Provincial Steering
Committee (CWSG, various
Dinas Provinsi )
Dinas Kota c
(Implementing Agency ABPD-
Kota)
City Sanitation Working
Group
(CSWG)
(chair: DGHS)
(chair: BAPPEDA-Prov.)
(chair: deputy mayor)
National Level
Provincial Level
City Level
Consultant Support
a Support teams consist of consultants for: (i) project implementation support,
and (ii) institutional development and capacity buildingb
Provincial Governmentc City Government
Supervision, guidance
reporting

TA 7993 - INO: Metropolitan Sanitation Management Investment Project – MSMIP Final Report 117
Institutional arrangements include mechanisms for environmental management and resettlement. See Annex Document H8 for details. b. Proposed Institutional Arrangements for Operation
The focus of the capacity building is on establishing an autonomous and accountable SDO for wastewater management. To do this, the city of Jambi plans to upgrade the existing UPTD in 2013 as a preparatory step towards the creation of a BLUD by 2016.
i. Upgrading of the UPTD A UPTD has previously been formed under DKPP to handle sludge treatment. This UPTD will be upgraded to cover wastewater operations. The Mayor’s decree for upgrading the UPTD and the Statement of Job Descriptions and Functions for additional staff is expected to be issues in 2013. The proposed organization for the UPTD is shown in Figure IV-L 2.
Figure IV-L 2. Proposed Organization Chart of the UPTD
HEAD
Administrative Dept
Head, Functional Group Head, Functional GroupHead, Functional Group
The upgraded UPTD will consist of the head, the administrative department, and several functional team groups. The head will manage, coordinate, and integrate all activities of the UPTD. The administrative department will handle hiring and training of staff. The number of functional groups, levels, and functional staff appointed by the Mayor will be based on the nature and volume of work load. Currently there is one functional group handling sludge treatment. With the upgrading, an additional functional group on wastewater operations will be added. Each group is headed by a senior functional staff appointed by the Mayor as proposed by DKPP. Upon completion of the MSMIP wastewater project, the UPTD Administrative Department, with assistance from the capacity development technical assistance (CDTA) consultants, will start the hiring process and training of staff to allow it to handle technical, commercial, finance/administrative operations of the wastewater system. The city is considering the PDAM as a possible collection agent. Whereas the PDAM Tirta Mayang serves less than half of the population in Jambi city, it’s connections serve around 75% of the areas to be served by the subproject WWTP – Kecamatan Jambi Tumur (71%) and Kecataman Pasar (78%). However, the city still remains unsure if the PDAM is the most preferable option for joint water supply and wastewater service collections as coverage in other PDAM-serviced areas is as low as 52%. As a result, the decision on the mode of billing and collection-- through the PDAM, the city government (PBB, etc) or through UPTD – i.e., village and community groups has been deferred until such time when the wastewater system is nearing

TA 7993 - INO: Metropolitan Sanitation Management Investment Project – MSMIP Final Report 118
completion. It is hoped that by then the PDAM would have increased its service coverage to include most if not all of the wastewater customers. The proposed capacity development technical assistance (CDTA) for MSMIP also provides for policy/ guideline and procedures manual preparation to cover operation and maintenance including commercial and financial systems. ii. Creation of the BLUD
It is expected that during the 2 year capacity building assistance, the consultants will be able to assist and guide the city to eventually create the BLUD as planned. The city realizes that under the UPTD, wastewater operations cannot fully be autonomous and will continue to depend on city government budgets. The consultants will assist the city prepare draft legislation including the necessary PERDAs (or city regulations). Details of proposals on how the BLUD will be organized are provided in Annex H8. c. Institutional Development and Capacity Development Component The CDTA comprises two components, namely the capacity building plan and project management assistance.
i. Capacity Building Plan Methodology and Approach
The capacity building plan is directed at two (2) distinct levels – sector (or city) management level (through the Local Institutional Development Action Plan or LIDAP) and at the service delivery level (through the Financial and Operating Improvement Plan or FOPIP). See Figure IV-L 3 below. The LIDAP includes interventions to be initiated and managed by the city government which influences the operating conditions of the Service Delivery Organization (SDO). The FOPIP, on the other hand, includes interventions which are to be initiated and managed by the SDO. The PPTA consultants assisted the city in preparing the LIDAP and FOPIP during the Workshop on Institutional Development Program for Wastewater Management Under the MSMIP (Preparation of LIDAP, FOPIP and the Capacity Building Plan for Jambi City) held last November 28-29 in Jambi City.
Figure IV-L 3. Capacity Development Plan Approach
1) policy formulation, sector
management
(2) management of service delivery
(human resources, pricing the service,
etc.)
(3) community involvement
(4) regulation of service provision.
FOPIP
CAPACITY DEVELOPMENT
Establish
ment of
Effective
Service
by SDO
LIDAPSector
Reform
The sector interventions to be provided by the capacity building component can be grouped into three types:

TA 7993 - INO: Metropolitan Sanitation Management Investment Project – MSMIP Final Report 119
• Assistance in the preparation of policies, guidelines, and manuals; • Advisory services, technical assistance and progress monitoring; • Training and Workshops.
ii. Project Management Assistance Project management assistance covers technical audit and benefit monitoring. Technical Audit. The consultancy services also aims to provide initial project management assistance during the 12 month period prior to mobilization of the PISC and during the 12 months of the PISC contract. This primarily covers assistance in the procurement activities. Benefit Monitoring and Evaluation. Monitoring and evaluation of project benefits calls for the development and implementation of a Project Performance Monitoring System which covers the, conduct of a baseline study and setting up of all institutional requirements in order to be able monitor and evaluate the benefits of the project after its completion. d. Project Readiness of the City Jambi city has demonstrated its institutional readiness and plans to issue the Mayor’s Decree for the upgrading of the UPTD to cover wastewater operations as soon as possible. The city also realizes that social marketing/ promotion and issuance and enforcement of sanitation regulation are key to the success of the project and commits to this and other action plans in the LIDAP and FOPIP. Once the proposed tariffs are determined, the city will adopt strategies to be able to implement the needed charges to make the wastewater operations sustainable. In several discussions of the consultants with the city, they have committed to charge fees that will fully recover O&M cost (including depreciation).

TA 7993 - INO: Metropolitan Sanitation Management Investment Project – MSMIP Final Report 120
V. Makassar, Losari Off-site Wastewater Collection System and Treatment A. Makassar, Losari Physical Setting Makassar is the capital of South Sulawesi. It is the fourth largest city in Indonesia and the largest city in East Indonesia. Makassar presently has 1.24 million inhabitants and it is projected that that this number will grow to around 1.8 million by the end of 2030. The gradient of the City ranges from 0 to 5% in the east-west direction. Annual average rainfall is about 2000-2500 mm, about 75% of which occurs in the rainy season. The average humidity is about 80% in the rainy season and about 75% in the dry season. The average annual temperature is about 28°C. Makassar city has high ground water levels, with the depth depending upon location but between 100 mm and 3600 mm. Ground water is used for private domestic supplies if not serviced by reticulated water (59% the population is serviced by reticulated water from 5 treatment plants). However, ground waters are polluted with nitrate and E. coli. Field findings show that rivers and streams, on average, are heavily polluted. Coastal Waters, the Losari coastal ecosystems, and the Jongaya canal estuary are threatened by domestic waste which is shown by the effluent quality from seven drainage outfalls which have BOD concentrations that exceed the standard. The project SOSEC survey of over 330 households during January/February 2011, found that from December 2010 to February 2011, 64.6% of respondents were affected by diseases caused by bad sanitation. Current wastewater facilities used in Makassar are mainly on-site individual but there are some communal systems. There are three small pilot-scale sewerage systems. Some commercial properties have their own wastewater treatment facilities and most outsource the operation of the facility to a third party. Hotels and restaurants along the coast discharge their wastewater straight into the sea. There is one septage solids treatment plant at Nipa Nipa. This is operated under Dinas Pertamanan dan Kebersihan (City Cleaning and Garden Office), built in 1989-1990, with a capacity of 100 m3/day (note: the Makassar feasibility indicates a 1,000 m3/d). Estimated numbers of septic tanks approach 200,000 but sludge taken to the IPLT averages only about 100 m3/week. There are several private vacuum tanker companies and the City Government has 4 vacuum trucks. The [pretreatment] sludge tank and Inhoff tank are broken, buried and inoperative. The septage is put directly into the anaerobic tanks such that there is almost no quality improvement and most goes directly into adjacent watercourses. Population increases will aggravate the aforementioned environmental problems. The Makassar City Government has been planning for many years to improve the unhygienic conditions around the Losari Beach area (12% practice open defecation), by providing a centralised sewerage system. Since 2006 Makassar City has made serious efforts to develop communal wastewater systems and three intermediate wastewater systems were implemented in Makassar during 2010. These were financed from National budgets, such as the USRI and local Public Works funds. There are also plans being developed by the City Government to develop more intermediate wastewater systems, for up to a total of 10,000 households by 2030, along the Jongaya canal. Intermediate wastewater treatment systems are to be developed systems in the high density slum areas along the Jongaya Canal for up to 10,000 households by 2030. Previous studies before the IndII Master Plan (2011) included:
1. Master Plan for Ujung Pandang – JICA (March 1996), 2. City Sanitation Strategy (June 2007),

TA 7993 - INO: Metropolitan Sanitation Management Investment Project – MSMIP Final Report 121
3. Metropolitan Sanitation Management and Health Project (MSMSP, August 2008), 4. Losari Wastewater Treatment Plant DED and Environmental Assessment, 2007
Sehati (part of the MSMH PROJECT SPAR report), 5. Losari Wastewater Treatment Plant DED, Dana Consult. (2008), and 6. Technical aid for preparation of the wastewater Institutional plan for Losari (Bantuan
Teknis Penyiapan Kelembagaan Air Limbah), CV Adi Permata Konsultan (2010). Previously plans for sewerage and treatment included the development of a 1,357 ha wastewater collection network with a 7,000 m3/day capacity sewage treatment plant (STP) at the Jl. Metro Tanjung Bunga Bridge over the Jongaya Canal (“Losai WWTP or STP”). By 2015 the proposed sewerage system would provide 50% area coverage and 9,000 connections and intermediate systems for 3,820 households. By 2020 the sewerage was to be extended to 60% with 12,500 connections and extended to 80% with 20,000 connections by year 2030. The wastewater was to be collected in a 500 mm diameter collector trunk sewer along the sea front of Losari Beach. Relevant Environmental Standards
Municipal regulations state commercial buildings should install a WWTP. Treated wastewater from hotels should be less than BOD 30 mg/L (annex 26, Governor Decree 14/2003). Pollution levels in fresh waters are covered by the South Sulawesi Governor Decree number 14 of 2003 annex 1: Stream, River or Water Surface Body Standard, which limits the water quality parameters given below:
• Total Suspended Solid (TSS) < 50 mg/L, • Total Dissolved Solids (TDS) < 800 mg/L, • Odour < detectable, • Biochemical Oxygen Demand (BOD) < 2 mg/L and • Ammonia < 0.5 mg/L.
The national Standard for Effluent Quality is 100 mg BOD/L (National Standards for Effluent Quality, Ministry of Environment Decree 112, 2003) but the Governor can adjust it to 50 mg BOD/L. The IndII Master Plan (2011) employed a wastewater discharge standard of 50 mgBOD5/L. B. Rationale for Selection of Priority Projects The sub-projects included for implementation during Phase 1 (by 2014) of the IndII Masterplans that was produced for Makassar City were identified. The City has been visited to ascertain which of the Phase 1 sub-projects is the priority of each of the City Governments, in that they represent the selected sub-projects that the Cities would wish to implement in the event of limited loan funds. Makassar was visited on the 26th July. Minutes of the Meeting were included in the PPTA Interim Report dated September 2012. At the meeting a presentation was made on the specific “Readiness of the City” with regard to the sub-projects recommended in the WWMPs for the Phase 1 period. In particular, emphasis was placed on the confirmation of the availability of the land for the construction of the WWTP. The City confirmed the land is now available. The City has prioritized the sub-projects that they would wish to be included in this MSMIP TA. The following table shows the sub-projects that have been requested for consideration under this PPTA.

TA 7993 - INO: Metropolitan Sanitation Management Investment Project – MSMIP Final Report 122
The City has prioritized the sub-projects that they would wish to be included in this MSMIP TA. The following table shows the sub-projects that have been requested for consideration under this PPTA.
SUB-PROJECTS SELECTED BY THE CITY FOR FUNDING City Description of Sub-Project Makassar WWTP and Losari Area wastewater collection system
In this PPTA Report we have evaluated the WWTP and the Central Area wastewater collection systems. C. Proposed Wastewater Collection System The cost of the sewerage proposals for Makassar were deemed by ADB and Cipta Karya to be too expensive to fund under the current loan discussions. The PPTA consultants were requested to reduce the extent of the wastewater collection area but to retain the same number of property connections. The Phase 1 sewerage proposals by PEMDA have been reduced, those sewers deferred are shown on the plan below showing sewer sizes. For details of the proposed wastewater collection system and costings please see the following plans and costings table.

TA 7993 - INO: Metropolitan Sanitation Management Investment Project – MSMIP Final Report 123

TA 7993 - INO: Metropolitan Sanitation Management Investment Project – MSMIP Final Report 124
Diameter LengthUnit cost
PPTA
(mm) m ( xRp 1000) ( xRp 1000) ($'million)
1 Rising Main PVC DN 1000 mm 2,600 9,480 24,648,000 2.57
2 Trunk Sewers Concrete DN 900 mm 860 6,459 5,555,155 0.58
Concrete DN 1050 mm 1,154 9,565 11,038,152 1.15
Concrete DN 1200 mm 616 9,972 6,142,752 0.64
Concrete DN 1350 mm 562 11,841 6,654,613 0.69
Concrete DN 1500 mm 580 13,804 8,006,504 0.83
Concrete DN 1650 mm 100 14,817 1,481,700 0.15
38,878,876 4.05
3 Main Sewers Concrete DN 250 mm 780 1,554 1,211,830 0.13
Concrete DN 375 mm 1,997 2,379 4,750,099 0.49
Concrete DN 450 mm 3,834 2,397 9,188,420 0.96
Concrete DN 525 mm 993 3,006 2,984,637 0.31
Concrete DN 600 mm 1,149 4,088 4,697,040 0.49
Concrete DN 750 mm 1,207 4,070 4,912,059 0.51
27,744,085 2.89
101,157 990 100,145,430 10.43
100,145,430 10.43
Flushing Chambers
4 47,413 189,652 0.02
6
Pumping Chamber ( 5m x 5m x 7m) 4 303,431 1,213,724 0.13
1 18,701,310 18,701,310 1.95
7
288 6,186 1,781,584 0.19
3,613 4,492 16,229,596 1.69
2,056 3,079 6,330,014 0.66
8
- - - -
9
0 - - -
10
14,400 3,840 55,296,000 5.76
11
1 23,630,000 23,630,000 2.46
*) By MSMHP Yogja: Lateral to the control box - Rp 2 Million + Box control to house - Rp 1.5 Million.
Total Rupiah (x 1000) 314,788,271 32.79
Sub Total 2 :
Sub Total 3 :
Land Acquisition for the WWTP LOSARI
Pumping Stations
1500 Ips, 20 m head, 4 No pumps
Manholes and Chambers
Sewer Manholes - Depth 2.0 - 7.0 meters
Lateral Sewer Chambers - Depth 1.5 - 2.0 meters
Pipe Work Crossing
6,142 Hectare
Property Connections *)
Collecting Chamber for House Connection
Storm Water Drain Rehabilitation
4
Sub Total 4 :
5Flushing Chamber Vol 4 m3
PVC Pipe dia 150 mm
Laterals
NO ITEMPPTA Reviewed cost
City : MAKASSAR
SEWERAGE PROPOSED BY CITY FOR ADB LOAN (BASIC DIRECT COST)
D. Proposed Waste Water Treatment Plant The original Makassar City plan included 9,000 connections from two areas (Losari 1 and Losari 2) and part of the GMTDC area in the south, taken from a catchment area of about 1,375 ha. The proposed physical facilities included one (1) pumping station and one (1) 7,000 m3/day capacity WWTP (IPAL) on a 6 ha site. The estimated capital cost (Capex) of the WWTP was Million Rp65,000 or Million USD6.915. The proposed WWTP (IPAL) site was apparently the same as what now is proposed for use.
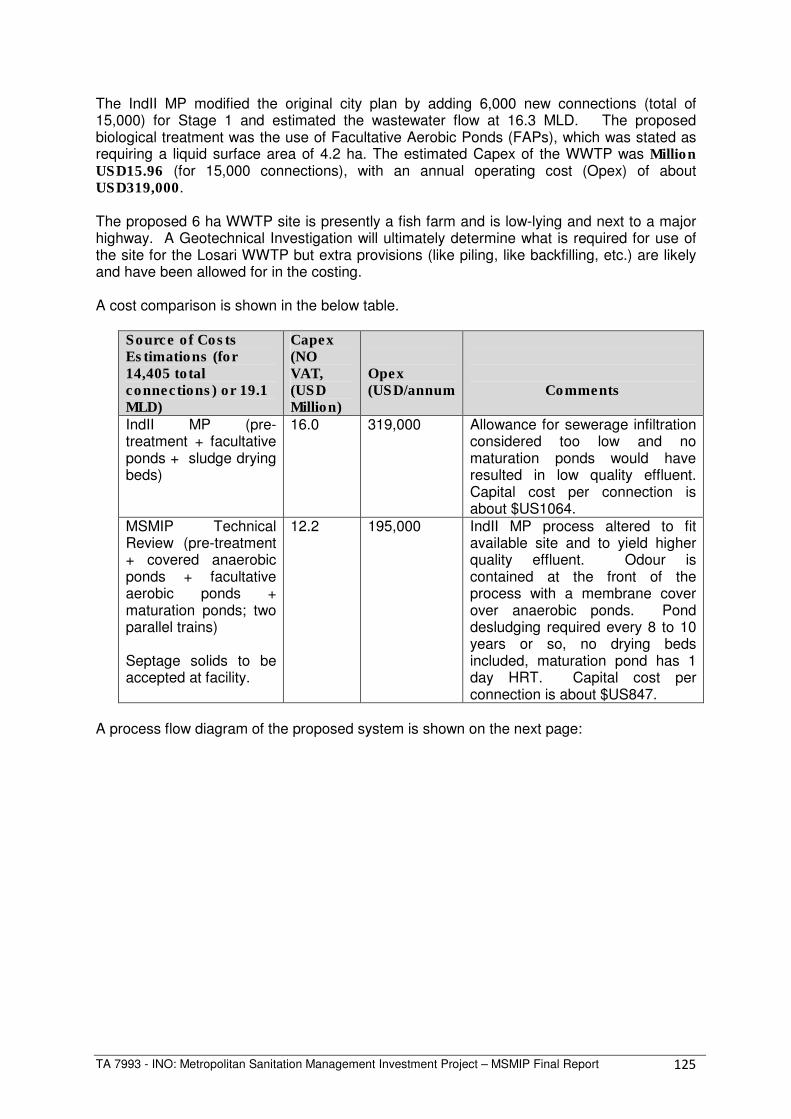
TA 7993 - INO: Metropolitan Sanitation Management Investment Project – MSMIP Final Report 125
The IndII MP modified the original city plan by adding 6,000 new connections (total of 15,000) for Stage 1 and estimated the wastewater flow at 16.3 MLD. The proposed biological treatment was the use of Facultative Aerobic Ponds (FAPs), which was stated as requiring a liquid surface area of 4.2 ha. The estimated Capex of the WWTP was Million USD15.96 (for 15,000 connections), with an annual operating cost (Opex) of about USD319,000. The proposed 6 ha WWTP site is presently a fish farm and is low-lying and next to a major highway. A Geotechnical Investigation will ultimately determine what is required for use of the site for the Losari WWTP but extra provisions (like piling, like backfilling, etc.) are likely and have been allowed for in the costing. A cost comparison is shown in the below table.
Source of Costs Estimations (for 14,405 total connections) or 19.1 MLD)
Capex (NO VAT, (USD Million)
Opex (USD/annum
Comments
IndII MP (pre-treatment + facultative ponds + sludge drying beds)
16.0 319,000 Allowance for sewerage infiltration considered too low and no maturation ponds would have resulted in low quality effluent. Capital cost per connection is about $US1064.
MSMIP Technical Review (pre-treatment + covered anaerobic ponds + facultative aerobic ponds + maturation ponds; two parallel trains) Septage solids to be accepted at facility.
12.2 195,000 IndII MP process altered to fit available site and to yield higher quality effluent. Odour is contained at the front of the process with a membrane cover over anaerobic ponds. Pond desludging required every 8 to 10 years or so, no drying beds included, maturation pond has 1 day HRT. Capital cost per connection is about $US847.
A process flow diagram of the proposed system is shown on the next page:

TA 7993 - INO: Metropolitan Sanitation Management Investment Project – MSMIP Final Report 126
3:1(H:V)DH
L1
L2
AT
AB
Dewater / Desludge
Every5 to 10+ years
Surface Aerators
3:1(H:V)DH
L1
L2
AT
AB
FACULTATIVE
AEROBIC PONDS
3:1(H:V)DH
L1
L2
AT
AB
MATURATION PONDS
Proposed AnFAP TREATMENT PROCESS
(Two Parallel Trains or 6 ponds)
COVERED ANAEROBIC PONDS
TRUCK OFFLOAD
CHAMBER
MECHANICAL
SCREENS
Domestic + Commercial Wastewater
GRIT
Screenings & Grit to Landfill
ST PumpoutTrucks
Possible Grinder
OVERFLOW Biogas
FLARE
Geo-Plastic
Membrane
Cover
Treated WW to Discharge
M
M
M
M
Optionale- gen
MM
M
BYPASS Flows > 2xADWF

TA 7993 - INO: Metropolitan Sanitation Management Investment Project – MSMIP Final Report 127
The Reviewer estimated the Capex for the [revised] Losari WWTP designs for the proposed site for a wastewater flow of 19.1 MLD (from about 14,400 connections). The estimated cost breakdown is given in the below table.
The Reviewer recommends a slight altered process configuration to the IndII to reduce the site area requirements whilst delivering the required effluent quality. The use of Facultative Aerobic Ponds (FAPs) was retained but was to be preceded by a biological pre-treatment to lessen the load to the FAPs and thus reduce their size. The use of anaerobic ponds is suggested before the FAPs, which will lessen the total liquid surface level area required from 6.6 ha to around 4.6 ha (Alternative 2B: covered anaerobic lagoon). Alternative 2B would also produce an estimated biogas of 533 m3/day and flaring it (or combusting for use) would lessen the carbon footprint of this process. The comparison is accentuated in the below table. The use of maturation ponds is suggested after the FAPs for settlement of solids and for some disinfection.
These estimated costs include provisions for a potentially problematic treatment plant site. Normally, covering an anaerobic pond (Alternative 2B) is more expensive than an open lagoon. In this case, the reduced volume from covering, and can reduce the civil works.

TA 7993 - INO: Metropolitan Sanitation Management Investment Project – MSMIP Final Report 128
E. Cost Estimates and Implementation Schedule
Total subproject cost for Makassar City is $60.66 million equivalent. This is based on the direct costs estimated in the technical study and discussed in previous sections. The subproject cost includes taxes and duties, detailed engineering design, physical and price contingencies, land acquisition and involuntary resettlement cost. Details of the estimate are shown in the following table:
Table V-E 1: Summary of Cost Estimates ($ million)
Breakdown of Totals Incl. Cont.
Local
Base For. (Excl. Duties &
Cost a
Exch. Taxes) Taxes Total
1 Wastewater Treatment Works
a. Civil Works 11.25 13.47 7.88 4.24 1.35 13.47
b. Detailed Engineering Design 0.56 0.63 0.19 0.38 0.06 0.63
Subtotal 11.81 14.10 8.07 4.62 1.41 14.10
2 Wastewater Collection System
a. Civil Works 25.14 31.43 10.40 17.88 3.14 31.43
b. Detailed Engineering Design 1.26 1.42 0.42 0.86 0.14 1.42
Subtotal 26.40 32.85 10.83 18.74 3.29 32.85
3 Property Connections
a. Civil Works 8.20 10.51 3.94 5.52 1.05 10.51
b. Detailed Engineering Design 0.41 0.54 0.10 0.39 0.05 0.54
c. Construction Supervision 0.25 0.33 0.06 0.24 0.03 0.33
Subtotal 8.86 11.38 4.10 6.14 1.14 11.38
4 Land Acquisition 1.91 1.91 - 1.91 - 1.91
5 Involuntary Resettlement 0.38 0.42 - 0.42 - 0.42
T O T A L 49.36 60.66 23.00 31.83 5.83 60.66
Total
Cost b
Source: PPTA Consultant’s estimates. a Based on estimates in the technical study.
b Includes taxes, duties, and contingencies (physical and price).
The total investment cost will be financed from various sources: ADB Ordinary Capital Resources (OCR), ASEAN Infrastructure Fund (AIF), AusAID Indonesia Infrastructure Initiative (Aus-AID-INDII), Central Government and City Government of Makassar.
The available financing will be allocated as follows: ADB OCR and AIF will finance $26.06 million equivalent and $13.03 million equivalent, respectively; AusAID-INDII will finance $1.85 million equivalent for the detailed engineering design; the Central Government will shoulder all taxes and duties of $7.15 million equivalent while the City Government will cover land acquisition, involuntary resettlement and property connections amounting to $12.57 million equivalent. The distribution of fund sources is detailed in the following table:
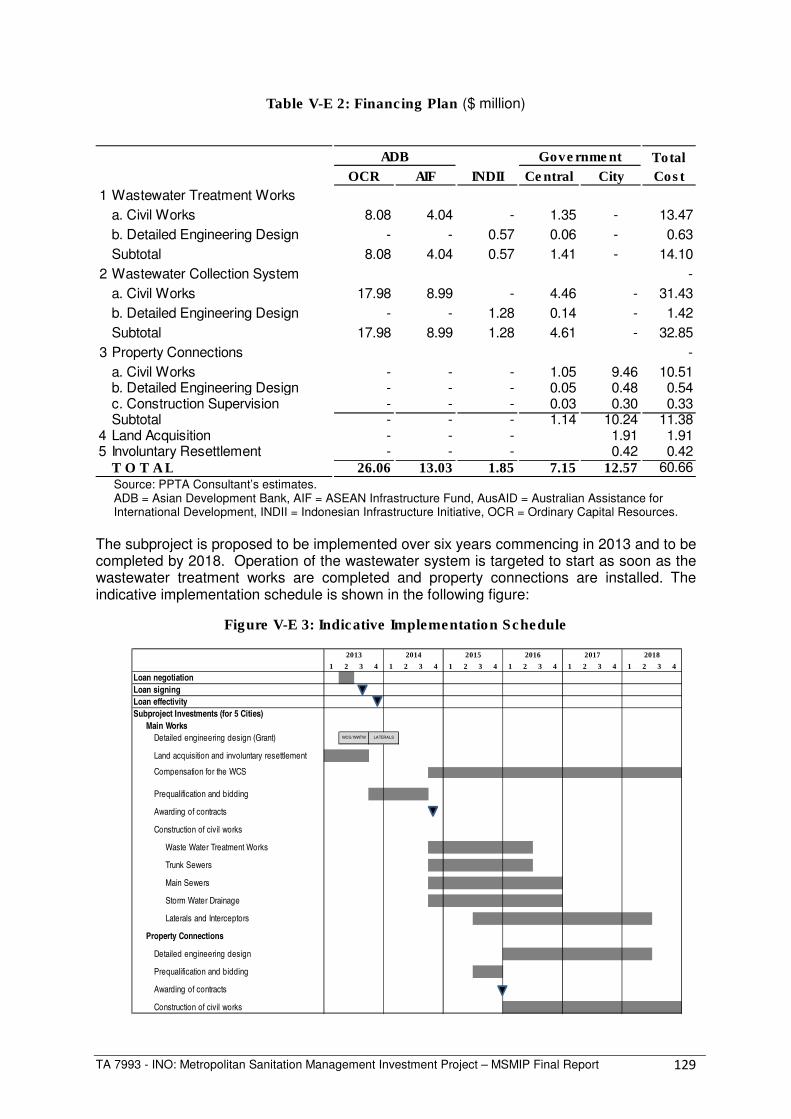
TA 7993 - INO: Metropolitan Sanitation Management Investment Project – MSMIP Final Report 129
Table V-E 2: Financing Plan ($ million)
ADB
OCR AIF INDII Central City
1 Wastewater Treatment Works
a. Civil Works 8.08 4.04 - 1.35 - 13.47
b. Detailed Engineering Design - - 0.57 0.06 - 0.63
Subtotal 8.08 4.04 0.57 1.41 - 14.10
2 Wastewater Collection System -
a. Civil Works 17.98 8.99 - 4.46 - 31.43
b. Detailed Engineering Design - - 1.28 0.14 - 1.42
Subtotal 17.98 8.99 1.28 4.61 - 32.85
3 Property Connections -
a. Civil Works - - - 1.05 9.46 10.51b. Detailed Engineering Design - - - 0.05 0.48 0.54c. Construction Supervision - - - 0.03 0.30 0.33Subtotal - - - 1.14 10.24 11.38
4 Land Acquisition - - - 1.91 1.915 Involuntary Resettlement - - - 0.42 0.42
T O T A L 26.06 13.03 1.85 7.15 12.57 60.66
Government Total
Cost
Source: PPTA Consultant’s estimates. ADB = Asian Development Bank, AIF = ASEAN Infrastructure Fund, AusAID = Australian Assistance for International Development, INDII = Indonesian Infrastructure Initiative, OCR = Ordinary Capital Resources.
The subproject is proposed to be implemented over six years commencing in 2013 and to be completed by 2018. Operation of the wastewater system is targeted to start as soon as the wastewater treatment works are completed and property connections are installed. The indicative implementation schedule is shown in the following figure:
Figure V-E 3: Indicative Implementation Schedule
1 2 3 4 1 2 3 4 1 2 3 4 1 2 3 4 1 2 3 4 1 2 3 4
Loan negotiation
Loan signing
Loan effectivity
Subproject Investments (for 5 Cities)
Main Works
Detailed engineering design (Grant)
Land acquisition and involuntary resettlement
Compensation for the WCS
Prequalification and bidding
Awarding of contracts
Construction of civil works
Waste Water Treatment Works
Trunk Sewers
Main Sewers
Storm Water Drainage
Laterals and Interceptors
Property Connections
Detailed engineering design
Prequalification and bidding
Awarding of contracts
Construction of civil works
WCS/WWTW LATERALS
2013 2014 2015 2016 2017 2018

TA 7993 - INO: Metropolitan Sanitation Management Investment Project – MSMIP Final Report 130
The annual breakdown of costs by component is shown in the following table:
Table V-E 4: Estimated Annual Subproject Costs by Component
Totals Including Contingencies (US$ Million)
2013 2014 2015 2016 2017 2018 Total
1 Wastewater Treatment Works
a. Civil Works - 1.82 7.65 4.00 - - 13.47
b. Detailed Engineering Design 0.63 - - - - - 0.63
Subtotal 0.63 1.82 7.65 4.00 - - 14.10
2 Wastewater Collection System
a. Civil Works - 2.06 11.00 10.43 5.23 2.71 31.43
b. Detailed Engineering Design 1.42 - - - - - 1.42
Subtotal 1.42 2.06 11.00 10.43 5.23 2.71 32.85
3 Property Connections
a. Civil Works - - 1.29 2.97 3.07 3.17 10.51
b. Detailed Engineering Design - - 0.07 0.15 0.16 0.16 0.54
c. Construction Supervision - - 0.04 0.09 0.10 0.10 0.33
Subtotal - - 1.40 3.22 3.33 3.44 11.38
4 Land Acquisition 1.91 - - - - - 1.915 Involuntary Resettlement - 0.03 0.15 0.14 0.07 0.03 0.42
T O T A L 3.97 3.92 20.19 17.78 8.62 6.18 60.66 Source: PPTA Consultant’s estimates.
F. Financial Analysis 1. Methodology and Assumptions. The financial analysis followed the guidelines described in ADB’s Financial Management and Analysis of Project (2005). Three indicators of the financial viability of the subproject have been identified:
• Financial Internal Rate of Return (FIRR). It is the discount rate at which the net revenues generated by the subproject are equal to zero. A project is considered financially viable if the computed FIRR is at least equal to the weighted average cost of capital (WACC) applicable to the proposed subproject;
• Tariff affordability. The wastewater tariff should be affordable to low income households.
• Subproject sustainability. The funds will be on-granted to the City; however, the subproject should still generate sufficient cash flow from wastewater tariffs to cover annual operations and maintenance requirements.
The key financial and technical assumptions used in the projections are the following:
• Cost estimates at constant October 2012 prices. • Domestic and foreign cost escalations30 are as follows:
30 ADB SERD, Domestic Cost Escalation Factors Update, October 2012 and World Bank projections as of September 2012 for international cost escalation factors.

TA 7993 - INO: Metropolitan Sanitation Management Investment Project – MSMIP Final Report 131
2013 2014 2015 2016 onwards Domestic cost escalation 5.1% 4.8% 4.4% 4.4% Foreign cost escalation 1.9% 2.2% 1.9% 1.8%
• Exchange rate at Rp9,600 to US$1.0031.
• Physical contingencies at 10% to 15% of direct costs. • Constant costs used in the computation of FIRR while current costs are used in the
financial statements. • Operation and maintenance (O&M) expenses based on technical projections and
escalated at 4.4% annually. • Number of property connections (9,000 domestic and 5,400 non-domestic) based on
plant capacity as presented in the technical evaluation. • Gross revenues equal to number of connections by type, multiplied by the
appropriate tariff. • Collection efficiency of 95%, based on the reported collection efficiency for similar
services (solid waste management). • Loan proceeds from ADB will be passed on by the Central Government to the City as
a grant (i.e. the Central Government will pay all principal and interest due on the loan).
• Makassar City will set up a Badan Layanan Umum Daerah (BLUD or Regional Public Service Agency) as the service delivery organization (SDO) to operate the wastewater system. A BLUD is a semi-autonomous service provider created for the provision of public service on a non-profit basis. Pending the establishment of the BLUD, a Unit Pelaksanaan Teknis Daerah (UPTD or Regional Technical Implementation Unit) is formed under the City’s Public Works Agency (DPU) to handle the preparatory, implementation and initial operational activities. a. Capital Costs
The total development cost for the subproject is $60.66 million equivalent. This is based on the costs presented in the technical study, plus physical and price contingencies.32
The basic development (investment) cost and the O&M costs are projected on an annual basis for the purpose of the financial analysis. The total costs include physical and price contingencies to allow for the timing of implementation, both for local and foreign cost components.
Acquisition of the land required for the subproject and detailed engineering design are scheduled in 2013 prior to construction works. Construction will start by the second half of year 2014 and is targeted to be completed by the end of 2018. Operations will commence in 2016, with full operations expected by 2019.
b. Operations and Maintenance
The proposed subproject is a new system and the SDO is a new entity, so there is no “without project” scenario. O&M costs are estimated by the technical engineers and are based on the capacity of the system. Included in O&M costs are personnel costs, chemicals for disinfection and dewatering of sludge, septage receival, sludge disposal, power cost, and
31 Bank of Indonesia. Average rate for period June to December, 2012.
32 To provide an effective wastewater treatment and collection service, the subproject will involve the construction of a wastewater treatment plant. trunk and main sewers, laterals and interceptors; installation of property connections; acquisition of land; and involuntary resettlement activities.

TA 7993 - INO: Metropolitan Sanitation Management Investment Project – MSMIP Final Report 132
provision for repairs and maintenance. At 2012 constant prices, O&M costs are estimated to be $0.397 million annually when full operation is achieved by 2019. O&M costs are likewise escalated to current prices in the financial statements.
c. Financing and Weighted Average Cost of Capital (WACC)
The WACC is derived based on the financing plan, with each fund source given an investment weight expressed as a percentage, multiplied by the corresponding interest rate of the fund source, and adjusted for the prevailing inflation rate. Details of the WACC computation are shown in the following table:
Table V-F 1: WACC Computation
ADB-OCR ADB-AIF INDII Govt Total
1. Amount ($ million) 13.03 26.06 1.85 19.73 60.66
2. Weighing 21.5% 43.0% 3.1% 32.5% 100.0%
3. Nominal cost 2.4% 3.8% 7.0% 7.0%
4. Tax Rate 10.0% 10.0% 10.0% 0.0%
5. Tax-adjusted nominal cost 2.2% 3.4% 6.3% 7.0%
6. Inflation rate 0.5% 0.5% 0.5% 5.1%
7. Real cost 1.7% 2.9% 5.8% 1.8%
8. Weighted component of WACC 0.4% 1.2% 0.2% 0.6% 2.4%
Weighted Average Cost of Capital (Real) 2.4%
Financing Component
d. Cost Recovery and Fees Affordability
It is recommended that the City Government enact local regulation mandating all premises within the areas provided with sewer pipelines to connect to the system in order to have an effective and sustainable sewerage system in the City. Mandatory connection is necessary to ensure adequate capacity utilization of the system and the realization of assumed improvements in public health and environment. The local regulation must also stipulate that all households and commercial establishments provided with sewer connections will pay mandatory monthly wastewater fees and these will be collected by the BLUD through community organizations or leaders. The loan proceeds will be on-granted from the Central Government to Makassar City. It was decided that tariffs should at least cover O&M costs for sustainability, provide the tariff per household is still affordable to the target beneficiaries. The proposed tariff structure classifies consumers as either domestic (i.e. households) or non-domestic (i.e. commercial and industrial connections), with non-domestic connections to be charged more to boost revenues. The proposed monthly fee is $1.50 per domestic connection and $7.50 per non-domestic connection. Tariffs are expected to be implemented in 2016 when operations commence, increasing 15% every two years to keep pace with inflation. The estimated average monthly household income for 2011 was Rp2,383,000 (equivalent to about $248) based on the results of the socio-economic survey conducted during the preparation of the City’s master development plan33. The $1.50 domestic tariff will be 0.50% of the monthly
33 INDII. 2011. Socioeconomic Survey Report on Domestic Wastewater Management and Wastewater Investment Program.

TA 7993 - INO: Metropolitan Sanitation Management Investment Project – MSMIP Final Report 133
household income, well within the 2% limit under DGHS’ policy for household wastewater charge.34 In all subsequent years, the domestic tariff is expected to remain below 1% of household income. It should be noted that the proposed tariff is equivalent to the tariff target beneficiaries indicated they were willing to pay. Initially it was assumed that domestic and non-domestic accounts would pay a one-time connection fee. City officials subsequently informed the study team that the City’s current intention is to charge non-domestic connections only a one-time connection fee of Rp1,650,000. Households will not be charged, to encourage them to do so. The investment cost includes the cost of connections, and as shown in the financing plan, this will be funded by the City Government from its own funds. 2. Result of Financial Analysis The FIRR of the subproject is measured as the discount rate that equalizes the present value cost stream associated with the project to the present value of the project’s benefit stream. A subproject is considered financially viable if the resulting FIRR is higher than the WACC applicable to the subproject. Sensitivity analysis is conducted under four scenarios such as a one-year delay in operation, a 10% increase in project cost, a 10% increase in O&M costs and a 10% decrease in revenues. The analysis shows that full recovery of the cost of the wastewater system and O&M costs through tariffs alone is not possible, due to affordability constraints and very low willingness to pay for this kind of service. Two scenarios were evaluated: Scenario 1 with tariffs equivalent to the tariff target beneficiaries indicated they were willing to pay and sufficient to cover O&M costs resulting in a positive cash flow (but not sufficient to cover depreciation); and Scenario 2 with full cost recovery of investment and O&M costs. The following table shows the tariffs required for each category and results as to affordability, FIRR, net income and cash flow:
Table V-F 2: Summary Result of Evaluation
Proposed monthly fee
per HH connection
a
Affordability over 10-year projection period
b
FIRR Net Income after
depreciation
Cash Flow
Partial Cost Recovery (to cover O&M and equivalent to willingness to pay)
$1.50 0.50%to 0.60%
-0.84% Negative Positive No subsidy required
Full Cost Recovery $5.80 2.20% to 2.70%
8.67% Positive Positive No subsidy required.
a Monthly fees are proposed to be increased by 15% every two years.
b Monthly fee as a percentage of average monthly household income. The percentage range represents the
minimum and maximum percentages during the 10-year projection period.
It is recommended that the wastewater fees should at least cover O&M costs to result in a positive cash flow for the SDO. Partial cost recovery ($1.50 per household connection and $7.50 per non-domestic connection) should be the minimum objective since if fees are lower, a significant subsidy from the City Government will be required to make the operation sustainable.
34 INDII. 2011. Wastewater Investment Master Plan Package 1: Makassar.

TA 7993 - INO: Metropolitan Sanitation Management Investment Project – MSMIP Final Report 134
The FIRR results for the recommended partial cost recovery option are provided in the following table:
Table V-F 3: Summary Result of Financial Evaluation
NPV ($ m) FIRR (%) SI % Change SV
Base case (19.85) -0.8%
1-Year Delay in Operation (22.35) -1.3% -6.00 10% -17%
Capital cost plus 10% (24.39) -1.3% -5.95 10% -17%
O & M costs plus 10% (20.56) -1.0% -1.51 10% -66%
Revenues less 10% (23.11) -1.5% -8.19 10% -12%
FIRR = financial internal rate of return, NPV = net present value SI = sensitivity indicator (ratio of % change in EIRR to % change in a variable) SV = switching value (% change in variable required for EIRR to fall below cut-off rate)
3. Project Financial Sustainability and Implementation Risks
a. Financial Projections for SDO
The financial sustainability and performance of BLUD, the operating entity, was projected over the ten years immediately following full system operation in 2019. The BLUD’s projected financial statements (balance sheet, income statement and cash flow statement for the period 2013 to 2025) are summarized and presented in Tables V-F 5 and V-F 6. Selected financial ratios and performance indicators were used to analyse the results of operations and project viability. Several risks which may impact the BLUD’s financial performance including:
• Uncertainty regarding the implementation of tariff increases; • Uncertainty on the provision of public service obligation or PSO35 for O&M
costs, as maybe required; • Inadequate resources for counterpart funding; and • Inefficiency of its collections.
Tariffs must be periodically raised to keep pace with inflation (the projections assumed tariffs increase by 15% every two years), and the City Government’s approval is required for these increases. If tariffs are not periodically increased, the City Government must provide a support fund or subsidy to ensure its financial sustainability. These factors should be properly addressed to mitigate the risks enumerated above. The projected revenues were based on the projected increase in the number of connections multiplied by the monthly wastewater service fees, initially $1.50 and $7.50 for domestic and non-domestic consumers, respectively. O&M costs were assumed at current prices. The projected income statements show that the wastewater fees can adequately cover the costs of O&M even during the initial operating stage. From 2019 onwards, assuming 95% collection efficiency, results of operations will further improve with an average net income before depreciation of $0.42 million per year.
35 Public Service Obligation (PSO) is a form of subsidy provided by the City Government to the SDO.

TA 7993 - INO: Metropolitan Sanitation Management Investment Project – MSMIP Final Report 135
Net losses arise as revenues are insufficient to cover the full depreciation cost of the system. Depreciation expense is estimated at $2.43 million per year based on straight line computation and assuming an estimated useful life of 25 years. The projected balance sheet for the ten-year period includes the projected assets, liabilities and equity, as presented in Table V-F 4. Total fixed assets reflect mainly the project cost of $60.69 million, comprising roughly 98% of total assets. The debt to equity ratios are expected to be low as the proceeds of the project are on-granted from the Central Government to the City Government. The SDO’s liquidity position has an average ratio of 9:1. Selected financial ratios are presented in the financial statements. Projected cash flows were also developed and showed positive cash balances all throughout the projection period as shown in Table V-F 6. Collection efficiency is assumed at 95% with average collection period of 15 days, providing for cash sufficiency for operations and maintenance.

TA 7993 - INO: Metropolitan Sanitation Management Investment Project – MSMIP Final Report 136
Table V-F 4: Projected Income Statement ($ million)
2016 2017 2018 2019 2020 2021 2022 2023 2024 2025
Operating Revenues
Water Sales 0.113 0.340 0.652 0.689 0.836 0.857 0.986 0.986 1.133 1.133
Domestic 0.016 0.049 0.093 0.130 0.193 0.214 0.246 0.246 0.283 0.283
Institutional 0.000 0.000 0.000 0.000 0.000 0.000 0.000 0.000 0.000 0.000
Commercial 0.097 0.292 0.559 0.559 0.643 0.643 0.739 0.739 0.850 0.850
Other Operating Revenues 0.233 0.465 0.465 0.094 0.094 0.086 0.099 0.099 0.113 0.113
Total Revenues 0.346 0.805 1.117 0.783 0.929 0.943 1.084 1.084 1.247 1.247
Operating Expenses
Payroll 0.085 0.102 0.121 0.128 0.134 0.141 0.148 0.156 0.164 0.172
Power Cost 0.050 0.088 0.129 0.136 0.143 0.150 0.158 0.166 0.174 0.183
Chemicals 0.000 0.000 0.000 0.000 0.000 0.000 0.000 0.000 0.000 0.000
Maintenance 0.041 0.082 0.126 0.132 0.139 0.146 0.153 0.161 0.169 0.178
Other O & M 0.127 0.142 0.159 0.167 0.175 0.184 0.194 0.203 0.214 0.225
Bad Debts 0.000 0.000 0.000 0.000 0.001 0.001 0.001 0.001 0.001 0.001
Total 0.304 0.414 0.535 0.563 0.592 0.622 0.654 0.687 0.722 0.759
Net Income (Loss) before depreciation 0.042 0.391 0.582 0.220 0.338 0.321 0.430 0.397 0.524 0.488
Depreciation 0.917 2.007 2.303 2.426 2.426 2.426 2.426 2.426 2.426 2.426
Net Operating Income (Loss) (0.875) (1.616) (1.721) (2.206) (2.089) (2.106) (1.996) (2.029) (1.902) (1.939)

TA 7993 - INO: Metropolitan Sanitation Management Investment Project – MSMIP Final Report 137
Table V-F 5: Projected Balance Sheet ($ million)
2013 2014 2015 2016 2017 2018 2019 2020 2021 2022 2023 2024 2025
ASSETS
Fixed Assets
Fixed Assets in Operation 0.000 0.000 0.000 45.859 54.484 60.662 60.662 60.662 60.662 60.662 60.662 60.662 60.662
Less: Accum. Depreciation 0.000 0.000 0.000 0.917 2.924 5.227 7.653 10.080 12.506 14.933 17.359 19.786 22.212
Net Fixed Assets in Operation 0.000 0.000 0.000 44.942 51.560 55.435 53.008 50.582 48.155 45.729 43.302 40.876 38.450
Add: Work-in-Progress 3.965 7.883 28.075 0.000 0.000 0.000
Total Fixed Assets 3.965 7.883 28.075 44.942 51.560 55.435 53.008 50.582 48.155 45.729 43.302 40.876 38.450
Current Assets
Cash 0.000 0.000 0.000 0.039 0.401 0.928 1.061 1.326 1.560 1.909 2.212 2.646 3.026
Accounts Receivable (net) 0.000 0.000 0.000 0.000 0.011 0.034 0.066 0.072 0.090 0.093 0.108 0.108 0.124
Inventory 0.000 0.000 0.000 0.000 0.007 0.014 0.021 0.022 0.023 0.024 0.026 0.027 0.028
Other Current Assets 0.000 0.000 0.000 0.015 0.019 0.024 0.025 0.027 0.028 0.029 0.031 0.032 0.034
Total Current Assets 0.000 0.000 0.000 0.053 0.439 1.000 1.173 1.446 1.701 2.055 2.376 2.813 3.213
Reserves 0.000 0.000 0.000 0.003 0.020 0.053 0.108 0.175 0.244 0.322 0.401 0.492 0.583
TOTAL ASSETS 3.965 7.883 28.075 44.999 52.019 56.487 54.290 52.203 50.100 48.107 46.080 44.181 42.245
LIABILITIES AND EQUITY
Current Liabilities
Accounts Payable 0.000 0.000 0.000 0.015 0.026 0.038 0.046 0.049 0.051 0.054 0.056 0.059 0.062
Total Current Liabilities 0.000 0.000 0.000 0.015 0.026 0.038 0.046 0.049 0.051 0.054 0.056 0.059 0.062
Equity
Donated Capital 3.965 7.883 28.075 45.859 54.484 60.662 60.662 60.662 60.662 60.662 60.662 60.662 60.662
Retained Earnings 0.000 0.000 0.000 (0.875) (2.491) (4.212) (6.418) (8.507) (10.613) (12.609) (14.638) (16.540) (18.479)
Total Equity 3.965 7.883 28.075 44.984 51.993 56.450 54.244 52.155 50.049 48.053 46.023 44.121 42.183
TOTAL LIABILITIES AND EQUITY 3.965 7.883 28.075 44.999 52.019 56.487 54.290 52.203 50.100 48.107 46.080 44.181 42.245
0.000 0.000 0.000 0.000 0.000 0.000 0.000 0.000 0.000 0.000 0.000 0.000 0.000

TA 7993 - INO: Metropolitan Sanitation Management Investment Project – MSMIP Final Report 138
Table V-F 6: Projected Cash Flow Statement ($ million)
2013 2014 2015 2016 2017 2018 2019 2020 2021 2022 2023 2024 2025
Sources of Cash
Collection of Revenues - CY - - - 0.113 0.329 0.618 0.623 0.763 0.767 0.893 0.878 1.026 1.009
Collection of Receivables - PY - - - - - 0.011 0.034 0.066 0.072 0.090 0.093 0.108 0.108
Other Receipts - - - 0.233 0.465 0.465 0.094 0.094 0.086 0.099 0.099 0.113 0.113
Grant Funds - INDII 3.965 0.505 3.875 5.239 4.137 3.856 -
Central Government 0.206 0.475 2.466 2.202 1.075 0.728
INDII 1.852 - - - - -
City Government 1.908 0.030 1.409 3.036 3.061 3.128
Proceeds of Loan - 3.413 16.318 12.545 4.488 2.322
ADB-OCR 1.138 5.439 4.182 1.496 0.774
ADB-AIF 2.275 10.878 8.363 2.992 1.548
Total Sources of Cash 3.965 3.918 20.192 18.130 9.419 7.272 0.751 0.923 0.925 1.081 1.069 1.246 1.230
Uses of Cash
Project Investment 3.965 3.918 20.192 17.784 8.625 6.178
O & M Expenses and Working Capital - - - 0.304 0.414 0.535 0.563 0.592 0.622 0.654 0.687 0.722 0.759
Reserves - - - 0.003 0.017 0.033 0.055 0.067 0.069 0.079 0.079 0.091 0.091
Total Uses of Cash 3.965 3.918 20.192 18.091 9.056 6.746 0.618 0.659 0.690 0.733 0.766 0.813 0.850
Increase(Decrease) in Cash - - - 0.039 0.363 0.527 0.133 0.265 0.234 0.349 0.304 0.434 0.381
Add: Cash Balance, Beg. - - - - 0.039 0.401 0.928 1.061 1.326 1.560 1.909 2.212 2.646
Cash Balance, End. - - - 0.039 0.401 0.928 1.061 1.326 1.560 1.909 2.212 2.646 3.026

TA 7993 - INO: Metropolitan Sanitation Management Investment Project – MSMIP Final Report 139
4. Municipal Finance
Currently, the City’s Public Works Agency (DPU) has the responsibility for infrastructure development in the city. Located within DPU is a section responsible for wastewater. Funding of its capital investments and O&M costs come from the City Government’s annual budget. The DPU prepares an annual program and the annual budget ceiling is consolidated into the City Government’s annual budget with actual budget allocation dependent on the City Government’s environmental sanitation priorities and projects.
Historical Income and Expenditures
Aside from fund transfers from the Central Government, major sources of the City Government’s local source revenues (PAD) during the period 2008-2012 were local taxes and service income. With the enactment of Law No. 28/2009, effective 1 January 2011, taxes on transfers of ownership of land and building (BPHTB) are now administered by the City Government as local source revenue (i.e. no longer shared revenues (Dana Bagi Hasil)). Taxes on land and buildings (PBB) will be treated as local source revenues effective 31 December 2013 at the latest. Historical data on the city’s financial performance is presented in Table V-F 7.
Projected Income and Expenditures Individual revenue and expenditure items have been projected using historical trends and best estimates of local officials. When the City Government takes full control of the land and building tax administration (i.e. from both PBB and BPHTB), the City Government’s revenues are expected to increase significantly. The surplus projected in the short term is assumed to be available for some of the investments required for improved urban sanitation services. Surplus income can be used by the City Government to finance the PSO that the City Government will be required to provide to the SDO responsible for sanitation (including O&M and periodic major capital expenditures). Table V-F 8 presents income projections before MSMIP. From this, the requirements of MSMIP in terms of equity for the investment amounting to $12.55 million were included. The evaluation shows that the City Government will have sufficient funds to cover the equity requirement of the subproject.

TA 7993 - INO: Metropolitan Sanitation Management Investment Project – MSMIP Final Report 140
Table V-F 7 HISTORICAL MUNICIPAL FINANCE - MAKASSAR
FISCAL YEARS 2007 - 2012
(In Million Rupiah)
Items 2007 2008 2009 2010 2011 2012 '07 - '08 '08 - '09 '09 - '10 '10 - '11 '11 - '12 Average
Revenue 945,541 1,141,052 1,215,718 1,449,663 1,728,570 1,768,525 1.21 1.07 1.19 1.19 1.02 1.16
Local Revenue 136,626 154,912 170,699 210,136 351,693 372,840 1.13 1.10 1.23 1.67 1.06 1.29
Local tax 85,997 98,319 115,223 133,552 270,548 286,218 1.14 1.17 1.16 2.03 1.06 1.16
Retribution 37,972 40,966 39,981 59,729 62,043 67,962 1.08 0.98 1.49 1.04 1.10 1.03
Income of Local Equity 3,919 4,358 5,666 5,818 6,355 6,787 1.11 1.30 1.03 1.09 1.07 1.13
Others 8,738 11,269 9,829 11,038 12,746 11,873 1.29 0.87 1.12 1.15 0.93 1.11
Transfer from Central Government) 706,531 794,525 902,799 1,051,707 1,168,801 1,100,807 1.12 1.14 1.16 1.11 0.94 1.13
Tax Revenue 104,874 123,594 142,662 170,552 124,804 136,354 1.18 1.15 1.20 0.73 1.09 1.07
Natural Resources 4,201 2,337 721 708 1,690 0.56 0.31 0.98 2.39 0.00 1.06
General allocation fund 583,842 643,328 647,300 644,266 718,481 911,123 1.10 1.01 1.00 1.12 1.27 1.07
Special allocation fund 8,535 19,993 43,151 45,754 60,898 32,644 2.34 2.16 1.06 1.33 0.54 1.94
Autonomy fund 5,079 5,273 68,965 190,427 262,928 20,686 1.04 13.08 2.76 1.38 0.08 1.73
From Province & Other 102,384 191,615 142,220 187,819 208,077 205,239 1.87 0.74 1.32 1.11 0.99 1.26
Grant 5,417 3,088 1,559 650 971 0.57 0.50 0.42 1.49 0.00 0.75
Tax Revenue from Province 83,268 128,140 115,012 155,704 166,494 167,247 1.54 0.90 1.35 1.07 1.00 1.21
Others 13,698 60,387 25,648 31,465 40,611 37,991 4.41 0.42 1.23 1.29 0.94 1.84
Municipal Saving (from budget surplus previous year) 89,639
Expenses 874,885 1,139,994 1,241,043 1,378,034 1,711,878 1,768,525 1.30 1.09 1.11 1.24 1.03 1.19
Operating Expenses 734,945 954,288 1,043,863 1,200,551 1,541,329 809,447 1.30 1.09 1.15 1.28 0.53 1.21
Employees 491,041 622,134 700,510 817,606 1,072,077 772,397 1.27 1.13 1.17 1.31 0.72 1.22
Goods 196,025 236,173 301,449 329,417 406,496 1.20 1.28 1.09 1.23 0.00 1.20
Interest 1,243 - - 2,120 - 8,446 0.00 0.00 0.00
Subsidy 4,425 1,728 1,125 - - 0.39 0.65 0.00 0.52
Grant 3,500 61,599 23,305 25,176 35,578 18,292 17.60 0.38 1.08 1.41 0.51 5.12
Social/Finance Assistance 38,710 32,654 17,474 26,233 27,178 6,311 0.84 0.54 1.50 1.04 0.23 0.80
Contingencies 4,000
Capital Expenses 139,940 185,705 197,181 177,483 170,549 959,078 1.33 1.06 0.90 0.96 5.62 1.06
Land 5,732 9,215 939 294 6,404 1.61 0.10 0.31 21.77 0.00 0.67
Machine & Equipment 32,938 56,343 50,012 38,896 51,704 1.71 0.89 0.78 1.33 0.00 1.13
Building 28,803 51,074 42,013 40,326 30,780 1.77 0.82 0.96 0.76 0.00 1.19
Road, Irrigation. Network 70,367 66,160 98,647 95,162 64,404 0.94 1.49 0.96 0.68 0.00 1.13
Other Asset 2,101 2,913 5,570 2,805 17,258 1.39 1.91 0.50 6.15 0.00 1.27
Surplus/(Deficit ) Before MSMIP (Rp mil) 70,656 1,058 (25,326) 71,628 16,692 (0) 0.01 -23.94 -2.83 0.23 0.00 -6.63

TA 7993 - INO: Metropolitan Sanitation Management Investment Project – MSMIP Final Report 141
Table V-F 8
MUNICIPAL FINANCE PROJECTION - MAKASSAR
FISCAL YEARS 2013 - 2025
(In Million Rupiah)
Items 2013 2014 2015 2016 2017 2018 2019 2020
Revenue 2,001,332 2,236,590 2,525,875 2,815,196 3,139,708 3,453,678 3,799,046 4,178,951
Local Revenue 433,097 503,259 584,985 680,217 791,230 870,353 957,388 1,053,127
Local tax 329,151 378,524 435,303 500,598 575,688 633,256 696,582 766,240
Retribution 81,555 97,866 117,439 140,927 169,112 186,023 204,626 225,088
Income of Local Equity 8,144 9,773 11,728 14,073 16,888 18,576 20,434 22,477
Others 14,247 17,096 20,516 24,619 29,543 32,497 35,747 39,321
Transfer from Central Government) 1,324,679 1,445,351 1,600,029 1,760,031 1,936,034 2,129,638 2,342,602 2,576,862
Tax Revenue 190,896 209,985 230,984 254,082 279,491 307,440 338,184 372,002
Natural Resources 1,859 1,952 2,050 2,255 2,481 2,729 3,001 3,302
General allocation fund 1,047,791 1,100,181 1,155,190 1,270,709 1,397,780 1,537,558 1,691,313 1,860,445
Special allocation fund 48,966 73,450 110,175 121,192 133,311 146,642 161,307 177,437
Autonomy fund 35,166 59,782 101,630 111,793 122,973 135,270 148,797 163,677
From Province & Other 243,555 287,980 340,862 374,948 412,443 453,687 499,056 548,962
Grant 1,068 1,175 1,292 1,422 1,564 1,720 1,892 2,081
Tax Revenue from Province 200,697 240,836 289,003 317,904 349,694 384,664 423,130 465,443
Others 41,790 45,969 50,566 55,623 61,185 67,304 74,034 81,438
Municipal Saving (from budget surplus previous year)
Expenses 1,967,268 2,195,484 2,451,540 2,738,973 3,061,782 3,367,623 3,704,386 4,074,824
Operating Expenses 1,295,913 1,423,426 1,563,673 1,717,926 1,887,578 2,075,999 2,283,599 2,511,959
Employees 849,636 934,600 1,028,060 1,130,866 1,243,953 1,368,348 1,505,183 1,655,701
Goods 418,690 460,560 506,615 557,277 613,005 674,305 741,736 815,909
Interest 1,942 1,533 1,124 717 306
Subsidy 0 0 0 0 0 0 0 0
Grant 19,207 20,167 21,176 22,235 23,346 25,681 28,249 31,074
Social/Finance Assistance 6,438 6,566 6,698 6,832 6,968 7,665 8,432 9,275
Contingencies
Capital Expenses 671,355 772,058 887,867 1,021,047 1,174,204 1,291,624 1,420,787 1,562,865
Surplus/(Deficit ) Before MSMIP (Rp mil) 34,064 41,106 74,336 76,223 77,926 86,055 94,661 104,127
Surplus/(Deficit ) Before MSMIP ($ mil) 3.55 4.28 7.74 7.94 8.12 8.96 9.86 10.85
Required subsidy for MSMIP 1.908 0.03 1.41 3.04 3.06 3.13 0.00 0.00
Surplus/(Deficit ) After MSMIP ($ mil) 1.64 4.25 6.33 4.90 5.06 5.84 9.86 10.85

TA 7993 - INO: Metropolitan Sanitation Management Investment Project – MSMIP Final Report 142
G. Economic Analysis
1. Scope of analysis Economic analysis was undertaken for the proposed investments in off-site sewerage system in Makassar City. The proposed investments include: (i) a piped network of trunk sewers, main sewers, laterals and interceptors, including property connections, for collecting wastewater from sources within the subproject coverage area36, and (ii) a 19.1MLD centralized wastewater treatment plant in Losari area. The economic analysis includes an evaluation of the economic feasibility of the proposed subproject and the impact of changes in key variables on the economic feasibility of the investments. The analysis also includes an analysis of the distribution of economic benefits to stakeholders, including the poor.
2. Economic costs and benefits
Economic costs and benefits are expressed in constant October 2012 prices using domestic price numeraire. Costs include capital investments for the piped sewerage network, centralized treatment plant, land, resettlement and O&M costs. The economic benefits considered in the analysis consist, among others, of (i) savings in health care costs for major sanitation-related diseases in the city such as diarrhea, typhoid and dengue as a result of reduced morbidity incidence due to improved wastewater management, (ii) avoided loss of income or productivity savings, (iii) avoided costs of desludging/constructing septic tanks, and (iv) averted costs of accessing polluted water for drinking and other domestic uses. The economic analysis was performed over a period of 25 years, including 5 years of investment implementation. Civil works construction was assumed to commence in 2014, with benefits starting to accrue in 2016.
Financial investments at constant price amount to approximately Rp625.5 billion, of which 21% is for the treatment plant, 71% for sewer network, and the remainder for land and related investments. By excluding taxes/duties and applying a CF of 0.91, the total economic cost of the proposed subproject was estimated at about Rp512.3 billion.
3. Valuation of economic benefits
The economic benefits of the proposed sewerage system which were considered in the analysis and the bases for their valuation are as follows (see Annex B – Financial and Economic Analysis):
a. Health benefits. Providing improved wastewater collection, treatment and disposal facilities is expected to reduce the incidence of sanitation-related diseases which leads to reduced costs of medical treatment and related health care services. The analysis considered diarrhea/gastroenteritis, typhoid and dengue which are among the major morbidity cases in the city. Valuation of health benefits was based on the incidence rate of the diseases, average cost of treatment, the proportion of cases seeking medical treatment in existing medical care facilities, and the average duration of illness. In Makassar City, the average cost of hospital treatment of diarrhea was assumed at Rp222,000/ patient/day37 while for non-severe cases that do not require hospitalization, the cost is around Rp80,000/day. For typhoid and dengue, the respective costs are Rp272,000 and
36 Subproject coverage area includes five of the fourteen kecamatans comprising Makassar City, i.e., Mariso,
Mamajang, Tamalate, Makassar and Ujung Pandang. 37
In the absence of treatment cost data for these specific diseases in Makassar, cost data from Cimahi City were assumed.

TA 7993 - INO: Metropolitan Sanitation Management Investment Project – MSMIP Final Report 143
Rp377,000/day. Reduction in the incidence of the disease was assumed at 35%38. The present value (PV) of health care cost savings within the subproject area over the 25-year period was estimated at Rp43.9 billion.
b. Avoided loss of income/productivity savings. People afflicted with the
disease, especially involving severe cases, are kept out of work and other daily activities which results in loss of income or productivity. The economic impact of illness becomes critical especially when the patient is the sole or major income earner in the family. Reduced morbidity reduces loss of income/productivity. The value of this benefit was computed based on the proportion of patients who are economically active and the compensation that the person receives for being on the job or is actively engaged in income generation. Compensation was based on the minimum wage in the city. For in-patients, total loss of income also includes the foregone income of household member(s) who provides care while the patient is confined in the hospital/clinic. It was assumed in the analysis that one household member assumes this role. Valuation of the additional foregone income also takes into account the number of day that the patient is sick, employment rate and average income of the person involved. PV of this benefit in Makassar City was estimated at Rp27.5 billion.
c. Avoided costs of desludging/constructing septic tanks. This benefit is
generated because once a property is connected to the sewerage network it foregoes the need for regular desludging of the septic tank. The current cost of desludging septic tanks in Makassar City is Rp250,000 per service.39 Desludging frequency was assumed at once every three years.40 For properties with no septic tanks but are connected to the sewerage system, the amount that is saved for not constructing a septic tank is an added benefit of the subproject. Septic tank costs about Rp3.0 million. The present value of this benefit was computed at around Rp14.5 billion.
d. Averted costs of accessing polluted water for drinking/domestic use.
Unabated pollution of water sources because of uncontrolled and improper disposal of wastewater, including human excreta, correspondingly increases the cost of water especially for drinking and other domestic uses. Pollution leads to avertive behavior on the part of water users either through the use of more costly technologies to improve water quality, increased treatment or resort to alternative supplies (e.g., bottled water) which generally costs higher. This benefit was valued by estimating the total cost of water for both PDAM and non-PDAM users based on consumption rate, price of piped and non-piped water and attribution rate of pollution to total cost of water. In South Sulawesi, domestic sources of pollution such as households, commercial and institutional establishments have been assessed to contribute 51% to overall water pollution, with industry contributing 40% and agriculture, about 8%41. Based on these assumptions, the PV of total averted costs over 25 years was estimated at approximately Rp473.2 billion.
38 Based on WHO data which estimated morbidity reduction rate for diarrhea of 22.7%-37.5% due to improved
excreta disposal. A survey and review of literature conducted by Esrey, et. al. also showed a 36% reduction in diarrhea incidence because of improved water supply and sanitation (Esrey, S.A, Potash, J.B. Roberts, and Shiff, C. Health Benefits for Improvements in Water Supply and Sanitation–Survey and Analysis of Literature on Selected Diseases, WASH Technical Report No. 66. 39
Local Regulation of Makassar City on Hygiene and Waste Management, 2011. 40
Based on SNI 03-2001: Tata Cara Perencanaan Tangki Septik Dengan Resapan, 2001. 41
World Bank Water and Sanitation Program, Economic Impacts of Sanitation in Indonesia, August 2008.

TA 7993 - INO: Metropolitan Sanitation Management Investment Project – MSMIP Final Report 144
4. Un-quantified benefits
There are other economic benefits of improved wastewater management system which were not included in the analysis for of lack of data and difficulty of valuing their respective economic impact. These un-quantified benefits include, among others, the following:
a. Health care cost savings from reduced incidence of other sanitation-related diseases
(e.g., skin diseases); b. Value of sludge derived from the wastewater treatment process for use in agriculture
either as soil conditioner or fertilizer; c. Increased agricultural productivity and value of fish catch due to reduced water
pollution; d. Increased value of land previously made unusable or rendered marginally productive
because of pollution; and e. Impact of improved wastewater management and reduced pollution on local tourism
and economy. 5. Results of the economic analysis
Under the “base case”, the estimated economic internal rate of return (EIRR) of the proposed investments exceeds the assumed 12% economic opportunity cost of capital (EOCC), hence, the subproject is deemed economically feasible (Table IV-G 1). The total present value of net economic benefits (ENPV) amounts to Rp90.2 billion.
Table IV-G 1: Results of Economic Analysis (Base Case)
Subproject EIRR (%)
ENPV (Rp billion)
Makassar sewerage system 15.8 90.2
EIRR = economic internal rate of return, ENPV = economic net present value
6. Sensitivity analysis
Sensitivity tests assuming (i) a 10%-increase in capital investments, (ii) a 10%-increase in O&M costs, (iii) a 10%-reduction in total benefits, (iv) one-year delay in benefits, and (v) combination of the first three scenarios indicate that the subproject remains economically feasible with EIRR remaining above the minimum threshold. Underan adverse condition where both capital investments and O&M simultaneously increase by 10% while total benefits fall 10% lower than initially estimated, the subproject’s EIRR is 12.5%. The investments’ economic viability remains robust in all scenarios considered (Table IV-G 2).

TA 7993 - INO: Metropolitan Sanitation Management Investment Project – MSMIP Final Report 145
Table IV-G 2: Results of Sensitivity Analysis
Case
Change from Base Case (%)
EIRR (%)
ENPV (Rp billion)
Switching Value (%)
Capital investment O&M costs Total benefits 1-yr delay in benefits Combination (Cases 1, 2, 3)
+10 +10 -10
14.2 15.7 13.9 13.5 12.5
55.8 88.7 45.6 38.7
9.6
+23
+609 -20
-
-
EIRR = economic internal rate of return, ENPV = economic net present value, O&M = operation and maintenance.
The sensitivity analysis also indicates that the investments are most sensitive to reductions in total benefits, followed closely by increases in capital costs or investment cost overruns. Changes in O&M costs were found to have very little impact on the economic feasibility of the investments.
7. Distribution of benefits
The sewerage system investments will directly benefit a total of about 39,600 people (9.000 households) and 5,405 commercial establishments within the subproject coverage area.
Households and commercial establishments are therefore the principal direct beneficiaries of the subproject. In addition to the afore-mentioned beneficiaries is Makassar City government itself, through its service delivery organization (SDO). Of the estimated total economic benefits of Rp589.5 billion, 75% (consisting of health and productivity savings, averted cost of accessing clean water, and cost savings from desludging/constructing septic tanks) will directly accrue to households. Commercial establishments will gain 20% of the benefits in terms of averted costs of accessing clean water and cost savings on septic tank maintenance. About 5% of the benefits will go to SDO in the form of service payments from those that are connected to the system and avail of the wastewater treatment service.
The poverty impact ratio (PIR) of the investments is 28%, which means that about a quarter of the total subproject benefits will accrue to the poor. H. Gender Analysis and Gender Action Plan
1. Background and Objective
A gender-responsive project such as the MSMIP is one that involves an understanding of issues and problems from the perspectives of both men and women in the development process. Mainstreaming gender entails the integration of a gender perspective in the project design. Thus, a Gender Analysis is undertaken for ADB projects to identify project design elements that will enable women to participate in and benefit from the Project. It is identified factors that have the potential to exclude women from participating in or benefiting from the Project. Data for this analysis are obtained from available material from socio-economic surveys that were prepared during the preparation of a Master Plan for Wastewater Management. Focus Group Discussion was also conducted with women. Based on available data, gender analysis shall look into gender issues and differences in the roles and responsibilities of women and men, their participation in social and economic life and the

TA 7993 - INO: Metropolitan Sanitation Management Investment Project – MSMIP Final Report 146
differential impacts on their lives of sanitation programs and services. Further assessment is needed based on these. 2. Gender Characteristics
The total HH sample interviewed was 333 households, 8% of which were headed by women. About 38% of the respondents have graduated high school. The percentage of respondents with education higher than the high school level is 59%. Sex disaggregation of data was not undertaken for Makassar but most survey respondents were women.42 3. Institutional Gender Assessment In the poor income communities, informal institutions exist that are close to the community. These are RT/RW as an administrator of the population; LPM & BKM are informal institutions that manage programs and accommodates community proposals, and cadre - PKK (with women's or mother's role in environmental activities), and the Taqlim Assembly (religious organization in the community). A gender assessment was undertaken for PU and partners agencies in the Sanitation Pokja. Central Government Budget for Income and Expenditure (APBN) and Local Government Budget for Income and Expenditure (APBD) is available for gender mainstreaming. For Sanitation Pokja members, gender focus is provided by the Social Institution (Dinas Sosial) and the Female Empowerment and Family Planning Board (BPPKB Badan Keluarga Berencana dan Pemberdayaan Perempuan). At the Public Work Institution, (PU), there are 65% (228 person) male and 35% (122 person) female staff; 25% were in management positions. There is no gender focal person or programs but there is a claim of no gender differentiation in terms of employment opportunities; criteria for hiring and promotion are based on merit. It is said that women dominated in all activities such as socialization, cadres training and training on sanitation management. The PU would support gender mainstreaming. There is budget that can be accessed from the Central Government Budget for Income and Expenditure (APBN) and Local Government Budget for Income and Expenditure (APBD). Feedback was obtained from PU, the executing agency, on possible pro-poor measures for the project. It is the idea that house connection would not be free of charge. There was agreement that subsidies may be given for connection and monthly fees. This will depend on income class. There is a belief that low income households may produce smaller volumes of waste water than families in middle/high income levels. Proposed tariffs will be studied and regulated in the Regional Regulation (Peraturan Daerah) for 2013. Now the draft (clausal) is being discussed with the Local Legislative Body (DPRD). Setting of minimum charges on Waste Water Expenditure/Fees will be set as a Major Regulation (Peraturan Walikota) in 2013.
42 Additional/comparative data are included in the Poverty and Social Analysis, Annex D of the MSMIP Final Report.

TA 7993 - INO: Metropolitan Sanitation Management Investment Project – MSMIP Final Report 147
4. Participation in Sewerage and Sanitation Improvement
The respondent RTs were divided over their perceptions of the Wastewater Investment Program. However, majority of the responses were on the affirmative side since 64% agreed as against 18% were very agreed on program implementation. Fifteen per cent was neutral with only 2% disagreeing to connect. Less than 1% had no idea about sanitation project and did not know whether they would participate. The willingness to connect denotes the respondents’ willingness to use wastewater management services under the program. On this aspect, the survey showed that 81% agreed to have their connections vis-à-vis the 19% who do not want to use the services. Such answers were shown in the main report with varied percentages of agreement and disagreement by cluster of the RTs. The RTs who disagreed to be connected have cited the following reasons: (i) they do not want to pay for something which belong to other people because they are only renters of the house; (ii) the respondent renters have no right to make permanent change on the house and facilities; and (iii) low income level seems the main constraint to come up with a decision to connect to waste water management system as it entails expenses. Related to willingness-to-connect where the majority had expressed that they are willing to connect to wastewater management services, 95% of the RTs surveyed would be willing to pay for the services. Only 5% did not agree to avail of the services for a fee, citing the following reasons: (i) monthly payment for the service will be a burden to their monthly expenditure due to their limited incomes; and (ii) they would only connect to the system if the service is free of charge. As to the amount the RTs who agreed that they are willing to pay, the prices range at below Rp 7,500 – 20,000. More than 50% of the respondents who expressed their willingness to pay placed the average amount of service fee at Rp 7,500 per month.
5. Sanitation Hot Spots
The areas around the proposed site for the WWTP site in Sambala, have informal settlements and rental properties. There are inadequate sanitation facilities. Many are renters who cannot make capital improvements on the property. While there is a need for improved sanitation, the WWTP site is outside the sewerage service area.
6. Willingness to Contribute for Sanitation Improvement Activities
From social survey revealed that most respondent (63.66%) agree with the program implementation. This is an indication of a good program acceptance which in line with respondent perception on the program importance.
Society is able to receive information about programs for improving sanitation facilities, especially wastewater treatment planned off-set system. It has recognized the need for sanitation in improving the quality of life and it is willing to participate in improving sanitation. However, the community needs more socialization of the communal sanitation improvement program, network service system with regard to cost and retribution related to the program. 7. Perceived Benefits and Concerns
Feedback from community respondents show that they realized the need for raising the standards of their sanitation in improving their quality of life, so they are willing to participate

TA 7993 - INO: Metropolitan Sanitation Management Investment Project – MSMIP Final Report 148
in improving sanitation. However, the community needs more information and socialization about the sanitation improvement program and how it will affect the community. The respondents were keen to find out more about the network service system with regard to cost and distribution related to the program. They expressed the sentiment that there is a need for in-depth community participation with regard to the connection process. Some community members saw an employment opportunity as workers at the sewerage development and implementation stages. 8. Gender Analysis and Strategy
Lack of awareness by men and especially women and satisfaction on existing sanitation services is seen as a constraint to achieving high rates of sewerage connection. Increased hygiene and sanitation information is perceived as a help which is consistent with the designation of hygiene and sanitation awareness as a component of the project. Joint sanitation awareness planning puts a focus on collective decision-making strategies and mobilizing authorities and stakeholders for sustained behavior change on hygiene and sanitation. It is designed to influence social acceptance for sewerage connection and behavior change on sanitation not only within the project site but the entire city as well. Affordability is perceived as a bar to participation if this means a high connection cost or monthly bill. There is consensus among community members and implementing agencies on the importance of pro-poor measures for those who are identified to need assistance which can be based on existing government subsidy programs for the poor with IEC in sanitation hot spots. The strategy is for free domestic connection and targeted subsidy for monthly fees for vulnerable groups including the poor, elderly and female-headed households. Further discussion among stakeholders is strategic to consider willingness to contribute to part of cost of connection consistent with recommendations to charge an affordable connection rate. There are sanitation hot spots along waterways and by the seashore and around the WWTP site where there is need for sanitation improvement but where there is likely to be lack of capacity to pay. Universal connection and subsidies help low income households. Proposed interventions for onsite sanitation improvement as well as livelihood development assistance promotes social inclusion for the WWTP sites which are outside of coverage area for sewerage improvement. Technical constraints such as lack of PDAM/steady supply of water, satisfaction with onsite connection, tight space, connection to onsite systems and the like will need active consideration by village authorities and residents and designers during the sanitation audit and design and construction phases. Strategies to reach absentee homeowners will also need to be discussed at connection phase since significant numbers are renters. A pro-poor measure is included to address sanitation and income lack in WWTP sites. Installing onsite sanitation or establishing livelihood development needs to be assessed for viability of preferred livelihood options including land tenure constraints of informal settlers. Thus, problem solving on connection and implementation issues shall be facilitated through participatory processes and collective decision making as proposed in Implementation Arrangement Plans for Gender and Social Development, Stakeholder Communication Strategy and Community Participation Plan. Women, community organizations and institutional partners in Makassar City agree that gender analysis and women participation in sanitation promotion can ensure maximum participation by women. A Gender Action Plan, gender specialists and gender inclusive capacity building and joint sanitation advocacy planning promotes active roles of stakeholders where the needs of both women and men are addressed and women’s organizations are enlisted for sanitation advocacy and for better social and economic

TA 7993 - INO: Metropolitan Sanitation Management Investment Project – MSMIP Final Report 149
outcomes. In addition, quotas for female recruitment (10% more by 2018) and promotion (10% more by 2018), and training (50%) and consultation and decision making (40%) promote women empowerment at staff and community levels. Potential social risks are also managed such as the influx of migrant workers exacerbating sanitation and social and health concerns such as waterborne diseases through poor sanitation and sexually transmitted diseases due to workers camps. Pro-poor and inclusive measures are quotas for local workers (35%) with preferential hiring from low income communities with requirements for sanitation standards at workers camps. HIV/AIDS education will also be implemented by contractor and under the GAP. 9. Gender Action Plan The Gender Action Plan below (under category of Effective Gender Mainstreaming) summarizes how the Project will benefit both men and women and how different components of the Project will address gender disparities and enhancement opportunities in plan implementation. Targets may be revisited during project implementation.
Table V-H 1: Gender Action Plan, Makassar
Strategies Project Outputs and GAP Targets Output 1: Completed Infrastructure Development of Off-Site Waste Water Systems Promote Women and Community involvement in construction, operation and decision making
• At least 40% of participants in public consultation and sewerage connection campaign activities are women and vulnerable groups such as female headed households) who get full information about subsidized connection fees and criteria for subsidized monthly tariffs
• At least 40% women participants in consultations on resettlement/land acquisition • Future sanitation tariff increases take into consideration gender and affordability
through 50% women participation in public hearings for tariff hikes • Information bulletin on risks of HIV/AIDS relayed through appropriate media with civil
works contractors providing information/preparing code of conduct for workers.
Promote inclusive access to sanitation services
• Universal connection through free or subsidized domestic connection • At least 10% of connected households being from poor and female-headed or
vulnerable people (e.g. old, sick, disabled) through subsidized connections and monthly feesOnsite sanitation managed by CBOs established in non-sewered hot spots near the Waste Water Treatment Plant sites connecting at least 90% of households disposing waste water into waterways with at least 50% of households being from poor, female-headed household or vulnerable groups (if population will otherwise not have access to sanitation infrastructure) implemented in coordination with eligible NGO.

TA 7993 - INO: Metropolitan Sanitation Management Investment Project – MSMIP Final Report 150
Increase Livelihoods and Employment
• Civil works construction shall employ at least 35% local labor from urban poor women and their families where there is equal pay for men and women for work of equal type Sanitation/ development fund of at least $55,00043 shall be set aside and additional sources raised as needed for low income areas around the Wastewater Treatment Plant sanitation hotspots for onsite sanitation improvement (if population will otherwise not have access to sanitation infrastructure) at Sambala, MakassarLivelihood seed fund of $8,000 (included in Sanitation/livelihood Development Fund) supports viable livelihood for at least 50 women and their organization near the WWTP
Output 2: Completed capacity building for strengthened sanitation strategy and institutional capacity Equity in staffing Training and Capacity Building and Institutional Set up
• PMU/IA and the Service Delivery Organization to be established shall strive for gender equity; where female staff is 40% or under, at least 10% female staff and 10% increase of females in management positions shall be added by 2018 based on project baseline to be established. (For PU, baseline is 35% female staff and 25% in management position.)
• Specific gender and sanitation training modules and technical/management capacity development training are open to managers and staff at all levels (i.e. national, districts) to promote professional advancement of female staff where at least 50% of participants are women for in training on gender, community facilitation, utility management, technical and project/sector management-related skills
• At least 50% are women who participate in capacity building on hygiene and sanitation education, promotion, planning and participatory monitoring – e.g. WWTP impacts, etc.
• At least 40% of women in key decision-making and working groups such as Resettlement Committees, monitoring committees, Community supervision mechanism for Joint Sanitation Plan implementation, O and M structure and for onsite sanitation systems
• Gendered indicators in PPMS and quarterly reporting • A full-time Social/Gender specialist shall be hired in PMU
Output 3: Improved communication and public information on hygiene and sanitation Improved mechanism for public feedback and hygiene and sanitation promotion
• Women and community organizations such as PKK are partners in IEC and Joint Sanitation planning and delivery where at least 50% are women.
• 50%-50% male and female for community facilitators for awareness raising where male facilitators target male population to share responsibility for complaint reporting/management and sanitation promotion
• Joint sanitation marketing and sustainability planning and implementation with at least 50% female attendance in consultations and membership in implementation mechanisms
I. Poverty and Social Analysis The Asian Development Bank supports equitable and sustainable social development outcomes by giving attention to the social dimensions of its operations. A Social and Poverty Analysis is mandatory for all ADB projects to examine social development issues and a project’s potential effects, especially on poor people.
43 This amount is inclusive of onsite sanitation budget of $42,000 with $8,000 Livelihood Development Seed Fund and $5,000 for capacity building on sanitation system O and M and livelihood development. This will be allocated upon completion of needs assessment. This represents funds that can be augmented by other agencies for both livelihood development and sanitation improvement. For instance, the area may be scheduled for installation of onsite sanitation system under the City WW Improvement Master Plan.

TA 7993 - INO: Metropolitan Sanitation Management Investment Project – MSMIP Final Report 151
Social analysis and poverty analysis are critical tools in ADB’s efforts to reduce poverty since these address the processes and structures that exclude some groups from participating in and benefiting from economic development. Thus, ADB adopted social development policies and strategies covering such issues as gender and development, social protection, and cooperation with nongovernment organizations (NGOs); social safeguard policies on involuntary resettlement and indigenous peoples as reflected in the ADB’s Operations Manual. 1. Key Findings of Socio-economic Survey (SES) and Stakeholder Consultations The following is based on statistics of Makassar City, the Sanitation Strategy of Makassar City, the Dinas PU of Makassar City and the Business plan of PDAM Makassar. Data from these are augmented by a Socio-Economic Survey of “Domestic Wastewater Management and Wastewater Investment Program under the AusAID-assisted Indonesia Infrastructure Initiative (INDII). The SES of Households in the settlement clusters of Makassar was undertaken from 23 to 26 February 2011.
a. Population Characteristics
The Population of Makassar is 1,339,374 while the number of households is 306,067. Population density of Makassar is 6,722 people per square kilometer, making it the second most densely populated city of the project. Its population growth rate at 12.52% is the highest among the project areas and much higher than the 1.48% national standard which was taken from 2000 to 2010. There are fewer men than women at 661,379 and 677,995, respectively. In Makassar, the minimum wage per month (2011) is Rp 1,088,000. The average household income higher at Rp. 2,382,955. The poverty threshold in Makassar is Rp.668,000 per household while the poverty incidence as of 2011 is 11%.
b. Household Characteristics
Of the 333 households interviewed, 31% of the respondents were men and 69% were women which could suggest that the latter category has a good understanding about domestic wastewater management. As to their education, 59% graduated from high school. The average distribution of household members has been disaggregated based upon the type and density of the settlement cluster. This shows that the high-density low poor population areas to have average household membership of 7.06 whereas the denser and poorer population areas have 5 members per household which is higher than 4, the average for the city. Targeting of these areas stands to benefit more people. The number of productive household members along with the average monthly income and expenditure of each RT/HH according to their clusters in the study area is in the table below. Overall results showed that each RT has an average of 1.81 productive persons and receives an average monthly income of Rp 2,382,955 with an average expenditure of Rp 1,708,387. However, data varies according to the household clusters in the study area as summarized in Table V-I 1 which notably shows averages that are not widely divergent indicating similar experiences and opportunities.

TA 7993 - INO: Metropolitan Sanitation Management Investment Project – MSMIP Final Report 152
Table V-I 1: Number of Productive Household Member, Monthly Income and Expenditures
Clusters of Households by
their Location
Number of HH
member with
Income
Average Household
Income
Average Household
Expenditure
Overall Average 1.81 Rp 2,382,955 Rp 1,708,387 Low-density Low Poor Population 2.15 2,326,000 1,604,887 Low-density Med. Poor Population 2.02 2,256,296 1,632,824 Low-density High Poor Population 1.96 2,242,278 1,579,063 Medium-density Low Poor Population
1.96 2,504,714 1,737,345
Medium-density Med. Poor Population
1.80 2,317,500 2,087,150
Medium-density High Poor Population
1.20 1,830,000 1,426,080
High-density Low Poor Population 2.00 2,323,804 1,610,127 High-density Medium Poor Population
1.81 2,384,773 1,690,516
High-density High Poor Population 1.67 2,455,082 1,873,164 Source: Socio-economic Survey (Appendix 3.A) of Makassar City.
The average household income in each cluster group is similar (above Rp. 2,200,000) except for cluster 4 (medium-density high-poor population) with an average family income of only Rp. 1,830,000. This highlights areas with less working household members and possibly less able to afford improved sanitation services. The SES was able to gather data from the different clusters as to their monthly expenditures for utilities. On a monthly average, groceries cost the households Rp. 854,078; Telephone bills Rp. 115,534; Transportation expenses Rp. 204,093; electricity Rp. 85,787; water expense at Rp. 44,985; Education Rp. 175,610; Installment Rp. 490,986; Insurance at Rp. 490,986; Recreation expenses were at Rp. 209,595. Of the utility expenses, telephone bills were high compared to water and electricity. Aside from groceries as the highest expenditure, insurance, installment, and recreation show a level of priority for the households, showing that the people enjoy some surplus for recreation and savings and possible sewerage connection. For housing, 68% have semi-permanent houses while 32% live in permanent structures. The difference in classification is that semi-permanent houses are 40% made of rock and concrete while a permanent house is more than 40% made of rock and cement. As to ownership of the houses, 52% of the respondents are renters, 38% are owners of the housing units, 10% live with their parents. The high percentage of semi-permanent houses and renters suggests a population with minimal capacity with possibly more sanitation and basic water problems to be addressed. It also indicates the need for a strategy to reach absent homeowners who will make the decision on sewerage connection. About 52% of the respondents live in built-up areas while 15% live in densely populated locations. Most respondents live in poor and densely populated areas which are identified to have sanitation and wastewater problems. These are critical areas that pose a unique opportunity of addressing more poor participants at once.

TA 7993 - INO: Metropolitan Sanitation Management Investment Project – MSMIP Final Report 153
c. Need for Sanitation Services
Close to 46% of the RTs (rumahtangga or household) get their clean water from water utility; 31% extract from shallow well, while more than 23% depend on deep wells. However, most RTs have more than one water-source. Piped water is used for drinking (81%) and cooking (73%) while water from deep and/or shallow well is used for washing, bathing and cleaning. These percentages indicate vulnerability of groundwater sources; these also suggest that water availability may be a factor in determining viability of sewerage connection for a significant percentage of the target population. For those without a steady supply of water; water access may be higher in their hierarchy of household priorities. Based on data from City Health Office Makassar in 2010, 86% of household Black Water go to Septic Tanks while the remaining 14% or 33,315 families use water channels and open land for defecation. Two main classifications of wastewater were identified in the SES, such as grey water and the black water. Grey water is non-feces water that comes after bathing and/or washing while the black water is feces wastewater from the toilet. About 78% of the RTs disposed grey water into drainage systems, 14% on vacant land, more than 3% under the house and 2% each on land outside the house and in the latrine. On black water disposal, 89% of the household use their private toilet with latrine facilities while 11% used public toilet facilities. The main reason for not having a private toilet, as disclosed by 54% of the respondents, is the limitation of land while the rest admitted that (a) clean water is not available, 3%, (b) there are enough public toilets 11%, (c) no budget, 24%, and (d) other reasons 8%. These percentages highlight the need for improving the standard of wastewater services in the area. Diseases caused by environmental sanitation conditions were linked to 12 specific diseases such as: influenza, cough, sore throat, tuberculosis, shortness of breath. Water-related diseases are dysentery, dengue fever, intestinal worms and infections of the stomach, eyes and skin. These further indicate the need of the area for improved sanitation. During the survey, about 77% of the RTs revealed that an average of one of their members experienced sanitation-related diseases over the last three months. Eighty seven per cent of the 77% of the households pointed to influenza (87%), cough (53%) and to water-borne dysentery (11%) and skin diseases. As averaged from 9 clusters of the RTs, about Rp 109,207 was spent on medication and doctor’s service fees for treatment of the disease with an average of 21.32 hours being lost to the parent or the productive household member during treatment.
d. Demand for Improved Sanitation Services
On perceptions on present sanitation facilities and wastewater management practices, the survey showed that 77% of the respondents were satisfied with their existing sanitation facilities and practices while 20% were dissatisfied indicating a low percentage of RTs that were as yet ready to change, perhaps due to a lack of awareness and resource. The reasons for satisfaction are: (i) facility is in good condition (21%); (ii) the facility is clean, does not cause odor (19%); (iii) small number of users (21%); (iv) water closet use “S”-shape pipe and has a wide septic tank (16%); (v) water closet is owned (15%); (vi) sanitation is regularly maintained (5%); and (vii) criteria for water closet is met (3%). For the dissatisfied, the reasons mentioned were (a) poor condition of (broken) toilets, with the smelly contents being discharged direct to the channel, (b) clogged toilets and septic

TA 7993 - INO: Metropolitan Sanitation Management Investment Project – MSMIP Final Report 154
tanks are often full during the rainy season, (c) user does not own a toilet, and (d) large number of users. The dissatisfied would appear to be the most in need of sanitary improvement, the most vulnerable to disease, as well as being contributors to the degradation of the environmental condition, especially to the water channels and river. As an indication of awareness on good water management and how wastewater mismanagement results to an unhealthy environment, about 56% of the RT respondents considered the community health, and felt that the improvement program is important to their living environment. This was followed by 25% who considered it very important, then 15% that said that it was common while 3% thought it was not important. This level of awareness is a good starting point although it still needs to be supported and built up with a water and sanitation public awareness under the MMSIP.
e. Affordability
As to the share of sanitation on the households’ monthly expenses, the amount ranged from Rp 8,077 – Rp 31,356 with the average of Rp17,515. This means a relatively low allocation for sanitation services as this range combines the cost of trash/garbage dumping, community security, and communal sanitation facilities. These are relatively incremental amounts of income, suggesting either low incomes or low consideration for the importance of cleanliness and sanitation among the community clusters surveyed. Table V-I 2 on the next page is a benchmark on sanitation expenditure per cluster type to advice tariff setting discussions with communities.
Table V-I 2: Average Household Monthly Sanitation Expenses
Source: Socio-economic Survey (Appendix 3.A) of Makassar City.
Generally, decision-making over the household’s daily and monthly expenditures rests upon the wives, and this also covers the expenses on sanitation. Women respondents were significant; some did not have water connection which may be a constraint to sewerage connection. The facts indicate that women have an important role towards introducing the process of wastewater services to their households and to the community. The respondent RTs were divided over their perceptions on the Wastewater Investment Program. However, a majority of the responses were on the affirmative side since 64% agreed while 18% were very agreed on program implementation. Fifteen per cent were neutral while only 2% disagreed. The willingness to connect denotes the respondents’ willingness to use wastewater management services under the program. The survey showed that 81% agreed to be
Clusters of Households by
their Location
Monthly Expenses on
Sanitation Overall Average Rp 17,515
Low-density Low Poor Population 12,528 Low-density Med. Poor Population 15,078 Low-density High Poor Population 12,933 Medium-density Low Poor Population 19,383 Medium-density Med. Poor Population 31,357 Medium-density High Poor Population 20,000 High-density Low Poor Population 8,077 High-density Medium Poor Population 19,792 High-density High Poor Population 20,187

TA 7993 - INO: Metropolitan Sanitation Management Investment Project – MSMIP Final Report 155
connected while only 19% indicated unwillingness to use the services. The RTs who disagreed to be connected cited the following reasons: (i) they do not want to pay for something which belong to other people because they are only renters of the house; (ii) the respondent renters have no right to make permanent changes to the house and facilities; and (iii) low income levels which seem to be the main constraint in coming up with a decision to connect to a waste water management system since it entails added expense. The majority of the respondents expressed that they are willing to connect to wastewater management services since 95% of the RTs surveyed were willing to pay for the services. Only 5% did not agree to avail of the services for a fee. As to the amount the RTs agreed that they are willing to pay, the prices ranged from Rp 7,500 – 20,000. More than 50% of the respondents who expressed their willingness to pay placed the average amount of service fee at Rp 7,500 per month.
f. Vulnerable Groups
Due to their location in marginalized areas, the poor are more vulnerable to disease and natural catastrophes such as flooding and are also likely to contribute to more environmental damage. With the advent of climate change, these risks are more prone to happen. Vulnerable groups then, have higher stakes in cleaning up the sewers and rivers in the areas in which they live. Although arguably they have less resource by way of money and materials, they do have abundant human resources if directed towards solutions for the improvement of their surroundings and better chances of survival.
The urban poor are often landless in informal settlements by rivers and shores and lacked water and sanitation facilities. In some areas, urban poor lived in slums with poor sanitation. Migrant workers generally rent rooms with their low income (work as labor, unemployed). There are also vulnerable people such as elderly, the sick, disabled and poor. Makassar as a port and tourism center has one of the highest rates of HIV/AIDS incidence among the 5 cities at 2714 and 999 in 2012, respectively. 2. Analysis The overarching goal of MSMIP is improvement in the overall well-being of the city population within the Project area through sewerage connection. This is through improved water quality and decreased incidence of water-related diseases, especially among children. These help achieve Indonesia’s targets for urban sanitation in a manner that is inclusive and empowering. The project contributes to poverty reduction by helping attain national targets for urban sanitation and that of the Millennium Development Goal (MDG) Goal 7.9 for improved coverage of safe water and sanitation. The proposed investment shall provide access to sewerage service for an initial target of 9,000 domestic connections and 5,400 commercial connections in the most densely populated center of the city. The expected outcomes of the Project for Makassar City are: improved sewerage services and environmental quality in served areas, improved sewerage management services, and improved public awareness on sanitation. Improved sanitation outcomes will be measured in terms of the number of new service connections (i.e., residential, commercial/industrial, institutional), including women and poor households that will directly benefit from pro-poor policies for connection. Sanitation outcomes may also be measured by the reduction in direct disposal of waste water into water bodies, thereby reducing water pollution and resulting bad color and smell of waterways. These can also be measured by improved ground water quality that could

TA 7993 - INO: Metropolitan Sanitation Management Investment Project – MSMIP Final Report 156
contaminate wells that supply drinking water to the population. Served households can also enjoy savings in the medium term through reduced cost of septic tank construction and maintenance. Primary outcomes are the total number of residential and commercial sewerage connections made and reduced incidence of water-related diseases in the Project area. The investment in sanitation stands to benefit all in the service area through universal free connection. Fifty-five percent were willing to pay for sewerage connection. Affordability was a concern for many. Thus, the strategy adopted by the city is universal connection for domestic users. The challenge of inaccessible monthly fees is addressed through affordable tariffs and subsidies for monthly fees for the poor and vulnerable. Public awareness and connection campaigns in sanitation hot spots promote increased participation of the homeowners and of the renters that reside here. Benefits include improved sanitation service and improved hygiene, solid waste management and access to safe water through sanitation awareness campaign. Attainment of these goals, however, depends on whether intended beneficiaries connect to developed sewerage system and institute behavior change in other areas of environmental sanitation – e.g. disposal of garbage and other wastes into rivers. To do so, measures will be made to reach the poor and vulnerable groups and involve villages and organizations in discussing appropriate strategies to benefit slums and sanitation hot spots. Key issues such as disposal of solid wastes and grey and black wastes into waterways in slums, upstream and in unserved areas can cancel out any gains from sewerage connection within the Project Site. This calls for cooperation on a wider plan to address behavior change on hygiene and sanitation for the entire city and not just within the target beneficiary zone. Partnerships shall be established through joint planning on the contribution of city and village governments, Sanitation Pokja agencies, NGOs and desludging companies with community organizations for a common plan to address city sanitation challenges. Improved water access as a condition for connection also needs to be coordinated with PDAM early on. There are sanitation hot spots along waterways and by the shore. Around the WWTP site there is need for sanitation improvement but this is not within the sewerage area. Proposed interventions for onsite sanitation improvement, as well as livelihood development assistance promote social inclusion for the WWTP site. Livelihood enhancement opportunities shall be further assessed during project implementation though employment data indicate that women are less likely to be employed. The Project shall empower women and vulnerable groups through affirmative action policies for their participation in project design, sewerage connection and monitoring and evaluation. Along with village structures, community organizations will also be active partners in sanitation assessment, action planning as well as sanitation promotion. Pro-poor targets as well as gender targets at the level of the Implementing Agency and customer are included relative to hiring and promotion and giving them equitable access to sewerage service and training opportunities. A sanitation promotion strategy shall help ensure higher connection rates as survey shows high satisfaction with current sanitation facilities and Indonesian experience shows that free connection, by itself, cannot assure participation. Constraints to connection shall be addressed through joint problem solving of identified connection and sanitation awareness issues. A Stakeholder Communication Strategy shall guide the project in engaging its publics and in facilitating behavior change for improved hygiene and sanitation. A Consultation and Participation Plan will serve as guide in engaging key stakeholders at various stages of project life with special attention to affected persons and vulnerable groups.

TA 7993 - INO: Metropolitan Sanitation Management Investment Project – MSMIP Final Report 157
A capacity building component of MSMIP is expected to result in more inclusive and gender-sensitive operations and monitoring indicators and mechanisms for the implementing agency including village governments and communities in performing their respective roles in the Project. Village governments, women and community organizations, communal sanitation programs and desludging companies which serve households outside the Project Site are potential partners in project implementation and sanitation promotion. Cooperation can be facilitated through joint planning for a sanitation action plan. The project is expected to bring jobs at construction and operations. The observance of core labor standards is prescribed and mitigation measures are set in place for identified risks such as on poor living conditions at worker camps and on sexually transmitted diseases/HIV/AIDS among workers and communities. J. Social Safeguard Studies – Involuntary Resettlement A total of 51,443 m² (5.1443 ha) has already been permanently acquired from the 4 AHs. Located in Tamalate Sub-district, the proposed 5.1443 ha site is aligned towards the northwest and is generally a flat area with elevation of approximately between 1 to 3 m above sea level. The southern part is bounded by a vacant piece of land blocking direct access from the road to the site. Access for the WWTP site is proposed through the western bank of Jongaya Canal. The affected households do not belong to any indigenous groups and the land is not under any ancestral domain. All the four affected households live in parts of the city and there are no structures or any other fixed assets on the acquired land. The four land owners of the subject 5.1443 ha had proper certificates (titles) in their names and have already received compensation. Proofs of payment are included in the Due Diligence report prepared for the subproject. Supported with documents, the lands were acquired in compliance with the procedures prescribed in Chapter IV of Presidential National Land Agency (BPN) Regulation No. 3/2007. The AHs were compensated based on the price range reported by an independent appraiser which was higher than the rate set up by NJOP and the amount offered by the City Government. Land acquisition has no impact on the incomes and standard of living of the AHs since their livelihoods are not dependent on the acquired lands. There are no outstanding resettlement or compensation issues. The Initial Public Consultation and Information Disclosure was held on 17 October 2012 in compliance with the Government Regulation and ADB’s 2009 SPS and Public Communication Policy (2 April 2012). The public consultation was attended by key stakeholders including three affected households. Public consultation with the affected households and randomly selected residences along the roads covered under the WCS component continued in February 2013 and copies of the PIB in Bahasa Indonesia was provided to several roadside occupants. Public consultation with affected communities will continue throughout the planning and implementation phase of the subproject. The Subproject is Resettlement Category B, since land acquisition has only affected four AHs with 18 persons. K. Environmental Safeguards Study An environmental assessment was made for the proposed Makassar City’s Losari Off-site Wastewater Collection System and Treatment. Based on the significance of its environmental impacts and risks, the Makassar City subproject is deemed Environmental Category B in accordance with ADB’s environmental categorization and the type of assessment warranted only the preparation of an Initial

TA 7993 - INO: Metropolitan Sanitation Management Investment Project – MSMIP Final Report 158
Environmental Examination (IEE) report. The IEE was carried out under ADB’s TA 7993-INO and in accordance with ADB’s 2009 Safeguard Policy Statement (SPS) and Government of Indonesia (GOI) environment law, Environmental Protection and Management Law of 2009. A copy of the final Makassar City subproject IEE is presented in Annex Document - G. An important consideration in analyzing the environmental impacts of the proposed Makassar City subproject is the fact that its components are infrastructures for environmental improvement and for reducing the risk to public health from untreated sewage. The screening for potential environmental impacts and risks of the proposed Makassar City subproject showed that there are no significant negative environmental impacts and risks that cannot be mitigated. With its Environmental Management Plan (EMP), the proposed Makassar City subproject can be implemented in an environmentally acceptable manner. There is no need for further environmental assessment study. A full EIA is not warranted and the subproject’s environmental classification as Category B is deemed appropriate. An REA checklist was prepared to support the environmental categorization of this subproject. The IEE shall serve as the final environmental assessment document of the proposed Makassar City’s sewerage system subproject. Implementation of the proposed Makassar City’s subproject is recommended with emphasis on the following: (i) EMP of Makassar City’s sewerage system subproject shall be included in the design process; (ii) IEE Report/EMP shall be forwarded to the design consultant for consideration in the design process; (iii) Tendering process shall advocate environmentally responsible procurement by ensuring the inclusion of EMP provisions in the bidding and construction contract documents; (iv) Contractor’s submittal of a contractor’s EMP (CEMP) shall be included in the construction contract; (v) Contract provisions on creation and operation of the ad-hoc City Sewerage Environmental Complaints Committee (CSECC) shall be included in construction contracts; (vi) Training of the WWTP operators on operation and maintenance of the WWTP shall be completed before actual operation; (vii) a WWTP advisor (consultant) shall be provided intermittently during the initial 3 months of operation to assist the operators in the start-up phase and also to correct any undesirable operating practices; (viii) Monitoring of health and safety requirements shall be given more importance during construction and operation to reduce risks to the public and to personnel; and (ix) Makassar City government, its LPMU, and the South Sulawesi Province’s PPIU shall continue the process of public consultation and information disclosure during detailed design and construction phases. 1. Compliance to ADB’s SPS Requirements In compliance with ADB’s SPS (2009) and the requirements describe in its Appendix 1 (Safeguards Requirement 1: Environment), the final IEE for Makassar City’s sewerage subproject contains sections of the following: (i) executive summary, (ii) introduction, (iii) policy, legal, and administrative framework, (iv) description of the environment, (v) anticipated environmental impacts and mitigation measures, (vi) information disclosure, consultation, and participation, (vii) grievance redress mechanism, (viii) environmental management plan, and (ix) conclusion and recommendations. Environmental Management Plan. The EMP section addresses the need for mitigation and management measures for Makassar City’s subproject. Information includes: (i) mitigating measures to be implemented, (ii) required monitoring associated with the mitigating measures, and (iii) implementation arrangement. A tabulated mitigation plan presents the information on: (i) required measures for each environmental impact that requires mitigation, (ii) locations where the measures apply, (iii) associated cost, and (iv) responsibility for implementing the measures. Details of mitigating measures are discussed in the screening process for environmental impacts. A tabulated monitoring plan presents the information on:

TA 7993 - INO: Metropolitan Sanitation Management Investment Project – MSMIP Final Report 159
(i) aspects or parameters to be monitored, (ii) location where monitoring is applicable, (iii) means of monitoring, (iv) frequency of monitoring, (v) responsibility of compliance monitoring, and (vi) cost of monitoring. One of the pre-construction considerations discussed in the EMP is the need to include measures for climate change adaptation and mitigation. A hydrology and flooding study shall be conducted during the design phase for the proposed Makassar City’s WWTP to ensure that occurrence of flooding is properly evaluated. Results of the study shall be used for designing the proposed WWTP and the preparation of engineering specifications to ensure that it is less vulnerable to extreme flood events. Climate change mitigation is by connecting the WWTP’s membrane covered anaerobic ponds to a flare to avoid releasing the generated methane. However, during detailed design, potential use of the generated methane shall be evaluated with due considerations to financial and economic factors. EMP Cost. The IEE points to the need of ensuring funds for EMP implementation. The suggested approach is to allocate funds for EMP implementation by requiring that the tender documents of Makassar City’s sewerage subproject shall include a lump sum bid item in the bill of quantities to be titled “Environmental Mitigation Measures”. Furthermore, it shall be clarified in the specification documents that the environmental mitigating measures identified in the construction EMP are to be charged to this item. This will allow the construction supervision engineer of Makassar City’s sewerage subproject to require the contractors to quickly address the environmental issues during construction. For budgetary purposes, this EMP fund of the proposed Makassar City’s sewerage system is estimated at 1% of the total direct cost of the WWTP and the sewer lines. Relative to this, the CPMU and the South Sulawesi Province’s PPIU shall ensure that this provision for “Environmental Mitigation Measures” is included in the bidding documents and civil works contracts. Institutional Setup. Similar to the 4 other MSMIP subprojects, there is a need to ensure that the environmental aspects of the proposed Makassar City’s sewerage system is effectively addressed through a well-defined institutional setup. The roles of the various GOI units and consultants for the environmental aspects are discussed in the sections for institutional aspects of the final IEE. The setup presents the proposed PPIU of South Sulawesi Province as the key implementation unit responsible for construction contracts’ supervision of the Makassar City subproject, while the Makassar City’s LPMU coordinates the needed local inputs and resources. Capacity Building for WWTP Operators. The final IEE recognizes the fact that a newly constructed WWTP might discharge poor quality effluents due to operators that are not properly trained. One of the proactive ways to prevent this from happening is to provide capacity building for the operators of the new Makassar City’s WWTP during pre-operation phase and continue during the initial few months of the operation phase. The proposed capacity building shall be divided into 2 parts and shall be facilitated by local consultants. The first part shall be a one month hands-on training on operating and maintaining a WWTP in a similarly operating WWTP in Indonesia. The second part shall be the actual operation of the new Makassar City’s WWTP with inputs from a WWTP advisor for a 3-month period intermittently. This type of advisory services is very important since the new WWTP will be in the start-up phase and also to correct any undesirable operating practices of the newly hired operators. Estimated cost of the initial capacity building is US$7,600 while the cost of advisory services of the WWTP advisor for a 3-month period intermittently at the new WWTP is US$14,000. This capacity building for WWTP operators is also reflected in the overall capacity building plan for MSMIP. Grievance Redress Mechanism. The IEE presents a local grievance redress mechanism (GRM) for environmental complaints during the construction phase of the Makassar City’s

TA 7993 - INO: Metropolitan Sanitation Management Investment Project – MSMIP Final Report 160
sewerage subproject. The GRM has three levels and calls for the creation of an ad-hoc City Sewerage Environmental Complaints Committee (CSECC). This shall be chaired by Makassar City’s Chief of the LPMU. CSECC members shall include the: (i) contractor’s highest official at the site such as the Construction Manager or Construction Superintendent, (ii) village (Kelurahan) Chief or his representative, and (iii) a women organization’s representative. The draft GRM was presented to stakeholders during the initial public consultation meeting. Public Consultation and Information Disclosure. Last 16 October 2012, Makassar City’s BAPPEDA conducted an initial public consultation and formally discussed the proposed sewerage subproject with the stakeholders and requested their views. A total of 30 stakeholders and representatives participated. The discussions included the state of pollution of the Losari Beach area, the area presently receiving domestic wastewater from the service area of the proposed Makassar Cty’s sewerage system. Some participants stated that the benefits of having a sewerage system and WWTP should be brought to the attention of the people since poor management of the city’s domestic wastewater could pollute the beach area and also spread those bacteria causing diarrhea. The need to exert efforts in increasing public’s awareness on the importance of sanitation was discussed and some participants recognized the challenge in changing the public’s behavior on sanitation. This initial public consultation meeting is fully documented in the final Makassar City subproject IEE. A summary of the issues raised during the initial public consultation in Makassar City and how the project addressed them is presented in Table V-K 1.
Table V-K 1: Summary of Issues Raised and Project’s Response during Public Consultation
Group Represented Issues/ Concerns Raised Project’s Response
NGO, The Green Foundation The positive environmental
impacts to Losari beach from WWTP should be disseminated
Poorly managed wastewater would spread diarrhea from E coli bacteria. WWTP was important to prevent the spread of worm disease
NGO, The Green Foundation How much time would be necessary to make Losari beach clean again?
It is dependent on some factors since the sources of pollution to Losari beach must be identified and whether such pollution sources had been managed appropriately. At present there are 7 big outlets of wastewater to the Losari beach.
Community closed to WWTP site
Other cities, such as Bandung, have managed their domestic wastewater using WWTPs. Communities are advised to visit the WWTP site of Bandung.
The idea of visiting the WWTP site of Bandung is a good suggestion
NGO, The Green Foundation Regulations on domestic wastewater discharges should be made with firmer sanctions to violators and the media can play a role in informing the public
Preparation of a regional regulation on wastewater management, including drainage, is ongoing. Charge setting mechanism is also being prepared and supports from all parties are needed. To enact a regulation is not an easy task.
NGO, CARE International Indonesia
majority of communities have no objection with the proposed wastewater management project. Losari 1 and 2 areas
The most challenging issue during pre-construction concerned how to change the perception of communities. More public information campaign activities will be

TA 7993 - INO: Metropolitan Sanitation Management Investment Project – MSMIP Final Report 161
should be designed as priorities. However, the challenge is to change people’s behavior on the importance of sanitation.
conducted including community forums.
Health workers (community health centers)
Should construction start on 2013, public information campaign should be intensified and the Puskemas (community health centers) within the service areas can be engaged for this purpose.
Use of the Puskemas for public information campaign is a good suggestion
2. Compliance to GOI’s Environmental Requirements The final Makassar City subproject IEE presents GOI’s regulatory requirements regarding the AMDAL system (EIA system) and discharge permit for WWTPs. Under AMDAL regulation, a proposed WWTP for domestic wastewater that will require an area of more than 3 hectares or will serve a population of more than 100,000 shall be required to prepare an AMDAL report. The Makassar subproject will require an AMDAL since its WWTP area is 6 hectares, more than the 3-hectare criterion. The Makassar City subproject has already complied with the AMDAL requirements. Approval decrees from Makassar’s environmental agency, Badan Lingkungan Hidup, have been issued for the proposed WWTP and sewer lines network. According to the environmental agency, an Environmental Permit under Environmental Permit Regulation No.27/2012 is no longer required since the AMDAL approval decrees were issued long before the issuance of the regulation. Copies of the approval decrees are presented in the final IEE’s appendices. Makassar City’s Badan Lingkungan Hidup has also issued certifications last 11 January 2013 stating that the previously issued approval decrees for the proposed WWTP and sewer lines network remain valid. A permit to discharge will also be required for the proposed Makassar City WWTP under the city’s regulation for WWTPs. Information on the process for discharge permit application is presented in the final IEE’s appendices. L. Makassar Institutional Proposals 1. The Project and Schedule Makassar City confirmed the Central Business District Wastewater Collection System and WWTP subproject as a priority project of the city. The schedule of project implementation as well as the supporting institutional development activities is presented in Table V-L 1.
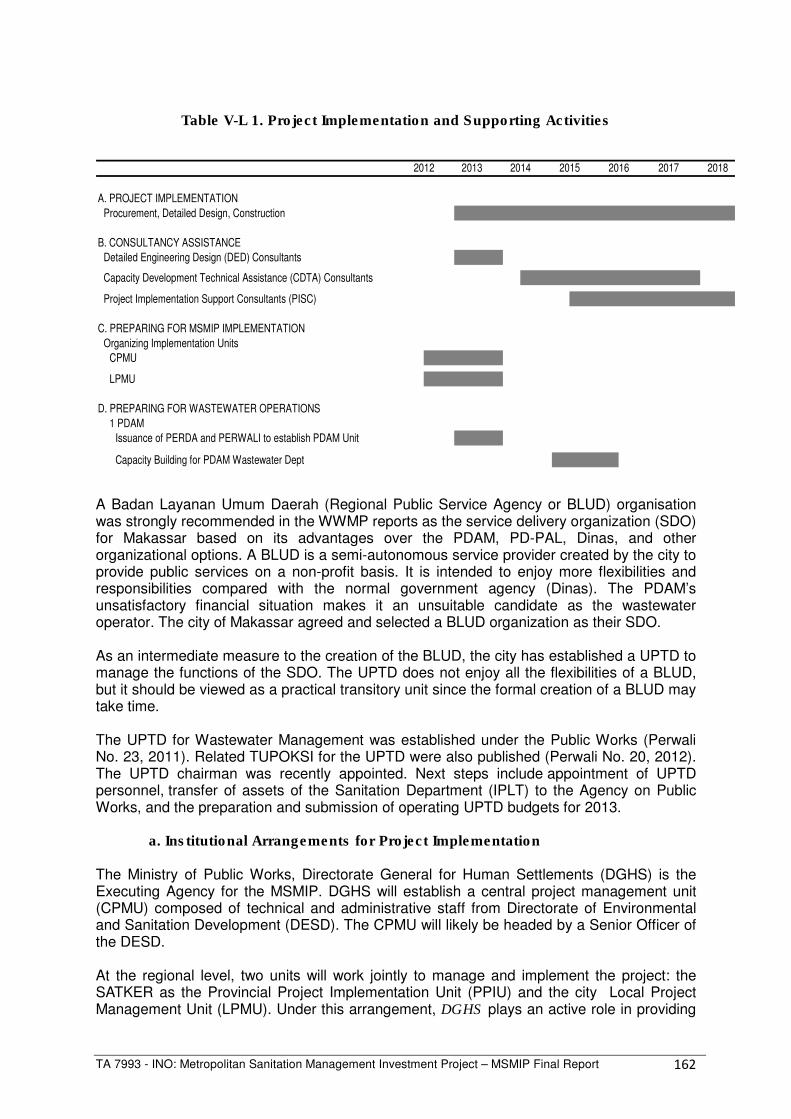
TA 7993 - INO: Metropolitan Sanitation Management Investment Project – MSMIP Final Report 162
Table V-L 1. Project Implementation and Supporting Activities
A. PROJECT IMPLEMENTATION
Procurement, Detailed Design, Construction
B. CONSULTANCY ASSISTANCE
Detailed Engineering Design (DED) Consultants
Capacity Development Technical Assistance (CDTA) Consultants
Project Implementation Support Consultants (PISC)
C. PREPARING FOR MSMIP IMPLEMENTATION
Organizing Implementation Units
CPMU
LPMU
D. PREPARING FOR WASTEWATER OPERATIONS
1 PDAM
Issuance of PERDA and PERWALI to establish PDAM Unit
Capacity Building for PDAM Wastewater Dept
2017 20182012 2013 2014 2015 2016
A Badan Layanan Umum Daerah (Regional Public Service Agency or BLUD) organisation was strongly recommended in the WWMP reports as the service delivery organization (SDO) for Makassar based on its advantages over the PDAM, PD-PAL, Dinas, and other organizational options. A BLUD is a semi-autonomous service provider created by the city to provide public services on a non-profit basis. It is intended to enjoy more flexibilities and responsibilities compared with the normal government agency (Dinas). The PDAM’s unsatisfactory financial situation makes it an unsuitable candidate as the wastewater operator. The city of Makassar agreed and selected a BLUD organization as their SDO. As an intermediate measure to the creation of the BLUD, the city has established a UPTD to manage the functions of the SDO. The UPTD does not enjoy all the flexibilities of a BLUD, but it should be viewed as a practical transitory unit since the formal creation of a BLUD may take time. The UPTD for Wastewater Management was established under the Public Works (Perwali No. 23, 2011). Related TUPOKSI for the UPTD were also published (Perwali No. 20, 2012). The UPTD chairman was recently appointed. Next steps include appointment of UPTD personnel, transfer of assets of the Sanitation Department (IPLT) to the Agency on Public Works, and the preparation and submission of operating UPTD budgets for 2013. a. Institutional Arrangements for Project Implementation The Ministry of Public Works, Directorate General for Human Settlements (DGHS) is the Executing Agency for the MSMIP. DGHS will establish a central project management unit (CPMU) composed of technical and administrative staff from Directorate of Environmental and Sanitation Development (DESD). The CPMU will likely be headed by a Senior Officer of the DESD. At the regional level, two units will work jointly to manage and implement the project: the SATKER as the Provincial Project Implementation Unit (PPIU) and the city Local Project Management Unit (LPMU). Under this arrangement, DGHS plays an active role in providing

TA 7993 - INO: Metropolitan Sanitation Management Investment Project – MSMIP Final Report 163
technical supervision and responsibility over the investment (the Satuan Kerja or SATKER model). The PPIU or the SATKER comprises full time staff detailed from DGHS to the provinces to implement specific projects of DGHS. The projects in the four cities above will be implemented through the SATKER in their respective provinces. The Makassar subproject will be implemented through the SATKER South Sulawesi Province acting as the PPIU or the implementing agency for the MSMIP. While the SATKER is the key implementation unit in the field, substantial involvement of the city government is needed. For this reason, an LPMU will be created in each city. The LPMU will be included in relevant training to provide them with capacity to gradually absorb project more planning, implementation and monitoring responsibilities in the future. Based on discussions with the City of Makassar, the LPMU will be DPU. The LPMU will coordinate closely with the POJKA AMPL, so as to strengthen the involvement of the UPTD in the project during the early stages, and to establish a sound sense of project ownership. See Figure V-L 1.

TA 7993 - INO: Metropolitan Sanitation Management Investment Project – MSMIP Final Report 164
Figure V-L 1: Implementation Arrangements
DGHS
(Executing Agency)
Central Steering
Commitee
Central Project
Management Unit
(CPMU)
Central Project
Implementation Unit (CPIU)
/ Satker Pusat
Central Support team
(CST) a
Provincial Project
Management Unit
(PPMU)
Provincial Project
Implementation Unit
(PPIU) / Satker Provinsi
Provincial Support team
(PST) a
Local Support team
(LST) a
Local Project Management
Unit
(LPMU)
Local Project
Implementation Unit
(LPIU) / SKPD
Dinas Provinsi b
Implementing Agency
Provincial Steering
Committee (CWSG, various
Dinas Provinsi )
Dinas Kota c
(Implementing Agency ABPD-
Kota)
City Sanitation Working
Group
(CSWG)
(chair: DGHS)
(chair: BAPPEDA-Prov.)
(chair: deputy mayor)
National Level
Provincial Level
City Level
Consultant Support
a Support teams consist of consultants for: (i) project implementation support,
and (ii) institutional development and capacity buildingb
Provincial Governmentc City Government
Supervision, guidance
reporting
Figure 3 shows the proposed arrangement where the Cipta Karya (Directorate General Human Settlements) plays a very active role in providing technical supervision and responsibility over the investment (the Satuan Kerja or SATKER model). Institutional arrangements for implementation include mechanisms for environmental management and resettlement. See details in Annex Document H9.

TA 7993 - INO: Metropolitan Sanitation Management Investment Project – MSMIP Final Report 165
b. Proposed Institutional Arrangements for Operation The focus of the capacity building is on establishing an autonomous and accountable SDO for wastewater management. To do this, the city of Makassar plans to create and operationalize the UPTD in 2013 as a preparatory step towards the creation of a BLUD by 2016. i. Organization and Operationalization of the UPTD
The Unit Pelaksanaan Teknis Dinas or UPTD for Wastewater Management in Makassar was established under Dinas PU (Perwali No. 23, 2011) to handle the preparatory activities pending the creation of the BLUD. Related job descriptions and job functions (TUPOKSI) for the UPTD were also published (Perwali No. 20, 2012). The UPTD chairman was recently appointed on July 26, 2012. A UPTD is a Regional Technical Implementation Unit, a sub-unit of a dinas, established to undertake technical operations in a specified functional or geographical area. The proposed organization for the UPTD is shown in Figure V-L 2.
Figure V-L 2: Proposed Organization Chart of the UPTD
Head of UPTD
WastewaterTreatment Plant
Communal Systems
Septage Treatment
Laboratory/ Community Affairs
(Mobile Team)
AdministrativeDivision
Functional Staff
Based on the Mayor’s Decree, the UPTD will consist of the head, the administrative department, and several functional groups. The functional groups on Communal Systems and Septage Treatment are existing functions under the Dinas Kebersihan san Pertamanan (Cleanliness and Parks Agency or DKP). These will be transferred to the new UPTD under DPU. The function group on the wastewater treatment plan is a new function. The Administrative Department will handle hiring and training of staff in coordination with the Administrative Division of the DPU. Each group is headed by a senior functional staff appointed by the Mayor as proposed by DKP. The head of the wastewater group will manage, coordinate, and integrate all wastewater activities of the city.

TA 7993 - INO: Metropolitan Sanitation Management Investment Project – MSMIP Final Report 166
Prior to project completion in 2016, the UPTD Administrative Department, with assistance from the MSMIP CDTA consultants, will start the hiring process and training of staff for the Wastewater Division of the UPTD to prepare them to handle technical, commercial, finance/administrative operations of the wastewater system. Billing and collection will be done with the UPTD directly collecting from the customers. A combined collection of water supply and wastewater fees has many advantages and is usually the preferred mode. However in the case of Makassar, this was not considered because of the financial and operational problems of the PDAM. The CDTA provides for policy/ guideline and procedures manual preparation to cover operation and maintenance including commercial systems. The proposed capacity development technical assistance (CDTA) for MSMIP also provides for policy/ guideline and procedures manual preparation to cover operation and maintenance including commercial and financial systems. ii. Creation of the BLUD
It is expected that during the 2 year capacity building assistance, the consultants will be able to assist and capacitate the city and the UPTD in achieving independent and sustainable wastewater operations eventually to create the BLUD as planned. The city realizes that under the UPTD, wastewater operations cannot fully be autonomous and will continue to depend on city government budgets. The consultants will assist the city prepare legislation authorised by the City Council and the Mayor including the PERDAs (or city regulations). Details of proposals on how the BLUD will be organized are provided in Annex G9. c. Institutional Development and Capacity Development Component The CDTA comprises two components, namely the capacity building plan and project management assistance. i. Capacity Building Plan Methodology and Approach The capacity building plan is directed at two (2) distinct levels – sector (or city) management level (through the Local Institutional Development Action Plan or LIDAP) and at the service delivery level (through the Financial and Operating Improvement Plan or FOPIP). The LIDAP includes interventions to be initiated and managed by the city government which influences the operating conditions of the Service Delivery Organization (SDO). The FOPIP, on the other hand, includes interventions which are to be initiated and managed by the SDO. See Figure V-L 3 below.
Figure V-L 3. Capacity Development Plan Approach
1) policy formulation, sector
management
(2) management of service delivery
(human resources, pricing the service,
etc.)
(3) community involvement
(4) regulation of service provision.
FOPIP
CAPACITY DEVELOPMENT
Establish
ment of
Effective
Service
by SDO
LIDAPSector
Reform

TA 7993 - INO: Metropolitan Sanitation Management Investment Project – MSMIP Final Report 167
The sector interventions to be provided by the capacity building component can be grouped into three types:
• Assistance in the preparation of policies, guidelines, and manuals; • Advisory services, technical assistance and progress monitoring; • Training and Workshops
ii. Project Management Assistance Project management assistance covers technical audit and benefit monitoring. Technical Audit. The consultancy services also aims to provide initial project management assistance during the 12 month period prior to mobilization of the PISC and during the 18 months of the PISC contract. This primarily covers assistance in the procurement activities.
Benefit Monitoring and Evaluation. Monitoring and evaluation of project benefits calls for the development and implementation of a Project Performance Monitoring System which covers the, conduct of a baseline study and setting up of all institutional requirements in order to be able monitor and evaluate the benefits of the project after its completion. d. Project Readiness of the City Due to significant institutional support coming from the ADB CDTA and IUWASH consultancy assistance, Makassar is fast catching up in terms of updating the CSS, and preparing and conducting some LIDAP and FOPIP activities. According to the MSMHP CDTA consultants, the LIDAP and FOPIP drafts will be ready by December 2012. More importantly, the city’s UPTD is ready to operate early 2013. The required Mayor’s Decrees to create and staff the UPTD has been issued, the Chairman has been appointed and the budget for 2013 has been provided. The city also realizes that social marketing/ promotion and issuance and enforcement of sanitation regulation are key to the success of the project and commits to this and other action plans in the LIDAP and FOPIP. Once the proposed tariffs are determined, the city will determine strategies to be able to implement the needed charges to make the wastewater operations sustainable. In several discussions of the consultants with the city, they have committed to charge fees that will fully recover O&M cost (including depreciation). The preliminary amounts calculated in the feasibility studies prepared under INDII were used as basis of the discussions with local officials. Firmer commitments are expected from the cities on the final tariffs which will be determined at a later stage.

TA 7993 - INO: Metropolitan Sanitation Management Investment Project – MSMIP Final Report 168
VI. Palembang City Off-site Wastewater Collection System and Treatment A. Palembang Physical Setting Palembang city is the capital of the South Sumatra province and the fourth largest city in Indonesia. It has an area of just over 400 km2. Administratively, the city is composed of 16 sub-districts (kecamatans) and 107 kelurahans. Palembang has a wide open space feel about it with larger building plot sizes. There are only a few high rise buildings. The built up areas tend to be concentrated in the central part of the city on either side of the Ampera Bridge and along the river banks. Population in Palembang is about 1.47 million people (2009), with 58,400 classified as poor (2009). The growth rate is more than double that of the Province (at 2.1 percent) and some 35 percent higher than the National average. This was attributed in the Indii WWMP to the City Administration’s drive to “internationalise” the city and which in turn has increased economic activity and attracts more people to live in Palembang. Palembang, being almost on the equator, has a monsoon climate with distinct wet and dry seasons. The average monthly rainfall varies from low 40 mm at the end of the dry season in September to high 330 mm in March and April. The average monthly evaporation rates during the period 2007-2009, range from 100 mm to 150 mm. An important feature is that rainfall exceeds evaporation for seven months of the year. Elevations range from about 4 m above mean sea level (MSL) close to the river to about 12 m above MSL in the northern and north western parts (Sukarami to Ilir Barat), where the terrain tends be more undulating in nature then to the flat, marshy areas typical of the western part of the urban area. Palembang is characterized by the Sungai Musi River transecting the city from west to east. The river is tidal to upstream of the town and so water levels rise and fall during the day. Although there are levee banks around the city, inundation still occurs relatively frequently, especially in the marshy areas in eastern parts such as Kaldoni and Seberang Ulu II. By extension the reaches of the tributary streams are also affected by tidal variations. The underlying geology of the city is predominantly sandy clay, silt and alluvial deposits. The water table in the alluvial deposits near the river is shallow with a depth of 1 m to 2 m during the dry season and rising to 1.5 to 0.5 m in the wet season. Further away from river the depths to the nearest aquifers range from more than 5 m in the dry season to about 2 m in the wet season. The groundwater quality is poor and unsuitable for direct human consumption. It is high in iron (as evidenced by the yellow colouring oil) with high E. coli counts, likely from septic tank and direct wastewater discharges. The use of shallow wells is by less than 20 per cent of the population. Water supply in Palembang is the responsibility of the Palembang Water Authority (PDAM Tirta Musi), which claims an 80 percent coverage of the population with reticulated water. The PDAM has two water intakes in the Musi River (at Karang Anyar) and one on the Ogan River at 15 Ulu to the south of the city. The current total water production capacity of the PDAM is 235,000 m3/d. Of the 133,600 registered connections (which seemed low for the population), 89 percent are residential (118,500 customers), 10 percent commercial (13,500 customers) and 1 percent social (1,600 customers). No industrial customers are registered. The water quality of the rivers on entering Palembang is good and largely meets the limit for a Class 1-2 stream in terms of chemical oxygen demand, and ammonia. The dissolved oxygen levels of 3-5 mg/L are class 2-3 standard, which is not unrealistic for a river crossing a flood plain. Phosphorus and Faecal coliform concentrations in the rivers are high and

TA 7993 - INO: Metropolitan Sanitation Management Investment Project – MSMIP Final Report 169
representative of Class 3-4 streams. It was concluded by the Indii WWMP that the Musi River has enough capacity to absorb treated wastewater discharged from Palembang but not enough for untreated wastewater. The Indii WWMP reported that 69 percent of households have septic tanks, 4 percent have pit latrines, 15 percent practice open defecation on land and 12 percent defecate directly in waterways. Over 20 percent of low income households do not have a toilet in their house for use. Open defecation is still a major issue in Palembang and the usage of septic tanks is below the national average of 73 percent. Of those with septic tanks, 89 percent, have pour-flush toilets which minimise the waste liquid discharges. Flush toilets are more common in the new housing estates. Reportedly, only about 30 percent of the septic tanks are considered to be of sound construction and working properly and 60 percent were found to be unsound. This means that overall, only about 20 percent (30 percent of 69 percent) of households have adequate waste treatment systems on their premises. These reported statistics are supported by the findings of the social survey undertaken as part of this activity in February 2011. Where septic tanks are installed, black (toilet and kitchen) and grey water (bathroom, laundry) are separated; the latter waters are discharged directly to the street drain and the former water to “soak aways” or mostly to “soak beds” (septic tanks without a bottom), both ill-suited to high clay soils. In clay soils septic tank overflow (sullage) ends up in street drains. The septage collection fleet in the City comprises of 13 trucks with capacity 2 to 3 m3, of which 4 are owned by the City Sanitation Office. Palembang has one septage treatment plant (of unknown capacity) operated by the City Sanitation Office and located at the Sukawinatan landfill facility near the airport. The plant is operational but quite a distance from the city centre. There are several neighbourhood sewerage/treatment schemes that service only about 2,400 people but no there are no off-site sewerage and treatment systems in Palembang. The Palembang City Government has medium- and long-term targets to be achieved for compliance with the National Medium Term Development Plan (2010-2014), the Millennium Development Goal (MDG) 7C and the environment, health, social amenity and sustainability drivers. While there has been considerable improvement in both urban and rural sanitation nationwide, there is still some way to go to meet the MDGs. The Human Development Index score of Palembang in 2005 was 73.60 and increased in 2009 to 74.98 making it the in the first position out of 16 cities/kabupatens. Other drivers include the desire to eliminate poor health “hot spots” within the city associated with poor sanitation facilities and waterborne diseases and are prevalent in the lower socio-economic areas; and to work towards meeting the Governor’s stated environmental objective of making the Musi River a Class I or II river in terms of water quality. Environmental management in Palembang is under the Badan Lingkungan Hidup (BLH) or Environmental Management Board and Dinas Kebersihan (DK) or sanitation agency. BLH is responsible for policy formulation and coordination while DK is responsible for implementation of solid waste and sewage management within the city. DK’s sanitation service (DK operates 4 sludge suction trucks and charges IDR 175,000 per trip to the customer site) is limited to emptying of septic tanks using sludge suction trucks when requested by residential and non-residential customers. DK also operates and maintains the sludge final disposal site which also serves private operator of sludge suction trucks. Environmental drivers include the declining quality of the main watercourses, such as the Musi River, resulting from the lack of sanitation and wastewater collection and treatment facilities. Palembang City sees itself as the main city of Sumatra and the current administration drives the development of the city to being one of the main hubs of Indonesia.

TA 7993 - INO: Metropolitan Sanitation Management Investment Project – MSMIP Final Report 170
The identification of sensitive ecosystems remained unknown from the Indii WWMP as no reports were available on the ecology within the city or areas in the immediate vicinity downstream. There is low community awareness on the importance of sanitation management and a lack of information dissemination and education on the importance of domestic wastewater management, especially for low income community members living in densely populated areas prone to flooding. The main priority area identified in Palembang for improving wastewater and sanitation is in the inner city on both sides of the Musi River and includes the central business district. This will maximise the opportunity that the connected customers will support the scheme and be willing to pay the tariffs. This was considered vital in the Indii WWMP for the early success of the scheme and will also shape the subsequent stages and community attitudes. Areas such as Gandus and Kertapati score high in terms of poverty occurrence, proximity to river and waterlogged ground conditions, and will be priority focus for onsite sanitation improvements. Due to the very low urban densities in these areas an off-site sewerage system, apart from local neighbourhood systems is not feasible. The Indii WWMP reviewed a number of past studies relating to sanitation, including:
• Master Plan of Utilities in Palembang City, Planning Board (Bappeda) of Palembang City – 2006
• Wastewater Detail Engineering Design of Housing Flat - 23, 24 and 26 Ilir Palembang City Wastewater, Planning Board of Palembang City (Bappeda) - 2008,
• White Book of Sanitation Palembang City, Draft Final Report, POKJA Sanitasi Palembang – 2010 and
• Environmental Health Risk Assessment (EHRA), Draft Final Report, POKJA Sanitasi Palembang – 2010.
Relevant Environmental Standards The national strategy on domestic wastewater management system and the implementation is formulated through several regulation and commitments. The regulations are:
• Public Work Regulation No. 16/PRT/M/2008 on National Strategy and Policy in Domestic Wastewater Management, and
• Government Regulation No. 16/2005 on Water Supply Development Wastewater management is associated with the environment (UU 32 / 2009) and planning (UU 26/2007). The consequences of the legislation on wastewater management are:
• In order to avoid pollution, wastewater needs to be treated, and it has become a challenge for Palembang to develop and manage the wastewater system.
• The community needs to be empowered to participate in managing the environment. Effluent discharge standards for most areas in Indonesia stipulate a 100 mgBOD/L but the Province Standard issued by the Governor for South Sumatra is 50 mgBOD/L. Apart from the BOD load there is a 100 mg/L limit on suspended solids and 10 mg/L for fats and oils. In most cases with wastewater having a suspended solids delimit of 100 mg/L would exceed the BOD delimit of 50 mg/L so the BOD limit is the guide. There are no other parameters stipulated. For Industry, Hotel, Hospital, Domestic, and Coal Mines, the South Sumatran Governor Regulation No. 18 Year 2005 on Effluent Standard Quality applies: pH – 6 to 9; BOD < 50 mg/L; SS < 100 mg/L and Fats and Oils < 10 mg/L.

TA 7993 - INO: Metropolitan Sanitation Management Investment Project – MSMIP Final Report 171
The Indii WWMP suggested an effluent discharge target of 30 mg/L BOD be set for the plant with an upper limit of 50 mg/L not to be exceeded more than 10 percent of the time in any one year for the first 5 years. An effluent standard of 20 mg/L BOD was recommended for the future as operators become more skilled. The BOD delimits were set with the Musi River quality in mind as that is a major source for the Palembang drinking water. According to the Indii WWMP, there are no existing regulations relating to the management of biosolids. B. Rationale for Selection of Priority Projects The sub-projects included for implementation during Phase 1 (by 2014) of the IndII Masterplans that were produced for Palembang City were identified. The City has been been visited to ascertain which of the Phase 1 sub-projects are the priority of each of the City Governments, in that they represent the selected sub-projects that the Cities would wish to implement in the event of limited loan funds. Palembang was visited on the 20th July. Minutes of the Meeting were included in the PPTA Interim Report dated September 2012. At the meeting a presentation was made on the specific “Readiness of the City” with regard to the sub-projects recommended in the WWMPs for the Phase 1 period. In particular, emphasis was placed on the confirmation of the availability of the land for the construction of the WWTP. The City confirmed the land is either now available or will be in the near future. The City has prioritized the sub-projects that they would wish to be included in this MSMIP TA. The following table shows the sub-projects that have been requested for consideration under this PPTA. The City has prioritized the sub-projects that they would wish to be included in this MSMIP TA. The following table shows the sub-projects that have been requested for consideration under this PPTA.
SUB-PROJECTS SELECTED BY THE CITY FOR FUNDING
City Description of Sub-Project Palembang WWTP and Central Area wastewater collection system
In this PPTA Report we have only evaluated the WWTP and the Central Area wastewater collection systems. C. Proposed Wastewater Collection System The cost of the sewerage proposals for Palembang were deemed by ADB and Cipta Karya to be too expensive to fund under the current loan discussions. The PPTA consultants were requested to reduce the extent of the wastewater collection area but to retain the same number of property connections. The Phase 1 sewerage proposals by PEMDA have been reduced, those sewers deferred are also shown on the plan below. For details of the proposed wastewater collection system and costings please see the following plans and costings table. The plan below shows both the sizes and function of the sewers.

TA 7993 - INO: Metropolitan Sanitation Management Investment Project – MSMIP Final Report 172

TA 7993 - INO: Metropolitan Sanitation Management Investment Project – MSMIP Final Report 173
Diameter LengthUnit cost
PPTA
(mm) m ( xRp 1000) ( xRp 1000) ($'million)
1 Rising Main - -
RCP DN 1550 1,050 5,700 5,985,000 0.62
RCP DN 1650 4,050 7,000 28,350,000 2.95
34,335,000 3.58
HDPE DN 300 1,000 1,408 1,408,000 0.15
HDPE DN 450 560 2,156 1,207,360 0.13
HDPE DN 550 1,480 3,179 4,704,920 0.49
HDPE DN 750 1,210 4,081 4,938,010 0.51
HDPE DN 850 180 4,774 859,320 0.09
RCP DN 1200 1,620 4,800 7,776,000 0.81
RCP DN 1550 2,720 5,700 15,504,000 1.62
36,397,610 3.79
Lateral and Interceptors
346 138,600 47,955,600 5.00
Storm Water Interception
- - - -
6
1 8,893,550 8,893,550 0.93
1 5,056,010 5,056,010 0.53
7
92 22,609 2,080,000 0.22
1,240 7,300 9,052,000 0.94
8
- - - -
9
0 - - -
10
21,400 3,520 75,328,000 7.85
11
1 25,000,000 25,000,000 2.60
*) By MSMHP Yogja: Lateral to the control box - Rp 2 Million + Box control to house - Rp 1.5 Million.
City : PALEMBANG
2 Trunk Sewers
Sub Total 2 :
NO ITEM
SEWERAGE PROPOSED BY CITY FOR ADB LOAN (BASIC DIRECT COST)
Sewer Manholes - Depth 2.0 - 6.0 meters
1 Pump Station Trunk Sewer
Lateral Sewer Chambers - Depth 1.5 - 2.0 meters
Pipe Work Crossing
PPTA Reviewed cost
Total Rupiah (x 1000)
Main Sewers
Sub Total 3 :
3
Storm Water Drain Rehabilitation
Drainage Rehabilitation
4Estimated per hectare
Manholes and Chambers
25.43244,097,770
Property Connections *)
5Interception Chambers (No)
Pumping Stations
2 Pump Station Main Sewer
Land Acquisition for the WWTP
30.7 Hectare
D. Proposed Waste Water Treatment Plant The intended 5.7 ha treatment plant site for the Ilir scheme (i.e. north of the Musi River) is large enough to support [for Stage 1 flows only] a pond treatment technology for the Sei Selayur WWTP that could reduce Capex, Opex and system complexity from the oxidation ditch approach of the IndII MP. The process flow diagrams (PFDs) of oxidation ditch and an alternative pond treatment system are shown on the following page. The pond system would require all of the 5.7 ha for Stage 1, whereas the oxidation ditches would require only 2.1 ha for Stage 1 flows. The oxidation ditch configuration is slightly different from that proposed in the IndII MP in that a sludge thickener and anaerobic digesters have been inserted to reduce the sludge quantity and introduce possible future electrical generation from the biogas. A dual parallel process

TA 7993 - INO: Metropolitan Sanitation Management Investment Project – MSMIP Final Report 174
train is again included to allow time for sewerage connections to increase inflow to plant as well as providing process redundancy to lower risk. The suggested pond treatment process (and certainly other process configurations are possible) a sequential pond system consisting of anaerobic ponds + facultative-aerobic ponds + maturation ponds. Two separate parallel process streams are suggested to assist in future lagoon sludge dewatering. The main advantage of this configuration is the reduction of power usage as well the elimination of daily sludge management. The ponds can be designed to be desludged every 5 to 10 years. This lessens the capital expenditure and certainly the system complexity that gives time and opportunity for Palembang/Provincial government to formulate and implement a Biosolids Management Strategy to address the biosolids that will ultimately result from any wastewater treatment process. Moreover, there is also the possibility that additional adjacent land can be obtained for Stage 2 and Stage 3 from the Provincial government. The use of a pond technology presumes that the 5.7 ha in full can be used, and the Reviewer notes the current presence of informal settlers on the site as well as its current agricultural use for oil palms and bamboo, for a pond treatment system. A comparison between the two approaches is shown on the following page.
Re
vie
we
r P
on
d
Tre
atm
en
t A
lte
rna
tiv
e
(2 C
ov
ere
d A
na
e.
Po
nd
s +
2
FA
Ps
+ 2
Ma
t. P
on
ds)
Re
vie
we
r O
xid
ati
on
Dit
ch
Tre
atm
en
t A
lte
rna
tiv
e
(2 O
Ds
+ 2
Cla
rifi
ers
+ 1
Th
ick
ne
r +
4
AD
s +
Slu
dg
e
Dry
ing
Be
ds)
1 Biological Treatment Process Covered Anae.
Ponds + FAPs +
Maturation Ponds
2 ODs + 2 Clarifiers + 1
Thickener + 4 ADs + Sludge
Drying Beds
2 Area Requirement
(Site is 5.7 Ha)
Stage 1: 5.7 Ha Stage 1: ca. 2.1 Ha
3 Sludge Production
(tonnes/day)
2.0 2.6
4 Sludge Management Regime Desludge ponds
ever 5+ years
Daily sludge management
required
5 Power Requirement for
Treatment (kW)
130 332
6 Operating Difficulty Not Complex Complex
7 Estimated Capital Cost
($USM)
10.5 12.1
8 Estimated Annual O&M Cost
($USk)
207 424
9 Biogas Generation at Capacity
(m3 of 70%CH4/day)
573 355
10 Possible Electrical Generation
Potential (kW)
126 78
Note: AD - Anaerobic Digester; FAP - Facultative Aerobic Ponds; OD - Oxidation Ditch
PALEMBANG (Analysis Assuming Pretreatment
+ 21,400 Total Connections or 23.1
MLD)

TA 7993 - INO: Metropolitan Sanitation Management Investment Project – MSMIP Final Report 175
The intent is to have the Musi River effluent outfall downstream of any potable water intakes. The Ulu system of the IndII MP, south of the Musi River, is apparently delayed but should be picked up as soon as possible because of the foul water discharges between the city potable water intakes in the Musi River. The financial comparison of the two systems is given in the table following the PFDs. The oxidation ditch would produce a better quality effluent (20 to 30 mgBOD/L) than that of the pond system (around 50 mgBOD/L) but would cost more to build, operate and maintain and is a more complicated system, requiring daily sludge management.

TA 7993 - INO: Metropolitan Sanitation Management Investment Project – MSMIP Final Report 176
3:1(H:V)DH
L1
L2
AT
AB
Dewater / Desludge
Every5 to 10+ years
Surface Aerators
3:1(H:V)DH
L1
L2
AT
AB
FACULTATIVE
AEROBIC PONDS
3:1(H:V)DH
L1
L2
AT
AB
MATURATION PONDS
Proposed AnFAP TREATMENT PROCESS
(Two Parallel Trains or 6 ponds)
COVERED ANAEROBIC PONDS
TRUCK OFFLOAD
CHAMBER
MECHANICAL
SCREENS
Domestic + Commercial Wastewater
GRIT
Screenings & Grit to Landfill
ST PumpoutTrucks
Possible Grinder
OVERFLOW Biogas
FLARE
Geo-Plastic
Membrane
Cover
Treated WW to Discharge
M
M
M
M
Optionale- gen
MM
M
BYPASS Flows > 2xADWF
M
MDomestic + Comm. WW
CLARIFIERS
Mechanical or Gas MixingBrush Aerators
Waste Solids
OXIDATION DITCHES ANAEROBIC DIGESTERS
(No Preheating)
OXIDATION DITCH TREATMENT PROCESS
FLARE
Screenings & Grit to Landfill
Flows > 2xADWF BYPASS
4
4
Treated WW to Discharge
Cl2 DISINFECTION
TRUCK OFFLOAD
CHAMBER
MECHANICAL
SCREENS
GRIT
REMOVAL
OVERFLOW
WEIR
M
M
M
M
Supernatant Return to HoW
Grinder Pump
e- Gen. Option
SLUDGE THICKENER
M
ST PumpoutTrucks
M
Pump
M
Pump
M
Pump
M
M M M
Cl2
M
Pump
M
M
Pump
M
M
To Sludge Drying Beds
M
Return Acitvated Sludge
M
M

TA 7993 - INO: Metropolitan Sanitation Management Investment Project – MSMIP Final Report 177
Source of Stage 1 Cost Estimations for Sei Selayur WWTP (for 21,400 total connections) 23 MLD
Capex (NO VAT, (USD Million)
Opex (USD/annum
Comments
IndII MP (pretreatment + oxidation ditch + clarifiers + daily sludge dewatering + 3 pump stations)
37.3 945,000 System will yield superior effluent quality but with a higher Capex and Opex. Daily sludge management a necessity. Capital cost per connection was about $US1757. The costing by the IndII MP reflected a flow of 75 MLD.
MSMIP Technical Review (Alternative 3: pre-treatment + oxidation ditches + sludge thickener + anaerobic digester + chlorine disinfection; two parallel trains)
12.1 424,000 System will yield superior effluent quality but with a higher Capex and Opex. Daily sludge management a necessity with sludge from the anaerobic digesters directed to sludge drying beds before disposal. Capital cost per connection was about $US567.
MSMIP Technical Review (Alternative 2B: pre-treatment + covered anaerobic ponds + facultative aerobic ponds + maturation ponds; two parallel trains) Septage solids to be accepted at facility.
10.5 207,000 Odour contained at the front of the process with a membrane cover over anaerobic pond, desludging only needed every 10 years or so, drying beds included, facultative-aerobic ponds used, thus lowering energy requirements, maturation pond has 1 day HRT. Lagoon desludging, a future activity, has not been provided for in the Capex. Capital cost per connection is about $US492.
For a more detailed analysis of the proposals see the table below and Annex Document A – Technical.

TA 7993 - INO: Metropolitan Sanitation Management Investment Project – MSMIP Final Report 178
Million (IDR)
or Other
Million
(USD)
Percent of
Total
Million (IDR) or
Other
Million
(USD)
Percent of
Total1 Surface Area Reqmts, ha 5.7 NA NA 2.1 NA NA
2 5,588 0.59 6% 3,238 0.34 3%
3 7,789 0.83 8% 14,549 1.55 13%4
12,807 1.36 13% 48,076 5.11 42%
5
27,453 2.92 28% NA NA NA
6NA NA NA NA NA NA
7 Contingency for Unknown Site Constraints10,676 1.14 11% 11,632 1.24 10%
8 Engineering & Construction Management5,694 0.61 6% 6,204 0.66 5%
9 Other 28,214 3.00 29% 23,316 2.48 21%
TOTAL ESTIMATED CAPITAL COSTS: 98,221 10.50 107,016 12.10Avg Capex/Conn (Mil. IRP/conn. or USD/conn.): 5.2 553 5.6 637
TOTAL EST. ANNUAL O&M COSTS: 1,942 0.2066 3,983 0.4238Avg. Annual Opex/Conn. (IDR or USD/conn. ): 102,223 10.87 209,652 22.30
Annual Opex as % of Capex: 2.0% 3.5%
Note: NA (not applicable); costing does NOT include VAT; Opex = Operating + Maintenance Costs; Capex = Capital Cost
Alternative 2B: Membrane Covered Anaerobic Pond+ Facultative Aerated Pond + Maturation Pond
Alternative 3: Oxidation Ditch + Clarifiers + Anaerobic Solids Digestion + Chlorine Disinfection + Sludge Drying Beds
Estimated Cost of Pond's CPE (plastic) Liner +
Protective Sand Top + Bottom
Estimated Cost of Cover for Anaerobic Pond +
Biogas Piping + Flare
REVIEWER SEI SELAYUR WWTP:
COST SUMMARY
STAGE 1: 23.1 MLD
Approximately 19,000 Connections
ALTERNATIVE 2B
Estimated Cost for Site Preparation
Estimated Mechanical Cost
Option 2B: Estimated Civil Cost of Ponds (ponds to
sit on top of site, no cut; dykes to be made of clean
fill)
Option 3: Estimated Civil Cost
ALTERNATIVE 3
E. Cost Estimates and Implementation Schedule
Total subproject cost for Palembang City is $51.9 million equivalent. This is based on the direct costs estimated in the technical study and discussed in previous sections. The subproject cost includes taxes and duties, detailed engineering design, construction supervision, physical and price contingencies, land acquisition and involuntary resettlement. As recommended in the Palembang Master Plan, the preferred wastewater system operator for Palembang is Perusahaan Daerah Air Minum Tirta Musi (PDAM Tirta Musi or PDAM), a city-owned enterprise. Experience in Indonesia has shown that wastewater fees or environmental fees, when combined with the water bill, have higher collection rate compared to wastewater fees billed on a stand-alone basis.
Details of the cost estimate are shown in the following table:

TA 7993 - INO: Metropolitan Sanitation Management Investment Project – MSMIP Final Report 179
Table VI-E 1: Summary of Cost Estimates ($ million)
Breakdown of Totals Incl. Cont.
Local
Base For. (Excl. Duties &
Cost Exch. Taxes) Taxes Total
1 Wastewater Treatment Works
a. Civil Works 11.09 13.28 7.77 4.18 1.33 13.28
b. Detailed Engineering Design 0.55 0.62 0.18 0.37 0.06 0.62
c. Construction Supervision 0.33 0.40 0.12 0.25 0.04 0.40
Subtotal 11.97 14.30 8.07 4.80 1.43 14.30
2 Wastewater Collection System
a. Civil Works 16.47 20.95 6.94 11.91 2.09 20.95
b. Detailed Engineering Design 0.82 0.93 0.28 0.56 0.09 0.93
c. Construction Supervision 0.49 0.61 0.17 0.38 0.06 0.61
Subtotal 17.78 22.49 7.39 12.85 2.25 22.49
3 Property Connections
a. Civil Works 8.63 11.28 4.23 5.92 1.13 11.28
b. Detailed Engineering Design 0.43 0.56 0.10 0.41 0.06 0.56
c. Construction Supervision 0.26 0.34 0.06 0.24 0.03 0.34
Subtotal 9.32 12.19 4.40 6.57 1.22 12.19
4 Land Acquisition 2.33 2.33 - 2.33 - 2.33
5 Involuntary Resettlement 0.54 0.59 - 0.59 - 0.59
T O T A L 41.93 51.90 19.86 27.14 4.90 51.90
Total
Cost
Source: PPTA Consultant’s estimates. a Based on estimates in the technical study.
b Includes taxes, duties, and contingencies (physical and price).
The total investment cost will be financed from three sources: AusAID Indonesia Infrastructure Initiative (AusAID-INDII), Central Government and City Government of Palembang. AusAID-INDII will finance $44.08 million equivalent for detailed engineering design, construction supervision and civil works; the Central Government will shoulder all taxes and duties of $4.90 million equivalent while the City Government will cover land acquisition, involuntary resettlement and property connections amounting to $2.92 million equivalent. The funds will be on-granted by AusAID-INDII, the Central Government and the City Government to the PDAM. The distribution of fund sources is detailed in the following table:
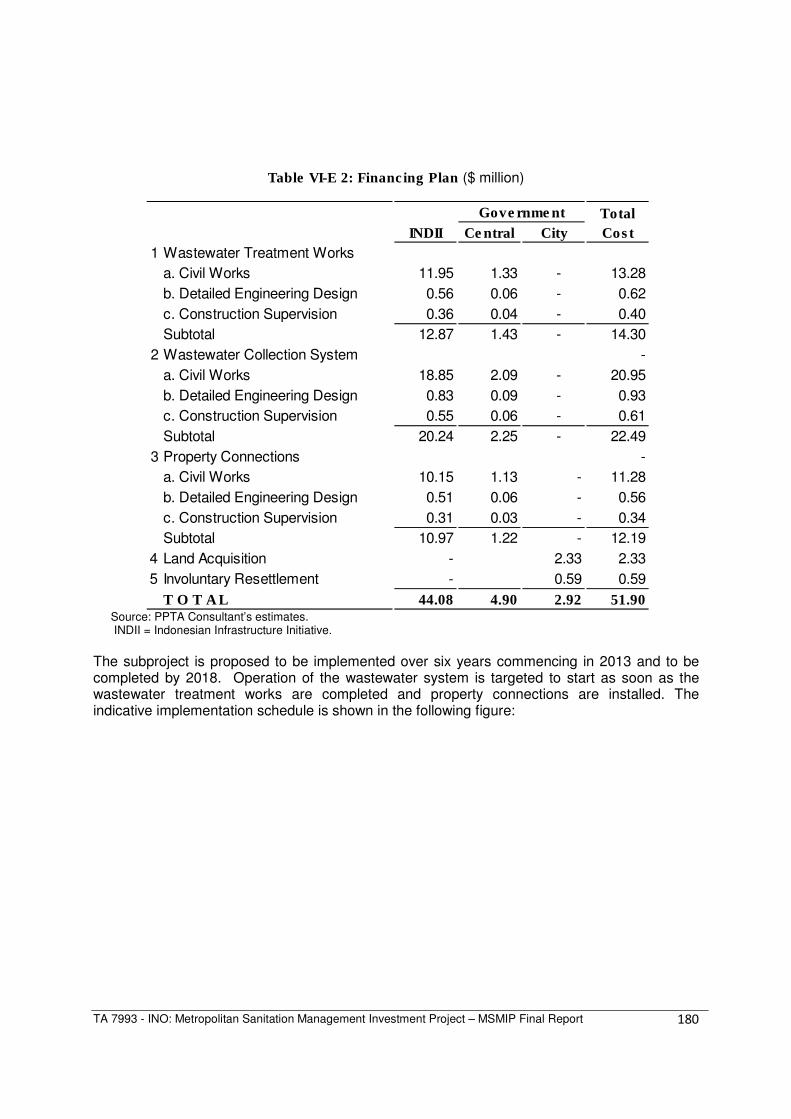
TA 7993 - INO: Metropolitan Sanitation Management Investment Project – MSMIP Final Report 180
Table VI-E 2: Financing Plan ($ million)
INDII Central City
1 Wastewater Treatment Works
a. Civil Works 11.95 1.33 - 13.28
b. Detailed Engineering Design 0.56 0.06 - 0.62
c. Construction Supervision 0.36 0.04 - 0.40
Subtotal 12.87 1.43 - 14.30
2 Wastewater Collection System -
a. Civil Works 18.85 2.09 - 20.95
b. Detailed Engineering Design 0.83 0.09 - 0.93
c. Construction Supervision 0.55 0.06 - 0.61
Subtotal 20.24 2.25 - 22.49
3 Property Connections -
a. Civil Works 10.15 1.13 - 11.28
b. Detailed Engineering Design 0.51 0.06 - 0.56
c. Construction Supervision 0.31 0.03 - 0.34
Subtotal 10.97 1.22 - 12.19
4 Land Acquisition - 2.33 2.33
5 Involuntary Resettlement - 0.59 0.59
T O T A L 44.08 4.90 2.92 51.90
Total
Cost
Government
Source: PPTA Consultant’s estimates. INDII = Indonesian Infrastructure Initiative.
The subproject is proposed to be implemented over six years commencing in 2013 and to be completed by 2018. Operation of the wastewater system is targeted to start as soon as the wastewater treatment works are completed and property connections are installed. The indicative implementation schedule is shown in the following figure:

TA 7993 - INO: Metropolitan Sanitation Management Investment Project – MSMIP Final Report 181
Figure VI-E 1: Indicative Implementation Schedule
1 2 3 4 1 2 3 4 1 2 3 4 1 2 3 4 1 2 3 4 1 2 3 4
Loan negotiation
Loan signing
Loan effectivity
Subproject Investments (for 5 Cities)
Main Works
Detailed engineering design (Grant)
Land acquisition and involuntary resettlement
Compensation for the WCS
Prequalification and bidding
Awarding of contracts
Construction of civil works
Waste Water Treatment Works
Trunk Sewers
Main Sewers
Storm Water Drainage
Laterals and Interceptors
Property Connections
Detailed engineering design
Prequalification and bidding
Awarding of contracts
Construction of civil works
WCS/WWTW LATERALS
2013 2014 2015 2016 2017 2018
The annual breakdown of costs by component is shown in the following table:

TA 7993 - INO: Metropolitan Sanitation Management Investment Project – MSMIP Final Report 182
Table VI-E 3: Estimated Annual Subproject Costs by Component
Totals Including Contingencies (US$ Million)
2013 2014 2015 2016 2017 2018 Total
1 Wastewater Treatment Works
a. Civil Works - 1.80 7.54 3.94 - - 13.28
b. Detailed Engineering Design 0.62 - - - - - 0.62
c. Construction Supervision - 0.05 0.23 0.12 - - 0.40
Subtotal 0.62 1.85 7.77 4.06 - - 14.30
2 Wastewater Collection System
a. Civil Works - 1.58 7.56 7.39 2.84 1.58 20.95
b. Detailed Engineering Design 0.93 - - - - - 0.93
c. Construction Supervision - 0.05 0.22 0.22 0.08 0.05 0.61
Subtotal 0.93 1.62 7.78 7.61 2.92 1.63 22.49
3 Property Connections
a. Civil Works - - 1.39 3.19 3.30 3.41 11.28
b. Detailed Engineering Design - - 0.07 0.16 0.17 0.17 0.56
c. Construction Supervision - - 0.04 0.10 0.10 0.10 0.34
Subtotal - - 1.50 3.45 3.56 3.68 12.19
4 Land Acquisition 2.33 - - - - - 2.33
5 Involuntary Resettlement - 0.05 0.22 0.21 0.08 0.04 0.59
T O T A L 3.88 3.52 17.26 15.33 6.56 5.35 51.90 Source: PPTA Consultant’s estimates.
F. Financial Analysis 1. Methodology and Assumptions.. The financial analysis followed the guidelines described in ADB’s Financial Management and Analysis of Project (2005). Three indicators of the financial viability of the subproject have been identified:
• Financial Internal Rate of Return (FIRR), the discount rate at which the net revenues generated by the subproject are equal to zero. A project is considered financially viable if the computed FIRR is at least equal to the weighted average cost of capital (WACC) applicable to the proposed subproject;
• Tariff affordability. The wastewater tariff should be affordable to low income households. • Subproject sustainability. Although funds will be on-granted to the PDAM, the subproject
should still generate sufficient cash flow from wastewater tariffs to cover annual operation and maintenance (O&M) expenses.
The key financial and technical assumptions used in the projections are the following: • Cost estimates at constant October 2012 prices. • Domestic and foreign cost escalations44 are as follows:
2013 2014 2015 2016 onwards
Domestic cost escalation 5.1% 4.8% 4.4% 4.4% Foreign cost escalation 1.9% 2.2% 1.9% 1.8%
44 ADB SERD, Domestic Cost Escalation Factors Update, October 2012 and World Bank projections as of September 2012 for international cost escalation factors.

TA 7993 - INO: Metropolitan Sanitation Management Investment Project – MSMIP Final Report 183
• Exchange rate at Rp9,600 to US$1.0045.
• Physical contingencies at 10% to 15% of direct costs. • Constant costs used in the computation of FIRR while current costs are used in the
financial statements. • O&M expenses based on technical projections and escalated at 4.4% annually. • Treatment plant capacity based on estimated 19,000 domestic and 2,400 non-domestic
connections. • Wastewater tariff is equivalent to 4.5% of water bill. • Collection efficiency of 95% based on average during the past five years. • Grant proceeds from AusAID, the Central Government and the City Government to the
PDAM (i.e. the PDAM will have no debt service obligations). a. Capital Costs
The total development cost for the subproject is $51.90 million equivalent, based on the costs presented in the technical study and includes physical and price contingencies.46 The basic development (investment) and O&M costs are projected on an annual basis for the purpose of the financial analysis, to allow for the timing of implementation and applicable escalation for both local and foreign cost components. Acquisition of the land required for the subproject and detailed engineering design are scheduled in 2013 prior to construction works. Construction will start by the second half of year 2014 and is targeted to be completed by the end of 2018. Operations will commence in 2016, with full operations expected by 2019.
b. Operations and Maintenance
The PDAM currently operates the water supply system. The proposed wastewater treatment and collection system is an additional facility to be operated by the PDAM. O&M expenses are estimated by the technical engineers and were based on the capacity of the wastewater system only, independent of the water supply system. Included in the incremental O&M costs are personnel costs, septage receival, sludge disposal, power cost, and provision for repairs and maintenance of the wastewater treatment and collection system. At 2012 constant prices, the total incremental O&M is estimated to be $0.491 million annually when full operation is achieved by end of 2018. This cost is likewise escalated to current prices for inclusion in the financial statements. c. Financing and Weighted Average Cost of Capital (WACC) The WACC is derived based on the financing plan, with each fund source given an investment weight expressed as a percentage, multiplied by the corresponding interest rate of the fund source, and adjusted for the prevailing inflation rate. It should be noted that proceeds will be on-granted to the PDAM. Details of the WACC computation are shown in the following table:
45 Bank of Indonesia. Average rate for period June to December, 2012.
46 To provide an effective wastewater treatment and collection service, the subproject will involve the construction of a wastewater treatment plant. trunk and main sewers, laterals and interceptors; installation of property connections; acquisition of land; and involuntary resettlement activities.
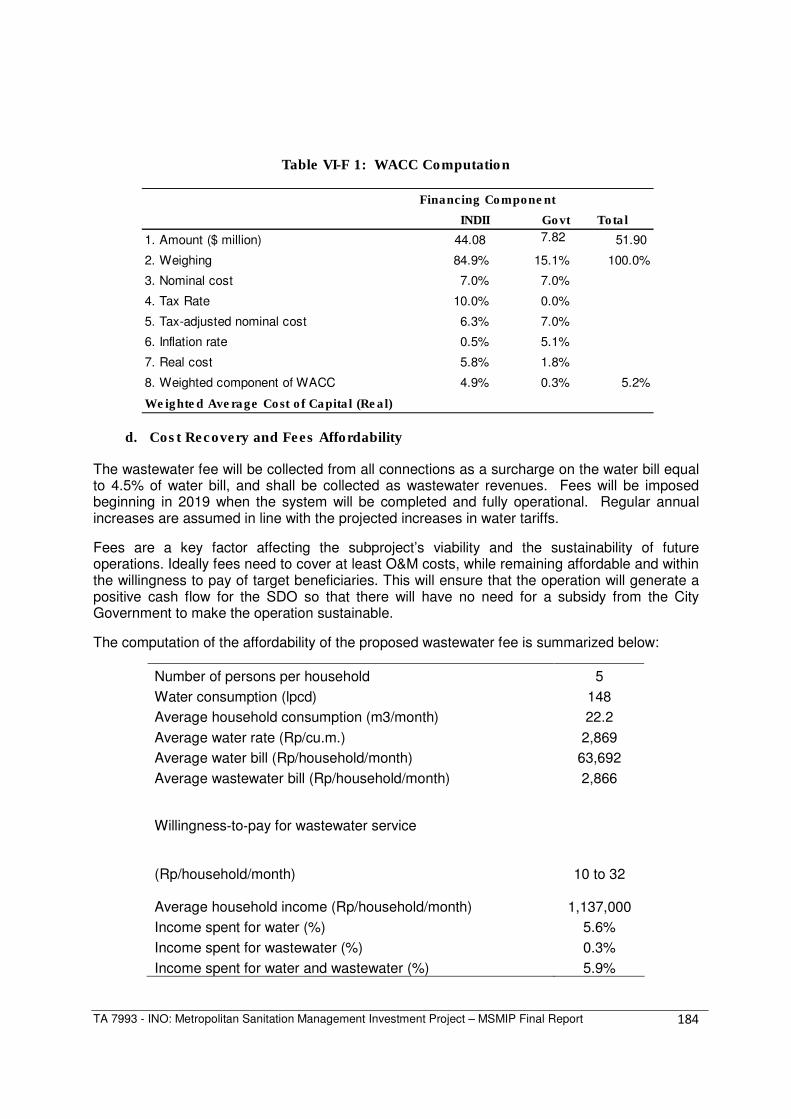
TA 7993 - INO: Metropolitan Sanitation Management Investment Project – MSMIP Final Report 184
Table VI-F 1: WACC Computation
INDII Govt Total
1. Amount ($ million) 44.08 7.82 51.90
2. Weighing 84.9% 15.1% 100.0%
3. Nominal cost 7.0% 7.0%
4. Tax Rate 10.0% 0.0%
5. Tax-adjusted nominal cost 6.3% 7.0%
6. Inflation rate 0.5% 5.1%
7. Real cost 5.8% 1.8%
8. Weighted component of WACC 4.9% 0.3% 5.2%
Weighted Average Cost of Capital (Real)
Financing Component
d. Cost Recovery and Fees Affordability
The wastewater fee will be collected from all connections as a surcharge on the water bill equal to 4.5% of water bill, and shall be collected as wastewater revenues. Fees will be imposed beginning in 2019 when the system will be completed and fully operational. Regular annual increases are assumed in line with the projected increases in water tariffs.
Fees are a key factor affecting the subproject’s viability and the sustainability of future operations. Ideally fees need to cover at least O&M costs, while remaining affordable and within the willingness to pay of target beneficiaries. This will ensure that the operation will generate a positive cash flow for the SDO so that there will have no need for a subsidy from the City Government to make the operation sustainable.
The computation of the affordability of the proposed wastewater fee is summarized below:
Number of persons per household 5
Water consumption (lpcd) 148
Average household consumption (m3/month) 22.2
Average water rate (Rp/cu.m.) 2,869
Average water bill (Rp/household/month) 63,692
Average wastewater bill (Rp/household/month) 2,866
Willingness‐to‐pay for wastewater service
(Rp/household/month) 10 to 32
Average household income (Rp/household/month)
1,137,000
Income spent for water (%) 5.6%
Income spent for wastewater (%) 0.3%
Income spent for water and wastewater (%) 5.9%
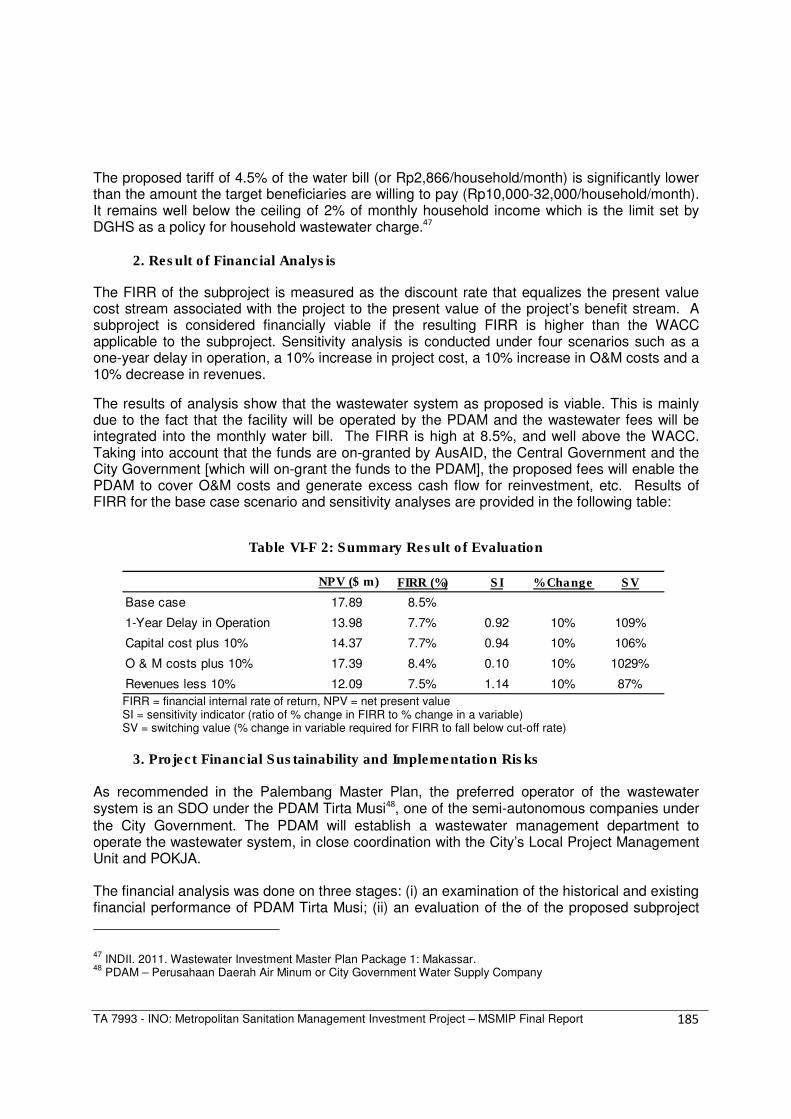
TA 7993 - INO: Metropolitan Sanitation Management Investment Project – MSMIP Final Report 185
The proposed tariff of 4.5% of the water bill (or Rp2,866/household/month) is significantly lower than the amount the target beneficiaries are willing to pay (Rp10,000-32,000/household/month). It remains well below the ceiling of 2% of monthly household income which is the limit set by DGHS as a policy for household wastewater charge.47 2. Result of Financial Analysis
The FIRR of the subproject is measured as the discount rate that equalizes the present value cost stream associated with the project to the present value of the project’s benefit stream. A subproject is considered financially viable if the resulting FIRR is higher than the WACC applicable to the subproject. Sensitivity analysis is conducted under four scenarios such as a one-year delay in operation, a 10% increase in project cost, a 10% increase in O&M costs and a 10% decrease in revenues.
The results of analysis show that the wastewater system as proposed is viable. This is mainly due to the fact that the facility will be operated by the PDAM and the wastewater fees will be integrated into the monthly water bill. The FIRR is high at 8.5%, and well above the WACC. Taking into account that the funds are on-granted by AusAID, the Central Government and the City Government [which will on-grant the funds to the PDAM], the proposed fees will enable the PDAM to cover O&M costs and generate excess cash flow for reinvestment, etc. Results of FIRR for the base case scenario and sensitivity analyses are provided in the following table:
Table VI-F 2: Summary Result of Evaluation
NPV ($ m) FIRR (%) SI % Change SV
Base case 17.89 8.5%
1-Year Delay in Operation 13.98 7.7% 0.92 10% 109%
Capital cost plus 10% 14.37 7.7% 0.94 10% 106%
O & M costs plus 10% 17.39 8.4% 0.10 10% 1029%
Revenues less 10% 12.09 7.5% 1.14 10% 87%
FIRR = financial internal rate of return, NPV = net present value SI = sensitivity indicator (ratio of % change in FIRR to % change in a variable) SV = switching value (% change in variable required for FIRR to fall below cut-off rate)
3. Project Financial Sustainability and Implementation Risks As recommended in the Palembang Master Plan, the preferred operator of the wastewater system is an SDO under the PDAM Tirta Musi48, one of the semi-autonomous companies under the City Government. The PDAM will establish a wastewater management department to operate the wastewater system, in close coordination with the City’s Local Project Management Unit and POKJA. The financial analysis was done on three stages: (i) an examination of the historical and existing financial performance of PDAM Tirta Musi; (ii) an evaluation of the of the proposed subproject
47 INDII. 2011. Wastewater Investment Master Plan Package 1: Makassar.
48 PDAM – Perusahaan Daerah Air Minum or City Government Water Supply Company

TA 7993 - INO: Metropolitan Sanitation Management Investment Project – MSMIP Final Report 186
on a stand-alone basis; and (iii) an evaluation of the impact of the proposed subproject on PDAM Tirta Musi. PDAM Tirta Musi’s Historical Financial Performance 2008-2011 The approach and methodology used in the assessment of the PDAM Tirta Musi’s financial performance included an analysis of historical trends in absolute values, in percentages and ratio analysis. Financial statements such as the income statements, balance sheets and cash flow statements covering the four-year period from 2008 to 2011 were reviewed.
Revenue and Expenses PDAM’s operating revenues are derived from water sales which comprise 88% of the total revenues, and non-water revenues composed of connection fees, fines, penalties and other miscellaneous charges. Water sales increased by 49% over the four-year period and details are presented in the following table:
Table VI-F 3: Operating Revenues 2008-2011 (in million IDR)
2008 2009 2010 2011 % Total % Inc.(Dec.)
OPERATING REVENUES
Water Sales 153,283 168,891 189,715 227,723 88% 49%
Non Water Revenue 29,089 27,508 25,223 31,677 12% 9%
Total 182,372 196,399 214,938 259,400 100%
PDAM Tirta Musi’s expenses are categorized as direct operating costs, indirect operating costs and non-operating expenses. Direct operating costs are expenses which are directly related to operations such as water treatment, water source and transmission and distribution. Indirect operating costs are composed of general and administration costs. The breakdown of expenses and percentages to total are shown in the following table.
Table VI-F 4: Expenses 2008-2011 (in million IDR)
DIRECT OPERATING COSTS 2008 2009 2010 2011 % Total % Inc.(Dec)
Water Source Cost 14,085 15,222 13,295 17,002 8% 21%
Water Treatment Cost 29,144 26,491 34,203 32,509 16% 12%
Transmission and Distribution Cost 32,461 37,720 39,402 45,982 23% 42%
Total 75,690 79,433 86,900 95,493 47% 26%
INDIRECT COST
Administration & General Cost 76,078 92,256 96,909 106,251 53% 40%
Non Operating Expense 3,758 346 1,346 319 0.2% -92%
Total 79,836 92,602 98,255 106,570 53% 33%
TOTAL EXPENSES 155,526 172,036 185,155 202,063 100% 30%

TA 7993 - INO: Metropolitan Sanitation Management Investment Project – MSMIP Final Report 187
Net Profit
PDAM Tirta Musi’s net profit (before tax) showed an upward trend in more recent years with an estimated average of IDR40.9 million per year. Net profit ratio is at 24% in 2011 or an average of 19% in the past four years. The results of operations are summarized below:
Table VI-F 5: Net Profit 2008-2011 (in million IDR)
2008 2009 2010 2011 %
OPERATING REVENUES 182,372 196,399 214,938 259,400 100%
Less: Direct Operating Costs 75,690 79,433 86,900 95,493 37%
Net Operating Profit 106,682 116,965 128,038 163,907 63%
Less: Indirect Costs 76,078 92,256 96,909 106,251 41%
PROFIT (LOSS) 30,604 24,709 31,129 57,656
Less: Non Operating Revenue and Expense
Non Operating Revenue 4,000 7,988 8,981 4,467
Non Operating Expense 3,758 346 1,346 319
Total 242 7,642 7,635 4,148
Net PROFIT (LOSS) BEFORE TAX 30,846 32,351 38,764 61,804 24%
Cash Flow
PDAM Tirta Musi’s cash flow comes from (1) operating activities, (ii) investing activities, and (iii) financing activities. Cash flow from operating activities includes receipts from water sales and other operating income while disbursements include payment of operating expenses including general and administration costs. Cash flow from investing activities includes additions and improvements on fixed assets; cash inflow from financing activities consisted of government investments and additional local government equity while cash outflow involves debt servicing. The PDAM’s cash position had been erratic in the past four years with a significant decrease in 2010 due to higher capital expenditures and increased payment of long-term debt. It maintained a cash balance of Rp 84.76 million on average in the past four years.
Assets
The company’s assets are composed mainly of fixed assets, cash on hand and in banks, accounts receivables, inventories and other assets. Fixed assets represented about 70% of total assets, with additional capital expenditures totalling to Rp156 million in the past four years. Cash on hand and in banks represented 65% of total current assets. Its current ratio improved significantly in the past four years showing an average ratio of 1.71:1 per year.

TA 7993 - INO: Metropolitan Sanitation Management Investment Project – MSMIP Final Report 188
Table VI-F 6: Assets, 2008-2011 (in Rp million)
2008 2009 2010 2011
CURRENT ASSETS
Cash & Bank 7,871 8,537 5,679 10,963
Deposit 72,000 138,000 38,000 58,000
Account Receivable 12,800 4,818 4,308 2,944
Other Receivables 210 205 87 4
Inventories 573 948 297 27,562
Prepaid Expenses - 119 - -
Advances Operation 1,512 1,051 1,903 3,811
Miscellaneous of Prepaid Expenses - 1,870 1,130 2,692
Total of Current Assets 94,966 155,549 51,404 105,975
20% 27% 10% 20%
NON CURRENT ASSETS
Fixed Assets
Price Acquisition 542,110 577,635 642,558 698,352
Accumulated Depreciation (208,289) (247,601) (285,978) (328,956)
Total Book Value of Fixed Assets 333,820 330,034 356,580 369,396
71% 58% 69% 70%
Other Assets 44,152 85,543 112,511 49,035
9% 15% 22% 9%
TOTAL ASSETS 472,938 571,126 520,495 524,406
ASSETS
Liabilities and Equity
PDAM’s liabilities are three times more than its equity, which means that operations are being financed mainly from borrowings. PDAM was able to liquidate or pay about Rp251 million of its obligations in the past four years, thereby decreasing liabilities by about 85%. Table VI-F 7 presents details of the liabilities and equity account.
Table VI-F 7: Liabilities and Equity, 2008-2011 (in million IDR)
2008 2009 2010 2011 % Total
Ave.
Inc.(dec.)
Short -Term Liabilities 232,012 86,167 32,734 34,829 7% -85%
Long-term Liabilities 176,777 153,702 137,806 122,593 23% -31%
Other Liabilities 7,126 223,315 185,755 160,160 31% 2148%
Equity 57,023 107,942 164,201 206,824 39% 263%
TOTAL LIABLILITIES AND EQUITY 472,938 571,126 520,495 524,406 100% 11%
LIABILITIES AND EQUITY
Projected Wastewater Subproject Operation
Separate financial projections were developed for the proposed wastewater subproject to determine its sustainability and its impact on the operations of PDAM Tirta Musi following full operations in 2019. The projected financial statements for the period 2015 to 2025 are summarized and presented in Tables VI-F8, VI-F9 and VI-F10. Selected financial ratios and performance indicators were used to analyse the results of operations and project viability.

TA 7993 - INO: Metropolitan Sanitation Management Investment Project – MSMIP Final Report 189
It is proposed that a wastewater or environmental fee be charged as a percentage of the water bill and included in the bill.49 Other assumptions used in the projections are those mentioned in Section 6.6.1. The revenues required for full cost recovery50 average $3.85 million per year from 2019-2025. Expenses are escalated based on the average percentage increases from 2008 to 2011. Depreciation expense is at $2.08 million per year based on a straight line computation assuming an estimated useful life of 25 years. The operation of the wastewater system shows favorable financial results throughout the analysis period. The projected balance sheet shows total assets increasing equally to the subproject cost of $51.92 million. The debt to equity ratios are expected to be low as the proceeds of the project are grant funds from INDII and the Central and City Governments. The liquidity position figured positively at the start of the operations at 58:1. Projected cash flows were also developed and likewise showed positive cash balances from 2019-2025. Impact of the Proposed Subproject on PDAM Tirta Musi’s Financial Position
PDAM Tirta Musi’s projected financial statements were developed based on historical trends. The SDO’s financial projections were then integrated to determine the impact of the subproject on PDAM Tirta Musi’s financial operations.
The wastewater subproject will generate an estimated total revenue of Rp37.67 million from wastewater fees during the first seven years of operation, or an average of Rp4.67 million per year. The projected total wastewater revenue is assumed to be equal to 4.5% of total water sales. On the other hand, O&M expenses for the wastewater system are approximately 1% of PDAM’s total operating expenses. With the subproject, PDAM’s operating ratios are projected to be about 62% per annum on average over the seven-year period. The consolidated income statement is presented in Table VI-F 11.
A consolidated balance sheet reflecting the combined operation of water and wastewater systems was prepared. The current ratio remains favorable (ranging from 4:1 to 15:1). The debt to equity ratio significantly improved from 1.2:1.00 in 2012 to 0.23:1.00 in 2019, due to the addition of project investments as a grant. The wastewater investment is approximately 27% of the total assets. The consolidated balance sheet and selected financial ratios are summarized in Table VI-F 12.
49 Based on Palembang Wastewater Investment Master Plan – Activity W004 Feasibility Study
50 Full cost recovery = operating and maintenance expense + depreciation expense

TA 7993 - INO: Metropolitan Sanitation Management Investment Project – MSMIP Final Report 190
Table VI-F 8
PALEMBANG - SDO
PROJECTED INCOME STATEMENT($ million)
2015 2016 2017 2018 2019 2020 2021 2022 2023 2024 2025
Operating Revenues
Waste Water Fees 3.045 3.471 3.957 4.511 5.143 5.863 6.684
Total Revenues 0.000 0.000 0.000 0.000 3.045 3.471 3.957 4.511 5.143 5.863 6.684
Operating Expenses
Payroll 0.000 0.000 0.000 0.000 0.089 0.093 0.098 0.103 0.108 0.114 0.119
Power Cost 0.000 0.000 0.000 0.000 0.104 0.109 0.115 0.121 0.127 0.133 0.140
Chemicals 0.000 0.000 0.000 0.000 0.107 0.113 0.119 0.125 0.131 0.138 0.145
Maintenance 0.000 0.000 0.000 0.000 0.123 0.129 0.136 0.143 0.150 0.157 0.165
Other O & M 0.000 0.000 0.000 0.000 0.273 0.286 0.301 0.316 0.333 0.350 0.367
Franchise Tax 0.000 0.000 0.000 0.000 0.000 0.000 0.000 0.000 0.000 0.000 0.000
Bad Debts 0.000 0.000 0.000 0.000 0.000 0.000 0.003 0.003 0.004 0.005 0.006
Total Operating Exp. - - - - 0.695 0.731 0.771 0.811 0.853 0.897 0.943
Net Income before depreciation - - - - 2.350 2.740 3.186 3.701 4.290 4.966 5.741
Depreciation - - - - 2.076 2.076 2.076 2.076 2.076 2.076 2.076
Net Income - - - - 0.274 0.664 1.110 1.624 2.214 2.890 3.665
Projected

TA 7993 - INO: Metropolitan Sanitation Management Investment Project – MSMIP Final Report 191
Table VI-F 9
PALEMBANG - SDO
Projected Balance Sheet ($ million)
2015 2016 2017 2018 2019 2020 2021 2022 2023 2024 2025
ASSETS
Fixed Assets
Fixed Assets in Operation 24.659 39.985 46.549 51.903 51.903 51.903 51.903 51.903 51.903 51.903 51.903
Less: Accum. Depreciation 0.000 0.000 0.000 0.000 2.076 4.152 6.228 8.304 10.381 12.457 14.533
Net Fixed Assets in Operation 24.659 39.985 46.549 51.903 49.826 47.750 45.674 43.598 41.522 39.446 37.370
Add: Work-in-Progress 0.000 0.000 0.000 0.000
Total Fixed Assets 24.659 39.985 46.549 51.903 49.826 47.750 45.674 43.598 41.522 39.446 37.370
Current Assets
Cash 0.000 0.000 0.000 0.000 2.316 4.713 7.817 11.394 15.580 20.424 26.035
Accounts Receivable (net) 0.000 0.000 0.000 0.000 0.000 0.304 0.347 0.426 0.486 0.557 0.635
Inventory 0.000 0.000 0.000 0.000 0.000 0.027 0.027 0.027 0.027 0.027 0.027
Other Current Assets 0.000 0.000 0.000 0.000 0.040 0.042 0.045 0.047 0.049 0.052 0.054
Total Current Assets 0.000 0.000 0.000 0.000 2.356 5.087 8.236 11.894 16.142 21.059 26.751
Reserves 0.000 0.000 0.000 0.000 0.034 0.073 0.112 0.157 0.201 0.253 0.304
TOTAL ASSETS 24.659 39.985 46.549 51.903 52.216 52.910 54.022 55.649 57.865 60.758 64.426
LIABILITIES AND EQUITY
Current Liabilities
Accounts Payable 0.000 0.000 0.000 0.000 0.040 0.069 0.072 0.074 0.076 0.079 0.081
Total Current Liabilities 0.000 0.000 0.000 0.000 0.040 0.069 0.072 0.074 0.076 0.079 0.081
Equity
Donated Capital 24.659 39.985 46.549 51.903 51.903 51.903 51.903 51.903 51.903 51.903 51.903
Retained Earnings 0.000 0.000 0.000 0.000 0.274 0.938 2.048 3.672 5.887 8.777 12.442
Total Equity 24.659 39.985 46.549 51.903 52.176 52.841 53.951 55.575 57.789 60.679 64.344
TOTAL LIABILITIES AND EQUITY 24.659 39.985 46.549 51.903 52.216 52.910 54.022 55.649 57.865 60.758 64.426
0.000 0.000 0.000 0.000 0.000 0.000 0.000 0.000 0.000 0.000 0.000
Projected

TA 7993 - INO: Metropolitan Sanitation Management Investment Project – MSMIP Final Report 192
Table VI-F 10
PALEMBANG - SDO
CASH FLOW STATEMENT, ACTUAL AND PROJECTED ($ million)
2013 2014 2015 2016 2017 2018 2019 2020 2021 2022 2023 2024 2025
Sources of Cash
Collection of Revenues - CY - - - - - - 3.045 3.167 3.610 4.085 4.657 5.306 6.049
Collection of Receivables - PY - - - - - - - - 0.304 0.347 0.426 0.486 0.557
Grant Funds - INDII 3.878 3.523 17.258 15.326 6.564 5.353
Central Government 0.155 0.348 1.704 1.512 0.649 0.531
INDII 1.394 3.128 15.335 13.607 5.839 4.781
City Government 2.329 0.047 0.219 0.207 0.077 0.041
Total Sources of Cash 3.878 3.523 17.258 15.326 6.564 5.353 3.045 3.167 3.915 4.432 5.083 5.792 6.606
Uses of Cash
Equity
Project Investment 3.878 3.523 17.258 15.326 6.564 5.353
O & M Expenses and Working Capital - - - - - - 0.695 0.731 0.771 0.811 0.853 0.897 0.943
Reserves - - - - - - 0.034 0.039 0.039 0.045 0.045 0.052 0.052
Total Uses of Cash 3.878 3.523 17.258 15.326 6.564 5.353 0.729 0.770 0.810 0.856 0.897 0.948 0.994
Increase(Decrease) in Cash - - - - - - 2.316 2.397 3.105 3.577 4.186 4.844 5.611
Add: Cash Balance, Beg. - - - - - - - 2.316 4.713 7.817 11.394 15.580 20.424
Cash Balance, End. - - - - - - 2.316 4.713 7.817 11.394 15.580 20.424 26.035
Projected

TA 7993 - INO: Metropolitan Sanitation Management Investment Project – MSMIP Final Report 193
Table VI-F 11
CONSOLIDATED INCOME STATEMENT
(In Million $)
2016 2017 2018 2019 2020 2021 2022 2023 2024 2025
OPERATING REVENUES
Water Sales 45.673 52.067 59.357 67.667 77.140 87.940 100.251 114.286 130.286 148.526
Non Water Revenue 4.015 4.175 4.342 4.516 4.696 4.884 5.080 5.283 5.494 5.714
Total 49.688 56.242 63.699 72.182 81.836 92.824 105.331 119.569 135.780 154.240
Revenues - Project - - - 3.045 3.471 3.957 4.511 5.143 5.863 6.684
Total 49.688 56.242 63.699 75.227 85.308 96.781 109.842 124.712 141.643 160.924
DIRECT OPERATING COSTS
Water Source Cost 2.602 2.810 3.035 3.278 3.540 3.824 4.129 4.460 4.817 5.202
Water Treatment Cost 4.322 4.538 4.765 5.003 5.253 5.516 5.792 6.081 6.385 6.705
Transmission and Distribution C 8.441 9.454 10.589 11.859 13.283 14.876 16.662 18.661 20.900 23.408
Total 15.365 16.803 18.389 20.141 22.076 24.216 26.583 29.202 32.102 35.315
Operating Cost- Project - - - 0.695 0.731 0.771 0.811 0.853 0.897 0.943
Total 15.365 16.803 18.389 20.836 22.807 24.987 27.394 30.055 32.999 36.258
PROFIT (LOSS) 34.322 39.440 45.310 54.391 62.501 71.794 82.448 94.657 108.644 124.666
INDIRECT COST
Administration & General Cost 19.505 21.846 24.467 27.403 30.692 34.375 38.500 43.120 48.294 54.090
Depreciation Expense -Project - - - 2.076 2.076 2.076 2.076 2.076 2.076 2.076
PROFIT (LOSS) 14.817 17.594 20.843 24.912 29.733 35.343 41.873 49.461 58.274 68.501
NON OPERATING REVENUE (EXPENSE)
Non Operating Revenue 1.207 1.460 1.767 2.138 2.587 3.131 3.788 4.584 5.546 6.711
Non Operating Expense 0.185 0.261 0.368 0.519 0.732 1.032 1.455 2.052 2.894 4.080
Total 1.022 1.199 1.399 1.619 1.855 2.098 2.333 2.531 2.652 2.631
PROFIT (LOSS) BEFORE TAX 15.839 18.793 22.241 26.531 31.588 37.441 44.205 51.992 60.927 71.131
TAX 3.326 3.947 4.671 5.571 6.633 7.863 9.283 10.918 12.795 14.938
NETT PROFIT (LOSS) 12.513 14.847 17.571 20.959 24.954 29.579 34.922 41.074 48.132 56.194
Projected

TA 7993 - INO: Metropolitan Sanitation Management Investment Project – MSMIP Final Report 194
Table VI-F 12 CONSOLIDATED BALANCE SHEET
(In Million $)
2016 2017 2018 2019 2020 2021 2022 2023 2024 2025 2026
ASSETS
CURRENT ASSETS
Cash & Bank 45.025 59.021 75.703 97.836 123.681 154.472 190.641 233.075 282.662 340.435 407.496
Deposit 6.042 6.042 6.042 6.042 6.042 6.042 6.042 6.042 6.042 6.042 6.042
Account Receivable 1.827 2.083 2.374 2.707 3.390 3.865 4.436 5.057 5.768 6.576 7.497
Other Receivables 0.040 0.042 0.043 0.045 0.047 0.049 0.051 0.053 0.055 0.057 0.059
Inventories 0.086 0.091 0.095 0.100 0.132 0.137 0.143 0.149 0.155 0.161 0.168
Advances Operation 0.507 0.532 0.559 0.587 0.616 0.647 0.679 0.713 0.749 0.786 0.825
Other Current Assets - - - 0.040 0.042 0.045 0.047 0.049 0.052 0.054 0.057
Miscellaneous of Prepaid Expenses 0.358 0.376 0.395 0.414 0.435 0.457 0.480 0.504 0.529 0.555 0.583
Total 53.885 68.186 85.211 107.771 134.385 165.712 202.518 245.641 296.011 354.666 422.727
NON CURRENT ASSETS
Fixed Asset
Price Acquisition 111.927 122.001 132.981 144.949 157.994 172.214 187.713 204.607 223.022 243.094 264.972
Accumulated Depreciation (67.484) (76.024) (85.333) (95.479) (106.539) (118.594) (131.734) (146.056) (161.668) (178.684) (197.232)
Total Book Value of Fixed Asset 44.443 45.977 47.648 49.470 51.456 53.620 55.979 58.551 61.354 64.410 67.740
Add: Fixed Assets (net)- Project 39.985 46.549 51.903 49.826 47.750 45.674 43.598 41.522 39.446 37.370 35.294
Total Fixed Assets 84.428 92.526 99.551 99.296 99.206 99.294 99.578 100.073 100.800 101.780 103.034
Other Assets
Work in process 4.931 4.931 4.931 4.931 4.931 4.931 4.931 4.931 4.931 4.931 4.931
Fixed Asset are not functioning 0.786 0.786 0.786 0.786 0.786 0.786 0.786 0.786 0.786 0.786 0.786
Accum. Depreciation/Allow. for Impairment (0.719) (0.740) (0.762) (0.784) (0.784) (0.784) (0.784) (0.784) (0.784) (0.784) (0.784)
Book value of (non-functional) fixed assets 0.067 0.046 0.024 0.002 0.002 0.002 0.002 0.002 0.002 0.002 0.002
Reserves - - - 0.034 0.073 0.112 0.157 0.201 0.253 0.304 0.364
Total of Other Assets 4.998 4.977 4.955 4.967 5.006 5.045 5.090 5.134 5.186 5.237 5.297
TOTAL ASSETS 143.311 165.688 189.716 212.034 238.596 270.051 307.185 350.849 401.997 461.683 531.058
Projected

TA 7993 - INO: Metropolitan Sanitation Management Investment Project – MSMIP Final Report 195
2016 2017 2018 2019 2020 2021 2022 2023 2024 2025 2026
LIABILITIES AND EQUITY
SHORT-TERM LIABILITIES
Accounts Payable 1.478 1.626 1.788 2.007 2.233 2.452 2.692 2.956 3.247 3.566 3.917
Non Accounts Payable 0.072 0.080 0.088 0.096 0.106 0.117 0.128 0.141 0.155 0.171 0.188
Accrued Expense 0.324 0.356 0.392 0.431 0.474 0.522 0.574 0.631 0.695 0.764 0.840
Production Service Liablities 1.577 1.734 1.908 2.098 2.308 2.539 2.793 3.072 3.379 3.717 4.089
Tax Payable 3.326 3.947 4.671 5.514 6.494 7.630 8.942 10.453 12.188 14.168 16.417
Long Term Debt Maturities 0.214 0.214 0.214 0.214 0.214 0.214 0.214 0.214 0.214 0.214 0.214
Total of Short Term Liabilities 6.991 7.956 9.060 10.361 11.829 13.473 15.343 17.468 19.877 22.600 25.665
LONG TERM LIABILITIES
Long Term Debt 12.770 12.770 12.770 12.770 12.770 12.770 12.770 12.770 12.770 12.770 12.770
Total of Long Term Liabilities 12.770 12.770 12.770 12.770 12.770 12.770 12.770 12.770 12.770 12.770 12.770
OTHER LIABILITIES
New Connection Guaranty - - - - - - - - - - -
Reserves of Production Fund 0.009 0.009 0.009 0.009 0.009 0.009 0.009 0.009 0.009 0.009 0.009
Miscellaneous Other Liabilities 0 0 0 0 0 0 0 0 0 0 0
Long-Term Liabilities Deferred payout 16.675 16.675 16.675 16.675 16.675 16.675 16.675 16.675 16.675 16.675 16.675
Total of Other Liabilities 16.683 16.683 16.683 16.683 16.683 16.683 16.683 16.683 16.683 16.683 16.683
EQUITY
Government Investments Unspecified status 6.223 6.223 6.223 6.223 6.223 6.223 6.223 6.223 6.223 6.223 6.223
Capital of Local Government 12.537 12.537 12.537 12.537 12.537 12.537 12.537 12.537 12.537 12.537 12.537
Grant 2.245 2.245 2.245 2.245 2.245 2.245 2.245 2.245 2.245 2.245 2.245
Donated Capital - Project 39.985 46.549 51.903 51.903 51.903 51.903 51.903 51.903 51.903 51.903 51.903
Retained Earnings- Project - - - 0.274 0.938 2.048 3.672 5.887 8.777 12.442 16.994
Profit (Loss) Retained 33.365 45.878 60.724 78.295 99.038 123.468 152.170 185.808 225.133 270.982 324.280
Profit (Loss)of Current Year 12.513 14.847 17.571 20.743 24.430 28.702 33.639 39.325 45.849 53.299 61.757
Total of Equity 106.867 128.278 151.202 172.219 197.313 227.125 262.388 303.927 352.666 409.630 475.939
TOTAL LIABLILITIES AND EQUITY 143.311 165.688 189.716 212.034 238.596 270.051 307.185 350.849 401.997 461.683 531.057
(0.000) (0.000) (0.000) (0.000) (0.000) (0.000) (0.000) (0.000) (0.000) (0.000) (0.000)
Selected Financial Ratios
Current Ratio 7.71 8.57 9.41 10.40 11.36 12.30 13.20 14.06 14.89 15.69 16.47
Fixed Assets/Total Assets 0.31 0.28 0.25 0.23 0.22 0.20 0.18 0.17 0.15 0.14 0.13
Net Profit Ratio (before tax) 31% 33% 34% 34% 36% 37% 39% 40% 41% 42% 43%
Total Debt/Equity Ratio 0.34 0.29 0.25 0.23 0.21 0.19 0.17 0.15 0.14 0.13 0.12
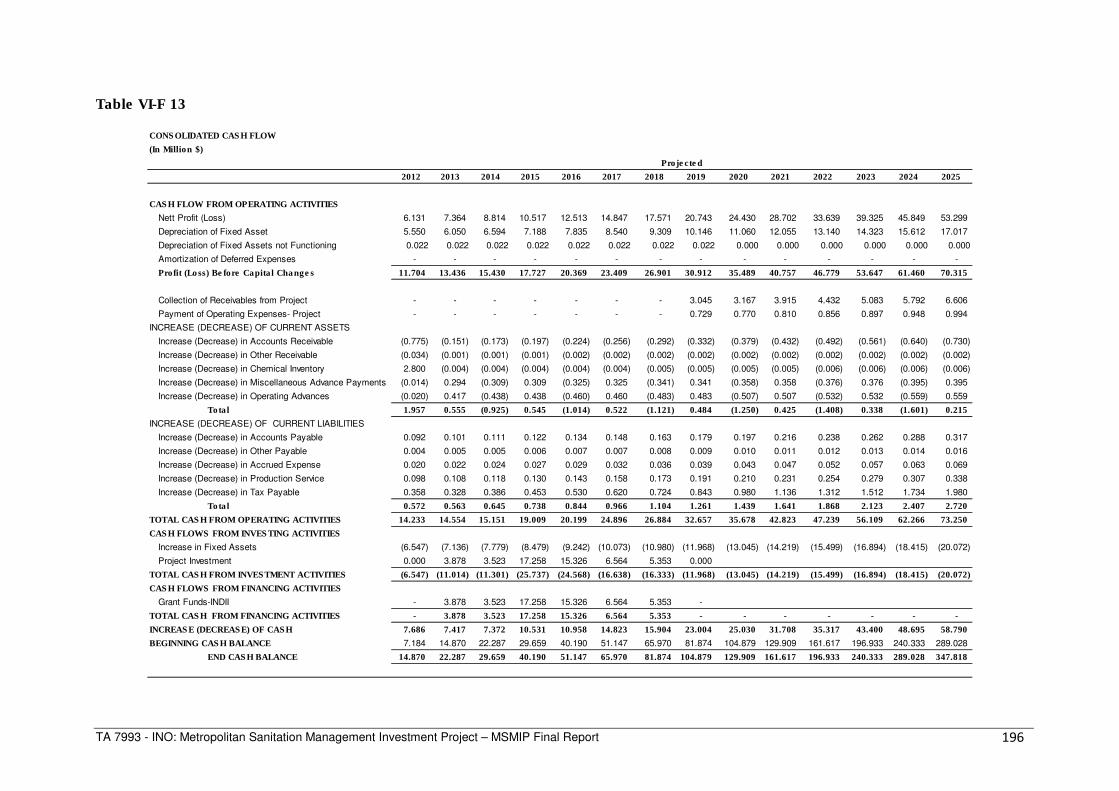
TA 7993 - INO: Metropolitan Sanitation Management Investment Project – MSMIP Final Report 196
Table VI-F 13
CONSOLIDATED CASH FLOW
(In Million $)
2012 2013 2014 2015 2016 2017 2018 2019 2020 2021 2022 2023 2024 2025
CASH FLOW FROM OPERATING ACTIVITIES
Nett Profit (Loss) 6.131 7.364 8.814 10.517 12.513 14.847 17.571 20.743 24.430 28.702 33.639 39.325 45.849 53.299
Depreciation of Fixed Asset 5.550 6.050 6.594 7.188 7.835 8.540 9.309 10.146 11.060 12.055 13.140 14.323 15.612 17.017
Depreciation of Fixed Assets not Functioning 0.022 0.022 0.022 0.022 0.022 0.022 0.022 0.022 0.000 0.000 0.000 0.000 0.000 0.000
Amortization of Deferred Expenses - - - - - - - - - - - - - -
Profit (Loss) Before Capital Changes 11.704 13.436 15.430 17.727 20.369 23.409 26.901 30.912 35.489 40.757 46.779 53.647 61.460 70.315
Collection of Receivables from Project - - - - - - - 3.045 3.167 3.915 4.432 5.083 5.792 6.606
Payment of Operating Expenses- Project - - - - - - - 0.729 0.770 0.810 0.856 0.897 0.948 0.994
INCREASE (DECREASE) OF CURRENT ASSETS
Increase (Decrease) in Accounts Receivable (0.775) (0.151) (0.173) (0.197) (0.224) (0.256) (0.292) (0.332) (0.379) (0.432) (0.492) (0.561) (0.640) (0.730)
Increase (Decrease) in Other Receivable (0.034) (0.001) (0.001) (0.001) (0.002) (0.002) (0.002) (0.002) (0.002) (0.002) (0.002) (0.002) (0.002) (0.002)
Increase (Decrease) in Chemical Inventory 2.800 (0.004) (0.004) (0.004) (0.004) (0.004) (0.005) (0.005) (0.005) (0.005) (0.006) (0.006) (0.006) (0.006)
Increase (Decrease) in Miscellaneous Advance Payments (0.014) 0.294 (0.309) 0.309 (0.325) 0.325 (0.341) 0.341 (0.358) 0.358 (0.376) 0.376 (0.395) 0.395
Increase (Decrease) in Operating Advances (0.020) 0.417 (0.438) 0.438 (0.460) 0.460 (0.483) 0.483 (0.507) 0.507 (0.532) 0.532 (0.559) 0.559
Total 1.957 0.555 (0.925) 0.545 (1.014) 0.522 (1.121) 0.484 (1.250) 0.425 (1.408) 0.338 (1.601) 0.215
INCREASE (DECREASE) OF CURRENT LIABILITIES
Increase (Decrease) in Accounts Payable 0.092 0.101 0.111 0.122 0.134 0.148 0.163 0.179 0.197 0.216 0.238 0.262 0.288 0.317
Increase (Decrease) in Other Payable 0.004 0.005 0.005 0.006 0.007 0.007 0.008 0.009 0.010 0.011 0.012 0.013 0.014 0.016
Increase (Decrease) in Accrued Expense 0.020 0.022 0.024 0.027 0.029 0.032 0.036 0.039 0.043 0.047 0.052 0.057 0.063 0.069
Increase (Decrease) in Production Service 0.098 0.108 0.118 0.130 0.143 0.158 0.173 0.191 0.210 0.231 0.254 0.279 0.307 0.338
Increase (Decrease) in Tax Payable 0.358 0.328 0.386 0.453 0.530 0.620 0.724 0.843 0.980 1.136 1.312 1.512 1.734 1.980
Total 0.572 0.563 0.645 0.738 0.844 0.966 1.104 1.261 1.439 1.641 1.868 2.123 2.407 2.720
TOTAL CASH FROM OPERATING ACTIVITIES 14.233 14.554 15.151 19.009 20.199 24.896 26.884 32.657 35.678 42.823 47.239 56.109 62.266 73.250
CASH FLOWS FROM INVESTING ACTIVITIES
Increase in Fixed Assets (6.547) (7.136) (7.779) (8.479) (9.242) (10.073) (10.980) (11.968) (13.045) (14.219) (15.499) (16.894) (18.415) (20.072)
Project Investment 0.000 3.878 3.523 17.258 15.326 6.564 5.353 0.000
TOTAL CASH FROM INVESTMENT ACTIVITIES (6.547) (11.014) (11.301) (25.737) (24.568) (16.638) (16.333) (11.968) (13.045) (14.219) (15.499) (16.894) (18.415) (20.072)
CASH FLOWS FROM FINANCING ACTIVITIES
Grant Funds-INDII - 3.878 3.523 17.258 15.326 6.564 5.353 -
TOTAL CASH FROM FINANCING ACTIVITIES - 3.878 3.523 17.258 15.326 6.564 5.353 - - - - - - -
INCREASE (DECREASE) OF CASH 7.686 7.417 7.372 10.531 10.958 14.823 15.904 23.004 25.030 31.708 35.317 43.400 48.695 58.790
BEGINNING CASH BALANCE 7.184 14.870 22.287 29.659 40.190 51.147 65.970 81.874 104.879 129.909 161.617 196.933 240.333 289.028
END CASH BALANCE 14.870 22.287 29.659 40.190 51.147 65.970 81.874 104.879 129.909 161.617 196.933 240.333 289.028 347.818
Projected

TA 7993 - INO: Metropolitan Sanitation Management Investment Project – MSMIP Final Report 197
G. Economic Analysis
1. Scope of analysis Economic analysis was undertaken for the proposed investments in off-site sewerage system in Palembang City. The proposed investments include: (i) a piped network of trunk sewers, main sewers, laterals and interceptors, including property connections for collecting wastewater from individual houses and commercial establishments within the subproject area51, and (ii) a 23.1MLD centralized wastewater treatment plant in Kecamatan Ilir Timur II. The economic analysis includes an evaluation of the economic feasibility of the proposed subproject and the impact of changes in key variables on the economic feasibility of the investments. The analysis also includes an analysis of the distribution of economic benefits to stakeholders, including the poor.
2. Economic costs and benefits
Economic costs and benefits are expressed in constant October 2012 prices using domestic price numeraire. Costs include capital investments for the piped sewerage network, centralized treatment plant, land, resettlement and O&M costs. The economic benefits that were considered in the analysis consist, among others, of (i) savings in health care costs for major sanitation-related diseases in the city such as diarrhea, typhoid and dengue resulting from reduced morbidity incidence due to improved wastewater management, (ii) avoided loss of income or productivity savings, (iii) avoided costs of desludging/constructing septic tanks, and (iv) averted costs of accessing polluted water for drinking and other domestic uses. The economic analysis was performed over a period of 25 years, including 5 years of investment implementation. Civil works construction was assumed to commence in 2014, with benefits starting to accrue in 2016.
Financial investments at constant prices amount to approximately Rp512.6 billion, of which 25% is for the treatment plant, 64% for sewer network, and the remainder for land and related investments. By excluding taxes/duties and applying a CF of 0.91, the total economic cost of the proposed subproject was estimated at about Rp419.9 billion.
3. Valuation of economic benefits
The economic benefits of the proposed sewerage system which were considered in the analysis and the bases for their valuation are as follows (see Annex B – Financial and Economic Analysis):
a. Health benefits. Providing wastewater collection and treatment facilities is expected to reduce the incidence of sanitation-related diseases which leads to reduced costs of medical treatment and related health care services. The analysis considered diarrhea/gastroenteritis, typhoid and dengue which are among the major morbidity cases in the city. Valuation of health benefits was based on the incidence rate of the diseases, average cost of treatment, the proportion of cases seeking medical treatment in existing medical care facilities, and the average duration of illness. In Palembang, the average cost of treatment for diarrhea patients in hospitals/clinics is Rp260,000/patient/day while for non-severe cases that do not require hospitalization, cost is about Rp80,000/day. For typhoid and dengue, the respective costs are Rp235,000 and Rp205,000/day.
51 Subproject coverage area is north of the Musi River which includes three of the sixteen kecamatans that
comprise Palembang City, i.e., Ilir Timur I, Ilir Timur II and Bukit Kecil.
TA 7993 - INO: Metropolitan Sanitation Management Investment Project – MSMIP Final Report 198
Reduction in the incidence of the disease was assumed at 35%52. The present value (PV) of health care cost savings within the subproject area over the 25-year period was estimated at Rp81.6 billion.
b. Avoided loss of income/productivity savings. People afflicted with the above
diseases are kept out of work and other daily activities resulting in loss of income or productivity. The economic impact of illness becomes critical especially when the patient is the sole or major income earner in the family. Reduced morbidity reduces loss of income/productivity. The value of this benefit was computed based on the proportion of patients who are economically active and the compensation that the person receives for being on the job or is actively engaged in income generation. Compensation was based on minimum wage in the city. For in-patients, total loss of income also includes the foregone income of household member(s) who provides care while the patient is confined in the hospital/clinic. It was assumed in the analysis that one household member assumes this role. Valuation of the additional foregone income also takes into account the number of days that the patient is sick, employment rate and average income of the person involved. PV of this health impact benefit was estimated at Rp48.8 billion.
c. Avoided costs of desludging/constructing septic tanks. This benefit is
generated because once a property is connected to the sewerage network it foregoes the need for regular desludging of the septic tank. The current cost of desludging septic tanks in Palembang City is around Rp188,000 per service. Desludging frequency was assumed at once every three years.53 For properties with no septic tanks but are connected to the sewerage system, the amount saved for not constructing a septic tank is an added benefit of subproject. Septic tank costs about Rp5.0 million. The present value of this benefit amounts to around Rp36.2 billion.
d. Averted cost of accessing polluted water for drinking/domestic use.
Unabated pollution of water sources because of uncontrolled and improper disposal of wastewater, including human excreta, correspondingly increases the cost of water especially for drinking and other domestic uses. Pollution leads to avertive behavior on the part of water users either through the use of more costly technologies to improve water quality, increased treatment or resort to alternative supplies (e.g., bottled water) which generally costs higher. This benefit was valued by estimating the total cost of water for both PDAM and non-PDAM users based on consumption rate, price of piped and non-piped water and attribution rate of pollution to total cost of water. In South Sumatra, domestic sources of pollution such as households, commercial and institutional establishments have been assessed to contribute 22% to water pollution, with industry contributing 70% and agriculture, 8%54. In the case of Palembang City, however, a higher attribution rate of 35% from domestic sources was assumed in the analysis considering that the subproject area has no significant industrial and agricultural sources of pollution and that direct disposal of human excreta and wastewater to rivers and waterways is common in some parts of the city. Based on these
52 Based on WHO data which estimated morbidity reduction rate for diarrhea of 22.7%-37.5% due to improved
excreta disposal. A survey and review of literature conducted by Esrey, et. al. also showed a 36% reduction in diarrhea incidence because of improved water supply and sanitation (Esrey, S.A, Potash, J.B. Roberts, and Shiff, C. Health Benefits for Improvements in Water Supply and Sanitation–Survey and Analysis of Literature on Selected Diseases, WASH Technical Report No. 66. 53
Based on SNI 03-2001: Tata Cara Perencanaan Tangki Septik Dengan Resapan, 2001. 54
World Bank Water and Sanitation Program, Economic Impacts of Sanitation in Indonesia, August 2008.

TA 7993 - INO: Metropolitan Sanitation Management Investment Project – MSMIP Final Report 199
assumptions, the PV of total averted costs was estimated at approximately Rp215.1 billion.
4. Un-quantified benefits There are other economic benefits to be derived from improved wastewater
management system which were not included in the analysis because of lack of data and the difficulty of valuing their respective economic impact. These un-quantified benefits include, among others, the following:
a. Health care cost savings from reduced incidence of other sanitation-related
diseases; b. Value of sludge derived from the wastewater treatment process for use in
agriculture either as soil conditioner or fertilizer; c. Increased agricultural productivity and value of fish catch due to reduced
water pollution; d. Increased value of land previously made unusable or rendered marginally
productive because of pollution; and e. Impact of improved wastewater management and reduced pollution on local
tourism and economy. 5. Results of the economic analysis Under the “base case”, the estimated economic internal rate of return (EIRR) of the
proposed investments is 12.6% which exceeds the assumed 12% economic opportunity cost of capital (EOCC) threshold, hence, the subproject is deemed economically feasible (Table VI-G 1). The total present value of net economic benefits (ENPV) amounts to Rp10.9 billion.
Table VI-G 1: Results of Economic Analysis (Base Case)
Subproject EIRR (%)
ENPV (Rp billion)
Palembang sewerage system 12.6 10.9
EIRR = economic internal rate of return, ENPV = economic net present value
6. Sensitivity analysis
Sensitivity tests assuming (i) a 10%-increase in capital investments, (ii) a 10%-increase in O&M costs, (iii) a 10%-reduction in total benefits, and (iv) one-year delay in total benefits result in EIRR that are either above or slightly below the threshold . A combination of the first three cases where investments and O&M costs increase by 10% while total benefits are reduced by the same rate - a condition that might be considered “worse case” scenario – results in an EIRR of 9.5% (Table VI-G 2).

TA 7993 - INO: Metropolitan Sanitation Management Investment Project – MSMIP Final Report 200
Table VI-G 2: Results of Sensitivity Analysis
Case
Change from Base Case (%)
EIRR (%)
ENPV (Rp billion)
Switching Value (%)
Capital investment O&M costs Total benefits 1-yr delay in benefits Combination (Cases 1, 2, 3)
+10 +10 -10
11.1 12.5 10.9 10.8 9.5
-17.4
9.6 -19.5 -24.0
-49.2
+4
+83 -4
-
-
EIRR = economic internal rate of return, ENPV = economic net present value, O&M = operation and maintenance.
The sensitivity analysis also indicates that the investments are most sensitive to reductions in total benefits, followed closely by increases in capital costs (which could possibly result from investment cost overruns). Changes in O&M costs were found to have very little impact on the economic feasibility of the investments.
7. Distribution of benefits
The proposed sewerage system will directly benefit a total of 83,600 people (19,000 households) and 2,336 commercial establishments within the subproject coverage area.
Households and commercial establishments are therefore the principal direct beneficiaries of the subproject. In addition to the afore-mentioned beneficiaries is PDAM Tirta Musi which will be service delivery organization (SDO) in the city. Of the estimated present value economic benefits of Rp420.1 billion, 79% (consisting of health and productivity savings, averted costs of accessing clean water, and cost savings from desludging/constructing septic tanks) will directly accrue to households. Commercial establishments will gain 12% of the benefits in terms of averted costs of accessing clean water and cost savings on septic tank maintenance. About 9% of the benefits will go to SDO in the form of service payments from those that are connected to the system and avail of the wastewater treatment service.
The poverty impact ratio (PIR) of the investments is 18%, which means that about one-fifth of the subproject benefits will directly accrue to thepoor. H. Gender Analysis and Gender Action Plan
1. Background and Objective
A gender-responsive project such as the MSMIP is one that involves an understanding of issues and problems from the perspectives of both men and women in the development process. Mainstreaming gender entails the integration of a gender perspective in the project design. Thus, Gender Analysis is undertaken for ADB projects to identify project design elements that will enable women to participate in and benefit from the Project. It identifies factors that have the potential to exclude women from participating in or benefiting from the Project. Data for this analysis were obtained from available material from socio-economic surveys that were prepared during the preparation of a Master Plan for Wastewater Management. Under the PPTA, gender analysis made use of qualitative methods such as key informant interview, community meetings and focus group discussion with women and those in low income communities. This is in addition to reviewing documents from
TA 7993 - INO: Metropolitan Sanitation Management Investment Project – MSMIP Final Report 201
Palembang City. Gender analysis looked into gender issues and differences in the roles and responsibilities of women and men, their participation in social and economic life and the differential impacts on their lives of sanitation programs and services. Women were a key part of PPTA process.
2. Gender Characteristics
About 12.5% of households in Palembang are formally headed by women (de jure) because of death, divorce or permanent absence of their husband. In addition to this number, households are also headed by women in the temporary absence of their husband (de facto female heads) as in the case of husbands who work in emerging industries (mining and agriculture plantation) outside Palembang.
In the consultations, it was noted that women headed households are often amongst the poorest because of their lack of labor power, lower income earning capacity and access to resources, and their lack of power and influence. Very often, the women heads of households are elderly. Without specific efforts made to include them, they may be excluded from participating and benefiting fully from development activities. Elderly women and widows are targets for information sharing on benefits and project subsidies.55
3. Gender Roles and Issues
There were 726 respondents of male family leaders (96.80%) and 24 female family leaders (3.20%). Domestic work such as cleaning the toilet, disposing of garbage, sorting garbage, looking after toddlers was done most of the time by women (>46.5%). Respondents who shared household responsibilities equally among husbands and wives were 36.9%. The involvement of women in the sanitation construction process was only approved by (12.7%) and around 11.3% of the respondents stated that they did not quite see the need for a waste water improvement plan. The approval was limited to women’s involvement in providing food (10.0%). It illustrates husband’s role in family’s finance.
These statistics indicate that women are not involved in public meetings or in making decisions about the household’s involvement in development programs. In relation with WWTP project, women still need to be encouraged to participate and be involved in the project, in order for them to benefit more. Community organizations in village level can facilitate greater participation of women in the project.
4. Willingness to Connect and Affordability
Many of those interviewed felt that they had no problem with their waste disposal system (direct to small river or drainage) but that if the city had a good program for the community, they would be willing to connect if the cost was not burdensome. This attitude was based on the sentiment that the members of the community already had some monthly payments such as water service (PDAM) and electricity to worry about. However, the city government has a pro poor policy and communities proposed a subsidy for house connection though the proposal was not for totally free connection. Furthermore, it was proposed that tariff/monthly fee depends on income class, a criterion being the type of house.
55 Additional/comparative data are included in the Poverty and Social Analysis, Annex D of the MSMIP Final Report.

TA 7993 - INO: Metropolitan Sanitation Management Investment Project – MSMIP Final Report 202
Feedback from the consultation shows a positive sentiment towards replicating PDAM (clean water) subsidy for connection service (Rp.300,000) for the poor. The tariff will be regulated in Regional Regulation (Peraturan Daerah-Perda) in 2013. From the SES, women’s involvement in future sanitation improvement activities shows that respondents were divided with 53% stating that women should be involved and 47% stating that women did not need to be involved with the project at all. However, 80% of those respondents who thought women should be involved believed that women’s role was to provide food and drinks. Another 13% claimed that the main role of women was as members of the organizing committees and 7% said that they should be involved in construction. However, focus group discussions revealed a strong demand by women for their involvement in all aspects of sanitation improvement.
From the consultation, women in kelurahan and neighborhood levels were willing to contribute to the project by socializing or promoting among their community members. The community spirit to contribute to sanitation improvement was very high especially among women organizations. There were those who acknowledged the need for the project and were ready to participate. Women leaders at IPAL area and along sewerage pipeline requested representation in the monitoring committee for resettlement and in construction of WWTP.
5. Sanitation Hot Spots The area around the proposed site for the WWTP site, Sei Selayur, Palembang, is surrounded by informal settlements in vacant government property. There are also permanent settlements nearby. While there is a need for improved sanitation in surrounding neighborhoods, the WWTP site is outside the sewerage service area. People also expect to benefit through job opportunities or livelihood assistance. The viability of proposed social inclusion measure involving installation of onsite sanitation facility with livelihood support for WWTP sites shall be discussed with all concerned in light of land tenure issue of informal settlers who may need to move to a new location shortly. The area also has a rubber factory that disposes off wastes into waterways, making for environmentally challenged living conditions. Local issues such as these shall be addressed in Joint Planning on Sanitation at the village and city levels. Other gender issue on sanitation is an acknowledged lack of awareness and understanding of the benefits of improved sanitation. However, this lack of awareness is seen as due to lack of socialization or public campaigns about the issue.
6. Local organizations and Gender Mainstreaming
Women will benefit by being mainstreamed into decisions about waste water services through participation on community groups/local organizations, and in project management structures. Through their participation in the project, it is expected that women will have a balanced representation on operational and monitoring aspects and show that they are valued members of the community whose opinions and abilities are respected.
The existing community local organizations are women’s groups like the (PKK), Youth groups (Karang Taruna), School groups of teachers and students, and Community and religious leaders in wastewater management, environmental sanitation and health and hygiene initiatives
Palembang city and the DKP have set aside a budget to be used as a gender fund (gender mainstreaming) which comes from APBD through BKBPP for some activities on gender

TA 7993 - INO: Metropolitan Sanitation Management Investment Project – MSMIP Final Report 203
aspects, such as household violence consultation, Gerakan Sayang Ibu (Mother Friendly Movement), but not in relation to waste water aspects. There is a Gender program under Social Institution (Dinas Sosial) and Female Empowerment and Family Planning Board (BPPKB Badan Keluarga Berencana dan Pemberdayaan Perempuan), that have activities concerning gender, that is IMP (Institusi Masyarakat Perkotaan) in sub-district level with women members from kelurahan/ villages. Their activities include socialization on Healthy and Clean Behavior, which are held during monthly meetings at the kelurahan level. It is important to involve these institutions to help in promoting and socializing the project.
Sanitation Pokja with SK Walikota and Forum Kota Sehat are active to facilitate health public campaign in sanitation promotion and development of sanitation based community. The member board of Sanitation Pokja is also board of Forum Kota Sehat.), those are health office, DKP, BPPKB have a sanitation awareness campaign.
7. Institutional Gender Assessment
For Sanitation Pokja members, gender focus is provided by the Social Institution (Dinas Sosial) and the Female Empowerment and Family Planning Board (BPPKB Badan Keluarga Berencana dan Pemberdayaan Perempuan).
At the Bappeda there is a staff ration of 40% (41 males) and 60% females (61). There are 30% - 40% females in management positions. There is no gender focal person or programs but there is a claim of no gender differentiation in terms of employment opportunities; criteria for hiring and promotion are based on merit. There are women leaders of projects such as PPTK. BAPPEDA and the Sanitation Pokja would support gender mainstreaming. Gender budget can be accessed from the Central Government Budget for Income and Expenditure (APBN) and Local Government Budget for Income and Expenditure (APBD).
Feedback was obtained from BAPPEDA and the Sanitation Pokja on possible pro-poor measures for the project. It is the idea that house connection would not be free of charge. There was agreement that subsidies may be given for connection for the poor which replicates the system at PDAM that now gives free clean water connection to the poor through subsidies of Rp300,000. Monthly fees for sewerage would depend on income class with tariff to be regulated in the Regional Regulation (Peraturan Daerah) for 2013. PERDA will socialize in public meetings. The agencies believe that women’s participation is important in health including in jobs in waste water infrastructure maintenance and sanitation promotion.
8. Safeguard Issues and Enhancement Measures
It was noted at consultations that access to information and employment opportunities in an infrastructure project can be limited for women. Women are employed as construction laborers in a number of regions, and both women and men may need to migrate to construction sites. Construction camps are frequently poorly serviced and unsafe for children, and construction sites may give little attention to occupational health and safety that exacerbate spread of water-borne diseases. The incidence of sexually-transmitted disease including statistics on HIV/AIDS in the city also needs to be managed since constructions camps involving migrant workers are often vulnerable to sexually transmitted diseases. The size of construction camps is managed with a quota for 35% local hiring and education on HIV/AIDS by both contractor and MSMIP.

TA 7993 - INO: Metropolitan Sanitation Management Investment Project – MSMIP Final Report 204
9. Gender Analysis and Strategy
Lack of awareness by men and especially women and satisfaction on existing sanitation services is seen as a constraint to achieving high rates of sewerage connection. Increased hygiene and sanitation information is perceived as a help which is consistent with the designation of hygiene and sanitation awareness as a component of the project. Joint sanitation awareness planning puts a focus on collective decision-making strategies and mobilizing authorities and stakeholders for sustained behavior change on hygiene and sanitation. This includes the agencies and local organizations such as the IMP (Institusi Masyarakat Perkotaan) which are already implementing sanitation awareness campaigns on the ground. Joint action is designed to influence social acceptance for sewerage connection and behavior change on sanitation not only within the project site but the entire city as well. Palembang’s incidence of poverty is at 10%. The poor includes women. Poverty is a constraint to participation in the sanitation improvement project. There are fears that sewerage pipe connection and even the monthly bill may be too expensive. A pro-poor policy for women headed households to maximize benefits for women should be set in place. There is consensus among community members and implementing agencies on the importance of pro-poor measures for those who are identified to need assistance which can be based on existing government subsidy programs for the poor with IEC in sanitation hot spots. The strategy is for free domestic connection for all but targeted subsidy for monthly fees for vulnerable groups including the poor, elderly and female-headed households. On the other hand, further discussion among stakeholders is strategic in considering willingness to contribute part of cost of connection consistent with recommendations to charge an affordable connection rate. There are sanitation hot spots along waterways and near the WWTP site where there is need for sanitation improvement but where there may be lack of capacity to pay for improved sanitation. A pro-poor measure is included to address sanitation and income lack in WWTP sites. However, the status of informal settlements on the nearby government land needs to be ascertained in view of proposed support for onsite sanitation installation and livelihood assistance for communities near the WTTP site. Installing onsite sanitation or establishing livelihood development needs to be assessed for viability on account of land tenure situation. . On the whole, universal connection and subsidies help women and low income households. Proposed interventions for onsite sanitation improvement as well as livelihood development assistance promote social inclusion for the WWTP sites which are outside of coverage area for sewerage improvement. Technical constraints such as lack of PDAM/steady supply of water, satisfaction with onsite connection, tight space, connection to onsite systems and the like will need active consideration by village authorities and residents and designers during the sanitation audit and design and construction phases. Strategies to reach absentee homeowners will also need to be discussed at connection phase since significant numbers are renters. Problem solving on connection issues shall be facilitated through participatory processes and collective decision making as proposed in Implementation Arrangement Plans for Gender and Social Development, Stakeholder Communication Strategy and Community Participation Plan. Women, community organizations and institutional partners in Palembang City agree that gender analysis and women participation in sanitation promotion can ensure maximum participation by women. A Gender Action Plan and gender inclusive capacity building and joint sanitation advocacy planning promotes active roles of stakeholders where the needs of both women and men are addressed and women’s organizations are enlisted for sanitation advocacy and for better social and economic outcomes. Their participation in working groups

TA 7993 - INO: Metropolitan Sanitation Management Investment Project – MSMIP Final Report 205
for implementation, monitoring of resettlement and WWTP operations shall be ensured. In addition, quotas for female promotion (10% more in addition to current 35% in management positions) as well as for training (50%) and decision making, promote women empowerment at staff and community levels. MSMIP is an opportunity and catalyst for women to become involved in development. By their continued and increased involvement in development projects, women become accepted as responsible and productive individuals even outside the household. Otherwise, the male-dominated worldview that was expressed in the consultations and surveys will simply continue as it has for generations. Sensitivity to these issues is needed; the chances to mainstream women’s involvement in the development process exists but should be exercised. Finally, potential social risks are also managed such as the influx of migrant workers exacerbating sanitation and social and health concerns such as waterborne diseases through poor sanitation and sexually transmitted diseases due to workers camps. Pro-poor and inclusive measures are quotas for local workers (35%) with preferential hiring from low income communities and requirements for water and sanitation standards at workers camps.
10. Gender Action Plan The Gender Action Plan below (under category of Effective Gender Mainstreaming) summarizes how the Project will benefit both men and women and how different components of the Project will address gender disparities and enhancement opportunities in plan implementation. Targets may be revisited during project implementation.

TA 7993 - INO: Metropolitan Sanitation Management Investment Project – MSMIP Final Report 206
Table VI-H 1: Gender Action Plan, Palembang
Strategies Project Outputs and GAP Targets
Output 1: Completed Infrastructure Development of Off-Site Waste Water Systems
Promote
Women and
Community
involvement in
construction,
operation and
decision
making
• At least 40% of participants in public consultation and sewerage connection campaign activities are women and vulnerable groups such as female headed households) who get full information about subsidized connection fees and criteria for subsidized monthly tariffs
• At least 40% women participants in consultations on resettlement/land acquisition • Future sanitation tariff increases take into consideration gender and affordability
through 50% women participation in public hearings for tariff hikes • Information bulletin on risks of HIV/AIDS relayed through appropriate media with civil
works contractors providing information/preparing code of conduct for workers • Consultation with men and women, especially mothers, during the design finalization
of WWTP schemes to ensure that children's safety is considered during construction. • Contractor provides safe working conditions, a work environment free of harassment
with adequate water and sanitation facilities in work camps with separate sanitation facilities for women.
Promote
inclusive
access to
sanitation
services
• Universal connection through free or subsidized domestic connection • At least 10% of connected households being from poor and female-headed or
vulnerable people (e.g. old, sick, disabled) through subsidized monthly fees • Onsite sanitation managed by CBOs established in non-sewered hot spots near the
Waste Water Treatment Plant sites connecting at least 90% of households disposing waste water into waterways with at least 50% of households being from poor, female-headed household or vulnerable groups (if population will otherwise not have access to sanitation infrastructure) implemented in coordination with eligible NGO.
Increase
Livelihoods
and
Employment
• Civil works construction shall employ at least 35% local labor from urban poor women and their families where there is equal pay for men and women for work of equal type
• Sanitation and livelihood development fund of at least $55,00056 shall be set aside and additional sources raised as needed for low income areas around the Wastewater Treatment Plant sanitation hotspots for onsite sanitation improvement (if population will otherwise not have access to sanitation infrastructure) at Sei Selayur, Palembang
• Livelihood seed fund of $8,000 (included in Sanitation/livelihood Development Fund) supports viable livelihood for at least 50 women and their organization near the WWTP.
Output 2: Completed capacity building for strengthened sanitation strategy and institutional
capacity
Equity in staffing
• PMU/IA and Service Delivery Organization to be established shall strive for gender equity; where female staff is 40% or under, at least 10% female staff and 10% increase of females in management positions shall be added by 2018 based on
56 This amount per city is inclusive of onsite sanitation budget of $42,000 with $8,000 Livelihood Development Seed Fund and $5,000 for capacity building on sanitation system O and M and livelihood development. This will be allocated upon completion of needs assessment. This represents funds that can be augmented by other agencies for both livelihood development and sanitation improvement. For instance, the area may be scheduled for installation of onsite sanitation system under the WW Improvement Master Plans of the cities.

TA 7993 - INO: Metropolitan Sanitation Management Investment Project – MSMIP Final Report 207
Training and
Capacity
Building and
Institutional
Set up
project baseline to be established (Baseline is 60% female staff and 35% in management position for BAPPEDA.)
• Specific gender and sanitation training modules and technical/management capacity development training are open to managers and staff at all levels (i.e. national, districts) to promote professional advancement of female staff where at least 50% of participants are women for in training on gender, community facilitation, utility management, technical and project/sector management-related skills
• At least 50% are women who participate in capacity building on hygiene and sanitation education, promotion, planning and participatory monitoring – e.g. WWTP impacts, etc.
• At least 40% of women in key decision-making and working groups such as Resettlement Committees, monitoring committees, Community supervision mechanism for Joint Sanitation Plan implementation, O and M structure and for onsite sanitation systems
• Gendered indicators in PPMS and GAP in quarterly reporting • A full-time Social/Gender specialist shall be hired in PMU.
Output 3: Improved communication and public information on hygiene and sanitation
Improved mechanism for public feedback and hygiene and sanitation promotion
• Women and community organizations such as PKK are partners in IEC and Joint Sanitation planning and delivery where at least 50% are women.
• 50%-50% male and female for community facilitators for awareness raising where male facilitators target male population to share responsibility for complaint reporting/management and sanitation promotion
• Joint sanitation marketing and sustainability planning and implementation with at least 50% female attendance in consultations and membership in implementation mechanisms.
I. Poverty and Social Analysis The Asian Development Bank supports equitable and sustainable social development outcomes by giving attention to the social dimensions of its operations. A Social and Poverty Analysis is mandatory for all ADB projects to examine social development issues and a project’s potential effects, especially on poor people. Social analysis and poverty analysis are critical tools in ADB’s efforts to reduce poverty since these address the processes and structures that exclude some groups from participating in and benefiting from economic development. Thus, ADB adopted social development policies and strategies covering such issues as gender and development, social protection, and cooperation with nongovernment organizations (NGOs); social safeguard policies on involuntary resettlement and indigenous peoples as reflected in the ADB’s Operations Manual.
1. Key Findings of Socio-economic Survey (SES) and Stakeholder Consultations The following is based on a Socio-Economic Survey of “Domestic Wastewater Management and Wastewater Investment Program under the AusAID-assisted Indonesia Infrastructure Initiative (INDII).The respondent rumahtangga (RT or household) were chosen in settlement clusters of sample kelurahan (village) where the surveys were carried out in all of the City’s administrative districts, including project villages, in January and February 2011. Survey data were augmented with information gathered from communities, women and vulnerable groups, as well as from village officials and concerned agencies during project preparation. In addition, a limited survey of target households and business establishments was also undertaken in September 2012. Updated health and official data were also obtained from the

TA 7993 - INO: Metropolitan Sanitation Management Investment Project – MSMIP Final Report 208
city. Critical outputs were presented to key partners for a consensus on the findings and needed interventions.
a. Population Characteristics Palembang City has 16 kecamatan (districts) which are subdivided into 107 kelurahan (villages). Based on the country’s official census in 2010, the City has a population of 1.45 million and 330,933 households which are generally categorized as MBR (low-income) and non-MBR, of which, 40.8% are from the MBR classification while 59.2 % are from the non-MBR category. The households that belong to the MBR category live in houses made of light materials, less than 60 m² in size, and without registered electricity connections consuming 900 watts per month. The households in non-MBR category belong to the middle income and the above middle income group of the society. They live in houses made of permanent materials and are more than 60 m2 in size while also having registered electricity connections. The population density of Palembang is 3,941 people per kilometer square as against the national population density of 72.95 people per km2. The population growth rate of Palembang City is 1.1%. The employed population is 1,046,098 according to the SES done by AusAid INDII in 2011. The Poverty threshold for 2012 in Palembang is Rp. 290,741 per person/month while it is Rp. 1,162,964 per household. According to the Bureau of Statistics in Palembang, the poverty incidence there is 10% of the households. There were 750 sample households interviewed; of the respondents, 450 households (or 60%) lived close to the watershed while 300 households (40%) lived far from the watershed. This distribution is a consequence of the river Musi and the watery landscape that Palembang is built upon. The physical environment should be considered in factoring Socio-economic data and statistics since they reflect real constraints that the people of Palembang negotiate daily. Concerning the heads of households, 96.8% were headed by men while 3.2% were headed by women. The respondents consisted of 483 males (64.4%) and 267 females (35.6%). More than 77% of the respondents had completed high school or lower, compared to the combined 19% of respondents who graduated high school and college. The education of the remaining 4% of the households is unknown.
b. Need for Improved Sanitation Services
The water supply of Palembang City is provided by PDAM Tirta Musi; 85% of the households in Palembang are covered although water is not in optimum supply for 24 hours of the day. More than 67% of the respondents derived their water needs both PDAM and groundwater sources. Of the respondents who are covered by PDAM, 71.3% use the water for showering and for the toilet while 11.7% use the water from PDAM for drinking. About 19.2% of the respondents consumed an average of 1 m³, 71.2% by about 1-3 m³ and 9.6% of the households by more than 3 m³, per day. These volumes of water are consumed by 91.3% of the households whose houses have their own bathrooms and toilets, the wastewater of which could be released into open drains. From the results of a survey in 2008 by the Health Department of Palembang in 2008, it shows that 89.6%households are family households who have latrines and of the 184,938

TA 7993 - INO: Metropolitan Sanitation Management Investment Project – MSMIP Final Report 209
who have latrines, 85.6% of the family latrines can be considered healthy. If seen by the distribution centers, the areas with the highest healthy latrine ownership is the Puskesmas Merdeka in District Small Hill (98.3%), while the least healthy latrines are the health centers in the Gandus region (65.0%), outside of the target area. According to the SES by INDII, 73.7% of public latrines are equipped with septic-tanks. However, these septic-tanks are considered unhygienic because wells are not provided. On wastewater disposal, some households dispose their liquid wastes through open or closed sewers or directly into the river. Drainage fees in Palembang ranges from Rp 100.000 - 300,000, the relatively high costs of which could explain the high incidence of disposing liquid wastes directly into open drains or the river and added financial costs for medical treatment. The survey reflected that a sick family member could. The lack of proper or adequate sanitation services could lead to sickness in the community spend Rp.500.000 or less for medical treatment. This financial social cost was translated into the loss of work time, as disclosed by 24.8% of male and 20.3% of female respondents. The total loss of working time is 5 days according to 14.1% of the respondents, and between 5-10 days according to 8.4% of the respondents. On the aspect of environmental sanitation and waste management, the government has been providing transport pick up services for garbage to the Final Waste Disposal. However, 55.6% of the respondents declared that they have not been served by government services since their locations could not be reached to collect their garbage. The lack of access of sanitation services could be a contributing factor to the disposal of solid and liquid wastes into bodies of water and the surrounding environment of the project area. Households using the services are charged at the range of Rp. 10.000 - Rp. 100.000 per month. Payments are made through a village tax levy imposed by the villages and the households. Another contributing factor to the low level of environmental sanitation in the Palembang environs could be the incapacity of some people to afford sanitation services.
c. Affordability and Demand for Improved Sanitation Services
In Palembang, there is a widespread perception that the government is not doing enough to fulfill its obligation to the people. On the weaknesses over the delivery of sanitation services, 63.2% of the respondents pointed to the lack of public interest, 39.6% for the absence of socialization and information to the public and 46.3% on lack of government's response to citizen’s complaints. The lack of public interest surfaces as the main reason for deficient sanitation, followed by government’s inadequate response to the people’s needs. The absence of socialization and information for the public is also high at almost 40 percent. The sentiment regarding the government's plan to construct the communal waste water treatment system reflects a response from the majority (76.3%) who disclosed that they do not want to get involved, 11.6% for involvement in the development stage, 8.3% on the maintenance phase and 2.3 % during the stage of socialization. The high level of sentiment concerning non-involvement in the project poses a challenge to the Community Mobilization team which will need to design ways to catch the interest of the target population. Consultations suggest the mediation of village leaders and community organizations in the socialization process in raising awareness on health impacts of poor sanitation. The survey data concerning the willingness of people in Palembang to be connected to the waste-water sanitation facility reflects low percentages in the responses. About 19.8% of the respondents expressed their interest on the use of individual septic tanks equipped with wells; 12.9% indicated the ability to fund less than Rp 500,000 for installation. For individual septic-tank system with communal wells, 5.1% indicated their interest to connect; 8.5% of the respondents were not willing to be connected with sewerage the services; 2.8% indicated no interest if the cost is more than Rp 100,000. This threshold for connection expense was

TA 7993 - INO: Metropolitan Sanitation Management Investment Project – MSMIP Final Report 210
supported by women from poor communities as well as by women representatives from low to mid-income levels. Some from sanitation hot spots indicated willingness to connect only if service connections would be free. One way to determine affordability is to contrast household income levels with expenses. Among the respondents, 15.7% had a monthly income below Rp. 1,000,000. Those who earned Rp. 1,001,000 to Rp. 2,000,000 monthly were 30.8%. Households with income between Rp. 2,001,000 to 5,000,000 a month were 35.2% while those who earned more than 5,000,000 rupiah a month were 18.3%. Family expenses for food, by way of rice and meat were disaggregated by the SES survey between MBR and non-MBR households. MBR households had 15% spending less than Rp. 500,000 while 22% could spend between Rp. 501,000 to Rp. 1,000,000. MBR households barely reflected any expenditure above this threshold. As for non-MBR households, 7.1% spent below Rp. 500,000 while 27.2% spent between Rp. 501,000 to Rp. 1,000,000. There were 18.3% non-MBR households who spent between Rp. 1,001,000 to Rp. 2,000,000. There was 4.1 % spending between Rp. 2,002,000 to Rp. 3,000,000 while only 2.5% could spend more than Rp. 3,000,000 on food every month. Family expenses for water by MBR households were 24.4% for those spending below Rp. 10,000 and 5.6% for those spending Rp. 11,000 to Rp. 50,000. Non-MBR households spending below Rp. 10,000 were 27.2% while those spending between Rp. 11,000 to Rp. 50,000 were 24.8 %. Both MBR and non-MBR households reflected minimal percentage above Rp. 50,000 for water expenses per month. Family expenses for electricity by MBR households spending below Rp. 100,000 were 28.1% while non-MBR households spending below Rp. 100,000 was only 14%. For the expense range of Rp. 101,000 to Rp. 500,000, MBR households reflected 9.9% while 41.6% of non-MBR households could afford this expense rate. No MBR and non-MBR households spent more than Rp. 501,000 for electricity. Family expense for communication spending was in the range close to Rp. 100,000 at 18.9% for MBR households while non-MBR households reflected 14.9% in this range. For the spending range of Rp. -101,000 to Rp. 500,000, MBR households reflected 6.7% while non-MBR households reflected 34.4%. Communication expenditure above Rp. 500,000 by MBR households is nil, while for non-MBR households it is 1.9%. Family expenditure for education by MBR households was 5.1% for spending below Rp. 100,000 while it was 11.8% for spending between Rp. 101,000 to 500,000. For non-MBR households, expenditure below Rp. 100,000 was 4.1% while for the range between Rp. 101,000 to 500,000 it was 22.8%, and 8.3% for spending beyond that. Among MBR or poorer households, only 8.1% spend on garbage disposal at less than Rp.50,000 while 29.2% of non-MBR households spend less than Rp.50,000 on garbage disposal. These expenditure for garbage disposal imply either a low willingness to pay for garbage disposal, low service availability or a low affordability of service. On the other hand, levels of communication spending can be compared to proposed sewerage tariffs vis-à-vis the importance of the service. The respondents (13.8%) object to community sanitation systems in the form of owning septic tank without the necessary the wells, and 13.8% desired to have their own septic-tank with wells. Among the constraints cited for willingness to participate to sewerage connection was affordability; 6.9% admitted their limited capacity on funding. Even if there is an alternative to payment scheme by installment, only 4.8% of the respondents were willing to be connected while 25.6% of households were not willing to be connected at all.

TA 7993 - INO: Metropolitan Sanitation Management Investment Project – MSMIP Final Report 211
Consultations at sanitation hot spots and among women leaders indicate that the biggest hurdle aside from affordability question for some households is the perception that there is nothing wrong with existing sanitation systems. They therefore suggest more socialization on the matter. In FGDs that were conducted for the Master Plan, willingness to connect to a sanitation/sewerage system by income level is as follows: Piping Installation Non Iow income : Rp. 1.000.000 < x< Rp. 1.500.000 Low income : Rp. 500.000 < x< Rp. 1.500.000 (government subsidies) Non low income will build standard septic tank (communal or individual) : Rp. 500.000 < x< Rp. 1.500.000 (government subsidies or sharing). Desludging fee : Low income : Rp. 200.000 Non low income :Rp. 350.0000 Monthly fee Low income : 5.000 – Rp.10.000,- Non low income Rp. 20.000-Rp.25.000 Fifteen per cent of the respondents prefer the options of alternative systems like the off-site individual family latrine, house connections, inspection holes and piping networks. Concerning the MSMIP WWTP, about 10.1% agreed to connect to sewer pipes of the project if funding is less than Rp.17.000. For 10.2% of the respondents, a levy of Rp 20,000 per month is reasonable if they are connected to the service. Consultations in poorer communities indicated willingness to pay no more than Rp5000 due to many competing family expenses. These statistics reflect many opinions concerning waste disposal and sanitation methods which may be improved by more community consultations to work out specific constraints to connection. Social and economic issues also need to be addressed with sensitivity to the existing and potential capacity of the Palembang people to improve their sanitation and living environment. The family expenses data and statistics reveal more priority to food, electricity, water, education and communication than to garbage disposal. The links of sanitation improvement are accorded less importance than improvements in other areas of expenditure. These issues may be addressed by further participatory community consultations and workshops that will raise awareness about sanitation as well as become a nexus for mutual understanding between the beneficiaries and implementers of the project.
d. Gender
Men and women both have obligations for the household, but for domestic affairs such as cleaning toilets, taking out the trash, garbage sorting and taking care of children, about 46.5% of the respondents viewed them as the role of the wife, though 36.9% thought that these should be equally shared by husband and wife. Women would be much affected by any changes in the process of waste disposal and sanitation in the communities since they are the household members most involved already. As the most affected individuals of the household when it comes to the process of sanitary improvement, there is much opportunity for improvements to affect women positively. The involvement of women in the development process is viewed positively by 12.7% of the respondents while approximately 11.3% who do not agree. On the construction of sanitation

TA 7993 - INO: Metropolitan Sanitation Management Investment Project – MSMIP Final Report 212
facilities, 19.5% agreed on the involvement of women, while 4.27% disagreed that they should be involved at all. Although there are those who acknowledge the role and contributions of women, the percentages are low reflecting the position of women in Palembang society. There is a growing incidence of HIV/AIDS in the city as reflected in the reported number of 1084 and 322 with the disease in 2012. 2. Analysis The overarching goal of MSMIP is improvement in the overall well-being of the city population within the Project area through sewerage connection. This is through improved water quality and decreased incidence of water-related diseases, especially among children. These help achieve Indonesia’s targets for urban sanitation in a manner that is inclusive and empowering. The project contributes to poverty reduction by helping attain national targets for urban sanitation and that of the Millennium Development Goal (MDG) Goal 7.9 for improved coverage of safe water and sanitation. The expected outcomes of the Project for Palembang City are: improved sewerage services for at least 19,000 households and 2,400 commercial establishments and improved environmental quality in served areas, improved sewerage management services, and improved public awareness on sanitation. Other identified constraints can be considered in the preparation of talking points for sanitation awareness raising campaign and in the participatory discussion of solutions to challenges such as responsibilities of renters and homeowners, satisfaction rates, water as a factor in sewerage connection, etc. Improved sanitation outcomes will be measured in terms of the number of new service connections (i.e., residential, commercial/industrial, institutional), including women and poor households that will directly benefit from pro-poor policies for connection. Sanitation outcomes may also be measured by the reduction in direct disposal of waste water into water bodies, thereby reducing water pollution and resulting bad color and smell of waterways. These can also be measured by improved ground water quality that could contaminate wells that supply drinking water to the population. Served households can also enjoy savings in the medium term through reduced cost of septic tank construction and maintenance. Primary outcomes are the total number of residential and commercial sewerage connections made and reduced incidence of water-related diseases in the Project area. The investment in sanitation stands to benefit all in the service area through universal free connection. Affordability may be a bigger problem that indicated by the city poverty incidence of 10%. Many areas along the river, the target site for sewerage service, have significant numbers of sanitation hot spots occupied by renters and informal settlers. Floating villages exist. Thus, the strategy adopted by the city is universal connection for domestic users. The challenge of inaccessible monthly fees is addressed through affordable tariffs and subsidies for monthly fees for the poor and vulnerable. Public awareness and connection campaigns in sanitation hot spots promote increased participation of the homeowners and of the renters that reside here. Benefits include improved sanitation service and improved hygiene, solid waste management and access to safe water through sanitation awareness campaign. Attainment of these goals, however, depends on whether intended beneficiaries connect to developed sewerage system and institute behavior change in other areas of environmental sanitation –

TA 7993 - INO: Metropolitan Sanitation Management Investment Project – MSMIP Final Report 213
e.g. disposal of garbage and other wastes into rivers. To do so, measures will be made to reach the poor and vulnerable groups and involve villages and organizations in discussing appropriate strategies to benefit slums and sanitation hot spots. Key issues such as disposal of solid wastes and grey and black wastes into waterways in slums, upstream and in unserved areas can cancel out any gains from sewerage connection within the Project Site. This calls for cooperation on a wider plan to address behavior change on hygiene and sanitation for the entire city and not just within the target beneficiary zone. Partnerships shall be established through joint planning on the contribution of city and village governments, Sanitation Pokja agencies, NGOs and desludging companies with community organizations for a common plan to address city sanitation challenges. Improved water access as a condition for connection also needs to be coordinated with PDAM early on. There are sanitation hot spots along waterways and by the shore. Around the WWTP site there is need for sanitation improvement but this is not within the sewerage area. Proposed interventions for onsite sanitation improvement, as well as livelihood development assistance promote social inclusion for the WWTP site. Livelihood enhancement opportunities shall be further assessed during project implementation though employment data indicate that women are less likely to be employed. The Project shall empower women and vulnerable groups through affirmative action policies for their participation in project design, sewerage connection and monitoring and evaluation. Along with village structures, community organizations will also be active partners in sanitation assessment, action planning as well as sanitation promotion. Pro-poor targets as well as gender targets at the level of the Implementing Agency and customer are included relative to hiring and promotion and giving them equitable access to sewerage service and training opportunities. Key issues such as disposal of solid wastes and grey and black wastes into waterways in slums, upstream and in underserved areas can cancel out any gains from sewerage connection within the Project Site since only 22% of the population is targeted for sewerage service. This calls for cooperation on a wider plan to address behavior change on overall hygiene and sanitation for the entire city and not just within the target service zone. This will be done through Joint Action Planning on Sanitation. A sanitation promotion strategy shall help ensure higher connection rates as survey shows high satisfaction with current sanitation facilities and Indonesian experience shows that free connection, by itself, cannot assure participation. Constraints to connection shall be addressed through joint problem solving of identified connection and sanitation awareness issues. A Stakeholder Communication Strategy shall guide the project in engaging its publics and in facilitating behavior change for improved hygiene and sanitation. A Consultation and Participation Plan will serve as guide in engaging key stakeholders at various stages of project life with special attention to affected persons and vulnerable groups. A capacity building component of MSMIP is expected to result in more inclusive and gender-sensitive operations and monitoring indicators and mechanisms for the implementing agency including village governments and communities in performing their respective roles in the Project. Village governments, women and community organizations, communal sanitation programs and desludging companies which serve households outside the Project Site are potential partners in project implementation and sanitation promotion. Cooperation can be facilitated through joint planning for a sanitation action plan. The project is expected to bring jobs at construction and operations. The observance of core labor standards is prescribed and mitigation measures are set in place for identified risks

TA 7993 - INO: Metropolitan Sanitation Management Investment Project – MSMIP Final Report 214
such as on poor living conditions at worker camps and on sexually transmitted diseases/HIV/AIDS among workers and communities. J. Social Safeguard Studies – Involuntary Resettlement A total of 58,230 m² (5.8 ha) of lands shall be permanently acquired for the Subproject and shall affect 21 houses, 10 other structures, 3 small business shops, and a total of 190 trees and fruit crops. A total of 28 households would be affected due to the land acquisition. Of the 58,230 m2, acquisition of 10,920 m2 has already been completed and the acquisition proceedings for the rest of the land are at an advance stage. 24 households occupying the houses on the WWTP site will be physically displaced due to the land acquisition. All the relocating households would be given option to purchase government sponsored low-income housing schemes and will be provided assistance them in obtaining bank loan, if necessary. Of the 28 households affected by the land acquisition, three are land owners, 14 owners of houses, 5 tenants and 6 households who live with their parents or in houses provided by their parents. All the 14 households owning houses on the WWTP site have written permission from the land owners to build houses on the land temporarily and to vacate the land as and when required without any claim for compensation or assistance from the land owners. The AHs are headed by 16 male and 8 female with total occupancy of 75 persons. Thirty five, or 64.8%, of the total members of the AHs are engaged in various occupations which are not dependent on the lands to be acquired. 7 households are vulnerable due to low household incomes and another 7 being female headed households. The BAPPEDA of Palembang City Government has already conducted the initial Public Consultation and Information Disclosure on 2 October 2012. Further consultation with the households and with randomly selected roadside establishments was carried out in February 2013. Copies of the PIB in Bahasa Indonesia were provided to the households and several other roadside establishments. Public consultations will continue throughout the project process cycle.
The Subproject is Resettlement Category B that will affect 28 AHs with 75 persons. K. Environmental Safeguards Study An environmental assessment was made for the proposed Palembang City’s Off-site Wastewater Collection System and Treatment. Based on the significance of its environmental impacts and risks, the Palembang City subproject is deemed Environmental Category B in accordance with ADB’s environmental categorization and the type of assessment warranted only the preparation of an Initial Environmental Examination (IEE) report. The IEE was carried out under ADB’s TA 7993-INO and in accordance with ADB’s 2009 Safeguard Policy Statement (SPS) and Government of Indonesia (GOI) environment law, Environmental Protection and Management Law of 2009. A copy of the final Palembang City subproject IEE is presented in Annex Document - G. An important consideration in analyzing the environmental impacts of the proposed Palembang City subproject is the fact that its components are infrastructures for environmental improvement and for reducing the risk to public health from untreated sewage. The screening for potential environmental impacts and risks of the proposed Palembang City subproject showed that there are no significant negative environmental impacts and risks that cannot be mitigated. With its Environmental Management Plan (EMP), the proposed Palembang City subproject can be implemented in an environmentally acceptable manner. There is no need for further environmental assessment study. A full

TA 7993 - INO: Metropolitan Sanitation Management Investment Project – MSMIP Final Report 215
EIA is not warranted and the subproject’s environmental classification as Category B is deemed appropriate. An REA checklist was prepared to support the environmental categorization of this subproject. The IEE shall serve as the final environmental assessment document of the proposed Palembang City’s sewerage system subproject. Implementation of the proposed Palembang City’s subproject is recommended with emphasis on the following: (i) EMP of Palembang City’s sewerage system subproject shall be included in the design process; (ii) IEE Report/EMP shall be forwarded to the design consultant for consideration in the design process; (iii) Tendering process shall advocate environmentally responsible procurement by ensuring the inclusion of EMP provisions in the bidding and construction contract documents; (iv) Contractor’s submittal of a contractor’s EMP (CEMP) shall be included in the construction contract; (v) Contract provisions on creation and operation of the ad-hoc City Sewerage Environmental Complaints Committee (CSECC) shall be included in construction contracts; (vi) Training of the WWTP operators on operation and maintenance of the WWTP shall be completed before actual operation; (vii) a WWTP advisor (consultant) shall be provided intermittently during the initial 3 months of operation to assist the operators in the start-up phase and also to correct any undesirable operating practices; (viii) Monitoring of health and safety requirements shall be given more importance during construction and operation to reduce risks to the public and to personnel; and (ix) Palembang City government and its LPMU shall continue the process of public consultation and information disclosure during detailed design and construction phases. 1. Compliance to ADB’s SPS Requirements In compliance with ADB’s SPS (2009) and the requirements describe in its Appendix 1 (Safeguards Requirement 1: Environment), the final IEE for Palembang City’s sewerage subproject contains sections of the following: (i) executive summary, (ii) introduction, (iii) policy, legal, and administrative framework, (iv) description of the environment, (v) anticipated environmental impacts and mitigation measures, (vi) information disclosure, consultation, and participation, (vii) grievance redress mechanism, (viii) environmental management plan, and (ix) conclusion and recommendations. Environmental Management Plan. The EMP section addresses the need for mitigation and management measures for Palembang City’s subproject. Information includes: (i) mitigating measures to be implemented, (ii) required monitoring associated with the mitigating measures, and (iii) implementation arrangement. A tabulated mitigation plan presents the information on: (i) required measures for each environmental impact that requires mitigation, (ii) locations where the measures apply, (iii) associated cost, and (iv) responsibility for implementing the measures. Details of mitigating measures are discussed in the screening process for environmental impacts. A tabulated monitoring plan presents the information on: (i) aspects or parameter to be monitored, (ii) location where monitoring is applicable, (iii) means of monitoring, (iv) frequency of monitoring, (v) responsibility of compliance monitoring, and (vi) cost of monitoring. One of the pre-construction considerations discussed in the EMP is the need to include measures for climate change adaptation and mitigation. A hydrology and flooding study shall be conducted during the design phase for the proposed Palembang City’s WWTP to ensure that occurrence of flooding is properly evaluated. Results of the study shall be used for designing the proposed WWTP and the preparation of engineering specifications to ensure that it is less vulnerable to extreme flood events. Climate change mitigation is by connecting the WWTP’s membrane covered anaerobic ponds to a flare to avoid releasing the generated methane. However, during detailed design, potential use of the generated methane shall be evaluated with due considerations to financial and economic factors.

TA 7993 - INO: Metropolitan Sanitation Management Investment Project – MSMIP Final Report 216
EMP Cost. The IEE points to the need of ensuring funds for EMP implementation. The suggested approach is to allocate funds for EMP implementation by requiring that the tender documents of Palembang City’s sewerage subproject shall include a lump sum bid item in the bill of quantities to be titled “Environmental Mitigation Measures”. Furthermore, it shall be clarified in the specification documents that the environmental mitigating measures identified in the construction EMP are to be charged to this item. This will allow the construction supervision engineer of Palembang City’s sewerage subproject to require the contractors to quickly address the environmental issues during construction. For budgetary purposes, this EMP fund of the proposed Palembang City’s sewerage system is estimated at 1% of the total direct cost of the WWTP and the sewer lines. Relative to this, the CPMU and the Palembang City’s LPMU shall ensure that this provision for “Environmental Mitigation Measures” is included in the bidding documents and civil works contracts. Institutional Setup. Similar to the 4 other MSMIP subprojects, there is a need to ensure that the environmental aspects of the proposed Palembang City’s sewerage system is effectively addressed through a well-defined institutional setup. The roles of the various GOI units and consultants for the environmental aspects are discussed in the sections for institutional aspects of the final IEE. The setup presents the proposed Palembang City’s LPMU as the key implementation unit responsible for construction contracts’ supervision of the Palembang City subproject. Capacity Building for WWTP Operators. The final IEE recognizes the fact that a newly constructed WWTP might discharge poor quality effluents due to operators that are not properly trained. One of the proactive ways to prevent this from happening is to provide capacity building for the operators of the new Palembang City’s WWTP during pre-operation phase and continue during the initial few months of the operation phase. The proposed capacity building shall be divided into 2 parts and shall be facilitated by local consultants. The first part shall be a one month hands-on training on operating and maintaining a WWTP in a similarly operating WWTP in Indonesia. The second part shall be the actual operation of the new Palembang City’s WWTP with inputs from a WWTP advisor for a 3-month period intermittently. This type of advisory services is very important since the new WWTP will be in the start-up phase and also to correct any undesirable operating practices of the newly hired operators. Estimated cost of the initial capacity building is US$7,600 while the cost of advisory services of the WWTP advisor for a 3-month period intermittently at the new WWTP is US$14,000. This capacity building for WWTP operators is also reflected in the overall capacity building plan for MSMIP. Grievance Redress Mechanism. The IEE presents a local grievance redress mechanism (GRM) for environmental complaints during the construction phase of the Palembang City’s sewerage subproject. The GRM has three levels and calls for the creation of an ad-hoc City Sewerage Environmental Complaints Committee (CSECC). This shall be chaired by Palembang City’s Chief of the LPMU. CSECC members shall include the: (i) contractor’s highest official at the site such as the Construction Manager or Construction Superintendent, (ii) village (Kelurahan) Chief or his representative, and (iii) a women organization’s representative. The draft GRM was presented to stakeholders during the initial public consultation meeting. Public Consultation and Information Disclosure. Last 02 October 2012, Palembang City’s BAPPEDA conducted an initial public consultation and formally discussed the proposed sewerage subproject with the stakeholders and requested their views. A total of 20 stakeholders and representatives participated.

TA 7993 - INO: Metropolitan Sanitation Management Investment Project – MSMIP Final Report 217
BAPPEDA requested the PPTA consultants to assist them in explaining the technical aspects of the proposed sewerage system. Issues that stakeholders raised include construction impacts, WWTP odor during operation, and the need for further information campaign. This initial public consultation meeting is fully documented in the Palembang City subproject’s final IEE. A summary of the issues raised during the initial public consultation in Palembang City and how the project addressed them is presented in Table VI-K 1.
Table VI-K 1: Summary of Issues Raisedand Project’s Response during Public Consultation
Group Represented Issues/ Concerns Raised Project’s Response
NGO WALHI Why the initial sewerage area
is the business district? Is the
criteria population density?
The initial selected site is the business center
in order to recover some costs since the
operation and maintenance of a WWTP will
require huge costs. The selected site is
populous and septic tank is not suitable due
to limited land
health sector What about the odor
generated by the WWTP?
Odor is not a problem during operation of the
WWTP. In some cities, such as Bangkok and
Kuala Lumpur, WWTPs are located in areas
surrounded by houses and there are no odor
problems.
Govt sector What about the impacts of
sewer line construction to the
residents of the surrounding
areas?
During pipeline construction, the method will
be clean construction to prevent disruption to
the environment and the local residents and
their daily activities.
Govt sector How will wastewater from
houses, industries be
collected?
Domestic wastewater will be collected via
pipes laid at certain slope and equipped with
supporting structures such as manhole, drop
manhole, flushing structure, etc.
health sector Can the treated water be used
as recycled water?
Effluent from the WWTP can be recycled, but
only suitable for communal scale. For city
scale, it can be used to water city parks or
sold to industries for cooling water.
Kalidoni District There should be more public
information campaign and
consultation since the people
are concerned with potential
impacts of the sewer system
Another public information campaign and
consultation will be organized with the
related agencies in 2013. A regional
regulation for the sewer system is being
drafted with regard to the management.
Ilir Timur I District More public information
campaign and consultation
Another public information campaign and
consultation will be organized with the
related agencies in 2013
2. Compliance to GOI’s Environmental Requirements

TA 7993 - INO: Metropolitan Sanitation Management Investment Project – MSMIP Final Report 218
The Palembang City subproject’s final IEE presents GOI’s regulatory requirements regarding the AMDAL system (EIA system) and discharge permit for WWTPs. Under AMDAL regulation, a proposed WWTP for domestic wastewater that will require an area of more than 3 hectares or will serve a population of more than 100,000 shall be required to prepare an AMDAL report. The Palembang City subproject will require an area of 5.7 hectares for its WWTP, more than the 3-hectare criterion. It will therefore be required to prepare an AMDAL. Preparation of the AMDAL will be done by the detailed design consultants during the detailed design phase as agreed by ADB and GOI. This will be funded by the Indonesia Infrastructure Initiative (IndII). AMDAL preparation shall be completed prior to any bidding/procurement process. A permit to discharge will also be required for the proposed Palembang City WWTP under the city’s regulation for WWTPs. Information on the process for discharge permit application is presented in the final IEE’s appendices. L. Palembang Institutional Proposals 1. The Project and Schedule In the meeting with the PPTA consultants last July 20, 2012 the POKJA confirmed the project scope to include the Central Business District Wastewater Collection and Wastewater Treatment. The schedule of project implementation as well as the supporting institutional development activities is presented in Table VI-L 1.
Table VI-L 1. Project Implementation and Supporting Activities
A. PROJECT IMPLEMENTATION
Procurement, Detailed Design, Construction
B. CONSULTANCY ASSISTANCE
Detailed Engineering Design (DED) Consultants
Capacity Development Technical Assistance (CDTA) Consultants
Project Implementation Support Consultants (PISC)
C. PREPARING FOR MSMIP IMPLEMENTATION
Organizing Implementation Units
CPMU
LPMU
D. PREPARING FOR WASTEWATER OPERATIONS
1 PDAM
Issuance of PERDA and PERWALI to establish PDAM Unit
Capacity Building for PDAM Wastewater Dept
2017 20182012 2013 2014 2015 2016
The selection of the SDO was done during the WWMP studies in full consultation with Technical Working Group on Sanitation (POKJA) Palembang. The preferred organization as indicated in the Palembang Master Plan is an SDO under the PDAM Tirta Musi Palembang (Perusahaan Daerah Air Minum).

TA 7993 - INO: Metropolitan Sanitation Management Investment Project – MSMIP Final Report 219
a. Proposed Institutional Arrangements for Project Implementation The Ministry of Public Works, Directorate General for Human Settlements (DGHS) is the Executing Agency for the MSMIP. DGHS will establish a central project management unit (CPMU) composed of technical and administrative staff from Directorate of Environmental and Sanitation Development (DESD). The CPMU will likely be headed by a Senior Officer of the DESD. At the regional level, two units will work jointly to manage and implement the project: the SATKER as the Provincial Project Implementation Unit (PPIU) and the city Local Project Management Unit (LPMU). Under this arrangement, DGHS plays an active role in providing technical supervision and responsibility over the investment (the Satuan Kerja or SATKER model). The PPIU or the SATKER comprises full time staff detailed from DGHS to the provinces to implement specific projects of DGHS. The projects in the four cities above will be implemented through the SATKER in their respective provinces. Model 2 (PEMKO Model) for Palembang. Under a pilot initiative to reinforce project ownership and local autonomy, the Palembang city government will be the IA, instead of the provincial SATKER as in other cities. In Palembang, the city-owned water company (PDAM) already manages several water treatment plants and has the capacity to implement its subproject.

TA 7993 - INO: Metropolitan Sanitation Management Investment Project – MSMIP Final Report 220
Figure III-L 1. Implementation Arrangement
DGHS
(Executing Agency)
Central Steering
Commitee
Central Project
Management Unit
(CPMU)
Central Project
Implementation Unit (CPIU)
/ Satker Pusat
Central Support team
(CST) a
Provincial Project
Management Unit
(PPMU)
Provincial Project
Implementation Unit
(PPIU) / Satker Provinsi
Provincial Support team
(PST) a
Local Support team
(LST) a
Local Project Management
Unit
(LPMU)
Local Project
Implementation Unit
(LPIU) / SKPD
Dinas Provinsi b
Implementing Agency
Provincial Steering
Committee (CWSG, various
Dinas Provinsi )
Dinas Kota c
(Implementing Agency ABPD-
Kota)
City Sanitation Working
Group
(CSWG)
(chair: DGHS)
(chair: BAPPEDA-Prov.)
(chair: deputy mayor)
National Level
Provincial Level
City Level
Consultant Support
a Support teams consist of consultants for: (i) project implementation support,
and (ii) institutional development and capacity buildingb
Provincial Governmentc City Government
Supervision, guidance
reporting
coordination
Institutional arrangements for implementation include mechanisms for environmental management and resettlement. See Annex Document H.11 for details.

TA 7993 - INO: Metropolitan Sanitation Management Investment Project – MSMIP Final Report 221
b. Proposed Institutional Arrangements for Operation
The focus of the capacity building is on establishing an autonomous and accountable service delivery organisation (SDO) for wastewater management. To do this, the city of Palembang plans to create a wastewater department under the PDAM. i. Wastewater Operating Subsystems The organization of the wastewater department will need to consider the following subsystems57 needed to operate the facility. Many of these functions are already being done by existing PDAM departments for the water supply operations. The operating (physical) system in the includes all the resources, facilities and activities needed for the preparation of technical plans and designs, implementation of construction, the operation and maintenance of its facilities. The technical operations will involve 2 processes, sewage collection and sewage treatment.
The planning system begins with understanding the mission and vision for wastewater operations according to social, economic, environmental and regulatory policies under which it must function. The planning system must aim at effective accomplishment of the objectives in the short-, medium and long-term. It must make sure all parts of wastewater operations work efficiently to meet targets so that it delivers the services required by the residents. This system generates physical expansion and institutional development plans. Supported by the management information system, the planning system establishes the feasibility of the objectives, plans and programs. The commercial system is a strategic element for attaining the objectives of wastewater operations (i.e., meeting service demands within regulatory requirements). It is a tool for the promotion and sale of services and for recovery of the cost of delivering those services to the residents. This enables the operations to be as financially self-sufficient as possible. The department performs this function according to policies, standards and plans established based on consumer demands and official regulations. The commercial system includes subsystems related to billing and collection, consumer registration and marketing. The financial management system includes all policies and standards established by the PDAM and the government to carry out its financial tasks, together with the procedures used for recording and evaluating financial operations and reporting on their results. These activities are found in the financial administration and accounting systems. The administration support system includes four (4) subsystems–supplies administration, asset management, transport administration and public relations. The human resources management & development system comprises all policies, standards and procedures which ensure that the SDO has the personnel it needs at the right time and that the personnel are appropriately trained.To this end, a plan of human resources demand and supply should be drawn up.This system carries out several key functions and responsibilities,including: job design, classification and grading, staff selection and recruitment, deployment of staff, training; administrative control of staff; and human relations activities through social welfare and benefits, work safetyandworkers 'health.
57 WWMP Indonesia Infrastructure Initiative. Wastewater Investment Master Plan, Package II – Palembang, Activity W004: LIDAP – Palembang, Australia Indonesia Partnership, September 2011.

TA 7993 - INO: Metropolitan Sanitation Management Investment Project – MSMIP Final Report 222
The management information system defines the flow of information within the organization to support the planning and decision making processes of the SDO. Each of earlier systems produces financial and operating information and data which are fed into and processed by the MIS for management action. The proposed capacity development technical assistance (CDTA) for MSMIP also provides for policy/ guideline and procedures manual preparation to cover operation and maintenance including commercial and financial systems. This will allow the new unit to handle operations and maintenance, commercial and financial operations of the wastewater system. A combined collection of water supply and wastewater fees has many advantages and this will be the method of collection for PDAM Palembang. ii. Organization of the Wastewater Department Following the above functional requirements, the proposed structure for the Wastewater Department under the PDAM is shown in Figure VI-L 2. It will be headed by a Technical Director II. The PDAM and the legal division of Setda Palembang attached to the Office of the City Mayor will oversee the finalization of the organizational structure under PDAM Tirta Musi, and the appointment of the director for wastewater operations. There is an existing recruitment system in place to assist and monitor the selection of technical heads and staff. At present, there are approximately 500 permanent employees and 100 casual workers assisting in the everyday operations of the PDAM. It is expected that during the 2 year capacity building assistance, the CDTA consultants will be able to assist the city and the PDAM in achieving independent and sustainable wastewater operations. They will initially provide guidance to the city and PDAM to prepare necessary legislation including the PERDAs to create the new Wastewater Dept. The consultants will then assist in the drafting revisions to the performance contract and the public service obligation contract, and finalize the PDAM wastewater structure, initial staffing plan and start-up activities. Prior to completion of the MSMIP wastewater project, the PDAM with assistance from the CDTA consultants will start the hiring process and training of staff. See Figure VI-L 2 for the proposed organization.

TA 7993 - INO: Metropolitan Sanitation Management Investment Project – MSMIP Final Report 223
Figure VI-L 2. Organization Chart for PDAM Wastewater Department
Mayor
Supervisory Board
President
Director
Internal Supervisory
Unit
General
Director
Technical
Director I
Wastewater Dept.
Technical Director II
Sewage
Collection
Septic Tank
Cleaning
On Site
Sanitation
Sewage
Treatment
Installation
of Service
Connection
Minor
Extention
Works
Operation &
Mainte-
nance
Laboratory
Operation &
Mainte-
nance
Customer
Service
Execution
Planning
Marketing
Septage
Services
c. Institutional Development and Capacity Development Component The CDTA comprises two components, namely the capacity building plan and project management assistance. i. Capacity Building Plan Methodology and Approach The capacity building plan is directed at two (2) distinct levels – sector (or city) management level (through the Local Institutional Development Action Plan or LIDAP) and at the service delivery level (through the Financial and Operating Improvement Plan or FOPIP). The LIDAP includes interventions to be initiated and managed by the city government which influences the operating conditions of the Service Delivery Organization (SDO). The FOPIP, on the

TA 7993 - INO: Metropolitan Sanitation Management Investment Project – MSMIP Final Report 224
other hand, includes interventions which are to be initiated and managed by the SDO. See Figure 3 below.
Figure 3. Capacity Development Plan Approach
1) policy formulation, sector
management
(2) management of service delivery
(human resources, pricing the service,
etc.)
(3) community involvement
(4) regulation of service provision.
FOPIP
CAPACITY DEVELOPMENT
Establish
ment of
Effective
Service
by SDO
LIDAPSector
Reform
The sector interventions to be provided by the capacity building component can be grouped into three types:
• Assistance in the preparation of policies, guidelines, and manuals; • Advisory services, technical assistance and progress monitoring; • Training and Workshops.
The CDTA includes a component to address the concerns of stakeholders that the expected number of connections to the sewer lines may take a long time to happen. One of the measures to address this is the preparation of a Social Marketing Plan for Sanitation which will incorporate the comprehensive "Model Micro-Marketing of New HC Centralized Wastewater" as developed and implemented by CDTA-MSMHP in Yogyakarta. ii. Project Management Assistance Project management assistance covers technical audit and benefit monitoring. Technical Audit. The consultancy services also aims to provide initial project management assistance during the 12 month period prior to mobilization of the PISC and during the 12 months of the PISC contract. This primarily covers assistance in the procurement activities.
Benefit Monitoring and Evaluation. Monitoring and evaluation of project benefits calls for the development and implementation of a Project Performance Monitoring System which covers the, conduct of a baseline study and setting up of all institutional requirements in order to be able monitor and evaluate the benefits of the project after its completion. d. Project Readiness of the City The city of Palembang is institutionally ready and has committed to the action plans necessary to allow the SDO to be autonomous and sustainable. The next step is the issuance of the Mayor’s Decrees for the creation and staffing/ functions of the Wastewater Department. The city committed that this will be done as soon as the project is final. The city also realizes that promotion and regulation of sanitation are key to its success and commits to this and other action plans in the LIDAP and FOPIP.

TA 7993 - INO: Metropolitan Sanitation Management Investment Project – MSMIP Final Report 225
In several discussions of the consultants with the city, they have committed to charge fees that will fully recover O&M cost (including depreciation). The preliminary amounts calculated in the feasibility studies prepared under INDII were used as basis of the discussions with local officials. Once the proposed tariffs are determined, the city will determine strategies to be able to implement the needed charges to make the wastewater operations sustainable. In accordance with the above commitments and progress, the City Mayor has affirmed the inclusion of Rs 5 billion in the APBDP budget for 2012, to finance the land acquisition of the Sei Selayur WWTP. This has been approved by the DPRD of Palembang last 14 August. Concurrently, the City Government has released a request to the Provincial Government of South Sumatra to utilize an extra parcel of land situated beside the Selayu WWTP. A reply from the South Sumatra Governor is expected in December 2012.

TA 7993 - INO: Metropolitan Sanitation Management Investment Project – MSMIP Final Report 226
VII. Pekanbaru City Off-site Wastewater Collection System and Treatment A. Pekanbaru Physical Setting Pekanbaru City is a relatively clean city due to its low population density, wide streets, low traffic density and attention to cleanliness. Pekanbaru has been awarded the Adipura (Award) for the Cleanest Big City category in Indonesia level, six times consecutively from 2005, to 2010. The desire of the city to maintain its reputation as one of the cleanest cities in the country is one driver to improve its sanitation and wastewater facilities. The capital city of Riau Province, Pekanbaru City covers just over 630 km2 and comprises 12 sub-districts (kecamatans) and 58 villages (kelurahans). The total occupied land in Pekanbaru is 14,892 hectares, about 24 percent of the total area. The primary use of the occupied land is housing at 73 percent, 12 percent for industry and 5 percent for commerce. Land utilisation for housing is concentrated in the downtown area and around the Caltex/Chevron residential area. The industrial area is in Tenayan Raya Sub-district and the commercial area is in the downtown area. The city is bisected by the Siak River which flows from west to east. The landscape of Pekanbaru is dominated by water (see Figure VII-A 1). The Siak River has 17 tributaries within the city limits. The Siak River has a typical monsoonal discharge pattern of high flows during the wet season and a much lower flow in the dry season with an average flow of around 200-300m3/second and is subject to tidal fluctuations at Pekanbaru. The largest tributary (with a catchment of 120 km2) is the Sail River, which is also subject to tidal influences. This would make it unsuitable as a receiving-water for discharge of treated effluent. The implications for the master plan are that most of the tributary streams and drainage channels in Pekanbaru would be unsuitable for discharge of treated effluent as they have limited hydraulic capacities. The logical place for discharge of treated effluent would be the Siak River downstream of the higher density area of the city. The river is not very wide, so transfer of collected wastewater from the north side of the city to the south should not have any technical constraints.
Figure VII-A 1: The various river catchment zones in Pekanbaru City
TA 7993 - INO: Metropolitan Sanitation Management Investment Project – MSMIP Final Report 227
Most of Pekanbaru is relatively flat with slopes in the range of 0-2 percent, especially in the areas along the Siak and Sail Rivers. The natural ground gradient is adequate to enable gravity pipelines for tertiary and secondary sewer pipes over relatively short distances across the flatter areas. However, pump stations will be required for transmission over long distances. As the low lying areas are prone to inundation, in many parts of the city, disposal of septic effluent poses a health hazard to the community and should be connected to a sewerage system. The geology and soil conditions in Pekanbaru indicate that soils are well draining, which may create contamination concerns if there is a high concentration of septic tanks and cess pits. Such areas are not well suited for on-site disposal systems (53 percent of HH have septic tanks in Pekanbaru). The shallow aquifers should not be used as sources of water supply without treatment (disinfection as a minimum). There is an absence of significant hard rocky strata in the top 10 m indicates that construction of pipelines should not be too difficult and methods such as trenching and horizontal directional drilling could be employed. Away from the river the water supply bearing aquifers are deep and would generally not be affected by seepage from cess spits and septic tanks. In the northern areas, the higher clay content would lessen the efficiency of on-site disposal systems but this could be offset by the lower housing density. Pekanbaru in 2009 had a population of 802,788 with 188,341 households. The average annual population growth in Pekanbaru between 2005-2009 was 2.76 percent. The total projected population of Pekanbaru for 2030 is estimated at 1,663,200. Based on the urban spatial development structure, the total population in the downtown area (CBD) is estimated to be 384,914, with a density of 193 people/ha, while the new development area, Sabrantas, that covers Marpoyan Damai and Tampan sub-districts is estimated to be populated with 483,821 people, with a density of 54 people/ha. The Northern area of the city, or west of Siak River, has a slower development rate than the southern area. The slow rate of development is due to the relatively hilly topography in the north that contains peak that makes the waters brown. The Southern area of the city, or right of Siak River has a high rate of development. Pekanbaru is effectively on the Equator and the mean monthly rainfall is 220 mm with a standard deviation of 60 mm and on average there are about 149 days of rainfall per year. The period October through to April is the wetter period. The population in Pekanbaru City obtains water from a range of sources including the Siak River and groundwater. The declining quality of these water sources is the result of the lack of sanitation and wastewater collection and treatment facilities and is a significant driver in the need for improved sanitation and wastewater infrastructure. There are no reticulated sewerage systems or communal septic tanks in residential areas in Pekanbaru. Most residents use one latrine connected to a single septic tank, or nothing at all. There is a need for communal septic tanks to decrease the septic tank density and, therefore, the risk of pollution of the shallow aquifers from sub-standard and leaking tanks. Some basic pipework would be required to convey the waste from the houses to a communal septic tank at the edge of the village, not unlike a SANIMAS approach. There is also a low community awareness on the importance of sanitation management and a lack of information dissemination and education on the importance of domestic wastewater management, especially for low income community members living in densely populated areas prone to flooding. There are about 17,500 poor households in the city and nearly 18,000 households in flood affected areas.

TA 7993 - INO: Metropolitan Sanitation Management Investment Project – MSMIP Final Report 228
There are several companies that pump out septic tanks, but only three are registered. During the rainy/wet season, each vehicle makes 2-3 trips/day, but only 1 trip at the most during the dry season. The transportation cost for these vehicles is about Rp 180,000/trip for the vehicles with 1 m3 capacity and between Rp 225,000 and Rp 270,000 for the vehicles with 3 m3 capacity. Septage from septic tank pumpouts is supposed to be transported to the septage treatment facility (IPLT) at the municipal landfill site in Muara Fajar kelaruhan, 20 kilometres from the city centre. Although this facility was constructed in 1997, it was only in operation for a short time. It was renovated in 2006, but soon ceased to operate effectively. Septage is usually disposed to the nearest waterway or to another site leased by the truck operators. An assessment of water quality based on secondary data indicates that wastewater discharge from the city area has a clear impact on the quality of surface waters within the urban area. There evidence of a significant industrial load to the river with heavy metal concentrations (cadmium, chromium iron, copper lead and zinc) levels exceeding national standards and the 4:1 COD/BOD ratio. The city government issues wastewater disposal permits and collects fees from industries, hotels and hospitals (Perda No. 8/2003). Only 10 percent of Pekanbaru residents are PDAM consumers, with 90% of the population using ground water from deep wells and dug wells. The streams on the right bank, especially the Senapelan and Sail rivers and the smaller streams in between which flow through the more densely populated parts of the city, are also heavily polluted with organic loads in the range of 20-70 mg/L BOD and bacteria counts up to 12,000 MPN/100 mL of faecal coliforms – all indications of human sources of pollution. These degraded conditions constitute not only environmental pollution but pose a public health risk as well to the citizens of this otherwise very clean city. The logical place for discharge of treated effluent would be the Siak River downstream of the higher density area of the city. The river is not very wide, so transfer of collected wastewater from the north side of the city to the south should not have any technical constraints. Assuming a 50m3/s flow in the Siak River, an increase of 15 mg/L in BOD across the city (as indicated by water quality analyses) would mean a mass load of 65 tonnes/day is dumped into the river. Such degraded conditions are not only an environmental pollution but pose a serious public health risk to the citizens of this otherwise very clean city. Relevant Environmental Standards
The national strategy on domestic wastewater management system and the implementation is formulated through several regulation and commitments. The regulations are:
• Public Work Regulation No. 16/PRT/M/2008 on National Strategy and Policy in Domestic Wastewater Management, and
• Government Regulation No. 16/2005 on Water Supply Development Effluent discharge standards for most areas in Indonesia stipulate a 100 mgBOD/L but the Province Standard issued by the Governor for South Sumatra is 50 mgBOD/L. Apart from the BOD load there is a 100 mg/L limit on suspended solids and 10 mg/L for fats and oils. In most cases with wastewater having a suspended solids delimit of 100 mg/L would exceed the BOD delimit of 50 mg/L so the BOD limit is the guide. There are no other parameters stipulated. For Industry, Hotel, Hospital, Domestic, and Coal Mines, the South Sumatran Governor Regulation No. 18 Year 2005 on Effluent Standard Quality applies: pH – 6 to 9; BOD < 50 mg/L; SS < 100 mg/L and Fats and Oils < 10 mg/L.

TA 7993 - INO: Metropolitan Sanitation Management Investment Project – MSMIP Final Report 229
The national standard for discharge of BOD is 100mg/L, for suspended solids = 100 mg/L and for oil &grease = 10 mg/L. In other cities the provincial standard applies which is stricter at 50mg/L for domestic waste (Palembang) and 30mg/L for hospitals (Bandar Lampung). The allowable BOD discharge of 100mg/L (national) and 150 mg/l (provincial) is considered to be too high for a Class 2 river. Based on current data obtained from BLH the river is currently Class 4 being heavily polluted along its whole length. The IndII WWMP used an effluent discharge maximum target of 50 mg/L BOD. B. Rationale for Selection of Priority Projects The sub-projects included for implementation during Phase 1 (by 2014) of the IndII Masterplans that were produced for Pekanbaru City have been identified. The City has been visited to ascertain which of the Phase 1 sub-projects are the priority of the City Governments, in that they represent the selected sub-projects that the Cities would wish to implement in the event of limited loan funds. Pekanbaru was visited on the 1st August. Minutes of the Meeting were included in the PPTA Interim Report dated September 2012. At the meeting a presentation was made on the specific “Readiness of the City” with regard to the sub-projects recommended in the WWMPs for the Phase 1 period. In particular, emphasis was placed on the confirmation of the availability of the land for the construction of the WWTP. The City confirmed the land is either now available or will be in the near future. The City has prioritized the sub-projects that they would wish to be included in this MSMIP TA. The following table shows the sub-projects that have been requested for consideration under this PPTA. The City has prioritized the sub-projects that they would wish to be included in this MSMIP TA. The following table shows the sub-projects that have been requested for consideration under this PPTA.
SUB-PROJECTS SELECTED BY THE CITY FOR FUNDING
City Description of Sub-Project Pekanbaru WWTP and Central Area wastewater collection system In this PPTA Report we have evaluated the WWTP and the Central Area wastewater collection systems.
C. Proposed Wastewater Collection System For details of the proposed wastewater collection system and costings please see the
following plans and costings table.

TA 7993 - INO: Metropolitan Sanitation Management Investment Project – MSMIP Final Report 230

TA 7993 - INO: Metropolitan Sanitation Management Investment Project – MSMIP Final Report 231

TA 7993 - INO: Metropolitan Sanitation Management Investment Project – MSMIP Final Report 232
Diameter LengthUnit cost
PPTA
(mm) m ( xRp 1000) ( xRp 1000) ($'million)
1 Rising Main PVC DN 600 mm 700 3,481 2,437,000 0.25
2 Trunk Sewers Concrete DN 900 mm 3,509 3,107 10,903,155 1.14
Concrete DN 1000 mm 309 3,599 1,111,940 0.12
Concrete DN 1100 mm 2,917 4,431 12,926,100 1.35
24,941,195 2.60
3 Main Sewers PVC DN 300 mm 1,134 947 1,073,800 0.11
Concrete DN 600 mm 2,804 1,726 4,839,120 0.50
Concrete DN 700 mm 2,235 2,716 6,070,000 0.63
11,982,920 1.25
Laterals PVC DN 150 mm 40,000 325 13,000,000 1.35
PVC DN 200 mm 20,000 540 10,800,000 1.13
PVC DN 250 mm 20,000 585 11,700,000 1.22
35,500,000 3.70
Storm Water Interception
15 76,000 1,140,000 0.12
6
5 740,000 3,700,000 0.39
7
112 12,478 1,397,500 0.15
1,183 6,560 7,760,100 0.81
8
27 34,391 928,550 0.10
9
4,071 5,211 21,212,255 2.21
10
17,268 3,680 63,546,240 6.62
11
1 12,500,000 12,500,000 1.30
*) By MSMHP Yogja: Lateral to the control box - Rp 2 Million + Box control to house - Rp 1.5 Million.
19.48
Sewer Manholes - Depth 2.0 - 6.0 meters
Property Connections *)
Total Rupiah (x 1000)
Land Acquisition for the WWTP
20 Hectare
187,045,760
Drainage Rehabilitation
4
PPTA Reviewed cost
Sub Total 2 :
Sub Total 3 :
Sub Total 4 :
SEWERAGE PROPOSED BY CITY FOR ADB LOAN (BASIC DIRECT COST)City : PEKANBARU
Pipe Work Crossing
Cross River Sail and Road
Storm Water Drain Rehabilitation
Manholes and Chambers
NO ITEM
Lateral Sewer Chambers - Depth 1.5 - 2.0 meters
5Interception Chambers (No)
Pumping Stations
160 Ips, 15 m head
D. Proposed Waste Water Treatment Plant The intended 8 ha treatment plant site for the Rejosari WWTP is large enough for Stage 1 flows only if a pond treatment configuration is retained. Another more intensive treatment configuration such as activated sludge would require less area but the capital and operating and maintenance costs would be higher, daily sludge management would be required and system complexity would significant for Pekanbaru City as this would be their first treatment plant. If it is presumed that the nominated 8 ha in full can be used, and the Reviewer notes the current presence of informal settlers on the site, as well as its current agricultural use for oil palms and bamboo, the site is large enough for a pond treatment system for Stage 1. The Reviewer optimised the proposed IndII MP pond process somewhat, with the treatment process consisting of a sequential pond system consisting of covered anaerobic ponds + facultative-aerobic ponds + maturation pond (see PFD below). Two separate parallel process streams are suggested. The main advantage of Reviewer’s pond treatment configuration is that it will comfortably fit on the 8 ha site. The ponds can be designed to be desludged every 8 to 10 years. This lessens the capital expenditure and certainly the

TA 7993 - INO: Metropolitan Sanitation Management Investment Project – MSMIP Final Report 233
system complexity that gives time and opportunity for development of a Biosolids Management Strategy to address the biosolids that will ultimately result from the treatment process. A comparison of the costs of the two pond treatment configurations is shown in the following table.
Source of Stage 1 Cost Estimations for Rojosari WWTP (for 15,800 dom. + 1,468 comm. connections) 14.7 MLD
Capex (NO VAT, (USD Million)
Opex (USD/annum
Comments
IndII MP (pre-treatment + covered anaerobic ponds + partially-mixed aerobic ponds + maturation pond + mechanical dewatering; two parallel trains)
14.1 275,000 (Reviewer adjusted to reflect BOD error in IndII MP)
Odour contained at the front of the process with a membrane cover over anaerobic pond, desludging only needed every 5 to 10 years or so, , partially-mixed aerobic ponds used with surface aerators, maturation pond had 1 day HRT. Capital cost per connection was about $US964 as number of proposed connections was less at 13,372.
MSMIP Technical Review (Alternative 2B: pre-treatment + covered anaerobic ponds + facultative aerobic ponds + maturation pond; two parallel trains) Septage solids to be accepted at facility.
13.5 186,000 Odour contained at the front of the process with a membrane cover over anaerobic pond, desludging only needed every 10 years or so, no drying beds included, facultative-aerobic ponds used, thus lowering energy requirements, maturation pond has 1.5 days HRT. Capital cost per connection is about $US779.
The costs per connection are such because of the potential difficulty of the site as it is currently prone to an annual flooding to over 1 m in depth and will require substantial clean fill to raise the site level. The ponds would sit on top of the fill with their birms or dykes. The estimated USD1.8 Million (2011) for upgrade of the Rehabilitation and upgrade of Muara Fadjar IPLT (from 40 m3/d to 80 m3/d) can be reduced if septage is also accepted at the future Rejosari WWTP. The Reviewer was unable to quantify the amount of this cost reduction due to insufficient information. The Reviewer’s process flow diagram is given on the following page.

TA 7993 - INO: Metropolitan Sanitation Management Investment Project – MSMIP Final Report 234
3:1(H:V)DH
L1
L2
AT
AB
Dewater / Desludge
Every5 to 10+ years
Surface Aerators
3:1(H:V)DH
L1
L2
AT
AB
FACULTATIVE
AEROBIC PONDS
3:1(H:V)DH
L1
L2
AT
AB
MATURATION PONDS
Proposed AnFAP TREATMENT PROCESS
(Two Parallel Trains or 6 ponds)
COVERED ANAEROBIC PONDS
TRUCK OFFLOAD
CHAMBER
MECHANICAL
SCREENS
Domestic + Commercial Wastewater
GRIT
Screenings & Grit to Landfill
ST PumpoutTrucks
Possible Grinder
OVERFLOW Biogas
FLARE
Geo-Plastic
Membrane
Cover
Treated WW to Discharge
M
M
M
M
Optionale- gen
MM
M
BYPASS Flows > 2xADWF

TA 7993 - INO: Metropolitan Sanitation Management Investment Project – MSMIP Final Report 235
For a more detailed analysis of the proposals see the table below and Annex Document A
– Technical
Million (IDR)
or Other
Million
(USD)
Percent of
Total
Million (IDR)
or Other
Million
(USD)
Percent of
Total
1 Biotreatment Liquid Surface Area Reqmts, ha 5.3 NA NA 5.1 NA NA
2 22,121 2.35 18% 22,121 2.35 17%
3 5,874 0.62 5% 5,310 0.56 4%
4 9,842 1.05 8% 9,693 1.03 8%
5 32,447 3.45 27% 31,340 3.33 25%
6 NA NA NA 4,782 0.51 4%
7 Contingency for Unknown Site Constraints 13,245 1.41 11% 13,725 1.46 11%
8 Engineering & Construction Management 6,181 0.66 5% 6,405 0.68 5%
9 Other 31,258 3.33 26% 31,979 3.40 25%
TOTAL ESTIMATED CAPITAL COSTS: 120,969 12.99 125,356 13.45Avg Capex/Conn (Mil. IRP/conn. or USD/conn.): 7.7 822 7.9 852
TOTAL EST. ANNUAL O&M COSTS: 1,578 0.1915 1,744 0.1855Avg. Annual Opex/Conn. (IDR or USD/conn. ): 99,844 12.12 110,387 11.74
Annual Opex as % of Capex: 1.5% . 1.4%
Note: NA (not applicable); costing does NOT include VAT; Opex = Operating + Maintenance Costs; Capex = Capital Cost
Alternative 2A: Anaerobic Pond followed by Facultative Aerated Pond + Maturation Pond
Alternative 2B: Membrane Covered Anaerobic Pond+ Facultative Aerated Pond + Maturation Pond
Estimated Cost of Pond's CPE (plastic) Liner +
Protective Sand Top + Bottom
Estimated Cost of Cover for Anaerobic Pond +
Biogas Piping + Flare
REVIEWER REJOSARI WWTP:
COST SUMMARY
STAGE 1: 14.7 MLD
Approximately 17,300 Connections
ALTERNATIVE 2A ALTERNATIVE 2B
Estimated Cost for Site Prep. Including Raising
whole Site by 0.5 m (currently fish farm)
Estimated Mechanical Cost
Estimated Civil Cost of Ponds (ponds to sit on top of
site fill, no cut; dykes to be made of clean fill)
E. Cost Estimates and Implementation Schedule Total subproject cost for Pekanbaru City is $44.43 million equivalent. This is based on the direct costs estimated in the technical study and discussed in previous sections. The subproject cost includes taxes and duties, detailed engineering design, physical and price contingencies, land acquisition and involuntary resettlement cost. Details of the estimate are shown in the following table:

TA 7993 - INO: Metropolitan Sanitation Management Investment Project – MSMIP Final Report 236
Table VII-E 1: Summary of Cost Estimates ($ million)
Breakdown of Totals Incl. Cont.
Local
Base (Excl. Duties &
Cost Taxes) Taxes Total
1 Wastewater Treatment Works
a. Civil Works 12.47 14.93 4.70 1.49 14.93
b. Detailed Engineering Design 0.62 0.70 0.49 0.07 0.70
Subtotal 13.09 15.63 5.19 1.56 15.63
2 Wastewater Collection System
a. Civil Works 12.72 15.85 9.01 1.58 15.85
b. Detailed Engineering Design 0.64 0.72 0.51 0.07 0.72
Subtotal 13.36 16.57 9.52 1.66 16.57
3 Property Connections
a. Civil Works 7.28 9.33 4.90 0.93 9.33
b. Detailed Engineering Design 0.43 0.56 0.41 0.06 0.56
c. Construction Supervision 0.22 0.29 0.21 0.03 0.29
Subtotal 7.93 10.19 5.51 1.02 10.19
4 Land Acquisition 1.62 1.62 1.62 - 1.62
5 Involuntary Resettlement 0.39 0.43 0.43 - 0.43
T O T A L 36.38 44.43 22.26 4.24 44.43
Total
Cost
Source: PPTA Consultant’s estimates. a Based on estimates in the technical study.
b Includes taxes, duties, and contingencies (physical and price).
The total investment cost will be financed from various sources: ADB Ordinary Capital Resources (OCR), ASEAN Infrastructure Fund (AIF), Central Government and City Government of Pekanbaru.
The available financing will be allocated as follows: ADB OCR and AIF will finance $17.83 million equivalent and $8.92 million equivalent, respectively; the Central Government will shoulder all taxes and duties of $6.47 million equivalent while the City Government will cover land acquisition, involuntary resettlement and property connections amounting to $11.21 million equivalent. The distribution of fund sources is detailed in the following table:

TA 7993 - INO: Metropolitan Sanitation Management Investment Project – MSMIP Final Report 237
Table VII-E 2: Financing Plan ($ million)
ADB
OCR AIF Central City
1 Wastewater Treatment Works
a. Civil Works 8.96 4.48 1.49 - 14.93
b. Detailed Engineering Design - - 0.70 - 0.70
Subtotal 8.96 4.48 2.19 - 15.63
2 Wastewater Collection System -
a. Civil Works 8.87 4.44 2.54 - 15.85
b. Detailed Engineering Design - - 0.72 - 0.72
Subtotal 8.87 4.44 3.26 - 16.57
3 Property Connections -
a. Civil Works - - 0.93 8.40 9.33
b. Detailed Engineering Design - - 0.06 0.51 0.56
c. Construction Supervision - - 0.03 0.26 0.29
Subtotal - - 1.02 9.17 10.19
4 Land Acquisition - - 1.62 1.62
5 Involuntary Resettlement - - 0.43 0.43
T O T A L 17.83 8.92 6.47 11.21 44.43
Government Total
Cost
Source: PPTA Consultant’s estimates. ADB = Asian Development Bank, AIF = ASEAN Infrastructure Fund, OCR = Ordinary Capital Resources.
The subproject is proposed to be implemented over six years commencing in 2013 and to be completed by 2018. Operation of the wastewater system is targeted to start as soon as the wastewater treatment works are completed and property connections are installed. The indicative implementation schedule is shown in the following figure:
Figure VII-E 1: Indicative Implementation Schedule
1 2 3 4 1 2 3 4 1 2 3 4 1 2 3 4 1 2 3 4 1 2 3 4
Loan negotiation
Loan signing
Loan effectivity
Subproject Investments (for 5 Cities)
Main Works
Detailed engineering design (Grant)
Land acquisition and involuntary resettlement
Compensation for the WCS
Prequalification and bidding
Awarding of contracts
Construction of civil works
Waste Water Treatment Works
Trunk Sewers
Main Sewers
Storm Water Drainage
Laterals and Interceptors
Property Connections
Detailed engineering design
Prequalification and bidding
Awarding of contracts
Construction of civil works
WCS/ WWTW LATERALS
2013 2014 2015 2016 2017 2018

TA 7993 - INO: Metropolitan Sanitation Management Investment Project – MSMIP Final Report 238
The annual breakdown of costs by component is shown in the following table:
Table VII-E 3: Estimated Annual Subproject Costs by Component
Totals Including Contingencies (US$ Million)
2013 2014 2016 2017 2018 Total
1 Wastewater Treatment Works
a. Civil Works - 2.02 4.43 - - 14.93
b. Detailed Engineering Design 0.70 - - - - 0.70Subtotal 0.70 2.02 4.43 - - 15.63
2 Wastewater Collection Systema. Civil Works - 1.19 5.76 2.15 1.03 15.85b. Detailed Engineering Design 0.72 - - - - 0.72Subtotal 0.72 1.19 5.76 2.15 1.03 16.57
3 Property Connections
a. Civil Works - - 2.64 2.73 2.82 9.33
b. Detailed Engineering Design - - 0.16 0.17 0.17 0.56
c. Construction Supervision - - 0.08 0.08 0.09 0.29
Subtotal - - 2.88 2.98 3.08 10.19
4 Land Acquisition 1.62 - - - - 1.62
5 Involuntary Resettlement - 0.03 0.15 0.06 0.03 0.43
T O T A L 3.04 3.25 13.22 5.18 4.13 44.43 Source: PPTA Consultant’s estimates.
F. Financial Analysis 1. Methodology and Assumptions. The financial analysis followed the guidelines described in ADB’s Financial Management and Analysis of Project (2005). Three indicators of the financial viability of the subproject have been identified:
• Financial Internal Rate of Return (FIRR). It is the discount rate at which the net revenues generated by the subproject are equal to zero. A project is considered financially viable if the computed FIRR is at least equal to the weighted average cost of capital (WACC) applicable to the proposed subproject;
• Tariff affordability. The wastewater tariff should be affordable to low income households.
• Subproject sustainability. The funds will be on-granted to the City; however, the subproject should still generate sufficient cash flow from wastewater tariffs to cover annual operations and maintenance requirements.
•
The key financial and technical assumptions used in the projections are the following:
• Cost estimates at constant October 2012 prices. • Domestic and foreign cost escalations58 are as follows:
58 ADB SERD, Domestic Cost Escalation Factors Update, October 2012 and World Bank projections as of September 2012 for international cost escalation factors.

TA 7993 - INO: Metropolitan Sanitation Management Investment Project – MSMIP Final Report 239
2013 2014 2015 2016 onwards Domestic cost escalation 5.1% 4.8% 4.4% 4.4% Foreign cost escalation 1.9% 2.2% 1.9% 1.8%
• Exchange rate at Rp9,600 to US$1.0059.
• Physical contingencies at 10% to 15% of direct costs. • Constant costs used in the computation of FIRR while current costs are used in the
financial statements. • Operation and maintenance (O&M) expenses based on technical projections and
escalated at 4.4% annually. • Number of property connections (15,800 domestic and 1,468 non-domestic) based
on plant capacity as presented in the technical evaluation. • Gross revenues equal to number of connections by type, multiplied by the
appropriate tariff. • Collection efficiency of 95%, based on the reported collection efficiency for similar
services (solid waste management). • Loan proceeds from ADB will be passed on by the Central Government to the City as
a grant (i.e. the Central Government will pay all principal and interest due on the loan).
• Pekanbaru City will set up a Badan Layanan Umum Daerah (BLUD or Regional Public Service Agency) as the service delivery organization (SDO) to operate the wastewater system. A BLUD is a semi-autonomous service provider created for the provision of public service on a non-profit basis. Pending the establishment of the BLUD, a Unit Pelaksanaan Teknis Daerah (UPTD or Regional Technical Implementation Unit) is in the process of being formed under the Public Works (Perwali No. 42, 2012) to handle the preparatory, implementation and initial operational activities a. Capital Costs
The total development cost for the subproject is $44.43 million equivalent. This is based on the costs presented in the technical study, plus physical and price contingencies.60 The basic development (investment) cost and the O&M costs are projected on an annual basis for the purpose of the financial analysis. The total costs include physical and price contingencies to allow for the timing of implementation, both for local and foreign cost components. Acquisition of the land required for the subproject and detailed engineering design are scheduled in 2013 prior to construction works. Construction will start by the second half of year 2014 and is targeted to be completed by the end of 2018. Operations will commence in 2016, with full operations expected by 2019.
b. Operations and Maintenance
The proposed subproject is a new system and the SDO is a new entity, so there is no “without project” scenario. O&M costs are estimated by the technical engineers and are based on the capacity of the system. Included in O&M costs are personnel costs, chemicals for disinfection and dewatering of sludge, septage receival, sludge disposal, power cost, and
59 Bank of Indonesia. Average rate for period June to December, 2012.
60 To provide an effective wastewater treatment and collection service, the subproject will involve the construction of a wastewater treatment plant. trunk and main sewers, laterals and interceptors; rehabilitation of selected storm drainage lines; installation of property connections; acquisition of land; and involuntary resettlement activities.

TA 7993 - INO: Metropolitan Sanitation Management Investment Project – MSMIP Final Report 240
provision for repairs and maintenance. At 2012 constant prices, O&M costs are estimated to be $0.332 million annually when full operation is achieved by 2019. O&M costs are likewise escalated to current prices in the financial statements. c. Financing and Weighted Average Cost of Capital (WACC) The WACC is derived based on the financing plan, with each fund source given an investment weight expressed as a percentage, multiplied by the corresponding interest rate of the fund source, and adjusted for the prevailing inflation rate. Details of the WACC computation are shown in the following table:
Table VII-F 1: WACC Computation
ADB-OCR ADB-AIF Govt Total
1. Amount ($ million) 8.92 17.83 17.69 44.43
2. Weighing 20.1% 40.1% 39.8% 100.0%
3. Nominal cost 2.4% 3.8% 7.0%
4. Tax Rate 10.0% 10.0% 0.0%
5. Tax-adjusted nominal cost 2.2% 3.4% 7.0%
6. Inflation rate 0.5% 0.5% 5.1%
7. Real cost 1.7% 2.9% 1.8%
8. Weighted component of WACC 0.3% 1.2% 0.7% 2.2%
Weighted Average Cost of Capital (Real) 2.2%
Financing Component
d. Cost Recovery and Fees Affordability
The master plan prepared under INDII61 recommended that the City Government enact local regulation mandating all premises within the areas provided with sewer pipelines to connect to the system in order to have an effective and sustainable sewerage system in the City. Mandatory connection is necessary to ensure adequate capacity utilization of the system and the realization of assumed improvements in public health and environment. The local regulation must also stipulate that all households and commercial establishments provided with sewer connections will pay mandatory monthly wastewater fees and these fees will be collected by the BLUD through community organizations or leaders.
The loan proceeds will be on-granted from the Central Government to Pekanbaru City. It was decided that tariffs should at least cover O&M costs for sustainability, provide the tariff per household is still affordable to the target beneficiaries. The proposed tariff structure classifies consumers as either domestic (i.e. households) or non-domestic (i.e. commercial and industrial connections), with non-domestic connections to be charged more to boost revenues. The proposed monthly fee is $1.90 per domestic connection and $19.00 per non-domestic connection. Tariffs are expected to be implemented in 2016 when operations commence, increasing 15% every two years to keep pace with inflation. The estimated average monthly household income for 2011 was Rp1,950,000 (equivalent to about $203) based on the results of socio-economic survey conducted in a previous study62. The $1.90 domestic tariff will be 0.77% of the monthly household income, well within the 2% limit under DGHS’ policy for household wastewater charge.63 In all subsequent years, the domestic tariff
61 INDII. 2011. Wastewater Investment Master Plan, Final Feasibility Study: Pekanbaru.
62 INDII. 2011. Pekanbaru Socioeconomic Survey Report on Domestic Wastewater Management and Wastewater Investment Program).
63 INDII. 2011. Wastewater Investment Master Plan Package 1: Makassar.

TA 7993 - INO: Metropolitan Sanitation Management Investment Project – MSMIP Final Report 241
is expected to remain below 1% of household income. It should be noted, however, that the proposed tariff is above the $1.50 tariff target beneficiaries indicated they were willing to pay.
Initially it was assumed that domestic and non-domestic accounts would pay a one-time connection fee. City officials subsequently informed the study team that the City’s current intention is to charge non-domestic connections only a one-time connection fee of Rp1,650,000. Households will likewise be charged, but will be allowed to pay in instalment basis to encourage them to connect to the system. The investment cost includes the cost of connections, and as shown in the financing plan, this will be funded by the City Government from its own funds.
2. Result of Financial Analysis The FIRR of the subproject is measured as the discount rate that equalizes the present value cost stream associated with the project to the present value of the project’s benefit stream. A subproject is considered financially viable if the resulting FIRR is higher than the WACC applicable to the subproject. Sensitivity analysis is conducted under four scenarios such as a one-year delay in operation, a 10% increase in project cost, a 10% increase in O&M costs and a 10% decrease in revenues. The analysis shows that full recovery of the cost of the wastewater system and O&M costs through tariffs alone is not possible, due to affordability constraints and very low willingness to pay for this kind of service. Three scenarios were evaluated: Scenario 1 with tariffs equivalent to the tariff target beneficiaries indicated they were willing to pay; Scenario 2 with tariffs sufficient only to cover O&M costs resulting in a slight positive cash flow (but not sufficient to cover depreciation); and Scenario 3 with full cost recovery of investment and O&M costs. The following table shows the tariffs required for each category and results as to affordability, FIRR, net income and cash flow:
Table VII-F 2: Summary Result of Evaluation
Proposed monthly
fee per HH connection
a
Affordability over 10-
year projection period
b
FIRR Net Income after
depreciation
Cash Flow
Willingness to pay
$1.25 0.48% to 0.60%
-1.32% Negative Negative This requires a $0.11 million subsidy from the City for the first 10 years of operation.
Partial Cost Recovery (to cover O&M)
$1.90 0.73%to 0.91%
1.47% Negative Positive No subsidy required.
Full Cost Recovery
$5.51 2.13% to 2.64%
8.81% Positive Positive No subsidy required.
a Monthly fees are proposed to be increased by 15% every two years.
b Monthly fee as a percentage of average monthly household income. The percentage range represents the
minimum and maximum percentages during the 10-year projection period.
It is recommended that the wastewater fees should at least cover O&M costs to result in a positive cash flow for the SDO. Partial cost recovery ($1.90 per household connection and $19.00 per non-domestic connection) should be the minimum objective since if fees are lower (say, following the willingness to pay of $1.25 per household per month), a significant subsidy from the City Government will be required to make the operation sustainable.

TA 7993 - INO: Metropolitan Sanitation Management Investment Project – MSMIP Final Report 242
The FIRR results for the recommended partial cost recovery option are provided in the
following table:
NPV ($ m) FIRR (%) SI % Change SV
Base case (4.58) 1.4%
1-Year Delay in Operation (7.41) 0.8% 3.98 10% 25%
Capital cost plus 10% (7.95) 0.9% 3.84 10% 26%
O & M costs plus 10% (5.18) 1.3% 0.81 10% 123%
Revenues less 10% (8.09) 0.7% 5.10 10% 20%
FIRR = financial internal rate of return, NPV = net present value SI = sensitivity indicator (ratio of % change in EIRR to % change in a variable) SV = switching value (% change in variable required for EIRR to fall below cut-off rate)
3. Project Financial Sustainability and Implementation Risks a. Financial Projections for SDO
The financial sustainability and performance of BLUD, the operating entity, was projected over the ten years immediately following full system operation in 2019. The BLUD’s projected financial statements (balance sheet, income statement and cash flow statement for the period 2013 to 2025) are summarized and presented in Tables VII-F 4 and VII-F 5. Selected financial ratios and performance indicators were used to analyse the results of operations and project viability. Several risks may impact the BLUD’s financial performance including:
• Uncertainty regarding the implementation of tariff increases; • Uncertainty on the provision of public service obligation or PSO64 for O&M
costs, as maybe required; • Inadequate resources for counterpart funding; and • Inefficiency of its collections.
Tariffs must be periodically raised to keep pace with inflation (the projections assumed tariffs increase by 15% every two years), and the City Government’s approval is required for these increases. If tariffs are not periodically increased, the City Government must provide a support funds or a subsidy to ensure its financial sustainability. These factors should be properly addressed to mitigate the risks enumerated above. The projected revenues were based on the projected increase in the number of connections multiplied by the monthly wastewater service fees, initially $1.90 and $19.00 for domestic and non-domestic consumers, respectively. O&M costs were assumed at current prices. The projected income statements show that the wastewater fees can adequately cover the costs of O&M. From 2018 onwards, assuming 95% collection efficiency, results of operations will further improve with an average net income before depreciation of $0.52 million per year. However, net losses arise as revenues are insufficient to cover the full depreciation cost of the system. Depreciation expense is estimated at $1.63 million per year based on straight line computation and assuming 25 years of estimated useful life of the infrastructure. The projected balance sheet for the ten-year period includes the projected assets, liabilities and equity, as presented in Table VII-F 3. Total fixed assets reflect mainly the project cost
64 Public Service Obligation (PSO) is a form of subsidy provided by the City Government to the SDO.

TA 7993 - INO: Metropolitan Sanitation Management Investment Project – MSMIP Final Report 243
of $44.41 million, comprising roughly 98% of total assets. The debt to equity ratios are expected to be low as the proceeds of the loan and grant are on-granted from the Central Government to the City Government. The SDO’s liquidity position has an average ratio of 10:1. Selected financial ratios are presented in the financial statements. Projected cash flows were also developed and showed positive cash balances all throughout the projection period as shown in Table VII-F 5. Collection efficiency is assumed at 95% with average collection period of 15 days, providing for cash sufficiency for operations and maintenance.

TA 7993 - INO: Metropolitan Sanitation Management Investment Project – MSMIP Final Report 244
Table VII-F 3
PROJECTED INCOME STATEMENT($ million)
2016 2017 2018 2019 2020 2021 2022 2023 2024 2025
Operating Revenues
Water Sales 0.103 0.309 0.592 0.675 0.871 0.919 1.057 1.057 1.215 1.215
Domestic 0.036 0.108 0.207 0.290 0.429 0.476 0.548 0.548 0.630 0.630
Commercial 0.067 0.201 0.385 0.385 0.443 0.443 0.509 0.509 0.585 0.585
Other Operating Revenues 0.050 0.101 0.101 0.067 0.087 0.092 0.106 0.106 0.122 0.122
Total Revenues 0.153 0.410 0.693 0.742 0.959 1.011 1.163 1.163 1.337 1.337
Operating Expenses
Payroll -0.032 -0.097 -0.095 -0.100 -0.105 -0.110 -0.116 -0.122 -0.128 -0.135
Power Cost 0.021 0.063 0.086 0.091 0.095 0.100 0.105 0.111 0.116 0.122
Chemicals 0.067 0.201 0.211 0.222 0.233 0.245 0.258 0.271 0.285 0.299
Maintenance 0.019 0.057 0.078 0.082 0.086 0.091 0.095 0.100 0.105 0.111
Other O & M 0.051 0.155 0.167 0.175 0.184 0.194 0.204 0.214 0.225 0.236
Bad Debts 0.000 0.000 0.000 0.000 0.001 0.001 0.001 0.001 0.001 0.001
Total Operating Exp. 0.125 0.379 0.447 0.470 0.495 0.520 0.547 0.575 0.604 0.635
Net Income (Loss) before depreciation 0.028 0.031 0.246 0.272 0.464 0.491 0.616 0.588 0.733 0.702
Depreciation 0.702 1.508 1.695 1.777 1.777 1.777 1.777 1.777 1.777 1.777
Net Operating Income (Loss) (0.674) (1.478) (1.449) (1.505) (1.313) (1.286) (1.161) (1.189) (1.044) (1.075)
Less: Interest Expense - - - - - - - - - -
Net Income (Loss) (0.674) (1.478) (1.449) (1.505) (1.313) (1.286) (1.161) (1.189) (1.044) (1.075)
Projected

TA 7993 - INO: Metropolitan Sanitation Management Investment Project – MSMIP Final Report 245
Table VII-F 4
Projected Balance Sheet,($ million)
2013 2014 2015 2016 2017 2018 2019 2020 2021 2022 2023 2024 2025
ASSETS
Fixed Assets
Fixed Assets in Operation 0.000 0.000 0.000 35.117 40.301 44.431 44.431 44.431 44.431 44.431 44.431 44.431 44.431
Less: Accum. Depreciation 0.000 0.000 0.000 0.702 2.211 3.905 5.683 7.460 9.237 11.014 12.792 14.569 16.346
Net Fixed Assets in Operation 0.000 0.000 0.000 34.415 38.090 40.526 38.749 36.971 35.194 33.417 31.640 29.862 28.085
Add: Work-in-Progress 3.042 6.292 21.895 0.000 0.000 0.000
Total Fixed Assets 3.042 6.292 21.895 34.415 38.090 40.526 38.749 36.971 35.194 33.417 31.640 29.862 28.085
Current Assets
Cash (3.042) (3.469) (6.640) (10.940) (14.313) (17.385) (17.197) (16.813) (16.418) (15.893) (15.405) (14.770) (14.183)
Accounts Receivable (net) 0.000 0.000 0.000 0.000 0.010 0.031 0.060 0.071 0.093 0.099 0.115 0.116 0.133
Inventory 0.000 0.000 0.000 0.000 0.043 0.048 0.051 0.053 0.056 0.059 0.062 0.065 0.068
Prepayments 0.000 0.000 0.000 0.000 0.000 0.000 0.000 0.000 0.000 0.000 0.000 0.000 0.000
Other Current Assets 0.000 0.000 0.000 0.012 0.035 0.039 0.041 0.043 0.045 0.047 0.050 0.052 0.055
Total Current Assets (3.042) (3.469) (6.640) (10.929) (14.224) (17.267) (17.045) (16.646) (16.224) (15.687) (15.179) (14.537) (13.926)
Reserves 0.000 0.000 0.000 0.003 0.019 0.048 0.102 0.172 0.245 0.330 0.414 0.512 0.609
TOTAL ASSETS 0.000 2.823 15.254 23.489 23.884 23.307 21.806 20.497 19.216 18.059 16.876 15.837 14.768
LIABILITIES AND EQUITY
Current Liabilities
Accounts Payable 0.000 0.000 0.000 0.012 0.078 0.087 0.091 0.096 0.101 0.106 0.111 0.117 0.123
Total Current Liabilities 0.000 0.000 0.000 0.012 0.078 0.087 0.091 0.096 0.101 0.106 0.111 0.12 0.12
Equity
Donated Capital 0.000 2.823 15.254 24.152 25.958 26.820 26.820 26.820 26.820 26.820 26.820 26.820 26.820
Retained Earnings 0.000 0.000 0.000 (0.674) (2.152) (3.601) (5.106) (6.419) (7.706) (8.867) (10.056) (11.10) (12.18)
Total Equity 0.000 2.823 15.254 23.478 23.806 23.220 21.714 20.401 19.115 17.953 16.764 15.72 14.64
TOTAL LIABILITIES AND EQUIT 0.000 2.823 15.254 23.489 23.884 23.307 21.806 20.497 19.216 18.059 16.876 15.84 14.77
0.000 0.000 0.000 0.000 0.000 0.000 0.000 0.000 0.000 0.000 0.000 0.000 0.000
Projected

TA 7993 - INO: Metropolitan Sanitation Management Investment Project – MSMIP Final Report 246
Table VII-F 5
PROJECTED CASH FLOW STATEMENT, ($ million)
2013 2014 2015 2016 2017 2018 2019 2020 2021 2022 2023 2024 2025
Sources of Cash
Collection of Revenues - CY - - - 0.103 0.299 0.561 0.615 0.801 0.826 0.958 0.942 1.100 1.082
Collection of Receivables - PY - - - - - 0.010 0.031 0.060 0.071 0.093 0.099 0.115 0.116
Other Receipts - - - 0.050 0.101 0.101 0.067 0.087 0.092 0.106 0.106 0.122 0.122
Grant Funds - INDII
Central Government 1.427 0.393 1.888 1.652 0.642 0.472
City Government 1.615 0.034 1.284 2.748 2.736 2.796
Proceeds of Loan - 2.823 12.432 8.822 1.806 0.863
ADB-OCR 0.941 4.144 2.941 0.602 0.288
ADB-AIF 1.882 8.288 5.882 1.204 0.575
Capital Contribution 0.075
Total Sources of Cash - 2.823 12.432 9.051 2.206 1.535 0.713 0.948 0.988 1.157 1.147 1.336 1.320
Uses of Cash
Project Investment 3.042 3.250 15.603 13.222 5.184 4.130
O & M Expenses and Working Capital - - - 0.125 0.379 0.447 0.470 0.495 0.520 0.547 0.575 0.604 0.635
Reserves - - - 0.003 0.015 0.030 0.054 0.070 0.074 0.085 0.085 0.097 0.097
Total Uses of Cash 3.042 3.250 15.603 13.351 5.578 4.608 0.524 0.564 0.594 0.631 0.659 0.701 0.732
Increase(Decrease) in Cash (3.042) (0.428) (3.171) (4.300) (3.372) (3.073) 0.189 0.384 0.395 0.526 0.487 0.635 0.587
Add: Cash Balance, Beg. - (3.042) (3.469) (6.640) (10.940) (14.313) (17.385) (17.197) (16.813) (16.418) (15.893) (15.405) (14.770)
Cash Balance, End. (3.042) (3.469) (6.640) (10.940) (14.313) (17.385) (17.197) (16.813) (16.418) (15.893) (15.405) (14.770) (14.183)
Projected

TA 7993 - INO: Metropolitan Sanitation Management Investment Project – MSMIP Final Report 247
d. Municipal Finance
Dinas Kebersihan dan Pertaminan (DKP) undertakes the City’s environmental sanitation activities, with funding of its capital investments and O&M costs coming from the City Government’s annual budget. Similar to PDU, the DKP prepares an annual program and the annual budget ceiling is consolidated into the City Government’s annual budget. The DKP’s annual budget is not linked or limited to the revenues it expects to generate; as one of the agencies of the City, its budget allocation depends on the City Government’s environmental sanitation priorities and projects.
Historical Income and Expenditures
Aside from fund transfers from the Central Government, major sources of the City Government’s local source revenues (PAD) during the period 2008-2012 were local taxes for land, drainage and business operations. With the enactment of Law No. 28/2009, effective 1 January 2011, taxes on transfers of ownership of land and building (BPHTB) are now administered by the City Government as local source revenue (i.e. no longer shared revenues (Dana Bagi Hasil)). Taxes on land and buildings (PBB) will be treated as local source revenues effective 31 December 2013 at the latest. Historical data on the city’s financial performance is presented in Table VII-F 6.
Projected Income and Expenditures Individual revenue and expenditure items have been projected using historical trends and best estimates of local officials. When the City Government takes full control of the land and building tax administration (i.e. from both PBB and BPHTB), the City Government’s revenues are expected to increase significantly. The surplus projected in the short term is assumed to be available for some of the investments required for improved urban sanitation services. Surplus income can be used by the City Government to finance the PSO that the City Government will be required to provide to the SDO responsible for sanitation (including O&M and periodic major capital expenditures). Table VII-F 7 presents income projections before MSMIP. From this, the requirements of MSMIP in terms of equity for the investment amounting to $11.19 million were included. The evaluation shows that the City Government will have sufficient funds to cover the equity and initial O&M requirements of the subproject.

TA 7993 - INO: Metropolitan Sanitation Management Investment Project – MSMIP 248
Draft Final Report
Table VII-F 6 HISTORICAL MUNICIPAL FINANCE - PEKANBARU
FISCAL YEARS 2008 - 2012
(In Million Rupiah)
ITEM 2008 2009 2010 2011 2012
Actual Actual Actual Actual Budget 08-09 09-10 10-11 11-12 Average
REVENUE 1,137,673 1,039,508 1,183,353 1,536,063 1,583,348 0.91 1.14 1.30 1.03 1.10
Local Revenue 147,876 134,868 158,831 223,232 251,339 0.91 1.18 1.41 1.13 1.16
Local Tax 60,622 69,865 80,119 145,091 162,073 1.15 1.15 1.81 1.12 1.31
Retribution 43,515 43,690 59,149 57,370 61,948 1.00 1.35 0.97 1.08 1.10
Revenue from State-owned Enterprises 1,916 2,766 2,794 3,091 3,475 1.44 1.01 1.11 1.12 1.17
Others 41,823 18,547 16,769 17,680 23,843 0.44 0.90 1.05 1.35 0.94
Balance Fund (from Central Government 912,021 754,108 822,356 1,053,472 1,079,491 0.83 1.09 1.28 1.02 1.06
Tax / Non Tax Revenue 549,747 391,070 530,555 547,224 433,372 0.71 1.36 1.03 0.79 0.97
General Allocated Fund 351,339 354,901 280,284 488,816 622,185 1.01 0.79 1.74 1.27 1.20
Special Allocation Fund 10,935 8,137 11,517 17,432 23,934 0.74 1.42 1.51 1.37 1.26
Others Revenue 77,776 150,532 202,167 259,359 252,519 1.94 1.34 1.28 0.97 1.38
Allocation of Tax Revenue from Province 49,416 150,532 101,343 96,442 149,757 3.05 0.67 0.95 1.55 1.56
Special Autonomy Fund 22,360 - 78,600 141,906 97,508 - - 1.81 0.69 1.25
EXPENSES 1,073,487 1,145,460 1,193,935 1,443,986 1,583,349
Operating Expenses 899,828 920,330 987,635 1,204,811 1,295,957 1.02 1.07 1.22 1.08 1.10
Employees 656,653 660,546 704,926 837,271 940,062 1.01 1.07 1.19 1.12 1.10
Goods 189,751 185,431 202,545 248,395 274,153 0.98 1.09 1.23 1.10 1.10
Social Assistance 25,141 27,035 37,943 38,512 25,160 1.08 1.40 1.02 0.65 1.04
Grant 26,415 47,318 42,021 80,632 55,182 1.79 0.89 1.92 0.68 1.32
Capital Expenses 173,660 225,129 206,300 239,175 287,392 1.30 0.92 1.16 1.20 1.14
Surplus/(Deficit ) Before MSMIP (Rp mil) 64,185 (105,951) (10,582) 92,077 (0)
Growth Rate

TA 7993 - INO: Metropolitan Sanitation Management Investment Project – MSMIP 249
Draft Final Report
Table VII-F 7
MUNICIPAL FINANCE PROJECTION - PEKANBARU
FISCAL YEARS 2013 - 2025
(In Million Rupiah)
ITEM 2013 2014 2015 2016 2017 2018 2019 2020 2025
REVENUE 1,819,959 2,106,421 2,446,238 2,692,668 2,968,058 3,264,864 3,591,351 3,950,486 6,362,297
Local Revenue 291,662 339,225 395,401 461,832 540,477 594,525 653,977 719,375 1,158,560
Local Tax 194,487 233,385 280,061 336,074 403,288 443,617 487,979 536,777 864,485
Retribution 68,143 74,957 82,453 90,698 99,768 109,745 120,719 132,791 213,861
Revenue from State-owned Enterprises 3,997 4,596 5,286 6,079 6,990 7,689 8,458 9,304 14,984
Others 25,035 26,287 27,601 28,981 30,430 33,473 36,820 40,503 65,230
Balance Fund (from Central Government 1,231,580 1,411,136 1,623,564 1,760,836 1,910,581 2,101,639 2,311,803 2,542,983 4,095,500
Tax / Non Tax Revenue 455,041 477,793 501,682 526,767 553,105 608,415 669,257 736,183 1,185,630
General Allocated Fund 746,622 895,946 1,075,135 1,182,649 1,300,914 1,431,005 1,574,105 1,731,516 2,788,624
Special Allocation Fund 29,917 37,397 46,746 51,421 56,563 62,219 68,441 75,285 121,247
Others Revenue 296,717 356,061 427,273 470,000 517,000 568,701 625,571 688,128 1,108,236
Allocation of Tax Revenue from Province 179,708 215,650 258,780 284,658 313,124 344,436 378,879 416,767 671,208
Special Autonomy Fund 117,009 140,411 168,493 185,343 203,877 224,265 246,691 271,360 437,028
EXPENSES 1,778,410 2,003,515 2,262,270 2,560,707 2,906,126 3,196,739 3,516,413 3,868,054 6,229,539
Operating Expenses 1,433,540 1,589,671 1,765,657 1,964,772 2,191,004 2,410,104 2,651,115 2,916,226 4,696,612
Employees 1,034,068 1,137,475 1,251,222 1,376,345 1,513,979 1,665,377 1,831,915 2,015,106 3,245,349
Goods 301,568 331,725 364,897 401,387 441,526 485,679 534,246 587,671 946,450
Social Assistance 26,166 27,213 28,302 29,434 30,611 33,672 37,039 40,743 65,617
Grant 71,737 93,258 121,235 157,606 204,888 225,377 247,914 272,706 439,196
Capital Expenses 344,870 413,844 496,613 595,935 715,122 786,634 865,298 951,828 1,532,928
Surplus/(Deficit ) Before MSMIP (Rp mil) 41,549 102,906 183,968 131,961 61,932 68,125 74,938 82,432 132,757
Surplus/(Deficit ) Before MSMIP ($ mil) 4.33 10.72 19.16 13.75 6.45 7.10 7.81 8.59 13.83
Required subsidy for MSMIP 1.62 0.03 1.28 2.75 2.74 2.80 0.00 0.00 0.00
Surplus/(Deficit ) After MSMIP ($ mil) 2.71 10.69 17.88 11.00 3.72 4.30 7.81 8.59 13.83

TA 7993 - INO: Metropolitan Sanitation Management Investment Project – MSMIP 250
Draft Final Report
G. Economic Analysis
1. Scope of analysis Economic analysis was undertaken for the proposed investments in off-site sewerage system in Pekanbaru City. The proposed investments include: (i) a piped network of trunk sewers, main sewers, laterals and interceptors, including property connections, for collecting wastewater from sources within the city center65, and (ii) a 14.7MLD centralized wastewater treatment plant in Rejosari. The analysis includes an evaluation of the economic feasibility of the proposed subproject and the impact of changes in key variables on the economic feasibility of the investments. The analysis also includes an analysis of the distribution of economic benefits to stakeholders, including the poor.
2. Economic costs and benefits
Economic costs and benefits are expressed in constant October 2012 prices using domestic price numeraire. Costs include capital investments for piped sewerage network, centralized treatment plant, land, resettlement and O&M costs for the sewerage system facilities. The economic benefits considered in the analysis consist, among others, of (i) savings in health care costs for major sanitation-related diseases such as diarrhea, dengue and skin diseases resulting from reduced morbidity incidence due to improved wastewater management, (ii) avoided loss of income or productivity savings, (iii) avoided costs of desludging/constructing septic tanks, and (iv) averted costs of accessing polluted water for drinking and other domestic uses. The economic analysis was performed over a period of 25 years, including 5 years of investment implementation. Civil works construction was assumed to commence in 2014, with benefits starting to accrue in 2016.
Financial investments at constant October 2012 prices amount to about Rp474.3 billion, of which 30% is for the treatment plant, 61% for sewer network, and the remainder for land and related investments. By excluding taxes/duties and applying a conversion factor of 0.91, total economic costs of the proposed subproject was estimated at Rp388.5 billion.
3. Valuation of economic benefits
The economic benefits of proposed sewerage system which were considered in the analysis and the bases for their valuation are as follows (see Annex B – Financial and Economic Analysis):
a. Health benefits. Providing wastewater collection and treatment facilities is expected to reduce the incidence of sanitation-related diseases resulting in reduced costs of medical treatment and related health care services. The analysis considered diarrhea, dengue and skin diseases which are among the major morbidity cases in Pekanbaru. Valuation of health benefits was based on the incidence rate of diseases, cost of treatment, the proportion of
65 Subproject coverage area includes five of twelve kecamatans comprising Pekanbaru City, i.e., Lima
Puluh, Sail, Pekanbaru Kota, Sukajadi and Senapelan.

TA 7993 - INO: Metropolitan Sanitation Management Investment Project – MSMIP 251
Draft Final Report
cases seeking medical treatment in existing medical care facilities, and duration of illness. In Pekanbaru City, the average cost of treatment for diarrhea patients in hospitals/clinics was assumed at Rp260,000/patient/day66 while for non-severe cases, health cost is around Rp80,000/day. For dengue and skin diseases, the respective costs are Rp205,000 and Rp185,000/day. Reduction in disease incidence was assumed at 35%67. The present value (PV) of total health care cost savings within the subproject area over the 25-year period was estimated at Rp42.1 billion.
b. Avoided loss of income/productivity savings. People afflicted with the
diseases are often kept out of work and other daily activities resulting in loss of income or productivity. The economic impact of illness becomes critical when the patient is the sole or major income earner in the family. Reduced morbidity also reduces income/productivity losses. The value of this benefit was computed based on the proportion of patients who are economically active and compensation that the person receives for being on the job or is actively engaged in income generation. Compensation was based on minimum wage in the city. For in-patients, total loss of income also includes the foregone income of household member(s) who provides care while the patient undergoes treatment. The analysis assumed that one household member performs this role. Valuation of the additional foregone income also takes into account the number of days that the patient is sick, employment rate and average income of the person involved. PV of this benefit was estimated at Rp12.9 billion.
c. Avoided costs of desludging/constructing septic tanks. This benefit is
generated because once a property is connected to the sewerage network it foregoes the need for regular desludging of the septic tank. The current cost of desludging in Pekanbaru City is Rp250,000 per service. Frequency of desludging was assumed at once every three years.68 For properties with no septic tanks but are connected to the sewerage system, the amount saved for not constructing a septic tank is an added benefit of access to the sewerage network. Septic tank in the city costs about Rp4.0 million. The present value of this benefit over 25 years is approximately Rp27.0 billion.
d. Averted costs of accessing polluted water for drinking/domestic use.
Unabated pollution of water sources because of uncontrolled and improper disposal of wastewater, including human excreta, correspondingly increases the cost of water especially for drinking and other domestic uses. Pollution leads to avertive behavior on the part of water users either through the use of more costly technologies to improve water quality, increased treatment or
66 In the absence of medical cost data from Kota Pekanbaru, the average costs for the diseases in
Palembang were assumed in the analysis. 67
Based on WHO data which estimated morbidity reduction rate for diarrhea of 22.7%-37.5% due to improved excreta disposal. A survey and review of literature conducted by Esrey, et. al. also showed a 36% reduction in diarrhea incidence because of improved water supply and sanitation (Esrey, S.A, Potash, J.B. Roberts, and Shiff, C. Health Benefits for Improvements in Water Supply and Sanitation–Survey and Analysis of Literature on Selected Diseases, WASH Technical Report No. 66. 68
Based on SNI 03-2001: Tata Cara Perencanaan Tangki Septik Dengan Resapan, 2001.

TA 7993 - INO: Metropolitan Sanitation Management Investment Project – MSMIP 252
Draft Final Report
resort to alternative supplies (e.g., bottled water) which generally costs higher. This benefit was valued by estimating the total cost of water for both PDAM and non-PDAM users based on consumption rate, price of piped and non-piped water and attribution rate of pollution to total cost of water. In Riau province, it was estimated that 88% of water pollution is contributed by industry, 3% by agriculture and 9% by domestic sources such as households, commercial establishment and institution69. In the analysis, a higher rate of 45% was assumed for Pekanbaru City, particularly in the subproject area, in the absence of significant agricultural and major industrial sources of pollution and considering the fact that only 53% of the septic tanks have infiltration tanks. Based on the above assumptions, the PV of this benefit was estimated at Rp288.7 billion.
4. Un-quantified benefits
There are other economic benefits to be derived from improved wastewater management system which were not included in the analysis for lack of data and consequently, the difficulty of valuing their respective economic impact. These un-quantified benefits include, among others, the following:
a. Health care cost savings from reduced incidence of other sanitation-
related diseases; b. Value of sludge derived from the wastewater treatment process for use in
agriculture either as soil conditioner or fertilizer; c. Increased agricultural productivity and value of fish catch due to reduced
water pollution; d. Increased value of land previously made unusable or rendered marginally
productive because of pollution; and e. Impact of improved wastewater management and reduced pollution on
local tourism and economy. 5. Results of the economic analysis
Under “base case” scenario, the economic internal rate of return (EIRR) of the proposed sewerage system of 13.4% exceeds the assumed 12% economic opportunity cost of capital (EOCC), hence, the subproject is deemed economically feasible (Table VII-G 1). The present value of total net economic benefits (ENPV) amounts to Rp23.2 billion.
69 World Bank Water and Sanitation Program, Economic Impacts of Sanitation in Indonesia, August 2008.

TA 7993 - INO: Metropolitan Sanitation Management Investment Project – MSMIP 253
Draft Final Report
Table VII-G 1: Results of Economic Analysis (Base Case)
Subproject EIRR (%)
ENPV (Rp billion)
Pekanbaru sewerage system 13.4 23.2
EIRR = economic internal rate of return, ENPV = economic net present value
6. Sensitivity analysis Sensitivity tests assuming (i) a 10%-increase in capital investments, (ii) a 10%-increase in O&M costs, and (iii) a 10%-reduction in total benefits indicate that the subproject remains basically robust. Under a condition where total benefits are delayed by one year, the subproject has an EIRR slightly below the threshold. Simultaneous increases of 10% in both capital investments and O&M costs and a 10%-shortfall in total benefits estimated under the “base case” yields an EIRR of 10.1% (Table VII-G 2).
Table VII-G 2: Results of Sensitivity Analysis
Case
Change from Base Case (%)
EIRR (%)
ENPV (Rp billion)
Switching Value (%)
Capital investment O&M costs Total benefits 1-yr delay in benefits Combination (Cases 1, 2, 3)
+10 +10 -10
11.8 13.3 11.6 11.4 10.1
-3.2 22.0 -6.3
-10.4
-33.9
+9
+202 -8
-
-
EIRR = economic internal rate of return, ENPV = economic net present value, O&M = operation and maintenance.
The investments are most sensitive to reductions in total benefits, followed closely by increases in capital costs. Changes in O&M costs have very little impact on the economic viability of the investments.
Distribution of benefits
The proposed sewerage system investments will directly benefit a total of about 66,500 people (15,800 households) and 1,468 commercial establishments within the subproject area.

TA 7993 - INO: Metropolitan Sanitation Management Investment Project – MSMIP 254
Draft Final Report
Households and commercial establishments are the principal direct beneficiaries of the subproject. In addition to the afore-mentioned beneficiaries is Pekanbaru City government itself, through its service delivery organization (SDO). Of the estimated total economic benefits of Rp390.6 billion, 65% (consisting of health and productivity savings, averted costs of accessing clean water, and cost savings from desludging/constructing septic tanks) will directly accrue to households. Commercial establishments will gain 30% of the benefits in terms of averted costs of accessing clean water and cost savings on septic tank maintenance. About 5% of the benefits will accrue to SDO in the form of service payments from users of the system.
The poverty impact ratio (PIR) of the investments is 10%, which means that one-tenth of the subproject benefits will accrue to the poor. H. Gender Analysis and Gender Action Plan 1. Background and Objective
A gender-responsive project such as the MSMIP is one that involves an understanding of issues and problems from the perspectives of both men and women in the development process. Mainstreaming gender entails the integration of a gender perspective in the project design. Thus, a Gender Analysis is undertaken for ADB projects to identify project design elements that will enable women to participate in and benefit from the Project. It identifies factors that have the potential to exclude women from participating in or benefiting from the Project. Data for this analysis were obtained from available material from socio-economic surveys that were prepared during the preparation of a Master Plan for Wastewater Management. Under the PPTA, gender analysis made use of qualitative methods in addition to reviewing documents from Pekanbaru City and conducting various types of consultations. Gender analysis looked into gender issues and differences in the roles and responsibilities of women and men, their participation in social and economic life and the differential impacts on their lives of sanitation programs and services. Women were a key part of PPTA process. 2. Gender Characteristics70
The SES showed that 88 percent of household heads among the respondents of the Pekanbaru areas were males while only 12 percent were females, with 65 percent of all household heads within the age range of 35-59 years. Women who headed households tended to be older, with 69% of them were age 45 years and older, more so than male heads, where 42% were aged 45 years and older.
Seventy three percent of respondents graduated from upper secondary school or higher, where 40% of females finished primary school and or intermediate level, while 24% of male heads were the same. More than half the female respondents (56%) graduated from secondary schools and/or obtained higher degrees, while 74% of male heads did the same.
70 Additional/comparative data are included in the Poverty and Social Analysis, Annex D of the MSMIP Final Report.

TA 7993 - INO: Metropolitan Sanitation Management Investment Project – MSMIP 255
Draft Final Report
Households defined as “very poor” consisted of 10% of all female-headed households and 3% of all male-headed households, while households defined as “poor” consisted of 25% of all female headed households and 22% of male-headed households, indicating that there were more poor female headed households. 3. Gender Roles and Decision Making Based on the SES, decisions over household matters are decided by both spouses, but are largely dominated by the husbands, as expressed by 60% of the respondents. For example, on the renovation of the house, the decision rests on the husband as it is seen as a physical activity for men and is even extended over to decision for making on septic tanks and responsibility for cleaning of sewer. Men/husbands dominate in the decision-making and responsibility for “heavy work” or possibly “big expenses and technical” areas such as cleaning out drainage ditches (67%) and deciding to make a new toilet or septic tank (60%). Women and wives dominate in cleaning and changing the clothes of infants (75%) and possibly telling a child to wash his or her hands (45%). However, the responsibility of raising the children is the duty of both husband and wife, including the aspect of sanitation and cleanliness. On a day-to-day basis, the wife takes charge of cooking, cleaning the house and surroundings including sorting and taking out the garbage. It has been the feedback that a great deal of decision-making and carrying out of tasks within the household was shared between men and women, although men take over tasks that require greater strength or construction skills, and women are more responsible for daily child rearing tasks. In the context of improvements to sanitation, both men and women’s decision-making and participation is critical to the success of the project. 4. Sanitation Hot Spots The area around the proposed site for the WWTP site, Rejosari Village, Pekanbaru, is surrounded by informal settlements and rental properties. There are inadequate sanitation facilities. Many are renters or informal settlers who cannot make capital improvements on the property. While there is a need for improved sanitation, the WWTP site is outside the sewerage service area. As an impact area of the WWTP, there are expectations that the project could help improve facilities for the area as well – roads, sanitation and livelihoods. The area is described as neglected; many women did not work but have time to establish livelihood options except that they lacked access to credit or technical assistance. It was the hope that the Project could help.
5. Perceived Benefits and Concerns of Women Women would benefit by being mainstreamed into decisions about waste water services through participation on community groups/local organizations, and in project management structures. Through their participation in the project, it is expected that women will have a more balanced representation on the operational and monitoring process.

TA 7993 - INO: Metropolitan Sanitation Management Investment Project – MSMIP 256
Draft Final Report
According to the SES, women-headed households, especially the low-income ones, would benefit from project improvements as long as project implementers remain sensitive to their existence, since many female heads do not attend socialization and planning meetings (they view this as male domains), and rarely have anything to do with public construction activities. The waste water project will have a positive impact on women in general. Home environments will be made cleaner and safer from waterborne and water-related diseases. Groundwater should improve, so that home wells and boreholes will provide cleaner water for domestic use. The needs of sanitation hot spots should be prioritized. This includes communities around the WWTP site where people expected to be benefited through improved sanitation and improved facilities (road, livelihood assistance for women.) 6. Local Organizations and Gender Mainstreaming In Pekanbaru City there is no NGO concerned with just sanitation. However, some community activities have gender aspects in existing NGOs with particular concern for the environment and health. The NGOs being mentioned make sure to infuse a “gender “spirit” to their approach and community activities.
Some women have a position as community leader such as the Majlis taklim head. There are also the Posyandu cadres who live along proposed sewerage lines who have a close rapport with the community. This makes them influential at the kelurahan, neighborhood, and household level. They can be involved in promoting the public awareness plan. Involvement in WWTP projects empowers women, especially when project activities are implemented. Women can participate in socialization, collecting monthly bill and as maintenance keeper/controller (because most women stay at home) of the project for onsite sanitation. Women can contribute in socialization to encourage community to connect.
7. Institutional Gender Assessment
For Sanitation Pokja members, gender focus is provided by the Social Institution (Dinas Sosial) and the Female Empowerment and Family Planning Board (BPPKB Badan Keluarga Berencana dan Pemberdayaan Perempuan).
At the Public Work Institution, (PU), there are 71% (76 persons) male and 29% (31 persons) female staff; Bappeda had 70%-30% ratio with 59 male and 23 female; PDAM had 70% male and 30% female; 30% female were in management positions. There is no gender focal person or programs but there is a claim of no gender differentiation in terms of employment opportunities; criteria for hiring and promotion are based on merit. There are women leaders of projects such as PPTK. The PU and Bappeda would support gender mainstreaming. Gender budget can be accessed from the Central Government Budget for Income and Expenditure (APBN) and Local Government Budget for Income and Expenditure (APBD).

TA 7993 - INO: Metropolitan Sanitation Management Investment Project – MSMIP 257
Draft Final Report
Feedback was obtained from Bappeda and PU, the executing agency, on possible pro-poor measures for the project. It is the idea that house connection would not be free of charge. There was agreement that subsidies may be given for connection for the poor which replicates the system at PDAM that gives free clean water connection to the poor. Monthly fees for sewerage would depend on income class with tariff to be regulated in the Regional Regulation (Peraturan Daerah) for 2014. The agencies believe that women’s participation is important in health and sanitation such as in LKM and in community empowerment activities such as through PNPM and local institutions including PKK, BPM, KSM. It is the belief among the agencies that women and the community will be happy to participate in hygiene and sanitation promotion even without pay. 8. Willingness to Contribute to Sanitation Improvement Activities Based on the SES, 77% are willing to connect but only 14% of male headed expressed any interest to contribute to sanitation improvement activities, while 0% of female headed households wanted to do so. Mostly the male heads who were interested to contribute said they could contribute labor (60%), with a few being willing to contribute materials, money or food and drink. Female heads were not willing to contribute anything to these efforts.
From consultation with women leaders who lived along porposed sewerage pipeline, it was noted that about 50% of residents rented. house found that it needs discussion with the people when there is a new program (WWTP project). Because people already have waste disposal septic tanks, many feel that this is adequate although they have to desludge the septic tanks when full. In this condition, the city and kelurahan need to involve community leaders and local community organizations that are close to the people in order to encourage them to connect. The feedback is that the people need more explanation about the project and its dimensions to enhance willingness to connect.
Poverty is one constraint for a sector of the population, especially those who lived in sanitation hot spots; people were concerned that they might not be able to afford sewerage connection and/or high cost monthly bill. So MSMIP needs a policy to address affordability and to maximize benefit for women, the community organizations and stakeholders in Pekanbaru City may use gender analysis to ensure maximum participation by women and therefore increase benefits to society from women's skills. 9. Gender Analysis and Strategy
Lack of awareness by men and especially women and satisfaction on existing sanitation services is seen as a constraint to achieving high rates of sewerage connection. Increased hygiene and sanitation information is perceived as a help which is consistent with the designation of hygiene and sanitation awareness as a component of the project. Joint sanitation awareness planning puts a focus on collective decision-making strategies and mobilizing authorities and stakeholders for sustained behavior change on hygiene and sanitation. It is designed to influence social acceptance for sewerage

TA 7993 - INO: Metropolitan Sanitation Management Investment Project – MSMIP 258
Draft Final Report
connection and behavior change on sanitation not only within the project site but the entire city as well. Affordability is perceived as a bar to participation if this means a high connection cost or monthly bill. There is consensus among community members and implementing agencies on the importance of pro-poor measures for those who are identified to need assistance which can be based on existing government subsidy programs for the poor with IEC in sanitation hot spots. The strategy is for free domestic connection and targeted subsidy for monthly fees for vulnerable groups including the poor, elderly and female-headed households. Further discussion among stakeholders is strategic to further consider people’s willingness to contribute to part of cost of connection consistent with recommendations to charge an affordable connection rate. There are sanitation hot spots along waterways, in floating villages and around the WWTP site where there is need for sanitation improvement but where there may be lack of capacity to pay for improved sanitation. Universal connection and subsidies help low income households. Proposed interventions for onsite sanitation improvement as well as livelihood development assistance promotes social inclusion for the WWTP sites which are outside of coverage area for sewerage improvement. Technical constraints such as lack of PDAM/steady supply of water, satisfaction with onsite connection, tight space, connection to onsite systems and the like will need active consideration by village authorities and residents and designers during the sanitation audit and design and construction phases. Strategies to reach absentee homeowners will also need to be discussed at connection phase since significant numbers are renters. A pro-poor measure is included to address sanitation and income lack in WWTP sites. Installing onsite sanitation or establishing livelihood development needs to be assessed for viability of preferred livelihood options and land tenure concerns. Problem solving on connection issues shall be facilitated through participatory processes and collective decision making as proposed in Implementation Arrangement Plans for Gender and Social Development, Gender Action Plan, Stakeholder Communication Strategy and Community Participation Plan. Women, community organizations and institutional partners in Pekanbaru City agree that gender analysis and women participation in sanitation promotion can ensure maximum participation by women. A Gender Action Plan and gender inclusive capacity building and joint sanitation advocacy planning promotes active roles of stakeholders where the needs of both women and men are addressed and women’s organizations are enlisted for sanitation advocacy and for better social and economic outcomes. In addition, quotas for female recruitment (20% more by 2018) and promotion (20% more by 2018) and training (50% female representation) and decision making, promote women empowerment at staff and community levels. Potential social risks are also managed such as the influx of migrant workers exacerbating sanitation and social and health concerns such as waterborne diseases through poor sanitation and sexually transmitted diseases due to workers camps. Pro-poor and inclusive measures are quotas for local workers (35%) with preferential hiring from low income communities with requirements for sanitation standards at workers camps. HIV/AIDS education will also be implemented by contractor and under the GAP.

TA 7993 - INO: Metropolitan Sanitation Management Investment Project – MSMIP 259
Draft Final Report
10. Gender Action Plan The Gender Action Plan below (under category of Effective Gender Mainstreaming) summarizes how the Project will benefit both men and women and how different components of the Project will address gender disparities and enhancement opportunities in plan implementation. Targets may be revisited during project implementation.
Table VII-H 1: Gender Action Plan, Pekanbaru
Strategies Project Outputs and GAP Targets Output 1: Completed Infrastructure Development of Off-Site Waste Water Systems Promote Women and Community involvement in construction, operation and decision making
• At least 40% of participants in public consultation and sewerage connection campaign activities are women and vulnerable groups such as female headed households) who get full information about subsidized connection fees and criteria for subsidized monthly tariffs
• At least 40% women participants in consultations on resettlement/land acquisition • Future sanitation tariff increases take into consideration gender and affordability
through 50% women participation in public hearings for tariff hikes • Information bulletin on risks of HIV/AIDS relayed through appropriate media with civil
works contractors providing information/preparing code of conduct for workers
Promote inclusive access to sanitation services
• Universal connection through free or subsidized domestic connection • At least 4.5% of connected households being from poor and female-headed or
vulnerable people (e.g. old, sick, disabled) in sanitation hot spots through subsidized monthly feesOnsite sanitation managed by CBOs established in non-sewered hot spots near the Waste Water Treatment Plant sites connecting at least 90% of households disposing waste water into waterways with at least 50% of households being from poor, female-headed household or vulnerable groups (if population will otherwise not have access to sanitation infrastructure) implemented in coordination with eligible NGO.
Increase Livelihoods and Employment
• Civil works construction shall employ at least 35% local labor from urban poor women and their families where there is equal pay for men and women for work of equal type Sanitation and livelihood development fund of at least $55,00071 shall be set aside and additional sources raised as needed for low income areas around the Wastewater Treatment Plant sanitation hotspots for onsite sanitation improvement (if population will otherwise not have access to sanitation infrastructure) at Rejosari Village, Pekabaru.
• Livelihood seed fund of $8,000 (included in Sanitation/livelihood Development Fund) supports viable livelihood for at least 50 women and their organization near the WWTP.
71 This amount per city is inclusive of onsite sanitation budget of $42,000 with $8,000 Livelihood Development Seed Fund and $5,000 for capacity building on sanitation system O and M and livelihood development. This will be allocated upon completion of needs assessment. This represents funds that can be augmented by other agencies for both livelihood development and sanitation improvement. For instance, the area may be scheduled for installation of onsite sanitation system under the WW Improvement Master Plans of the cities.

TA 7993 - INO: Metropolitan Sanitation Management Investment Project – MSMIP 260
Draft Final Report
Output 2: Completed capacity building for strengthened sanitation strategy and institutional capacity Equity in staffing Training and Capacity Building and Institutional Set up
• PMU/IA/SDO with additional 20% female staff with 20% increase of females in management positions by 2018
• Specific gender and sanitation training modules and technical/management capacity development training are open to managers and staff at all levels (i.e. national, districts) to promote professional advancement of female staff where at least 50% of participants are women for in training on gender, community facilitation, utility management, technical and project/sector management-related skills
• At least 50% are women who participate in capacity building on hygiene and sanitation education, promotion, planning and participatory monitoring – e.g. WWTP impacts, etc.
• At least 40% of women in key decision-making and working groups such as Resettlement Committees, monitoring committees, Community supervision mechanism for Joint Sanitation Plan implementation, O and M structure and for onsite sanitation systems
• Gendered indicators in PPMS and GAP in quarterly reporting • A full-time Social/Gender specialist shall be hired in PMU
Output 3: Improved communication and public information on hygiene and sanitation Improved mechanism for public feedback and hygiene and sanitation promotion
• Women and community organizations such as PKK are partners in IEC and Joint Sanitation planning and delivery where at least 50% are women.
• 50%-50% male and female for community facilitators for awareness raising where male facilitators target male population to share responsibility for complaint reporting/management and sanitation promotion
• Joint sanitation marketing and sustainability planning and implementation with at least 50% female attendance in consultations and membership in implementation mechanism
I. Poverty and Social Analysis The Asian Development Bank supports equitable and sustainable social development outcomes by giving attention to the social dimensions of its operations. A Social and Poverty Analysis is mandatory for all ADB projects to examine social development issues and a project’s potential effects, especially on poor people. Social analysis and poverty analysis are critical tools in ADB’s efforts to reduce poverty since these address the processes and structures that exclude some groups from participating in and benefiting from economic development. Thus, ADB adopted social development policies and strategies covering such issues as gender and development, social protection, and cooperation with nongovernment organizations (NGOs); social safeguard policies on involuntary resettlement and indigenous peoples as reflected in the ADB’s Operations Manual.

TA 7993 - INO: Metropolitan Sanitation Management Investment Project – MSMIP 261
Draft Final Report
2. Key Findings of Socio-economic Survey (SES) and Stakeholder Consultations
In preparing the Poverty and Social Analysis, surveys were conducted in earlier phases of project preparation. The following is based on a 2011 socio-economic survey for Pekanbaru that was prepared by PT. U Tekno Pekanbaru with Sinclair Knight Merz (SKM) for the Waste Water Investment Master Plan through the Indonesia Infrastructure Initiative (IndII) and AusAid. Survey data were augmented with information gathered from communities, women and vulnerable groups, as well as with village officials and concerned agencies during project preparation. In addition, a limited survey of target households and business establishments was also undertaken in October 2012. Updated health and official data were also obtained from the city. Critical outputs were presented to key partners for a consensus on the findings and needed interventions.
a. Population Characteristics
The census population of Pekanbaru in 2010 shows 897,768 individuals, with a population density of 1,420 people per square kilometer. There are no significant numbers of indigenous people in the project area. Of the 403 respondents who represented their households, 88.19% were male respondents; 11.91% were female respondents. All respondents were functionally literate but of different levels of education; 51.4% completed senior high school education, with less having completed college education (diploma and bachelor) at 22.3%, and 16.6% completing junior high school. Based on the SES the average household income was Rp. 2,000,000 with the minimum wage set at Rp 1,016,000 in 2010. Average household (HH) income was higher than the poverty threshold of Rp 1,306,680/HH for the city. With poverty incidence at 4.25%, affordability could be a factor for a small section of the population in the acceptance of improved sanitation services. The most common occupation of respondents was employee/worker at 34% because Pekanbaru has mining, gas and oil and palm oil factories. About 28.3% are self-employed while the others are government employees and retired/unemployed. Their houses occupy different sizes of land where 44.4% of the households have lands that vary at 45 m² - 120 m². This is followed by 40.2% who owns 121 m2 - 299 m2 and by the 15.4% of the households with lots being equal to or greater 300 m2. These indicate that space is a potential constraint in service connections. Of the total households, 53.1% own the houses they occupy and 43.7% are on lease or contract arrangements and others live with family in extended structures or live in house institutions (rumah dinas). Home ownership is related to interest to connect so care shall be taken to inform and engage home owners with rental properties to connect to sewerage services.

TA 7993 - INO: Metropolitan Sanitation Management Investment Project – MSMIP 262
Draft Final Report
Houses are connected to electricity services provided by a local power distribution company. About 86.8% of the respondents live in houses made of permanent materials, 12.9% occupy semi-permanent structures, while others live in houses made of light materials.
b. Need for Improved Sanitation Services
Findings reveal that there is a high need for improved sanitation services in the project site. Of the surveyed households in Pekanbaru, 93,46% had private toilets, while those using communal toilets were at 4.69%, those using public toilets were at 0.33% and those respondents who used others were 1.62%. Concerning septic tanks, 67.6% of the respondents said that they are located in back of their house. The distance between a septic tank from the wells is less than 10 m because of limited land in their backyards. About 53.5% of the septic tanks are sealed while 34.8% has no suction. Of the total respondents, 80.8% pointed out that they had no problem with their septic tanks, but only the smell and leak. In emptying their septic tanks, 8.3% of the respondents hired the services of a desludging company while 69% did it themselves. Charges for suctioning the septic tank differed but it was about Rp. 200,000 for 22.6% of the respondents. For the rest, the cost of desludging service was between Rp.220.000 – Rp.270.000/septic tank depending on capacity.
c. Affordability and Demand for Improved Sanitation Services
Participation in wastewater activities in the community is viewed by 76.9% of the respondents in terms of availability of clean well water in their houses, while others cited preferring odorless and colorless water during dry season. From 33.3% of the respondents, they believe that a group of community organizations should be involved in the maintenance of public toilets. As for the involvement of communities in the development of public toilets / sewerage / waste, 51.4% would help in physical development. In addition, 59.6% is willing to contribute for electricity and 21.1% for food consumption of the workers. Friday should be reserved for home activities. At FGDs during the PPTA, meetings among women in lower income neighborhoods showed no knowledge of what was a fair amount to pay for sewerage services. They were willing to connect to sewerage service if free. Those that rented left the decision to the homeowners. This indicates a role for village government setting policy on sanitation standards in the village. Women expressed a need for more information on sewerage systems but saw good prospects for participation with proper “socialization.” Possible reasons by those that they thought were not sure to connect were lack of information as the biggest constraint, fears of high monthly charges and/or high connection fees as well as high cost of repair of damages to the house due to connection. They also pointed out that renters could not make the decision on sewerage connection.

TA 7993 - INO: Metropolitan Sanitation Management Investment Project – MSMIP 263
Draft Final Report
People in Pekanbaru showed high satisfaction with existing sanitation services. Among households with toilets/latrines, 90.8% considered their sanitation facilities to be relatively good, and 65.3% disclosed that there was no need for them to pay for monthly sanitation fees. Only 34.7% expressed the necessity for wastewater services and a willingness to pay at Rp. 10,000 per month. Charges for suctioning the septic tank differ; it is Rp 200,000 for 22.6% of the respondents. The cost of desludging service amounts to Rp.220.000 – Rp.270.000/septic tank. Proposed connection and monthly fees were way below current expenditure on utilities showing lower priority of sanitation improvement. These can be used in sanitation marketing to point out the comparative costs and benefits of sanitation services and as basis for discussion by all concerned on optimum rates to allow the utility to provide service while considering what people could afford. Based on the FGD conducted by the PPTA, the willingness to pay for the sewerage connection was based on the cost of building a septic tank including cost of materials and workmen fee. Based on this, two participants mentioned a Willingness to Pay amount of between Rp.2,000,000 and IDR 2.500.000. Based on the Focus Group Discussion the proposed cost of piping installation that respondents were willing to pay: for the poor: � Rp. 500.000, middle: Rp. 500.000 < x< Rp. 1.500.000 and rich: � Rp. 1.500.000 and monthly fee. As for monthly fees, the poor are willing to pay: � Rp. 10.000, middle: Rp.10.000 < x < Rp. 25. 000 and rich: � Rp. 25.000.
d. Health, Hygiene Practices On the health situation of households, 33.3% disclosed that they have family members who fell ill within the three months period, across all socioeconomic classes of the respondents. But the highest was felt by 37.5% of those who belonged to poor households. Most common diseases that afflicted their members were colds (48.6%), coughs (23.5%) and sore throats (3.6%), and water-related diseases such as diarrhea (12.0%). Nineteen per cent of the respondents pointed the causes of these diseases to polluted water in their environment, weather and mosquitoes, among others while 83.1% thought these were due to poor hygiene or dirty defecation of the infants which largely comprised the victims of the diseases. Hygiene and cleanliness is also an issue in the study area. After work, only 69% washed their hands, 38% washed and 31% washed with soap and water. On feeding the children, only 42.2% washed their hands with water only, while 50.4% used soap and water. Washing hands with water and soap after defecation is practiced by 90.3% of the respondents. Incidence of HIV/AIDS is1216 and 731, respectively, in 2012
e. Impact on Affected Persons
The proposed area for the waste water treatment plant is an informal settlement with productive plants such as rubber trees, with 11 landowners. The landowners were willing

TA 7993 - INO: Metropolitan Sanitation Management Investment Project – MSMIP 264
Draft Final Report
to sell land to the government but the price is currently under negotiation. There was awareness of the project by neighboring communities. But there is still a lack of awareness of the possible negative impacts of a WWTP in their vicinity. On the other hand, a community from the area sought participation in a monitoring body that would be set up during project construction and operation and have willingness to connect and pay according to their economic affordability. According to them if the said project could bring about positive impacts to the health of local communities, they would fully support the program.
f. Indigenous Peoples and Vulnerable Groups
There are no significant populations of indigenous peoples in the project sites. Dominant ethnic in WWTP Area are Melayu Riau and Sunda Ethnic. Vulnerable groups are the urban poor who live in rental properties with poor sanitation facilities. Interviews indicate that there are those among this group that may not likely to connect because they could not make the decision for the homeowner and because some may have insecure job tenure. They work in nearby factories and could be temporarily unemployed following short term contracting practices of local industries. Some areas along waterways risked flooding of water source and septic tanks which highlights the need for improved sanitation services.
g. Sanitation Hot Spots
The area around the proposed site for the WWTP site, Rejosari Village, Pekanbaru, is surrounded by informal settlements and rental properties. There are inadequate sanitation facilities. Many are renters or informal settlers who cannot make capital improvements on the property. While there is a need for improved sanitation, the WWTP site is outside the sewerage service area. As an impact area of the WWTP, there are expectations that the project could help improve facilities for the area as well – roads, sanitation and livelihoods. The area is described as neglected; many women did not work but have time to establish livelihood options except that they lacked access to credit or technical assistance. It was the hope that the Project could help.
h. Community Organizations
There are youth/health/community organizations, such as KSM/LKM, and women organization such (PKK, Posyandu, Puskesmas, Puskesmas Pembantu). KSM along with community organizations manage private community sanitation facilities such as public toilets and communal septic tanks. The assessment is that there is a general lack of awareness on hygiene and sanitation but there are good prospects for improving sanitation connection through good a public awareness campaign.
i. Issues and Concerns
Concerns raised that are relevant to connection and behavior change on sanitation are: low-lying areas get flooded and could not connect to communal septic tanks due to elevation; narrow access roads and lack of space for pipe connections; fears that high cost of WWTP and operations may translate to high cost for clients. The respondents felt that the concerns need to be addressed with the communities during detailed design and in designing sanitation awareness campaigns.

TA 7993 - INO: Metropolitan Sanitation Management Investment Project – MSMIP 265
Draft Final Report
The demand for water for domestic needs is continually increasing, reflected by a growth rate of 2.76% from 2005-2009. Overall, the problem of water quality and waste water disposal is related to other sanitation problems such as open defecation and garbage disposal. Poor people dispose waste directly into the river and waterways causing drainage problems, seasonal and chronic flooding and lack of clean water. Moreover, there are no sanctions by city government for substandard septic tanks. Sanitation promotion needs to address the interlocking problems in sanitation for the proposed wastewater services to make a dent in improving sanitation practices and water and environmental quality.
j. Recommendations from Stakeholder Consultations
Proposals from consultations on needs, issues, constraints and opportunities are summarized below:
• Socialized Connection Rate and Monthly Fees for Poor and Vulnerable - Changes were noted for responses for willingness to connect since the SES was done. An increase was noted in willingness to connect since then. This can be the subject of further discussion between the Implementing Agency and project beneficiaries to find the optimum rate between affordability and willingness to pay. However, all acknowledged the importance of providing subsidy for vulnerable groups for connection and monthly fees since they are in a position of greatest need.
• Hot spots are settlements near waterways – not all people in these areas are poor and yet most dispose waste water into waterways. Due to space, land tenure, flooding, capacity to pay and other concerns, individual sewerage connection may not be feasible. Communal septic tanks can serve as collection point to avoid disturbance of individual properties. It is the consensus that sanitation hot spots require attention. Appropriate solutions may be in coordination with other septage management options and subject to community assessment and planning.
• Proposed role of village government, women and community organizations in sanitation promotion and project monitoring highlights the importance of mechanisms for cooperation and joint action for on sewerage connection and related sanitation problems.
• Narrow passages and space between houses is seen as a possible constraint during construction. Cost of repairs of tiles, etc. as a result of home connection is another deterrent to immediate connection. Construction disturbances need to be coordinated and planned for with affected communities. Sewerage connection to communal septic tanks a possibility.
• Water connection – Low water levels of water connection in the city (10%) served by PDAM. Landownership and sanitation audit during detailed design can ascertain implications of these for sewerage connection planning to ensure that measures are set in place to address constraint in coordination with water utility.
• Gender Mainstreaming, Public Awareness and Pro-Poor Measures - Institutions such as the Pokja, NGOs and Bappeda acknowledged the need to firm up measures for pro-poor policies for sewerage connection. Some form of subsidy is seen which should be subject to further analysis and discussion among all

TA 7993 - INO: Metropolitan Sanitation Management Investment Project – MSMIP 266
Draft Final Report
concerned to arrive at an amount that has a bearing on the true costs of connection and maintenance.
• Replicated from PDAM, house connection will be free of charge for the poor. Tariff/monthly fee depend on income class. The tariff will be regulated in Regional Regulation (Peraturan Daerah) in 2014 about tariff of waste water. Low income/the poor have minimum knowledge and no money but middle/high has that.
• Gender mainstreaming of policies for customer and staff development was supported even while no major gender issues were identified. A proposed training need relates to gender mainstreaming. Based on interviewed with women organization, women should be more engaged in the management.
Table VII-I 1: PEKANBARU Key Findings of Socio-Economic Survey and
Stakeholder Consultation
Parameter Survey Result Basic Data for Pekanbaru City
The population of Pekanbaru in 2010 was 897,768 people while there were 224,442 households. The annual growth rate was 2.76% from 2005 – 2009.
Respondents’ Characteristics
Based on SES, The monthly household income on average was Rp. 2,000,000; 4,25% of the population lived below the poverty line; most were workers and employees; served population for PDAM water was 10% of households in the city.
Needs 93.46% had private toilets, while those using communal toilets were at 4.69%, public toilets were being used at 0.33% and others 1.62%. There is a continued presence of disease and bad smell caused by flooding, and the lack of clean water.
Affordability and Willingness to Pay (WTP)
SES Pekanbaru - The Willingness to Pay monthly fee was Rp. 24,750 high end, average17.515. Based on FGD with women about WTP about 10.000 – 25.000 or adjusted to the economic level of the household. It is their assessment that with proper orientation on benefits, many would connect.
Health, Hygiene and Sanitation
Based on SES Pekanbaru, households’ health situations, 33.3% disclosed that they have family members who fell ill within the three months period, across all socioeconomic classes of the respondents. The highest was felt by 37.5% of those who belong to the poor households. Most common diseases that afflicted their members were colds (48.6%), cough (23.5%), diarrhea 12.0%. Nineteen per cent of the respondents pointed the causes of these diseases to polluted water in their environment, weather and mosquitoes, among others while 83.1% thought that due to the lack of or dirty defecation of the infants which largely comprised the victims of the diseases. Hygiene indicators are: after work, only 69% are washing their hands after work, 38% washes with water as 31% with soap and water. On feeding the children, only 42.2% wash their hands with water only, while 50.4% use soap and water. Washing hands with water and soap after defecation is practiced by 90.3% of the respondents. Incidence of HIV/AIDS – 1216 and 731, respectively in 2012

TA 7993 - INO: Metropolitan Sanitation Management Investment Project – MSMIP 267
Draft Final Report
Parameter Survey Result Gender Roles, Issues, Organizations
There are youth/health/community organizations, such as KSM/LKM, and women organization such (PKK, Posyandu, Puskesmas, Puskesmas Pembantu). Roles in decision making in the home were shared or women-led on child-rearing, sanitation and home care. Gender issues on water sanitation among others are lack awareness and understanding of benefit of improved sanitation. The advantages of community participation in organization or development planning: costs according to their financial capacity, income generation, self-help management.
Indigenous Peoples
Dominant ethnic in WWTP Area are Melayu Riau and Sunda Ethnic.
Poverty and Vulnerable Groups
Some of the urban poor lived by the waterways, in flood-prone areas, discharging wastewater directly into river; women-headed households were significant, some with no water connection; a small percentage exists with disability; Migrant workers were generally renting rooms with their low income. There are also vulnerable people such as the elderly, the sick, disabled and poor. These vulnerable get government subsidies for visits to public hospitals, water tariffs, etc. Socialized pricing of sewerage service recommended by women organizations
Affected Persons
The participants basically understood that their lands would be purchased by the municipal government of Kota Pekanbaru for the development of an off-site WWTP. However, most of them had lack of details what an off-site WWTP was. According to them if the said project brought about positive impacts to the health of local communities, they would fully support the program.
Issues and Concerns
Low-lying areas are flooded and could not connect to communal septic tanks; fear that high cost of WWTP and operations would translate to high cost for clients; Narrow access roads and lack of space for pipe connections; problems on garbage disposal (solid waste), clogged drainage, flooding (seasonal and chronic); poor people dispose waste everywhere (direct to river). Rents house near from WWTP area.
2. Analysis The overarching goal of MSMIP is improvement in the overall well-being of the city population within the Project area through sewerage connection. This is through improved water quality and decreased incidence of water-related diseases, especially among children. These help achieve Indonesia’s targets for urban sanitation in a manner that is inclusive and empowering. The Project stands to benefit target communities. Based on MP, the proposed investment shall provide access to sewerage service for 15,800 households and 1,470 commercial establishments. Benefits include improved sanitation service and improved hygiene, solid waste management and access to safe water through sanitation awareness campaign.

TA 7993 - INO: Metropolitan Sanitation Management Investment Project – MSMIP 268
Draft Final Report
Attainment of these goals, however, depends on whether intended beneficiaries connect to developed sewerage system and institute behavior change in other areas of environmental sanitation – e.g. disposal of garbage and other wastes into rivers. To do so, measures will be made to reach the poor and vulnerable groups and involve villages and organizations in discussing appropriate strategies to benefit slums and sanitation hot spots. Lack of awareness by men and especially women and satisfaction on existing sanitation services is seen as a constraint to achieving high rates of sewerage connection. Increased hygiene and sanitation information is perceived as a help which is consistent with the designation of hygiene and sanitation awareness as a component of the project. Joint sanitation awareness planning puts a focus on collective decision-making strategies and mobilizing authorities and stakeholders for sustained behavior change on hygiene and sanitation. It is designed to influence social acceptance for sewerage connection and behavior change on sanitation not only within the project site but the entire city as well. Affordability is perceived as a bar to participation if this means a high connection cost or monthly bill. The strategy is for free domestic connection and targeted subsidy for monthly fees for vulnerable groups including the poor, elderly and female-headed households. Further discussion among stakeholders is strategic to further consider people’s willingness to contribute to part of cost of connection consistent with recommendations to charge an affordable connection rate. There are sanitation hot spots along waterways and by the shore. Around the WWTP site there is need for sanitation improvement but this is not within the sewerage area. Universal free connection for domestic users and subsidies on monthly fees help low income households. Proposed interventions for onsite sanitation improvement as well as livelihood development assistance promotes social inclusion for the WWTP sites which are outside of coverage area for sewerage improvement. Proposed interventions for onsite sanitation improvement, as well as livelihood development assistance promote social inclusion for the WWTP site. Livelihood enhancement opportunities shall be further assessed during project implementation though employment data indicate that women are less likely to be employed. There are identified constraints to connection that need to be addressed including satisfaction with existing facilities and lack of awareness on hygiene and sanitation, affordability issues of those that are most in need of improved services, disturbance of land in tight city spaces and water supply since only 10% of the city is connected to PDAM. These constraints shall be discussed by village authorities and residents and designers during the sanitation audit and design and construction phases. Strategies to reach absentee homeowners will also need to be planned at connection phase since significant numbers are renters. Problem solving on connection issues shall be facilitated through participatory processes and collective decision making as proposed in Implementation Arrangement Plans for Gender and Social Development, Gender Action Plan, Stakeholder Communication Strategy and Community Participation Plan.

TA 7993 - INO: Metropolitan Sanitation Management Investment Project – MSMIP 269
Draft Final Report
A sanitation promotion strategy shall help ensure a higher connection rate rates as Indonesian experience shows that free connection, by itself, cannot assure participation. Constraints to connection need to be assessed with concerned villages and their organizations with a view to accommodating appropriate sanitation options given constraints on land, affordability, etc. for sanitation hot spots. Women, community organizations and institutional partners in Pekanbaru City agree that gender analysis and women participation in sanitation promotion can ensure maximum participation by women. A Gender Action Plan and gender inclusive capacity building and joint sanitation advocacy planning promotes active roles of stakeholders where the needs of both women and men are addressed and women’s organizations are enlisted for sanitation advocacy and for better social and economic outcomes. In addition, quotas for female recruitment and promotion (10% more by 2018) and training (50% female representation) and decision making, promote women empowerment at staff and community levels. Potential social risks are also managed such as the influx of migrant workers exacerbating sanitation and social and health concerns such as waterborne diseases through poor sanitation and sexually transmitted diseases due to workers camps. Pro-poor and inclusive measures are quotas for local workers (35%) with preferential hiring from low income communities with requirements for sanitation standards at workers camps. HIV/AIDS education will also be implemented by contractor and under the GAP. J. Social Safeguard Studies – Involuntary Resettlement A total of 134,544 m² (13.45 ha) of private lands shall be permanently acquired for the Subproject and shall affect 5,088 rubber trees, 109 palm oil trees, 48 banana trees and several other trees, totaling 6,122. Of the total 13.45 ha, 11,3148 m2, affecting 12 households, has already been acquired. Due Diligence for this acquisition concluded that the procedures according to the local laws and regulations were duly followed. Compensation for land was paid based on the rates determined by the professional appraiser. Compensation for affected 4,649 trees was paid as per the Mayor’s regulations. Land acquisition of additional 21,396 m2 will affect an 10 households. A total of 22 households, including 12 HH affected by acquisition of 11.45 ha, shall be affected with aggregate members of 97 persons, composed of 54 male and 33 female. Of the total members, 57 persons are working but their livelihoods do not depend on affected lands. Except for two households, all the other households live in the City’s outskirts in seven villages, kilometers away from the affected lands. 5 Households would be affected by more than 10% of their household incomes due to the loss of trees. The incomes of the affected households (AHs) are higher than the City’s established poverty threshold. None of the households are reported to have any handicapped members. Based on the vulnerability criteria, none of the AHs are vulnerable. None of them belong to indigenous peoples. However, the data gathered during the TA shall be updated during Subproject implementation. The Initial Public Consultation and Information Disclosure was held on 22 October 2012 in compliance with the Government Regulation and ADB’s 2009 SPS and Public Communication Policy (2 April 2012). Five types of stakeholders who have actively
TA 7993 - INO: Metropolitan Sanitation Management Investment Project – MSMIP 270
Draft Final Report
participated on that public meeting were identified. Further public consultation was carried out in February 2013. Public Information Booklets (PIB) and the procedures on grievance review mechanism, in Bahasa Indonesia, were distributed to the participants. The APs can also ask for assistance from ADB’s responsible Project Officer as the last resort in the resolution of their complaints, consistent with the provision of the Bank’s Accountability Mechanism (2012). Public consultation will be an ongoing activity under the Subproject, and this will include the communities covered by the WCS following the completion of the DED for the sewer lines. However, land acquisition will not be required since the WCS will be constructed on roadsides which are part of government properties being administered by the DGH. The LARP shall be implemented in eight months. The Subproject is Resettlement Category B that will affect 22 AHs with 97 persons. K. Environmental Safeguards Study An environmental assessment was made for the proposed Pekanbaru City’s Off-site Wastewater Collection System and Treatment. Based on the significance of its environmental impacts and risks, the Pekanbaru City subproject is deemed Environmental Category B in accordance with ADB’s environmental categorization and the type of assessment warranted only the preparation of an Initial Environmental Examination (IEE) report. The IEE was carried out under ADB’s TA 7993-INO and in accordance with ADB’s 2009 Safeguard Policy Statement (SPS) and Government of Indonesia (GOI) environment law, Environmental Protection and Management Law of 2009. A copy of the Pekanbaru City subproject’s final IEE is presented in Annex Document - G. An important consideration in analyzing the environmental impacts of the proposed Pekanbaru City subproject is the fact that its components are infrastructures for environmental improvement and for reducing the risk to public health from untreated sewage. The screening for potential environmental impacts and risks of the proposed Pekanbaru City subproject showed that there are no significant negative environmental impacts and risks that cannot be mitigated. With its Environmental Management Plan (EMP), the proposed Pekanbaru City subproject can be implemented in an environmentally acceptable manner. There is no need for further environmental assessment study. A full EIA is not warranted and the subproject’s environmental classification as Category B is deemed appropriate. An REA checklist was prepared to support the environmental categorization of this subproject. The IEE shall serve as the final environmental assessment document of the proposed Pekanbaru City’s sewerage system subproject. Implementation of the proposed Pekanbaru City’s subproject is recommended with emphasis on the following: (i) EMP of Pekanbaru City’s sewerage system subproject shall be included in the design process; (ii) IEE Report/EMP shall be forwarded to the design consultant for consideration in the design process; (iii) Tendering process shall advocate environmentally responsible procurement by ensuring the inclusion of EMP provisions in the bidding and construction contract documents; (iv) Contractor’s submittal of a contractor’s EMP (CEMP) shall be included in the construction contract; (v) Contract

TA 7993 - INO: Metropolitan Sanitation Management Investment Project – MSMIP 271
Draft Final Report
provisions on creation and operation of the ad-hoc City Sewerage Environmental Complaints Committee (CSECC) shall be included in construction contracts; (vi) Training of the WWTP operators on operation and maintenance of the WWTP shall be completed before actual operation; (vii) a WWTP advisor (consultant) shall be provided intermittently during the initial 3 months of operation to assist the operators in the start-up phase and also to correct any undesirable operating practices; (viii) Monitoring of health and safety requirements shall be given more importance during construction and operation to reduce risks to the public and to personnel; and (ix) Pekanbaru City government, its LPMU, and the Riau Province’s PPIU shall continue the process of public consultation and information disclosure during detailed design and construction phases. 1. Compliance to ADB’s SPS Requirements In compliance with ADB’s SPS (2009) and the requirements describe in its Appendix 1 (Safeguards Requirement 1: Environment), the final IEE for Pekanbaru City’s sewerage subproject contains sections of the following: (i) executive summary, (ii) introduction, (iii) policy, legal, and administrative framework, (iv) description of the environment, (v) anticipated environmental impacts and mitigation measures, (vi) information disclosure, consultation, and participation, (vii) grievance redress mechanism, (viii) environmental management plan, and (ix) conclusion and recommendations. Environmental Management Plan. The EMP section addresses the need for mitigation and management measures for Pekanbaru City’s subproject. Information includes: (i) mitigating measures to be implemented, (ii) required monitoring associated with the mitigating measures, and (iii) implementation arrangement. A tabulated mitigation plan presents the information on: (i) required measures for each environmental impact that requires mitigation, (ii) locations where the measures apply, (iii) associated cost, and (iv) responsibility for implementing the measures. Details of mitigating measures are discussed in the screening process for environmental impacts. A tabulated monitoring plan presents the information on: (i) aspects or parameter to be monitored, (ii) location where monitoring is applicable, (iii) means of monitoring, (iv) frequency of monitoring, (v) responsibility of compliance monitoring, and (vi) cost of monitoring. One of the pre-construction considerations discussed in the EMP is the need to include measures for climate change adaptation and mitigation. A hydrology and flooding study shall be conducted during the design phase for the proposed Pekanbaru City’s WWTP to ensure that occurrence of flooding is properly evaluated. Results of the study shall be used for designing the proposed WWTP and the preparation of engineering specifications to ensure that it is less vulnerable to extreme flood events. Climate change mitigation is by connecting the WWTP’s membrane covered anaerobic ponds to a flare to avoid releasing the generated methane. However, during detailed design, potential use of the generated methane shall be evaluated with due considerations to financial and economic factors. EMP Cost. The IEE points to the need of ensuring funds for EMP implementation. The suggested approach is to allocate funds for EMP implementation by requiring that the tender documents of Pekanbaru City’s sewerage subproject shall include a lump sum bid item in the bill of quantities to be titled “Environmental Mitigation Measures”. Furthermore, it shall be clarified in the specification documents that the environmental

TA 7993 - INO: Metropolitan Sanitation Management Investment Project – MSMIP 272
Draft Final Report
mitigating measures identified in the construction EMP are to be charged to this item. This will allow the construction supervision engineer of Pekanbaru City’s sewerage subproject to require the contractors to quickly address the environmental issues during construction. For budgetary purposes, this EMP fund of the proposed Pekanbaru City’s sewerage system is estimated at 1% of the total direct cost of the WWTP and the sewer lines. Relative to this, the CPMU and the Riau Province’s PPIU shall ensure that this provision for “Environmental Mitigation Measures” is included in the bidding documents and civil works contracts. Institutional Setup. Similar to the 4 other MSMIP subprojects, there is a need to ensure that the environmental aspects of the proposed Pekanbaru City’s sewerage system is effectively addressed through a well-defined institutional setup. The roles of the various GOI units and consultants for the environmental aspects are discussed in the sections for institutional aspects of the final IEE. The setup presents the proposed PPIU of Riau Province as the key implementation unit responsible for construction contracts’ supervision of the Pekanbaru City subproject, while the Pekanbaru City’s LPMU coordinates the needed local inputs and resources. Capacity Building for WWTP Operators. The final IEE recognizes the fact that a newly constructed WWTP might discharge poor quality effluents due to operators that are not properly trained. One of the proactive ways to prevent this from happening is to provide capacity building for the operators of the new Pekanbaru City’s WWTP during pre-operation phase and continue during the initial few months of the operation phase. The proposed capacity building shall be divided into 2 parts and shall be facilitated by local consultants. The first part shall be a one month hands-on training on operating and maintaining a WWTP in a similarly operating WWTP in Indonesia. The second part shall be the actual operation of the new Pekanbaru City’s WWTP with inputs from a WWTP advisor for a 3-month period intermittently. This type of advisory services is very important since the new WWTP will be in the start-up phase and also to correct any undesirable operating practices of the newly hired operators. Estimated cost of the initial capacity building is US$7,600 while the cost of advisory services of the WWTP advisor for a 3-month period intermittently at the new WWTP is US$14,000. This capacity building for WWTP operators is also reflected in the overall capacity building plan for MSMIP. Grievance Redress Mechanism. The IEE presents a local grievance redress mechanism (GRM) for environmental complaints during the construction phase of the Pekanbaru City’s sewerage subproject. The GRM has three levels and calls for the creation of an ad-hoc City Sewerage Environmental Complaints Committee (CSECC). This shall be chaired by Pekanbaru City’s Chief of the LPMU. CSECC members shall include the: (i) contractor’s highest official at the site such as the Construction Manager or Construction Superintendent, (ii) village (Kelurahan) Chief or his representative, and (iii) a women organization’s representative. The draft GRM was presented to stakeholders during the initial public consultation meeting. Public Consultation and Information Disclosure. Last 22 October 2012, Pekanbaru City’s BAPPEDA conducted an initial public consultation and formally discussed the proposed sewerage subproject with the stakeholders and requested their views. A total of 26 stakeholders and representatives participated. Issues that stakeholders raised include

TA 7993 - INO: Metropolitan Sanitation Management Investment Project – MSMIP 273
Draft Final Report
odor from the WWTP operation, WWTP impact to their wells, impact to Siak river water quality, and excavation materials along the road. This initial public consultation meeting is fully documented in the final Pekanbaru City subproject IEE. A summary of the issues raised during the initial public consultation in Pekanbaru City and how the project addressed them is presented in Table VII-K 1.
Table VII-K 1: Summary of Issues Raised and Project’s Response during Public Consultation
Group Represented Issues/ Concerns Raised Project’s Response
Tanjung Rhu Village • Local residents are expecting this program to implement because their area is densely populated, it is difficult to build septic tanks
NGO, Forum Kota Sehat • Wastewater Treatment Plant (IPAL) or Septage Treatment Plan (IPLT?)? What is the difference of these two facilities?
• Of three alternative WWTP sites, which one would be selected? Why alternative 1 was selected?
• The customers would be charged for some fees. What will they receive for in return?
• The location had been selected in view of various considerations. Originally there were 3 alternative locations. Alternative 2 was crowded by inhabitants requiring enormous land acquisition. The alternative 3 was close to pond and local inhabitants had no houses. The existing land use would be more prioritized for Rusunawa (Rental Low Cost Apartment). The remaining choice was only alternative 1 in Kelurahan Rejosari, 20 ha, RT 02/RW 02, consisting of 20 ha land. This option was also suitable for further expansion of the plant in future.
• One purpose of this meeting is to know if there are objections from local residents to this program
• IPLT has different function from IPAL. The former is to treat sludge taken from septic tank. If the houses have septic tanks there must be IPLT facility to treat its wastewater. Meanwhile, IPAL is to treat water from toilet or known as black water and from bathing or washing or cooking known as grey water. This grey water is thus far directly disposed to drainage. It is not a hygienic practice. If IPAL is built, all domestic wastewater must be drained to this treatment facility.
Suma Hilang Village Will hazardous waste of hospitals be accommodated in the proposed WWTP?
Hospital wastes will not be accommodated by the proposed WWTP due to the nature of their wastes. Hospitals are required by law to have their own WWTP
Tanjung Rhu Village (near the Rejosari WWTP site
At present we use drilled well (20-30 m) for our clean water with some having depth of 60 m. What is the impact of the WWTP to our wells?
The WWTP will be impermeable and will not disturb the surrounding environment. There is also monitoring well to check the quality of well water closed to the plant.
Tanjung Rhu Village (near Many children play in the Do not worry about the unpleasant odor. If

TA 7993 - INO: Metropolitan Sanitation Management Investment Project – MSMIP 274
Draft Final Report
Group Represented Issues/ Concerns Raised Project’s Response
the Rejosari WWTP site surroundings of WWTP site. Will this plant generate unpleasant odor to the nearest houses?
properly operated a WWTP will not generate any odor. The odor will be similar to smell of paddy field. You can see by yourself in communal WWTP (Sanimas, etc). With good management these facilities produce no odor. Today, many WWTPs are built in city centers and residential zones as found in Bangkok, Malaysia, and Australia.
Community Leader closed to WWTP site, Tanjung Rhu Village
How is the distance of WWTP site to river Siak? Too close proximity will cause environmental destruction
The quality of river will not be disrupted. The water discharged to river will be first treated until complying with government standards.
Working Group AMPL • Is there any provincial representative invited in this consultation?
• Consultants can assist socialization, not only for FGD in 10 kelurahan/ villages only. The local persons must be prepared. Only few land owners attend this consultation.
There is Coordination with the provincial government and this is continuously being done.
There will be socialization. AMDAL will be prepared by IndII and also the DED.
NGO, Forum Kota Sehat • The local government needs to conduct public socialization about this planned WWTP. What kind of structures to be built? Will it consist of pipes only?
• Will the affected persons receive compensation if their fences or land affected by the program?
• Pipe or cable construction leaves excavation material along the road. What’s about the development of this wastewater pipes?
• In case of odor from WWTP operation, where will the resident make their complaints?
• Not only pipes, there will be other fixtures for these wastewater pipeline networks such as manhole, drop manhole placed at certain distance. They must be maintained after operation. Please don’t open manhole or discard any water into it. There is also flushing structure to prevent clogged pipes.
• There will be compensation for lands and plants affected by project
• During pipe construction, the method will be clean construction to prevent disruption to environment and the local residents and their daily activities. Cost for the construction of pipes with diameter > 300 mm will be charged to ADB. Clean construction is one requirement for ADB financing.
• As to complaint resolution, a proposed complaint resolution mechanism has been distributed. Your feedback is awaited. This mechanism concerns procedure of addressing complaints. Moreover, the local government has operated mechanism for the reporting of environmental complaints.

TA 7993 - INO: Metropolitan Sanitation Management Investment Project – MSMIP 275
Draft Final Report
Group Represented Issues/ Concerns Raised Project’s Response
Agricultural office • What can be used from this WWTP process? As fertilizer, for example.
• Can it be turned into biogas and how is the quality?
• Its treated water. It is just presented that the treated water may around 40000 m3/day. It is huge volume of water that can be used for watering the plants. In Jakarta, the groundwater is expensive, i.e. Rp. 18000 per m3. Some malls and industries treat their wastewater using membrane technology at cost Rp. 8000 – 10000 per m3 for flushing purpose, watering the plants and cooling water.
• Another product of WWTP treatment is sludge that can be used as compost. However further research is necessary to ensure its safety.
• Wastewater treatment with anaerobic process will produce biogas. This product is normally used for internal operation of the plant or burned it. As for its sludge treatment, WWTP in Indonesia normally uses sludge drying bed system.
Official Leader of Sub-district Sukajadi
• Personally support the project.
• Socialization to each Kecamatan is necessary
• In 2012 socialization has been made to SKPD, especially in WWTP development and pipeline networks
• Public consultation will be made directly to the communities.
National Land Office Is WWTP site consistent with
Spatial Planning? There is discussion and coordination with Spatial Planning Agency. The WWTP location has been included in RTRW Kota Pekanbaru.
2. Compliance to GOI’s Environmental Requirements The final Pekanbaru City subproject IEE presents GOI’s regulatory requirements regarding the AMDAL system (EIA system) and discharge permit for WWTPs. Under AMDAL regulation, a proposed WWTP for domestic wastewater that will require an area of more than 3 hectares or will serve a population of more than 100,000 shall be required to prepare an AMDAL report. The Pekanbaru City’s subproject will require an area of 8.0 hectares for its WWTP, more than the 3-hectare criterion. It will therefore be required to prepare an AMDAL. Preparation of the AMDAL will be done by the detailed design consultants during the detailed design phase as agreed by ADB and GOI. AMDAL preparation will be funded by the GOI and shall be completed prior to any bidding/procurement process. A permit to discharge will also be required for the proposed Pekanbaru City WWTP under the city’s regulation for WWTPs. Information on the process for discharge permit application is presented in the final IEE’s appendices.
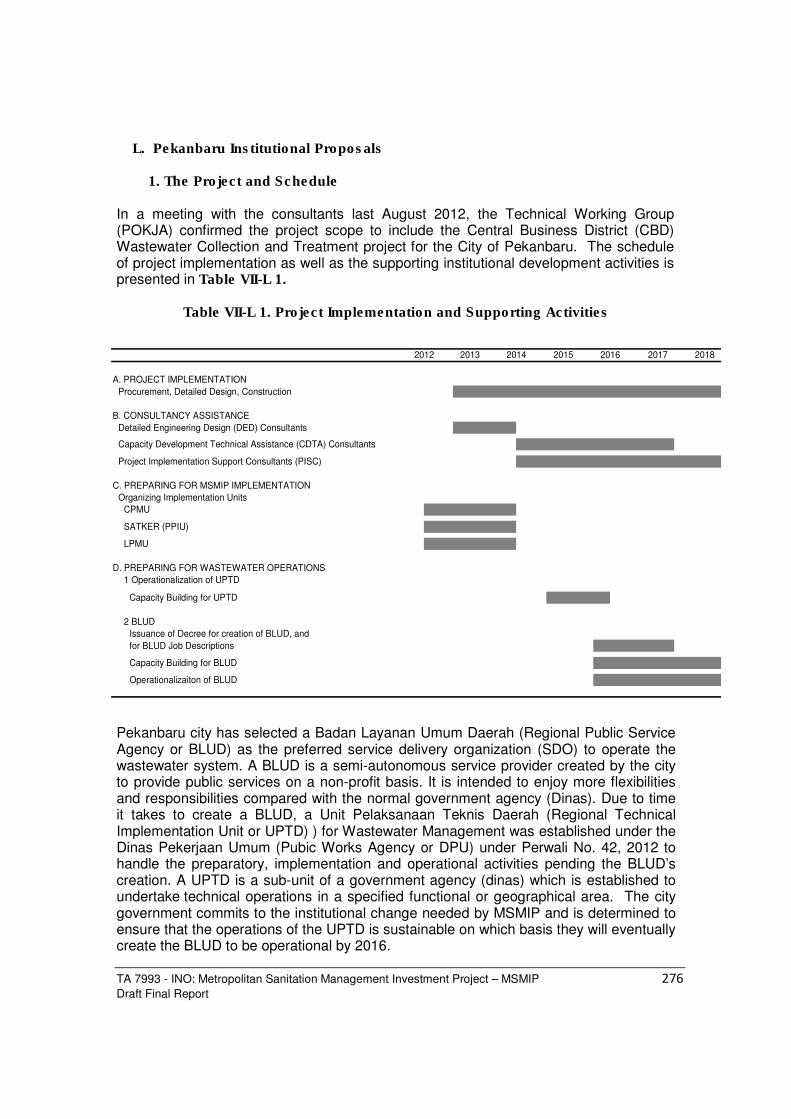
TA 7993 - INO: Metropolitan Sanitation Management Investment Project – MSMIP 276
Draft Final Report
L. Pekanbaru Institutional Proposals 1. The Project and Schedule In a meeting with the consultants last August 2012, the Technical Working Group (POKJA) confirmed the project scope to include the Central Business District (CBD) Wastewater Collection and Treatment project for the City of Pekanbaru. The schedule of project implementation as well as the supporting institutional development activities is presented in Table VII-L 1.
Table VII-L 1. Project Implementation and Supporting Activities
A. PROJECT IMPLEMENTATION
Procurement, Detailed Design, Construction
B. CONSULTANCY ASSISTANCE
Detailed Engineering Design (DED) Consultants
Capacity Development Technical Assistance (CDTA) Consultants
Project Implementation Support Consultants (PISC)
C. PREPARING FOR MSMIP IMPLEMENTATION
Organizing Implementation Units
CPMU
SATKER (PPIU)
LPMU
D. PREPARING FOR WASTEWATER OPERATIONS
1 Operationalization of UPTD
Capacity Building for UPTD
2 BLUD
Issuance of Decree for creation of BLUD, and
for BLUD Job Descriptions
Capacity Building for BLUD
Operationalizaiton of BLUD
2017 20182012 2013 2014 2015 2016
Pekanbaru city has selected a Badan Layanan Umum Daerah (Regional Public Service Agency or BLUD) as the preferred service delivery organization (SDO) to operate the wastewater system. A BLUD is a semi-autonomous service provider created by the city to provide public services on a non-profit basis. It is intended to enjoy more flexibilities and responsibilities compared with the normal government agency (Dinas). Due to time it takes to create a BLUD, a Unit Pelaksanaan Teknis Daerah (Regional Technical Implementation Unit or UPTD) ) for Wastewater Management was established under the Dinas Pekerjaan Umum (Pubic Works Agency or DPU) under Perwali No. 42, 2012 to handle the preparatory, implementation and operational activities pending the BLUD’s creation. A UPTD is a sub-unit of a government agency (dinas) which is established to undertake technical operations in a specified functional or geographical area. The city government commits to the institutional change needed by MSMIP and is determined to ensure that the operations of the UPTD is sustainable on which basis they will eventually create the BLUD to be operational by 2016.

TA 7993 - INO: Metropolitan Sanitation Management Investment Project – MSMIP 277
Draft Final Report
The UPTD is expected to operate from 2013 – 2015. The election of the UPTD chairman is already underway in order to accelerate its operation. Next steps include appointment of UPTD personnel, transfer of assets of the Sanitation Department (IPLT) to the city Department of Public Works and the preparation and submission of operating UPTD budgets for 2013. The main task of the UPTD for Pekanbaru is to manage technical activities focusing on wastewater services. Prior to completion of the wastewater system, the UPTD will focus its attention on the management of the communal WWTP as well as the operational problems of the septage treatment facility (IPLT). a. Proposed Institutional Arrangements for Project Implementation i. Implementation Arrangements The Ministry of Public Works, Directorate General for Human Settlements (DGHS) is the Executing Agency for the MSMIP. DGHS will establish a central project management unit (CPMU) composed of technical and administrative staff from Directorate of Environmental and Sanitation Development (DESD). The CPMU will likely be headed by a Senior Officer of the DESD At the regional level, two units will work jointly to manage and implement the project: the SATKER as the Provincial Project Implementation Unit (PPIU) and the city Local Project Management Unit (LPMU). Under this arrangement, DGHS plays an active role in providing technical supervision and responsibility over the investment (the Satuan Kerja or SATKER model). The PPIU or the SATKER comprises full time staff detailed from DGHS to the provinces to implement specific projects of DGHS. The projects in the four cities above will be implemented through the SATKER in their respective provinces. Based on the above arrangements, the Pekanbaru subproject will be implemented through the SATKER Riau Province acting as the PPIU or the implementing agency for the MSMIP. While the SATKER is the key implementation unit in the field, substantial involvement of the city government is needed. For this reason, a local project management unit (LPMU) will be created in the city to assist in subproject implementation. The LPMU is essentially a city level technical office that is either created or assigned to an existing attached agency depending on the service requirement. The LPMU will be included in relevant training to provide them with capacity to gradually absorb project more planning, implementation and monitoring responsibilities in the future. The city plans that the DPU becomes the LPMU for the MSMIP. It will coordinate closely with the POKJA and the UPTD. This way, the UPTD also becomes involved in the project in the early stages and develops a sense of ownership over the project.

TA 7993 - INO: Metropolitan Sanitation Management Investment Project – MSMIP 278
Draft Final Report
See Figure VII-L 1 for the implementation arrangements.
Figure VII-L 1. Implementation Arrangements
DGHS
(Executing Agency)
Central Steering
Commitee
Central Project
Management Unit
(CPMU)
Central Project
Implementation Unit (CPIU)
/ Satker Pusat
Central Support team
(CST) a
Provincial Project
Management Unit
(PPMU)
Provincial Project
Implementation Unit
(PPIU) / Satker Provinsi
Provincial Support team
(PST) a
Local Support team
(LST) a
Local Project Management
Unit
(LPMU)
Local Project
Implementation Unit
(LPIU) / SKPD
Dinas Provinsi b
Implementing Agency
Provincial Steering
Committee (CWSG, various
Dinas Provinsi )
Dinas Kota c
(Implementing Agency ABPD-
Kota)
City Sanitation Working
Group
(CSWG)
(chair: DGHS)
(chair: BAPPEDA-Prov.)
(chair: deputy mayor)
National Level
Provincial Level
City Level
Consultant Support
a Support teams consist of consultants for: (i) project implementation support,
and (ii) institutional development and capacity buildingb
Provincial Governmentc City Government
Supervision, guidance
reporting

TA 7993 - INO: Metropolitan Sanitation Management Investment Project – MSMIP 279
Draft Final Report
Institutional arrangements include mechanisms for environmental management and resettlement. See Annex Document H.11. b. Proposed Institutional Arrangements for Operation The focus of the capacity building is on establishing an autonomous and accountable SDO for wastewater management. To do this, the city of Pekanbaru plans to operationalize the UPTD by 2013 as a preparatory step towards the creation of a BLUD. The priority activities comprise (i) organization and operationalization of the UPTD; (ii) creation of the BLUD; (iii) development of the Performance Contract and Public Service Obligation Contract and (iv) adoption of the SDO Structure, Initial Staffing Plan and Start Up Activities. i. Organization and Operationalization of the UPTD Pending the creation of the BLUD, a UPTD has been formed under Dinas PU to handle the preparatory activities. The proposed organization for the UPTD is shown in Figure VII-L 2.
Figure VII-L 2: Proposed Organization Chart of the UPTD
HEAD
Administrative Dept
Head, Functional Group Head, Functional GroupHead, Functional Group
The UPTD will consist of the head, the administrative department, and several functional groups. The Administrative Department will handle hiring and training of staff in coordination with the Administrative Division of the DKP. The number of functional groups, levels, and functional staff appointed by the Mayor will be based on the nature and volume of work load72. Each group is headed by a senior functional staff appointed by the Mayor as proposed by DPU. The head of the wastewater group will manage, coordinate, and integrate all wastewater activities of the city. Prior to completion of the MSMIP wastewater project, the UPTD Administrative Department, with assistance from the capacity development technical assistance
72 In Cimahi, the functional groups comprise centralized WWTP, Septage Treatment and Communal systems

TA 7993 - INO: Metropolitan Sanitation Management Investment Project – MSMIP 280
Draft Final Report
(CDTA) consultants, will start the hiring process and training of staff to allow it to handle technical, commercial, finance/administrative operations of the wastewater system. It is planned that collection of sewage fees will be done through non-governmental organizations acting as collecting agents. A a combined collection of water supply and sewerage fees is not practical as only about 10% of Pekanbaru residents are served by the PDAM. The proposed capacity development technical assistance (CDTA) for MSMIP provides for policy/ guideline and procedures manual preparation to cover operation and maintenance including commercial systems for wastewater systems. ii. Creation of the BLUD
It is expected that during the 3-year capacity building assistance, the consultants will be able to assist the city and the UPTD in achieving independent and sustainable wastewater operations and guide the city to eventually create the BLUD as planned. The city realizes that under the UPTD, wastewater operations cannot fully be autonomous and will continue to depend on city government budgets. The consultants will assist the city prepare draft legislation including the necessary PERDAs (or city regulations). Details of proposals on how the BLUD will be organized are provided in Annex H11. c. Institutional Development and Capacity Development Component The CDTA comprises two components, namely capacity building plan and assistance to Project Management. i. Capacity Building Plan Methodology and Approach The capacity building plan is directed at two (2) distinct levels – sector (or city) management level (through the Local Institutional Development Action Plan or LIDAP) and at the service delivery level (through the Financial and Operating Improvement Plan or FOPIP). The LIDAP includes interventions to be initiated and managed by the city government which influences the operating conditions of the Service Delivery Organization (SDO). The FOPIP, on the other hand, includes interventions which are to be initiated and managed by the SDO. See Figure VII-L 3 below.

TA 7993 - INO: Metropolitan Sanitation Management Investment Project – MSMIP 281
Draft Final Report
Figure VII-L 3. Capacity Development Plan Approach
1) policy formulation, sector
management
(2) management of service delivery
(human resources, pricing the service,
etc.)
(3) community involvement
(4) regulation of service provision.
FOPIP
CAPACITY DEVELOPMENT
Establish
ment of
Effective
Service
by SDO
LIDAPSector
Reform
The sector interventions to be provided by the capacity building component can be grouped into three types:
• Assistance in the preparation of policies, guidelines, and manuals; • Advisory services, technical assistance and progress monitoring; • Training and Workshops.
The CDTA includes a component to address the concerns of stakeholders that the expected number of connections to the sewer lines may take a long time to happen. One of the measures to address this is the preparation of a Social Marketing Plan for Sanitation which will incorporate the comprehensive "Model Micro-Marketing of New HC Centralized Wastewater" as developed and implemented by CDTA-MSMHP in Yogyakarta. ii. Project Management Assistance Project management assistance covers technical audit and benefit monitoring. Technical Audit. The consultancy services also aims to provide initial project management assistance during the 12 month period prior to mobilization of the PISC and during the 12 months of the PISC contract. This primarily covers assistance in the procurement activities.
Benefit Monitoring and Evaluation. Monitoring and evaluation of project benefits calls for the development and implementation of a Project Performance Monitoring System which covers the, conduct of a baseline study and setting up of all institutional requirements in order to be able monitor and evaluate the benefits of the project after its completion. d. Project Readiness of the Cities
The commitment of the city of Pekanbaru to the CSS and to the institutional support for the project were generally confirmed during the consultants’ visits. The Mayor’s Decrees

TA 7993 - INO: Metropolitan Sanitation Management Investment Project – MSMIP 282
Draft Final Report
for the creation and staffing/ functions of the UPTD has been issued and the budget for 2013 operations has been provided. The appointment of the Chairman is the next action to be done by the city. The city also realizes that social marketing/ promotion and issuance and enforcement of sanitation regulation are key to the success of the project and commits to this and other action plans in the LIDAP and FOPIP. In several discussions of the consultants with the city, they have committed to charge fees that will fully recover O&M cost (including depreciation). The preliminary amounts calculated in the feasibility studies prepared under INDII were used as basis of the discussions with local officials. Firmer commitments are expected from the cities on the final tariffs which will be determined at a later stage.

TA 7993 - INO: Metropolitan Sanitation Management Investment Project – MSMIP 283
Draft Final Report
VIII. Summary of Institutional Proposals for Operation A. Project Implementation
1. Implementation Schedule The main subproject in all 5 cities is the Central Business District Wastewater collection system and Wastewater Treatment Plant. In addition, Cimahi has the following subprojects:
• Septage Trucks, (23) and Motor Bike tankers, (11) • Rehabilitation of existing public facilities and construction of 104 new facilities • Rehabilitation of existing communal septic tanks in 5 Kelurahan (villages)
The typical schedule of project implementation as well as the supporting institutional development activities is presented in Table VIII-A 1. Specific schedules and other details for each city are shown in the city reports in Annex Document H7 to 11.
Table VIII-A 1. Project Implementation and Supporting Activities
2014 2017
A PROJECT IMPLEMENTATION
Procurement, Detailed Design, Construction,
B CONSULTANCY ASSISTANCE
Detailed Engineering Design (DED) Consultants
Capacity Development Technical Assistance (CDTA) Consultants
Project Implementation Support Consultants (PISC)
C PREPARING FOR MSMIP IMPLEMENTATION
Organizing Implementation Units
CPMU
SATKER (PPIU)
LPMU
D PREPARING FOR WASTEWATER OPERATIONS
1 UPTD
1 Operationalization of UPTD
Capacity Building for UPTD
2 BLUD
Capacity Building for BLUD
Operationalization of BLUD
Issuance of Decrees for creation of UPTD and for UPTD
Job Descriptions
2012 2013 2015 2016 2018
Issuance of Decree for creation of BLUD and for
BLUD Job Descriptions

TA 7993 - INO: Metropolitan Sanitation Management Investment Project – MSMIP 284
Draft Final Report
2. Selection of the SDO In the selection of the SDO under the WWMP Project, the various options were discussed with the POKJA/AMPL in all cities and evaluated in terms of their advantages and disadvantages. A Badan Layanan Umum Daerah (BLUD) organisation was strongly recommended as the SDO in 4 cities (Cimahi, Jambi, Makassar, and Pekanbaru) and was preferred over other organizational options such as the PDAM, Dinas (city agency), and UPDT (Unit Pelaksanaan Teknis Daerah or Regional Technical Implementation Unit). A BLUD is a semi-autonomous service provider created by the city to provide public services on a not-for-profit basis. It is intended to enjoy more flexibilities (and responsibilities) compared with the normal Dinas. For Palembang, an SDO under the PDAM is the preferred option. Locating the SDO within the PDAM has the main advantage of the PDAM’s management competence to handle utility operations and its commercial orientation. The technical capabilities may however have to be upgraded to meet the requirements for wastewater. The PDAM already has a billing system and a customer database which can also be used for sewerage billings. PDAM Palembang is considered financially healthy and has a 93% service area network coverage. High-level discussions have already been done regarding this proposal. Except in the case of Palembang where they are not necessary, UPTDs are currently in various stages of being formed under various Dinas to handle the preparatory activities pending the creation of the BLUD. A UPTD (Unit Pelaksanaan Teknis Daerah) is a Regional Technical Implementation Unit, a sub-unit of a dinas, established to undertake technical operations in a specified functional or geographical area. In the case of Palembang city, a department will be created under the PDAM to handle wastewater management. See Table VIII-A 2.
Table VIII-A 2.Status of UPTD Establishment
City Preferred SDO UPTD (Project Implementation Unit)
Status of Creation of UPTD
1. Cimahi BLUD UPTD under Dinas Kebersihan Pertamanan
• Mayor’s Decree is still in draft form to be issued in 2013.
2. Jambi BLUD UPTD under Dinas Kebersihan, Pertamanan, Pemakaman
• Mayor’s Decree in Jambi No.16/2009 was issued in 2009 creating a UPTD for the Septage Treatment Plant. The Mayor’s Decree needs to be amended to upgrade the existing coverage of the UPTD to include the future wastewater system
• UPTD for Septage Treatment Plant is now fully operational with existing budget
3. Makassar BLUD UPTD under Dinas
PU • Mayor’s Decree creating the UPTD was
published in 2012 (Perwali No. 20, 2012) • Job descriptions and job function (TUPOKSI)
were issued in 2012 (Perwali No. 23, 2012) • UPTD chairman election (July 26, 2012)

TA 7993 - INO: Metropolitan Sanitation Management Investment Project – MSMIP 285
Draft Final Report
• Budget provided for UPTD in 2013 • Full operation of UPTD planned in 2013
4. Palembang SDO under PDAM No need for UPTD. City will create a SDO un-der PDAM
• Mayor’s decree to create Wastewater Department under PDAM to be prepared when the project is final and confirmed in 2013.
5. Pekanbaru BLUD UPTD under Dinas
PU • Mayor’s Decree no.42 / 2012 issued in 2012
creating the UPTD • Chairman not yet appointed • Budget provided for operation in 2013 • Full operation of UPTD planned in 2013.
B. Proposed Institutional Arrangements for Operation The focus of the capacity building is on establishing an autonomous and accountable service delivery organisation (SDO) for wastewater management which, conceptually:
• Has clear and distinct role and responsibilities; • Maintains a distinct difference with the core administrative agencies; • Is largely self-financing; • Is disciplined and autonomous; • Is efficient and effective; • Listens to and responds to customer demands; and remains under the
effective control of higher authorities
Several action plans lead towards the attainment of the above objective and these are covered in the individual city reports and in the capacity development plan. The priority action steps are discussed in the succeeding sections and these depend on the type of SDO selected. The four cities of CImahi, Jambi, Makassar and Pekanbaru have selected the BLUD. The city of Palembang has decided to create a department under the PDAM. 1. SDO: BLUD for CImahi, Jambi, Makassar and Pekanbaru The above cities plan to create and operationalize the UPTD in early 2013 as a preparatory step towards the creation of a BLUD by 2016. The priority activities comprise (i) organization and operationalization of the UPTD, (ii) creation of the BLUD (iii) development of the Performance Contract and Public Service Obligation Contract and (iv) adoption of the SDO Structure, Initial Staffing Plan and Start Up Activities. Operation of the UPTD is further discussed below. Details and other priority activities are discussed in the city reports in Annex Document H.7 to H.11.

TA 7993 - INO: Metropolitan Sanitation Management Investment Project – MSMIP 286
Draft Final Report
a. Organization
A typical organizational structure of the UPTD is as shown in Figure VIII-B 1.
Figure VIII-B 1. Proposed Organization Chart of the UPTD
HEAD
Administrative Dept
Head, Functional Group Head, Functional GroupHead, Functional Group
The UPTDs will be under the DKP for Cimahi, under the DKPP for Jambi and under the DPU for Makassar, Palembang and Pekanbaru. b. Operation of the UPTD Typical operation of the UPTDs in 2013 will focus on maintaining communal systems, sludge treatment and preparation for the future management of the wastewater systems.
Hiring and Training. Prior to completion of the MSMIP wastewater project, the UPTD Administration, with assistance from the CDTA consultants will start the hiring process and training of staff. The initial number of staff to be hired upon operation of the wastewater system is estimated at around 15 including staff to perform the billing/collection and accounting/budgeting functions. Upon completion of the construction of the wastewater system, the UPTD functional groups will need to be ready to handle key operations as discussed in succeeding sections. Technical operations will involve 2 processes, sewage collection and sewage treatment. Sewage Collection involves operation and maintenance of pumping stations, mains and sewers, laterals and connection chambers, storm water drains (where they are part of the system), and property connections. This also includes sewer repairs and road reinstatement and clean up and compensation assessment in case of sewage flooding.
Sewage Treatment covers the operation (planned to be operated in two shifts) and maintenance of the Wastewater Treatment Plant.

TA 7993 - INO: Metropolitan Sanitation Management Investment Project – MSMIP 287
Draft Final Report
The commercial system includes subsystems related to consumer registration and marketing, billing and collection. A combined collection of water supply and wastewater fees has many advantages and is usually the preferred mode. This is the planned system for Palembang since the SDO will be under the PDAM. However collection of sewage fees through the PDAMs is not practical in the case of Cimahi and Pekanbaru, where a significant percentage of residents and potential customers of the wastewater systems are not served by the PDAM. For now, these cities plan to utilize the village heads (Cimahi) and NGOs (Pekanbaru) as collecting agents. In the case of Makassar, the PDAM is facing financial and operating difficulties making collection through the PDAM unacceptable to the city. The UPTD will do the collection of fees for Makassar. In addition to billing and collection, the commercial system also covers:
• Property connection approvals and records • Sewer record keeping (new developments) • Making connections to the PEMDA sewer system
A critical activity in the initial months of operation, is the promotion to get households and other potential customers connected to the sewer lines. A plan for Social Marketing of Sanitation will be developed under the CDTA incorporating the comprehensive "Model Micro-Marketing of New HC Centralized Wastewater" as developed and implemented by CDTA-MSMHP in Yogyakarta. This has proven to be successful in maximizing connection rates to the system. The system provides for identification of all properties along a proposed trunk or main line and doing a door-to-door promotion campaign to ensure that all possible households are informed and an assessment has been made whether they will connect or not. This face-to-face contact of all potential connectors has been found to be more effective in getting a more accurate assessment of the number of possible connectors. Community Activities. The UPTD will also handle community activities particularly those related to social marketing of sanitation to support maintaining existing on site facilities and collection of wastewater fees. Environmental Management and Monitoring. Details of the environmental management and monitoring systems are provided in the city reports. c. Creation of the BLUD It is expected that during the 3 ½ year capacity building assistance, the CDTA consultants will be able to assist the city and the UPTDs to eventually create the BLUD as planned. The city realizes that under the UPTD, wastewater operations cannot fully be autonomous and will continue to depend on city government budgets. The consultants will assist the city prepare legislation including the following PERDAs (or city regulations):73
73 Indonesia Infrastructure Initiative. Wastewater Investment Master Plan, Package III – Cimahi, Activity W005: Final Feasibility Study – Cimahi, Australia Indonesia Partnership, September 2011.

TA 7993 - INO: Metropolitan Sanitation Management Investment Project – MSMIP 288
Draft Final Report
• Establishing the BLUD organization, including key operating details • Authorizing fees to support wastewater operations • Authorizing the Performance Contract and Public Service Obligation Contract
between the City and the BLUD • Prescribing clearly wastewater quality which can be received by the public
sewerage system • Requiring the regular cleaning of domestic septic tanks • Providing for the security and protection of the new facilities • Restructuring the functions and responsibilities of existing institutions to
streamline the planning, implementation, and monitoring of environmental improvements
The operating, commercial and financial systems under the BLUD will be an expanded version of the UPTD systems. 2. SDO: Wastewater Department under PDAM for Palembang The priority activities to operationalize the Wastewater Dept. under the PDAM includes (i) preparation of legislation (ii) revision of the Performance Contract and Public Service Obligation Contract for sanitation and (iii) adoption of the Wastewater Dept Structure, Initial Staffing Plan and Start Up Activities. a. Legislation to create new Wastewater Department under PDAM
It is expected that during the 3-year capacity building assistance, the CDTA consultants will be able to assist the city and the PDAM in achieving independent and sustainable wastewater operations. They will also provide guidance to the city and PDAM to prepare necessary legislation including the PERDAs to create the new Wastewater Dept. b. Revision of the Performance Contract and Public Service Obligation Contract for sanitation There is currently an existing Performance Contract with the city government which clarifies the relationship between the PDAM and the government. Monitoring of performance based on the contract is also done by the Badan Pengawas (regulatory body). The contract delineates the authority and accountability relationship between the asset owner/policymaker and the operator. This contract is renewed every January 2. A revision of this contract needs to be done considering the PDAM’s additional responsibility for sanitation. Similarly, the PDAM’s existing Public Service Obligation Contract needs to be revised to include sanitation. c. Adoption of Wastewater Organization
Based on the functional requirements, the proposed structure for the Wastewater Department under the PDAM is shown in Figure VIII-B 2. It will be headed by a

TA 7993 - INO: Metropolitan Sanitation Management Investment Project – MSMIP 289
Draft Final Report
Technical Director II. The PDAM and the legal division of Setda Palembang attached to the Office of the City Mayor, will oversee the finalization of the organizational structure under PDAM Tirta Musi, and the appointment of the director for wastewater operations. There is an existing recruitment system in place to assist and monitor the selection of technical heads and staff. At present, there are approximately 500 permanent employees and 100 casual workers assisting in the everyday operations of the PDAM.
Figure VIII-B 2. Proposed Organization of the Wastewater Dept. Under the PDAM
Mayor
Supervisory Board
President
Director
Internal Supervisory
Unit
General
Director
Technical
Director I
Wastewater Dept.
Technical Director II
Sewage
Collection
Septic Tank
Cleaning
On Site
Sanitation
Sewage
Treatment
Installation
of Service
Connection
Minor
Extention
Works
Operation &
Mainte-
nance
Laboratory
Operation &
Mainte-
nance
Customer
Service
Execution
Planning
Marketing
Septage
Services

TA 7993 - INO: Metropolitan Sanitation Management Investment Project – MSMIP 290
Draft Final Report
C. Institutional Development and Capacity Development Component 1. Strategy and Scope
The capacity building approach used in the WWMP studies consists of a broad series of interventions at two levels –the sector level and the SDO level.
a. Sector Level reforms
While sector level reforms cover a broad range of functions including policy formulation and sector management, management of service delivery, human resources, pricing the service and community empowerment, it will focus to a large extent on regulation and the regulatory environment. Most of the cities have some sanitation regulation like a regulation on sludge removal. However, in all cases the regulations did not impose sanctions for non-compliance. Prior to completion of construction of the wastewater system, regulations including sanctions will need to be prepared for the Sewerage system including a regulation for household connection to sewer lines. A regulation is only effective if it is being enforced so the cities need to include the necessary mechanisms to monitor and enforce the regulation. In effect, the Dinas Offices will act as the regulator of the UPTDs. The Supervisory Board (Badan Pengawas) on the other hand, will be the regulator of the PDAM-based SDO. The PDAM will submit reports to the Mayor and the regulatory body will review these reports. It will monitor the performance of the Wastewater Department against the performance contract with the Mayor. The Supervisory Board will check the performance against the performance contracts and agreed performance indicators that will measure the success and capabilities of the UPTD/BLUD. Specific sector level action plans are covered in the Local Institutional Development Action Plans (LIDAP). b. SDO Level Reforms The focus of the capacity building is on establishing an autonomous and accountable service delivery organisation (SDO) for wastewater management which will conceptually have the following features:
• Has clear and distinct role and responsibilities, • Maintains a distinct difference with the core administrative agencies, • Is largely self-financing, • Is disciplined and autonomous, • Is efficient and effective, • Listens to and responds to customer demands, and • Remains under the effective control of higher authorities.
Specific SDO level action plans are covered in the Financial and Operating Performance Improvement Plan (FOPIP).

TA 7993 - INO: Metropolitan Sanitation Management Investment Project – MSMIP 291
Draft Final Report
c. The Local Institutional Development Action Plan (LIDAP) The Local Institutional Development Action Plan (LIDAP) includes key actions to be initiated and managed by the city government in order to reform the current environment for wastewater management and sanitation under which the SDO will be operating. The LIDAP consists of nine (9) components, as follows; (i) Establishing an effective SDO: (ii) Capacity building for project management and implementation; (iii) Raising demand for sanitation improvements; (iv) Training and human resource development (for sector management); (v) Improvement of sector governance; (vi) Streamlining the wastewater management & sanitation sector structure in the city; (vii) Improving access to capital financing and O&M budgets (viii) Introducing regulatory reform; and (ix) Promotion of appropriate private sector partnerships (PPPs) in investment, construction, operation and maintenance. d. Financial and Operating Performance Improvement Plan (FOPIP) At the Service Delivery Organization level, a Financial and Operating Performance Improvement Plan (FOPIP) has been/ is being prepared for the SDO to assist in organizing and strengthening the service delivery organization. It is proposed to have four (4) components: (i) Adoption of the SDO Structure and Initial Staffing Plan; (ii) Preparation of standards, systems and procedures for technical operations, operation and maintenance, including the septage management program; (iii) Establishment of Business Management Control and Information System; and (iv) Planning and Implementation of Human Resources Management and Development. 2. Capacity Development Technical Assistance (CDTA)
The CDTA comprises two components, namely capacity building plan and assistance to Project Management. a. Capacity Building Plan Methodology and Approach As proposed by the WWMP Reports under the INDII project, capacity building plan is directed at two (2) distinct levels – sector (or city) management level (through LIDAP) and at the service delivery level (through FOPIP). The LIDAP includes interventions to be initiated and managed by the city government which influences the operating conditions of the Service Delivery Organization (SDO). The FOPIP, on the other hand, includes interventions which are to be initiated and managed by the SDO. The sector interventions to be provided by the capacity building component can be grouped into three types: • Assistance in the preparation of policies, guidelines, and manuals • Advisory services, technical assistance and progress monitoring • Training and workshops. Social Marketing for Sanitation. The CDTA includes a component to address the concerns of stakeholders that the expected number of connections to the sewer lines may take a long time to happen. One of the measures to address this is the preparation of the Social Marketing for Sanitation Plan which will incorporate the "Model Micro-
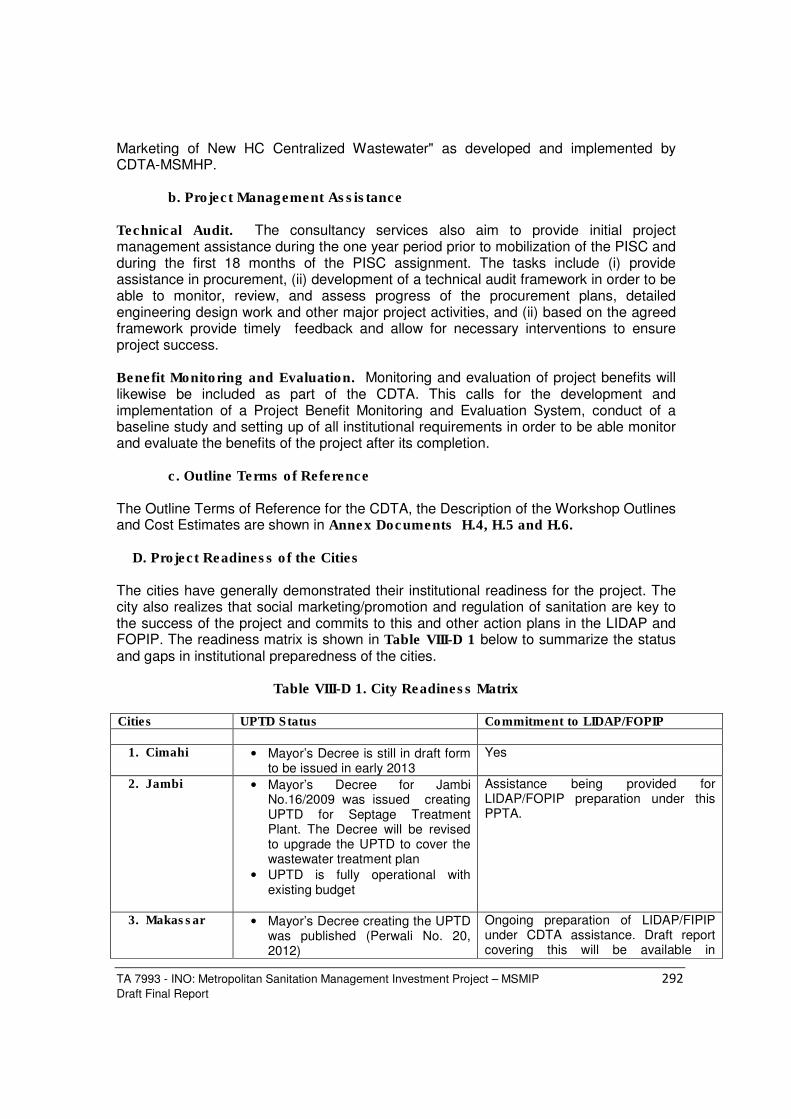
TA 7993 - INO: Metropolitan Sanitation Management Investment Project – MSMIP 292
Draft Final Report
Marketing of New HC Centralized Wastewater" as developed and implemented by CDTA-MSMHP. b. Project Management Assistance Technical Audit. The consultancy services also aim to provide initial project management assistance during the one year period prior to mobilization of the PISC and during the first 18 months of the PISC assignment. The tasks include (i) provide assistance in procurement, (ii) development of a technical audit framework in order to be able to monitor, review, and assess progress of the procurement plans, detailed engineering design work and other major project activities, and (ii) based on the agreed framework provide timely feedback and allow for necessary interventions to ensure project success. Benefit Monitoring and Evaluation. Monitoring and evaluation of project benefits will likewise be included as part of the CDTA. This calls for the development and implementation of a Project Benefit Monitoring and Evaluation System, conduct of a baseline study and setting up of all institutional requirements in order to be able monitor and evaluate the benefits of the project after its completion. c. Outline Terms of Reference The Outline Terms of Reference for the CDTA, the Description of the Workshop Outlines and Cost Estimates are shown in Annex Documents H.4, H.5 and H.6. D. Project Readiness of the Cities The cities have generally demonstrated their institutional readiness for the project. The city also realizes that social marketing/promotion and regulation of sanitation are key to the success of the project and commits to this and other action plans in the LIDAP and FOPIP. The readiness matrix is shown in Table VIII-D 1 below to summarize the status and gaps in institutional preparedness of the cities.
Table VIII-D 1. City Readiness Matrix
Cities UPTD Status Commitment to LIDAP/FOPIP
1. Cimahi • Mayor’s Decree is still in draft form to be issued in early 2013
Yes
2. Jambi • Mayor’s Decree for Jambi No.16/2009 was issued creating UPTD for Septage Treatment Plant. The Decree will be revised to upgrade the UPTD to cover the wastewater treatment plan
• UPTD is fully operational with existing budget
Assistance being provided for LIDAP/FOPIP preparation under this PPTA.
3. Makassar • Mayor’s Decree creating the UPTD was published (Perwali No. 20, 2012)
Ongoing preparation of LIDAP/FIPIP under CDTA assistance. Draft report covering this will be available in
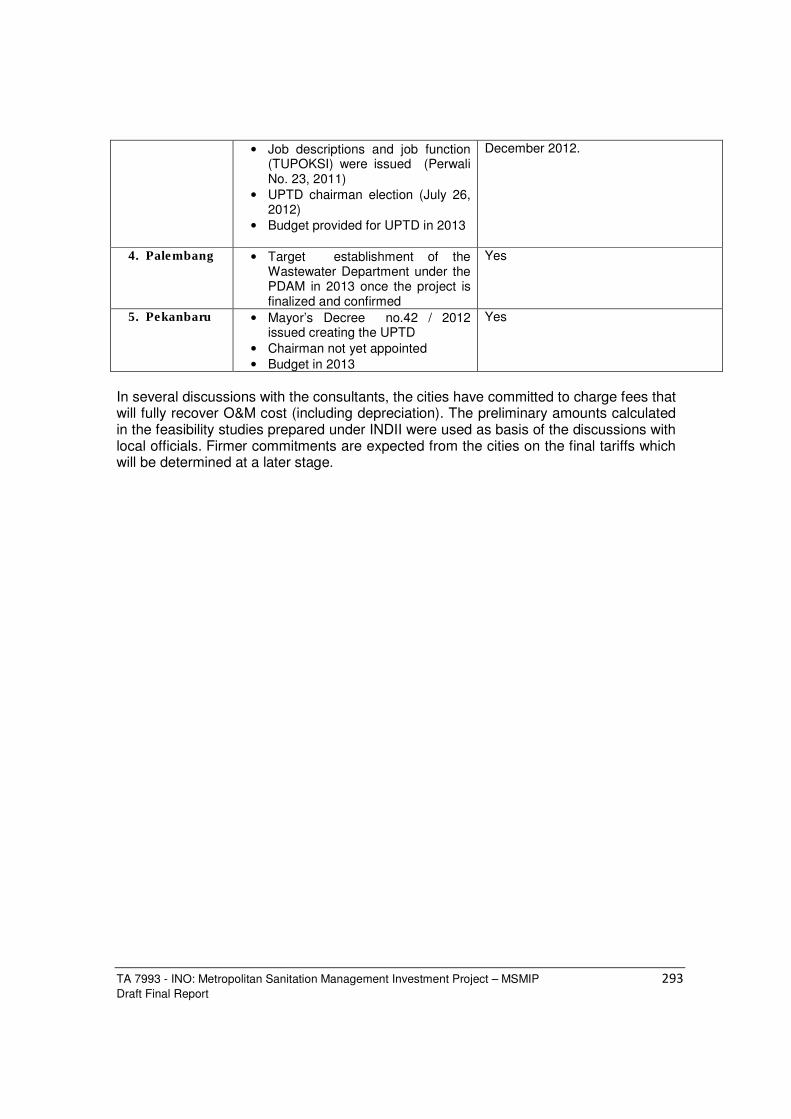
TA 7993 - INO: Metropolitan Sanitation Management Investment Project – MSMIP 293
Draft Final Report
• Job descriptions and job function (TUPOKSI) were issued (Perwali No. 23, 2011)
• UPTD chairman election (July 26, 2012)
• Budget provided for UPTD in 2013
December 2012.
4. Palembang • Target establishment of the Wastewater Department under the PDAM in 2013 once the project is finalized and confirmed
Yes
5. Pekanbaru • Mayor’s Decree no.42 / 2012 issued creating the UPTD
• Chairman not yet appointed • Budget in 2013
Yes
In several discussions with the consultants, the cities have committed to charge fees that will fully recover O&M cost (including depreciation). The preliminary amounts calculated in the feasibility studies prepared under INDII were used as basis of the discussions with local officials. Firmer commitments are expected from the cities on the final tariffs which will be determined at a later stage.

TA 7993 - INO: Metropolitan Sanitation Management Investment Project – MSMIP 294
Draft Final Report
IX. Sanitation Promotion and Public Awareness Campaign Plan Background Urban centers in Indonesia have been growing rapidly in the past decade as a result of rural migration. The inadequate water supply and sanitation systems in the cities have adversely affected the quality of life and health conditions of the people living in them, with water-borne diseases affecting the population especially children and the elderly. MSMIP is designed to improve sanitation and waste water conditions in 5 metropolitan cities to contribute to water and environmental sustainability and poverty reduction in urban areas. The objectives and scope of the project preparatory technical assistance (PPTA) are to (i) develop the Metropolitan Sanitation Management and Health Project II (MSMHP II) to a suitable level for consideration by the Asian Development Bank (ADB) for funding, (ii) confirm existing city sanitation strategies (CSS) and feasibility studies for up to eleven large cities, (iii) prepare implementation support and institutional development programs addressing sector reform,governance, and public awareness. Developments to be achieved by the Indonesian people are reaching a developed nation and independent, physically and spiritually prosperity. One characteristic of a developed nation is to have a high degree of health. This is because the level of health has a huge influence on the quality of human resources. Only with healthy resources will be more productive and improve the competitiveness of the nation. Realizing this, the Government of Indonesia has launched a new policy and strategy in a Health-Based Development Movement for National Strategy toward Healthy Indonesia 2015 on March 1, Edit 3 1999. This supports the MDGs for Water and Sanitation which prioritize improving sanitation in urban areas. The MDGs aims at halving by 2015 the proportion of people without sustainable access to safe drinking water and basic sanitation. During the Johannesburg World Summit on Sustainable Development of August 2002 the Government of Indonesia committed itself to the implementation of the MDGs and subsequently made realization of the MDGs integral part of national policies, goals and targets. On the Internet general information concerning the MDGs can be found. Annex Document I.3 provides some background information concerning MDG 7 and the related targets and indicators. In the context of national policies, improved sanitation aims at improving health, environmental and economic wellbeing of the urban and rural populations, especially the poor, trough targeted efforts to improve and sustain sanitation services delivery. The Program targets specifically improved sanitation within the boundaries of cities: urban sanitation. By this policy and strategy, planning and implementation of development in all sectors must be able to consider the negative and positive impacts on the health sector, both for individuals, families and communities. In the health sector, health efforts will prefer the preventive measures and proactive promotion, without ignoring curative and rehabilitative efforts.

TA 7993 - INO: Metropolitan Sanitation Management Investment Project – MSMIP 295
Draft Final Report
Basic health care in the construction of a new view is called the Healthy Paradigm. Health development aims to increase awareness, willingness and ability to live a healthy life for every citizen to achieve optimal healthy. Health status is one factor that greatly affects the quality of human resources. Healthy human resources will be more productive and improve the competitiveness of human. Although in urban areas most households do not have access to clean water and sanitation, because there are many slums and trading centers where housing becomes both as home and also as one place of business and not all homes are equipped with adequate sanitary facilities. Clean and healthy behavior have not entrenched in the community it's because a lack of understanding and awareness of the importance of hygiene and health behaviors (healthy life style). Society still puts priority on the development of clean water than to sanitation facilities and health programs. The construction of water supply without construction of sanitation facilities and health will be less impact on the health degree improvement. Communities pay less attention to the importance of activities for operations and maintenance facilities, as well as efforts to improve water quality and the environment. Lack of increase in clean and healthy lifestyle behaviors on the use of clean water and sanitation led to a lack of continuity and sustainability of clean water, sanitation and health. The Makassar city, South Sulawesi Province, as one of the MSMIP city had compiled Community Awareness/Public Health Campaign. Points were presented in the report for the campaign are very well and can provide extensive knowledge its association with health campaign activities conducted in the city. Community participation in sanitation, in particular waste water, is the involvement of communities in the sense of responsibility to participate actively or passively, as individuals, families, or groups, to achieve health for oneself and the environment. . Points that were made regarding to Promotion of Sanitation Health are the definition of community participation; Efforts to of community participation; Government efforts to encourage community participation; Community participation in the field of waste water; The problem faced in building community participation in the Community Awareness /Public Health Campaign; Efforts to grow and develop community participation in the field of waste water are presented in the report. Component Installation of Sewerage Systems and Wastewater Treatment Plants for example for Pekanbaru the sewerage works will comprise the construction of sewage interceptors to intercept dry weather flows from the combined drainage channels at strategic locations and construction of trunk sewers to convey flows from the drains to the centralised WWTP. Parts of the drainage system will be rehabilitated to accommodate the combined flows. Component Institutional Development and Capacity Building Capacity building interventions are proposed at two levels – at the sector level and at the SDO level.Key interventions are needed to promote sector reform towards the proposed institutional framework These interventions are consolidated in the Local Institutional Development Action Plan (LIDAP).Interventions to help in the start-up and strengthening of the proposed service delivery arrangements are contained in the Financial and Operational Performance Implementation Plan (FOPIP).A five-year technical assistance

TA 7993 - INO: Metropolitan Sanitation Management Investment Project – MSMIP 296
Draft Final Report
project is proposed to provide the needed technical support in implementing the LIDAP and FOPIP Component Public Participation and Sanitation Community Awareness Programs This Component will also address the low community awareness on the importance of sanitation management and a lack of information dissemination and education on the importance of domestic wastewater management. Through the conduct of community awareness programs, the awareness and understanding of the community on the provision and management of wastewater services will be increased. A. Waste Water and Sanitation Conditions in Indonesia and in MSMIP Cities 1. Overview for Waste Water and Sanitation in Indonesia According to the 2007 World Development Report, just over half of the Indonesian population lives below the poverty line of $2 per day. The Indonesian government has reported that, in urban areas, only 13% of the population is poor, but this is based on a threshold of just $0.60 per day. While at least half of Indonesia’s 245 (2011) million population lives in urban areas,only 1% of the population is served by sewerage, and less than ten cities have a substantial sewerage network. This level of coverage is among the lowest in Asia. In the absence of public investments,most of the infrastructure and services in place have been provided by households and small operators. The use of waterborne toilets is well established in towns and roughly three quarters of urban households have a toilet. However, local government oversight and regulation is weak and very few households dispose of wastewater safely. Many toilets are connected to soak pits known as cubluk, or to septic tanks that are poorly constructed, rarely emptied, and allow untreated or partially treated wastewater to seep into ground water (which is high in many locations) or into open drains and watercourses. Other households have toilets that discharge directly into drains and water courses via a waste pipe, or are simple ‘overhung’ latrines whereby a simple screen or shelter is erected inside which people defecate directly into the water. Septic tank emptying businesses are common, but many of them dump sludge directly into rivers without treatment.( Urban sanitation in Indonesia Planning for Progress-WSP) The enormity of the statistic presents an opportunity for considerable economic mobilization, on the one hand,but a larger, more ominous concern, on the other. Economic losses due to water pollution and poor wastewater management have been estimated at USD 4.7 billion per annum – roughly 2% of the national GDP. Further, it has been estimated that poor sanitation and hygiene causes at least 120 million disease episodes and 50,000 premature deaths annually. This proves worrisome for an economy that relies heavily on labor/manpower, natural resources and distinct urban commerce across its many island groups. Although water service delivery has improved over the past 15 years, standards in sanitation provision and quality remain below other developing countries in the region. Research depicts that the Indonesian government spent US$222 billion on water supply between 1992-2002, compared to $200 million spent on city collection and treatment

TA 7993 - INO: Metropolitan Sanitation Management Investment Project – MSMIP 297
Draft Final Report
over the last 20 years. Estimates of the World Bank moreover convey that about 47% of the country still does not have access to basic sanitation. Alternatively, many toilets discharge into a cubluk – an unsealed tank or soakpit referred to locally as a tangki septik. Under such circumstances, local government oversight and subsector regulation needs improvement as very few households dispose of wastewater in the manner considerate to both society and the environment. The decentralization of sanitation-based functions more importantly allows the Indonesian Government to respond to a variety of sector concerns and goals in a more dynamic, if not inclusive, manner. Under the National Action Plan on Sanitation, the government through a decentralized effort wields the instruments for achieving the national sanitation goal of 75% aggregate access to improved sanitation. This also resonates well with the stated goals of the UN-led Millennium Development Program, and is in accordance with the Government’s Roadmap to Acceleration of Urban Sanitation Development 2010-2014 that aspires to attain open defecation-free regencies (kabupaten) and towns (kota) by 2015.(Urban sanitation in Indonesia Planning for Progress-WSP). 2. Waste Water and Sanitation Situation in MSMIP Sites As the table below illustrates the existing ownership MSMIP toilets in 5 cities. mentioned type of ownership, type of toilet, conditions and separate reservoirs (disposal) in the percentages in this table are also presented for the cost in toilet construction cost in depletion, the price range of local land for the project, as follows: Table IX-A 1: Waste Water and Sanitation Situation in MSMIP Sites
PART 2: SUBPROJECT PERCEPTIONS AND ISSUES
Cimahi Makassar Palembang Pekan Baru Jambi
Sanitation Condition
a. Ownership of Toilet
- Privat Toilet 95,30% 88,90% 80,90% 93,46% 94%
- Communal Toilet - - 15,76% 4,69% -
- Public Toilet 3,60% 11,10% 2,34% 0,23% 2,70%
- Others 2% - 0,09% 1,62% 3,30%
b. Type of Toilet
- Gooseneck 7% 85,60% - 93% -
- Without
Gooseneck 91% 9,90% - - -
- Flush Toilets - - 88,15% 7% -
- Cubluk - 3,60% 3,99% - -
- Plengsengan - - 7,23% - -
- Others - 0,90% - - -

TA 7993 - INO: Metropolitan Sanitation Management Investment Project – MSMIP 298
Draft Final Report
c. Septic Tank
Condition
- House Hold Have Septic Tank
- - - 69%
- Have Pit Latrines - - - 7% 4%
- Practice open defecation on land
- - - - 15%
- Defecate directly in rivers
- - - - 12%
- Infiltration Tank - - - 93% -
- Without Infiltration Tank
- - - 29% -
d. Disposal System
- With Septic Tank 15% 87,86% 88,15% - -
- Without Septic Tank 72% 12,14% - -
- Ponds/ Rice Field - - 1,04% - -
- Rivers - - 4,30% - -
- Pits - - 6,25% - -
Cost of (Standar size) Septictank construction
Complete (bio filter) septic tank amount of Rp. 8 million/unit, plain septictank Rp. 4 million/unit
Complete (good) septic tank amount of Rp. 5 million/unit
Complete (good) septic tank amount of Rp. 5 million/unit
Complete (good) septic tank amount of Rp. 4 million/unit
Complete (good) septic tank amount of Rp. 3 million/unit
Cost of desludging service in the area (if service exists)
No sludge removal services in Cimahi. When Cimahi people need, the request from Bandung city with price around of Rp. 300,000 - 500,000/service
Amount of Rp. 250,000/septic tank
Rp. 200,000/trip by private operator (capacity 3 m3) and Rp. 175,000/trip by DKP (capacity 3 m3)
Amount of Rp. 220,000 - Rp. 270,000/septic tank
Rp. 175,000/trip by Dinas Kebersihan (capacity 1 m3)

TA 7993 - INO: Metropolitan Sanitation Management Investment Project – MSMIP 299
Draft Final Report
Land Value Land for the project area amount of 2.5 billion rupiah ; 1 Ha in 2011. Increase 20 - 30%/year
Land acquisition for the project area amount of Rp 370,000 rupiah/m2 for land is a former fish ponds. Land for the project area amount of Rp. 5 million/m2. Increase 30%/year
Land for the project area amount of Rp.1,000,000 rupiah/m2. Increase 30%/year
Land for the project area amount of Rp 80,000 rupiah/m2. Increase 20%/year
Land for the project area amount of Rp.3,000,000 - 5,000,000m2. Increase 10 - 15%/year
Minimum Wage (Rp/month) - 2010
1.107.304
1.011.000
927.825
1.016.000
900.000
3. Public Awareness and Institutional Arrangements on Sanitation Management in MSMIP Sites The table below illustrates the Sanitation Working Group 5 cities MSMIP either on similarities, differences in strengths and weaknesses in general, related to sanitation activities that have been enshrined in the city's sanitation strategy (CSSs) that they interchange and a reference implementation of the city's sanitation improvements contained in RPJMD and funded from the budget of the City. Activity awareness or public awareness of hygiene and sanitation is an important activity in the CSS. For more details can be seen in Table IX-A 2: Sanitation Working Group, Status and On-going Public Awareness Campaign. (A full description of MSMIP each city can be seen in Annex Document I. 1)

TA 7993 - INO: Metropolitan Sanitation Management Investment Project – MSMIP 300
Draft Final Report
Table IX-A 2 : Sanitation Working Group, Status and On-going Public Awareness Campaigns
Sanitation Working Group
Similarities (Kesamaan) Differences (Perbedaan) Strengths (Kekuatan) Weakness or Challenges
(Kendala)
1) Formed to improved sanitation urban scale,
1. Establishment and approval is not the same city sanitation task force between the city and the other one
a) Sanitation Working Group is a need for the city and will be the benchmark of urban sanitation policy
2. Hierarchical membership agreed by the working group by each city SKPD (vary from one city to another),
a. Mutation the city staff level would disrupt working group performance.
b. Weak performance will make the absorption of low sanitation fund
2) Membership government agencies related to sanitation and town stakeholders,
3) Develop City Sanitation Strategy (SSK), 3. Priority urban sanitation problems are
not the same,
b) Working Group endorsed by mayor decree with a flexible management structure.
c) Operation for working group to be fund by local funds ( APBD)
4. The process contained in RPJMD CSS takes a different,
d) Sanitation activities contained in RPJMD supported by local funding,
c. Delayed loading of CSSs in year plan would disrupt the schedule of sanitation, 4) Preparation of SSCs based on a white
paper that has been previously developed cities,
5) Sign the Medium Term Plan (Plan) City,
5. The amount of the budget for the operations and activities of the city level sanitation
e) For the possible activities of hygiene and sanitation working group to innovate to obtain funds from third parties (CSR, donors and others)
d. Coordination working group disrupted as replacement management, and mutation
6) Operation Working Group is budgeted in the city budget,
6. Community care policy in health and sanitation
7) Activity in the CSS (SSK) funding. Budget, sought from other sources,,
7. Target public awareness campaigns on health and sanitation based on city priorities
f) Execution activities remain to be implemented by each municipal departement city level, although there are blueprints for the sanitation working group level.
8) Duration of the activities of the Development Plan for the CSS duration 5 years
8. System zoning (zoning) for a public awareness campaign to the priorities of each city,,
g) Given the flexibility for the development of public awareness media campaigns, so the media will be developed on target and provide the maximum benefit for the city's sanitation development..
9) level, city sanitation policy blueprint for WG did not happen again overlapping repairs, construction of sanitation level decision-making and implementation.
9. Developing the media - media campaigns based on target specifications and the uniqueness of each region.
e. Public awareness campaign was not well planned because it is based on the output is not a process
f. Lack of innovation working group, the activities will be stagnant, public awareness campaigns require ongoing development, good training and a media campaign.

TA 7993 - INO: Metropolitan Sanitation Management Investment Project – MSMIP 301
Draft Final Report
4. Communication Challenges and Opportunities
a. Challenges i. Perceptions - Low awareness on the linkages between disease and hygiene
and sanitation ii. Low willingness to connect – also due to lack of information on sewerage
systems iii. There are sections of population with low affordability. These are in sanitation
hot spots iv. Negative Perception of the Project: The Project is classified as category B for
environment, category B for involuntary resettlement and category C for indigenous peoples. Accordingly, the safeguards challenges are not expected to be great, but care must be taken to avoid any negative perceptions especially in relation to the construction of WTTP. In certain cities, the facility is close to populated zones.
v. Information Dissemination on the Project: There will be the need for basic information on the project that the public can access, in order to provide a clear picture of the project’s involvement, and also of the broader government approach to sanitation improvement. The project needs communication tools for disseminating information to stakeholders including the public, project affected people, development partners, NGOs/CSOs government agencies and the media.
vi. Media Role in Sanitation Improvement and Perception of the Project: vii. Communication Assessment (with affected people including those with low
literacy): Ways of communication with affected people/communities need to be identified in order to provide information and facilitate two-way communication with them about project benefits and impact. The ways that they receive and process information (e.g. traditional forms of information dissemination, new media or social interaction etc) will need to be taken into account. The strategy will also include support to consultation and participation components of the project.
viii. Spokesperson(s): PPTA and role of EA and implementing agency b. Opportunities
i. The Communications Plan will provide opportunities to address the above challenges by: • On-going activities • Establishing and maintaining channels of communication with
stakeholders including media, government counterpart, development partners, affected households, NGOs/CSOs and the public;
• Communicating the project’s benefits vis-à-vis costs of poor septage management
• Building trust, support and participation of the project with affected communities and other stakeholders; and
• Establishing joint sanitation promotion plan to address sanitation issues and challenges by promoting opportunities for joint action with community organization, village governments, other sanitation programs and concerned agencies (Sanitation Working Groups

TA 7993 - INO: Metropolitan Sanitation Management Investment Project – MSMIP 302
Draft Final Report
• Communicating the cost of sewerage development and maintenance, thus the need for cost sharing by service beneficiaries.
• There are active village/city sanitation organizations.
No City Name of Organization Activity 1 Cimahi Forum Kota Sehat Environment
Organization 2 Perkumpulan Keluarga
Berencana Propinsi Jawa Barat
Health and Family Planning Organization
3 Pekanbaru LSM Koalisi Indonesia Bersih(KIB)
Environment Organization
4 Solidaritas Rakyat Peduli Lingkungan (SERULING)
Environment Organization
5 Lembaga Pemberdayaan Masyarakat Miskin Riau (LPMMR)
Social Organization for Poor Community
6 LSM Masyarakat Peduli Lingkungan Hidup(LSM MPLH )
Environment Organization
7 Yayasan Utama Health Organization 8 Palembang Wahana Lingkungan Hidup
(Walhi) Kota Palembang Health Organization
9 Wahana Bumi Hijau Health Organization 10 Jambi Berantas Labor and Sanitation
Organization 11 Gita Buana Environment
Organization 12
• Communicating the project’s benefits.
1) People have a perception posive project objectives regarding sanitation.
2) The project is acceptable to all parties, especially the project beneficiaries
3) Supported by both the existing community around the project site as well as the center of business project targeted
4) Accelerate the development that is both physical and non-physical 5) People can be invited to contribute to the sustainability of the project
• Building trust, support and participation of the project with affected
communities and other stakeholders – consultative process; early disclosure of project information and impacts
• Exploring avenues for cooperation on sanitation among stakeholders • Switch opinions and new information within the community to maintain
the continuity of the project • intake of new information from the stakeholder community level with the city, so the insights people who enjoy growing project • Easily create a new commitment, a new deal for the sustainability of the project development process • The public will be concerned in supporting the smooth and safety

TA 7993 - INO: Metropolitan Sanitation Management Investment Project – MSMIP 303
Draft Final Report
projects • Obstacles emerging community level easily controlled and well resolved • Development of the users and beneficiaries are easy to do • Easy to formulate rules of rewards and punishments the needs of the community in order to maintain the sustainability of the project
The Role of Sanitation Pokja (Sanitation Working Groups) The working group as meant in point FIRST is responsible for the following main task:
1. Facilitate on the public awareness and support from all stakeholders in the city level in accelerating the drinking water development and environmental health of City;
2. Perform the public awareness and stakeholder commitment to support in implementing the program activities and water program activities and environmental health;
3. Drafting the white book of City Sanitation and Strategy; 4. Coordinate with related institutions of Cimahi city, other stakeholders, and
provincial working group, Project Management Unit (PMU), and Project Implementation Unit (PIU) in establishing the drinking water and environmental health plan city drinking water and environmental health development.
5. Observations to assess the physical condition of the field directly, district and village visits for discussion and analysis.
6. Tasked to prepare a development strategy of urban sanitation in an effort to improve the planning and construction of sanitation in order to achieve the attainment targets city sanitation services
7. Preparing sanitation action plan, information on sanitation activities (project digest), prioritization and zoning (zoning priority setting and sanitation), and other tasks in order to improve the city's sanitation
8. Prepare strategies, plans, programs and schedules of activities in preparation for the construction of centralized wastewater management system in the city,
9. Improve coordination with all agencies, government / provincial / local governments, businesses, educational institutions and community development activities related to the implementation of wastewater management systems,
10. Implement control implementation working group activities, and 11. Prepare report on implementation of preparations for the construction of
waste water management systems.
Developing and implementing public awareness campaign (example in 5 cities )
1. Technical Guidance for Public Places, especially in tourist areas, hotels, restaurants, worship facilities, as well as in schools, terminals, markets and health facilities.

TA 7993 - INO: Metropolitan Sanitation Management Investment Project – MSMIP 304
Draft Final Report
2. Program of Health Campaigns/Promotion (PHBS) have been carried out by Public Health Office with PHBS indicators include Behavior indicators and Environmental Indicators
3. Optimizing the family latrine ownership stimulus program for poor households
4. Optimizes operation and maintenance of communal latrines through community organizing group
5. Conducting socialization, counseling and supervision and guidance about Clean and Healthy Behaviors (PHBs) in 20 villages with the lowest percentage of CTPS study by EHRA Palembang.
6. Increased community participation in the management of wastewater infrastructure and encourage community-based waste management.
7. Through institutional RT / RW( household ) can be made to improve the knowledge and awareness in the field of sanitation, for example, by raising issues of sanitation and environmental health in residents meetings, and conducting community service activities of environmental hygiene.
8. Training of effective communication strategies for health promotion officers, sanitation workers centers, Posyandu cadres.
9. Sanitation campaign through various media various media to motivate people in the management of domestic waste water.
B. Media Role in Sanitation Improvement and Perception of the Project The key media chosen is TV, supported by radio, local newspapers and printed materials (posters, flyers, sanitation options catalogue for men’s community meetings (Musrenbang). Women will be reached through their own meetings and groups. From FGDs sanitation and personal hygiene in Jambi we learned that bad environmental conditions are seen as an important area for community action. Role of media can be give the good improvment and perception for WWTP componentsThe Sanitation Awareness Plan. The communication strategy is aimed at raising awareness on sanitation problems in the project area to increase demand for the sewerage project and strengthening the collaboration between the government, ADB and other development partners. Communications plan also improves outcomes through a proactive communication approach and open communication channels that support stakeholder engagement. The strategy will support MSMIP in shaping public opinion in readiness for the project; enhancing information dissemination on sanitation and regarding the project activities and sustaining positive engagement with stakeholders. Implementation of the communication strategy will be closely coordinated with the executing and implementing agencies. 1. Objective
The objective of the communications plan is to significantly increase awareness and understanding of the city sanitation challenges and the role of stakeholders in addressing these. The Project supports capacity building and collaboration of stakeholders in addressing sanitation issues through infrastructure development and public awareness for behavior change.

TA 7993 - INO: Metropolitan Sanitation Management Investment Project – MSMIP 305
Draft Final Report
Indicators are increased support for the project through willingness to connect, thus increased number of connections. Another indicator is collaboration among stakeholders on sanitation promotion, etc. The public awareness campaign focuses on community awareness on the project including
• the benefits and importance of connecting to sewage line • the roles and responsibilities of the households, sanitation organizations,
local governments, SDOs, PDAMs and City Sanitation Pokja • the need to share the capital cost of sewerage system and WWTP • the linkage between the desired level of services, cost contribution and
operations and maintenance expenditure and sanitation tariffs • the need to pay back borrowed funds • women’s representation in the decision-making process • land acquisition and resettlement issues. The public awareness campaign
will lead to developing a Sanitation Public Awareness and Community Action Plans
• Health and hygiene education will include � Women’s role in sanitation socialization � School hygiene education � Community education � Focused training including solid waste management, latrine
construction, training of community health volunteers and women socialization agents.
2. Target Audiences
MSMIP will focus on the following target audience: (i) Affected communities/people; The affected people directly suffering the effects of the process to the project, so the approach taken to provide understanding and benefits to them and the general public. (ii) Government counterparts/Executing Agencies; As the implementer of the project or government partners to provide support in the implementation. With campaign done to them accelerated public awareness will be more motivated, manifest and obtain support. (iii) Local government units Provide an understanding of the existing units that conducted the campaign is not only related to sanitation, but also other units, so that the benefits of these campaigns will they communicate in a chance meeting with the communityiv) Development Partners; Campaign done more to get traction in the expanding public awareness campaign, including support in the procurement of media campaign, including providing color on their policies in the public awareness efforts. (v) The Media Campaign to the media, something that is very strategic means to directly touch the media are expected to help with innovation in this awareness campaign pack, easy to understand and hit the community(vi) CSOs and advocacy NGOs; and So that the programs and activities they do also exist packaging for the public awareness campaign (vii) Private Sector.

TA 7993 - INO: Metropolitan Sanitation Management Investment Project – MSMIP 306
Draft Final Report
This sector has business activities that are directly related to the community, so that they are always in the business development efforts in public awareness of hygiene and sanitation, C. Target Audiences for Public Awareness The Project has for primary target audiences the communities and business establishments in and around the identified sanitation and waste water areas which can further be segmented into specific audiences for particular messages – communities near waterways (waste water facilities), residences and businesses with inadequate sanitation facilities, etc. Other targets for communication on the project are potential advocates and partners in community education and public awareness on waste water and sanitation – e.g. mosque and village leader, national leaders who can serve as champion for needed reforms, religious leaders, the media, Chamber of Commerce for the business sector, and so on. The effect of upstream waste disposal practices on waste water and sanitation requires that villages in all area are targets for community education and mobilization on solid waste management including sanitation and wastewater management. In general, publicity on the WWT Project and its activities is hoped to raise general awareness and support for sanitation and waste management throughout five MSMIP cities and surrounding villages and urban areas. Target groups are defined by: 1) The definition of target groups are individuals or groups that would be given
counseling and guidance; 2) Target Groups are prioritized to do counseling in the field of waste water; 3) The communities who less responsive to environmental health problems; 4) The communities who still own and understand the customs, historical relics
those are less supportive of efforts to control environmental pollution; 5) The communities who still wrong in the practice of cooperativeness in the environment; 6) Community groups who not yet covered by a wastewater management of
centralized systems (expected to be served by communal systems); 7) The housewife and member of housewife organization (PKK); 8) Household Service Workers/servant/maid; 9) The community group who are targeted of development services activities of
offsite WWTP in the city scale; 10) The community group who were targeted of development services activities of
offsite WWTP in the city will be built; 11) Teachers and elementary school children which are the early age group
(elementary school students). (See Annex Document I2 : MSMIP Stakeholder Communication Strategy )

TA 7993 - INO: Metropolitan Sanitation Management Investment Project – MSMIP 307
Draft Final Report
Timeline Public awareness campaign will be carried out throughout project life. The five-year project will have four phases: a) Planning for social marketing of sanitation b) Initial advocacy and social marketing at construction phase c) Capacity development, demonstration projects and mid-term evaluation d) Scaling-up throughout the five cities & final evaluation (3 years) See Annex Document I3 Workplan for Public Awareness Campaign Strategy Formulation 1. Problem Analysis Some of the key problems nationwide in the sanitation sector include (i) lack of revenue to cover maintenance costs; (ii) institutional overlap of agencies involved in sanitation; (iii) lack of strategic sanitation planning; (iv) lack of interest of private sector investors; (v) poor condition of existing wastewater treatment plants; (vi) shortage of sludge tankers and septage treatment facilities; (vii) lack of qualified manpower; (viii) pollution of water sources resulting from inadequate sanitation; and (ix) low community awareness and public participation of sanitation. Participation comes from the word contains the meaning active participation, namely the activity. Other definition is the willingness to help the success of any programs according to everyone's ability without sacrificing self-interest. Definition of community participation in sanitation, in particular waste water, is the involvement of communities in the sense of responsibility to participate actively or passively, as individuals, families, or groups, to achieve health for oneself and the environment. The Wastewater Investment Master Plan (2011-2030) identified the priority areas for wastewater and sanitation development throughout the city and identified the priority areas for the development of off-site sewerage systems while the remaining areas would continue to be services by improved on site sanitation systems. For Instance two separate sewerage schemes in Palembang are proposed: the Ilir Wastewater Scheme draining the area to the north of the River Musi; and the Ulu Wastewater Scheme draining the area to the south of the river. Indicated is a need not only to improve infrastructure but to change prevailing practices that affect drainage and sanitation, as well as to strengthen policy enforcement and the role of communities in wastewater drainage maintenance. The Project will benefit all economic classes in the targeted area including the poor and disadvantaged. Female headed households, especially the lower income ones, will benefit from Project improvements as long as Project implementers remain sensitive to their existence. The Project will have a positive impact on women in general as well as children, whose health will be improved, and who will come to expect a new, higher level standard in sanitation. The Project will provide employment opportunities in the city, some of which will go to the poor.

TA 7993 - INO: Metropolitan Sanitation Management Investment Project – MSMIP 308
Draft Final Report
Figure IX-C 1
Problem Analysis:
Flooding and Poor Water
Back flow due to
reclamation and
re-channeling of
stream
Immigration Solid waste and
waste water
disposal
High rainfall Lack of awareness on
connection of hygiene
and sanitation
Blocked
drains
High run off due
to upstream
deforestation
Lack of
sanitation
facilities
Building over
drains
Building
Regulation
not enforced
Perception that
it is agency job
to clean up
Narrow outlet
Perceived high cost of
improvement
Reclamation
No rules
enforced or
construction of
driveways
Lack of
awareness of
good design
Siltation
from
upstream
No
monitoring
Lack of training
on hygiene
sanitation
Transient
population
No security of
tenure in
church &
government
lands
Garbage
dumps in
mangrove
Plastic / bottles
in water
Waste water
disposal into
streams
By industry
No
segregation
of waste
No rules
and
Monitoring
By
household
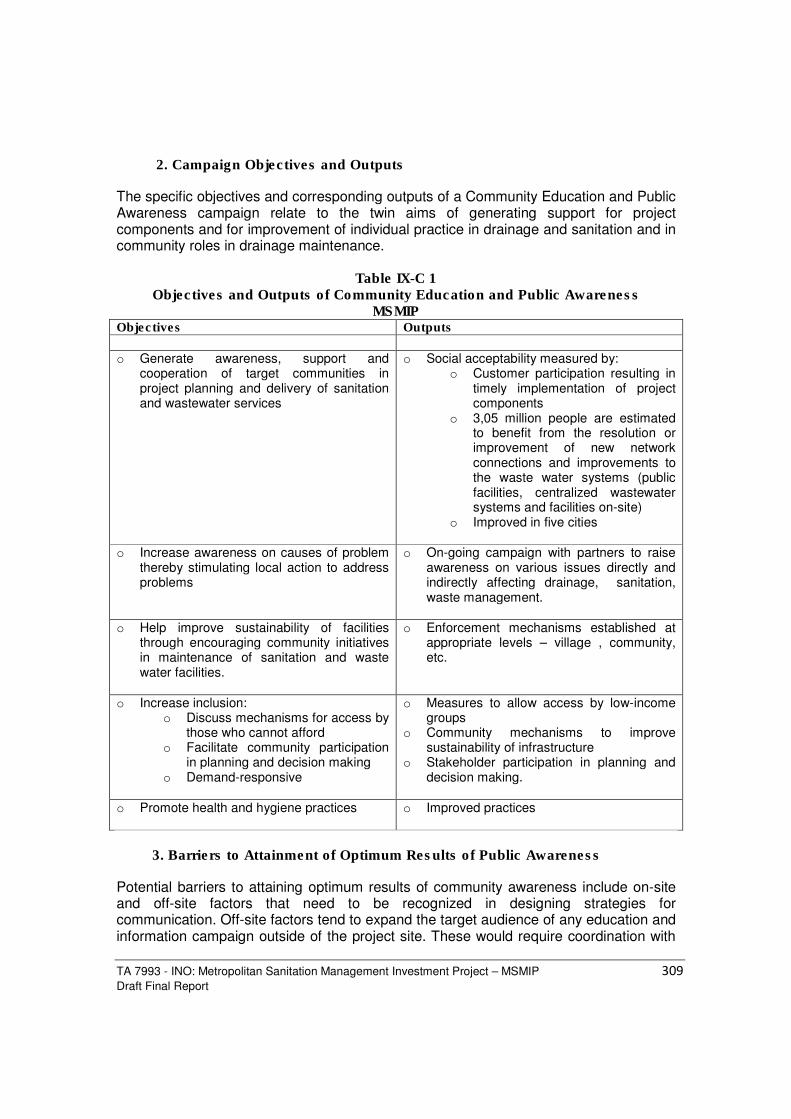
TA 7993 - INO: Metropolitan Sanitation Management Investment Project – MSMIP 309
Draft Final Report
2. Campaign Objectives and Outputs
The specific objectives and corresponding outputs of a Community Education and Public Awareness campaign relate to the twin aims of generating support for project components and for improvement of individual practice in drainage and sanitation and in community roles in drainage maintenance.
Table IX-C 1 Objectives and Outputs of Community Education and Public Awareness
MSMIP Objectives Outputs o Generate awareness, support and
cooperation of target communities in project planning and delivery of sanitation and wastewater services
o Social acceptability measured by: o Customer participation resulting in
timely implementation of project components
o 3,05 million people are estimated to benefit from the resolution or improvement of new network connections and improvements to the waste water systems (public facilities, centralized wastewater systems and facilities on-site)
o Improved in five cities
o Increase awareness on causes of problem thereby stimulating local action to address problems
o On-going campaign with partners to raise awareness on various issues directly and indirectly affecting drainage, sanitation, waste management.
o Help improve sustainability of facilities
through encouraging community initiatives in maintenance of sanitation and waste water facilities.
o Enforcement mechanisms established at appropriate levels – village , community, etc.
o Increase inclusion: o Discuss mechanisms for access by
those who cannot afford o Facilitate community participation
in planning and decision making o Demand-responsive
o Measures to allow access by low-income groups
o Community mechanisms to improve sustainability of infrastructure
o Stakeholder participation in planning and decision making.
o Promote health and hygiene practices o Improved practices
3. Barriers to Attainment of Optimum Results of Public Awareness
Potential barriers to attaining optimum results of community awareness include on-site and off-site factors that need to be recognized in designing strategies for communication. Off-site factors tend to expand the target audience of any education and information campaign outside of the project site. These would require coordination with

TA 7993 - INO: Metropolitan Sanitation Management Investment Project – MSMIP 310
Draft Final Report
other agencies with programs and education campaigns over specific aspects of the problem in/upstream of the project site. Moreover, implementing guidelines to certain policies still need to be developed or enforced. Where possible, the role of the community – business establishments and households, in sanitation and drainage maintenance and enforcement of rules needs to be strengthened but under conditions where traditional structures of governance are not in place. D. Framework for Community Education and Public Awareness The component has both short and long-term objectives to generate participation and support for the Project and to help improve sanitation and drainage practices and ensure sustainability of infrastructure. Figures IX-D 1 and IX-D 2 show that WWTP Project and raising public awareness needs other interventions. The longer-term objective of ensuring sustainability of wastewater and sanitation infrastructure and practices is the result of a mix of factors. Greater success can be expected where an enabling environment is created in cooperation with other programs and agencies addressing related concerns – such as on upstream waste disposal issues, and land management concerns and the like - in support of solid and wastewater management and drainage maintenance. WWTP Project can collaborate with these agencies in raising community awareness on problems and proposed solutions.

TA 7993 - INO: Metropolitan Sanitation Management Investment Project – MSMIP 311
Draft Final Report
Figure IX-D 1 FRAMEWORK FOR COMMUNITY EDUCATION AND PUBLIC AWARENESS
Waste Water Treatment Plan Project
Capability
Building
Community Education and
Public Awareness
WWTP Infrastructure
Improvement support
Desirable action on drainage and
sanitation
Community consultation
and planning
Proper Solid waste
disposal
Increased community role in drainage
maintenance
Improved wastewater disposal
Connection to
sewerage and on
site sanitation
systems
Cooperation in
drainage
improvement
Sustainability of
infrastructure
Enforcement
� Rules
� Monitoring
� Mechanisms for
Elements of Sustainability
Continuing education and
public awareness
Hygiene and sanitation,
recycling, mangrove
management, environmental
policies, building code, etc.
Incentives
Appropriate technology
Programs to address
contributing factors and
upstream waste disposal
WWTP
Sustainability of
waste management
practices

TA 7993 - INO: Metropolitan Sanitation Management Investment Project – MSMIP 312
Draft Final Report
E. Principles in Implementing Community Education and Public Awareness Strategy The Project is the first part of a long-term program and covers a limited project area in the flat lands of five cities MSMIP. Figure 4 shows that the problems of drainage and sanitation interrelate with local health, economy and environment. WWTP’s infrastructure and community education components address only a part of the problem. The green and yellow boxes indicate areas of intervention that are within the mandate of other programs and agencies. Thus, towards sustainable results, WWTP’s Community Education and Public Awareness Plan shall be guided by the following principles: 1. Partnership and Collaborative Framework
There are mechanisms in place for levels of coordination on water, waste management, sanitation. The project shall work with existing programs and strengthen working networks and methodologies to promote appropriate practices and technologies on drainage, sanitation and waste management. The component shall facilitate conduct of information and community education activities on special issues in the project site by other agencies – e.g. land management, BLH ( Environment Office ) policies on wastewater management as these are developed, building code, etc. It would also coordinate with other agencies on community education and public awareness campaigns on waste management for villages in the project site. It shall engage the urban area, urban and other stakeholders as partners and managers in drainage, sanitation and waste management. 2. Integration of Project Components in Public Awareness Campaign in
Target Communities
The project has distinct target areas for its various components. On the other hand, public awareness on sanitation, and waste water management shall be promoted in a comprehensive way in all villages and urban area of the project site. 3. Promotion of Sanitation, Waste Management and Waterways Maintenance
as Function of Community and Local Governance
Village/ kalurahan structures, the basic units of community management are suited to assume increased responsibilities in the maintenance of improved infrastructure. In addition, existing roles in sanitation shall be reinforced through community awareness and facilitation of waste water management community sanitation assessment, planning and monitoring. Government Efforts in Promoting Community Participation Attempts to establish society orderliness (discipline) is the duty of the Local Government (Law No. 5 Year 1974). In order to realize the creation and role of the community in preserving the environment, the Government issued a local regulation (law) which contains the obligation of every citizen in protecting the environment to keep it properly maintained.

TA 7993 - INO: Metropolitan Sanitation Management Investment Project – MSMIP 313
Draft Final Report
Community participation needs to be asked, because the people have great potential in any community development. Society is indeed a double-paced aspect, other than as recipients and perpetrators of all kinds of decisions; the community also serves as the ultimate target of a variety of instructions and rules among the various policies. There are four functions of community existence in the environment development:
• The community is seen as a source of information to the government, especially in relation to the impacts and consequences arising from the actions planned by the government. Information is very important as an input in the decision-makers.
• Communities will tend to show their willingness to accept and adjust to the decision taken, but community should also obtain a good opportunity to participate in decision-making process and are not faced with a must. One thing that is important is public participation in decision-making process will greatly reduce the possibility of conflict if the participation is not implemented at the right moment and effective.
• If a decision is taken with respect to some suggestions from the community, then later on will not show up to complicate matters the government (as decision makers).
• Another function of the communities’ existence is in relation with the democracy of decision makers. Although the community has been represented in the House of Representatives, but by no means rule out other forms of democracy.
In the implementation of community development and sanitation campaigns in the field of waste water should be done in integrated inter-related agencies covering various aspects:
1) Aspects of the region. Preferably in the same unit area . 2) Aspects of the material. Should be done with the material that covers the process
of understanding, awareness and fulfillment. 3) Aspects of the time. Preferably in the same single entity time. 4) Cooperation between the concerned organizations is realized in an integrated
program. Hence there will be synergistic in achieving outcomes and objectives. 4. Facilitation of Local Action
Public awareness by itself does not change behavior. Community education is reinforced with facilitation for action thereby taking public awareness to the next step of community mobilization. The strategy shall involve more than mass media public awareness campaigns to mobilize participation and willingness to pay for improvements. It entails that decision makers and participants are adequately consulted, informed, and mobilized.
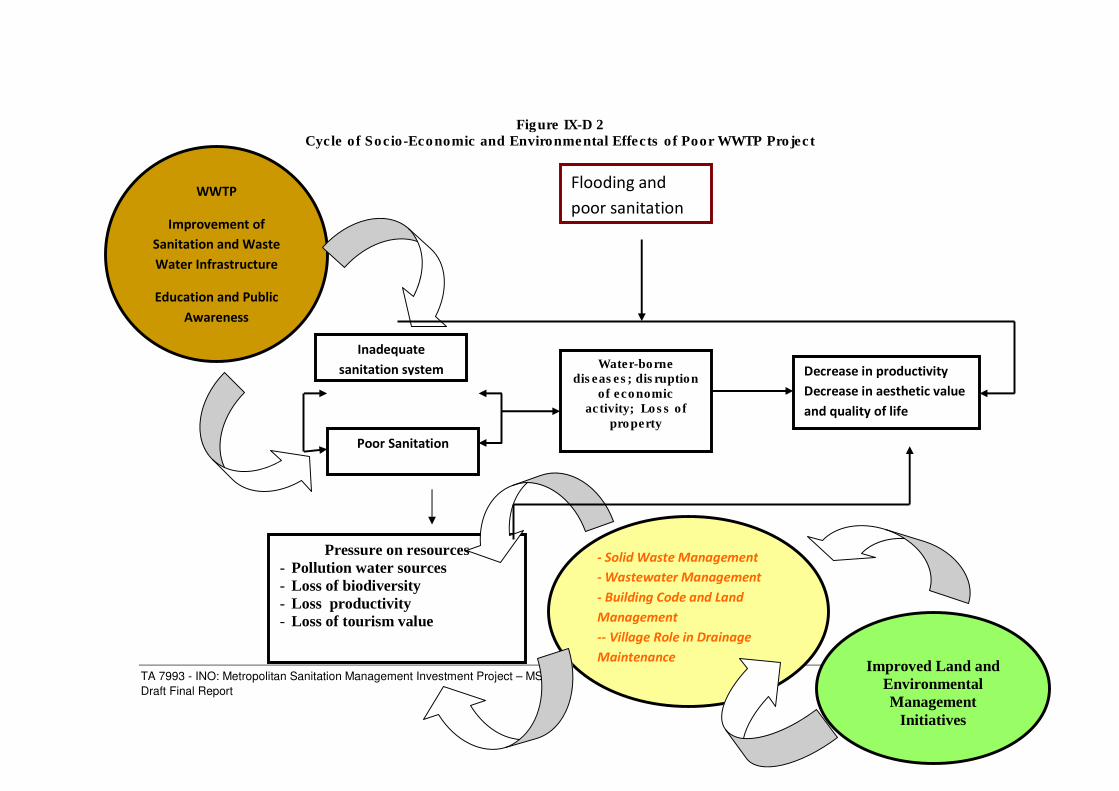
TA 7993 - INO: Metropolitan Sanitation Management Investment Project – MSMIP 314
Draft Final Report
Figure IX-D 2 Cycle of Socio-Economic and Environmental Effects of Poor WWTP Project
WWTP
Improvement of
Sanitation and Waste
Water Infrastructure
Education and Public
Awareness
Improved Land and
Environmental
Management
Initiatives
Inadequate
sanitation system
Poor Sanitation
Pressure on resources
- Pollution water sources
- Loss of biodiversity
- Loss productivity
- Loss of tourism value
Flooding and
poor sanitation
Water-borne diseases; disruption
of economic activity; Loss of
property
Decrease in productivity
Decrease in aesthetic value
and quality of life
- Solid Waste Management
- Wastewater Management
- Building Code and Land
Management
-- Village Role in Drainage
Maintenance

TA 7993 - INO: Metropolitan Sanitation Management Investment Project – MSMIP 315
Draft Final Report
F. Phases and Activities of Public Awareness Community Education and Public Awareness has two levels. The first involves information dissemination on the project, its objectives, components and activities to ensure smooth implementation of project components. The other involves education and awareness raising on environmental and technical concerns that relate to the project. Segmentation of audiences and their communication needs leads to tailored messages. While themes remain the same, the fine-tuning of the message content, the choice of media mix, and designing and packaging of the messages will vary. Raising public awareness starts under the Community Assessment Phase. The involvement of stakeholders in the assessment process becomes a public awareness activity in itself. A pre-implementation phase ensures village consultation on project plans and on related issues and concerns. This is the period for design preparation by contractors as well as a time to discuss cost recovery schemes and the like. The project then also coordinates with participants on procedures for project implementation. Information dissemination on construction impacts prepares the community for disturbances due to construction activities – e.g. sewer lines. A resettlement plan is prepared for those that might be affected by waste improvement. The construction phase features advisory and continuing communication of mitigating measures for disturbance due to construction. The phases overlap across different components. On-going education and public awareness on hygiene and sanitation may start anytime during earlier phases depending on the project component. For instance, actual construction of off-site sanitation does not start until the last year of project life. Example in MSMIP five cities, the master plan is divided into 5-year stages, except for first stage which is about three years in duration (2012-2015). Community education on hygiene and sanitation including planning of community roles in waste management and maintenance could start earlier during the preparation phase and may continue on after infrastructure upgrade in waste water sites. The phases of project implementation – construction phase, connection and operations phase, maintenance phase and then determine the information requirements and strategies for each phase in MSMIP cities are:
a. First Five-Year Program Community Development Program Sanitation Master Plan Implementation in the first phase of 5 years will be done through a series of related activities including project preparation, socialization, planning, implementation and delivery of infrastructure and maintenance. Objectives of Program Community development is to build mutual understanding and awareness in all stages of the program 1) Phase of Program Preparation

TA 7993 - INO: Metropolitan Sanitation Management Investment Project – MSMIP 316
Draft Final Report
Preparation activities should be known and understood by all involved parties, both in the ranks of government and society that would serve as planners, implementers, and beneficiaries to achieve the goals and objectives.
2) Phase of Socialization Preparation The purpose of this stage is to ensure that the public are aware of the risks, responsibilities, rights and obligations that arise as a consequence of decisions taken in the implementation of the program and their agreement to run it.
3) Phase of Activity Planning Problem identification involves a series of activities and considers the role of society. In this activity the role level of each member of the RT / RW up to community activities at Village level will be determined. This stage is held entirely by government support.
4) Phase of Physical Implementation Community facilities will have been built in accordance with the program approved in previous planning activities.
5) Phase of Post-Implementation This stage consists of: a) Establishing and operating a local communal facilities management
organization / onsite. b) Approaching women and providing greater opportunities for them to become
community leaders and developing the provision of support. c) Ensuring the operation and maintenance of an effective facility. d) Ensuring the continuation of the source of funds for the operation and
maintenance of facilities. Development of Community Participation A work plan needs to be prepared that supports participation in the development of the Master Plan. Such work plan preparations by public participation will require the help of a facilitator to work with the community. Public participation activities during the development of the Master Plan are as follows:
1) Training of facilitators to assist the community in preparing the work plan for community participation in local-scale sanitation
2) Assist the public in the work plan. 3) Develop educational material for use in schools and in society. 4) Training of teachers to use such materials positively. 5) Planning and budgeting of the public participation program. 6) Fundraising program / workshops with the private sector and the general public
to increase public awareness of sanitation problems. Public Consultation Program Public consultation is required to build the perception that will result in positive action towards effective wastewater management in the community. These activities will include:
1) Conducting big events of sanitation activities to raise awareness of sanitation in all levels of the community.
2) Conducting effective mass media campaigns on the importance of domestic wastewater treatment.

TA 7993 - INO: Metropolitan Sanitation Management Investment Project – MSMIP 317
Draft Final Report
3) A media campaign to discourage people from polluting rivers by disposing of their waste in them.
4) A media campaign to motivate people to actively participate in the program 5) A Master Plan for domestic wastewater.
The media campaign will involve public dialogue with the Mayor and the Chairman of Local Parliament on national and local television. Entertainment activities such as puppet shows with the theme of sanitation and sub themes of domestic wastewater, will also be held throughout the city. These will include:
1) Spreading the message and technical knowledge through posters and brochures.
2) The installation of banners and advertisements. 3) Public service ads on radio and television. 4) Interviews with journalists, communities and governments.
b. The second - 5 Year Program Development of Community Participation Developing and building on the change in mindset regarding clean and healthy lifestyles, especially in managing domestic wastewater is a necessary and ongoing role of the community. Therefore there is a need to continue development in socialization activities, campaigns, providing information and education to the community, on the management of domestic wastewater to the public, especially those living in priority areas. Other points to consider are:
1) The importance of a good septic tank standard, the prevention of design errors or leaks and optional type of sewerage in residential areas.
2) The campaign to promote septic tanks or communal WWTP usage in residential areas and expansion of new connections to residential areas that already have communal sewerage (off site).
3) Campaign to identify and inform of the risk of disease caused by vector-borne diseases found in domestic wastewater.
4) To educate to improve clean and healthy lifestyles of primary school students Program to improve the discipline of citizens in the pumping out of septic tanks regularly by:
a) Competitions to promote healthy homes and healthy sanitation in the RT / RW / village.
b) Training activity (on the job training) of the manufacture of family latrines and healthy septic tanks.
c) Program enforcement for violations of regulations on wastewater and public health.
Community Campaign Program Dissemination of information should continue, because there will be changes in society, e.g. the first primary school age children will move on to high school (junior high / high school / college). Continuity of information delivered will promote sustainable behavior in the community. An activity program that could be run is as follows:

TA 7993 - INO: Metropolitan Sanitation Management Investment Project – MSMIP 318
Draft Final Report
1) Communicate technical messages and knowledge through leaflets, posters, banners and billboards
2) Demonstrate and inform on the onsite system and centralized system (offsite system)
3) Make a miniature healthy toilet and healthy septic tank at the location of public health education (primary schools, health centers, or village/sub district office)
4) Have public service advertisments on television and radio 5) Promote dialogue with journalists, communities and governments to ensure
that information is disseminated.
c. The final - 10 Years Program Community Development Program In order to keep clean and healthy lifestyles in society and to keep continuity in improvement in all levels of the community the following efforts will be required:
1) Education curriculum modules of sanitary hygiene thatare clear and programmed
2) Planned training of participatories from SHG 3) Development activity for the community action plan 4) Monitoring and evaluation activities within the community 5) Implementation of assistance to people both in priority areas and outside 6) Development of community activity plans for the next phase.
Development of Community Participation The activities that encourage community participation remain a priority at this stage. So there is continuity at the community level.
1) Outreach activities, campaigns, providing information and education to the community, especially those living in areas of priority, concerning the management of domestic wastewater to the public including:
• The importance of the septic tank quality, preventing design errors and leaks, as well as the option of different types of sewerage systems in residential areas
• Campaigns about septic tanks and communal WWTP usage in residential areas and the expansion of new connections to residential areas already with a communal sewerage system(off site)
• Campaigns on the risk and impact of diseases caused by vector-borne organisms found in domestic wastewater
• Educate and promote improvement in clean and healthy lifestyles to primary students.
2) A program developed on an incentives pattern to encourage support for the building of the pipeline system.
3) A program to promote improved discipline of citizens with regard to pumping out their septic tank regularly. Such as a competition on healthy homes and healthy sanitation in the RT / RW / villages
4) Program enforcement for violations of the provisions in force in the field of wastewater and public health.

TA 7993 - INO: Metropolitan Sanitation Management Investment Project – MSMIP 319
Draft Final Report
Community Campaign Program Program activities that can be run to help ensure continued changes and improvements:
1) Planned demonstrations of the on-site system and centralized system (of-site system)
2) Making a model of a miniature hygienic toilet and effective septic tank in locations with a good catchment area (primary schools, health centers, village/sub district office)
There were no recommendations for sanitation promotion included in the PU Masterplan for Jambi. However the following recommendations are from the White Book and the City Sanitation Strategy (CSS) for Jambi. Includes strengthening sanitation promotion through the Healthy Communities program and the Independent Movement (PHBs and Gema Sehati). The two major programs of health are the PHBs and Gema Sehati with the main driver of the programs being the Mayor. Many activities have been, and will be, conducted within the framework of Gema Sehati. While PHBS program is a national program under the Ministry of Health, so the Health Office is also implementing a lot of PHBs programs in Jambi. Both programs include efforts to improve sanitation. Sanitation promotion to increase awareness In Stage I, the objectives associated with the promotion of improvement in sanitation up to 2015 can be seen in the following table: 1). Zero, Open Defecation (BABS) by 2015 strategy, implemented by a program that includes a variety of different media for promotion. It includes campaign risks and impacts caused by disease vectors contained in domestic wastewater. Also increase PHBs in primary school students to improve awareness of healthy living and hygiene at school. 2). Increase the continuous monitoring of wastewater management of home industry to meet domestic environmental quality standards. This implemented strategy of the rehabilitation program is to prevent environmental pollution caused by wastewater. Campaigns on latrines usage are taking place in 4 villages (Legok, Sulanjanan, Budiman and Rajawali). There is a program for clean and healthy market environment, a healthy market campaign, a campaign for healthy and environmentally friendly home industry and the establishment, training, coaching cadre of SHG in the 7 earmarked villages. In stage II, up to 2020, the following interactions with the community are planned: 1) The Campaign Program PHBs 2) Facilitate the creation of a CSR for sanitation 3) Healthy Village Award 4) Training of O & M capabilities at communal and intermediate levels 5) Social marketing for an urban-scale sewerage system. In stage III, up to 2030, the roles of the community are: 1) Continuing of PHB campaign program

TA 7993 - INO: Metropolitan Sanitation Management Investment Project – MSMIP 320
Draft Final Report
2) Continue to facilitate the creation of a CSR for sanitation 3) Continuing of Healthy Village Awards 4) Continuing Training of O & M capabilities at communal and intermediate levels 5) Continuing the social marketing for urban-scale sewerage system. Education and training, as a function of a collaborative plan by the existing network for waste water and sanitation could be on-going during and even after project life. On the other hand, on-going awareness campaign on waste management with assistance from other concerned agencies could be strengthened ideally before start of waste water treatment plan improvement in Makassar, Palembang, Jambi, Pekanbaru, Cimahi and Jambi. This happens after the preparation of an Action Plan with partner agencies. Community education and facilitation of community responses such as replanting along the areas of waste water treatment plan by agency partners could be reflected in the Action Plan and implemented accordingly. Related policy reforms are expected to be formulated during the project life. These will be part of the education campaign within the project site as these are promulgated. 2. Community Assessment Phase Public awareness campaign starts where the people are in terms of practices, attitudes, preferences, and affordability. An appreciation of the factors affecting poor waste water and sanitation helps communities to address these in a sustained manner. Social and sanitation assessment shall be the basis for planning for change as well as to discuss concerns such as cost sharing and community counterpart in implementation, operation and management. Thus, this plan shall be reviewed based on result of waste water and sanitation assessment. a. Public Awareness through the Community Assessment Processes Social, waste water and sanitation assessments will be undertaken at the start of the project to gather information about waste water and sanitation conditions in terms of facilities, attitudes, problems and practices. Rapid appraisal techniques shall be used to identify current conditions and issues and problems at the village level. A survey of households and business establishments shall also be conducted as part of the assessment. These are occasions to introduce the project, its objectives, components and methodology to residents of the project site while gathering information and feedback, thus generating stakeholder inputs and defining issues more fully.(conducted in feability study waste water master plan by INDII)

TA 7993 - INO: Metropolitan Sanitation Management Investment Project – MSMIP 321
Draft Final Report
Inventory of Land Availability for the Waste Water Treatment Plan
CimahiCurrently, government of Cimahi have purchased 1 Ha of land and a 6,000 m2 pond for construction. Theyhave ability to increase land area by another 4,000m2, in 2013, giving a total area of 2 Ha.
Jambiland acquisition process for the 6Ha be be finished no later than September 2012. Land survey to identify theborders of lands for individual owners is underway. Land Cost Rp 6 Billion
Makassar
5 Ha of land has been acquired since 2009, costing Rp19 billion. Land Certification process will be carried out using APBDP 2012 budget. See letter from Walikota to PU re land purchase and transfer of 1 Ha of land from
GMTDC
Palembang 5.7Ha of land has been agreed for sale, the purchase will occur in September 2012
Pekanbaru
Land price for the 20 Ha has been mutually agreed with the land owners. At present BPN is surveying theparcels / borders of individual owners. Payment process is expected to be made after Idul Fitri and completely
paid by September 2012. b. Publicity and Promotions The objective is to raise the profile of wastewater and sanitation issues and the importance of community role in addressing various concerns. Publicity encourages full participation in target area and serves as prompt to support change of practices in waste disposal, building waste water treatment plan facilities, etc. Media coverage of project activities and related stories can help put concerns and proposed solutions in focus. It is hoped that publicity on project experience and activities helps raise consciousness on hygiene, sanitation and environment throughout the city. The following activities are applicable for the initial phase. A separate Publicity Plan for an on-going education campaign shall be discussed with agency partners.
o Production of Information Materials for Public Consultations Appropriate presentation materials are needed for community consultations and workshops. Maps and project plans of the appropriate size could help present project components in a manner that more easily elicits information and generate discussion among participants. o Production of Brochure and Briefing Materials The other target audiences of the Project are other agencies, programs, national leaders, individuals or groups such as the media which can take on advocacy roles to promote solutions and action on various project concerns. Briefing materials in the form of a brochure and briefing kits for the media and other potential supporters would be helpful. These would be geared towards also addressing the special interest of the sector such as Information Management and Exchange

TA 7993 - INO: Metropolitan Sanitation Management Investment Project – MSMIP 322
Draft Final Report
Access to information related to sanitation and waste water management issues is lacking. Such access can be improved by compiling a database to identify basic information on sanitation and health, waste water effluent levels and standards, etc. These are put together for use in developing information kits and education materials. o Education Materials for On-going Education Campaign The Project shall coordinate with other agencies early on for resource sharing on related education campaigns. On specific topics such as water and hygiene and sanitation, etc, some campaign materials are already available with partner agencies such as the Ministry of Health, Environmental Office , the sanitation working group at city levels, existing campaigns on sanitation and waste management by these agencies can be launched or strengthened community awareness. Raising awareness on causes is the first step. Various media shall then be selected to deliver these in the most effective way. Another message to stress is the need for individual and collective responsibility as well as options and community activities that can help solve various aspects of the problems. Campaign materials may also highlight education for community from Ministry of Education and culture concepts and teachings of pride of beauty of and village responsibility over surroundings, which can easily encompass proper construction of sanitation facilities and maintenance of waste water treatment plan. Reports and articles in newspapers, television shots, local radio, posters, and other mass media tools are also effective in addressing the general public. Usually this is the responsibility of each agency, thus the need for coordination. At a later phase, collaborative planning for the production of various education materials (posters, games, newspaper reports, brochures, television programs, seminars, and so on) is conducted to decide on additional campaign materials for each target audience.

TA 7993 - INO: Metropolitan Sanitation Management Investment Project – MSMIP 323
Draft Final Report
Figure IX-F 1: FLOWCHART FOR COMMUNITY EDUCATION AND PUBLIC AWARENESS
Community
Assessment
Secondary data
gathering; Rapid
appraisal and/or
survey
Sanitation
Survey
Pre-Implement
-ation Phase
Community,
business,
stakeholder
Pre-implement-
ation planning or
coordination with
village/households
Relocation
planning, as
needed
Education and
Public Awareness
by/with other
agencies
Construction Phase
Information dissemination
on impacts of construction
Implementation of business
and community roles on
waste management and
maintenance
On-going
Education and
Public
Awareness
“Clean River”
Campaign
Maintenance of
sanitation and
waste water
facilities by
village and
business Public
Consultations
Site selection
finalization
Bidding and Project
Design/Education on Waste
Management in Communities Policy Reform/Development
of Implementing Guidelines
Enforcement of
Development and
Land Management
Policies
Continuing Education and
Public Awareness by/with
other agencies on special
concerns
Facilitation of community
action on waste
management and waste
water maintenance
Coordination with village
on implementation of
component
Monitoring
Pre-meeting
contact with
Internal Affairs,
the fono and
village leaders

TA 7993 - INO: Metropolitan Sanitation Management Investment Project – MSMIP 324
Draft Final Report
3. Project Design and Pre-Implementation Phase
Community engagement shall precede design and implementation of project components. It allows feedback to be incorporated in project design and prepares communities for implementation which are spread out throughout project life. a. Public Awareness through Public Consultations To achieve greater cooperation and involvement, the public must understand the sanitation, sewage and waste water situation, the costs of poor water quality health and community, including the costs of delivery, the cost of maintenance of infrastructure, and the need to conserve land environment resources and to maintain them for future generations through improving quality of water that goes into the rivers or sea. Stakeholders are also informed of the issues and project responses and implementation plans – components, time frames, and implementation schemes per component. Information on general impacts and mitigating measures shall be provided. Inputs as well as feedback are obtained from participants on proposed project components. Consultations are also opportunities to raise awareness on the interrelated concerns of sanitation and waste management and the role of stakeholders. These may be conducted as part of the public awareness strategy, the community assessment process or the on-going information campaign on any aspect of implementation. Major consultation groupings include:
o Waste Water Areas o Business and Industry o On-Site Sanitation Villages o Impact Zone for Waste Water Treatment Plant, including pond treatment area
However, for the public awareness consultations, project presentations for any given area shall cover all of the components even while consultations may have a focus on any one component such as drainage, the waste treatment plant or on-site sanitation. General public consultations and meetings to plan details of implementation for a component may be an on-going process. Later meetings may be on specific concerns such as planning for impact of sewerage construction during the Games, firming up cost recovery scheme and collection mechanisms, consultations to arrange schedules and procedures for inspection of septic tanks or entry of earth moving machines for waste water improvement, etc. Public consultation shall be conducted in each subproject city of MSMIP, namely: Cimahi, Jambi, Makassar, Palembang, and Pekanbaru.
Objectives of Consultations: Key objectives for consultation during the initial period are:
o Validating targets for waste water improvement o Identification/validation of blockages and prioritization of work required o Identification of potential issues and concerns including impact on
property o Raising awareness on causes of problem and potential community role in
clean up and maintenance o Community Planning for Needed action – waste management, clearing of
excessive fill and inappropriate structures

TA 7993 - INO: Metropolitan Sanitation Management Investment Project – MSMIP 325
Draft Final Report
o Resettlement Action Planning with affected persons ADB’s information disclosure, consultation, and participation policy requires the project to share information with stakeholders and project-affected people early enough to allow them to provide meaningful inputs into project design. The objective is for MSMIP plans to reflect stakeholders’ inputs and the actual needs of the intended clientele to enhance ownership and sustainability. Consultations aim to:
1. Raise awareness on project 2. Generate/validate information on planning contexts 3. Build consensus on analysis of problems and required action among
stakeholders within the sanitation coverage area 4. Address special issues 5. Empower women, indigenous peoples, hardship and special need groups to
have their concerns duly considered in plan preparation 6. Foster a sense of ownership of investment plan by proponent, partners and
clients The basis of the public consultation to be conducted in each subproject city is ADB’s 2009 Safeguards Policy Statement (SPS) which requires the borrower/client (GOI) “to carry out meaningful consultation with affected people and other concerned stakeholders, including civil society, and facilitate their informed participation. SPS defines meaningful consultation as a process that (i) begins early in the project preparation stage and is carried out on an ongoing basis throughout the project cycle; (ii) provides timely disclosure of relevant and adequate information that is understandable and readily accessible to affected people; (iii) is undertaken in an atmosphere free of intimidation or coercion; (iv) is gender inclusive and responsive, and tailored to the needs of disadvantaged and vulnerable groups; and (v) enables the incorporation of all relevant views of affected people and other stakeholders into decision making, such as project design, mitigation measures, compensation and entitlement, the sharing of development benefits and opportunities, and implementation issues. The consultation process and its results are to be documented and reflected in the environmental assessment report and resettlement plan.”
b. Public Awareness through the Mosque as Communication Channel
The mosque in five MSMIP cities is a central institution in village life. This is especially the case in the project site where most villages are melting pots and are not organized according to the traditional system. The mosque, together with village structures can be tapped when disseminating project announcements to the public or when launching Project’s information and public awareness campaigns.
4. Information on Impacts at Construction
Information on disturbances during construction may be communicated directly to affected groups or through appropriate channels such as through the mosque and the community groups. Since sewage construction would be felt by other city residents, mass media shall also be used to advise residents in a timely manner of disturbances and mitigating measures during construction. Announcements include basic details on: what, where, when, why, how. Contact information may also be provided for feedback and complaints.

TA 7993 - INO: Metropolitan Sanitation Management Investment Project – MSMIP 326
Draft Final Report
o Community Planning for Construction per Component Timing and procedures shall be coordinated on various aspects of assessment and implementation such as for entering private land to inspect, assess requirements, and survey existing installations, for entry of earth moving equipment on private land, etc.
5. On-Going Community Education and Public Awareness
o Public Awareness through Launching a Common Campaign - e.g. Clean River Campaign
Increased understanding is the first step in any successful public awareness activity. Waste disposal and sanitation activities require changes of behavior and attitudes, which is usually a slow process. Therefore, ad hoc and occasional public awareness activities may not achieve tangible results. Therefore, a campaign plan needs to be set in place, that is continuous and have long-term activities in collaboration with all involved programs and agencies. Massive communication activities can be launched. The strategy of sanitation must involve all stakeholders and be interactive, and include all consumers and all the factors concerned, such as religious, political and formal and informal community leaders. Raising public awareness using strengthening sanitation promotion through the Healthy Communities program and the Independent Movement (Gema Sehati and PHBs) i.e Jambi can be integrated with the use of other communication tools and channels. For instance a “Clean River” Campaign can bring together the existing network of agencies and programs on the related themes of environment, water, sanitation and drainage in a sustained information and education campaign plan on these concerns. The campaign then becomes a city/national program that may focus on just the Musi River in Palembang and the Batanghari in Jambi or may include other city rivers with similar problems. It would be the standard bearer for various related campaigns such as to eliminate waste disposal in streams and may include another agency’s recycling promotion campaign and village action plans to maintain drains, monitor proper waste disposal, etc. A campaign by Sanitation Working Groups in the city level to promote improved waste treatment by industry may feature public disclosure of monitoring results on media. And so on to address the various facets of the problem (see Annex Document I.4 - Sanitation Working Group and Public Awareness Campaigns). A Campaign Plan can be drawn up with the agencies and programs that are concerned with the issues involved in eliminating flooding and in improving sanitation and wastewater management. Campaign /Socialization and guidance to communities can be an alternative to be used to bring communities together with government in efforts to tackle environmental pollution through the development of the management of House Connection (SR) centralized wastewater Treatment Plan (WWTP). Campaign environmental health are the process of giving effect to the/target capable of changing attitudes and behaviors are consistent to the purpose.
TA 7993 - INO: Metropolitan Sanitation Management Investment Project – MSMIP 327
Draft Final Report
1) Counselor is the person/agency designated to provide counseling 2) Campaigns of environment health is a business plan, that require the review, formulation and adjustment of various data, information, foundation, goals, and objectives, and implementing elements 3) Campaigns will be done by cog-use management mechanism of natural problems that exist in the location 4) Communities Guidance in the environmental health is the continued activity of the Counseling. 5) Campaigns and guidance of communities in the field of waste water are the provision process of information and motivation on the prevention of environmental pollution to the community Campaign planning shall review the social marketing mix that looks not only at aspects of promotion but also at other factors to include analysis of key target audiences (publics), campaign allies or partners, promotion of supporting policies, etc. On-going campaign can start anytime as soon as a plan is prepared with partner agencies. Advocacy requires agreements on specific operational goals. These have to be realistic and achievable in a specified time span. It is best to set these goals with the main stakeholders involved and setting them in such a way that indicators are agreed upon and are verifiable, preferably by those stakeholders who have immediate interest in the issue. Once these goals are in place, the next step is to identify and mobilize potential partners. Every stakeholder connected with waste management has to be approached, including village structures, legislative bodies, NGOs, industries and the Chamber of Commerce, religious people, the media, and community and professional groups. Then groundwork may be done through sector workshops to obtain commitments from the business and the private sector, villages along rivers and streams, the media, etc. o Public Awareness through Feedback on Monitoring Results
Water quality monitoring is part of the project. As there is no way to measure the effluent of each septic tank or business establishment, indications on changes in the sanitation situation may be measured in the amounts of nutrients and faecal coliforms in the coastal waters. Where there are provisions for testing-kits, villages can participate in taking periodic samples and recording changes in the coastal water. Responsibility centers can be trained to use the testing kits and record results. Feedback is important in behavior change. Feedback to the community on monitoring results of wastewater parameters, waste disposal practices, etc. would be useful in continuing education and public awareness activities. Moreover media publicity of monitoring results would also reinforce good performance and provide indications for areas of improvement.

TA 7993 - INO: Metropolitan Sanitation Management Investment Project – MSMIP 328
Draft Final Report
o Media Coverage of Project Activities and Good Practice in Network Campaigns
It is ideal to arrange media coverage of activities rather than depend on press releases. On the other hand, good treatment of news can be aided by providing media with a press kit containing background and key information on the situation and the project.
Feature stories are less popular but these are often better read and remembered. Stories of good practice, successes, appropriate technologies, partner institutions and their programs – e.g. JICA’s waste management campaign, or that feature the role of communities or business in waste management/treatment, drainage maintenance or sanitation or mangrove management, all raise awareness on the issues and proposed alternatives. As do special events or advocacy by influential officials and popular personalities. Feature stories on special concerns and successes of individuals and communities can be arranged as these emerge from project experience and those of partners.
Media coverage of special activities and success stories can be included in a publicity plan.
o Public Awareness through Special Events
Special events may be launched as part of the education and public awareness campaign. These could be clean-up drives, tree-planting along waterways, parades, etc. These could take advantage of local fairs and festivities that may feature booths and a signature campaign where participants express commitment for desired action – e.g. recycling, construction and use of garbage platform, wastewater treatment, etc. Studies have shown that participants who have expressed commitment for a course of action were more likely to sustain behavior.
o Public Awareness through Community Planning to Support Desired Action
on Waste Water and Sanitation
Discussion of assessment results can be the impetus to plan for needed action. Community planning and sanitation exercises shall be facilitated that will help communities set targets for change in waste water maintenance and solid waste and waste water management practices.
Villages in the project site can have action plans for elements of the campaign based on identified community sanitation and waste water issues. This may include rules on establishment and maintenance of garbage platforms, keeping drainage systems clean near one’s house, ensuring drainage systems are not blocked due to construction of driveways including schedules and responsibilities for maintenance work on drainage systems, protecting trees and replanting along rivers and waterways, disposal of waste water into streams, etc. Community plans for operation and maintenance are then put in place. This would include community monitoring mechanisms.
TA 7993 - INO: Metropolitan Sanitation Management Investment Project – MSMIP 329
Draft Final Report
Such a planning session can be piloted in project villages as early as the pre-implementation phase and can go on through the construction phase or later. In the case of area for off-site sanitation, this can occur even before 2015, when off-site sanitation facilities are actually build. o On-Going Public Awareness through the Mosque as Communication
Channel
The Mosque in the project site can be partners in on-going public awareness campaigns. Consultation planning with the sector may result in strategies and action plans that mosque leaders might be able to undertake in their respective areas.
For instance, a Sanitation and Environmental Clean-Up Awareness Campaign through churches may be launched. Churches can help promote good health practices and raise awareness about the importance of safe water, adequate sanitation, and hygiene in disease prevention. In such a campaign, training of church leaders by water, sanitation and environmental experts would be an essential component.
A pilot may be implemented where mosque leader and Ummat (Mosque Community) are trained to incorporate issues of daily life, including water conservation, waste management and sanitation and hygiene into their mosque education modules. They would be provided with information about cities sanitation and health statistics and commitments to the Millennium Development Goals, waste water toxicity information, land conservation resources, and the effects of continued sewage, waste water and solid waste practices would be on these resources, thus the need for public cooperation and participation in sanitation and environmental management. The mosque leaders and ummat may be more capable of reaching the public than environmentalists and sanitation specialists. Although they are usually well educated, their knowledge of sanitation, water resources and conservation practices is usually insufficient for them to act as educators on the subject. Therefore, specialists can train and inform them not only about sanitation shortages and good practice, and the need to involve the public but also about audiovisual tools and materials to help them reach the public. They could be provided with clear messages that may even link to moslem and traditional community values. Upon receiving proper training, each prepares a special friday speech to deliver. Mosque committees may also play a part in monitoring community sanitation and drainage action plans to ensure follow up.
The Mosque then becomes an ally in educating the public. The pilot can then be replicated in other mosque upstream or elsewhere. o Raising Awareness on Special Concerns
The project in coordination with concerned agencies shall also undertake education activities on related concerns. o Public Awareness Focusing on Business and Industry
Awareness campaigns need not focus solely on domestic users. Attention shall also be placed on business and industry which are located in the Central Business District.

TA 7993 - INO: Metropolitan Sanitation Management Investment Project – MSMIP 330
Draft Final Report
Topics include proper maintenance of sanitation facilities. Programs of the SWG at city level to encourage wastewater treatment, etc. as these are developed can be disseminated and monitored as part of plans under the Clean River Campaign. Their commitment for reforms can be obtained through planning workshops with the sector to prepare action plans based on new rules that are promulgated. Publicized monitoring may be agreed upon as an incentive for compliance.
6. Capability Building
Capability Building under the component shall support role of staff and communities for socially responsive and environmentally sound implementation of the project and in helping improve sustainability of infrastructure and practices on hygiene, sanitation, waste management and maintenance. This will involve on-the-job technical assistance in implementing an action plan on Community Education and Public Awareness throughout the project life. Assigned staff takes on additional responsibilities that are not part of functions under existing job descriptions. Additional competencies for technical/field staff are those that are required for Community Education and Public Awareness to include skills in information gathering/dissemination, facilitation of consultations, community planning and training, problem analysis, identification of training needs of communities and other stakeholders, advocacy on issues that affect drainage and sanitation and mobilizing community role in sanitation and drainage maintenance. Staff may also be called upon to conduct/coordinate community training or workshops with other agencies on related technical topics such as hygiene and sanitation, recycling, septic tanks construction and maintenance and the like. An area of competency is the production of promotion and education materials through appropriate media and designing and mobilizing for community outreach activities. Publicity entails ability to establish more vibrant partnership with media for coverage on sanitation and environmental concerns. This would entail preparing a publicity plan that not only depends on press releases and paid advertisements but also identifies opportunities for coverage thus projecting project issues and featuring good practice in mass media. Other competencies include facilitating community assessment and monitoring as well as partnership building and managing joint education campaigns. Community training needs are continually assessed but initially indicated by the Community Assessment. Moreover, result of on-going education campaigns is monitored and evaluated as basis for calibrating community education plans per village. Functional Analysis would be a useful tool to determine gaps in competency of staff for each of the job functions which would be a basis for delivery of on-the-job training and seminars, where needed. Topics of Public Awareness Campaign Environmental health campaign topics are all ingredients of the topics that will be delivered to the community as recipient of environmental health counseling. Selection of materials should be adjusted to the time and form of activities, communities faced, and the targets and objectives to be achieved. Topics in the field of waste water to be delivered include: Understanding Process 1) Definition of waste water, waste water sources 2) The relationship between sanitation and health 3) The problem of environmental pollution that is often encountered in communities

TA 7993 - INO: Metropolitan Sanitation Management Investment Project – MSMIP 331
Draft Final Report
4) Process of Awareness 5) The importance of community participation in prevention of pollution and health
problems 6) Mutual reminiscent of fellow citizens 7) Empowering communities through Communal WWTP in inaccessible areas with
centralized wastewater management 8) Community empowerment in the development of Connection House (SR) centralized
wastewater 9) Meeting the Needs Process 10) Provide practical guidance on the local waste water management (On Site) and
centralized (Off Site) 11) How to manufacture toilet and septic tank 12) Total cost involved and their sources in Communal WWTP management and
centralized WWTP (O & M Cost) 13) Socialization of services and development of house connection in centralized waste
water management with urban-scale WWTP.
Methods and Techniques of Public Awareness Campaign a) The method of Campaign/Counseling The methods used in the campaign/counseling of environmental sanitation are:
• Persuasive and motivational methods, are method in the performance of duties as health educators, provide understanding and invitations and messages, based on the awareness and conviction.
• Consultative method, has always maintained a strong relationship based on mutual understanding and give each other assistance and support of educators and communities goals.
• Participatory methods always place the targeted communities as subjects/active actors.
b) Technique of Campaign/Counseling Techniques of Campaign/Counseling are procedures of delivering counseling messages to the community as target counseling. The techniques used are verbal counseling, written counseling, and counseling demonstration. 1. Verbal counseling, are counseling delivered by spoken language a) Direct verbal Counseling
• Instructor deal directly with the group receiving counseling; • Place of the counseling course be prepared; • The media are: lectures, sermons, and workshop/discussion, FGD, and residents
meeting. b) Indirect Oral Counseling
• Instructor does not deal directly with the group receiving counseling in the same place;
• The counseling receiver is not prepared in advance in a particular place; • The media are: radio and TV broadcasts (speech, reportage, interviews,
drama, chat, and slide). 2. Writing Counseling: the counseling media is a written language, such as, making
brochures, leaflets, posters/pamphlets, flip charts, banners, and newspaper media. 3. Demonstrations Counseling: the media used in the form of exhibitions on the
development of waste water, film, traditional arts group (puppets, cultural performances, etc.)
4. Sanitation - Marketing through CAR TEAM: Village PPAL, which puts people (2 up to 4 persons) in the Village to carry out "Micro Marketing" whose jobs are to:
• Conduct campaigns/promotion on health and waste water
TA 7993 - INO: Metropolitan Sanitation Management Investment Project – MSMIP 332
Draft Final Report
• Describe/service consultation on waste water management and house connections service
• Dissemination of house connection of citywide WWTP. • Registration/Admission connection of house connection of citywide WWTP. • Serve the Complaint in the construction phase • Serve the payment of House Connection retribution • Serve the Complaint in the post-construction phase
5. Sanitation - Marketing through CAR TEAM: Village PPAL, which puts people (2 up to 4 persons), in the Village to carry out 'Monitoring and Development and Optimization of Communal WWTP "whose jobs are to:
• Hold FGD (Focus Group Discussion) between Communal WWTP Facilities Management Board.
• Hold BPS training for monitoring and coaching of O & M Communal WWTP • Hold Field Monitoring (Field Visit) to Communal WWTP • Hold Socialization/Campaign/Counseling PHBS and O & M Communal
WWTP. • Implement the Communal WWTP optimization.
Orientation on Monitoring for Community Education and Public Awareness Monitoring indicators shall be agreed upon as well as methodologies for gathering data. Community monitoring mechanisms may also be established to track changes in behavior relative to waste water and sanitation. Community Leaders on Sanitation and Waste Management, Role of Village Structures in Sanitation and Waste Management Households shall be encouraged to participate in upgrading of infrastructure for sanitation through an explanation of the effects of inadequate facilities on health and the environment. The communities especially those living along pipe area of waste water treatment plan shall be part of education activities on waste management, drainage maintenance and community monitoring. On the other hand, community leaders –and village committees - are supported to be able to help in the community education agenda in the village and to plan and sustain community mechanisms for monitoring of waste management systems and maintenance. Some topics which may be done by partners include:
o Building Code and standards on waste water and sanitation/Septic Tank Design for Low-Lying Areas
o Appropriate Technologies on Wastewater Management o Appropriate Technologies on Solid Waste Management o Hygiene and Sanitation (Ministry of Health) o Participatory Planning, Monitoring and Evaluation o New policies and implementing guidelines on wastewater management, legislation
on land use and environmental policies and rules, Building Code, etc. Orientation/Training of Other Partners on Community Education on Sanitation Where needed, other community partners may need to be trained to be able to assist in community education and public awareness campaigns. These may be teachers and mosque leaders on specific environmental campaigns in coordination with partner agencies. Support may also be provided in the form of educational materials in coordination with other agencies. In the same manner, a dialogue may be conducted with the media on sanitation

TA 7993 - INO: Metropolitan Sanitation Management Investment Project – MSMIP 333
Draft Final Report
and drainage concerns to gain their support for sustained coverage to increase awareness on drainage and sanitation issue. Figure IX-F 2 below describes the organization of the TA and defines the working and reporting relationships between the Executing Agency (DGHS), the ADB, and the Consultant Team.It also shows the interaction between the TA beneficiaries, the City Governments and other agencies which need to be involved and consulted.
Figure IX-F 2: Project Implementing Structures and Partners
7. Ministry of Public Works (MPW)
The Ministry of Public Works (MPW) will be the executing agency (EA) for the PPTA and is appointed technical assistance director who is Head of the Sub directorate for Foreign Cooperation. For technical issues pertaining to the PPTA, the Directorate of Human Settlements will provide assistance and support. At the local government level, the equivalent Public Works Department in conjunction with BAPPEDA will be the counterpart agencies. This unit will coordinate with and focus more on the local sanitation working group (Pokja). The local governments need to be fully aware of what is proposed in terms of development in the PPTA must work very closely with the local Bappeda in relation to their visions for each of the respective cities. Sanitation certainly forms a part of the National strategy and is most definitely also included within the strategies of the local governments themselves.
TA 7993 - INO: Metropolitan Sanitation Management Investment Project – MSMIP 334
Draft Final Report
Many of the cities that are part of this PPTA had already completed their own City Sanitation Strategy and action plan into the foreseeable future. These documents will be reviewed comprehensively by the PPTA team and the approaches adopted by the local government in terms of planning and budgeting where possible will be integrated in with the recommendations in the reports. Any deviations which the PPTA team considers critical will be carefully discussed with the planners and financiers within the local government to ensure that they are fully conversant and supportive of the PPTA’s recommendations. The phasing of the programme will generally follow the recommendations contained within the INDII prepared master plans. However budget considerations and potential constraints will be incorporated into these recommendations. 8. Indonesian infrastructure Initiative (INDII) The Government of Australia (GoA) announced the Water and Sanitation Initiative (WSI) in December 2008. The approved allocation for Indonesia is A$60.5 million. The bilateral funds are to be expended during the period 1 July 2009 - 30 June 2011. The preparation of Wastewater Investment Plans was under one component of the WSI for Indonesia. Other components of WSI include the water and sanitation hibah, and support to PAMSIMAS. The WSI program for Indonesia is being delivered through the Indonesian Infrastructure Initiative (IndII) which is a bilateral cooperation project between Australia and Indonesia funded by the Australian Agency for International Development (AusAID). The main objective of the project was the acceleration of urban sanitation development program which forms part of the Road map to Acceleration of Urban Sanitation Development (PPSP) a document produced by the MPW, MOHA and the MoH. The significant part of this project is that it will fast track the preparation of master plans specifically for the seven cities included to provide background information for additional donor support from both the bilateral and multilateral donor community. This Terms of Reference (TOR) is for the preparation of Wastewater Investment Plans for the cities of Batam, Palembang and Bandar Lampung as part of the WSI. The current activity of the wastewater master plans focused on 8 cities seven of these cities are split into three separate packages. Package 1 Surabaya and Bogor Package 2 Palembang, Banda Lampung and Batam Package 3 Pekanbaru, Cimahi, and Makassar Makassar was included at a later date and a masterplan and feasibility studies were also prepared for a section of the city. The outputs from this project form a major part of the initial structure of the PPTA. It is proposed that many of the studies and designs that were prepared by the master plan team will be utilised in the preparation of the final report. Socio-economic surveys willingness to pay and focus group discussions were all carried out in this assignment and based on a close review by the PPTA team it is envisaged that much of the data will be applicable.
a. NGOs Non-governmental organizations have the capacity to mobilize communities into purposeful action. Many have the capacity to develop and produce educational and public information materials and conduct training programs.

TA 7993 - INO: Metropolitan Sanitation Management Investment Project – MSMIP 335
Draft Final Report
The NGO network is represented in the Working Groups for Water and Sanitation. Where these operate in and upstream of the project site, a partnership with NGOs can form a dynamic network of motivated and trained individuals to promote improved waste and sewage management in line with their community development programs. Where needed, they may also be tapped to facilitate training on community planning to firm up mechanisms for drainage maintenance. b. Media The media in Indonesia can become active partners in awareness generation and advocacy for policy change. This can happen through more active coverage, commentary and in-depth reporting on drainage and waste management. Reports and articles in newspapers, television spots, posters, and other mass media tools are very effective in addressing the general public. Media can also help sustain pressure on all stakeholders to perform their roles and responsibilities as well as reinforce good practice through publicity. A stronger partnership can be established on issues by engaging the media as partners in a campaign. This can be done through a media orientation/forum on drainage and sanitation concerns and the preparation of a publicity plan which is then coordinated with media contacts and with programming directors/managers on special features and reportage of monitoring results. It is also good to invest on contacts and to assist them with background information, press kits, leads for features and the like. Media needs events and people. The campaign can create its own events and get media to cover that. This would be a departure from a focus on straight news and paid air time and press releases. News is not the only media. Campaigners can find out about timing and markets (listeners, readers, viewers) for each outlet – they determine what’s covered. Features pages/ programs and magazines are often better read and remembered. Other media channels can then be explored for more complex stories. Appropriate media may be offered with angles for good feature stories and investigative pieces on various project issues, alternative technologies, success stories within the network such on women’s roles in sanitation and so on. Campaign Material manufacturing can be: • Insert (3 minutes); broadcast on Local Radio (you can use the Government Radio City/Private Radio) • Factsheet, distributed in the events that made the Campaign/Socialization • Leaflets are distributed directly in events that are conducted in a
campaign/Socialization. • The poster, distributed by way of the outboard and given directly in the events that
are conducted. • Banner is in pairs at public events, arts festivals and cultural interest by communities. • Sticker, it includes the promotion of Houses connection installation for centralized
waste water management of Off-site system, Contact Person (Name, Office, and telephone number) that can be contacted regarding wastewater connection information, and payment of Tariff Charges.
• Dissemination by the FGD (Focus Group Discussion)
TA 7993 - INO: Metropolitan Sanitation Management Investment Project – MSMIP 336
Draft Final Report
Done to socialize and encourage the participation of officials and prominent figures in the Village in a centralized waste water treatment, FGD can be done at the Village Office.
• Dissemination through Citizens Rally (Urban Meeting) Gathering people do in order to socialize the development plan of wastewater house connection to the community. This socialization can also be done to push interest of people who live in the location - location of business/trade to install a centralized waste water house connection. This socialization can be done at the lowest level to the Neighborhood level.
• PHBS Campaign PHBs campaign is conducted to bring awareness to communities of the importance of a healthy and clean living, and its relationship between the health and wastewater. This will be very important topic to bring awareness to the community about the importance of management and wastewater treatment. So hopefully communities will put the needs of this waste water management become one of the priorities in his life. • Counseling Counseling is conducted to support the of the operational and maintenance aspects. At the house connection services, counseling of waste water is necessary in order to provide insight and understanding to the communities on the importance of maintaining facilities and infrastructure maintenance that had been built in the surrounding environment, both in the means of individual, communal, and centralized facilities. • Talk show This activity is carried out to support the efforts of government plans in the construction of the house connection to WWTP, and is done usually in order to socialize policies or regulations in force. Campaign/Counseling Material manufacturing can be: • Insert (3 minutes); broadcast on Local Radio (you can use the Government Radio City/Private Radio)
• Factsheet, distributed in the events that made the Campaign/Socialization • Leaflets are distributed directly in events that are conducted in a
campaign/Socialization. • The poster, distributed by way of the outboard and given directly in the events that
are conducted. • Banner is in pairs at public events, arts festivals and cultural interest by communities. • Sticker, it includes the promotion of Houses connection installation for centralized
waste water management of Off-site system, Contact Person (Name, Office, and telephone number) that can be contacted regarding wastewater connection information, and payment of Tariff Charges.
• Dissemination by the FGD (Focus Group Discussion)
Done to socialize and encourage the participation of officials and prominent figures in the Village in a centralized waste water treatment, FGD can be done at the Village Office.
• Dissemination through Citizens Rally (Urban Meeting) Gathering people do in order to socialize the development plan of wastewater house connection to the community. This socialization can also be done to push interest of people who live in the location - location of business/trade to install a centralized waste water house connection. This socialization can be done at the lowest level to the Neighborhood level.

TA 7993 - INO: Metropolitan Sanitation Management Investment Project – MSMIP 337
Draft Final Report
G. Monitoring and Evaluation Monitoring shall be undertaken not only of public awareness activities but also of their results. This can be through both formal and informal methods of obtaining feedback such as focus group discussion, key informant interview, feedback during consultations, survey, etc. This can be done within two months after a major campaign in a village/for a sector. The objective is to understand what works and what are preferences as to media channel or campaign strategy. Information is then also obtained on further education needs for each village or sector. Monitoring and evaluation shall include indicators not only on extent of participation in the upgrade of drainage and sanitation infrastructure but also on behavior and practices relative to hygiene and sanitation and drainage and solid and wastewater management. Another area includes compliance with Resettlement Action Plan. 1. Community Monitoring and Evaluation on Sanitation and Waste Management
Community efforts to improve drainage maintenance and sanitation practices can be strengthened through the establishment of participatory monitoring mechanisms. Success can be reinforced if community role in drainage and sanitation is also promoted, thus institutionalized by other agencies such as the Ministry of Women, Community and Social Development through recognition of drainage maintenance and waste management as village functions and providing incentives for good practice. In such a case, publicity for good performance would encourage continued monitoring and good performance. H. Budget The meeting featured key participants and representatives from the Ministry of Works, BAPPENAS and the ADB PPTA. An introduction was given by the Director of the Bina Program which is the agency that is responsible for the implementation of the PPTA within government. He conveyed the government's appreciation to the ADB for providing the support to enable the documentation to be prepared which would prepare the foundations for a formal loan application early in 2013. The government's vision in the next few years was to complete major wastewater infrastructure projects in 16 cities and is proposed loan would set the foundations for a five city study. The completion of the study would enable government to proceed with an application for approximately US$120 million for wastewater infrastructure within three cities. He gave a brief recap on a process that preceded the PPTA contract signing mentioned that the inputs from the contractor would be over an eight-month period between now and November 2012. Budget represents counterpart cost for promotion expenses given complementation scheme thus cost sharing with partner agencies on available education materials, resource persons, campaign activities and community education on waste management. Training of community partners on sanitation and environmental awareness is done in coordination with other agencies, thereby reducing cost to the project. The indicative budget below does not cover cost of an action plan that shall be developed with partners. Budget for a joint plan may have to be allocated from regular funds. Funds will be utilized on activities - such as public awareness activities are budgeted for the preparation of DED same time or after specified when the city will initiate activities related to hygiene and sanitation public awareness related associated WWTP. Sources of funds can
TA 7993 - INO: Metropolitan Sanitation Management Investment Project – MSMIP 338
Draft Final Report
be budgeted by project funds and funds budgeted for the city Sanitation Working Group. As an illustration is the amount of funds used for years 2013 to 2014.see Annex Document I. 3: Table 4: Indicative Budget Public Awareness Campaign MSMI Project MSMIP Public Awareness Campaign Analysis
1. It is recommended to include Palembang, Pekanbaru and Cimahi in Sanitation Program of Indii WWMP but not for Makassar, since this city is not listed in TOR. For Jambi, it is prepared outside Indii. Promotional activities on sanitation to the said 3 cities are divided into several stages covering in total 20 years, i.e.: the fist 5-year stage, and the second 5-year stage and the final 10-year stage. The first stage is preparation to instill understanding to the communities and notably to the target residents to arouse their awareness on the project. They need to know the Phase of Program Preparation , Phase of Socialization Preparation, Phase of Activity Planning, Phase of Physical Implementation, Phase of Post-Implementation. During this stage it is important to establish a local communal facility management organization as part of phase of Program Preparation. Indeed the communities must be involved since the very beginning stage of project through such organization.
2. Ensuring the operation and maintenance of an effective facility and the continuation
of the source of funds for the operation and maintenance of facilities must have been carried out since preparation stage. It is a crucial stage. During this stage, materials, inputs for software provision before entering socialization stage and the next following stages must have been put in place.
3. Approaching women and providing greater opportunities for them to become
community leaders and developing the provision of support should be initiated in preparation stage. Women can facilitate in creating sustainable program and activities in the society. They can provide inputs to their husbands in decision making and active in health promotion activities for their families.
4. Materials for public awareness campaign in WWTP are mainly taken from CSS (City
Sanitation Strategy) produced by urban sanitation working group Volume 5 concerning Sanitation Marketing and Community Participation in Sanitation Sector. CSS (City Sanitation Strategy) is an instrument to improve the planning and implementation of sanitation activities in attempting to reach the goals of city sanitation development. In broader context, SCC is significant step to pursuing targets set in national Millennium Development Goals (MDGs) notably the Target 10: Halve, by 2015, the proportion of people without sustainable access to safe drinking water and basic sanitation with indicators: a) Proportion of population with sustainable access to an improved water source,
urban and rural; b) Proportion of population with access to improved sanitation, urban and rural;
5. Volume 5 of CSS presents general strategies for awareness campaign, hygience
promotion and community participation. These strategies include assessment of main issues and opportunities and targets to improve communication, concerns/awareness and participation of communities and gender mainstreaming in sanitation planning and management. Poor environment quality either in wastewater management, solid waste or drainage, are primarily attributed to behavior, which is not in favor to stakeholders, either as the users of sanitation, the government as facility providers and DPRD as policy makers. This unfavorable behavior may be due to lack of

TA 7993 - INO: Metropolitan Sanitation Management Investment Project – MSMIP 339
Draft Final Report
knowledge and awareness on good environmental management or other interests impeding santionation sector as a top priority, in addition to the absence of adequate facilities and infrastructure to support healthy sanitation.
6. CSS has been the basis or source of information for the preparation onf public
awareness master plan in three cities of MSMIP (e.g. Pekanbaru, Palembang and Cihami) under Indii. Actually it also covers Kota Jambi and Makassar but for Makassar it is more specifically focused on activities implemented in the field through Community Awareness/ Public Health Campaign Kota Makassar, South Sulawesi province 2012 aiming to plan, implement CA/PH program of Kota Makassar i.e. to enhance the awareness and concern of communities on the importance of Hygienic and Clean Behavior. They serve also as reference and manual in planning and implementing hygienic and healthy life, sanitation socialization and marketing especially on wastewater. To enhance public health rate with the monitoring and development of communal WWTP coupled with sustainable operation and maintenance. The abovementioned public awareness campaings will be carried out by sanitation working group together with government agencies such as Health Agency, Cleaning Agency, Environment Agency, Education Agency including Non-Government Organizations (NGOs) and community based organizations. However during field visit it is revealed that the said campaign is not yet carried out sastifactorily, not yet reaches overal social components. To support public awareness campaign on sanitation, there are a lot of potentials that can be further developed. Sanitation working group should identify such potentials of either financial capacity, skills, institutions, culture and local arts or other activities beyond sanitation sector.
7. Timeline Public awareness campaign will be carried out throughout project life. The
five-year project will have four phases: a) Planning for social marketing of sanitation b) Initial advocacy and social marketing at construction phase c) Capacity development, demonstration projects and mid-term evaluation d) Scaling-up throughout the five cities & final evaluation (3 years) This timeline has been set out in public awareness campaing work plan for 2012 – 2013 (the first year of WWTP construction) and 2014-2016 when Medium term implementation scenarios will be prepared. The long-term implementation scenarios (2014-2010) will be also formulated. This closely relates to the said work plans that in 2013 Inventory of implementation activities, 2012 – 2013, Public Awareness Campaign implementation progress monitoring and inventory of ongoing MSMIP ativities, needs and opportunities assessment will be made. The results will be used as basis for the preparation of MSMIP city plan covering 20 years period, i.e. the fist 5-year stage, the second 5-year stage and the final 10-year stage (see annex Public Awareness Compaign Work Plan).
Budget prepared for this activities covers for one year period. Actually for activities under sanitation working group, their budget has been allocated in APBD Kota. (e.g. in RPJM Kota). However at the Government’s advise, APBD should only allocate 20% of total budget for sanitation activities. Sanitation promotion activities may be funded by APBN or project assistance. It is only a general description for 5 cities of MSMIP in public awareness campaigns. For individual city, it is dependent on budget that can be allocated by the city concerned, its financial capacity and support of project.

TA 7993 - INO: Metropolitan Sanitation Management Investment Project – MSMIP 340
Draft Final Report
X. Implementation Arrangements A. Proposed Institutional Arrangements for Project Implementation 1. Implementation Arrangements
The Ministry of Public Works, Directorate General for Human Settlements (DGHS) is the Executing Agency for the MSMIP. DGHS will establish a central project management unit (CPMU) composed of technical and administrative staff from Directorate of Environmental and Sanitation Development (DESD). The CPMU will likely be headed by a Senior Officer of the DESD. See Figure X-A 1.
Figure X-A 1. Organization of the Executing Agency
MINISTRY OF PUBLIC WORKS
Director General for
HighwaysDirector General for
Spatial Planning
Director General for
Water Resources
Director General for
Human Settlements
Construction
Development Agency
Research and
Development Agency
Directorate of Building
Structure and
Environment
Directorate of Bina
Program
Directorate of Water
Supply Development.
Directorate of
Environmental and
Sanitation Development
CPMU
Directorate of Settlement
Development
PROVINCE - SATKER
PPIU/PPMUCITY - LPMU/SKPD
At the regional level, two units will work jointly to manage and implement the project, the SATKER as the Provincial Project Implementation Unit (PPIU) and the city Local Project Management Unit (LPMU). There are two models being considered, namely Model 1 where the SATKER as the PPIU, is the key implementing agency, and Model 2 where the city LPMU is the key implementing agency. a. Model 1 ( SATKER) for Cimahi, Jambi, Makassar and Pekanbaru Under this arrangement, DGHS plays an active role in providing technical supervision and responsibility over the investment (the Satuan Kerja or SATKER model). The PPIU or the SATKER comprises full time staff detailed from DGHS to the provinces to implement specific projects of DGHS. The projects in the four cities above will be implemented through the SATKER in their respective provinces as shown in Figure X-A 2.

TA 7993 - INO: Metropolitan Sanitation Management Investment Project – MSMIP 341
Draft Final Report
Figure X-A 2. Project Organization through the SATKER
CPMU
West Java Province
PPMU/PPIU-
SATKER
LPMU/SKPD-
Cimahi City
Jambi Province
PPMU/PPIU-
SATKER
LPMU/SKPD-
Jambi City
South Sulawesi
Province
PPMU/PPIU-
SATKER
LPMU/SKPD-
Makassar City
South Sumatera
Province
PPMU/PPIU-
SATKER
LPMU/SKPD-
Palembang City
Riau Province
PPMU/PPIU-
SATKER
LPMU/SKPD-
Pekanbaru City
While the SATKER is the key implementation unit in the field, substantial involvement of the city government is needed. For this reason, a Local Project Management Unit (LPMU) will be created in each city. The LPMU will be included in relevant training to provide them with capacity to gradually absorb project more planning, implementation and monitoring responsibilities in the future. See Figure X-A 3 for project implementation arrangements under Model 1 – SATKER Model.

TA 7993 - INO: Metropolitan Sanitation Management Investment Project – MSMIP 342
Draft Final Report
Figure X-A 3. Project Implementation Arrangements – SATKER MODEL
DGHS
(Executing Agency)
Central Steering
Commitee
Central Project
Management Unit
(CPMU)
Central Project
Implementation Unit (CPIU)
/ Satker Pusat
Central Support team
(CST) a
Provincial Project
Management Unit
(PPMU)
Provincial Project
Implementation Unit
(PPIU) / Satker Provinsi
Provincial Support team
(PST) a
Local Support team
(LST) a
Local Project Management
Unit
(LPMU)
Local Project
Implementation Unit
(LPIU) / SKPD
Dinas Provinsi b
Implementing Agency
Provincial Steering
Committee (CWSG, various
Dinas Provinsi )
Dinas Kota c
(Implementing Agency ABPD-
Kota)
City Sanitation Working
Group
(CSWG)
(chair: DGHS)
(chair: BAPPEDA-Prov.)
(chair: deputy mayor)
National Level
Provincial Level
City Level
Consultant Support
a Support teams consist of consultants for: (i) project implementation support,
and (ii) institutional development and capacity buildingb
Provincial Governmentc City Government
Supervision, guidance
reporting
The responsibilities of each of the implementing units are discussed in Table X-A 1 below.

TA 7993 - INO: Metropolitan Sanitation Management Investment Project – MSMIP 343
Draft Final Report
Table X-A 1: Implementation Responsibilities
Unit General Functions and Responsibilities Consultants Support149
Central Steering Committee (National Coordination Agency)
� Acts as the Steering Committee of the Project
� Monitors compliance with the provisions of the External Loan Agreement
Central Project Management Unit (CPMU) (Directorate of Environmental and Sanitation Development (DESD or PPLP)
� Takes responsibility for implementation of MSMIP in project cities
� Supervises activities of the PPIU � Prepares and reviews all the external
reports of the Project � Liaises and coordinates with the
External Lending Agency
Central Support Team � Provide technical, managerial
and training support to the CPMU and CPIU
Central Project Implementation
Unit (CPIU)
� Coordinates with various central government agencies / offices
Provincial Project Management
Unit (PPMU)
� Coordinates with various offices (dinas) in the provincial level
Provincial Support Team � Provide technical, managerial
and training support to the PPIU and PPMU
Provincial Project Implementation Unit (PPIU) (SATKER)
� Takes full responsibility for the planning and implementation of all aspects and components of the Project in the city
� Undertakes project‐city procurement
activities � Closely monitors construction
progress. � Provides contract supervision.
Local Project Management Unit (LPMU)
� Sets project policies in accordance with the SLA and GFA in coordination with the POKJA and UPTD
� Monitors implementation of the project for the Cities
� Coordinates the needed local inputs and resources
� Reviews regularly Progress Reports on the Project
Local Support Team � Provide technical, managerial
and training support to the LPMU and SKPD
Satuan Kerja Perangkat Daerah (SKPD)
� Coordinates with city government offices in the implementation of the project.
149 Comprises the Project Implementation Support Consultants (PISC) and the Capacity Development Technical Assistance (CDTA)
Consultants

TA 7993 - INO: Metropolitan Sanitation Management Investment Project – MSMIP 344
Draft Final Report
Consultants Support Comprise the Project Implementation Support Consultants and the Capacity Development Technical Assistance or CDTA Consultants. The Central Project Consultants comprise the following:
• PISC funded by ADB loan (for Cimahi, Makassar, Jambi and Pekanbaru) • PISC funded by INDII (for Palembang) • CDTA Consultants funded by ADB grant for Cimahi, Makassar, Jambi and
Pekanbaru. • DED Consultants funded and hired by INDII (for CImahi, Makassar, Palembang and
Pekanbaru) • DED Consultants funded and hired by the central government (for Jambi) • DED for connection network funded and hired by the city government except
Palembang • Capacity Development Consultants for Palembang
The PISC consultants will provide overall project management support including procurement and construction supervision in their respective cities. It is their responsibility to ensure that activities are coordinated and synchronized to ensure that project objectives are met. Detailed engineering design will be done by another set of consultants as discussed above. b. Model 2 (PEMKO) for Palembang Under a pilot initiative to reinforce project ownership and local autonomy, the Palembang city government will be the IA, instead of the Provincial SATKER as in other cities. In Palembang, the city-owned water company (PDAM) already manages several water treatment plants and has the capacity to implement its subproject. See Figure X-A 4 for the implementation arrangements and Table X-A 2 for general functions and responsibilities under the proposed model.

TA 7993 - INO: Metropolitan Sanitation Management Investment Project – MSMIP 345
Draft Final Report
Figure X-A 4. Project Implementation Arrangements – PEMKO Model
DGHS
(Executing Agency)
Central Steering
Commitee
Central Project
Management Unit
(CPMU)
Central Project
Implementation Unit (CPIU)
/ Satker Pusat
Central Support team
(CST) a
Provincial Project
Management Unit
(PPMU)
Provincial Project
Implementation Unit
(PPIU) / Satker Provinsi
Provincial Support team
(PST) a
Local Support team
(LST) a
Local Project Management
Unit
(LPMU)
Local Project
Implementation Unit
(LPIU) / SKPD
Dinas Provinsi b
Implementing Agency
Provincial Steering
Committee (CWSG, various
Dinas Provinsi )
Dinas Kota c
(Implementing Agency ABPD-
Kota)
City Sanitation Working
Group
(CSWG)
(chair: DGHS)
(chair: BAPPEDA-Prov.)
(chair: deputy mayor)
National Level
Provincial Level
City Level
Consultant Support
a Support teams consist of consultants for: (i) project implementation support,
and (ii) institutional development and capacity buildingb
Provincial Governmentc City Government
Supervision, guidance
reporting
coordination

TA 7993 - INO: Metropolitan Sanitation Management Investment Project – MSMIP 346
Draft Final Report
Table X-A 2: Implementation Responsibilities
Unit General Functions and Responsibilities Consultants Support150
Central Steering Committee (National Coordination Agency)
� Acts as the Steering Committee of the Project
� Monitors compliance with the provisions of the External Loan Agreement
Central Project Management Unit (CPMU) (Directorate of Environmental and Sanitation Development (DESD or PPLP)
� Takes responsibility for implementation of MSMIP in project cities
� Supervises activities of the PPIU � Prepares and reviews all the external
reports of the Project � Liaises and coordinates with the External
Lending Agency
Central Support Team � Provide technical, managerial
and training support to the CPMU and CPIU.
Central Project Implementation Unit (CPIU)
� Coordinates with various central government agencies / offices
Provincial Project Management Unit (PPMU)
� Coordinates with various offices (dinas) in the provincial level
Provincial Support Team � Provide technical, managerial
and training support to the PPMU and PPIU.
Provincial Project Implementation Unit (PPIU) (SATKER)
� Provides guidance to the LPMU in the planning and implementation of all aspects and components of the Project in the city.
Local Project Management Unit (LPMU)
� Takes full responsibility for the planning and implementation of all aspects and components of the Project in the city
� Undertakes project‐city procurement activities
� Coordinates with the SATKER as needed � Closely monitors construction progress. � Provides contract supervision � Coordinates with the POKJA to set
project policies in accordance with the SLA and GFA.
� Coordinates with the POKJA for construction permits, AMDAL (EIA), etc.
� Monitors implementation of the project in the city and coordinates the needed local inputs and resources
� Reviews regularly Progress reports on the Project.
Local Support Team � Provide technical, managerial
and training support to the LPMU and SKPD.
Satuan Kerja Perangkat Daerah (SKPD)
� Coordinates with city government offices in the implementation of the project.
150 Comprises the Project Implementation Support Consultants (PISC) and the Capacity Development Technical Assistance (CDTA)
Consultants

TA 7993 - INO: Metropolitan Sanitation Management Investment Project – MSMIP 347
Draft Final Report
Priority Action151 Priority action for the cities in preparation for project implementation is as follows:
a. Finalize arrangements for the designation of the CPMU and SATKER to supervise and monitor implementation (procurement, project planning and monitoring, project supervision, reporting, project accounts, etc)
b. Organise UPTD as the local project management unit in the city. c. Appoint Director and key staff of CPIU. d. Identify office space, equipment, furniture for the CPIU. e. Familiarise with project management policies, systems, procedures and other
requirements of external funding agency, GOI and local stakeholders. f. Identify the management and reporting requirements of the project. g. Identify the relevant project management guidelines or manuals to be used. h. Conduct training activities. i. Prepare a public information plan to keep residents informed of the progress of
project. The cities have designated their respective LPMUs as shown in Table X-A 3.
Table X-A 3: Designated City LPMUs
CITY LPMU 1. Cimahi DKP 2. Jambi DKPP 3. Makassar DPU 4. Palembang DPU 5. Pekanbaru DPU
The LPMU will coordinate closely with the POKJA and the UPTD or the proposed wastewater department of PDAM, in the case of Palembang. This way, the UPTD and the PDAM also becomes involved in the project in the early stages and develops a sense of ownership over the project. The implementation arrangement for each city includes provisions for environmental management and resettlement. See city reports in Annex Document H6 to H11.
151 These tasks are discussed in the Final Capacity Building Report (LIDAP and FOPIP), Package 3, September 2011 .

TA 7993 - INO: Metropolitan Sanitation Management Investment Project – MSMIP 348
Draft Final Report
B. Implementation Plan
1 2 3 4 1 2 3 4 1 2 3 4 1 2 3 4 1 2 3 4 1 2 3 4
Loan negotiation
Loan signing
Loan effectivity
Subproject Investments (for 5 Cities)
Main Works
Detailed engineering design (Grant)
Land acquisition and involuntary resettlement
Compensation for the WCS
Prequalification and bidding
Awarding of contracts
Construction of civil works
Waste Water Treatment Works
Trunk Sewers
Main Sewers
Storm Water Drainage
Laterals and Interceptors
Property Connections
Detailed engineering design
Prequalification and bidding
Awarding of contracts
Construction of civil works
Project Implementation Support
Prequalification, selection of consultants
Awarding of contract
Implementation support and benefit monitoring
Capacity Development and Technical Assistance
Prequalification, selection of consultants
Awarding of contract
Conduct of workshops and seminars
WCS/ WWTW LATERALS
2013 2014 2015 2016 2017 2018

TA 7993 - INO: Metropolitan Sanitation Management Investment Project – MSMIP 349
Draft Final Report
C. Investment and Financing Plan
Indonesian
Asian Development Infrastructure Republic of
ADB - OCR Loan ADB - AIF Loan Bank - Grant Initiative Indonesia Local Government Total
Amount % Amount % Amount % Amount % Amount % Amount % Amount %
A. Cimahi
Waste Water Treatment Works 8.42 57.5 4.15 28.3 - - 0.61 4.2 1.46 10.0 - - 14.65 5.9
Waste Water Collection System 3.44 54.5 1.63 25.8 - - 0.25 4.0 0.99 15.7 - - 6.32 2.6
Property Connections - - - - - - - - 0.30 10.0 2.74 90.0 3.05 1.2
Land Acquisition - - - - - - - - - - 0.07 100.0 0.07 -
Involuntary Resettlement - - - - - - - - - - 0.05 100.0 0.05 -
Subtotal 11.87 49.2 5.78 24.0 - - 0.86 3.6 2.76 11.5 2.85 11.8 24.13 9.8
B. Jambi
Waste Water Treatment Works 7.17 57.5 3.53 28.3 - - - - 1.77 14.2 - - 12.47 5.0
Waste Water Collection System 8.01 54.5 3.79 25.8 - - - - 2.89 19.7 - - 14.69 5.9
Property Connections - - - - - - - - 1.49 12.6 10.29 87.4 11.77 4.8
Land Acquisition - - - - - - - - - - 0.58 100.0 0.58 0.2
Involuntary Resettlement - - - - - - - - - - 0.13 100.0 0.13 0.1
Subtotal 15.18 38.3 7.33 18.5 - - - - 6.14 15.5 10.99 27.7 39.64 16.0
C. Makassar
Waste Water Treatment Works 8.08 57.5 3.98 28.3 - - 0.58 4.1 1.40 10.0 - - 14.04 5.7
Waste Water Collection System 17.95 54.4 9.09 27.6 - - 1.31 4.0 4.63 14.0 - - 32.97 13.3
Property Connections - - - - - - - - 1.13 10.0 10.21 90.0 11.34 4.6
Land Acquisition - - - - - - - - - - 1.91 100.0 1.91 0.8
Involuntary Resettlement - - - - - - - - - - 0.43 100.0 0.43 0.2
Subtotal 26.03 42.9 13.07 21.5 - - 1.89 3.1 7.16 11.8 12.55 20.7 60.69 24.6
D. Palembang
Waste Water Treatment Works - - - - - - 12.96 90.0 1.44 10.0 - - 14.41 5.8
Waste Water Collection System - - - - - - 20.23 90.0 2.25 10.0 - - 22.47 9.1
Property Connections - - - - - - 10.90 90.0 1.21 10.0 - - 12.11 4.9
Land Acquisition - - - - - - - - - - 2.33 100.0 2.33 0.9
Involuntary Resettlement - - - - - - - - - - 0.60 100.0 0.60 0.2
Subtotal - - - - - - 44.09 84.9 4.90 9.4 2.93 5.7 51.92 21.0
E. Pekanbaru
Waste Water Treatment Works 8.96 57.5 4.41 28.3 - - - - 2.20 14.1 - - 15.57 6.3
Waste Water Collection System 9.06 54.5 4.29 25.8 - - - - 3.28 19.7 - - 16.64 6.7
Property Connections - - - - - - - - 1.02 10.0 9.14 90.0 10.15 4.1
Land Acquisition - - - - - - - - - - 1.62 100.0 1.62 0.7
Involuntary Resettlement - - - - - - - - - - 0.44 100.0 0.44 0.2
Subtotal 18.02 40.6 8.70 19.6 - - - - 6.50 14.6 11.19 25.2 44.41 18.0
G. Project Implementation Support - ADB
Consultant 6.78 57.2 3.89 32.8 - - - - 1.19 10.0 - - 11.87 4.8
Equipment and Vehicles 0.19 57.0 0.11 33.0 - - - - 0.03 10.0 - - 0.34 0.1
Operations 1.91 57.0 1.10 33.0 - - - - 0.33 10.0 - - 3.35 1.4
Subtotal 8.88 57.1 5.11 32.9 - - - - 1.55 10.0 - - 15.55 6.3
H. Project Implementation Support - INDII - - - - - - 2.00 90.0 0.22 10.0 - - 2.22 0.9
I. Capacity Development & Technical Assistance
Consultants - - - - 1.36 90.0 - - 0.15 10.0 - - 1.51 0.6
Trainings and Workshops - - - - 0.21 90.0 - - 0.02 10.0 - - 0.24 0.1
Equipment and Vehicles - - - - 0.02 90.0 - - 0.00 10.0 - - 0.02 -
Operations - - - - 0.41 90.0 - - 0.05 10.0 - - 0.46 0.2
Subtotal - - - - 2.00 90.0 - - 0.22 10.0 - - 2.22 0.9
J. Increased Awareness on Hygiene and Sanitation
IEC Materials 0.02 55.0 0.02 35.0 - - - - 0.00 10.0 - - 0.05 -
Planning and Implementation - - - - - - - - 0.43 100.0 - - 0.43 0.2
Subtotal 0.02 5.3 0.02 3.4 - - - - 0.43 91.4 - - 0.47 0.2
Total PROJECT COSTS 80.00 33.2 40.00 16.6 2.00 0.8 48.83 20.2 29.90 12.4 40.52 16.8 241.25 97.6
Interest During Implementation - - - - - - - - 5.67 100.0 - - 5.67 2.3
Commitment Charges - - - - - - - - 0.21 100.0 - - 0.21 0.1
Total Disbursement 80.00 32.4 40.00 16.2 2.00 0.8 48.83 19.8 35.79 14.5 40.52 16.4 247.14 100.0 ADB = Asian Development Bank, AIF = ASEAN Infrastructure Fund, AusAID – Australian Aid for International Development, INDII = Indonesian Infrastructure Initiative.

TA 7993 - INO: Metropolitan Sanitation Management Investment Project – MSMIP 350
Draft Final Report
D. Procurement Plan 1. Advance Contracting and Retroactive Financing All advance contracting and retroactive financing will be undertaken in conformity with ADB’s Procurement Guidelines (201077, as amended from time to time) and ADB’s Guidelines on the Use of Consultants (April 201078, as amended from time to time). The issuance of invitations to bid under advance contracting and retroactive financing will be subject to ADB approval. The Borrower has been advised that approval of advance contracting and retroactive financing or “no objection” issued by the ADB with regard to the procedures, documentation, or proposal for award does not commit ADB to finance or make a loan for the Project. The EA will advertise all consulting opportunities in Consulting Services Recruitment Notice at www.adb.org. The borrower may wish to proceed, with ADB’s approval, the selection (though not contracting) of consultants before the loan agreement is signed. In such cases, the selection procedures shall be in accordance with these guidelines, and ADB shall review the process used by the borrower. The Borrower agreed to take advance action in recruiting the PISC Consultants to speed-up the project implementation. ADB will not finance any expenditures paid by the Government of Indonesia before the grant and loan are approved by the ADB’s Board of Directors. ADB’s concurrence with advance actions does not commit ADB to finance the related expenditures under the Project or to finance the Project. Detailed Engineering Design (DED) consultants will be engaged during the 4th Quarter 2013 but will be financed through a grant so the procurement of DED consulting services will not be a concern of this loan agreement. 2. Procurement of Works and Consulting Services All procurement of Works will be in accordance with ADB’s Procurement Guidelines (2010), as amended from time to time. Civil Works will be procured through International Competitive Bidding (ICB) procedures for packages exceeding $10.0M equivalent. Goods will not be procured separately as these shall be included in the procurement of civil works. National Competitive Bidding (NCB) procedures acceptable to ADB will be used to procure Civil Works up to their respective thresholds. Packages amounting to the equivalent of $100,000 or less may be procured through Shopping.79 Note – in the event that any of the sewerage system construction packages are to be split into smaller packages, the split should be solely on a geographical area basis. A Procurement Capacity Assessment (PCA) of the four SATKERs80 was undertaken by the PPTA Consultant. The PCA identified particular risks related to the SATKERs’ procurement capacity in terms of (i) organization and staff capacity; (ii) information management; (iii) procurement practices; (iv) effectiveness; and (v) accountability measures.
77 ADB. 2010. ADB Procurement Guidelines. Manila
78 ADB. 2010. Guidelines on The Use of Consultants by Asian Development Bank and Its Borrowers. Manila
79 Presidential Decree No. 70/2012 (New Procurement Law)
80 The PCA was conducted for the following SATKERs (Provincial units of DGHS): West Java Province for Cimahi; Jambi Province for Jambi; South Sulawesi Province for Makassar; and Riau Province for Pekanbaru.

TA 7993 - INO: Metropolitan Sanitation Management Investment Project – MSMIP 351
Draft Final Report
Overall, the conclusions of the PCA can be summarized as follows: (i) policies and guidelines for the implementation of procurement activities are in place under Presidential Regulation 54/2010 and as amended by Presidential Regulation 70/2012; (ii) all of the four SATKERs have existing procurement service units that have been performing procurement functions for the agency; (iii) while the teams possess considerable experience with locally-funded projects, they lack experience with externally-funded projects including ADB-funded projects; and, (iv) support to the SATKER procurement teams will be essential such as provision of training on ADB procurement processes and the support of the Project Consultant to facilitate actual implementation of the proposed MSMIP procurement plans. The assessment rated the overall risk associated with procurement for the Project as Average. It has recommended a series of risk mitigation measures to be adopted in the short and medium term. Before the start of any procurement, ADB and the Government will review the public procurement laws of the Central and State Governments to ensure consistency with ADB’s Procurement Guidelines. A Procurement Plan will be prepared by the borrower and submitted to the ADB as part of the preparation of the project covering the procurement of works, goods, and recruitment of consulting services required to carry out the project during the initial period of at least 18 months. The contents of this Procurement Plan will comply with the ADB Guidelines. All consultants will be recruited according to ADB’s Guidelines on The Use Consultants (April 2010). The Terms of Reference for all Consulting Services are detailed in Section D. Consulting Services will include International and National expert inputs. ADB and INDII Consultants will be selected through Quality and Cost-Based Selection (QCBS) procedures with a standard quality:cost ratio of 90:10. GOI Consultants will be selected through Quality Based Selection (QBS). 3. Procurement Plan
Basic Data
Project Name: Metropolitan Sanitation Management Investment Project – PPTA Country: Indonesia Executing Agency: Ministry of Public Works Loan Amount: $120.0 M Loan (Grant) Number: ADB TA 7993-IND Date of First Procurement Plan: Dec 2012 Date of this Procurement Plan: August 2013
a. Process Thresholds, Review, and 18-Month Procurement Plan i. Project Procurement Thresholds Except as the Asian Development Bank (ADB) may otherwise agree, the following process thresholds shall apply to procurement of Works.
Procurement of Works
Methods Threshold
International Competitive Bidding (ICB) for Works Above $10,000,000 National Competitive Bidding (NCB) for Works $10,000,000 or Less Shopping for Works Up to $100,000
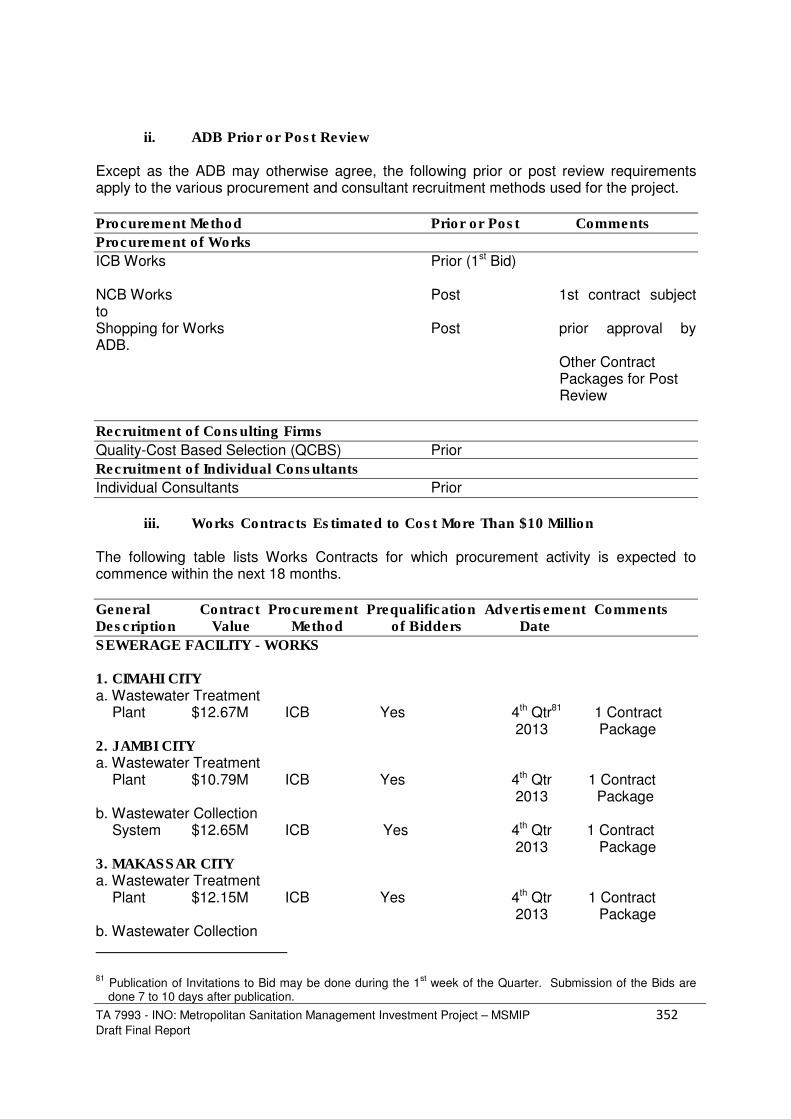
TA 7993 - INO: Metropolitan Sanitation Management Investment Project – MSMIP 352
Draft Final Report
ii. ADB Prior or Post Review Except as the ADB may otherwise agree, the following prior or post review requirements apply to the various procurement and consultant recruitment methods used for the project.
Procurement Method Prior or Post Comments
Procurement of Works
ICB Works Prior (1st Bid) NCB Works Post 1st contract subject to Shopping for Works Post prior approval by ADB. Other Contract Packages for Post Review
Recruitment of Consulting Firms
Quality-Cost Based Selection (QCBS) Prior
Recruitment of Individual Consultants
Individual Consultants Prior
iii. Works Contracts Estimated to Cost More Than $10 Million The following table lists Works Contracts for which procurement activity is expected to commence within the next 18 months.
General Contract Procurement Prequalification Advertisement Comments Description Value Method of Bidders Date
SEWERAGE FACILITY - WORKS 1. CIMAHI CITY a. Wastewater Treatment Plant $12.67M ICB Yes 4th Qtr81 1 Contract 2013 Package 2. JAMBI CITY a. Wastewater Treatment Plant $10.79M ICB Yes 4th Qtr 1 Contract 2013 Package b. Wastewater Collection System $12.65M ICB Yes 4th Qtr 1 Contract 2013 Package 3. MAKASSAR CITY a. Wastewater Treatment Plant $12.15M ICB Yes 4th Qtr 1 Contract 2013 Package b. Wastewater Collection
81 Publication of Invitations to Bid may be done during the 1
st week of the Quarter. Submission of the Bids are
done 7 to 10 days after publication.

TA 7993 - INO: Metropolitan Sanitation Management Investment Project – MSMIP 353
Draft Final Report
System $28.36M ICB Yes 4th Qtr 1 Contract 2013 Package 4. PALEMBANG CITY a. Wastewater Treatment Plant $11.98M ICB Yes 4th Qtr 1 Contract 2013 Package b. Wastewater Collection System $18.53M ICB Yes 4th Qtr 1 Contract 2013 Package 5. PEKANBARU CITY a. Wastewater Treatment Plant $13.47M ICB Yes 4th Qtr 1 Contract 2013 Package b. Wastewater Collection System $14.30M ICB Yes 4th Qtr 1 Contract 2013 Package
iv. Consulting Services Contracts Established to Cost More Than $1,000,000 The following table lists Consulting Services Contracts for which procurement activity is expected to commence within the next 18 months. ( ) indicates the organisation responsible for funding/procurement.
General Contract Recruitment Advertisement International Comments Description Value Method Date or National (Qtr/Yr) Assignment
1. JAMBI CITY Detailed Eng’g $1.08M QBS 4th Qtr All Bidders to Design (GoI) 2013 be prequalified 2. MAKASSAR CITY Detailed Eng’g $1.86M QCBS 4th Qtr All Bidders to Design (IndII) 2013 be prequalified 3. PALEMBANG CITY Detailed Eng’g $2.32M QCBS 4th Qtr All Bidders to Design (IndII) 2013 be prequalified Construction $1.35M QCBS 4th Qtr All Bidders to Supervision (IndII) be prequalified 4. PEKANBARU CITY Detailed Eng’g $1.28M QBS 4th Qtr All Bidders to Design (GoI) 2013 be prequalified 5. Project Implmt’n $2.04M QCBS 4th Qtr All Bidders to IndII82 Support 2013 be prequalified Consultants83 PISC (IndII)
82 Indonesian Infrastructure Initiative

TA 7993 - INO: Metropolitan Sanitation Management Investment Project – MSMIP 354
Draft Final Report
6. Project Implmt’n $14.80M QCBS 4th Qtr 1,288 PMs All Bidders to ADB Support Consultants, 2013 215 PMs Int’l be prequalified PISC (ADB) 1,073 PMs Nat’l Central Support Team – Jakarta Team Leader (Int’l) 16 PMs Inttermittent Deputy Team Leader (Nat’l) 48 PMs Continuous Mechanical Engineer (Int’l) 3 PMs Intermittent Electrical Engineer (Int’l) 3 PMs Intermittent Wastewater Treatment Process Engineer (Int’l) 6 PMs Intermittent Civil Engineer, Sewerage/Drainage (Int’l) 4 PMs Intermittent Civil Structural Engineer (Int’l) 3 PMs Intermittent Contract Specialist (Int’l) 3 PMs Intermittent QA/QC Specialist (Int’l) 3 PMs Intermittent Gender/Social Development Specialist (Int’l) 4 PMs Intermittent Environmental Specialist (Int’l) 2 PMs Continuous Social Safeguards/Resettlement Specialist (Int’l) 4 PMs Intermittent Benefit and Monitoring Specialist (Int’l) 4 PMs Intermittent Financial Management Specialist (Nat’l) 48 PMs Continuous Procurement Specialist (Nat’l) 6 PMs Intermittent MIS Specialist (Nat’l) 48 PMs Continuous Gender & Social Development Specialist (Nat’l) 8 PMs Intermittent City Supervision Team – For Cimahi City Office Leader – Sewerage/Drainage Const. Suprvsr. (Int’l) 36 PMs Intermittent Construction Supervisor – WWTP (Nat’l) 38 PMs Intermittent Civil Structural Engineer (Nat’l) 18 PMs Intermittent Civil Engineer, Sewerage/Drainage (Nat’l) 12 PMs Intermittent Geotechnical Specialist (Nat’l) 4 PMs Intermittent Mechanical Engineer (Nat’l) 5 PMs Intermittent Electrical Engineer (Nat’l) 4 PMs Intermittent Environmental Specialist (Nat’l) 6 PMs Intermittent Public Relations/Sanitation Marketing Specialists (2 Nat’l) 18 PMs Intermittent Health & Safety Coordinator (Nat’l) 38 PMs Intermittent Accounting Specialist (Nat’l) 38 PMs Intermittent Gender & Social Development Specialist (Nat’l) 4 PMs Intermittent Social Safeguards/Resettlement Specialist (Nat’l) 6 PMs Intermittent Benefit and Monitoring Specialist (Nat’l) 4 PMs Intermittent Sub-Professional Support Personnel: Drafting Support (Nat’l) 24 PMs Intermittent GIS Specialist Support (Nat’l) 6 PMs Intermittent Surveyor Support (Nat’l) 12 PMs Intermittent City Supervision Team – For Makassar City Office Leader – Sewerage/Drainage Const. Suprvsr. (Int’l) 36 PMs Intermittent Construction Supervisor – WWTP (Nat’l) 38 PMs Intermittent Civil Structural Engineer (Nat’l) 12 PMs Intermittent Civil Engineer, Sewerage/Drainage (Nat’l) 12 PMs Intermittent Geotechnical Specialist (Nat’l) 3 PMs Intermittent Mechanical Engineer (Nat’l) 3 PMs Intermittent
83 PISC For Palembang

TA 7993 - INO: Metropolitan Sanitation Management Investment Project – MSMIP 355
Draft Final Report
Electrical Engineer (Nat’l) 2 PMs Intermittent Environmental Specialist (Nat’l) 6 PMs Intermittent Public Relations/Sanitation Marketing Specialists (2 Nat’l) 18 PMs Intermittent Health & Safety Coordinator (Nat’l) 38 PMs Intermittent Accounting Specialist (Nat’l) 38 PMs Intermittent Gender & Social Development Specialist (Nat’l) 4 PMs Intermittent Social Safeguards/Resettlement Specialist (Nat’l) 6 PMs Intermittent Benefit and Monitoring Specialist (Nat’l) 4 PMs Intermittent Sub-Professional Support Personnel: Drafting Support (Nat’l) 24 PMs Intermittent GIS Specialist Support (Nat’l) 6 PMs Intermittent Surveyor Support (Nat’l) 12 PMs Intermittent City Supervision Team – For Jambi City Office Leader – Sewerage/Drainage Const. Suprvsr. (Int’l) 36 PMs Intermittent Construction Supervisor – WWTP (Nat’l) 38 PMs Intermittent Civil Structural Engineer (Nat’l) 12 PMs Intermittent Civil Engineer, Sewerage/Drainage (Nat’l) 12 PMs Intermittent Geotechnical Specialist (Nat’l) 3 PMs Intermittent Mechanical Engineer (Nat’l) 3 PMs Intermittent Electrical Engineer (Nat’l) 2 PMs Intermittent Environmental Specialist (Nat’l) 6 PMs Intermittent Public Relations/Sanitation Marketing Specialists (2 Nat’l) 18 PMs Intermittent Health & Safety Coordinator (Nat’l) 38 PMs Intermittent Accounting Specialist (Nat’l) 38 PMs Intermittent Gender & Social Development Specialist (Nat’l) 4 PMs Intermittent Social Safeguards/Resettlement Specialist (Nat’l) 6 PMs Intermittent Benefit and Monitoring Specialist (Nat’l) 4 PMs Intermittent Sub-Professional Support Personnel: Drafting Support (Nat’l) 24 PMs Intermittent GIS Specialist Support (Nat’l) 6 PMs Intermittent Surveyor Support (Nat’l) 12 PMs Intermittent Sewerage Design Engineer (Int’l)84 6 PMs Continuous Wastewater Treatment Process Engineer (Int’l)85 2 PMs Continuous City Supervision Team – For Pekanbaru City Office Leader – Sewerage/Drainage Const. Suprvsr. (Int’l) 36 PMs Intermittent Construction Supervisor – WWTP (Nat’l) 38 PMs Intermittent Civil Structural Engineer (Nat’l) 12 PMs Intermittent Civil Engineer, Sewerage/Drainage (Nat’l) 12 PMs Intermittent Geotechnical Specialist (Nat’l) 3 PMs Intermittent Mechanical Engineer (Nat’l) 3 PMs Intermittent Electrical Engineer (Nat’l) 2 PMs Intermittent Environmental Specialist (Nat’l) 6 PMs Intermittent Public Relations/Sanitation Marketing Specialists (2 Nat’l) 18 PMs Intermittent Health & Safety Coordinator (Nat’l) 38 PMs Intermittent Accounting Specialist (Nat’l) 38 PMs Intermittent Gender & Social Development Specialist (Nat’l) 4 PMs Intermittent Social Safeguards/Resettlement Specialist (Nat’l) 6 PMs Intermittent
84 To review City DED designs only
85 To review City DED designs only

TA 7993 - INO: Metropolitan Sanitation Management Investment Project – MSMIP 356
Draft Final Report
Benefit and Monitoring Specialist (Nat’l) 4 PMs Intermittent Sub-Professional Support Personnel: Drafting Support (Nat’l) 24 PMs Intermittent GIS Specialist Support (Nat’l) 6 PMs Intermittent Surveyor Support (Nat’l) 12 PMs Intermittent Sewerage Design Engineer (Int’l)86 6 PMs Continuous Wastewater Treatment Process Engineer (Int’l)87 2 PMs Continuous v. Works Contracts Estimated to Cost $10 Million or Less, Goods Contracts Estimated to Cost $2 Million or Less, and Consulting Services Contracts to $1,000,000 or Less The following table groups smaller-value Works, Goods, and Consulting Services Contracts for which procurement activity is expected to commence within the next 18 months. ( ) indicates the organisation responsible for funding/procurement.
General Value of Number of Procurement/ Comments Description Contracts Contracts Recruitment Method
SEWERAGE FACILITY - WORKS 1. CIMAHI CITY Wastewater Collection $5.44M 1 NCB System SEWERAGE FACILITY – CONSULTING SERVICES 1. CIMAHI CITY Detailed Engineering $0.85M 1 QCBS Design (IndII)
b. Indicative List of Packages Required Under the Project The following table provides an indicative list of all procurement (goods, works, and consulting services) over the life of the project. Contracts financed by the Borrower and others should also be indicated, with an appropriate notation in the comments section. ( ) indicates the organisation responsible for funding/procurement.
General Estimated Estimated Procurement Domestic Comments Description Value Number of Method Preference Contracts Applicable
SEWERAGE FACILITY - WORKS 1. CIMAHI CITY a. Wastewater Treatment Plant $12.67M 1 ICB No
86 To review City DED designs only
87 To review City DED designs only
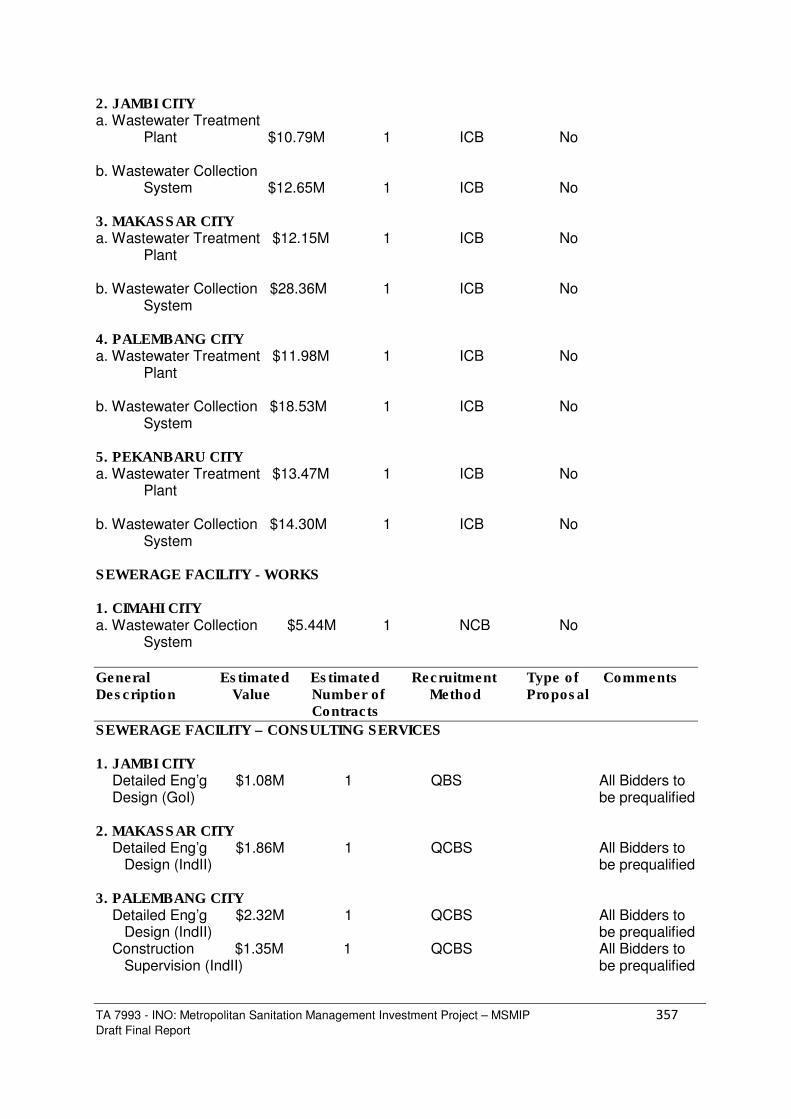
TA 7993 - INO: Metropolitan Sanitation Management Investment Project – MSMIP 357
Draft Final Report
2. JAMBI CITY a. Wastewater Treatment Plant $10.79M 1 ICB No b. Wastewater Collection System $12.65M 1 ICB No 3. MAKASSAR CITY a. Wastewater Treatment $12.15M 1 ICB No Plant b. Wastewater Collection $28.36M 1 ICB No System 4. PALEMBANG CITY a. Wastewater Treatment $11.98M 1 ICB No Plant b. Wastewater Collection $18.53M 1 ICB No System 5. PEKANBARU CITY a. Wastewater Treatment $13.47M 1 ICB No Plant b. Wastewater Collection $14.30M 1 ICB No System SEWERAGE FACILITY - WORKS 1. CIMAHI CITY a. Wastewater Collection $5.44M 1 NCB No System
General Estimated Estimated Recruitment Type of Comments Description Value Number of Method Proposal Contracts
SEWERAGE FACILITY – CONSULTING SERVICES 1. JAMBI CITY Detailed Eng’g $1.08M 1 QBS All Bidders to Design (GoI) be prequalified 2. MAKASSAR CITY Detailed Eng’g $1.86M 1 QCBS All Bidders to Design (IndII) be prequalified 3. PALEMBANG CITY Detailed Eng’g $2.32M 1 QCBS All Bidders to Design (IndII) be prequalified Construction $1.35M 1 QCBS All Bidders to Supervision (IndII) be prequalified

TA 7993 - INO: Metropolitan Sanitation Management Investment Project – MSMIP 358
Draft Final Report
4. PEKANBARU CITY Detailed Eng’g $1.28M 1 QBS All Bidders to Design (GoI) be prequalified 5. CIMAHI CITY Detailed Eng’g $0.85M 1 QCBS All Bidders to Design (IndII) be prequalified 6. IndII Project $2.04M 1 QCBS no details given Implementation Support PISC88 (IndII) 7. ADB Project $14.80M 1 QCBS 1,288 PMs Implementation Support PISC (ADB) 215 PMs Int’l 1,073 PMs Nat’l Central Support Team – Jakarta Team Leader (Int’l) 16 PMs Inttermittent Deputy Team Leader (Nat’l) 48 PMs Continuous Mechanical Engineer (Int’l) 3 PMs Intermittent Electrical Engineer (Int’l) 3 PMs Intermittent Wastewater Treatment Process Engineer (Int’l) 6 PMs Intermittent Civil Engineer, Sewerage/Drainage (Int’l) 4 PMs Intermittent Civil Structural Engineer (Int’l) 3 PMs Intermittent Contract Specialist (Int’l) 3 PMs Intermittent QA/QC Specialist (Int’l) 3 PMs Intermittent Gender/Social Development Specialist (Int’l) 4 PMs Intermittent Environmental Specialist (Int’l) 2 PMs Continuous Social Safeguards/Resettlement Specialist (Int’l) 4 PMs Intermittent Benefit and Monitoring Specialist (Int’l) 4 PMs Intermittent Financial Management Specialist (Nat’l) 48 PMs Continuous Procurement Specialist (Nat’l) 6 PMs Intermittent MIS Specialist (Nat’l) 48 PMs Continuous Gender & Social Development Specialist (Nat’l) 8 PMs Intermittent City Supervision Team – For Cimahi City Office Leader – Sewerage/Drainage Const. Suprvsr. (Int’l) 36 PMs Intermittent Construction Supervisor – WWTP (Nat’l) 38 PMs Intermittent Civil Structural Engineer (Nat’l) 18 PMs Intermittent Civil Engineer, Sewerage/Drainage (Nat’l) 12 PMs Intermittent Geotechnical Specialist (Nat’l) 4 PMs Intermittent Mechanical Engineer (Nat’l) 5 PMs Intermittent Electrical Engineer (Nat’l) 4 PMs Intermittent Environmental Specialist (Nat’l) 6 PMs Intermittent Public Relations/Sanitation Marketing Specialists (2 Nat’l) 18 PMs Intermittent Health & Safety Coordinator (Nat’l) 38 PMs Intermittent Accounting Specialist (Nat’l) 38 PMs Intermittent Gender & Social Development Specialist (Nat’l) 4 PMs Intermittent Social Safeguards/Resettlement Specialist (Nat’l) 6 PMs Intermittent Benefit and Monitoring Specialist (Nat’l) 4 PMs Intermittent Sub-Professional Support Personnel: Drafting Support (Nat’l) 24 PMs Intermittent GIS Specialist Support (Nat’l) 6 PMs Intermittent
88 PISC For Palembang

TA 7993 - INO: Metropolitan Sanitation Management Investment Project – MSMIP 359
Draft Final Report
Surveyor Support (Nat’l) 12 PMs Intermittent City Supervision Team – For Makassar City Office Leader – Sewerage/Drainage Const. Suprvsr. (Int’l) 36 PMs Intermittent Construction Supervisor – WWTP (Nat’l) 38 PMs Intermittent Civil Structural Engineer (Nat’l) 12 PMs Intermittent Civil Engineer, Sewerage/Drainage (Nat’l) 12 PMs Intermittent Geotechnical Specialist (Nat’l) 3 PMs Intermittent Mechanical Engineer (Nat’l) 3 PMs Intermittent Electrical Engineer (Nat’l) 2 PMs Intermittent Environmental Specialist (Nat’l) 6 PMs Intermittent Public Relations/Sanitation Marketing Specialists (2 Nat’l) 18 PMs Intermittent Health & Safety Coordinator (Nat’l) 38 PMs Intermittent Accounting Specialist (Nat’l) 38 PMs Intermittent Gender & Social Development Specialist (Nat’l) 4 PMs Intermittent Social Safeguards/Resettlement Specialist (Nat’l) 6 PMs Intermittent Benefit and Monitoring Specialist (Nat’l) 4 PMs Intermittent Sub-Professional Support Personnel: Drafting Support (Nat’l) 24 PMs Intermittent GIS Specialist Support (Nat’l) 6 PMs Intermittent Surveyor Support (Nat’l) 12 PMs Intermittent City Supervision Team – For Jambi City Office Leader – Sewerage/Drainage Const. Suprvsr. (Int’l) 36 PMs Intermittent Construction Supervisor – WWTP (Nat’l) 38 PMs Intermittent Civil Structural Engineer (Nat’l) 12 PMs Intermittent Civil Engineer, Sewerage/Drainage (Nat’l) 12 PMs Intermittent Geotechnical Specialist (Nat’l) 3 PMs Intermittent Mechanical Engineer (Nat’l) 3 PMs Intermittent Electrical Engineer (Nat’l) 2 PMs Intermittent Environmental Specialist (Nat’l) 6 PMs Intermittent Public Relations/Sanitation Marketing Specialists (2 Nat’l) 18 PMs Intermittent Health & Safety Coordinator (Nat’l) 38 PMs Intermittent Accounting Specialist (Nat’l) 38 PMs Intermittent Gender & Social Development Specialist (Nat’l) 4 PMs Intermittent Social Safeguards/Resettlement Specialist (Nat’l) 6 PMs Intermittent Benefit and Monitoring Specialist (Nat’l) 4 PMs Intermittent Sub-Professional Support Personnel: Drafting Support (Nat’l) 24 PMs Intermittent GIS Specialist Support (Nat’l) 6 PMs Intermittent Surveyor Support (Nat’l) 12 PMs Intermittent Sewerage Design Engineer (Int’l) 6 PMs Continuous Wastewater Treatment Process Engineer (Int’l) 2 PMs Continuous City Supervision Team – For Pekanbaru City Office Leader – Sewerage/Drainage Const. Suprvsr. (Int’l) 36 PMs Intermittent Construction Supervisor – WWTP (Nat’l) 38 PMs Intermittent Civil Structural Engineer (Nat’l) 12 PMs Intermittent Civil Engineer, Sewerage/Drainage (Nat’l) 12 PMs Intermittent Geotechnical Specialist (Nat’l) 3 PMs Intermittent Mechanical Engineer (Nat’l) 3 PMs Intermittent Electrical Engineer (Nat’l) 2 PMs Intermittent Environmental Specialist (Nat’l) 6 PMs Intermittent

TA 7993 - INO: Metropolitan Sanitation Management Investment Project – MSMIP 360
Draft Final Report
Public Relations/Sanitation Marketing Specialists (2 Nat’l) 18 PMs Intermittent Health & Safety Coordinator (Nat’l) 38 PMs Intermittent Accounting Specialist (Nat’l) 38 PMs Intermittent Gender & Social Development Specialist (Nat’l) 4 PMs Intermittent Social Safeguards/Resettlement Specialist (Nat’l) 6 PMs Intermittent Benefit and Monitoring Specialist (Nat’l) 4 PMs Intermittent Sub-Professional Support Personnel: Drafting Support (Nat’l) 24 PMs Intermittent GIS Specialist Support (Nat’l) 6 PMs Intermittent Surveyor Support (Nat’l) 12 PMs Intermittent Sewerage Design Engineer (Int’l) 6 PMs Continuous Wastewater Treatment Process Engineer (Int’l) 2 PMs Continuous
4. National Competitive Bidding a. General The procedures to be followed for National Competitive Bidding shall be those set forth in Presidential Decree No. 70/2012 or the New Procurement Law of the Republic of Indonesia, with the clarifications and modifications described in the following paragraphs required for compliance with the provisions of the Procurement Guidelines. b. Registration
i. Bidding shall not be restricted to pre-registered firms and such registration shall not be a condition for participation in the bidding process.
ii. Where registration is required prior to award of contract, bidders: (i) shall be
allowed a reasonable time to complete the registration process; and (ii) shall not be denied registration for reasons unrelated to their capability and resources to successfully perform the contract, which shall be verified through post-qualification.
c. Prequalification
Post-qualification shall be used unless prequalification is explicitly provided for in the Loan Agreement/Procurement Plan. Irrespective of whether post-qualification or prequalification is used, eligible bidders (both national and foreign) shall be allowed to participate. d. Joint Ventures A bidder declared the lowest evaluated responsive bidder shall not be required to form a joint venture or to sub-contract part of the supply of goods as a condition of award of the contract.
e. Preferences
i. No preference of any kind shall be given to domestic bidders or for
domestically manufactured goods.

TA 7993 - INO: Metropolitan Sanitation Management Investment Project – MSMIP 361
Draft Final Report
ii. Regulations issued by a sector ministry, provincial regulations, and local
regulations that restrict national competitive bidding procedures to a class of
contractors or a class of suppliers shall not be applicable.
f. Advertising
i. Invitations to Bid (or prequalify, where prequalification is used) shall be advertised in at least one widely-circulated national daily newspaper or freely accessible, nationally-known website allowing a minimum of seven (7) days for the preparation and submission of bids and allowing potential bidders to purchase bidding documents up to at least twenty-four (24) hours prior to the deadline for the submission of bids. Bidding of NCB Contracts estimated at $500,000 or more for goods and related services or $1,000,000 or more for civil works shall be advertised on ADB’s website via the posting of the Procurement Plan.
ii. Bidding Documents shall be made available by mail, electronically, or in
person to all who are willing to pay the required fees, if any.
iii. Bidders domiciled outside the area/district/province of the unit responsible for procurement shall be allowed to participate regardless of the estimated value of the Foreign bidders from ADB-member countries shall not be precluded from bidding.
g. Bid Security Where required, the Bid Security shall be in the form of a bank guarantee from a reputable bank. h. Bid Opening and Bid Evaluation
i. Bids shall be opened in public immediately after the deadline for submission of bids.
ii. Evaluation of bids shall be made in strict adherence to the criteria declared in
the bidding documents. iii. Bidders shall not be eliminated from detailed evaluation on the bases of
minor, non-substantial deviations. iv. No bid shall be rejected on the basis of a comparison with the owner’s
estimate or budget ceiling without the ADB’s prior concurrence. v. The contract shall be awarded to the technically responsive bid that offers the
lowest evaluated price. i. Rejection of All Bids and Rebidding
i. Bids shall not be rejected and new bids solicited without the ADB’s prior concurrence.
ii. When the number of responsive bids is less than three (3), re-bidding shall
not be carried out without the ADB’s prior concurrence.
TA 7993 - INO: Metropolitan Sanitation Management Investment Project – MSMIP 362
Draft Final Report
j. ADB Member Country Restrictions Bidders must be nationals of member countries of ADB, and offered goods and services must be produced in and supplied from member countries of ADB.
5. Consulting services
a. The Capacity Building Technical Assistance (CDTA)
The proposed ADB-funded capacity development technical assistance (CDTA) will provide support for Cities, Cimahi, Jambi, Makassar and Pekanbaru. The CDTA support for Palembang will be provided by INDII. The ADB CDTA consultancy will provide implementation support for two years from 2nd Qtr 2014 to 1st Qtr 2016. A total of 118 person-months (34 person-months international and 84 person-months national) will be recruited for Consultants and will be selected in accordance with ADB's Guidelines on the Use of Consultants by ADB and its Borrowers (2007, as amended from time to time). Consulting services for the TA will provide technical expertise and support in two areas namely Capacity Building and Assistance to Project Management. See Annex Document H for the detailed TOR of the ADB CDTA Consultancy.
i. Capacity Building There are two capacity building consultancies. The INDII PISC Consultant will support PDAM Palembang and the ADB Consultant will cover assistance to the other four city governments and agencies. The capacity building activities are targeted at two (2) levels – sector (or city) management level (through the Local Institutional Development Action Plan or LIDAP) and at the service delivery level (through the Financial and Operating Performance Improvement Plan or FOPIP). Capacity building for project implementation and operation is part of the LIDAP and includes interventions to be initiated and managed by the city government. These are directed at influencing the operating conditions of the Service Delivery Organization (SDO). The FOPIP, on the other hand, includes interventions which are to be initiated and managed by the SDO. Consultancy assistance will be provided in the (i) Preparation of policies, guidelines, and manuals, (ii) Advisory services, technical assistance and progress monitoring and (iii) Training and Workshops. Linkages to the Indonesia Waste Water Institute (IWWI) A proposal to establish the Indonesia Waste Water Institute is timely and very relevant to the CDTA.89 The IWWI model proposes professional certification as a means of i) testing the level of competence of professionals; ii) defining the minimum professional standards for
89 In September 2012 the Asian Development Bank appointed consultants to undertake the study ADB TA-7739 - Indonesia Water Supply and Sanitation Institute (IWSSI). The main objective of the project is to accelerate the building of capacity in urban water and sanitation services in Indonesia, through the creation of a training and professional certification body for water and wastewater operators that has initially been given the name of Indonesian Water Supply and Sanitation Institute (IWSSI). Eventually, the institute was referred to as the Indonesian Waste Water Institute (IWWI).The main outcome of this project is a 5-year plan for the creation and operation of the training and certification institution, along with a set of recommendations for policy-making measures that should support and safeguard its consolidation for the benefit of the people of Indonesia.

TA 7993 - INO: Metropolitan Sanitation Management Investment Project – MSMIP 363
Draft Final Report
certain roles; and iii) incentivizing the pursuit of continuing development among staff in the sector, based on the idea that the certification –provided that it has credibility and good reputation in the sector- will serve as a differentiating element of professional excellence. Initially, the IWWI 5-year working plan includes a first batch of people to be trained and certified from existing offsite system operators. The results of the IWWI model evaluation and improvement task that will take place at the end of 2014 should be taken into account in the CDTA (at FOPIP and LIDAP levels).It is proposed that the MSMIP cities (Makassar, Pekanbaru, Jambi, Palembang and Cimahi) will be targeted for the second batch training in 2015 (for the current UPTD head) and in 2016 (for the off site system manager/operator). Funding for this will be provided by the ADB WOPs project. The key points of interrelationships between IWWI and this CDTA include:
• The incorporation of knowledge products resulting from the MSMIP CDTA into the IWWI for further replication
• All IWWI trainees could very much benefit from making site visits during the installation and testing of the electromechanical equipment at the MSMIP plants, as well as during commissioning.
• Once trained, the SDO managers will be involved in the specific area of the FOPIP that deals with the definition of work competencies and recruitment processes
• Future managers of the MSMIP assets could also benefit from the WOPs activities that happen in parallel to the IWWI, for example joining the training courses carried out at the premises and offices of the international mentor operators (in the second part of 2015).
The cost for the ADB CDTA for the 4 Cities is estimated to be $2.0M for a total of 118 Person-Months. About 34 PMs will be allocated to international consultants and 84 PMs will be allocated to national consultants.
ii. Assistance to Project Management Technical Audit . The consultancy services also aims to provide initial project management assistance during the period prior to mobilization and during the initial years of the Project Implementation Support Consultants (PISC). The PISC will ensure that activities of the various project consultants are coordinated and synchronized so that project objectives are met. Benefit Monitoring and Evaluation. Monitoring and evaluation of project benefits calls for the development and implementation of a Project Performance Monitoring System which covers the conduct of a baseline study and setting up of all institutional requirements in order to be able monitor and evaluate the benefits of the project after its completion. The ADB CDTA is estimated to amount to $2milllion and will be implemented through the Ministry of Public Works, Directorate General for Human Settlements.
b. Detailed Engineering Design (DED)
Consulting Services will be provided (funded by INDII) for the detailed engineering design for Cimahi, Makassar and Palembang. Consulting Services will be provided (funded by the government) for the detailed engineering design for Jambi and Pekanbaru.
c. Project Implementation Support Consultants (PISC)

TA 7993 - INO: Metropolitan Sanitation Management Investment Project – MSMIP 364
Draft Final Report
Consulting Services will be provided (funded by ADB) for the project management including construction supervision oversight for Cimahi, Jambi, Makassar and Pekanbaru. Consulting Services will be provided (funded by INDII) for the project management including construction supervision oversight for Palembang. A total of 215 Person-Months for International Consultants and 1,073 Person-Months for National Consultants (a total of 1,288 Person-Months) will be engaged over the life of the ADB PISC contract, each of the 4 cities will be allocated 268 Person-Months. The total amount for the ADB and INDII PISC will be $12.2M. See Annex Document J for the detailed TOR for the ADB PISC Consultancy. d. Construction Supervision Consultants (CSC) Consulting Services will be provided (funded by ADB) for the detailed subproject construction supervision for Cimahi, Jambi, Makassar and Pekanbaru. Consulting Services will be provided (funded by INDII) for the detailed subproject construction supervision for Palembang. This construction supervision will be standard for all construction activities to ensure that actual construction complies with required design and standards, the CSC will also be responsible for recommending contract payments to the PIU. The total cost for the CSC services is estimated to be $4.18M. Note - the CSC construction supervision role is different from the construction oversight role of the PISC.