technical assistance consultant’s report · social assistance assistance for the elderly (e.g.,...
TRANSCRIPT
Technical Assistance Consultant’s Report
This consultant’s report does not necessarily reflect the views of ADB or the Government concerned, and ADB and the Government cannot be held liable for its contents. (For project preparatory technical assistance: All the views expressed herein may not be incorporated into the proposed project’s design.)
Project Number: 44152 Regional — Capacity Development Technical Assistance (R–CDTA) August 2012
The Islamic Republic of Afghanistan: Updating and Improving the Social Protection Index (Cofinanced by the Republic of Korea e-Asia and Knowledge Partnership Fund)
Prepared by Abdul Majeed Labib
For Asian Development Bank

ABBREVIATIONS AND ACRONYMS
DMC – Developing member countries ADB – Asian Development Bank SPI – Social Protection Index ISSA – International Social Security Association NRVA – National Risk and Vulnerability Assessment MoEC – Ministry of Economy CSO – Central Statistics Organization IMF – International Monetary Fund GDP – gross domestic product Afs – Afghani ANDS – Afghanistan National Development Strategy MOLSAMD – Ministry of Labor, Social Affairs, Martyrs and Disabled IDP – internally displaced people FEWS – Famine Early Warning System UNICEF – United Nations International Children’s Emergency Fund ANDMA – Afghanistan National Disaster Management Authority UNHCR – United Nation High Commission for Refugees MRRD – Ministry of Rural Rehabilitation and Development ICRC – International Committee of Red Cross IRC – International Rescue Committee MoPH – Ministry of Public Health WFP – World Food Program ARCS – Afghan Red Crescent Society NSP – National Solidarity Program FFE – Food for Education FFW – Food for work program GFD – General Food Distribution LMP – Labor Market program SI – Social Insurance SA – Social Assistance NEEPRA – National Emergency Employment Program For Rural
Access

CONTENTS
Page I. INTRODUCTION 1
A. Background 1 B. Definition of Social Protection 1 C. Report Structure 3
II. COUNTRY OVERVIEW 3 A. Geography 3 B. Demographic Profile 3 C. Economy 4 D. Poverty and Inequality 4 E. Employment and Labor Force 5
III. CURRENT SOCIAL PROTECTION PROGRAMS AND ACTIVITIES 5 A. Data Collection 5 B. Social Assistance Programs 6 C. Social Insurance 9 D. Labor Market Programs 10
IV. THE SOCIAL PROTECTION INDEX AND ITS DISAGGREGATION 12
V. ANALYSIS OF COUNTRY RESULTS 14 A. Disaggregation by Social Protection Category 14 B. Disaggregation by ‘Depth’ and ‘Breadth’ 15 C. Disaggregation by Poverty Focus 15 D. Disaggregation by Gender 15
VI. CONCLUSION AND RECOMMENDATIONS 16
I. INTRODUCTION
A. Background
1. Asian Development Bank’s (ADB) development of the social protection index contributed to the strengthening of social protection programs in developing member countries (DMCs). ADB will continue its work on updating and improving the Social Protection Index (SPI). The SPI’s update will address and incorporate lessons learned from two technical assistance projects1 that developed the SPI for 35 countries in Asia and the Pacific and introduce new components and institutional arrangements to sustain the effective use of social protection indicators in policy analysis and formulation in the DMCs. 2. These initiatives will be implemented under the ADB commissioned regional technical assistance project2 that seeks to (i) improve the methodology in defining social protection for each DMC in order to ensure comparability among DMCs; (ii) improve data gathering for statistical analysis on social protection; and (iii) develop capacity of DMCs in monitoring the SPI and allow comparisons between countries and over time on implementation performance. 3. This country study provides updated information and data on social protection arrangements, legislation, and institutions and calculates the SPI for Afghanistan in view of the revised SPI methodology. The SPI can be updated periodically to assess progress in social protection arrangements in the country and analyse deeper aspects of targeting, coverage and expenditures on various social protection programs; for example, on the breadth (coverage) of social insurance versus social assistance or labour market programs, or on the depth (size of benefit) of various categories of social protection. The revised SPI methodology also provides scope to measure the gender responsiveness of programs, and poverty targeting of programs.3 4. The primary objective of the Afghanistan Country Report is to present the results of the research on social protection programs and policies in Afghanistan from all related ministries, particularly the Ministry of Social Welfare; and, summarize quantitative information on these activities to enable the formulation of a national Social Protection Index (SPI). B. Definition of Social Protection
5. Social protection is defined as the set of policies and programs designed to reduce poverty and vulnerability by promoting efficient labor markets, diminishing people’s exposure to risks, and enhancing their capacity to protect themselves against hazards and interruption/loss of income. 6. This definition categorizes all programs under the traditional components of social protection as social insurance, social assistance, and labor market programs. Microfinance as a form of social protection is excluded from the calculation of SPI since it does not involve a transfer in cash or kind and beneficiaries incur loans or debt instead of transfers. Thus, by eliminating microfinance from the coverage of social protection programs, three major programs are left: (i) social insurance (i.e., the categories of old-age insurance, programs for the disabled, 1 ADB. 2003. Technical Assistance for Social Protection Index for Committed Poverty Reduction. Manila (TA 6120-
REG); ADB. 2006. Technical Assistance for Scaling Up of the Social Protection Index for Committed Poverty Reduction. Manila (TA 6308-REG).
2 ADB. 2010. Technical Assistance for Updating and Improving the Social Protection Index. Manila (TA 7601-REG). 3 To be able to calculate with relative accuracy the poverty-targeting rate of programs, household surveys need to
contain a social protection data. However, the data of the survey was not available at the time of writing this report.
2
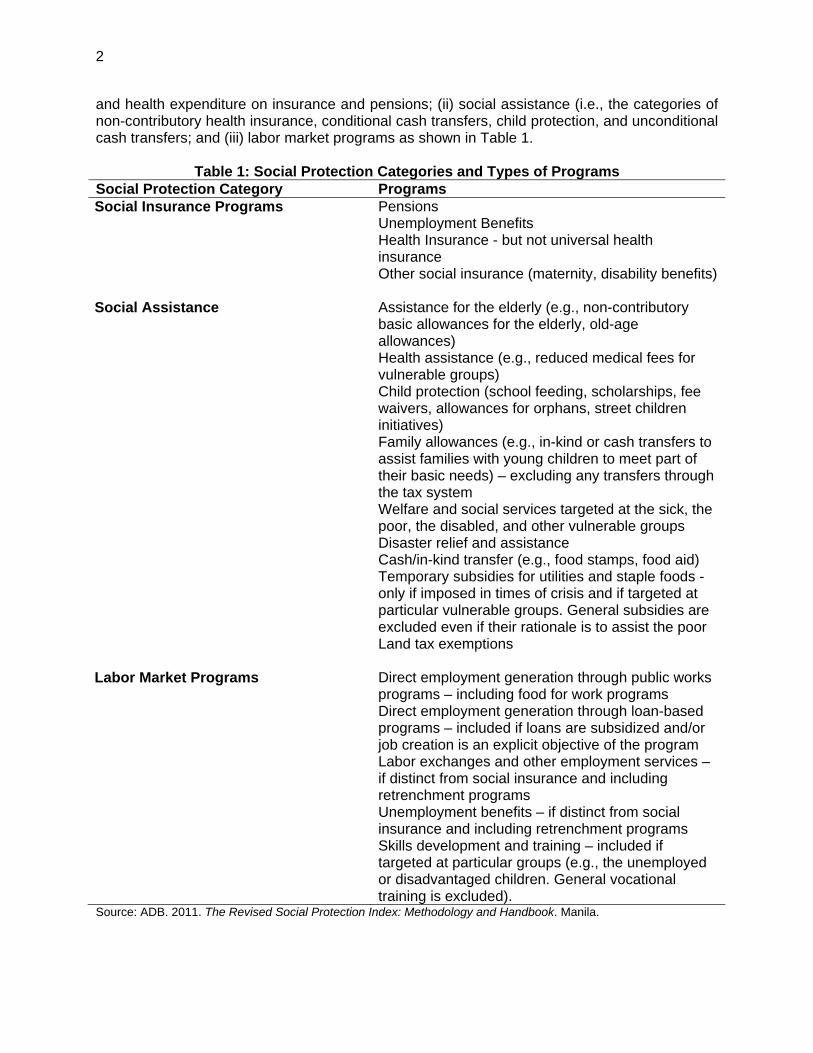
and health expenditure on insurance and pensions; (ii) social assistance (i.e., the categories of non-contributory health insurance, conditional cash transfers, child protection, and unconditional cash transfers; and (iii) labor market programs as shown in Table 1.
Table 1: Social Protection Categories and Types of Programs Social Protection Category Programs Social Insurance Programs Pensions
Unemployment Benefits Health Insurance - but not universal health
insurance Other social insurance (maternity, disability benefits)
Social Assistance Assistance for the elderly (e.g., non-contributory
basic allowances for the elderly, old-age allowances)
Health assistance (e.g., reduced medical fees for vulnerable groups)
Child protection (school feeding, scholarships, fee waivers, allowances for orphans, street children initiatives)
Family allowances (e.g., in-kind or cash transfers to assist families with young children to meet part of their basic needs) – excluding any transfers through the tax system
Welfare and social services targeted at the sick, the poor, the disabled, and other vulnerable groups
Disaster relief and assistance Cash/in-kind transfer (e.g., food stamps, food aid) Temporary subsidies for utilities and staple foods -
only if imposed in times of crisis and if targeted at particular vulnerable groups. General subsidies are excluded even if their rationale is to assist the poor
Land tax exemptions Labor Market Programs Direct employment generation through public works
programs – including food for work programs Direct employment generation through loan-based
programs – included if loans are subsidized and/or job creation is an explicit objective of the program
Labor exchanges and other employment services – if distinct from social insurance and including retrenchment programs
Unemployment benefits – if distinct from social insurance and including retrenchment programs
Skills development and training – included if targeted at particular groups (e.g., the unemployed or disadvantaged children. General vocational training is excluded).
Source: ADB. 2011. The Revised Social Protection Index: Methodology and Handbook. Manila.

3
7. Historically, various forms of social protection have existed in Afghanistan through community and patronage systems. Social insurance was introduced in the early 1990s to provide contributory old age, disability and survivor pensions; sickness and maternity benefits; and workers’ compensations in the formal sector. In 2002, the then-transitional Government of Islamic Republic of Afghanistan expressed a commitment to make state-led social policy a key element of the overall reconstruction program and to promote social protection while designing its overall social policy. Until then, donor and humanitarian agencies had delivered social protection.
8. The National Social Protection Strategy provides a framework to reform and streamline existing programs. The strategy is rooted in the country’s constitution and addresses the issue of consumption inequality based on geographic location. It highlights the disadvantages of the rural and nomadic population, those living in remote areas, people living in larger households, and women. It is an important step towards recognizing the need to address socio-economic vulnerability and exclusion. Moreover, the strategy is developed from a welfare approach, rather than from a rights-based one. C. Report Structure
9. The Afghanistan Country Report is structured as follows:
• Chapter II contains a brief overview of the social and economic development in Afghanistan.
• Chapter III describes current social protection activities and programs in the country using ADB’s typology.
• Chapter IV provides an overview of the derivation of SPI and its disaggregation.
• Chapter V presents the analysis of the country results.
• Chapter VI discusses policy assessments and implications.
II. COUNTRY OVERVIEW
10. This chapter provides a brief overview of the socio-economic characteristics of Afghanistan, main features of the country’s current developmental situation and recent trends.
A. Geography
11. Afghanistan is located in Central Asia, north and west of Pakistan and east of Iran. It is a land-locked and mountainous region with typically arid climate. B. Demographic Profile
12. Between 1978 and 2001, war and civil conflict resulted in the deaths of over 1 million Afghans, leaving another 1 million orphaned and disabled.5 Around a third of the population
5 ADB. 2008. Afghanistan Country Partnership Strategy (2009–2013). Manila

4
became refugees; many displaced from their homes, leaving villages and other urban areas devastated by the war. 13. The population is about 25.6 million in 2009. The elderly population (60 years and older) is 6% of the total population while 47% are children aged 0-14 years. The disaster affected population also rank significantly at 33%. The average household size is 4.5 persons. C. Economy
14. The nominal GDP growth rate shows a very positive trend. It increased from $7.1 billion in 2006 to $15.6 billion in 2010. Afghanistan’s real GDP growth rates may fluctuate but fare well with neighboring countries. 15. The Afghanistan National Development Strategy (ANDS) has not significantly yielded a change in the composition of GDP over the last four years. The service sector could benefit the most from the rapid inflow of external support with a realized annual growth rate of 12.6% in 2006-2010, well above the GDP growth rate of 10.6% and increasing its share of GDP from 38% to 41%; making the service sector the strongest sector of the economy. Within the service sector, the telecommunication sector is one of the most dynamic sub-sectors. The industry sector realized a modest annual growth rate of 8.6 % in 2006-2010, the lowest of the three large sectors. Industry continues to have the smallest share in economic performance among the three large sectors. The average annual growth rate of the agricultural sector is 9.6%. Both sectors decreased their shares of GDP with industry down from 25.5% in 2006 to 23.7% in 2010; and agriculture from 33% in 2006 to 32% in 2010. Afghanistan’s economic growth is also fuelled by large inflows of foreign assistance and opium production revenue, resulting in an increased demand for domestic goods and services. 16. Foreign trade is an important element of GDP, but trade statistics are not yet updated and do not fully reflect the trade trends and patterns as a large share of trade is not yet reported. Exports and imports have been increasing almost steadily over time in absolute figures, while GDP share from foreign trade is declining. According to the Central Statistics Organization (CSO) Statistical Year Book in 2010, imports increased significantly compared to 2009, while exports decreased slightly compared to 2009 and 2008. However, despite Afghanistan exhibiting a positive growth trend in terms of GDP per capita, it is still the poorest country in the region, achieving only 9% of the average standard of living of Iran, the wealthiest country in the region. D. Poverty and Inequality
17. Poverty reduction is one of the main objectives of the Afghanistan National Development Strategy. Recently, the Ministry of Economy (MoEc) with assistance from the World Bank, developed the poverty profile of the country based on the National Risk and Vulnerability Assessment (NRVA) 2007-2008. This profile appraises the magnitude of poverty and its distribution across regions and provides information on the characteristics and correlates of poverty in Afghanistan. The poverty profile revealed that 36% of the population is living below the poverty line, while more than half of the population is close to the poverty line6. In this situation, a very small negative shock could drop half of the population under the poverty line.
6 Afghanistan Human Development Report 2010-2011.
5
18. Poverty in Afghanistan varies dramatically by region because of different terrains, climate, agriculture zones, altitudes and latitudes of the areas. It is highly correlated with seasonality. There is a huge difference in economic wellbeing of households during different seasons due to agricultural cycles and extreme temperature fluctuations such as droughts and severe winter that affect livelihoods of exposed communities and create snow blocks roads especially in high mountain areas. 19. Afghanistan’s human development indicators are among the lowest in the world, although comparable to some of the poorest countries in sub-Saharan Africa. About 12 million Afghans or 42% of the population live below the poverty line, with incomes about $14 per month per capita; a further 20% of the population is slightly above the poverty line and highly vulnerable7. Food poverty is estimated to affect 45% of the population and life expectancy in Afghanistan is under 45 years old, at least 10 years below any other Asian country. During the widespread drought in 2008, the United Nations estimated that one-third of the population of about 11 million people will require food assistance during winter months. E. Employment and Labor Force
20. The number of employed population in Afghanistan in 2009 is 6.9 million while the unemployed and underemployed population is about 5 million. Despite impressive GDP growth rates, the unemployment rate in Afghanistan is still at a very high level and by far the highest in the region. However, for the first time in 2010, the trend was slightly positive mainly due to the huge number of small income-generating projects financed by the national budget and donors. The high rate of unemployment continues to be a serious threat to the social and political stability of the country.
III. CURRENT SOCIAL PROTECTION PROGRAMS AND ACTIVITIES
21. This chapter presents an overview of the data collection process, objectives, and current social protection activities in Afghanistan including challenges and difficulties encountered during the course of the study. The two-fold objective of this chapter is to present the main features of the social protection programs in the country and provide quantitative information that will serve as the basis for the formulation of the Social Protection Index. A. Data Collection
22. Data collected include reports of social protection programs in Afghanistan from the International Social Security Association (ISSA), UNICEF-Regional Office for South Asia, and other country reports. Other data sources include the Labour Force Survey of the Ministry of Labor, Social Affairs, Martyrs and Disabled; Census data, National Accounts data, Poverty Assessment report, and Afghanistan statistical yearbook data. 23. Social protection programs in Afghanistan are classified into three major social protection components: (i) social assistance; (ii) social insurance; and (iii) labor market programs. The major social protection activities in Afghanistan are implemented by government agencies.
7 ADB. 2008. Afghanistan Country Partnership Strategy (2009–2013). Manila.
6
B. Social Assistance Programs
24. The social assistance programs in Afghanistan consists of (i) social welfare programs for children, orphans and very poor families; (ii) disaster relief and assistance; (iii) food for tuberculosis patients program; and (iv) food for education program.
1. Social Welfare Program
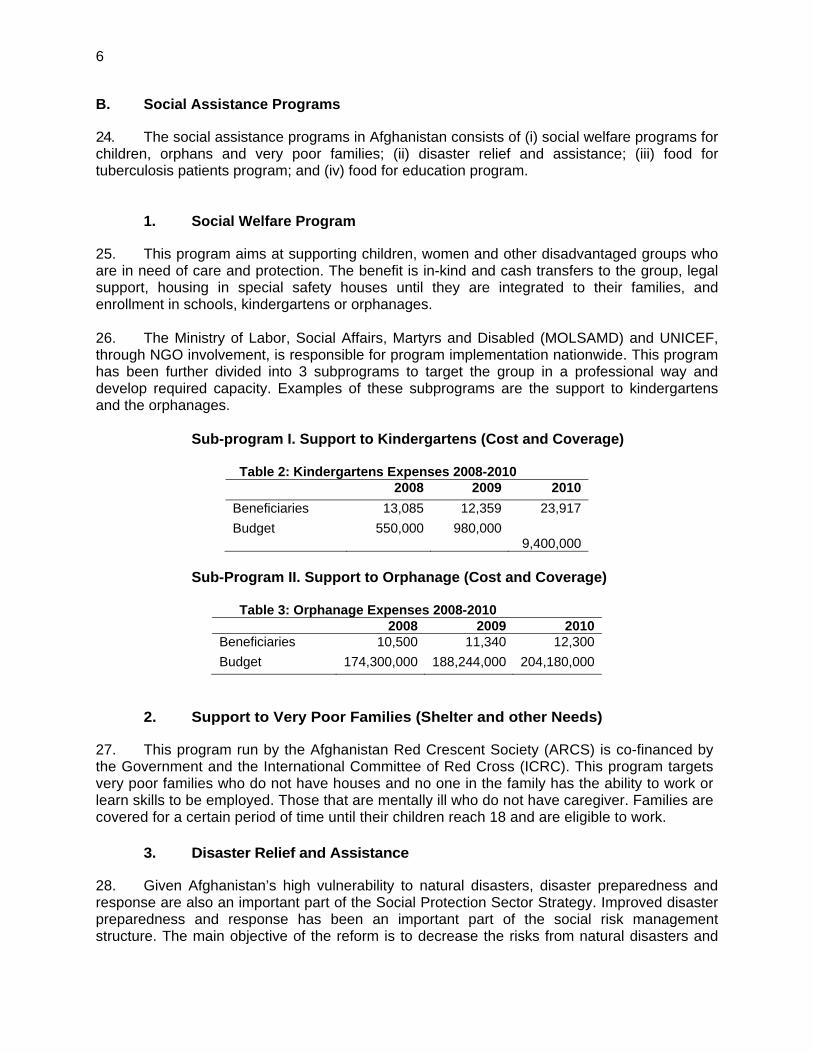
25. This program aims at supporting children, women and other disadvantaged groups who are in need of care and protection. The benefit is in-kind and cash transfers to the group, legal support, housing in special safety houses until they are integrated to their families, and enrollment in schools, kindergartens or orphanages. 26. The Ministry of Labor, Social Affairs, Martyrs and Disabled (MOLSAMD) and UNICEF, through NGO involvement, is responsible for program implementation nationwide. This program has been further divided into 3 subprograms to target the group in a professional way and develop required capacity. Examples of these subprograms are the support to kindergartens and the orphanages.
Sub-program I. Support to Kindergartens (Cost and Coverage)
Table 2: Kindergartens Expenses 2008-2010 2008 2009 2010 Beneficiaries 13,085 12,359 23,917 Budget 550,000 980,000
9,400,000
Sub-Program II. Support to Orphanage (Cost and Coverage)
Table 3: Orphanage Expenses 2008-2010 2008 2009 2010
Beneficiaries 10,500 11,340 12,300 Budget 174,300,000 188,244,000 204,180,000
2. Support to Very Poor Families (Shelter and other Needs)
27. This program run by the Afghanistan Red Crescent Society (ARCS) is co-financed by the Government and the International Committee of Red Cross (ICRC). This program targets very poor families who do not have houses and no one in the family has the ability to work or learn skills to be employed. Those that are mentally ill who do not have caregiver. Families are covered for a certain period of time until their children reach 18 and are eligible to work.
3. Disaster Relief and Assistance
28. Given Afghanistan’s high vulnerability to natural disasters, disaster preparedness and response are also an important part of the Social Protection Sector Strategy. Improved disaster preparedness and response has been an important part of the social risk management structure. The main objective of the reform is to decrease the risks from natural disasters and

7
improve the disaster preparedness and response with the aim of protecting human lives, assets, public infrastructure and the environment.
29. Under the existing legislation, the prime responsibility of the Afghanistan National Disaster Management Authority (ANDMA) is to coordinate Government’s efforts and provide policy making. However, lack of responsibility for implementation of key projects for disaster preparedness and response, and over-reliance on line ministries has been proven as a weakness. Therefore, the legislation will need to be improved in order to reflect the need to strengthen the ANDMA’s role in implementing some of the key projects. However, it is important to stress that the line ministries will remain responsible for the implementation of most projects for disaster preparedness and response. 30. There have been several regional or small national programs that have been helping disaster victims recover and these are financed by international donors and implemented by NGOs, international organizations or the Government of Afghanistan. All these efforts are under the leadership of ANDMA and were gathered under one program. The donors involved are UNHCR, WFP, UNICEF, IRC and national organizations such as ARCS, MoPH, MRRD and the Government’s Emergency Response Committee. 31. The primary target group for this program is victims of natural disasters such as floods and earthquakes. The benefits include relief packages in the form ready-made food, drugs, water, blankets and heating, tents, kitchen utilities, cloths, soap and cash for basic needs. The Government and donor agencies release the funds through the NGOs or spend it through the ANDMA network. Table 4 shows the total expenses of small disaster relief programs implemented by donors in coordination with ANDMA.
Table 4: Total Expenses of Small Disaster Relief Programs 2008 2009 2010 Beneficiaries/person 11,937 6,469 31,656 Expenses/Afs 103,000,000 56,200,000 275,000,000
32. There are many small programs run by NGOs or the government but under the Emergency Response Committee of the Government, the total expenses (Table 5) of these programs target all poor and vulnerable families who are susceptible to the cold winter.
Table 5: Government Winterization Program Expenses 2008 2009 2010 Beneficiaries 27,000 35,000 41,000 Expenses 256,500,000 332,500,000 389,500,000
4. Relief or General Food Distribution Programs
33. In General Food Distribution (GFD) programs, targeting criteria to all partners needs to be clarified. Beneficiary screening and third-party verification should be done early and comprehensively, particularly in urban areas. Provisions for eligible latecomers should be made.
8
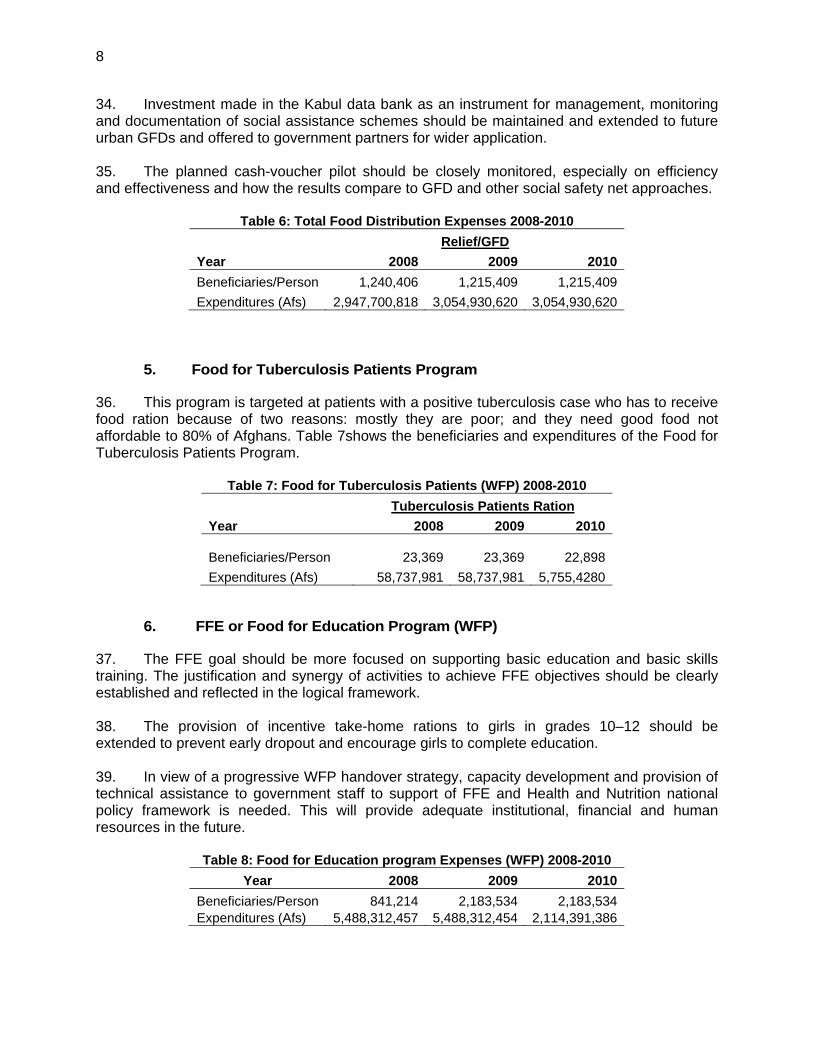
34. Investment made in the Kabul data bank as an instrument for management, monitoring and documentation of social assistance schemes should be maintained and extended to future urban GFDs and offered to government partners for wider application. 35. The planned cash-voucher pilot should be closely monitored, especially on efficiency and effectiveness and how the results compare to GFD and other social safety net approaches.
Table 6: Total Food Distribution Expenses 2008-2010 Relief/GFD Year 2008 2009 2010 Beneficiaries/Person 1,240,406 1,215,409 1,215,409 Expenditures (Afs) 2,947,700,818 3,054,930,620 3,054,930,620
5. Food for Tuberculosis Patients Program
36. This program is targeted at patients with a positive tuberculosis case who has to receive food ration because of two reasons: mostly they are poor; and they need good food not affordable to 80% of Afghans. Table 7shows the beneficiaries and expenditures of the Food for Tuberculosis Patients Program.
Table 7: Food for Tuberculosis Patients (WFP) 2008-2010 Tuberculosis Patients Ration Year 2008 2009 2010
Beneficiaries/Person 23,369 23,369
22,898 Expenditures (Afs) 58,737,981 58,737,981 5,755,4280
6. FFE or Food for Education Program (WFP)
37. The FFE goal should be more focused on supporting basic education and basic skills training. The justification and synergy of activities to achieve FFE objectives should be clearly established and reflected in the logical framework. 38. The provision of incentive take-home rations to girls in grades 10–12 should be extended to prevent early dropout and encourage girls to complete education. 39. In view of a progressive WFP handover strategy, capacity development and provision of technical assistance to government staff to support of FFE and Health and Nutrition national policy framework is needed. This will provide adequate institutional, financial and human resources in the future.
Table 8: Food for Education program Expenses (WFP) 2008-2010 Year 2008 2009 2010
Beneficiaries/Person 841,214 2,183,534 2,183,534 Expenditures (Afs) 5,488,312,457 5,488,312,454 2,114,391,386
9
C. Social Insurance
40. Afghanistan’s Ministry of Finance oversees contributory schemes covering old-age benefits, disability and survivor benefits, and sickness and maternity benefits for employed persons in the private sector; cooperatives; social organizations; joint enterprises; and government. The old-age pension is for people aged 65 years and older with 10 years contribution, or 55 years old with 25 years of contribution. The benefit’s value is up to 50% of the latest salary without any difference for men or women.
1. Pensions for Formal Sector Workers
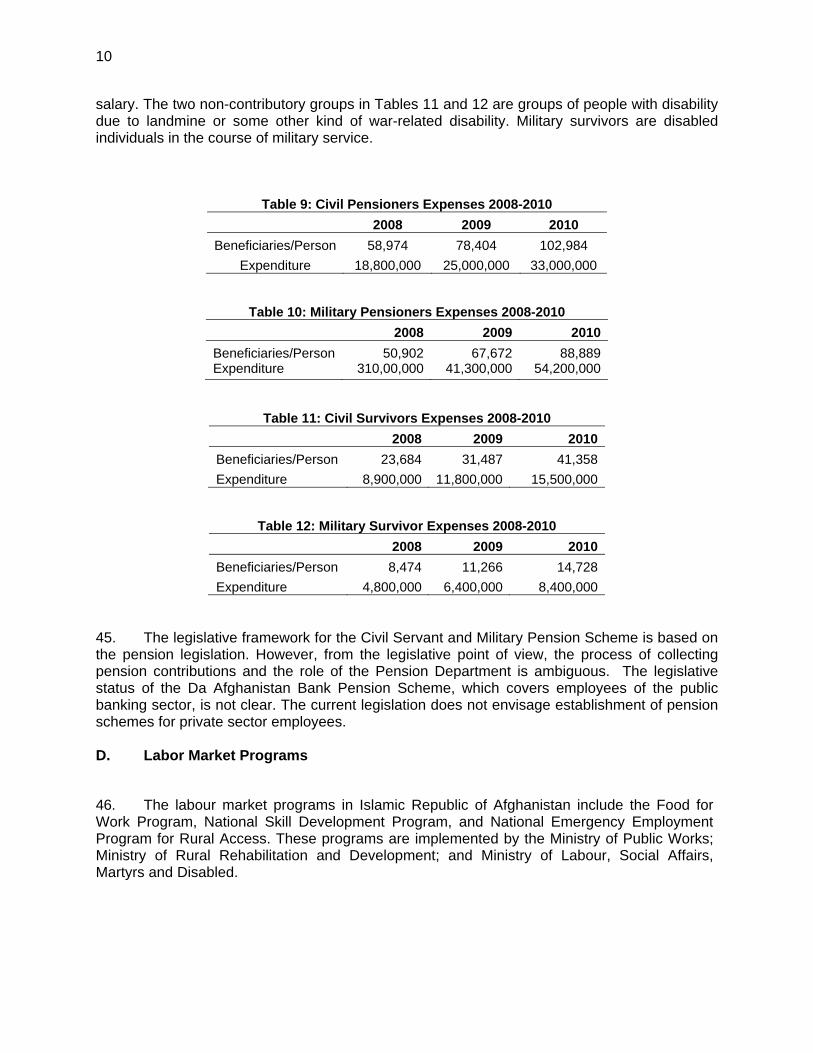
41. The development objectives of this project will contribute to the broader objectives of the Afghanistan National Development Strategy (ANDS) in social protection to build a fiscally sustainable pension system and an affordable social protection system. It will also strengthen the policy capacity and institutional framework of the MoLSAMD to deliver social protection programs. In this context, specific project development objectives will (i) improve the administrative capacity of the public pension program and ensure effective implementation of the new pension regulation that introduces a fiscally balanced pension system for public sector employees; (ii) develop the design and implementation arrangements for a scalable basic safety net program; and (iii) develop policy and administrative capacity of MoLSAMD in the design and management of safety net and pension programs, including design and utilization of a common administrative platform of benefit delivery. 42. The proposed activities will have principal components corresponding to the objectives such as systems and institutions building, pension payouts, and safety net design and policy development. The systems and institutions building for the new pension system is about $5.2 million which will consist of developing and implementing a workable program of reform of the administrative arrangements of the pension program, in coordination with the modernization of the public sector. Activities will include: (i) evaluation of existing systems and processes of the pension program, and design of new mechanisms for benefit delivery; (ii) strategy development for administrative integration with the pensions for families of martyrs and disabled; (iii) design and implementation of the new IT system for the pension department; (iv) outsourcing of IT system maintenance; (v) strengthening systems of pension contribution deduction from payroll, accounting, record keeping, monitoring, and compliance; (vi) digitization of records of the old system; (vii) securing basic office infrastructure in Kabul and the provincial offices; and (viii) securing stable electrical supply in the Kabul office of the Pension Department. 43. The pension payouts amount to $7.1 million and funds for partial payouts of pensions to selected group members of the old scheme will help reduce the outstanding fiscal liabilities. Activities will include: (i) development of the process of beneficiary selection of the payouts; (ii) design, implementation, and monitoring of the payout process; and (iii) cash payments to eligible retirees such as cohorts 80 years old and above. Payments will be made to existing registered pensioners or their survivors who receive regular benefits. All payments will be made in banks on the basis of personal checks issued by the Pension Department, against a specially designated public account. 44. Safety net design and policy development amount to $3 million, including a $1.5 million cash grant for pilots. There are four general categories covered by the safety net scheme which can be categorized into two contributory and non-contributory groups. The contributory groups include civil pensioners and military pensions as shown in Tables 9 and 10. Civil pensioners are civil officials who have contributed half of their salary (16%) and now receive half their last
10
salary. The two non-contributory groups in Tables 11 and 12 are groups of people with disability due to landmine or some other kind of war-related disability. Military survivors are disabled individuals in the course of military service.
Table 9: Civil Pensioners Expenses 2008-2010 2008 2009 2010
Beneficiaries/Person 58,974 78,404 102,984 Expenditure 18,800,000 25,000,000 33,000,000
Table 10: Military Pensioners Expenses 2008-2010 2008 2009 2010 Beneficiaries/Person 50,902 67,672 88,889 Expenditure 310,00,000 41,300,000 54,200,000
Table 11: Civil Survivors Expenses 2008-2010 2008 2009 2010 Beneficiaries/Person 23,684 31,487 41,358 Expenditure 8,900,000 11,800,000 15,500,000
Table 12: Military Survivor Expenses 2008-2010 2008 2009 2010 Beneficiaries/Person 8,474 11,266 14,728 Expenditure 4,800,000 6,400,000 8,400,000
45. The legislative framework for the Civil Servant and Military Pension Scheme is based on the pension legislation. However, from the legislative point of view, the process of collecting pension contributions and the role of the Pension Department is ambiguous. The legislative status of the Da Afghanistan Bank Pension Scheme, which covers employees of the public banking sector, is not clear. The current legislation does not envisage establishment of pension schemes for private sector employees. D. Labor Market Programs
46. The labour market programs in Islamic Republic of Afghanistan include the Food for Work Program, National Skill Development Program, and National Emergency Employment Program for Rural Access. These programs are implemented by the Ministry of Public Works; Ministry of Rural Rehabilitation and Development; and Ministry of Labour, Social Affairs, Martyrs and Disabled.

11
1. FFW or Food for Work Programs
47. These food for work schemes provide food to Afghans while building or repairing community assets such as roads, bridges, schools, reservoirs and irrigation systems. Projects are agreed upon between the Government and local communities. 48. Participation is very limited among the most vulnerable (e.g., kuchis, nomads), but there are more participants from urban areas. Participation rate among the poor is higher than the non-poor, but the latter receives higher wages. The scheme is not active in the poorest provinces, probably because the possibility of participating is not well known. 49. The restructuring of the World Food Program in active harmony with the FFW programs resulted in a community driven and Ministry of Rural Rehabilitation and Development (MRRD) supported intervention model that focuses on economies of scale. It is necessary to distinguish throughout the project cycle between humanitarian and recovery development. The goal should be to consistently bring food deliveries directly under the control of the community level. The FFW programs should also implement a back to basics review of the monitoring and evaluation system, with a strong senior leadership and focus on a small number of relevant FFW indicators.
Table 13: FFW (WFP) Expenses, 2008-2010
2008 2009 2010 Beneficiaries/Person 858,515 841,214 841,214
Expenditures 2,040,175,046 2,114,391,386 2,114,391,386
2. National Skill Development Program (NSDP)
50. This program is under the MoLSMD, a fully government initiated program but co-financed by the Government of Afghanistan and donor agencies. The MoLSMD is responsible for fund raising with projects implemented through NGOs or provincial units to develop skills. This program targets special groups such as the unemployed who do not have special marketable skills; women; and the disabled. The cost and coverage of the program is found in Table 14.
Table 14: NSDP Expenses, 2008-2010 2008 2009 2010
Beneficiaries 1,390 2,960 4,480 Budget 40,700,000 76,500,000 72,900,000
51. This program provides services for employment including schemes of employment facilitation between job seekers and employers such as the job portals (e.g., www.acbar.org, www.jobs.af) and employment services for overseas workers.
3. National Emergency Employment Program for Rural Access
52. The National Emergency Employment Program for Rural Access (NEEPRA), launched in 2002 with pilot road maintenance and rehabilitation projects, aims to provide particularly vulnerable rural groups with a social safety net based on cash for work. This self-targeting program helps supply jobs in road improvement, increasing rural access to services. The main beneficiaries of the project are the rural poor who receive access to basic services and rural
12
employment.
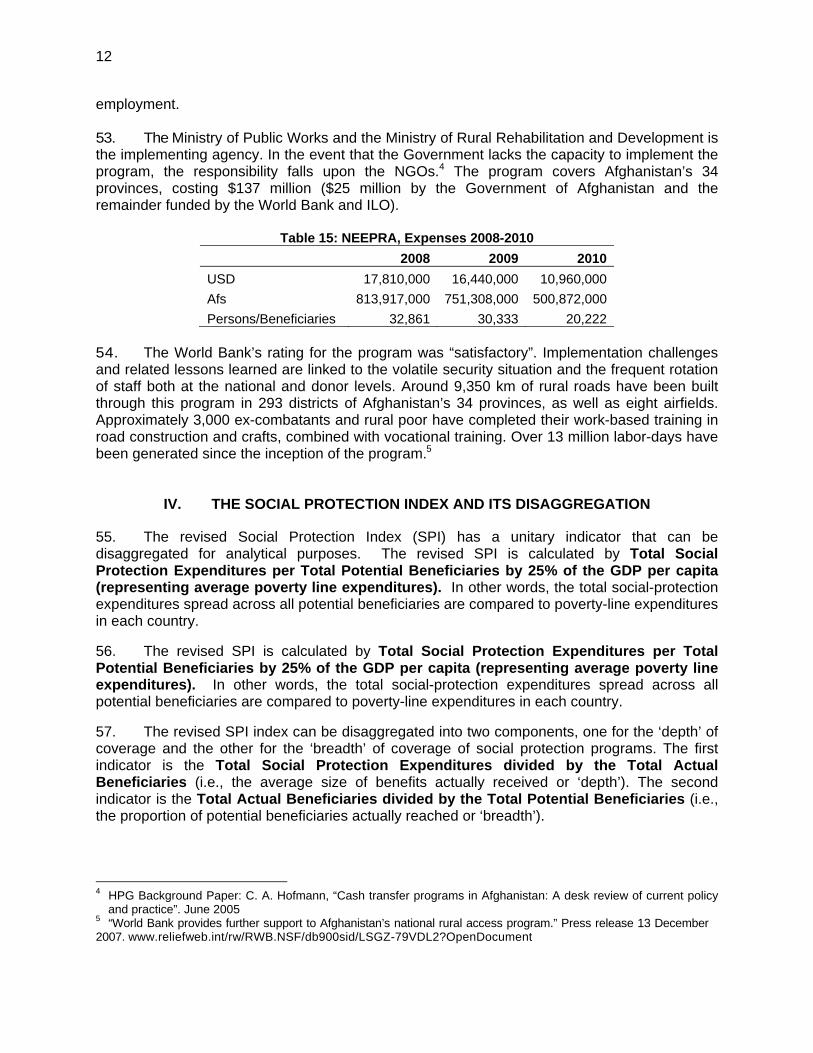
53. The Ministry of Public Works and the Ministry of Rural Rehabilitation and Development is the implementing agency. In the event that the Government lacks the capacity to implement the program, the responsibility falls upon the NGOs.4 The program covers Afghanistan’s 34 provinces, costing $137 million ($25 million by the Government of Afghanistan and the remainder funded by the World Bank and ILO).
Table 15: NEEPRA, Expenses 2008-2010 2008 2009 2010 USD 17,810,000 16,440,000 10,960,000 Afs 813,917,000 751,308,000 500,872,000 Persons/Beneficiaries 32,861 30,333 20,222
54. The World Bank’s rating for the program was “satisfactory”. Implementation challenges and related lessons learned are linked to the volatile security situation and the frequent rotation of staff both at the national and donor levels. Around 9,350 km of rural roads have been built through this program in 293 districts of Afghanistan’s 34 provinces, as well as eight airfields. Approximately 3,000 ex-combatants and rural poor have completed their work-based training in road construction and crafts, combined with vocational training. Over 13 million labor-days have been generated since the inception of the program.5
IV. THE SOCIAL PROTECTION INDEX AND ITS DISAGGREGATION
55. The revised Social Protection Index (SPI) has a unitary indicator that can be disaggregated for analytical purposes. The revised SPI is calculated by Total Social Protection Expenditures per Total Potential Beneficiaries by 25% of the GDP per capita (representing average poverty line expenditures). In other words, the total social-protection expenditures spread across all potential beneficiaries are compared to poverty-line expenditures in each country.
56. The revised SPI is calculated by Total Social Protection Expenditures per Total Potential Beneficiaries by 25% of the GDP per capita (representing average poverty line expenditures). In other words, the total social-protection expenditures spread across all potential beneficiaries are compared to poverty-line expenditures in each country.
57. The revised SPI index can be disaggregated into two components, one for the ‘depth’ of coverage and the other for the ‘breadth’ of coverage of social protection programs. The first indicator is the Total Social Protection Expenditures divided by the Total Actual Beneficiaries (i.e., the average size of benefits actually received or ‘depth’). The second indicator is the Total Actual Beneficiaries divided by the Total Potential Beneficiaries (i.e., the proportion of potential beneficiaries actually reached or ‘breadth’).
4 HPG Background Paper: C. A. Hofmann, “Cash transfer programs in Afghanistan: A desk review of current policy
and practice”. June 2005 5 “World Bank provides further support to Afghanistan’s national rural access program.” Press release 13 December 2007. www.reliefweb.int/rw/RWB.NSF/db900sid/LSGZ-79VDL2?OpenDocument
13
58. The revised SPI can also be disaggregated by the major categories of social protection programs: social insurance, social assistance and labor market programs. When the total expenditures per total potential beneficiaries for each major program are weighted in population terms, the program SPIs add up to the total SPI.
59. Furthermore, the revised SPI can also be disaggregated by expenditures per potential poor and non-poor beneficiaries. Finally, gender-wise data allows the disaggregation of expenditure by gender.
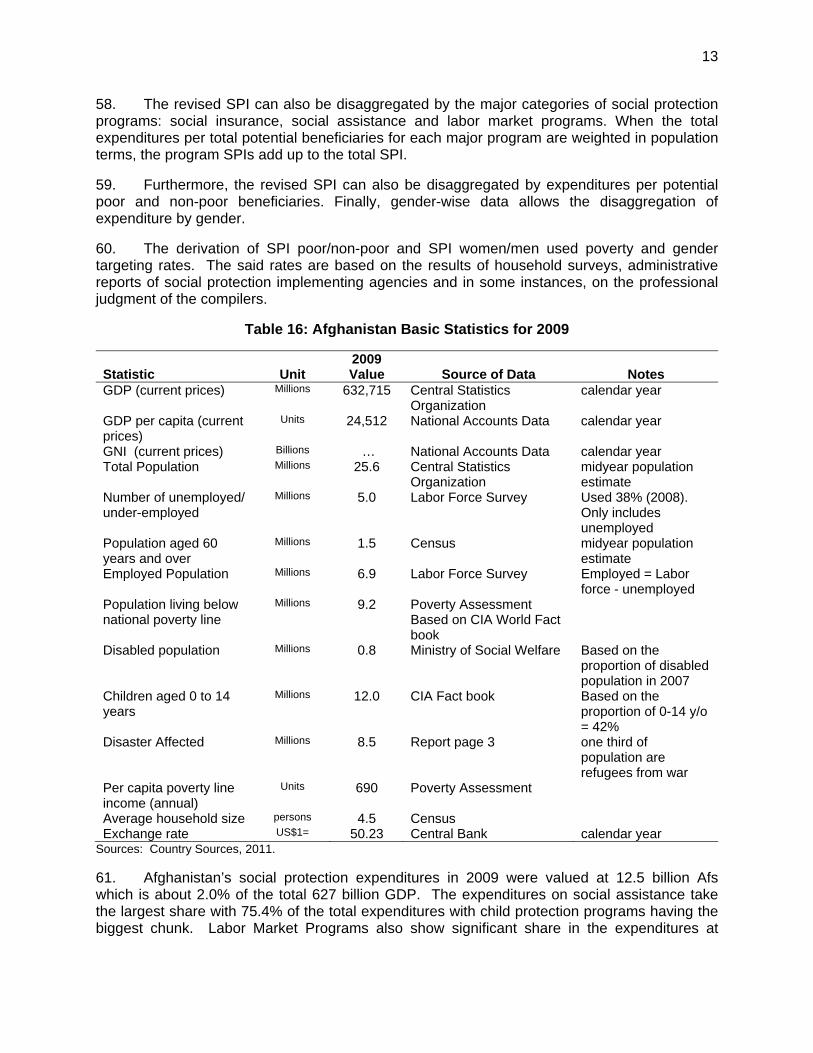
60. The derivation of SPI poor/non-poor and SPI women/men used poverty and gender targeting rates. The said rates are based on the results of household surveys, administrative reports of social protection implementing agencies and in some instances, on the professional judgment of the compilers.
Table 16: Afghanistan Basic Statistics for 2009
Statistic Unit 2009 Value Source of Data Notes
GDP (current prices) Millions 632,715 Central Statistics Organization
calendar year
GDP per capita (current prices)
Units 24,512 National Accounts Data calendar year
GNI (current prices) Billions … National Accounts Data calendar year Total Population Millions 25.6 Central Statistics
Organization midyear population estimate
Number of unemployed/ under-employed
Millions 5.0 Labor Force Survey Used 38% (2008). Only includes unemployed
Population aged 60 years and over
Millions 1.5 Census midyear population estimate
Employed Population Millions 6.9 Labor Force Survey Employed = Labor force - unemployed
Population living below national poverty line
Millions 9.2 Poverty Assessment Based on CIA World Fact book
Disabled population Millions 0.8 Ministry of Social Welfare Based on the proportion of disabled population in 2007
Children aged 0 to 14 years
Millions 12.0 CIA Fact book Based on the proportion of 0-14 y/o = 42%
Disaster Affected Millions 8.5 Report page 3 one third of population are refugees from war
Per capita poverty line income (annual)
Units 690 Poverty Assessment
Average household size persons 4.5 Census Exchange rate US$1= 50.23 Central Bank calendar year
Sources: Country Sources, 2011.
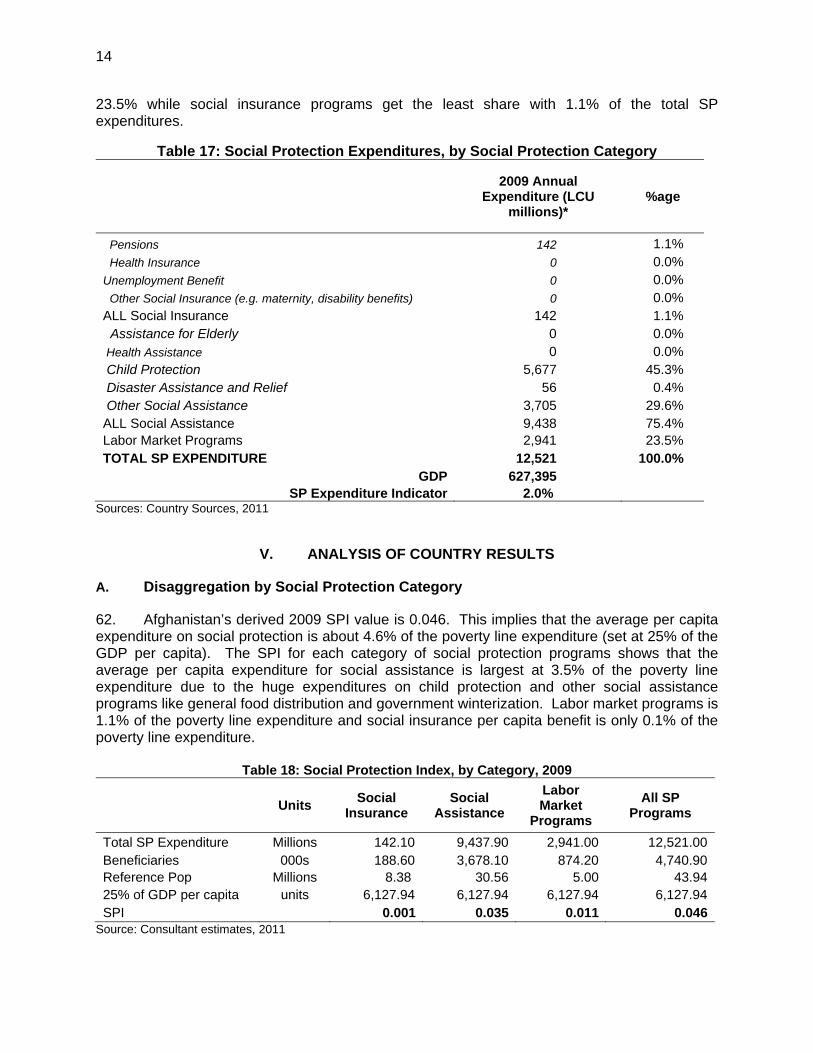
61. Afghanistan’s social protection expenditures in 2009 were valued at 12.5 billion Afs which is about 2.0% of the total 627 billion GDP. The expenditures on social assistance take the largest share with 75.4% of the total expenditures with child protection programs having the biggest chunk. Labor Market Programs also show significant share in the expenditures at
14
23.5% while social insurance programs get the least share with 1.1% of the total SP expenditures.
Table 17: Social Protection Expenditures, by Social Protection Category
2009 Annual
Expenditure (LCU millions)*
%age
Pensions 142 1.1% Health Insurance 0 0.0% Unemployment Benefit 0 0.0% Other Social Insurance (e.g. maternity, disability benefits) 0 0.0% ALL Social Insurance 142 1.1% Assistance for Elderly 0 0.0% Health Assistance 0 0.0% Child Protection 5,677 45.3% Disaster Assistance and Relief 56 0.4% Other Social Assistance 3,705 29.6% ALL Social Assistance 9,438 75.4% Labor Market Programs 2,941 23.5% TOTAL SP EXPENDITURE 12,521 100.0%
GDP 627,395 SP Expenditure Indicator 2.0%
Sources: Country Sources, 2011
V. ANALYSIS OF COUNTRY RESULTS
A. Disaggregation by Social Protection Category
62. Afghanistan’s derived 2009 SPI value is 0.046. This implies that the average per capita expenditure on social protection is about 4.6% of the poverty line expenditure (set at 25% of the GDP per capita). The SPI for each category of social protection programs shows that the average per capita expenditure for social assistance is largest at 3.5% of the poverty line expenditure due to the huge expenditures on child protection and other social assistance programs like general food distribution and government winterization. Labor market programs is 1.1% of the poverty line expenditure and social insurance per capita benefit is only 0.1% of the poverty line expenditure.
Table 18: Social Protection Index, by Category, 2009
Units Social Insurance
Social Assistance
Labor Market
Programs All SP
Programs
Total SP Expenditure Millions 142.10 9,437.90 2,941.00 12,521.00 Beneficiaries 000s 188.60 3,678.10 874.20 4,740.90 Reference Pop Millions 8.38 30.56 5.00 43.94 25% of GDP per capita units 6,127.94 6,127.94 6,127.94 6,127.94 SPI 0.001 0.035 0.011 0.046
Source: Consultant estimates, 2011
15
B. Disaggregation by ‘Depth’ and ‘Breadth’
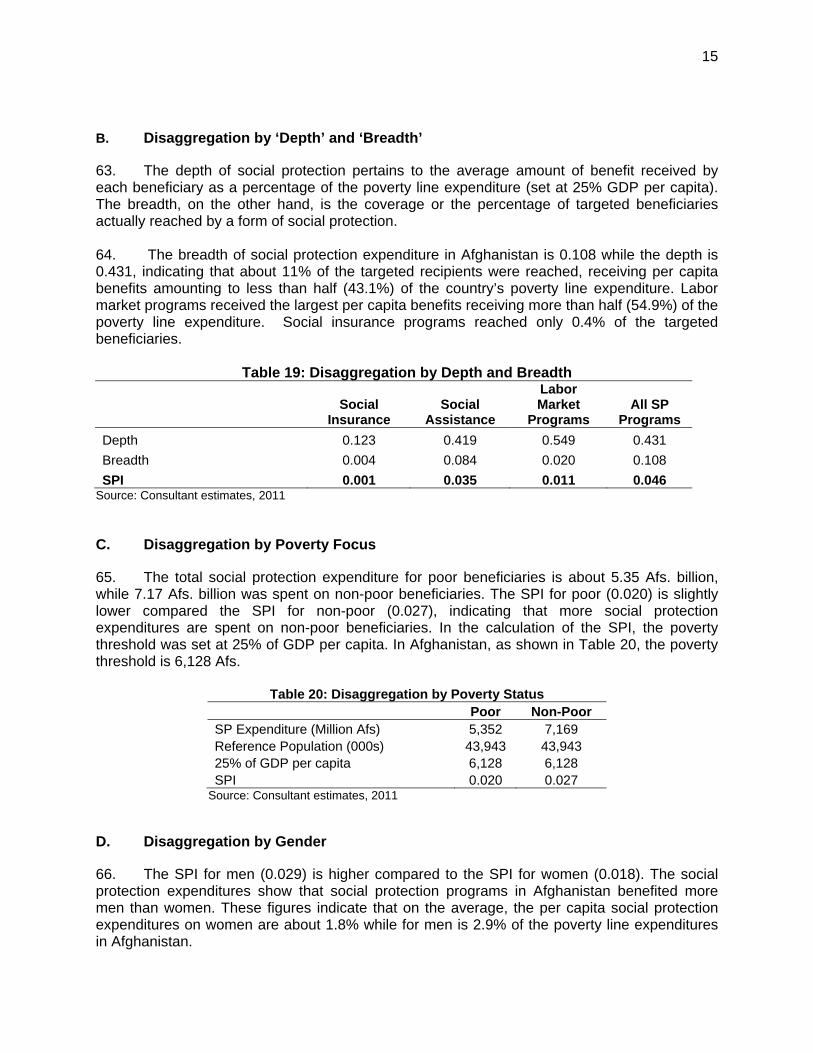
63. The depth of social protection pertains to the average amount of benefit received by each beneficiary as a percentage of the poverty line expenditure (set at 25% GDP per capita). The breadth, on the other hand, is the coverage or the percentage of targeted beneficiaries actually reached by a form of social protection. 64. The breadth of social protection expenditure in Afghanistan is 0.108 while the depth is 0.431, indicating that about 11% of the targeted recipients were reached, receiving per capita benefits amounting to less than half (43.1%) of the country’s poverty line expenditure. Labor market programs received the largest per capita benefits receiving more than half (54.9%) of the poverty line expenditure. Social insurance programs reached only 0.4% of the targeted beneficiaries.
Table 19: Disaggregation by Depth and Breadth
Social
Insurance Social
Assistance
Labor Market
Programs All SP
Programs Depth 0.123 0.419 0.549 0.431 Breadth 0.004 0.084 0.020 0.108 SPI 0.001 0.035 0.011 0.046
Source: Consultant estimates, 2011 C. Disaggregation by Poverty Focus
65. The total social protection expenditure for poor beneficiaries is about 5.35 Afs. billion, while 7.17 Afs. billion was spent on non-poor beneficiaries. The SPI for poor (0.020) is slightly lower compared the SPI for non-poor (0.027), indicating that more social protection expenditures are spent on non-poor beneficiaries. In the calculation of the SPI, the poverty threshold was set at 25% of GDP per capita. In Afghanistan, as shown in Table 20, the poverty threshold is 6,128 Afs.
Table 20: Disaggregation by Poverty Status Poor Non-Poor
SP Expenditure (Million Afs) 5,352 7,169 Reference Population (000s) 43,943 43,943 25% of GDP per capita 6,128 6,128 SPI 0.020 0.027
Source: Consultant estimates, 2011 D. Disaggregation by Gender
66. The SPI for men (0.029) is higher compared to the SPI for women (0.018). The social protection expenditures show that social protection programs in Afghanistan benefited more men than women. These figures indicate that on the average, the per capita social protection expenditures on women are about 1.8% while for men is 2.9% of the poverty line expenditures in Afghanistan.

16
Table 21: Disaggregation by Gender Women Men SP Expenditure (Million Afs) 4,811 7,710 Reference Pop (000s) 43,943 43,943 25% of GDP per capita 6,128 6,128 SPI 0.018 0.029
Source: Consultant estimates, 2011
VI. CONCLUSION AND RECOMMENDATIONS
67. For 2009, the total social protection expenditure for Afghanistan is Afs12.52 billion. Amounting to only 2.0% of GDP, social protection expenditure needs to be improved. 68. The overall SPI shows that relative to the poverty threshold, which was set at the quarter of the per capita GDP, the average per capita social protection expenditures, is only about 4.6%. This figure implies that government could create more social protection programs to help most of the Afghanistan’s poor population get out of poverty.
69. Among the three categories of social protection, social assistance has the highest share of expenditure compared to social insurance and labor market programs. This is essential in a post-conflict country like Afghanistan where the vulnerable population like children and disaster-affected population need to be covered with a form of social protection.
70. The benefit of social protection is about 43.1% of regional poverty line (set at 25% of GDP per capita) and social protection expenditure reached 10.8% of targeted beneficiaries. . 71. Social protection programs benefited more non-poor than poor beneficiaries, with each poor beneficiary receiving only 2% of the regional poverty line. 72. The total social protection expenditure benefited more men than women, with each female beneficiary receiving only 1.8% of the regional poverty line.
73. The depth and breadth imply some degree of ‘generosity’ but improvements on reaching a wider range of vulnerable population should be considered. Indicators reaching more non-poor and men beneficiaries are also worth considering in the social protection programs and policies in the future 74. Using the results of the 2009 SPI, the following improvements and priority policies can be taken into consideration to further improve the index for Afghanistan - (i) strengthen the capacity of Afghanistan National Disasters Management Agency (ANDMA) not only for coordination and policy-making, but also for implementation of programs and projects; (ii) strengthen the capacity and coordination of government line ministries for disaster preparedness and disaster response; and (iii) improve the provincial mechanisms in the delivery of humanitarian assistance.

Appendix 1 17
FORMULATION OF THE SOCIAL PROTECTION INDEX AND ITS MAJOR DISAGGREGATION
A. Structure of the SPI
1. Based from the 2011 SPI Handbook by Baulch’ and McKinley, the SPI is described as a simple and unitary indicator rather than a composite index. It is not an abstract index and should provide a “normative” reference such as the magnitude of the impact on people.
2. The formulation of the revised SPI, under the present study, refers to the total SP expenditures divided by the total potential beneficiaries, and relative to a quarter of GDP per capita. This is mathematically expressed in the following equation:
where
E represents the sum of all SP expenditures; PB represents the sum of all potential beneficiaries; and Z represents poverty-line expenditures which is 25% of GDP per capita.
3. The term “Total Expenditures per Total Potential Beneficiaries” has two parts:
(i) Total expenditures per total actual beneficiaries – this represents the Depth of the SPI;
(ii) Total actual beneficiaries per total potential beneficiaries – this represents the Breadth.
4. It is noted that 25% of GDP per capita is roughly the average national poverty line across ADB’s sample of countries.
B. SPI’s Major Disaggregation
1. Disaggregation by Depth and Breadth
5. The SPI can be disaggregated into measuring the depth of coverage and also, the breadth of coverage. Depth represents the average expenditures that the government spends for every actual beneficiary as a percentage of poverty-line expenditures.
a. Depth
6. The index is measured as
(Total Expenditures divided by Total Actual Beneficiaries); Divide by Z or the poverty-line expenditure. 7. The index is represented by the following equation:

18 Appendix 1
where
D represents Depth E represents the sum of all SP Expenditures, and
Z represents the poverty-line expenditures.
b. Breadth
8. The breadth of coverage index is simply the proportion of the total actual beneficiaries receiving government benefits over the total potential beneficiaries. This is computed as
Total Actual Beneficiaries divided by Total Potential Beneficiaries.
9. The index is represented by the equation
where
B denotes Breadth, AB represents the sum of all actual SP beneficiaries PB represents the sum of all potential SP beneficiaries. 2. Disaggregation by Component
10. The second major disaggregation involves the three-way distinction between components.
11. Each of the three components for Expenditures per Potential Beneficiaries of SI, Potential Beneficiaries of SA, Potential Beneficiaries of LMP is multiplied by its weight. The mathematical relationship between the three components is based on weighted average.
(i) SPI for Social Insurance (includes pensions, health insurance, and unemployment benefit)
(ii) SPI for Social Assistance (includes assistance for the elderly, health assistance, poverty programs and child protection)
(iii) SPI for Labor Market Programs (include training and public works scheme)
12. The formula for the SPI of each of the three categories can be illustrated by the formula for SPIsi. Deriving the SPI for Social Insurance proceeds as
(SI Expenditures divided by SI Actual Beneficiaries) multiplied by
Appendix 1 19
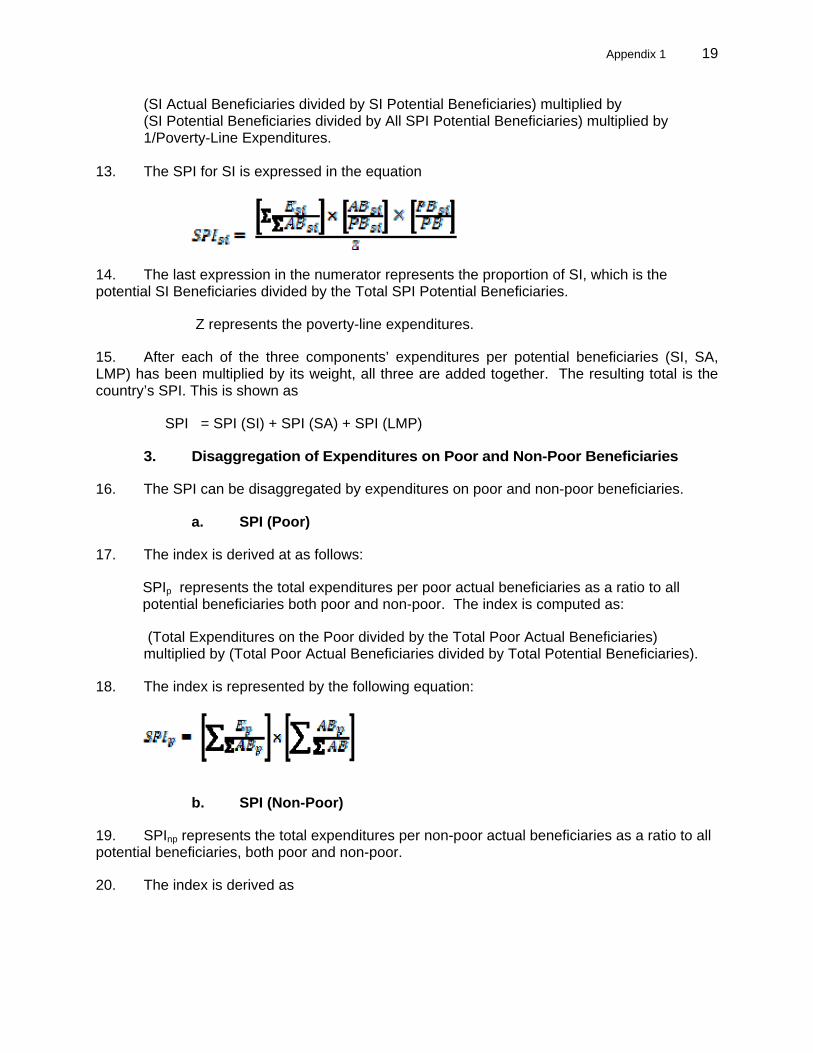
(SI Actual Beneficiaries divided by SI Potential Beneficiaries) multiplied by (SI Potential Beneficiaries divided by All SPI Potential Beneficiaries) multiplied by 1/Poverty-Line Expenditures.
13. The SPI for SI is expressed in the equation
14. The last expression in the numerator represents the proportion of SI, which is the potential SI Beneficiaries divided by the Total SPI Potential Beneficiaries.
Z represents the poverty-line expenditures.
15. After each of the three components’ expenditures per potential beneficiaries (SI, SA, LMP) has been multiplied by its weight, all three are added together. The resulting total is the country’s SPI. This is shown as
SPI = SPI (SI) + SPI (SA) + SPI (LMP)
3. Disaggregation of Expenditures on Poor and Non-Poor Beneficiaries
16. The SPI can be disaggregated by expenditures on poor and non-poor beneficiaries.
a. SPI (Poor)
17. The index is derived at as follows:
SPIp represents the total expenditures per poor actual beneficiaries as a ratio to all potential beneficiaries both poor and non-poor. The index is computed as:
(Total Expenditures on the Poor divided by the Total Poor Actual Beneficiaries) multiplied by (Total Poor Actual Beneficiaries divided by Total Potential Beneficiaries).
18. The index is represented by the following equation:
b. SPI (Non-Poor)
19. SPInp represents the total expenditures per non-poor actual beneficiaries as a ratio to all potential beneficiaries, both poor and non-poor.
20. The index is derived as

20 Appendix 1
(Total Expenditures on the Non-poor divided by Total Non-poor Actual Beneficiaries) multiplied by (Total Non-poor Actual Beneficiaries divided by Total Potential beneficiaries).
21. The index is represented by the following equation:
22. When SPI (Poor) is multiplied to SPI (Non-Poor), the product represents the SPI of the country.

Appendix 2 21
REFERENCES Agency Coordinating Body for Afghan Relief (ACBAR). 2008. NGO Voices on Social Protection.
http://reliefweb.int/sites/reliefweb.int/files/resources/E566F49E60D6CD44C12576F600380EF4-Full_Report.pdf
European Commission. 2007. Country Strategy Paper: Islamic Republic of Afghanistan 2007-
2013. http://www.eeas.europa.eu/afghanistan/csp/07_13_en.pdf Islamic Republic of Afghanistan. 2008. Afghanistan National Development Strategy. http://www.undp.org.af/publications/KeyDocuments/ANDS_Full_Eng.pdf Islamic Republic of Afghanistan. 2008. Afghanistan National Development Strategy: Social
Protection Sector Strategy 2007/08-2012/13. http://moec.gov.af/Content/files/Social%20Protection%20Sector%20Strategy%20-%20English.pdf
J. Sherman. 2009. The Afghan National Development Strategy: The Right Plan at the Wrong
Time? Journal of Security Sector Management. 7 (1). pp. 1-9. E. Sondorp. 2004. Case Study 1: A Time-Series Analysis of Health Service Delivery in
Afghanistan. UK: Department for International Development. UNICEF-Regional Office for South Asia. 2009. Social Protection in South Asia: A Review. World Bank. 2005. Afghanistan Poverty, Vulnerability and Social Protection: An Initial
Assessment. Human Development Unit South Asia Report No. 29694. Washington, DC. World Bank. Social Protection in Afghanistan: Overview.
http://web.worldbank.org/WBSITE/EXTERNAL/COUNTRIES/SOUTHASIAEXT/0,,contentMDK:22179461~pagePK:146736~piPK:146830~theSitePK:223547,00.html
22 Appendix 3
OTHER RESOURCES Afghanistan Statistical Yearbook 2009-2010
Afghanistan Statistical Yearbook 2008-2009
ANDS Progressive Annual Report 1389 (2010-2011)
ANDS Annual Report 1388, the first year report
ARCS/ICRC Annual Report 2009-2010
UNICEF/CFA Pilot project completion and progress report, capacity building