technical assessment on viability of
TRANSCRIPT

ADDIS ABABA UNIVERSITY
SCHOOL OF GRADUATE STUDIES
FACULTY OF TECHNOLOGY
CHEMICAL ENGINEERING DEPARTMENT
TECHNICAL ASSESSMENT ON VIABILITY OF INTEGRATED FRUITS PROCESSING IN ETHIOPIA
By ELIAS ABEBE
ADVISOR:
DR. ENG. SHIMELIS ADMASSU
A Thesis Submitted to the School of Graduate Studies of Addis Ababa University in Partial Fulfillment of the Requirements for the Degree of
Master of Science in Food Engineering
JULY 2007
Addis Ababa, Ethiopia

ACKNOWLEDGMENTS
Above all, I would like to honor and Give Glory to God. Almighty, my lord and savior, who
has been my strength throughout my studies and in this research work too.
My heart felt thank goes to my project advisor, Dr. Shemeles Admassu, for his invaluable
advice and diligent follow up of my progress. I am grateful to staff members of Chemical
Engineering Department, special thanks to Ato Almayehu Ambaw, Head of Chemical
Engineering Department, Dr S.K. Sahoo, and Ato Hintsasilase Seifu who have given freely
their time and experience and provide me with information.
I would like to extend my appreciation for management staff of Awash Melkassa Agriculture
Research Institute (AMARI) for letting me use their Crop Science Department laboratory
facility to conduct my experiments. I am grateful to Staffs= of Crop Science Department of
AMARI especially Senite Yetneberk, Head of Crop Science Department, Ato Mulugeta
Taemer, and W/o Tringo Tadesse for sharing me their invaluable experience and kind support
during my stay there.
I should also not forget my parents, Ato Abebe Bekele and Zewedie Sahilu who were always
showed their support and encouragement. Last but not least, my special thanks to my wife,
Hasset, for her constructive thoughts, encouragement and support during my studies and this
thesis.
i

TABLE OF CONTENTS
CHAPTER TITLE
PAGE
ACKNOWLEDGEMENTS i TABLE OF CONTENTS iv
LIST OF TABLES iv
LIST OF FIGURES vi
ABBREVIATIONS vi
ABSTRACT vii
1 INTRODUCTION 1
1.1 Background 1
1.2 The Current Status of Fruits and Vegetables Production &
Processing in Ethiopia
3
1.3 Statement of the Problem 6
1.4 Objective of the Thesis 7
2 LITERATURE REVIEW 8
2.1 Feasibility Study and Dimension of Business Viability 8
2.2 Utilization of Pineapple and Mango for Processing 12
2.3 Chemistry and Technology of Jam Production 15
2.4 Small Scale Fruit Drying Technology 25
3 METHODOLOGY AND APPROACH 28
4 RESULTS AND DISCUSSION 33
4.1 Selection of Fruits and Fruit Products for Feasibility Study 33
4.1.1 Selection criteria for crops 33
4.1.2 Justification for Processing the Products
34
4.1.3 Product description and application 35
4.2 Market Analysis for Dried Fruits and Fruit Jam 38
4.2.1 Market size and value
4.2.2 Feasible market share of the project
38
42
4.2.3 consumers analysis 44
ii

4.3 Technical Feasibility 46
4.3.1 Raw material and auxiliary inputs supply 46
4.3.2 Raw material quality 52
4.3.3 Formulation and sensory evaluation pineapple and
mango jam
55
4.3.4 Pulp and jam yield of pineapple and mango 59
4.3.5 Drying characteristics of pineapple slices 61
4.3.6 Plant capacity and production program 64
4.3.7 Material and energy balance 65
4.3.8 Processing technology 74
4.3.9 Machinery and equipments 80
4.3.10 Production facilities and services 84
4.3.11 Integration with medium and large industries 94
4.4 Organization and Management 95
4.4.1 Organizational structure 95
4.4.2 Human resource requirement 96
4.4.3 Labour availability and training requirement 98
4.4.4 Direct labour expense 98
4.4.5 Administrative and selling expense 99
4.5 Product Quality, Safety and Legal Requirements 99
4.5.1 Quality assurance System 99
4.5.2 Food safety requirements 103
4.5.3 Legal requirements 104
4.6 Financial and Economic Feasibility 113
4.6.1 Total investment cost 114
4.6.2 Production cost 114
4.6.3 Economic evaluation 115
5 CONCLUSION AND RECOMMENDATIONS 119
6 REFERENCES 121
7 ANNEX A 129
iii

LIST OF TABLES PAGE
Table 1.1 Characteristics of small, medium and large scale processing plants 1
Table 1.2 The status of small scale food manufacturing industries in Ethiopia 2
Table 1.3 Capacity of fruits and vegetables processing plants in Ethiopia 5
Table 2.1 Utilization of pineapple and mango for processing 13
Table 4.1
Specification for pineapple jam , mango jam and dried pineapple 37
Table 4.2 Annual marmalade production by Merti Fruit and Vegetable processing 39
Table 4.3 Import volume (kg) and value (Birr) of jam, jelly and marmalade 40
Table 4.4 Guide line for estimation of market share of a new food business 43
Table 4.5 Summary of market research survey 44
Table 4.6 Area covered and annual production of Pineapple in Sidama zone 47
Table 4.7 Annual consumption and cost of raw materials and auxiliary inputs 52
Table 4.8 Physico-chemical of characteristics of pineapple and mango pulp 54
Table 4.9 Formulation of pineapple and mango jam 55
Table 4.10 Physico-chemical characteristics of pineapple and mango jams 57
Table 4.11 Mean sensory scores of pineapple jams 58
Table 4.12 Mean sensory scores of mango jams 58
Table 4.13 Physical determination of local pineapple cultivars 59
Table 4.14 Pulp and jam yield of pineapple and mango 60
Table 4.15 The effect of slice thickness and air temperature on drying rate 62
Table 4.16 Annual production program for 2007-2012 65
Table 4.17 Process losses in well managed fruits and vegetable processing 66
iv

Table 4.18 Daily consumption of raw materials and auxiliary inputs 69
Table 4.19 Summary of technical ratios associated with the products 73
Table 4.20 Specification of equipments and machineries for raw material preparation 84
Table 4.21 Specification of equipments and machineries for jam making and drying 85
Table 4.22 Total land area (m2 ) and construction cost (Birr) for plant facilities 87
Table 4.23 Daily electrical power consumption of the plant machineries 90
Table 4.24 Comparison of transportation cost for selection of plant machineries 93
Table 4.25 Manpower requirement, qualification level and salary of personals 96
Table 4.26 Sample raw materials record format 110
Table 4.27 Sample production record format for drying process 110
Table 4.28 Samples sales record format 111
Table 4.29 Total investment cost (Birr) 114
Table 4.30 Total production cost (Birr) and unit production cost (Birr/Kg) 115
Table 4.31 Expected cumulative profit of the project under three scenarios 116
Table 4.32 Summary of Break even analysis 118
Table 4.33 Summary of IRR and NPV of the project under three scenarios 118
v

LIST OF FIGURES PAGE
Fig 2.1 Setting range of high esterified pectin 21
Fig.4.1 Ethiopian fruit jam, jelly and marmalade import volume (kg) (2003-2005) 41
Fig. 4.2 Ethiopian fruit jam, jelly and marmalade import value (Birr) (2003-2005) 41
Fig 4.3 Major pineapple and mango producing areas in Sidama zone 47
Fig 4.4 Pineapple and mango peak harvest periods 48
Fig 4.5a Effect of slice thickness on drying time at drying air temperature of 50°C 63
Fig 4.5b Effect of slice thickness on drying time at drying air temperature of 60°C 63
Fig 4.5c Effect of slice thickness on drying time at drying air temperature of 70°C 64
Fig 4.6 Heat inflow and outflow in jam boiling pan 72
Fig 4.7 Process flow diagram for jam Production 78
Fig 4.8 Process flow diagram for pineapple drying 79
Fig 4.9 Processing plant layout 86
Fig 4.10 Organizational structure 95
Fig 4.11
Activity chart for drying and jam making 97
Fig 4.12
Model label for pineapple jam 107
vi
ABSTRACT The feasibility study of small scale processing of pineapple jam, mango jam and dried
pineapple was studied. The methodology used for the feasibility study incorporates the three
environments proposed by Lecup and Nicholson (2000) namely, market, technical (scientific
and technological environment) and financial and economic environments.
Pineapple cultivars (Ananas Comosus L,) Smooth cayenne and Red spanish at full ripening
stage were collected from Teso in Sidama Zone. Mango samples were collected from
Shebedino Woreda in Sidama Zone. Physico-chemical characteristics (pH, titerable acidity
and soluble solid content) of the pulp, product yield (pulp and jam yield) and organoleptic
attributes (color, aroma, flavor, degree of spreadability and acceptability) of the jam
formulated from the crops were evaluated to assess the suitability of the local mango and
pineapple varieties for jam production and consumer acceptability.
It was observed that the pulp extracted from Smooth cayenne cultivar contain higher total
soluble solids (16.23° Brix) and lower titrable acidity (0.7%) compared to the Red spanish
cultivar. The total soluble solid and titerable acidity of the pulp from the local mango was
15.5° Brix and 0.36% respectively. The pH values of the pulp from both crops were found to
be higher than 3.6 which is the maximum limit for formation of optimum gel for High
Methoxy Pectin. The pulp yield (60%) and jam yield (95.5%) were higher for Smooth
cayenne cultivar as compared to the Red spanish.
Jam formulated from Smooth cayenne cultivar has scored the highest mean sensory scores in
all quality attributes except in taste. However, panelists have found no significant difference
(p<0.05) between the jam formulated form Smooth cayenne cultivar and imported pineapple
jam except for flavor. Panelists showed less preference in taste of the jam formulated from
Red spanish cultivar.
Drying air temperature had an important effect on thin layer drying rate of pineapple slices.
Drying at higher temperature, 70°C reduces the drying time by 46.2%, 33.3% and 33.3% for
4 mm, 6 mm and 8 mm slice thickness respectively.
vii

Slice thickness affected the drying time at all drying temperatures. Drying time was
considerably elongated (> 11 hr) for 8 mm slice thickness at all drying air temperatures.
The local demand for fruit jam jellies and marmalade is growing rapidly. Between 2003 and
2005, fruit jam, jelly and marmalade import to Ethiopia increase by 257% and 276% in terms
of volume and value respectively. The import volume and value for these products reached
268,897 kg and 2,361,745 Birr respectively in 2005.
Based on the projected feasible market share of the project the production scale of the
processing plant was set at 33 tones per annum with production mix of 26 tones of pineapple
and mango jam and 7 tones of dried pineapple. The production system was integrated to
process pineapple and mango products to make all year round processing and diversification
of products by utilizing availability of pineapple and mango at different times of the year.
Most equipments and machineries required for this processing plant are available in local
market at reasonable price, special equipments like pulper, peeler/corer, slicer and dryer could
be manufactured by local workshop with support from research institutes and universities.
The total investment cost of the processing plant including working capital is estimated as Birr
379,750. The project is feasible with IRR (30.1%), NPV (Birr 601,360) and the payback
period of (3.3 years) at 15 % profit margin. The project can create employment opportunity
for 16 people Moreover the project could contribute to: development of fruit agri-business
through improved farm gate price, availability of consumer goods, reduce post harvest loss
and lay background for innovations and technology adaptation
viii

CHAPTER I
INTRODUCTION
1.1 Background
The manufacturing industrial sector is the most dynamic component of the goods producing
sectors of all economy. Expansion and development of the manufacturing sector increases
agricultural productivity through providing agricultural inputs and creating demand for
agricultural outputs. In particular, Small- and medium-sized enterprises (SME’s) play a very
important role in the overall economic growth of developing countries. In many of developing
countries, smaller enterprises account for a large share of total employment. They provide a
productive outlet for the entrepreneurial spirit of individuals and assist in the dispersion of
business activity throughout the economy (International Trade Centre, 1993). They are a key
component in economic life, not only because of their number and variety, but because of
their involvement in every aspect of the economy; their contribution to regional development;
the complementary role they play in support of the large sector; and their role as a proving
ground for innovations and adaptations (International Trade Centre, 1993).
Table1.1 describes characteristics of small, medium and large scale processing plants. Large
scale processing involves high capital investment (over US$1,000,000) and sophisticated
techniques of processing which requires a big market in order to realize economy of scale.
Small scale processing plants are characterized by the small number of employees (5-15) and
low capital investment (US$1,000-US$ 50,000) makes them suitable for most entrepreneurs in
developing countries.
Table 1.1 Characteristics of small, medium and large scale processing plant
Scale of operation Characteristics
Small-scale 5-15 employees, capital investment US$1 000-US$50,000
Medium-scale 16-50 employees, capital investment US$50,000-US$1, 000,000
Large-scale More than 50 employees, capital investment over US$1 ,000, 000
Source: FAO (2004). Processed foods for improved livelihoods, Diversification booklet
1
Ethiopian National Statistical Agency has conducted survey on Small Scale Manufacturing
Industries in 2006 (G.C.). The report of the survey (CSA, 2006) indicates that there were
39,027 small scale manufacturing industries all over the country. All of the small scale
manufacturing industries operating in rural areas are grain milling service – rendering
establishments. The report further indicates that, the structural distribution of small scale
manufacturing industries in terms of number of establishment, number of person engaged,
gross value of production and value added were concentrated on grain mill servile sector as
compared to other manufacturing industrial sectors in 2005/2006. It was revealed that 19,744
(50.6 %) prevent of the total establishment constitute grain mill services. This industrial group
also constitutes 47.3 % of the number of persons engaged, 29.1% gross value of production
and 30.9% of value added of the total small scale manufacturing industries during the
reference period.
The other important manufacturing industrial groups in this respect were manufacture of
furniture (14.0 %), manufacture of wearing apparel (10.1%), manufacturing fabricated metal
products (10.1%) and manufacturing of fabricated food products (7.4%).These industrial
groups together contributed 41.7%, 43.7%, 59.4% and 56.0 % of total number of
establishments, number of persons engaged, and gross value of production and value of added
in that order, in the reference period.
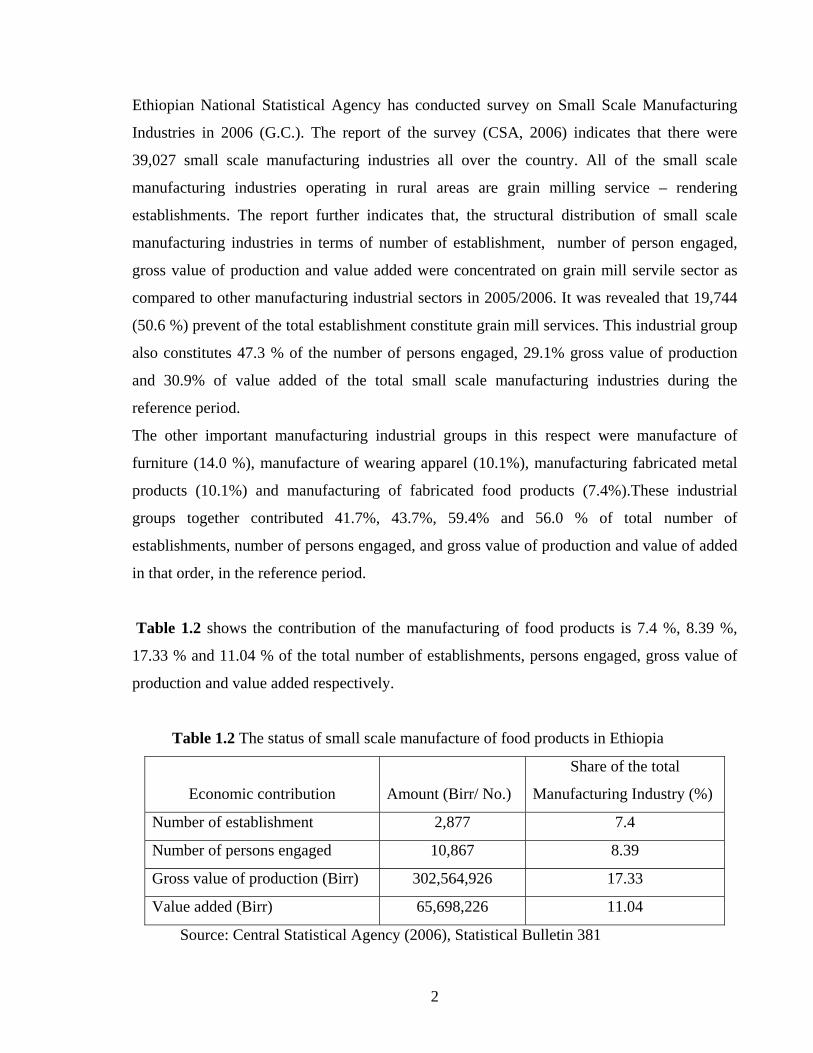
Table 1.2 shows the contribution of the manufacturing of food products is 7.4 %, 8.39 %,
17.33 % and 11.04 % of the total number of establishments, persons engaged, gross value of
production and value added respectively.
Table 1.2 The status of small scale manufacture of food products in Ethiopia
Share of the total
Economic contribution Amount (Birr/ No.) Manufacturing Industry (%)
Number of establishment 2,877 7.4
Number of persons engaged 10,867 8.39
Gross value of production (Birr) 302,564,926 17.33
Value added (Birr) 65,698,226 11.04
Source: Central Statistical Agency (2006), Statistical Bulletin 381
2

1.2 The Current Status of Fruit and Vegetable Production and Processing in Ethiopia
Ethiopia’s wide range of agro-climatic conditions and soil types make it suitable for the
production of diverse varieties of fruits and vegetables, including temperate, tropical and sub-
tropical crops. Most of the soil types in fruits and vegetables producing regions of the country
range from light clay to loam and are well suited for horticultural production. The source of
varieties of fruits and vegetables in Ethiopia can be categorized into two major groups: exotic
and endemic ones. State farms and newly emerged private commercial farms usually use
exotic varieties, while the small farm holders are mainly confined to local or traditional
varieties.
Horticultural production offers the best possible undertaking among the existing agricultural
enterprises due to the special characteristics of most horticultural crops. They are of relatively
high value adding which makes them suitable where land area is limiting and labor intensive.
Therefore they would go long way in solving the existing unemployment problems. They are
also suitable to small-scale farming which is predominant in Ethiopia.
Fruit crops have significant importance with a potential for domestic and export markets and
industrial processing. Pineapples, passion fruits, bananas, avocados, citrus fruits, mangoes,
mandarin, papayas, guava, grapes, asparagus and vegetable crops of economic importance
such as tomato, melon, pepper, chilies, onion, carrot, green beans, green peas, cabbages, okra,
cauliflower, and cucumbers are produced in Ethiopia. The major vegetables produced for
domestic consumption are cabbages, tomatoes and onion, while green beans and peas have
recently emerged for export market.
According to information obtained from the Ministry of Agriculture and Rural Development
(MoARD), the total area under fruits, vegetables and root crops is about 450,932 he in
2003/04. Out of which 66 % is under root crops while vegetables and fruits occupy 25 % and
9 %, respectively. Of the total land area under cultivation in the country during the same year,
the area under fruits and vegetables is less than one per cent (i.e. 0.05%), which is
insignificant as compared to food grain crops.
3

Less than 10 % of the total production is held by large state farms, while small holders
account for some 92% of the acreage and 90% of the yield (Dendana et al., 2005).
Some of the constraints of horticultural production are related to the perishable nature of their
produce. This is a major problem especially when marketing horticultural produce. During
peak harvest seasons, fruit and vegetables are sold at throw away price because of lack of
means to preserve and store the products. Therefore, in order to prolong the shelf life of the
post harvested produce, processing is necessary. Processing contributes towards expansion of
market of the processed products in availing it during off-seasons and also increasing its
value. Producers of fruit and vegetables will increase production if there is a market for their
produce.
In Ethiopia, fruits and vegetables processing sector is underutilized. Currently, there are only
5 fruits and vegetables processing plants in the country. Table 1.3 describes the location,
major products and production capacity of the current fruits and vegetables processing plants
in Ethiopia. These plants presently process limited products: tomato paste, orange marmalade,
guava nectar, vegetable soup, canned vegetables and wine. In general, processed products are
mainly geared to domestic markets.
4

Table1.3 Capacity of fruits and vegetables processing plants in Ethiopia
Name of Processing Plant
Production Capacity Location Ownership Major Products
Melge Wendo/ Southern Nations, Nationalities and Peoples National Regional State
- Tomato paste Melge Wendo Food Processing Factory
Private (850 g can) (foreign) - Peeled tomato 30 tones per
day - Tomato paste (410 g can)
Gonder Food Processing Factory
Gonder/ Amhara National Regional state
Private - Tomato paste 1,250 cans
in a single shift
(foreign) (850 g can)
Merti/ Oromia
National Regional State
Merti1Processing Factory
State-owned - Tomato paste 5,000 tones per year - Orange
marmalade -10.9
million L per year
Awash Winery2 Addis Ababa State-owned - wine
Green Star Food Company (Ethiopian
DebreZeit/ Private
(foreign) 9,990 tons per year - canned vegetable Oromia
Branch)
1The factory’s processing capacity could reach only 41,000 quintals if tomato products are
processed throughout the year. On the other hand, it could process over 61,000 quintals per
year if only orange products are processed throughout the year. When the two products are
mixed in equal amounts over a production cycle of one year, the factory’s processing capacity
will be lowered to 40,000-41,000 quintals per year
2 Comprises 3 wine factories, namely Lideta, Mekanisa and Addis Ketama.
5

1. 3 Statement of the Problem
The survey on small scale manufacturing industries conducted by in Central Statistical
Agency in 2006 has identified three major problems limiting the industries from working at
full capacity: low market demand (57.1%), shortage of raw material supply (11.1%) and
shortage of spare parts (7.1%) respectively. The industries were not full operation at all the
year round due to shortage of market demand and water. The major reason for lack of market
was incompetence for local and foreign products in price. The survey result further indicates
lack of information to decide type of activity and markets were major problems. It was
reported that 37.8 % of the total industries face shortage of initial capital when commencing
operation.
All the above stated problems are result of lack of detail feasibility study before planning to
establish the manufacturing industries. A feasibility study can be defined as a controlled
process for identifying problems and opportunities, determining objectives, describing
situation, defining outcomes and assessing the range of cost and benefits associated with
several alternatives for solving the problem (Thompson, 2003). Prior to establishing a new
fruit and vegetable processing in order to utilize the potential from the sector, it is essential to
carry out detail feasibility study to determine the potential of the business. A feasibility study
for establishment of fruit and vegetable processing plant consists of
Availability of raw material and seasonal variation
Market availability for finished products and semi processed products
Quality of raw material in the varieties needed for the various types of finished
products
Processing capacity related to raw material availability ,quantity and seasonal
variation
Processing equipments capacity for the mentioned points
Availability of workforce in the area and resources for training them to the required
level
Availability of utilities: electricity , running potable water, adequate waste disposal
Transport access to raw material fields and to products market
6

1.4 Objective of the Thesis The overall objective of this research was to identify the viability of integrated fruits
processing industries in Ethiopia.
The specific objectives of this research were to
Assess potential fruit and vegetable crops that are suitable for small-scale processing
in Ethiopia.
Conduct technical and economic viability analyses.
Identify legal, food safety, environmental and other requirements for these small scale
processing industries.
Study the opportunities of integration with medium/large scale processing industries.
7

CHAPTER II
LITERATURE REVIEW 2.1 Feasibility Study and Dimension of Business Viability
A business feasibility study can be defined a controlled process for identifying problems and
opportunities, describing situations, defining successful outcomes and assessing the range of
costs and benefits associated with several alternatives for solving a problem (Thompson
2003). The business feasibility study is used to support the decision-making process based on
a cost-benefit analysis of the actual business or project viability. It is an analytical tool that
includes recommendations and limitations, which are utilized to assist the decision-makers
when determining if the business concept is viable (Drucker, 1985; Hoagland & Williamson
2000; Thompson, 2003).
2.1.1 The Importance of a Business Feasibility Study
It is estimated that only one in fifty business ideas are actually commercially viable (Gofton,
1997; Bickerdyke et al., 2000). Therefore a business feasibility study is an effective way to
safeguard against wastage of further investment or recourses. If a project is seen to be feasible
from the results of the study, the next logical step is to proceed with the full Business Plan.
The research and business planning stage are reduced. A thorough viability analysis provides
an abundance of information that is also necessary for the business plan (Hoagland &
Williamson, 2000; Truitt, 2002; Thompson 2003).The strength of the recommendations can be
weighed against the study ability to demonstrate the continuity that exists between the
research analysis and the proposed business model. Recommendations will be reliant on a mix
of numerical data with qualitative, experience-based documentation.
2.1.2 Dimensions of Business Viability The business feasibility study places the findings of the Dimensions of business viability
model assessments in to a formal business of an enterprise which an audience can easily
8
understand. The following represents the framework of the dimensions of business viability
(Thompson, 2003):
Market Viability
Technical Viability
Management Model Viability
Economic and Financial Model Viability
2.1.3 Business Feasibility Study Outline The basic premise of a feasibility study is to determine the potential for success of proposed
business venture. The success of a feasibility study is based on the careful identification and
success. The elements to include in a feasibility study vary according to the type of business
venture analyzed and the market. The followings are typical factors to be included(Thompson,
2003).
Description of the Project
Type and quality of product(s) or service(s) to be marketed.
Outline the general business model.
Include the technical processes, size, location, kind of inputs, etc.
Specify the time horizon from the time the project is initiated until it is up and
running at full capacity.
Market Feasibility
Describe the size and scope of the industry, market and/or market segment(s).
Estimate the future direction of the industry, market and/or market segment(s).
Describe the nature of the industry, market and/or market segment(s) (stable or
going through rapid change and restructuring).
Identify the life-cycle of the industry, market and/or market segment(s).
Industry competitiveness
Industry concentration (few large producers or many small producers).
Analysis of major competitors.
9

Barriers/ease of entry of competitors into the market or industry.
Concentration and competitiveness of input suppliers and product/service
buyers.
Price competitiveness of product/service.
Market Potential
Identify the demand and usage trends of the market or market segment in
which the proposed product or service will participate.
Examine the potential for emerging, niche or segmented market opportunities.
Assess estimated market usage and potential share of the market or market
segment.
Sales Projection
Estimate sales or usage.
Project sales under various assumptions.
Access to market outlets.
Identify the potential buyers of the product/service and the associated
marketing costs.
Investigate the product/service distribution system and the costs involved.
Technical Feasibility
Determine facility needs
Estimate the size and type of production facilities.
Investigate the need for related buildings, equipment, facilities, etc.
Suitability of production technology
Investigate and compare technology.
Determine reliability and competitiveness of technology (proven or unproven,
state-of-the-art, etc.).
10

Identify limitations or constraints of technology.
Availability and suitability of site
Access to markets, raw materials, transportation , labor and production inputs
(electricity, natural gas, water, etc.).
Investigate emissions potential.
Analyze environmental impact.
Identify regulatory requirements.
Explore economic development incentives.
Raw materials
Estimate the amount of raw materials needed.
Investigate the current and future availability and access to raw materials.
Assess the quality and cost of raw materials.
Other inputs
Investigate the availability of labor including wage rates, skill level, etc.
Assess the potential to access and attract qualified management personnel.
Financial/Economic Feasibility
• Estimate the total capital requirements
Estimate capital requirements for facilities, equipment and inventories.
Replacement capital requirements and timing for facilities and equipment.
Estimate working capital needs.
Estimate start-up capital needs until revenues are realized at full capacity.
Estimate other capital needs.
11
• Budget expected costs and returns of various alternatives
Estimate expected costs and revenue.
Estimate the profit margin and expected net profit.
Estimate the sales or usage needed to break-even.
Estimate the returns under various production, price and sales levels.
Assess the reliability of the underlying assumptions of the financial analysis
benchmark against industry averages and/or competitors (cost, margin, profits,
ROI, etc.).
Identify limitations or constraints of the economic analysis.
Project expected cash flow during the start-up period.
Project income statement, balance sheet, etc. when reaching full operation.
Organizational/Managerial Feasibility
Outline alternative business model
Identify the proposed legal structure of the business.
Identify any potential joint venture partners, alliances or other important
stakeholders.
Identify availability of skilled and experienced business managers.
Identify availability of consultants and service providers with the skills needed
to realize the project, including legal, accounting, industry experts, etc.
Outline the governance, lines of authority and decision making structure.
2.2 Utilization of Pineapple and Mango for Processing
Pineapple and mango could be processed in to wide diversity of products. Table 2.1 shows
alternative products from green, ripe and waste of pineapple and mango crops. Pineapple and
mangoes are processed at two stages of maturity. Green fruits are used to make chutney,
pickles, slices and dehydrated products.
12
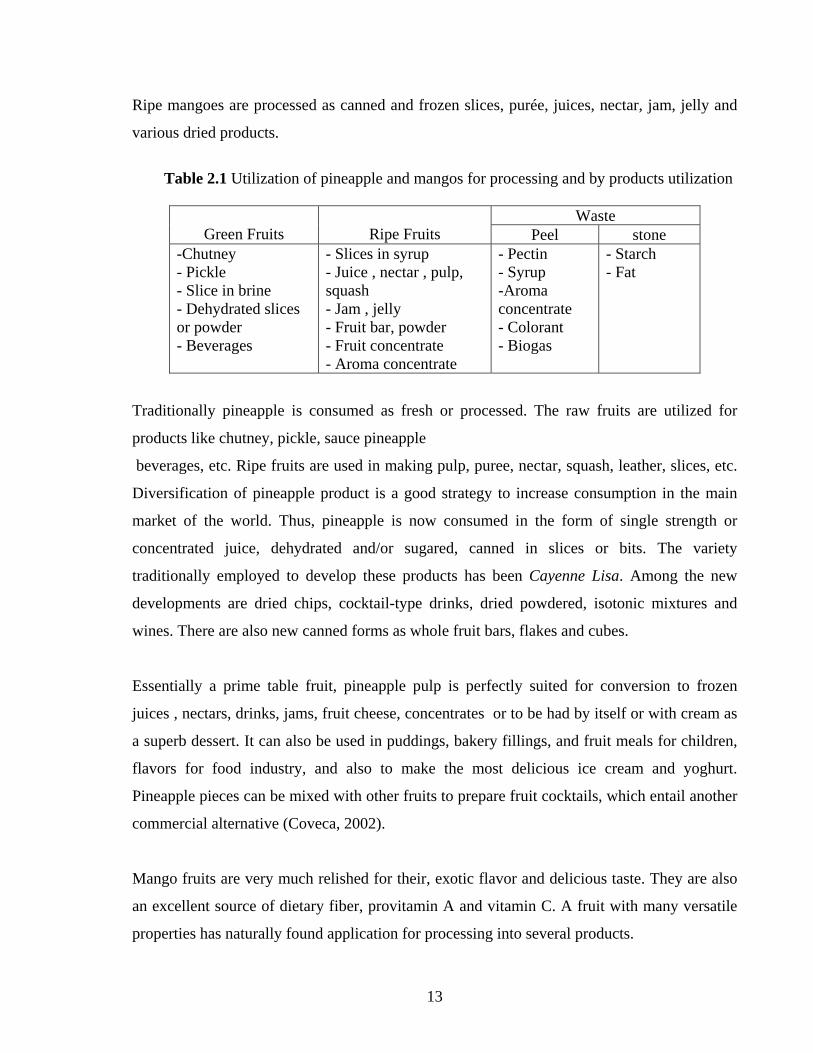
Ripe mangoes are processed as canned and frozen slices, purée, juices, nectar, jam, jelly and
various dried products.
Table 2.1 Utilization of pineapple and mangos for processing and by products utilization
Waste
Green Fruits Ripe Fruits Peel stone -Chutney - Slices in syrup - Pectin - Starch - Pickle - Juice , nectar , pulp,
squash - Syrup - Fat
- Slice in brine -Aroma concentrate - Dehydrated slices
or powder - Jam , jelly - Fruit bar, powder - Colorant
- Beverages - Fruit concentrate - Biogas - Aroma concentrate
Traditionally pineapple is consumed as fresh or processed. The raw fruits are utilized for
products like chutney, pickle, sauce pineapple
beverages, etc. Ripe fruits are used in making pulp, puree, nectar, squash, leather, slices, etc.
Diversification of pineapple product is a good strategy to increase consumption in the main
market of the world. Thus, pineapple is now consumed in the form of single strength or
concentrated juice, dehydrated and/or sugared, canned in slices or bits. The variety
traditionally employed to develop these products has been Cayenne Lisa. Among the new
developments are dried chips, cocktail-type drinks, dried powdered, isotonic mixtures and
wines. There are also new canned forms as whole fruit bars, flakes and cubes.
Essentially a prime table fruit, pineapple pulp is perfectly suited for conversion to frozen
juices , nectars, drinks, jams, fruit cheese, concentrates or to be had by itself or with cream as
a superb dessert. It can also be used in puddings, bakery fillings, and fruit meals for children,
flavors for food industry, and also to make the most delicious ice cream and yoghurt.
Pineapple pieces can be mixed with other fruits to prepare fruit cocktails, which entail another
commercial alternative (Coveca, 2002).
Mango fruits are very much relished for their, exotic flavor and delicious taste. They are also
an excellent source of dietary fiber, provitamin A and vitamin C. A fruit with many versatile
properties has naturally found application for processing into several products.
13

In most mangos growing countries the fruit is generally consumed fresh. Non-fibrous pulpy
mango varieties are normally used for processing. Physio-chemical composition is an
important factor in the selection of suitable cultivars for processing. The green fruit should be
freshly picked from the tree. Fruit that is bruised, damaged, or that has prematurely fallen to
the ground should not be used.
By-Product Utilization When a pineapple is processed, the outer peel and the central core are discarded. The waste
called pineapple bran accounts for about 50 % of the total pineapple weight, accounting 10
tons of fresh bran or 1 ton of dry bran per hectare. The bran can be used fresh for feeding, but
is usually dehydrated with approximately 9 % molasses and ground into animal feed. The
bran, either fresh or dried, is a good feed for ruminants and is usually mixed with grass as the
roughage portion of the diet. Furthermore, the waste from pineapple processing can be used to
make syrup, alcohol, vinegar, wine and three organic acids (citric acid, malic acid and
ascorbic acid). Roughages from pineapple leaves can also be used to produce clothes and
paper. The paper has special qualities regarding its thickness and softness and is used in many
countries to produce bank notes (FAO, 2004).
Pineapple peel wastes, which are seasonal, comprise of peels and rags. Their disposal poses a
serious environmental pollution problem. Since pineapple peel is rich in cellulose,
hemicellulose and other carbohydrates it was found to be a potential substrate for methane
generation by anaerobic digestion. Ensilaging of pineapple peel resulted in the conversion of
55% carbohydrates into volatile fatty acids. The ensilage of pineapple processing wastes
reduced the biological oxygen demand by 91 %. Biogas digester fed with ensilaged pineapple
peel resulted in the biogas yield of 0.67 m3/kg volatile solids (VS) added with methane
content of 65% whereas fresh and dried pineapple peels gave biogas yields of 0.55% and 0.41
m3/kg VS added and methane content of 51 % and 41 % respectively (Swaroopa & Nand,
2004).
Peels and stones are the main wastes of mango processing, and constitute 35-55 % of unripe
as well as ripe mangoes (Bhatnagar & Subramaniam, 1973). Useful products can be recovered
from these wastes and simultaneously avoid the disposal problems. During extraction of pulp,
pulper waste in addition to peel with adhering pulp is obtained. These wastes can be treated
14

with pectin enzyme; their juice can be expressed and used in preparation of nectar, vinegar or
concentrated and used as coloring and flavoring agent (Beerh et al., 1976, Ethiraj & Suresh,
1992). Mango peel can also be used for biogas production by anaerobic digestion. The result
of pilot plant studies have shown that mango peel, supplemented with essential nutrients, can
yield biogas at a rate as high as 0.68 m3/kg volatile solids added; the gas contains 52 %
methane (Krishnananad, 1994). Ensilage helps to preserve mango peel for a longer time and
aids hydrolysis of polymeric constituents of mango peel.
The mango seed kernel is a rich source of carbohydrates, proteins, fat and tannins. The kernel
fat (average 12 %) has potential use for preparing sweet meats (Narasimhacher et al., 1977), in
soap manufacturing and as a substitute for cocoa buffer (Baliga et al., 1981). Mango seed
kernels also contain 47-63 % starch, of which 19-22 % is amylase (Roy & Mitra, 1970).
Gelatinization characteristics and temperature, paste clarity, retrogradation, swelling power
and solubility of seed starch have been studied (Hemavathy, 1987). The starch is also
recommended for food use.
2.3 Chemistry and Technology of Jam Production
The quality criteria for jams and marmalades are decisively determined by the flavour, colour
and consistency as well as state of preservation and distribution of fruits. These properties
depend to a high degree on the quality of raw materials used, with special importance given to
the proper selection of suitable fruits. The characteristic nature of the finished product is
further determined by the addition of sugars, pectin and food grade acids.
2.3.1 Raw Materials
1. Fruits
Fruits used in the manufacture also generate an influence on the gelling process, depending on
variety, state of ripeness and storage conditions. The most important factors are the fruit own
pectin content, the sugar and acid content as well as the amount of minerals and other fruit-
specific constituents. With increasing ripeness, enzymes within the fruit degrade the fruit-
inherent pectin and the pulp becomes softer. The fruit-own acid amount decreases and the
sugar amount increases.
15

The most important quality criteria for fruits used are: optimal state of ripeness, full fruity
flavor, variety-specific color, no blemishes (no spots, no bruises), sufficient consistency
(solidity of form), and soluble solids content in agreement with quality standards, perfect
hygienic condition of raw materials and packaging.
2. Sugar
Sugars are one of the main constituents of jams, jellies and marmalades and influence the
shelf life of these products decisively through the soluble solids content. At the same time
they provide taste, flavor, consistency and coloring. For jam production, mostly refined sugar
or white sugar (sucrose) is used. During cooking, sucrose is partially inverted. This intended
chemical reaction (splitting of sucrose into glucose and fructose by binding water) is
influenced by: the pH-value, temperature and time of boiling. The formation of invert sugar
prevents the crystallization of the sucrose in the finished product. On the other hand, a
complete inversion of sucrose may lead to crystallization of the glucose in the product.
3. Pectin
The gelling agent pectin, a constituent of the vegetable cell structure, strengthens and supports
(as ‘’bonding substance”) the structure of the plant tissue. Any vegetable raw material with
high pectin content is suitable for the production of pectins. Apples and citrus fruits have
always been of superior importance for the production of pectin destined for the manufacture
of jams, jellies and marmalades. The highly valuable pectin substances are present in the pulp
and, in especially high concentration, the cell walls. This explains why the press residues from
the production of apple and citrus juice are so valuable for large-scale extraction of high-
quality pectins. In the plant cell, pectin molecules are so tightly linked to the other molecules
in the cellular wall that they cannot be extracted by water. This water-insoluble form is called
protopectin. The protopectin becomes soluble by acid hydrolysis and is then extracted with
hot water. The pectin rich extract is mechanically cleaned and carefully concentrated. Pectin is
then precipitated with alcohol from the liquid extract. Alcohol-insoluble pectin substances in
pure form are obtained by this alcohol precipitation. Pectin substances are subsequently dried
and ground to powder. The gel strength of pectin as a natural substance differs due to the raw
material used and is standardized by blending with dextrose or other sugar types.
16
The molecular structure of pectins is composed of D-galacturonic acid molecules, which are
linked to each other in alpha-1-4-glycosidic formation to polygalacturonic acid. Part of the
carboxyl groups is methoxylated with methanol. Neutral sugars like arabinose, galactose and
xylose, which are linked as side chains to the pectin macromolecule, as well as the
interruption of the main chain by rhamnose make pectin a heteropolysaccharide. Therefore
often neutral polysaccharides like galactane, arabane and also starch are concomitant
substances of isolated pectin. However, the specific composition depends on the raw material.
The gelling power of pectin is mainly based on its molecular weight, i.e. the number of chain
links a pectin molecule boasts, which is kept intact by extremely sensitive production process.
If all carboxyl groups of the polygalacturonic acid are free, i.e. not methoxylated, one gets
pectic acid, its salts are called pectates. Pectic acid in nature is methoxylated (or esterified) in
different degrees with methanol and thus becomes pectin. If the degree of esterification is
higher than 50 %, it is called high methylester pectin; with less than 50 % it is called low
methylester pectin. In selecting the suitable type of high methylester pectins – rapid, medium
or slow set ones – the following criteria are of great importance: filling temperature and
texture.
The criterion for selecting suitable pectin based on filling temperature is that the
manufactured product’s setting temperature is lower than the filling temperature. This
prevents pre-gelling, which would weaken the gel and exert a negative influence on the
texture. The height of the filling temperature is determined by the machines and systems
applied in the process as well as the size of the packing containers used. Containers which
cool more quickly allow a filling at high temperatures of 85 °C and 95 °C. Rapid set pectins in
this temperature range provide good gelation as well as an even distribution of the fruits in the
jelly. Containers which pass through a long cooling phase, on the other hand, require low
filling temperatures of e.g. 70°C to 75 °C, since otherwise the consistency of the product
might suffer by heat-related damage affecting the center. For this purpose, slow set pectins are
used that do not tend to pre-gel in the temperature range in which they are applied.
Furthermore, the setting rate may be controlled by adding suitable buffer salts.
17

Such gelling retardation is usually practiced in the confectionery industry where processing
with very high soluble solids is practiced.
Texture is a very important parameter for sensory acceptance and depends largely on the
composition of raw materials such as the type of fruit, fruit quantity and sugars used, but also
on the selected type of pectin. Pectins with a very high degree of esterification result in firm
gels which are characterized by the rheological parameter “highly elastic with a very low
viscous phase”. Pectins with a medium degree of esterification result in firm gels which are
characterized by the rheological parameter “highly elastic with an important viscous phase”.
Apple pectins form gels with definitely higher viscous share than citrus pectins with the same
degree of esterification do.
For the purpose of spreading jam on slices of bread or sweet rolls, it should be noted that
jellies with a lower elastic phase are more difficult to spread. In the extreme case, this implies
that jellies spread on with a knife will just break up from a large lump into many smaller
pieces. Gels with a higher viscous share, on the other hand, will spread on easily and form a
coherent jelly layer on the bread. The proper selection of the suitable type of pectin will thus
be a great help in controlling the desired rheological parameters of jam, jelly and marmalade.
4. Citric acid
The optimum gel set normally obtained in the pH range of 2.8 to 3.3 for high methoxy- pectin.
If the acid value is too high (pH-value under 2.8) the gel elasticity will be increased and the
gels become firm and brittle. If the acid value is low (pH-value above 3.3) the gel structures
become very soft. When exceeding a certain pH limit, gelation is no longer possible. The
presence of buffer salts in fruits, e.g. salts of citric and malic acid, suppresses the impact of pH
modification by added fruit acids, part of the effective acid value is compensated. To get into
the desired pH-value, the acid dosage must be raised. On the other hand, if the pH-value in
fruits is too low, it can be increased in order to prevent pre-gelation (Oakenfull and Scott,
1984). If the aim is a stabilization of the pH-value within strict limits, as is the case for jams,
one profits from the specific properties of fruit acids to form excellent buffer systems with
their salts, e.g. in the combination citric acid and sodium citrate. Among these acids, citric
18
acid has been used in fruit jam production due to its taste, antioxidant characteristics,
solubility and storage and handling characteristics. Citric acid is naturally present in a great
number of fruits. It is crystalline and dissolves well in water. Citric acid is a weaker acid than
tartaric acid, but stronger than lactic acid. The flavor of the citric acid is naturally sour and
harmonious. This acid, too, is preferred to be added as 50 % aqueous solution. As a rule, fruit
acids are added to the cooking batch towards the end of the cooking process. This prevents
pre-gelling, which might occur if the temperature of the cooking batch drops below the setting
temperature due to the blending in of the sugar or the pectin solution. Even if all parameters
are adjusted in an optimal way and the temperature is higher than the setting temperature, a
processing time, which is too long, can lead to pre-gelation after the addition of acid.
2.3.2 Gelling Mechanisms
The association of pectin chains leads to the formation of three-dimensional networks that
means to gel formation. Two or more chain segments bond together and start to interact.
These are longer segments of regular sequence, which are ruptured by the incorporation of
rhamnose or by the branching of the chain. Different types of chain associations exist which
are determined by the degree of esterification of high methylester pectins. Two decisive
factors initiate gel formation:
1. The addition of sucrose or other sugars has a dehydrating effect on the pectin molecules,
which facilitates the approach of the polymer chains and enables a cross linkage of the
hydrogen bridges.
2. A lowering of the pH in a medium suppresses the dissociation of free carboxyl groups and
thus reduces the electrostatic repulsion between the chains. The mechanism described above is
referred to in literature as”sugar-acid gelling mechanism”. Recent studies, however, have
shown that high methylester pectins are stabilized in the gel by a combination of hydrophobic
interactions and hydrogen bridge bondings, which means that the term ”sugar-acid-gelling
mechanism” requires a closer definition. Methylester groups are the hydrophobic part of a
pectin molecule. Hydrophobic forces push them into aggregate formations, while they are
constantly striving to keep the contact surface with water as small as possible. Moreover,
hydrogen bridges are formed, e.g. between non-esterified carboxyl groups, at a sufficiently
low pH-value in the gel and the dissociation of the carboxyl groups is largely suppressed.
19

According to Oakenfull and Scott (1984), the hydrogen bridge bondings are the responsible
factor in the stabilization of a pectin network, but without the hydrophobic interaction of the
methylester groups, gelation would not occur for energetic reasons. The higher the degree of
esterification, the greater the impact of hydrophobic forces in the gelation. The number of
hydrogen bridges over free, non-methoxylated carboxyl groups decreases. If the pH is too
high, the number of interfering factors (-COO-) decreases as well (in case of a too high
product pH, dissociated carboxyl groups interfere with the network formation). These factors
affect the gelling-pH-range. If the degree of esterification is extremely high, the suppression
of dissociation does not matter anymore.
The higher the degree of esterification, the higher also the pH-value is, at which gelation sets
in. Completely methoxylated pectins (100 % degree of esterification) thus do not require any
acid for gelation. The required high sugar concentration for the gelation of high methylester
pectins could be explained, according to Oakenfull (1984), by the fact that certain sugars have
an additionally stabilizing effect on the hydrophobic interactions. Low methylester pectins
also gel according to the mechanism described above. However, they may form a gel even in
relative independence from soluble solids content and pH-value if multivalent cations, e.g.
calcium ions, are present. The following model has been used to describe this gelling
mechanism: pectins chains cluster during the gelation process. Due to their bent shape they
create cavities between them, which become occupied by carboxyl and hydroxyl groups. Both
the formation of cavities and the carboxyl and hydroxyl groups favour the association of
pectin chains by calcium gelation.
2.3.3 Factors Affecting Gel Formation 1. Soluble Solids and pH-Value Figure 2.1 shows the setting ranges of sugar-acid-gels with high methylester pectin (setting
range of high methylester pectins, Pilnik, 1980). Certain solids/ pH areas are identified in
which pre-gelling or no gelling (liquid) occurs. Pre-gelling means that at the given filling
temperature the products have already started setting. Pumping, stirring or depositing during
filling destroys this incipient gel structure.
20

The formation of a homogeneous gel is no more possible. Therefore the texture of a pre-
gelled product is mushy with reduced gel strength. The figure also explains that sugar and acid
may substitute each other within certain limits in their contributions to the gel strength. Lower
sugar content requires for proper gelation a lower pH-value. Higher pH-values are feasible
with higher sugar content. If the sugar content remains constant, gels with lower pH values
will be firmer and more brittle; the same applies if the pH stays the same and the amount of
sugar increases. The optimal soluble solids content for jams is 60-65 % (Oakenfull, 1984).
Replacing part of the sucrose with glucose syrup or the use of the optimal type of pectin may
prevent the formation of brittle gels and the crystallization of sugar and dextrose.
Figure 2.1 Setting range of high esterified pectins
Source: Setting range of high methylester pectins, Pilnik, 1980
The lower limit for proper gelation of high methylester pectins is a soluble solid content of
about 55 %. With 58-55 % soluble solids, high methylester pectins with a very high degree of
esterification (above 75 %) show the best results. High methylester pectins do not gel at very
low soluble solids contents, for this application low methylester and amidated pectins and
calcium salts are used instead. Substituting sucrose by other sugars or polyols has an influence
on the gelling characteristics of pectins and the texture of gels. The reasons for these
phenomena are not yet sufficiently studied. It is assumed that this is due to the different water
activities of the sweeteners at similar solids contents or substance specific differences in the
stabilizing effect (Oakenfull, 1984).
21

2. Setting Time and Setting Temperature
High methylester pectins are commercially available within a range of 50 to 80 % degree of
esterification. This group of pectins shows a quite specific gelling behavior. Under the
virtually same conditions, higher methylester pectins set faster and at higher temperatures than
pectins with lower degrees of esterification. This explains the importance of setting time and
setting temperature for the evaluation of high methylester pectins. The setting temperature is
the temperature at which gelation starts subsequent to gel manufacture in the following
cooling period. There is no setting above this temperature, even though all criteria for gel
formation are met. Gelation of extremely high methylester pectins, as was shown in test gels,
may, for example, start already at 90 °C , that of less high methylester pectins at 60 °C .
The setting temperature depends on the raw material, the production technology, the pectin’s
degree of esterification, the sugar content and the product’s pH-value, the amount of buffer
salts added and the cooling rate. The faster the products are cooled, the lower the setting
temperature required. Therefore, to compare setting temperatures, pectin gels are usually
produced under reproducible, defined conditions and one subsequently observes at what
temperature gelation sets in. The setting time is defined as the period in which a fruit
preparation starts to gel at a defined, constant temperature after terminating the cooking
process. The definition for rapid set pectins might be that under defined conditions gelation
requires ten minutes at 90°C and slow set pectins need 20 minutes at 65 °C.
Rapid set pectins differ in their optimal pH-value from slow set ones. While slow set pectins
achieve their greatest gel strength at a pH of 3.0 and less, the optimal pH-value for rapid set
pectins is raised to higher pH-values(3.3 -3.6). For extra rapid set pectins, a pH-value under
3.0 may even be unfavorable, especially if the soluble solids content is clearly above 60%.
Gelation may then set in during the cooling process, with the very real risk of pre-gelling.
Soluble solids of around 60 % and a pH value of about 3.0 are suitable for rapid set as well as
slow set pectins (Figure 2.1). The differences are due to the setting temperature, setting time
and gel texture. With high soluble solids contents and low pH-values, slow set pectins must be
used to avoid pre-gelling .With high soluble solids and high pH-values, on the other hand,
rapid set pectin are recommended otherwise gelation is not possible.
22

2.3.4 Technology of Jam Making
The production of jam, jellies and marmalades involve three major processing steps: pectin
preparation, boiling and filling and sealing processing stages.
Pectin Preparation
The production of pectin solutions by way of a suitable system is the best possibility to add
standardized pectin to the cooking process. If only slow-speed mixers are available, the pectin
is mixed with about five times the amount of sugar and this mixture is dissolved in water with
a temperature of at least 80°C. In this way, a 3-5 % pectin solution can be produced. If a
dissolver with high-speed mixer is available (more than 1.500 rpm), pectin is added while the
mixer is running and the water temperature is at least 80 °C, directly poured into the mixer
flux and dissolved. Depending on the type of pectin, pectin solutions of 5-7 % may be
produced. Nowadays, 7-10% pectin solutions can be produced, on modern injection mixers.
The evaporating water volume is clearly smaller when such high percentage pectin solutions
are added in the cooking process than it is the case with 3-5 % pectin solutions.
If sugar solutions or sugar syrups are used, pectin may also be suspended in 10 times the
amount of liquid sugar/sugar syrup while stirring slowly. This suspension may then be
incorporated into hot water with at least 80°C, which results in a 3-5 % pectin solution. If
pectin is directly added to the product batch, i.e. not as pectin solution, this is best achieved
with the above mentioned pre-mix of pectin and 5-10 times the amount of sugar or a
suspension with liquid sugar or sugar syrups. In this case it is important to observe that the
soluble solids content in the batch during the dissolving of pectin is not above 30 %, since it
otherwise interferes with the solubility.
Boiling
This concentration of jams, jellies and marmalades is done with the objective to create a
finished product with a long shelf-life and with the required soluble solids content. During
cooking, a sufficient exchange between sugars, liquid medium and fruits is achieved, which
prevents water loss in the finished product during storage.
23

In the large-scale production of jams, jellies and marmalades with cooking kettles two basic
types exist for the concentration process: open system boiling and vacuum boiling. Cooking in
an open kettle is nowadays practiced only in a few, small companies. Cooking in vacuum
systems is done in closed kettles under reduced pressure. The great benefit of this cooking
method consists in low cooking temperatures and short cooking times. Both criteria are
decisive for an optimal finished product as regards to appearance, colour, flavour and
vitamins, since the raw materials are exposed to only minimal stressing. Short cooking times
and relatively large cooking batches also guarantee the economic efficiency of the process.
The pre-heated fruit/sugar mix is fed from the pre-heater by negative pressure into the kettle
and reduced by boiling under vacuum with constant stirring. To prevent foaming, edible oils
and fats such as mono- and diglycerides of edible fatty acids may be added. The pectin
solution is then metered and further reduced by boiling under vacuum until the desired final
soluble solids content is reached. Due to the low cooking temperatures, which may be as low
as 65 °C, slow to medium rapid set pectins are applied in this process. Once the final soluble
solids content is reached, the batch will be vented and acid is added. The temperature of the
cooked material increases in this process, before discharging it should reach 80-85 °C in order
to guarantee germ-free filling. Sophisticated cooking systems with flavour recovery condense
the volatile aroma components from the escaping steam and return them to the cooking batch
before its discharge.
Filling of Jams, Jellies and Marmalades
Jams, jellies and marmalades are discharged from the vacuum kettle by way of pumps or, even
more sensitively, by gravity into heated filling troughs with agitators, from which they are fed
into filling machines. The temperature of the cooking batch at the time of filling is 70-85 °C.
The relatively high filling temperature and capping under vacuum with headspace sterilization
guarantees germ-free filling and perfect stability during storage. Before closing the jars,
suitable measures for the sterility of the product surface during the filling process are
recommended. UV-radiation of the empty jars or the caps before filling is also indicated to
protect against secondary infections. After filling and capping, the jars pass through a tunnel
24

cooler and are sprinkled with cold water which lowers their temperature to 40-50°C. The rapid
lowering of the temperature prevents caramelization and colour changes in the filled article
and brings the product into a temperature range; in which gelation is initiated and an optimal
gel texture may be slowly formed. After cooling and labeling, the products go into packaging.
Before distribution, however, the jars should be stored until the product has thoroughly gelled.
2.4 Small Scale Fruit Drying Technology Drying is defined as the application of heat under controlled conditions to remove the majority
of water normally present in a food by evaporation. The main purpose of drying is to extend
the shelf life of foods by a reduction in water activity. This inhibits microbial growth and
enzyme activity, but the processing temperature is usually insufficient to inactivate. Drying
causes deterioration of both the eating quality and the nutritional value of food. The design
and operation of dehydration equipment aim to minimize these changes by selection of
appropriate drying conditions for individual food items.
Fruit Drying Equipments
A range of technologies is used for fruit drying which include tray, tunnel dryers, freeze
dryers. With the exception of tray dryers, none of these are appropriate, in terms of cost and
output, for use by small and medium enterprises. While small tray dryers are available from
Europe and the USA, they cost in excess of Birr 250, 000 which makes them unaffordable and
uneconomic for producers in developing countries. This suggested the need for small,
controllable, powered tray dryers capable of producing high quality products that could be
constructed by engineers in developing counties to a great extent from locally available food
grade materials.
Hot convective air dryers are generally used for drying piece-forms fruit and vegetables such
as banana, mango and pineapple slices, and various tea leaves (Chua & Chou, 2003).
Depending on the methods used to heat the air convective dryers are classified as solar,
electric and fuel fried which consists of biomass, biogas or petroleum products.
25

1. Solar Dryers
Solar drying can generally be classified into two broad categories active and passive. Passive
solar dryers use only the natural movement of heated air and they can be constructed easily
with inexpensive, locally available materials which make them appropriate at small level. In a
direct passive dryer the food is directly exposed to the sun’s rays. Direct passive dryers are
best for drying small batches of fruits and vegetables such as banana, pineapple, mango,
potato, carrots and French beans. Active solar dryers are designed incorporating external
means, like fans or pumps, for moving the solar energy in the form of heated air from the
collector area to the drying body. The food is not exposed to the direct rays of sun which
reduces the loss of color and vitamins. The collector can be large and thus heat greater
quantities of air.
There are a large number of different designs of solar driers, described in detail by
Brenndorfer et al. (1985) and Imrie (1997). Small solar driers have been investigated at
research institutions particularly in developing countries, for many years but their often low
capacity and insignificant improvement to drying rates and product qualities have restricted
their commercial use to only three of four application world wide.
Solar tunnel dryer becomes popular due to considerable reduction of drying time and
significant improvement of product quality. Solar tunnel dryer have been used to dry fruits,
vegetables, root crops, medicine preparation and fish (Gauhar, 1998). The utilization of solar
energy as the only energy source offers the possibility to use the solar tunnel dryer at nearly
any sunny location, even in remote areas with out access to the mains electricity or in areas
without reliable energy supply. The operational cost of the solar tunnel dryers in terms of
energy amount to zero. The solar tunnel dryers basically consists three major components: the
photovoltaic drive, the solar air heater and the drying compartment. The only part that may
need replacing from time to time is the plastic cover. The life span of the plastic cover is
mainly dependent on the location and care taken of the material. It has a life span in excess of
5 years.
26
The performance of the solar tunnel dryer is significantly dependent on the weather condition.
Both the heat required for removing the moisture as well as the electricity necessary for
driving the fans are generated by solar energy. The weather conditions have the biggest
influence on the capacity product that can be dried with in a certain time period. During the
rainy season, which is not the best season for the utilization of any kind of solar dryer, the
most efficient method of using the solar tunnel dryer is in combination with an artificial dryer.
If the weather conditions are fine, the product can be dried as in the dry season, using only the
solar tunnel dryer while under rainy conditions, the product will be pre-dried during the day
time in the artificial dryer. This method is also suitable if the production has to be extended
due to an increased request for high quality dried products.
2. Electric Dryers
One option for drying fruits and vegetables is an installation of electric convective dryer. This
option requires a regular electrical energy supply or the purchase of a generator. These driers
are available in size that ranges from units that handle 300 kg of fresh fruit per one day drying
cycle up to units that handle one tone per drying cycle. The electrical energy requirement
varies between 25 KVA to 50 KVA.
3. Fuel Fired Dryers
Situations where the control over drying conditions in sufficient using solar dryers, it is
necessary to use fuel-fired dryers. There are large numbers of different types and the selection
depends on the required throughput, types of fuel and level of investment that is available. The
main limitation of fuel-fired dryers, in addition to higher capital and operating costs, are that
they are more complex to build and maintain and therefore requires skilled labor for operation
and maintenance.
27

CHAPTER III
METHODOLOGY AND APPROACH Lecup and Nicholson (2000) proposed four main areas of feasibility study for enterprise
development: market and economic environment, scientific and technological environment,
resource management and social and institutional environment. The methodology used for the
present feasibility study incorporates the three environments proposed by Lecup and
Nicholson (2000) namely, market, technical (scientific and technological environment) and
financial and economic feasibility. However the scope of this study does not include the social
and institutional environment.
Materials
Two pineapple varieties (Ananas comosus L.), Smooth Cayenne and Red Spanish at full
ripening stage were collected from “Teso” pineapple growing farmers’ farm in “Sidama
Zone”. The ripening stage of pineapple is identified as peel color turns from green to yellow
at the base of the fruit. The pineapple crops were stored at 8 + 1 °C for 7 days until physico-
chemical analysis was conducted .Temperatures of 7 to 12 °C are recommended for storage of
pineapples for 14 to 20 days, provided that the fruits are at the color break stage (Paull, 1993).
Ripe mango samples were brought from “Shebedino” Woreda local market and kept 8+ 1°C
for 7 days until physico-chemical analysis was conducted. Ripe mango fruit can be stored at 7
to 8 °C (Jobin -Decor, 1988). High Metoxy Pectin (HMP) of grade 150 was used for jam
making experiments which were obtained from Awash Melkassa Agriculture Research
Institute.
Market Feasibility
The market feasibility study was conducted for fruit jam, jelly and marmalade in the domestic
market. The assessment involves the market and consumers study. The market analysis entails
investigation into the market size and value, major suppliers, competition in the market and
the market opportunity in the sector. The consumer analysis is conducted to identify major
market outlets and customers perception towards the product quality, packaging and labeling
and price of the imported fruit jam.
28

The import volume and value of fruit jam, jelly and marmalade was collected from imported
items database from Ethiopian Customs Authority (ECA). Local production was obtained
from the sole producer and distributor, Merti Jeju fruit and Vegetable Processing Plant, annual
sales report (2002-2006). Consumers’ survey was conducted to identify major market outlets
and customers perception towards the product quality, packaging and labeling and price of the
imported fruit jam. Consumers’ survey questionnaire was prepared and stratified random
sampling method was applied to interview 10 randomly taken customers who were found
buying jam in selected supermarkets at five sub-cities of Addis Ababa: Arada, Gulelle, Bole,
Kirkose and Akaki-Kaliti. The market share of the project was estimated from demand and
supply analysis and proposed guidelines for estimation of market share for a new food
business (Anon, 1992). Market information for dried pineapple was referred from Center for
the Promotion of Export from Developing Countries (CBI) website http://www.cbi.nl.
Technical Feasibility
The assessment of the technical feasibility entails investigation into the current and future
availability and accesses to raw materials, the quality, cost of raw materials, processing
technology required, the processing location, the status of the infrastructure and level and
availability of human resource and expertise.
Jam Formulation and Production
The formulation and laboratory scale production of pineapple and mango jams were carried
out in Awash Melkasa Agriculture Research Institute (AMARI) crop science department
laboratory. The fruit were sorted, cleaned with potable water, peeled, sliced in sharp stainless
steel knives and pulped in electric homogenizer. The pH, titerable acidity and total soluble
solid content of the fruit pulps were determined using AOAC methods (1984). Standard jam
formulation procedures were developed based on physico-chemical determination of the fruit
pulps and Codex Alimentarius standard for jam and jellies (Codex Alimentarius, 1981). The
pH of the fruit pulps were brought to 3.2 for obtaining good consistency products. The upper
limit for successful gel set is pH 3.6 (Smith, 2006).
29
The amount of pectin in the formulated batch was determined from laboratory trial
production and observation of product consistency. After formulating the jam, sugar, fruit
pulp and pectin were weighed accordingly. The pectin was mixed with 5 times its weight of
sugar to make it evenly dispersed. Fruit pulp and the remaining sugar were mixed and started
to heating. The prepared pectin was added to the heating mixture and allowed to boil until the
total soluble solid (TSS) content of the jam reach 68° Brix. The jam was then hot filled in
clean sterilized glass jars. The jars were sealed and cooled in ambient temperature.
Sensory Evaluation
Sensory evaluation of prepared pineapple and mango jams and imported pineapple and
mango jams was conducted. The sensory evaluation was conducted 4 week after the jam was
prepared. The prepared jams were kept refrigerated for 4 weeks at 12°C and at room
temperature for 24 hours before sensory evaluation was carried out. The sensory evaluation
was carried out using untrained sensory panels consisting of students and staff from the
faculty of technology AAU. The numbers of panelists were 20 (9 female and 11 male). The
sensory method employed is a nine point hedonic scale to assess color, taste ,flavor, aroma, ,
degree of spreadblity and overall acceptability; 9 (like extremely), 8 (like very much), 7 (like
moderately), 6 (like slightly),5 (neither like or dislike) , 4 (dislike slightly),3 (dislike
moderately ),2 (dislike very much) 1 (dislike extremely). The panelists were briefed how to
use sensory evaluation forms and terminologies of sensory attributes. Each panelist received
samples numbered with three digit random numbers and presented according to a randomized
complete block design. Bread was used as carrier since jam is normally consumed with bread.
Statistical analysis was done using Statistical Package for Social Scientists (SPSS version
13.0).
Drying Experiment
A drying experiment using a convective dryer was conducted at AAU Chemical Engineering
Laboratory to determine the effect of drying air temperature and slice thickness on drying time
of pineapple slices. The dryer consists of a drying chamber, electrical heater, blower and
temperature controller (20 to 80°C, dry bulb temperature). The Smooth Cayenne pineapple
cultivar were collected from “Teso” and stored at 8+ 1°C in the refrigerator. The pineapple
30

was left for 2 hours after it has been taken out from the refrigerator to equilibrate with room
temperature . The pineapple is then washed, peeled and sliced to uniform slice thickness.
At the start of each test, the dryer was switched on and the required temperature was set. After
the dryer reached the steady state condition, sliced pineapple samples were uniformly spread
in rectangular stainless steel meshed trays size (12 mm X 7mm) and kept in drying chamber of
the dryer. Air flow was parallel to the two faces and drying commencing from both major
faces of the slice. Drying air temperature (+ 0.1°C), relative humidity (+ 1%), and sample
weight ((+ 0.001 g) were recorded every 10 minutes for the first 60 minutes , every 15 minute
up to 120 minutes and every 30 minutes there after. The drying was continued until the
moisture content of the samples drop to 15g/100 g. The moisture content of the dried samples
was measured by placing the samples at 70 °C in the atmospheric oven and kept until the
weight difference fall below 0.1g between two consecutive measurements taken in 1 hour
interval. Determination of the moisture content was made in triplicates and the mean values
were used in moisture ratio determinations.
In thin layer drying, the moisture ratio during drying is calculated as follows
co
c
MMMM
MR−−
=
Where MR is the dimensionless moisture ratio, M is the moisture content at time t, and
the initial and equilibrium moisture content respectively on dry basis. However during
drying the samples were not exposed to uniform relative humidity and temperature
continuously, so the moisture ratio was simplified to Pala et al. (1996) and Doymaz (2004), to
oM
cM
oMMMR =
The moisture content at time t was determined from measurements of wet sample taken and
the weight of dried sample.
Food Safety Quality and Legal Requirements
Both national and international food safety and legal requirements applicable to the processed
fruit based products were assessed.
31

The Quality and Standard Authority of Ethiopia (QSAE) is the National Standard Body
(NSB) of Ethiopia. Specific and general legislative requirements applicable to production of
jam were obtained from QSAE. For international requirements Codex Alimentarius standards
and additional specific requirements for the export food stuffs to European Union (EU) market
were referred from Center for the Promotion of Export from Developing Countries (CBI)
website http://www.cbi.nl.
Financial and Economic Evaluation
The financial and economic evaluation incorporates determination of investment cost,
production cost and economic viability of the proposed project. The economic feasibility of
the project was evaluated based on the profitability, Internal Rate of Return (IRR), Net Present
Value (NPV) and payback period. The break-even analysis was also carried out. Finally the
overall feasibility of the project was evaluated based on market, technical and financial
feasibility results.
32

CHAPTER IV
RESULTS AND DISCUSSION
4.1 Selection of crops and processed Products for Feasibility Study In this chapter the basis for selection of crops, processed products and description of
processed products is discussed.
4.1.1 Selection Criteria for Crops Mango and pineapple were selected for technical assessment for viability of product
development from these fruit crops. Currently they are considered as potential crops for export
and local market. The crops are being promoted by the Fruit and Vegetables and Horticulture
Development Department of the Ministry of Agriculture and Rural Development (MoARD)
and The Netherlands Development Organization (SNV) in its program to support Business
Organizations and their Access to Market (BOAM). Furthermore, these crops were selected as
potential commodities for investment based on two overriding yardsticks which are ‘potential
market opportunity’ and ‘outreach to small holder farms’. Additional selection criteria were:
High added value either through agro-processing or knowledge
High market value
Long term comparative advantage
Enhanced group activities and position of women
Social acceptance and support by government polices
The SNV has initiated the value chain analysis for these crops. Value chain analysis is a
model that helps to identify the bottleneck and the necessary intervention at each stage of the
chain, from farm input supply to product delivery. The pineapple value chain has been doing a
lot of activities to improve the supply and quality of pineapple fruit. One of these activities is
identification of suitable areas for pineapple development in Southern Nations, Nationalities
and Peoples Regional (SNNPR) state. Experts from Awassa Agriculture Research Institute
(AARI) and SNNPR investment commission have identified 16,650 ha of land suitable and
available for pineapple production in SNNPR. In Sidama Zone 3,000 ha of land was found to
be suitable for pineapple production. (Legesse et al., 2006)
33

Activities are also initiated to improve the supply and quality of pineapple plantlet. The first
large scale pineapple plantlet micro propagation (500,000 plantlets) has started by Jimma
Agriculture Research Center (JARC). This seedling will be distributed to farmers in the
SNNPR state Cooperative Promotion bureau. It is planned to cover 28.8 and 1.25 ha of land in
Sidama Zone by Smooth Cayenne and Red Spanish new plantlets respectively.
Mango crops were selected due to the potential of the crop to integrated processing owing to
its similarity in products and production technologies. Beside this Fruits, Vegetables and
Horticulture Development Department of the MoARD has identified mango as one of the
fruits and vegetable products with potential for export and aimed to increase the land under
mango cultivation to reach more than 12,000 ha in the selected regions of Oromia, SNNPR,
Amhara and Tigray. The current area covered by mango in Ethiopia is estimated to be about
3000 ha and it is planned to plant 9, 835 ha in the immediate future, and replace gradually the
old mango stock. Awash Melkasa Agriculture Research Institute (AMARI) has adapted three
varieties brought from Florida Research Center, namely Tommy Atkins, Kent and Keitt. The
Upper Awash Agro-industry Enterprise has planted these new varieties so far on 13 ha and is
using them as parent plants for seedling propagation (BOAM, 2006). The Enterprise is
planning to expand its new mango variety orchards to cover 40 ha for sale with annual
capacity of 850,000 seedlings per year.
This intervention will impart positive attitude towards pineapple and mango farming as a
business; improve farmers’ access to productivity enhancing technologies, information and
market. This in turn generates effective market demand for the products. Value-adding
through agro-processing is one alternative to realize this linkage and bring sustainable
development.
4.1.2 Justification for Processing the Products Mango and pineapple could be processed into a wide diversity of products. The selection
criteria of the processed products were based on suitability for small scale processing and high
market demand. Suitable processed fruit and vegetable products are high value added
products. The high added-value means that the amount of food that must be processed to earn
a reasonable income is relatively small.
34
Hence the size and type of equipment required to operate at this scale can kept to levels that
are affordable to most aspiring entrepreneurs. Based on this two criteria jam and dried fruit
products were selected. Dried fruit and fruit preservative are high value added products and
there is high market demand in domestic and international markets.
The demand for exotic tropical and subtropical fruits by consumers in developed countries is
on the increase and so is the demand for natural and organically certified products. The key
reasons are the increasing awareness and health concern of consumers. In line to this, several
African companies are finding sweet success on the world’s market and are pushing ahead
with primary production. Safleg, a Togolese firm, markets dried pineapple rings, chunks and
pieces, and sell them under organic label, exclusively on the German market. The firm process
22 tones of fresh pineapple each week, and is moving into new market with dried mango and
bananas. In Guinea, Nebakam-Bio exports dried organic pineapples, mangoes and banana to
France. Its export volume, a mere 20 tones each year, is far below the requirement of the
importer who currently handles 1,000 tones annually (Spore, 2000).
4.1.3 Products Description and Application Jam is a fruit product prepared from fruit pulp by boiling with sufficient quantity of sugar and
pectin to a moderately thick consistency. Jellies are differentiated from jam in that the fruit
ingredients consist of the juice that is extracted from whole fruit and clarified by filtration or
other means. Marmalde is a fruit jelly where the slice of the fruit or peel shreds are suspended.
The distinguishing characteristics of the product are a substantial amount of fruit ingredient
used in the formulation (450 g/kg of jam) and high soluble solid content of the final
product.(TSS = 68° Brix). Jams are widely used for bread dressing to sweeten cakes and
flavor yogurt.
Pineapple and mango jam are prepared from the pulp which is extracted from whole sound
pineapple and mango fruits mixed with sugar and processed to suitable consistency. Pectin is
added to impart a texture to the jam that allows transportation without change which gives a
good flavor release and minimize syneresis. Citric acid is added to lower the pH of the fruit
for better consistency of the product. There is no added colorant or preservative to the product.
The products have colors similar to the color of the respective fruits.
35

36
Dried tropical fruits are mainly sold in health food shops as snack products and as cooking
ingredients. Dried tropical fruits are low in fat; contain natural sugars, vitamins and natural
antioxidants which are supposed to have properties prevent heart disease and cancer. The
specification for pineapple jam, mango jam and dried pineapple fruit is shown in Table 4.1.

37
Table 4.1 Product specification for pineapple jam, mango jam and dried pineapple
Product Specification
No
Product Type
Ingredients
Fruit content
color
Flavor
Texture
TSS and pH
Packaging material
Pineapple jam
Sugar, Pineapple pulp, pectin, citric acid
45 parts per 100 parts of initial ingredients
light yellow
Balanced sweet and sour taste free from burnt & other flavors
High elastic , moderate viscous & easily spread- able
TSS = 68° Brix pH = 3.0-3.2
Glass jar 450 g unit
1
Dried
pineapple
Pineapple slices
100 % pineapple
Bright light yellow
Sweet, typical of pineapple,
Firm and easily chewable not tough and fibrous
TSS = 14.5-16.0° Brix pH = 3.0-3.2
Biaxially oriented polypropylene (BOPP) 250 g unit in cardboard boxes
2
Mango jam
Sugar, mango pulp, pectin, citric acid
45 parts per 100 parts of initial ingredients
light yellow
Clean and free from burnt caramelized & other flavors
High elastic , moderate viscous & easily spread able
TSS = 68° Brix pH = 3.0-3.2
Glass jar 450g unit

4.2 Market Analysis for Dried Fruits and Fruit Jam
Market assessment is an important tool to identify strengths, weakness, opportunity and treats
in the marketing channel. The goal of the market assessment is to gather information about the
business environment from all role players involved in the marketing of the products.
4.2.1 Market size and value
In planning for starting a new business, the first thing to determine is the likely demand of the
product. The market size and value in each product category has been analyzed.
Jam, Jelly and marmalades are widely used by household, hotels, restaurants, boarding
schools and hospitals, as bread dressing and in pastries to sweeten cakes. The demand for jam,
jelly and marmalade is increasing as a derive demand due to increasing consumption of jam as
bread dressings. Fast rising of pastries and standard hotels also contribute to the increase
consumption of these products. The recent market research conducted estimates the annual
local demand for jam, jelly and marmalades at 1990 tones (Addis Ababa Investment
Authority, 2006). The estimation was conducted based on the information collected from
supermarkets, pastries, boarding schools, hotels and hospitals. The major consumers were the
pastries contributing 60.3% of the total demand while households and industrial outlets
(boarding schools, hotels and hospitals) contribute 25.1 % and 14.6 % of the total demand
respectively.
There is no local production of jam and jellies. All Jam and jelly are supplied to the domestic
market are imported. Merti Fruits and Vegetables Processing Plant is a sole producer of
orange marmalade. Table 4.2 shows the annual orange marmalade production by Merti Fruits
and Vegetables Processing Plant. The data indicates the mean annual production of orange
marmalade by Merti was 467.4 tones over the past five years.
38
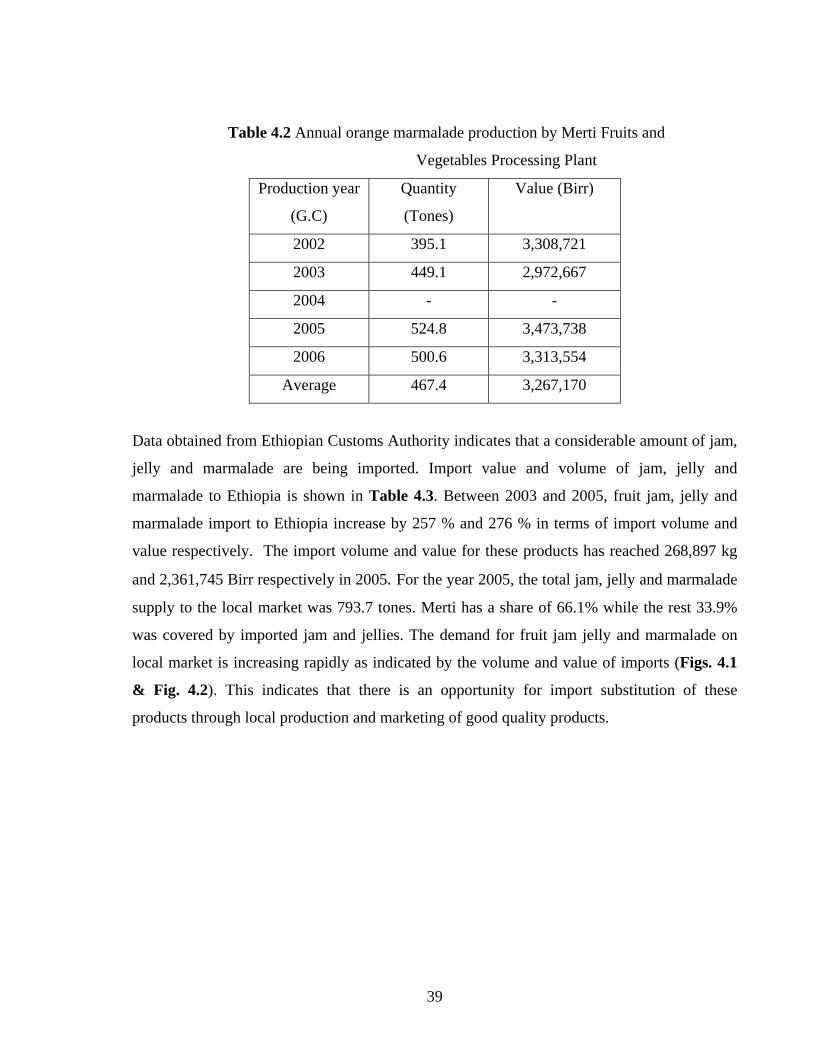
39
Table 4.2 Annual orange marmalade production by Merti Fruits and
Vegetables Processing Plant
Production year
(G.C)
Quantity
(Tones)
Value (Birr)
2002 395.1 3,308,721
2003 449.1 2,972,667
2004 - -
2005 524.8 3,473,738
2006 500.6 3,313,554
Average 467.4 3,267,170
Data obtained from Ethiopian Customs Authority indicates that a considerable amount of jam,
jelly and marmalade are being imported. Import value and volume of jam, jelly and
marmalade to Ethiopia is shown in Table 4.3. Between 2003 and 2005, fruit jam, jelly and
marmalade import to Ethiopia increase by 257 % and 276 % in terms of import volume and
value respectively. The import volume and value for these products has reached 268,897 kg
and 2,361,745 Birr respectively in 2005. For the year 2005, the total jam, jelly and marmalade
supply to the local market was 793.7 tones. Merti has a share of 66.1% while the rest 33.9%
was covered by imported jam and jellies. The demand for fruit jam jelly and marmalade on
local market is increasing rapidly as indicated by the volume and value of imports (Figs. 4.1
& Fig. 4.2). This indicates that there is an opportunity for import substitution of these
products through local production and marketing of good quality products.

40
Table 4.3 Import volume (kg) and value (Birr) of jam, jelly and marmalade to Ethiopia during 2003 to 2005
UAE = United Arab Emirates
Source: Ethiopian Customs Authority, 2006
Import volume in kg Import value in Birr
Supplier
2003
2004
2005
Total increase
(decrease)
2003-2005
2003
2004
2005
Total
increase
(decrease)
2003-2005
Egypt - 55,549 125,328 - - 427,552 1,065,000 -
UAE 42,869 25,569 50,240 17.2 247,384 193,761 441,467 78.5
Greek 1,933 34,935 44,449 2199.5 13,995 260,070 358,775 2463.6
Denmark 13,318 26,692 34,620 159.9 142,734 352,343 348,904 144.4
Argentina 8,598 7,927 5,982 (30.4) 136,055 75,051 50,554 (62.8)
South Africa 2,777 10,636 3,831 38.0 18,194 73,221 24,602 35.2
Italy 2,415 3,079 2,777 15.0 42,540 46,358 55,308 30.0
Others 3,314 2,689 1,670 (49.6) 27,536 59,754 17,135 (37.8)
275.8 2,361,745 1,488,110 628,438 257.5 268,897 75,224 167,076 Total

50,000
100,000
150,000
200,000
250,000
300,000
2003 2004 2005
kg
Figure 4.1 Ethiopian fruit jam, jelly and marmalade import volume (kg) during 2003-2005
0
500,000
1,000,000
1,500,000
2,000,000
2,500,000
2003 2004 2005
Birr
Figure 4.2 Ethiopian fruit jam, jelly and marmalade import value (Birr) during 2003-2005
41

The major markets for dried tropical fruit are the European Union (mainly Germany, France,
the United Kingdom and the Netherlands), the United States and Japan .Total imports of dried
fruit by EU member countries amounted to Euro 951 million and 635,000 tones in 2004
representing a total increase of 7% in value and 8% in volume since 2002 (CBI, 2005). The
UK is the world’s largest importer of dried fruit, accounting for 23% of total import, followed
by Germany (22%), France (13%) and The Netherlands (8%) in 2004 (Eurostat, 2005).
4.2.2 Feasible Market Share of the Project
The proportion of the total market that could be captured by a new business is vital tool for the
determination of scale of production for the processing plant. The figure depends on many
variables such as the extent and strength of competition, effectiveness of marketing strategy,
socio-economic and political factors. For estimation of feasible market share of the project
guideline proposed by Anon (1992) was used (Table 4.4). The estimation was based on
number of competitors, scale of production and the product characteristics. Mango and
pineapple jam would encounter competition from local orange marmalade and imported jams,
jellies and marmalades. Only four countries supply 95% of the Ethiopian fruit preservatives
import. Egypt was leading supplier in 2005, accounting for 47% total import volume,
followed by UAE 18.7 %, Greek 16.5 %, Denmark 12.9%, Argentina 2.2% (Table 4.3). In
this category, the competitors can be termed as few in number, large in size and competing
with similar products. Hence, a market share of 0-2.5% could be assumed to be captured
(Table 4.4).
42

Table 4.4 Guideline for estimation of market share of new food business
No of other
producers
Many Few One None
Size of
competitors
Large Small Large Small Large Small
Product
range
S D S D S D S D S D S D
100% Market
share % 10-1
5
10-1
5
20-3
0
10-1
5
30-5
0 40
-80
0-2.
5
0-2.
5
5-10
5-10
0-5
0-5
Source: Anon, a Manual for the Entrepreneur, 1992 S = Similar products; D = Dissimilar Products
Thailand is the primary supplier of dried pineapple, papaya and mango in the world. The
Philippines, Sirilanka, Costa Rica and Mexico are also big suppliers of dried fruit (ADC,
2002). Burkina Faso, Uganda, Togo, Guinea and Cameroon are main competitors for Ethiopia
in Africa in the export of dried tropical fruits. Dried tropical fruits face strong competition
from adjoining categories such as:
• Other natural dried fruits, especially those of Mediterranean origins (apricots,
prunes and dates etc.)
• Fresh tropical fruits, especially bananas, mango, pineapple and papayas, which
are widely available and basically have the same uses (snacking and cooking)
• Tropical fruits, which are otherwise preserved, such as canned and frozen tropical
fruits
For dried pineapple, the number of competitors can be termed as few in number, large in size
and competing with similar products. Hence, a market share of 0-2.5% could be captured
(Table 4.4).
43

4.2.3 Consumers Analysis Consumers’ survey was conducted to identify major market outlets and customers perception
towards the product quality, packaging and labeling and price of the imported pineapple and
manago jams. The results of the market survey is shown in Table 4.5
Table 4.5 Summary of consumers’ survey
Very
bad
Questionnaire Very
good
Good Average Bad Total
What do you think about the product color? 6 34 5 5 0 50
What do you think about the taste? 3 13 34 0 0 50
What do you think about the package? 27 15 8 0 0 50
What do you think about the product label? 20 10 11 9 0 50
What do you think about the product price? 5 7 12 25 1 50
Major findings of the consumers survey is summarized as follows
1. 80 % of the consumers found the color of the jam to be better than average, 94 %
of them were satisfied with the taste of imported jams. 68% of the consumers said
that flavor of the jam was average. This indicates that while planning to substitute
the imported fruit jam through local production emphasis should be given to the
quality of the product.
2. A large majority of the consumers (84%) were happy with the existing glass
packages and 60% of the consumers found the labels to be better than average.
This information indicates glass packages should preferably be selected for
packaging jam.
3. Super markets and shops sale pineapple jam and mango jam at Birr 40 per kg and
Birr 26.50 per kg respectively. Majority of consumers (52%) were unhappy with
the price of both jams. This indicates that a potential market share exists if an
alternative product having similar quality can be sold at reduced price.
44
The market for dried tropical fruits is divided between the health food and retail food markets.
Health food stores demand fruit that does not have any additive and it is dried using natural
process. Dried fruits with addition of sugar and treated with sulfur to ensure freshness are sold
to large retail stores. Health food sectors sell more dried tropical fruit than conventional
stores. Traditionally, natural food consumers in Europe are the urban households whose head
is between 30 and 50 years old and with annual income of between Euro 20,000 and 40,000
(CBI, 2005). The selling price of dried pineapple at EU market is US $ 8.50/kg.
45

4.3 Technical Feasibility
4.3.1 Raw Material and Auxiliary Inputs Supply The procurement of raw materials (inputs) must be studied before investing on establishment
of a processing plant. Raw materials and auxiliary inputs supply has great significance
because the transformation of inputs is one of the basic task performed in a processing facility.
Efficient procurement is dependent on quantity and quality of inputs, appropriate timing, cost
and efficient organization.
Availability of Raw Materials
The major raw materials for the envisaged processing plant are pineapple and mango. There
are two major producers of pineapple in Ethiopia: Dale, Dara and Aletawondo woredas’ of
Sidama zone and Gojeb State Farm located in Jimma area with 34 ha land for pineapple
production. The total area covered and annual production of pineapple in Dale, Dara and
Aletawondo woredas in 2005/2006 was 898.6 ha and 14,576 tones respectively (Table 4.6).
Aletawondo is the largest producer of pineapple contributing 92.12% of the total production in
the area. Gambella, Safa and Teso kebeles are major pineapple producers in the Aletawondo
woreda. The farmers grow pineapple as main cash crop for their livelihood.
Teso fruit farmers’ cooperative is organized to work on pineapple. The cooperative has 115
permanent and 1319 potential farmers in three adjacent villages located near main road from
Awassa to Dilla. The primary cooperative has about 746 ha of land with estimated annual
production of 12,480 tones. There are two varieties of pineapple being cultivated currently in
these areas. The Red Spanish variety which is called ‘Dume’ in Sidama language is preferred
by local farmers because of its shortest cultivation period, long post harvest shelf life and
acceptance of its red color by local fresh consumers. The Smooth Cayenne cultivar known by
the local name ‘Hunja’ is not widely cultivated because of its long cultivation period and short
shelf life.
46

Table 4.6 Area covered (ha) and annual pineapple production (tones)
in Sidama zone 2005/2006
Cultivated area Annual Production Percent
Share Area (ha) ( tones )
Dale 8.6 128.0 0.88
Dara 68.0 1,020.0 7.00
Aletawondo 822.0 13,428.0 92.12
Total 898.6 14,576.0 100.00
Source: Ethiopian Agriculture Research Institute, 2006
“Shebedino” Woreda in Sidama zone and “Wenago” in “Gedio” zone, which is adjacent to
“Aletawondo” and “Dara” woreda, are major mango producing areas around Sidama. The
data collected from the Woredas’ Agriculture Bureau indicate that the total area covered by
mango crop was estimated as 47.5 ha with annual production of 470 tones in 2005/2006.
Figure 4.3 describes major pineapple and mango producing areas in Sidama zone and
adjacent areas.
Key pineapple and mango producing areas in Sidama zone
Figure 4.3 Major pineapple and mango producing areas in Sidama zone and adjacent areas
47

The annual consumption of pineapple and mango by the processing plant at full production
capacity is 91.2 tones and 8.6 tones respectively. This amount is only 0.6% and 1.8% of the
current production of pineapple and mango respectively. Therefore, the availability of these
crops would not be the problem. The supply of pineapple is dependent on climatic factors
because most of the cultivation is rain fed agriculture. Drought and poor management would
make feasible supplies of raw materials diminish drastically. However there are three
perennial rivers, Gidabo, Burure and Melewo, crossing the areas which could be used for
irrigation.
Cultivation Calendar
Pineapple and mango bear fruit for limited time during a year. This is limiting the availability
of raw materials to a couple of months per year. Carrying large stock of crops for late
processing requires large investment which is not suitable for small scale processing.
Therefore processing should takes place when the raw materials are at peak harvest. Figure
4.4 describes peak harvesting periods for pineapple and mango in Sidama zone and adjacent
areas. Major pineapple harvest seasons are from October to December and April – July. Key
Mango harvest season is from September to November and January to April. Figure 4.4
shows that it is possible to have all year round processing of products based on the availability
of pineapple and mango at different times to the year.
Oct
ober
Nov
embe
r
Dec
embe
r
Sept
embe
r
Feb
ruar
y
Janu
ary
Crops
Aug
ust
mar
ch
Apr
il
June
May
July
Pineapple
Mango
Figure 4.4 Pineapple and Mango peak harvest Periods in Sidama Zone
48

Organization of the Procurement System
The organization of the raw material procurement system is very important aspect that
contributes to the sustainability of the fruit processing enterprise. One of the main challenges
in procurement of fruits is seasonality of the crops. From marketing point of view it is desired
to have processed products available while the specific fruit is out of season. This strategy
would however require investment be made in equipments necessary to preserve the
unprocessed or semi-processed fruits. The simplest and straight forward means for supply of
fruits is to purchase from the nearby market. However, this creates a number of problems such
as shortage of raw materials, lack of control over fruit quality during harvest and transport and
large seasonal price fluctuations. Contract farming system is vital tool to have control over
supply of fruit, their quality and price. The system had dual advantage. The farmers’ are
benefited having guaranteed market for their crop at a attractive price, the processor in turn
solve problems related to supply and quality of fruits. Raw material standards for variety of
fruits to be grown, degree of maturity at harvest, free from infection should be included when
making agreements for contracted farming. It is also important to train farmers about these
requirements including good farm management practices and post harvest handling of fruits.
Packaging Materials Other Processing Inputs
The selection of the correct type of packaging material depends on a complete mix of
consideration which include: the temperature and humidity of air in which product is stored,
the capacity of the product to pick up moisture, reaction within the product caused by air or
sunlight during storage , the expected shelf life, cost and availability of packaging material.
Dried pineapple is highly hygroscopic substance and it rehydrates to the equilibrium moisture
content on exposure to the atmospheric air. Exposure to high storage temperature and light
results in darkening and development of off-flavor by millard reaction. Therefore the
packaging material should provide protection against moisture pickup and light exposure. The
high fragility of the dehydrated pineapple also requires hard covers to prevent crushing during
transportation.
49

The widely used packaging material for dried fruits are flexible films which may be single ,
coated with polymer or aluminum or produced as multi-layered laminates or co-extrusion. The
product is then placed in cardboard boxes to prevent crushing and exclude light.
The preference for using flexible films for packaging dried fruits is due to their relative low
cost, wide range of barrier properties against moisture and gases, suitability for high speed
filling, ease of handling and print. Flexible films have wide range of mechanical, optical,
thermal and barrier properties depending on the thickness, chemical composition and
structural and orientation of molecules in the film. Flexible packaging materials are locally
produced by Flexible Printing Plc and Chambers Printing House Plc. The companies supply
single and polylaminates of polyethylene (PE), Biaxial Oriented Polypropylene (BOPP) and
aluminum foil.
Taking into consideration barrier requirements of the material and availability of the
packaging materials the packaging material for dried pineapple is selected to be the Biaxial
Oriented Polypropylene (BOPP). The packaged products are then placed in cardboard boxes
to prevent crushing and to exclude light which cause loss of color and development off –flavor
during storage.
Glass jars and cans are widely used for packaging of fruit jam. However there is an increased
transformation from cans to glass jars which are more appealing because glass is perceived by
the consumers as a package material which is healthier than cans. Addis Ababa bottle and
glass share company (AABGSC) is a sole producer and distributor of bottle and glass products
in Ethiopia. The company supply 375 ml jar jars which are suitable for packaging of 450 g
jam. Due to increased demand for glass and bottle products which exceeds the company
production capacity, there is a shortage of glass bottles nowadays. The company is on the
process of increasing its production capacity by double until mid 2008. The shortage of glass
container is expected to be solved by then. In apart from this pouches of low density
polypropylene, aluminum foil, polycell paper and foil polylaminates and aluminum
collapsible tubes are suitable for packaging jam (Gowramma et al., 1981)
50

All raw materials, auxiliary inputs and packaging materials except pectin and citric acid are
available locally. Pectin and citric acid are neither produced nor available locally. Therefore
they have to be imported. The annual consumption of citric acid and pectin is very small 178
kg and 139 kg respectively (Table 4.7). This amount is below the minimum order lot
requested by most producers and traders of these chemicals. This may pose a difficulty in
supply of these chemicals. One option is to make order arrangement together with Merti Fruit
and Vegetable Processing Plant should be sought. Pectin could also be extracted in house from
apple pomice, citrus fruit peel or peel of mango and pineapple. However further investigation
should be carried out on viability of this system. Alternative to citric acid, lemon juice could
be used.
Annual Consumption and Cost of Raw Materials and Auxiliary Inputs
Table 4.7 describes the annual consumption and cost of raw materials and auxiliary inputs.
The annual consumptions are computed from technical ratios (Table 4.19) and annual
production program (Table 4.16). During peak harvest period’s pineapple is sold by small
holder farmers at farm gate price of Birr 0.75-1.00 and Birr 1.0-1.50 per kg for Red Spanish
and Smooth Cayenne cultivars respectively. Mango is sold at farm gate price of Birr 0.30 -
0.45 per kg. The selling price of glass jars including ominia lids and cardboard boxes for 450
g jam glass packages by Addis Ababa Glass and Bottles S. Com is Birr 1.95. For annual
production of 26 tones of jam, 57,778 pcs of 450 g unit glass jars are required. This amounts
Birr 112,667 per annum.
The selected packaging material for dried pineapple is Biaxial Oriented Polypropylene. The
price of the packaging material for a kg of dried pineapple including three colors label printing
by Flexible Printing Plc is Birr 1.80. For packaging of 7 ton of dried pineapple packaging
material worth Birr 12,600 are required.
51
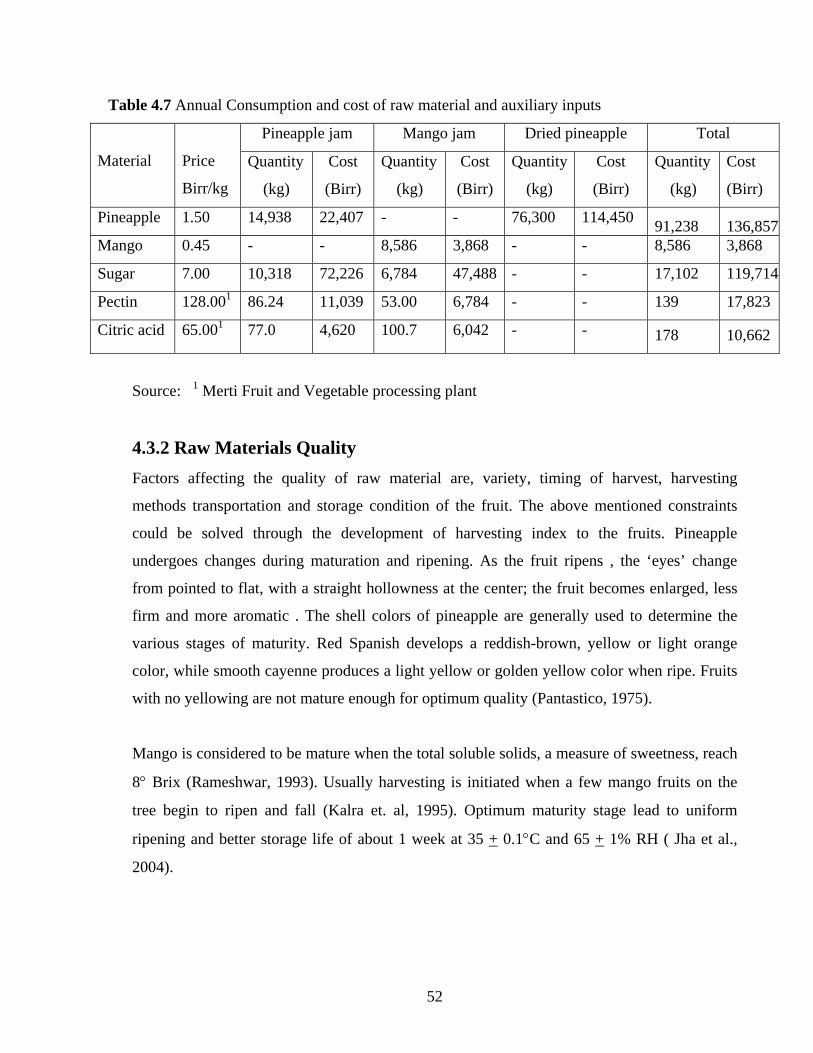
Table 4.7 Annual Consumption and cost of raw material and auxiliary inputs
Pineapple jam Mango jam Dried pineapple Total
Material Price Quantity Cost Quantity Cost Quantity Cost Quantity Cost
Birr/kg (kg) (Birr) (kg) (Birr) (kg) (Birr) (kg) (Birr)
Pineapple 1.50 14,938 22,407 - - 76,300 114,450 91,238 136,857Mango 0.45 - - 8,586 3,868 - - 8,586 3,868
Sugar 7.00 10,318 72,226 6,784 47,488 - - 17,102 119,714
Pectin 128.001 86.24 11,039 53.00 6,784 - - 139 17,823 1Citric acid 65.00 77.0 4,620 100.7 6,042 - - 178 10,662
Source: 1 Merti Fruit and Vegetable processing plant
4.3.2 Raw Materials Quality Factors affecting the quality of raw material are, variety, timing of harvest, harvesting
methods transportation and storage condition of the fruit. The above mentioned constraints
could be solved through the development of harvesting index to the fruits. Pineapple
undergoes changes during maturation and ripening. As the fruit ripens , the ‘eyes’ change
from pointed to flat, with a straight hollowness at the center; the fruit becomes enlarged, less
firm and more aromatic . The shell colors of pineapple are generally used to determine the
various stages of maturity. Red Spanish develops a reddish-brown, yellow or light orange
color, while smooth cayenne produces a light yellow or golden yellow color when ripe. Fruits
with no yellowing are not mature enough for optimum quality (Pantastico, 1975).
Mango is considered to be mature when the total soluble solids, a measure of sweetness, reach
8° Brix (Rameshwar, 1993). Usually harvesting is initiated when a few mango fruits on the
tree begin to ripen and fall (Kalra et. al, 1995). Optimum maturity stage lead to uniform
ripening and better storage life of about 1 week at 35 + 0.1°C and 65 + 1% RH ( Jha et al.,
2004).
52

Physico-Chemical Characteristics of Pineapple and Mango
Pineapple has long been one of the most popular non citrus fruit because of its attractive
flavor and refreshing sugar acid balance. It has been reported that there are 100 varieties of
pineapple, but only 6 to 8 of them are cultivated commercially (FAO, 2002).’Smooth
Cayenne’ and ‘Red Spanish’ cultivars are among the principal varieties. These two cultivates
are also produced in Ethiopia. The Red Spanish cultivar which is cultivated widely in the
Caribbean has medium sugar content of 12˚Brix with low acidity. Smooth Cayenne fruit is
characterized by higher sugar content of 13-19˚Brix. It produces a light yellow or golden
yellow color when ripe (Coveca, 2002).
The physico-chemical characteristics of fruits and the technological qualities of the products
processed vary with the variety. Some varieties are most suitable for specific application
(Doyeyappa & Ramannjaneya, 1995). The selected physico-chemical parameters based on
their impact on quality of fruit jam processed were pulp color, TSS, pH, acidity and ˚Brix
/acidity.
The range of physico-chemical constituents of ripe pineapple depending upon stage of fruit
ripeness, and agronomic and environmental factors has been reported by Dull (1971). The data
indicates Pineapples contain 81.2-86.2% moisture, 13-19% total soluble solids, of which
sucrose, glucose and fructose are the main components. Carbohydrates represent up to 85% of
total solids whereas fiber makes up for 2-3%. The pulp has very low ash content, nitrogenous
compounds and lipids (0.1%). From 25-30% of nitrogenous compounds are true proteins. Out
of this proportion, ca. 80% has proteolytic activity due to a protease known as Bromelin (Dull,
1971). The main organic acids contained in ripe pineapple fruit are citric acid and malic acid
(Singleton & Gortner, 1965; Dull 1971). Citric acid content of 1.27% and 0.80% were
reported for Red Spanish and Smooth Cayenne cultivars respectively (Bartholomew et al.,
1994)
Physico-chemical characteristic of four mango varieties (palmer, keitt, Ameliorel and mango)
were studied (Germain et al., 2003). The study indicates that a pulp extracted from ripe fruit of
the mentioned cultivars has a total sugar content range 9.4-15.2%, and a pH range 3.91-4.35.
53
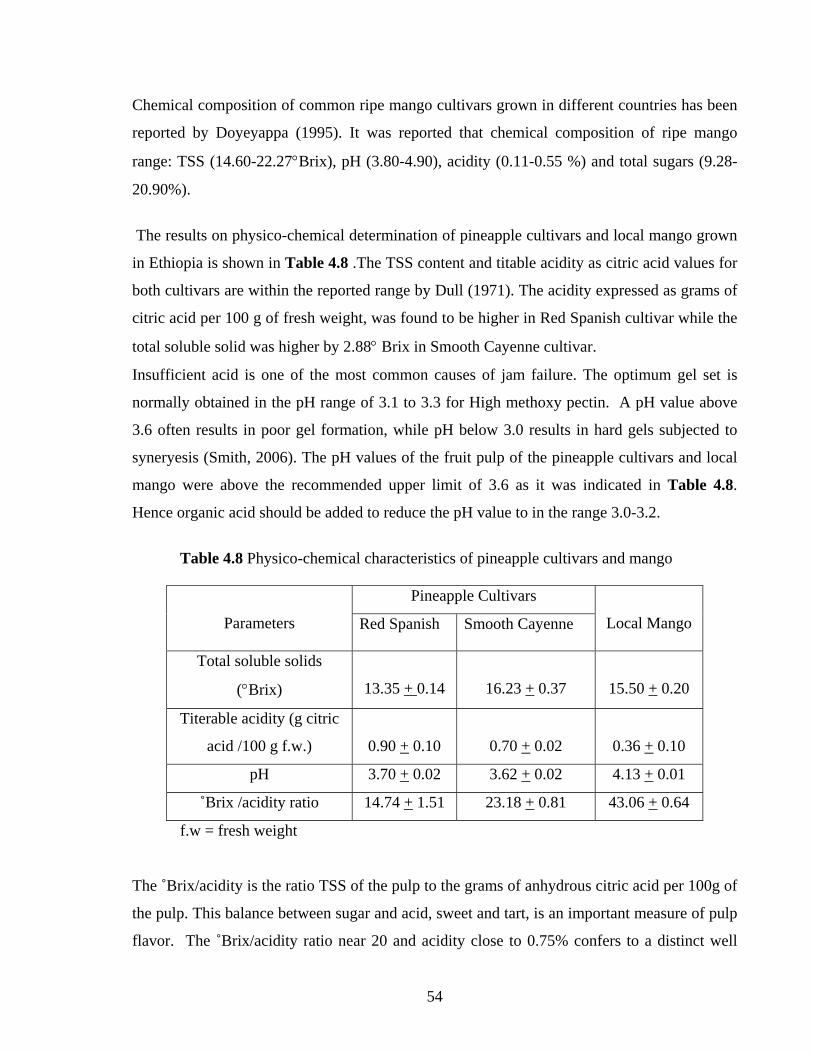
Chemical composition of common ripe mango cultivars grown in different countries has been
reported by Doyeyappa (1995). It was reported that chemical composition of ripe mango
range: TSS (14.60-22.27°Brix), pH (3.80-4.90), acidity (0.11-0.55 %) and total sugars (9.28-
20.90%).
The results on physico-chemical determination of pineapple cultivars and local mango grown
in Ethiopia is shown in Table 4.8 .The TSS content and titable acidity as citric acid values for
both cultivars are within the reported range by Dull (1971). The acidity expressed as grams of
citric acid per 100 g of fresh weight, was found to be higher in Red Spanish cultivar while the
total soluble solid was higher by 2.88° Brix in Smooth Cayenne cultivar.
Insufficient acid is one of the most common causes of jam failure. The optimum gel set is
normally obtained in the pH range of 3.1 to 3.3 for High methoxy pectin. A pH value above
3.6 often results in poor gel formation, while pH below 3.0 results in hard gels subjected to
syneryesis (Smith, 2006). The pH values of the fruit pulp of the pineapple cultivars and local
mango were above the recommended upper limit of 3.6 as it was indicated in Table 4.8.
Hence organic acid should be added to reduce the pH value to in the range 3.0-3.2.
Table 4.8 Physico-chemical characteristics of pineapple cultivars and mango
Pineapple Cultivars
Parameters Local Mango Red Spanish Smooth Cayenne
Total soluble solids
(°Brix)
13.35 + 0.14 16.23 + 0.37 15.50 + 0.20
Titerable acidity (g citric
acid /100 g f.w.)
0.90 + 0.10 0.70 + 0.02 0.36 + 0.10
pH 3.70 + 0.02 3.62 + 0.02 4.13 + 0.01
˚Brix /acidity ratio 14.74 + 1.51 23.18 + 0.81 43.06 + 0.64
f.w = fresh weight
The ˚Brix/acidity is the ratio TSS of the pulp to the grams of anhydrous citric acid per 100g of
the pulp. This balance between sugar and acid, sweet and tart, is an important measure of pulp
flavor. The ˚Brix/acidity ratio near 20 and acidity close to 0.75% confers to a distinct well
54

appreciated flavor of pineapple (Coveca, 2002). The ˚Brix/acidity ratio for the smooth
cayenne cultivar (23.18) is close to the desired value (20). However, the ˚Brix/acidity Red
Spanish is found to be low (14.74). This is due to lower TSS content (13.33) and higher
titerable acidity (0.90) than the Smooth Cayenne (Table 4.8).
4.3.3 Formulation and Sensory Evaluation of Pineapple and Mango Jams Formulation of Pineapple and Mango Jam
The successful manufacture of jam requires the combination of pectin, acid, and sugar within
narrow limit. Jam was formulated taking into account the pH and TSS of fruit pulp and
ingredients to obtain a final concentration of 45 parts of fruit per 100 parts of final product and
TSS content of 68°Brix in the final product. (Table 4.9)
Table 4.9 Formulation of pineapple and mango jam
Ingredients
(g/kg Jam) Smooth Cayenne Red Spanish Local mango
pulp 450.0 450.0 450.00
Sugar 597.0 609.0 587.0
Pectin 5.0 5.5 3.70
Citric acid 4.5 5.5 6.70
Total 1056.5 1070.0 1047.4
The following procedure were used in the formulation of pineapple and mango jam
A) The weight of fruit pulp in the formulated batch was determined based on Codex
Alimentarius specification for minimum fruit content in fruit jam and jelly. it was
stated that Extra jam, Jam, or High fruit jam should be manufactured from not less
than 45 parts by weight of original fruit ingredients, exclusive of any added sugar of
optional indigents for each 100 parts, by weight of finished product (Codex
Alimentarius, 1981).
B) To adjust the pH value citric acid, malic acid, lactic acid and tartaric acid as well as
their salts are permitted Codex Alimentarius (1981). Among these acids, citric acid has
been used in fruit jam production due to its taste, antioxidant characteristics, solubility
55
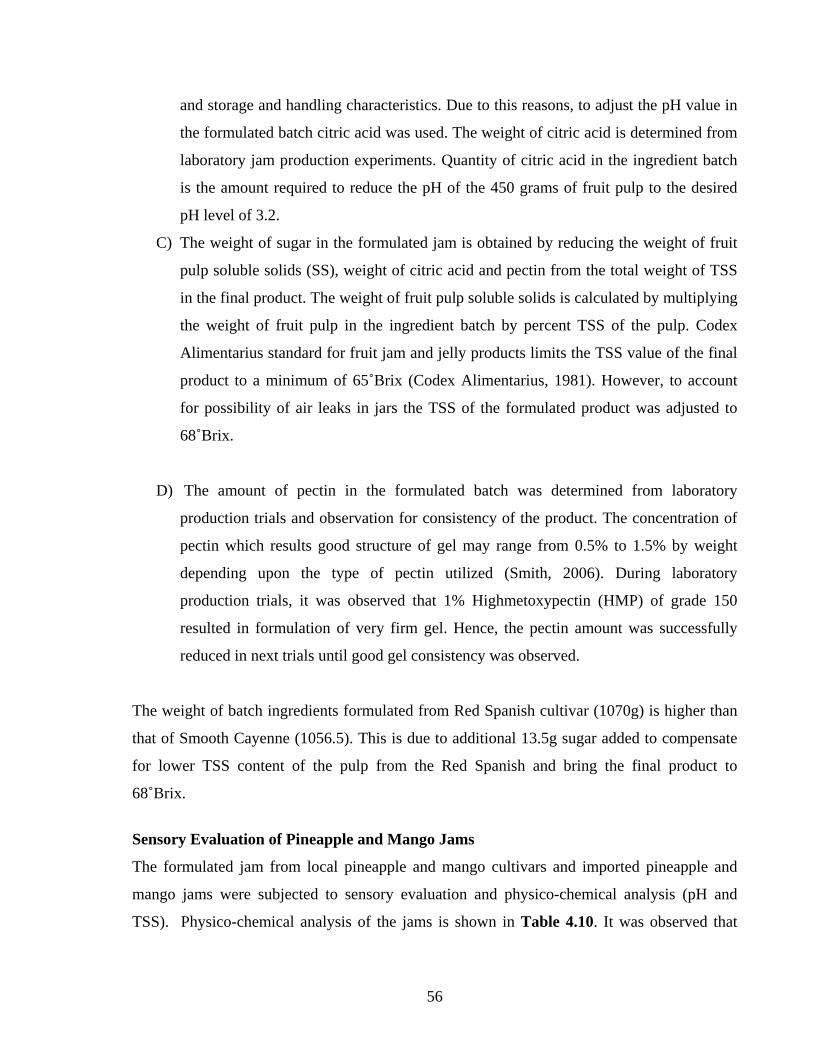
and storage and handling characteristics. Due to this reasons, to adjust the pH value in
the formulated batch citric acid was used. The weight of citric acid is determined from
laboratory jam production experiments. Quantity of citric acid in the ingredient batch
is the amount required to reduce the pH of the 450 grams of fruit pulp to the desired
pH level of 3.2.
C) The weight of sugar in the formulated jam is obtained by reducing the weight of fruit
pulp soluble solids (SS), weight of citric acid and pectin from the total weight of TSS
in the final product. The weight of fruit pulp soluble solids is calculated by multiplying
the weight of fruit pulp in the ingredient batch by percent TSS of the pulp. Codex
Alimentarius standard for fruit jam and jelly products limits the TSS value of the final
product to a minimum of 65˚Brix (Codex Alimentarius, 1981). However, to account
for possibility of air leaks in jars the TSS of the formulated product was adjusted to
68˚Brix.
D) The amount of pectin in the formulated batch was determined from laboratory
production trials and observation for consistency of the product. The concentration of
pectin which results good structure of gel may range from 0.5% to 1.5% by weight
depending upon the type of pectin utilized (Smith, 2006). During laboratory
production trials, it was observed that 1% Highmetoxypectin (HMP) of grade 150
resulted in formulation of very firm gel. Hence, the pectin amount was successfully
reduced in next trials until good gel consistency was observed.
The weight of batch ingredients formulated from Red Spanish cultivar (1070g) is higher than
that of Smooth Cayenne (1056.5). This is due to additional 13.5g sugar added to compensate
for lower TSS content of the pulp from the Red Spanish and bring the final product to
68˚Brix.
Sensory Evaluation of Pineapple and Mango Jams
The formulated jam from local pineapple and mango cultivars and imported pineapple and
mango jams were subjected to sensory evaluation and physico-chemical analysis (pH and
TSS). Physico-chemical analysis of the jams is shown in Table 4.10. It was observed that
56
there was no significant difference observed in pH and total soluble solid content among the
jams.
Table 4.10 Physico-chemical characteristics of pineapple and mango jams
Total Soluble Solids
Type of jam pH (° Brix)
Smooth Cayenne jam 2.78 + 0.04 68.5 + 0.2
Red Spanish jam 2.83 + 0.02 68.2 + 0.4
Imported pineapple jam 2.88 + 0.02 64.6 + 0.4
Local mango jam 2.77 + 0.03 67.4 + 0.2
Imported mango jam 2.96 + 0.01 65.4 + 0.3
Sensory scores of formulated batch from Smooth Cayenne and Red Spanish pineapple
cultivars and imported pineapple jam is shown in Table 4.11. The sensory attributes were
color, aroma, taste, flavor, degree of spreadability and overall acceptability. The panelists
have found that there was no significant difference (p < 0.05) in color, aroma and degree of
spreadability among the three jams. However, panelists showed preference to (p < 0.05) the
flavor of jam formulated from Smooth Cayenne cultivar among the three jams. The panelists
showed less preference in taste for jam formulated from Red Spanish cultivar while no
significant difference was observed between the Smooth Cayenne and imported pineapple
jam. This can be explained by low °Brix/acidity ratio (14.74) which is by far lower than the
value which gives higher taste and flavor (20.00).
Jam formulated from Smooth Cayenne pineapple has scored highest mean sensory scores in
all quality attributes except in taste. In overall acceptability the panelist shows least preference
for the jam from Red Spanish cultivar. However the jam is still acceptable since it scored
above 6.5 on a hedonic scale of 1 to 9.
57

Table 4.11 Mean sensory scores of pineapple jams
Overall
acceptabilityProduct color Aroma Taste Flavor Spreadability
Smooth Cayenne Jam 7.58a 7.42b 7.68c 7.95f 8.32g 7.79h
Red Spanish Jam 7.52a 6.63b 6.58d 6.89e 7.47g i6.89
Imported pineapple
jam
6.95a 6.68b 7.95c 7.63e 7.47g hi7.10
Different letters in the same column indicate significant difference, p < 0.05
Mean sensory scores for jam formulated from local mango and imported mango jam is shown
in Table 4.12, which indicates jam formulated from local mango had scored similar sensory
score. Table 4.12 Mean sensory scores of mango jams
Overall
acceptability Product Color Aroma Taste Flavor Spreadability
Local
mango jam 7.05 7.15 8.00 7.84 7.58 7.47
Imported
mango jam
8.00 7.32 7.79 7.47 6.63 7.42
The hedonic rating is 9 (like extremely), 8 (like very much), 7 (like moderately), 6 (like
slightly),5 (neither like or dislike) , 4 (dislike slightly),3 (dislike moderately ),2 (dislike very
much) and 1(dislike extremely).
58

4.3.4 Pulp and Jam Yield of Pineapple and Mango The selected physical parameters to predict the process recovery of pineapple and mango
variety for jam processing are fruit weight, diameter, length and shape. Pineapple fruit can be
classified in three categories on weight basis: category A, defined by fruit more than 1.5 kg;
category B, fruit weighing between 1 and 1.5 kg; category C, fruit weighing less than 1 kg
(Infoagro, 2002). Smooth Cayenne fruit is characterized by cylindrical fruit shape and average
fruit weight of 2500 g (Coveca, 2002). The Red Spanish fruit has fruit weight range of 1200-
2000 g.
Physical determination of pineapple cultivars grown in Sidama zone is shown in Table 4.13.
Red Spanish cultivar is smaller in size than Smooth Cayenne. The average fruit weight for
Red Spanish cultivar (934.0 g) and Smooth Cayenne (1343.0 g) were found to be lower than
the reported ranges by Coveca (2002). However, similar results were found for the two
cultivars grown in Spain. The average fruit weight for the Red Spanish and Smooth Cayenne
were reported as 927.0g and 2060.0g respectively (Bartholomew et al., 1994). The large
standard deviation observed in fruit weight on both cultivars illustrates the variability of the
fruit weights.
Table 4.13 Physical parameters determination of pineapple cultivars grown in Sidama Zone
Cultivars
Parameters Red Spanish Smooth cayenne
Fruit weight (g)(without crown) 934.00 +116.7 1343.00 +369.2
Fruit length (cm) 11.60 +1.20 16.45 +1.90
Average fruit diameter(cm) 11.10 +1.20 13.01 +1.10
Length ratio 1.05 +0.03 1.26 +0.06
Taper ratio 0.90 +0.05 0.95 +0.01
Results are mean value of at least 15 fruits determinations
The process recovery of pineapple fruit is determined by the shape of the fruit. The ratio of
length of fruit to its average diameter, length ratio, and the ratio of fruit diameter at 3/4 and
1/4 the height of fruit, taper ratio, are good indicators of product recovery from fresh fruit. For
higher product recovery, the fruit shall be moderately big with nearly cylindrical shape and
59

good square shoulders. Pineapple showing a taper ratio of 1.0 + 0.05 and length ratio greater
than 1.50 has an excellent shaper for great product recovery during peeling and coring
(Leverington, 1971)
Owing to its elongated shape, it was found that the Smooth Cayenne cultivar has length ratio
(1.26) and taper ratio (0.95). This indicates the fruit has a good shape for greater recovery of
the fruit. However, it was found that the Red Spanish cultivar have length ratio of 1.05 which
is lower than the recommend value (1.50). Taper ratio for this cultivar is 0.90 which is lower
than the range for recommended recovery. These can be used as the indication of the fruit
shape which is getting narrow at the head. These two results give indication for lower product
recovery from both cultivars compared to the recommendation.
Ethiopian standard for fresh mangoes group the size of mangoes into three categories: 200-
350g, 351-550 g, 551-800 g for small, medium and large respectively. The minimum weight
of mangoes shall not be less than 200 g. The average weight of mango produced in
“Shebedino” area was found to be 324.5 g which could be classified as small size.
Product yield is one of the key indicators for feasibility of fruit processing. Yield specifies the
percentage of finished product as compared to raw material. Pulp yield and jam yield were
used to measure the amount of product recovered from fresh pineapple and mango.
Table 4.14 Pulp and jam yield of pineapple and mango at Sidama Zone
Pulp
composition
Cultivar Pulp yield
(%)
Jam yield
(g/kg Jam) %
Smooth Cayenne 450.0 60.0 95.5
Red Spanish 450.0 52.0 94.6
Local mango 450.0 63.0 95.5
The pulp yield represents the amount of pulp, used as jam ingredient that could be extracted
from fresh fruit. The pulp yield was determined by measuring the weight of pulp extracted
60

from fresh fruit after washing, peeling, removing the eyes, slicing and crushing the sliced fruit
in electrical homogenizer. The pulp yield from the Smooth Cayenne was found 60.0% which
is higher than the Red Spanish 52.0% (Table 4.14). This is mainly due to widely broad deep
eyes which are embedded in the fruit flesh. Removing the eyes to avoid the presence of black
spots in the jam result in loss of fruit pulp. The result indicates that Smooth Cayenne cultivar
has better yield from process economic point of view for jam making. The amount of fresh
fruit required to make a Kg of jam from Smooth Cayenne and Red Spanish cultivar is 750 g
and 865 g respectively. In other words, additional 115 g fresh fruit is required to produce 1 kg
jam from Red Spanish cultivar. The pulp yield from local mango was 63%. Jam yield
represents the percentage of final product that could be obtained from ingredient batch.
The weight of ingredient to product 1 kg of pineapple and mango jam is shown in Table 4.9.
It was found that 1056.5 g, 1070 g, 1047 g of total ingredient weight is required to produce
1Kg Jam from Smooth Cayenne, Red Spanish and Local Mango respectively. The loss in
weight is due to water lost by evaporation to concentrate the TSS to 68˚ Brix. The jam yield is
higher for Smooth Cayenne cultivar (95.5) than the Red Spanish (94.6). This is due to higher
TSS value for Smooth Cayenne cultivar.
4.3.5 Drying Characteristics of Pineapple slices The common practice for drying topical fruits is by using drying air with temperature ranges
between 50-600C (Candelaria & Raymundo, 1994). The rate at which pineapple dry at this
temperatures depend on, drying air temperature, humidity, air velocity and the thickness of
the slices. The final moisture content to terminate the drying process is determined by the
water activity (aw) required for inhibition of microbial, enzymatic and non-enzymatic
reactions taking place in the dried products. To inhibit this reactions the aw of the dried
pineapple should fall below 0.45. The moisture content (wb) that corresponds to this aw at
20oC is reported as 15% (Hossain et al., 2001).
During sun or solar drying, the attainable drying air temperatures which are usually lower than
500C. Consequently drying usually needs at least 20 hrs resulting in low drying capacity and
loss in product quality. The observed quality deficiencies of the dried fruits caused by long
61
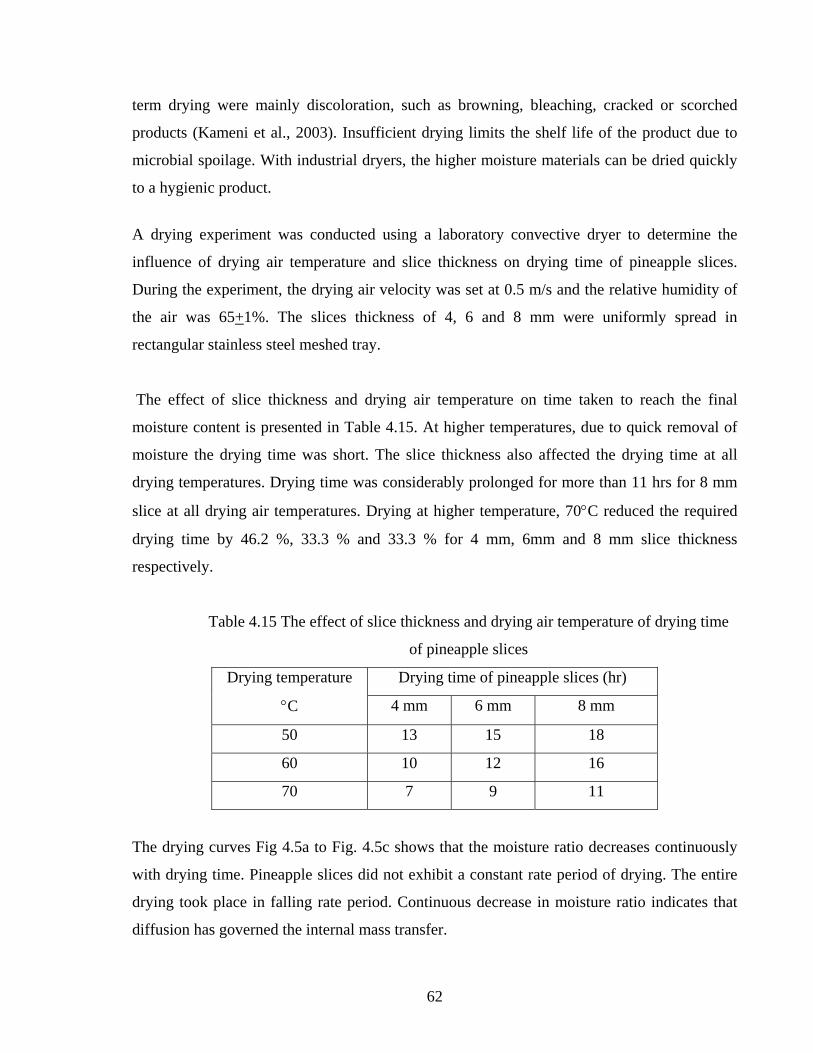
term drying were mainly discoloration, such as browning, bleaching, cracked or scorched
products (Kameni et al., 2003). Insufficient drying limits the shelf life of the product due to
microbial spoilage. With industrial dryers, the higher moisture materials can be dried quickly
to a hygienic product.
A drying experiment was conducted using a laboratory convective dryer to determine the
influence of drying air temperature and slice thickness on drying time of pineapple slices.
During the experiment, the drying air velocity was set at 0.5 m/s and the relative humidity of
the air was 65+1%. The slices thickness of 4, 6 and 8 mm were uniformly spread in
rectangular stainless steel meshed tray.
The effect of slice thickness and drying air temperature on time taken to reach the final
moisture content is presented in Table 4.15. At higher temperatures, due to quick removal of
moisture the drying time was short. The slice thickness also affected the drying time at all
drying temperatures. Drying time was considerably prolonged for more than 11 hrs for 8 mm
slice at all drying air temperatures. Drying at higher temperature, 70°C reduced the required
drying time by 46.2 %, 33.3 % and 33.3 % for 4 mm, 6mm and 8 mm slice thickness
respectively.
Table 4.15 The effect of slice thickness and drying air temperature of drying time
of pineapple slices
Drying time of pineapple slices (hr) Drying temperature
4 mm 6 mm 8 mm °C
50 13 15 18
60 10 12 16
70 7 9 11
The drying curves Fig 4.5a to Fig. 4.5c shows that the moisture ratio decreases continuously
with drying time. Pineapple slices did not exhibit a constant rate period of drying. The entire
drying took place in falling rate period. Continuous decrease in moisture ratio indicates that
diffusion has governed the internal mass transfer.
62

0.00
0.20
0.40
0.60
0.80
1.00
0 1 2 3 4 5 6 7 8 9 10 11 12 13 14 15 16 17 18Drying time , Hr
Moi
stur
e ra
tio
4 mm slice thickness 6 mm slice thickness 8 mm slice thickness
Fig. 4.5a Effect of slice thickness on drying time at drying air temperature of 50 °C
0.00
0.20
0.40
0.60
0.80
1.00
0 1 2 3 4 5 6 7 8 9 10 11 12 13 14 15 16Drying time , Hr
Moi
stur
e r
atio
4 mm slice thickness 6 mm slice thickness 8 mm slice thickness
Fig. 4.5b Effect of slice thickness on drying time at drying air temperature of 60 °C
63

0.00
0.20
0.40
0.60
0.80
1.00
0 1 2 3 4 5 6 7 8 9 10 11 1
Drying time, Hr
Moi
stur
e ra
tio
2
4 mm slice thickness 6 mm slice thickness 8 mm slice thickness
Fig. 4.5c Effect of slice thickness on drying time at drying air temperature of 70 °C 4.3.6 Plant Capacity and Production Program
Plant Capacity
The annual production capacity of the plant is scheduled to be 33 tons. The production
capacity is based on projected demand and realistic market share that could be captured. The
production mix is planned to be 26 tons of pineapple and mango jam and 7 tons of dried
pineapple. Mango jam has a share of 106 tones (40.7 %) from total jam production. The
production commence on single shift and 260 working days a year. The production program
does not include Sundays and national and public holidays. It was also considered that the
plant would conduct annual maintenance on August when the supply for both pineapple and
mango is low.
64

Production Program
The processing plant produces pineapple products in 7 peak pineapple harvest months (Figure
4.4). Mango processing is from January to March and in September when pineapple is not
available. The annual production program for the year 2009-2015 is indicated in Table 4.16
below. The plant initially produce 80% of its annual rated capacity bound to initial operating
problems such as machine setup and marketing. The production capacity increase by 10% and
attain its full rated capacity by the third year of its commencement.
Table 4.16 Annual production program of the processing plant
Production Program
(tons)
Year
Jam Dried fruit
2009 20.8 5.6
2010 23.4 6.3
2011 26.0 7.0
2012 26.0 7.0
2013 26.0 7.0
2014 26.0 7.0
2015 26.0 7.0
4.3.7 Material and Energy Balance A. Material Balance
There are two stages involved in planning the amount of materials required to produce a given
food product. The first stage is to determine the amount of each ingredient needed to
formulate a product. The formulation for pineapple and mango jam is shown in section 4.3.3
above. The dried products are intended to be natural hence no ingredient was added.
The next stage is to determine the amount of losses that are expected in commercial
production. Nearly all fruit processing result in loss of material. These arise from peeling or
de-stoning, unsatisfactory fruits rejected during sorting, spillage during filling into packs and
from food stick on equipments and lost during washing. Peeling and de-stoning losses are
65

specific to the type of fruits being processed. The losses were determined from laboratory
trials for two pineapple cultivars and local mango. However, other losses depend greatly on
the degree and effectiveness of the quality assurance methods used to reduce the losses.
Therefore, they can not be determined from the experimental result. The estimates were made
from the reported data on material loss in well managed fruit and vegetable processing plants
(Table 4.17). Quality assurance systems to minimize these losses were developed and shown
in Section 4.5.1. Therefore the processing plant is considered to work on lower level of the
reported range.
Table 4.17 Process loss in a well managed fruit and vegetable processing plant
Stages in a process Typical loss (%)
Sorting 5-50
Slicing/dicing 5-10
Batch preparation 2-5
Boiling* 5-10
Filling and sealing 5-10
The loss does not include loss due to evaporation of water *
Source: Fellows, P. Midway Technolog.Ltd, UK, 1997
The main production system is splited into three categories: raw material preparation, jam
processing and drying for suitable handling of material balance calculations. The raw material
balance for the production of pineapple jam and dried pineapple from Smooth Cayenne
cultivar is presented. The material balance calculations are computed backward starting from
the daily production of final products. The results of material balance for mango jam is
summarized on Table 4.19.
1. Raw Material Preparation
This process stage involves sorting and grading, peeling, coring, slicing and pulping of the
fruit flesh. The amount of pineapple required to produce 100 kg of jam and 25 kg of dried
pineapple is 370 kg fresh fruit. The average weight of Smooth Cayenne pineapple fruit is 1.34
kg. Hence, 276 pieces of pineapple is handled in a day.
66

Sorting/Grading
Fruits intended for processing has to pass a serious of quality inspections. Any fruits that do
not meet the required standard are removed. The percentage of rejected depend on source and
quality of fruits. Hence, the maximum acceptable reject level should be standardized between
the processor and the fruit supplier. For this specific case 5% reject loss which is the lower
level of the reported range of in typical fruit and processing plant is considered (Table 4.17).
weight of initial fresh pineapple = 370 kg of fresh pineapple per day
weight of fruit reject = 0.05 x 370 Kg/day = 18.5 kg /day
weight of sorted pineapple = 370-18.5 = 351.5 kg /day
Peeling and Coring
Pineapple has to be peeled and cored if it is to be used for drying whereas for jam production
the core is not removed. In laboratory trials it was found that the peel and core of pineapple
accounts to 38% and 8% of the fresh fruit and peeled pineapple weight respectively. From the
sorted pineapple 82% of the peeled pineapple is used for drying operation. Therefore,
weight of pineapple peel = 0.38 x 351.5 = 133.6 kg /day
weight of peeled pineapple = 351.5 – 133.6 = 217.9 kg /day
weight of peeled pineapple used for drying = 0.82 x 217.9 = 178.7 kg /day
weight of peeled pineapple used for jam = 217.9 – 178.7 = 39.2 kg /day
weight of core = 0.08 x 178.8 = 14.3 kg /day
weight of peeled and cored pineapple = 178.7 – 14.3 = 164.4 kg /day
Slicing
Slicing of fruits produces certain pieces with defined thickness and shape which may not meet
the process requirements. The unfit slices should be removed because they result in non
uniform drying and inconsistent product quality. From Table 4.17 the slicing loss is estimated
as 5%. The weight of fruit directed to slicing operation is 164.4.
Weight of slicing loss = 0.05 x 164.4 = 8.2 kg /day
Weight of sliced pineapple: 164.4 – 8.2 = 156.2 kg /day
67

Pulping
The daily consumption of fruit pulp for production of 100 kg pineapple jam including process
losses is 50.4 kg as shown in Table 4.18. 39.2 kg of this quantity is obtained from fresh fruit
while the rest 11.2 kg is supplemented by slicing loss (8.2 kg) and core (3.0). The core and the
slicing loss are blended in 1:3.7 ratios to maintain the original composition of the fresh fruit.
2. Jam Processing
The next stages in jam production are ingredients formulation, boiling, filling, sealing and
packaging.
Batch formulation
As it was shown in Section 4.3.3 105.6 kg of raw materials and ingredients are required to
formulate pineapple jam from Smooth Cayenne cultivar. 2 % material loss during batch
preparation, 5 % during boiling and 5 % during filing and sealing was estimated from Table
4.17. The total amount of these losses is 12%. Therefore the total amount of raw materials
required for production of 100 kg pineapple jam including the process losses is computed as
weight of batch ingredient including process loss =105.6 / (1- 0.12) =120.0 kg /day
material loss in batch preparation = 0.02 x 120.0= 2.4 kg /day
weight of boiling batch ingredient: 120.0 - 2.4 = 117.6 kg /day
A batch of jam should be boiled within approximately 20 minutes to maintain the quality of
product. Therefore two batches can be prepared in one hour. The time allocated to boil 117.6
kg batch ingredients mixture is 4 hours as it is shown in activity chart (Figure 4.11).
The weight of raw material and ingredients to be handled per batch:
hrbatchdayhrdaykg
/2/4/6.117
Χ =
= 14.7 kg /batch
Table 4.18 shows the composition of the batch and weight of raw materials and ingredients
required for daily production of 100 kg of jam including the process losses.
68

Table 4.18 Daily consumption of raw materials and ingredients
Ingredient Unit Input per batch Daily consumption Fruit pulp kg 6.26 50.08
Sugar kg 8.30 66.4 Citric acid g 62.61 500.9
Pectin g 69.57 556.6 Total kg 14.70 117.6
Boiling
The jam yield from smooth cayenne pineapple was 95.5 % as it was shown in section 4.34.
The weight of batch ingredients before boiling is 117.6 kg. The material loss during boiling is
estimated as 5% from Table 4.17.
weight of jam = 0.955 x 117.6 = 112.3 kg /day
weight of lost jam = 0.05 x 112.3 = 5.6 kg /day
weight of jam transferred to next stage=112.3 – 5.6= 106.7 kg /day
Filling and Sealing
The material loss at this stage is due to spillage and material sticking to filling equipment and
lost during washing. Material loss was estimated as 6 % during jam filling and sealing.
Weight of material loss = 0.06 X 106.7 = 6.7 kg /day
Weight of filled and sealed jam =106.7-6.7 = 100 kg /day
Labeling and Packaging
The jam is packed in 450 g net weight in glass jars and placed in cardboard box which can
hold 24 jars. The label is placed both on consumer pack and cardboard box.
Quantity of jars to pack daily production = 100 kg /0.45 kg per unit = 222 unit /day
Cardboard boxes to pack daily production: 100 kg /10.8 kg per unit = 9.25 unit/day.
Similarly, 222 labels for glass jars and 9 labels on outer package are required per day.
69

3. Drying of pineapple slice
Material balance around a dryer with 86% wb input moisture content of slice pineapple and
final moisture content of dried pineapple slices 15% wb yields a product recovery of 16.8%
from sliced pineapple.
Weight of sliced pineapple = 156.2 kg /day
Weight of dried pineapple = 0.168 x 156.2 = 26.3 kg /day
Filling and sealing
The drying process resulted in some poor quality products that could not be sold or
reprocessed. The process loss at this stage is estimated as 5% from Table 4.17.
Weight of material loss = 0.05 x 26.3 = 1.3 kg /day
Weight of sealed dried pineapple: 26.3 -1.3 = 25.0 kg /day
Labeling and packaging
The dried pineapple slices are packed in 250g polypropylene plastic bags and placed in 5 kg
cardboard boxes.
Quantity of polypropylene bag = 25 kg / 0.25 kg per unit = 100 units/day
Cardboard boxes = 25 kg per day / 5 kg per unit = 5 units/day
B. Energy Balance
The energy balance has been made to estimate the energy required for drying pineapple and
jam boiling.
1. Energy for drying pineapple slices
To determine the amount of fuel required for drying the amount of moisture that should be
removed from pineapple slices should be determined first. For inhibition of enzymatic and
non-enzymatic reactions the water activity of the dried pineapple should fall below 0.45.
The amount of moisture that should be removed form sliced fruit ( ) is computed as
follows
wM
f
fipwM
MMMM−
−=100
)( (1)
Where is the weight of dried pineapple, kg, is initial moisture content of sliced
pineapple (%wb) and is final moisture content of dried pineapple (% w
pM iM
fM ). b
70

From material balance =156.2 kg /day. Substituting the value into (Eq.1) pM
15100)1586(2.156
−−=wM
wM = 130.5 kg /day
The quantity of heat required to evaporate this quantity of water is determined from
(2) fghMwQ ×= Where Q is the amount of energy required for the drying process, kJ/day
is latent heat of evaporation, kJ / kg water fgh
The latent heat of evaporation was calculated using equation given by Youcuf-Ali et.al (2001)
as follows
( )( )prfg Th 56.059710186.4 3 −×= (3)
Where
prT is the temperature of the product, °C
The product temperature is considered to exit at the dry bulb temperature of 50 °C, Hence
( )( )5056.059710186.4 3 −×=fgh
= 2.38 kJ / kg water fgh
Hence, the amount of heat required to evaporated 130.5 kg water is
Q= 130.5 X 2.38 kJ / kg
= 310.6 mJ/day
Typical convective dryers account for about 85% of all industrial dryers (Mujumdar and Beke,
2003). The Overall thermal efficiency (Q’) of fuel fired tray dryers is between 30 and 40 %
(Earl, 1983). An average thermal efficiency is 35%. Therefore amount of heat required for
drying pineapple slice is
= 887.4 mJ/day η/' QQ =
71

2. Energy for Jam Boiling
The heat energy required for boiling of jam is determined from energy balance equations.
Figure 4.6 illustrated the heat inflow and outflow in jam boiling pan. From energy balance
computation it was found that 43.5 mJ of energy is required to product 100 kg jam from
pineapple and mango.
FF CTF ,,
P, Tp, Cp
Q
vHV ,
Fig 4.6 Heat inflow and outflow in jam boiling pan
Energy balance equation for jam boiling
( ) ( ) ( )refvrefppTTfeedp hHVTTPCQFCreff
−+−=+−, (4) Where F is quantity of batch mixture fed into boiling pan, kg /day
V is the quantity of evaporated water, kg /day
P is the quantity of jam, kg /day
Q is quantity of heat supplied to the boiling pan
CF and C are specific heat capacity of the feed and the final product respectively, P
KJ/ kg °C
TF and TP temperature of the feed and jam respectively, °C
is the reference temperature, °C Tref
Hv is enthalpy of the vapor at product temperature, KJ/ kg
href is enthalpy of the liquid water at reference temperature, KJ/ kg
Taking the reference temperature to be that of the feed temperature (eq.4) becomes,
( ) ( )refvrefpp hHVTTPCQ −+−= (5)
72

From material balance P =112.3 kg, V=5.3 kg /day. The processing plant is recommended to
be located at Awassa where the altitude is 1,700 m above seal level. Jam boils at 98.8°C at
1700 m above sea level (Elizabeth & Judy, 2006). TF =25 °C (ambient temperature). From
= 100.7 KJ/ kg. Csteam table Hv = 2672.1 KJ/ kg and href P =3.6 KJ/ kg °C. By Substituting
these values in to (eq. 5) the quantity of heat required for boiling 117.6 kg pineapple jam was
calculated as Q = 43.5 MJ. The summary of technical ratio associated with production of
pineapple jam, dried pineapple and mango jam computed in material balance calculations are
summarized in Table 4.19.
Table 4.19 Summary of technical ratios associated with the products
Category Parameter Technical ratio
kg Pineapple / kg dried pineapple 10.9
kg Pineapple / kg jam 0.97 Raw materials
kg mango / kg jam 0.81
kg sugar / kg pineapple jam 0.67
kg sugar / kg mango jam 0.64
g citric acid / kg pineapple jam 5.04 Ingredients
g citric acid / kg mango jam 9.50
g pectin / kg pineapple jam 5.60
g pectin / kg mango jam 5.00
Jam jar (450unit)/ kg jam 2.22
Cardboard box (10.8 kg unit) / kg jam 0.09 Packaging
Polypropylene bag/ kg dried pineapple 4.00 Materials
Cardboard box(25 kg unit)/ kg dried pineapple 0.20
Unit label / kg jam 2.22
Label Unit label / kg dried pineapple 0.20
73

4.3.8 Processing Technology The selection of processing technology was made on the basis of various factors. The first
factor was the consistency of the processing technology that ensures quality requirement of
the market place. The production of good quality products is essential to compete effectively
in the market place. Locally produced jam may faces strong competition from imported jams
which has already got consumers acceptance. Dried pineapple is intended for export market
hence the processing technology should meet the importers requirement. The second factor
was the technology compatibility for small scale processing of fruits. Small scale food
processing requires reliable, affordable, locally produced and locally repaired technology of
suitable size for the production and people who operate it (Fellows, 2002). The third factor
was the effect of the processing technology on the quality and quantity of the products
nutrients has been considered.
Description of the selected processing technology for jam production and drying are classified
into three major stages: raw material inspection, raw material preparation and processing.
Process flow diagrams for the manufacturing of jam and dried products are shown in Figure
4.7 and Figure 4.8 respectively.
Raw Material Inspection Pineapple and mango fruits harvested at optimal maturity stage will be collected from
contracted farms. The fruits are filled into wooden crates and transported to the processing
plant. The fruits are temporarily stored in the raw material storage area. The fruits are then
weighed in ground scale and inspected for maturity, color, size, presence of mold and foreign
matter. Fruits that do not meet the quality standards are removed to a disposal site. The fruits
are then filled in plastic crates and transferred into the raw material preparation stage. Each
batch of raw material received is recorded in an incoming material test book noting the
number of batch, the supplier and quality observations.
74

Raw Material Preparation
Four basic steps are involved in preparation of fruits for jam production and drying: These are
washing, peeling/coring/de-stoning, slicing and pulping. The fruits washing process includes
pre-cleaning, sanitization and rinsing stages. For raw material cleaning 2.5 liters of water is
required for each kg of fruit (Carlos et al, 2005). The first hygienic process is simple water
washing, in which the dirt is removed only through the physical contact between the water and
the fruit. For sanitization 50 % of the total water for hygiene is required. The recommended
chlorine concentration is 5 ppm (Medina, 1987). The rinsing is performed using potable water
to remove the residual chlorine.
The next processes are peeling, coring and destoning of the fruits. Pineapple should be peeled
and cored if it is to be dried however the core would not be removed for jam production. The
core removed during preparation of pineapple for drying is utilized in jam making. Peeling of
pineapple is a very tedious task. Hand operated pineapple peeling and coring machine is
applied .Peeling of mango is done by hand kg with sharp stainless steel knives. Mechanical
peelers for ripe mango are available at higher capacity which is more than 400 kg /hr. They
are also expensive to for small scale processing. The multi purpose fruit slicer slices the
peeled mango and pineapple into uniform thickness. The slicer also helps to reduce the size of
the fruits to the level that could be handled by the fruit pulper. The fruit pulper liquidizes the
sliced mango and pineapple.
Processing
1. Jam processing
The next stages in jam production are formulation of batch ingredients, boiling, filling, sealing
and cooling. Formulation of ingredients is one of the most important stages in jam processing.
There must be the correct proportion of sugar, acid and pectin in order to obtain a good gel.
The quality controller should adjust the batch recipe according to the physico-chemical
parameters of the fruits received. The change in batch formulation should be communicated to
the batch preparation staff in written form. The batch ingredients are weighed in the quantity
specified in the recipe using table scale with measurement range up to 2 kg in division of 1g.
75

The pH of fruit pulp should be adjusted by adding citric acid until the pH reaches 3.2 by
measuring it with pH paper. Boiling is one of the most important steps in jam making. Its
principal purpose is to increase the concentration of sugar to the point where gelling will
occur. Pectin is added by vigorously stirring while slowly adding the pectin to a heated but not
boiling fruit pulp. A temperature of 76°C to 82°C is preferable for pectin addition, because at
the boiling point sugar dissolves more rapidly than pectin and the pectin may form lumps
which are nearly impossible to dissolve. After the pectin is dissolved temperature is raised to
the boiling point. The boiling is continued until the product reaches 68 ° Brix. The end point is
determined by reading the total soluble solid content with hand refractometer. The
refractometer determines the sugar content by the angle that the solution refracts or bends
light. The procedure is fast and simple. A drop of the liquid is placed on the instrument and
the operator peers into the refractometer while aiming it towards a light source and reads the
percent TSS. Based on this result decision can be made weather to package or to cook the jam
further. The jam should be boiled for not more than 15 minuets because of the resultant loss of
flavor and color of the product.
When the end point reached the jam should be filled into jars, which have been cleaned and
sterilized. New jars and bottles should be cleaned by potable water with bottle brush then
rinsed thoroughly. Second hand bottles must be thoroughly inspected for contamination. They
should be soaked in 1% solution of caustic soda and detergent to remove old labels. All
contaminated jars should be removed and not used for package.
Sterilization of jars and lid is carried out by placing them in a large pan of boiling water for
10-15 minutes. The jars should be hot so that they do not crack due to thermal shocks during
filling. The jam is filled to at least 90 percent full to help a vacuum to form in the space above
the product as it cools. The lids should be loosely placed on the containers immediately
following filling, then tightened firmly with in two or three minutes. This allows time for
exhausting of air from the head space. The steam in the head space condenses when the jam
cools creating a vacuum seal on the jar. The jars are then placed in bottle cooler where cooling
water flow in opposite direction to containers. This helps to cool down the jam to 45°C so that
it does not keep cooking in the jar. The water level in the cooler should be kept below the lids
76
of the jars to prevent possible re-contamination of product. Labeling is carried out by rolling
the jars along the guide rail mounted on labeling table over glued stack of label and pressing
into rubber mat. Starch based glues are used to stick the labels into the surface of jars. Finally
the jars are inserted into cardboard boxes and transferred to the storage room.
2. Drying
The fruits sliced according to buyer’s specification at raw material preparation stage are
loaded on trays immediately after they have being sliced. The trays should be cleaned to
remove any old fruit pieces prior to loading the sliced fruits. The trays should be fully loaded
by placing slices close together on the tray however overlapping of slices should be avoided.
After the sliced fruits have been dried to the required moisture level they are unloaded from
the dyer. Under dried or darken pieces of slices are removed. The dried pineapple is filled into
250 g biaxially oriented polypropylene bags and sealed in manual heat sealers. The machine
melts and press polypropylene plastics forming 3-5 mm wide seal. The packed products are
then filled in cardboard boxes and transferred to storage.
77

Receiving fresh pineapple or mango Sorting and grading
Cleaning
Animal Feed or Biogas
Peeling/destoning
Pulping
Batch formulation
Boiling ( 68° Brix & 15-20 min)
Filling &Sealing
Cooling 45 °C
Labeling
Storage ( 10-21 °C )
Sterilization
Inspection & cleaning
Receiving glass jars
Peel & stone
Batch Ingredients
Inspection
78

Figure 4.7 Process flow diagrams for jam production Receiving fresh Pineapple Sorting & grading
Cleaning/washers
Animal feed or biogas
Figure 4.8 Process flow diagrams for pineapple slices drying
Peel & core Peeling/ decoring
Slicing (4 - 6 mm)
Drying (60- 70°C)
Filling & Sealing
Labeling
Storage
79

4.3.9 Machinery and Equipments The specification and description for equipments and machineries of processing plant is
discussed in this section. To estimate the throughput of the machineries and equipments first,
the weight of material that is handled at each stage of processing should be determined. This
task has partially been covered in material balance (section 4.3.7). Capacity, material of
construction and maintenance requirements are included in equipment and machinery
specification. All fruit contact surface should be smooth, non-toxic, unaffected by food
products, and capable of withstanding repeated exposure to normal cleaning.
Description of Plant Equipments and Machineries
Specification of plant equipments and machineries for the processing plant is shown in Table
4.20 and Table 4.21. Detail description of major equipments and machineries is discussed
below.
Pineapple Peeler/corer
A hand operated pineapple peeler and corer consists of two sharpened stainless steel cutting
cylinders which peels and removes the core from pineapple. The manually topped and tailed
pineapple is placed on the support table and when the larger cylinder brought down it cuts off
the outer skin. The smaller cutter is then used to remove the core. Cutting cylinders of three
different sizes help to handle the variation in pineapple fruit size.
Pulper
The contact parts of the pulper to fruit are made of stainless steel. It is powered by 1 HP single
phase motor. It can process about 60 -70 kg per hour. Its easy operations and maintenance
requires no skilled labor to operate. It can be easily dismantled for cleaning after operation
and quickly re-assembled.
Boiling pan
There are two types of boiling pan commonly employed for jam making : a simple stainless
steel boiling pan which is placed directly over a heat source and double jacketed stainless steel
boiling pan. The latter is selected because of higher quality jam it produces. Steam is produced
80

in the space between the outer jacket and inner pan to get more uniform heating and avoid
localized burning of the product.
The equipment should be fabricated from stainless steel because it is resistant to the action of
fruit pulp. Furthermore it provides smoothness, cleanability and corrosion prevention. The
corrosion resistant of stainless steel is attributed to the formation of surface film on the metal
surface when exposed to air. Iron or steel are liable to darken fruit pulp by the solution of
small amount of iron, which reacts with pulp tannins and colors to produce a black or dark
brown color. Copper and tin are objectionable because even small concentration of their salts
adversely affect the flavor and color of pulp and catalyze undesirable changes. Galvanized,
zinc coated, vessels should never be used for fruit pulp because toxic levels of zinc can be
dissolved in the pulp (Smith, 2006).
Bottle washer
The time consuming part of manual bottle washing is rinsing out the detergent. Bottle
washers are used to reduce this time. They are made by soldering vertical pipes on to a larger
base pipe and connecting the base pipe to a water supply. The jars are inverted over vertical
pipes and rinsed free of detergents. No spare parts are required and there is no maintenance
requirement.
Jars and lids are sterilized in boiling water in large aluminum pan. The bottles are boiled for
10 minutes and removed for immediate hot filling and sealing. The quantity of jars required to
package a batch of jam, 12.5 kg, is 28 jars. The sterilization could be done on two 10 liter
aluminum pans or one large aluminum pan 20 liter capacity.
Jam Fillers
At small scale viscous products like jam jelly and marmalade are filled by hand using funnels
and jugs calibrated for the correct volume. This is time consuming operation, which requires a
large labor input. Mechanical fillers are expensive and usually operate at higher production
throughput (more than 1000 packs per day. Jam filler selected for the project is small gravity
filler made from stainless steel bucket and valve fixed at the bottom. A gave valve is
recommended because of the easiness for cleaning. The tank should be cleaned after use by
washing thoroughly with detergent and rinsing with clean water.
81

Bottle cooler
The filled jars should cool down to room temperature so that the jam does not keep cooking in
the jar. Leaving the jam to cool by atmospheric air is very slow process because air is poor
conductor of heat. Inclined water bath is used to increase the rate at which the glass cools. The
water level should be kept below the lid of the jars. The cooling water flows in the opposite
direction. No spare parts are required and no maintenance, except periodic emptying and
cleaning to prevent a building of micro-organisms in the cooling water.
Dryer
The selection of fruit dryer is governed by the required throughput, the level of investment,
the ability to meet product quality requirements and the type of heat source available. From
material balance computations the daily throughput of the dryer was estimated as 156.2 kg.
The potential small scale drying equipments of this capacity are solar tunnel dryer and tray
dryer. The prone and cons of the two dryers is analyzed.
a) Solar tunnel dryer
Among the solar dryer solar tunnel dryer are popular due to larger throughput (150-250 kg per
batch), considerable reduction of drying time and significant improvement of product quality
(Chou, et al., 1997). Solar tunnel dryers capable of handling 150 kg per batch are available at
cost of Euro 5,326 (ITDG, 2004). The operational cost of solar tunnel dryer in terms of energy
is Zero. The main limitation of these dryers are they are dependent on weather condition and
extended drying periods which often lead to quality problems such as browning and
scorching.
b) Fuel fired dryers
Fuel fired dryers provides a better control of the product quality and shorter drying time is
achieved. The main limitations of these dryers are high investment cost and operating costs.
The investment cost is considerable reduced if the dryers are to be manufactured locally from
locally available materials. Intermediate Technology Development Group (ITDG) a British
based NGO has developed and disseminate small scale fuel fired tray dryers.
82

83
The dryers have been successful in more than 100 countries. These dryers could be
constructed at low cost (Axtel and Russell, 2000). The operating costs could be reduced if low
cost energy sources are used. For heat supply there are two options. These are biomass and
biogas. There have been studies on utilization of fruits and vegetable waste as efficient use for
methane generation (Nand, et al., 1990). Pineapple peel has been found to be promising waste
resource for biogas generation. Mango peel can also be used for biogas generation by
anaerobic digestion. The result of biogas pilot plant studies have shown that mango peel can
yield a biogas rate as high as 0.6 m3/ kg volatile solids and 52% methane (Krishnananad,
1994).The above two options are very promising energy source for pineapple drying however
further study need to be conducted to verify the viability of these options. Liquefied Petroleum
Gas (LPG) is another option but the operating cost is usually high. This gas has been taken as
energy source because for the drying of pineapple slices.
The selected dryer is fuel fired tray dryer, it consist of a drying chamber, combustion
chamber, heat exchanging unit and a centrifugal fan to draw ambient air through the heat
exchanger into the drying chamber. The combustion chamber is made of bricks enclosed in
galvanized sheet metal. The heat exchanger system consists of boiler tubes arranged in a
rectangular array. An air distribution system in the drying chamber helps the distribution of
heated air and profiles uniform temperature at all location of the drying chamber. The heat
required for drying is supplied by combustion of LPG. The temperature of air at the entrance
of the drying chamber is monitored by the thermocouple.
Equipment Supply and Maintenance Service
Most equipments and machineries required for the processing plant are available at local
market with reasonable price and special equipments like peeler/corer, slicer, and pulper could
be manufactured by local workshops. These fabricators could help in maintenance and supply
of spare parts; moreover their cost would be generally lower than imported ones. Dryer, hand
held refractometer and bag sealing machine, however, have to be imported. Since the
manufacturing of agro-industry machineries and equipments is not well developed in Ethiopia,
research centers and universities working on food technology should give support to develop
and test prototypes that meet the needs of both workshop and food processors.

Table 4.20 Specification and cost of equipments & machineries for raw material preparation
Processing stage
Unit Material handled
Process time per
day
No of workers
Equipment Specification Quantity Total cost
Per day Birr ( hr )
Ground scale measurement range 0-50
kg and tolerance
Weighing /sorting/grading
Pcs 275 1.0 4 +
100 g 1 2,400.00 enamel coated wooden sorting table (1.80 m x1.20 m x 0.8 m )
1 350.00
wooden crates 0.05 m3 volume 5 1250.00
Cleaning Pcs 261 1.0 4 25 liter polyethylene washing tank 2 80.00 Water storage tank 1500 liter 2 2,800.00
Plastic crates 5 125.00
Peeling /coring Pcs 261 2.20 2 Manual pineapple peeler and corer capacity of peeling and coring 2 fruits
per minutes
1 8,100.00
Multi fruit slicer capable of slicing
mango and pineapple , capacity = 75 kg/hr
Slicing kg 218 2.90 1 1 21,650.00
Stainless steel multi fruit pulper with
capacity 24 kg/hr 1 8,640.00
Pulp extraction kg 48 2.0 1 20 liter Plastic buckers 2 40.00
84
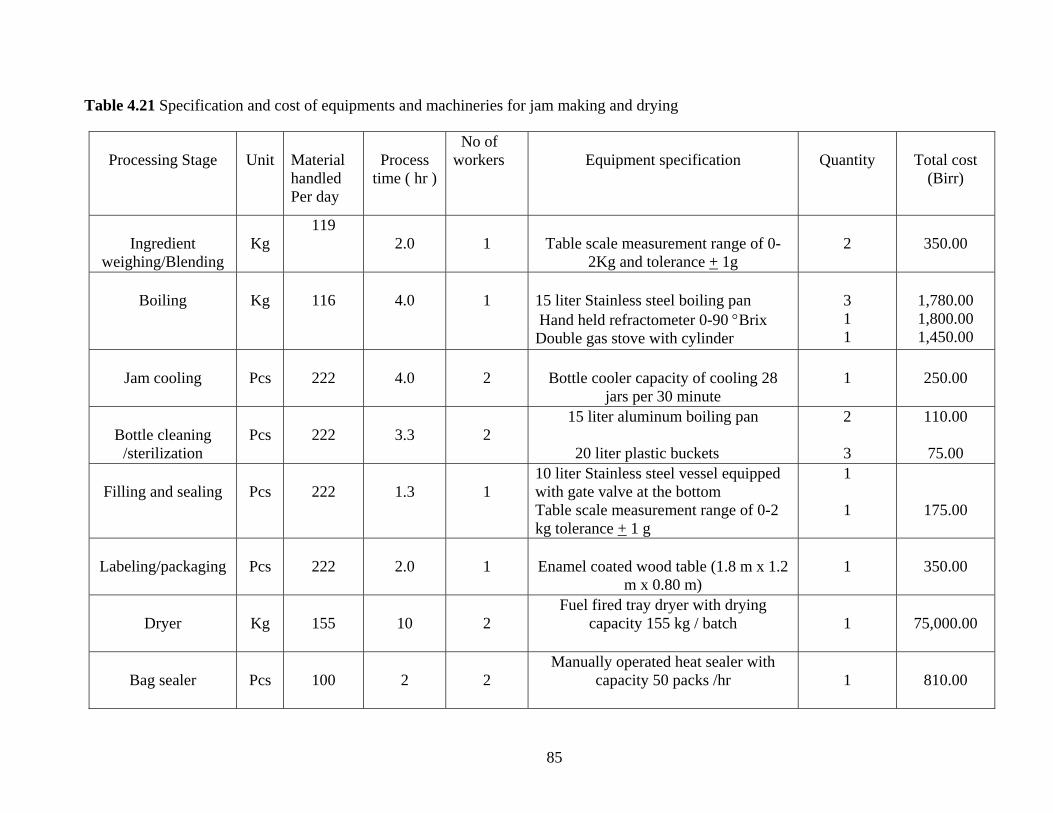
85
Table 4.21 Specification and cost of equipments and machineries for jam making and drying
Processing Stage
Unit
Material handled Per day
Process
time ( hr )
No of workers
Equipment specification
Quantity
Total cost
(Birr)
Ingredient
weighing/Blending
Kg
119 2.0
1
Table scale measurement range of 0-
2Kg and tolerance + 1g
2
350.00
Boiling
Kg
116
4.0
1
15 liter Stainless steel boiling pan Hand held refractometer 0-90 °Brix Double gas stove with cylinder
3 1 1
1,780.00 1,800.00 1,450.00
Jam cooling
Pcs
222
4.0
2
Bottle cooler capacity of cooling 28
jars per 30 minute
1
250.00
Bottle cleaning
/sterilization
Pcs
222
3.3
2
15 liter aluminum boiling pan
20 liter plastic buckets
2 3
110.00
75.00
Filling and sealing
Pcs
222
1.3
1
10 liter Stainless steel vessel equipped with gate valve at the bottom Table scale measurement range of 0-2 kg tolerance + 1 g
1 1
175.00
Labeling/packaging
Pcs
222
2.0
1
Enamel coated wood table (1.8 m x 1.2
m x 0.80 m)
1
350.00
Dryer
Kg
155
10
2
Fuel fired tray dryer with drying capacity 155 kg / batch
1
75,000.00
Bag sealer
Pcs
100
2
2
Manually operated heat sealer with capacity 50 packs /hr
1
810.00
4.3.10 Production Facilities and Services When considering setting up of fruit and vegetable processing plant, the infrastructure
required to lodge all machinery and equipments is often given priority. The infrastructure for
food processing should meet basic industrial health and hygienic practices. Details studies
have to be conducted on location of the processing plant, plant layout, construction of the
buildings provide basic services and installations.
Plant layout
Plant layout is the plan of optimum arrangement of an industrial facility. It embraces the
physical arrangement of various departments, machines, equipments and services for
economical, efficient and effective functioning while planning the production of any goods.
The food processing plant layout has been developed taking into consideration international
and national code of hygienic practices. Recommended international hygienic practices for
dried fruit processing plant construction, layout and sanitary facilities were covered in Codex
code of hygienic practice for dried fruits Codex Alimentarius (1969).
The processing plant layout is shown in Figure 4.9. In setting up the plant layout the
following points were considered. Machineries and equipments are arranged in a continuous
line without a path crossing to step up efficiency and avoid cross contamination. The ‘dirty’
area where the raw material is washed, peeled and cored is separated physically from the clean
area where pulp extraction, slicing, boiling and packaging is carried out. This layout reduces
the risk of contaminating semi processed and finished products by incoming raw materials. A
separate building is arranged for storage of ingredients, final products and packaging
materials. Sanitary facilities were provided in plant layout for preserving health and sanitary
standards. The sanitary facilities are located in separate area from the area where the raw
materials are received and processed to prevent possible contamination. Hand washing basin
is also provided at entrance to the toilets.
Special emphasis is taken in locating a dryer and bottle washing facility. A dryer is placed
outside the processing room in open shade because the processing room is humid area which
84
requires a great amount of heat to dry the air. Bottle washing is placed outside the processing
room to avoid the risk of glass splinters mixed with the final product.
Building Design
During construction of the building of the processing plant the following aspects should be
addressed. The processing room contains a considerable heat that evolves from jam boiling.
Therefore the roof should be over hanged and roof vents should be included to allow heat and
steam to escape and crate a flow of fresh air through the processing room. The vent must be
screened with mesh to keep insects and birds out of the room. A paneled ceiling should be
fitted in the processing and storage rooms to prevent dust accumulation and contaminate
products. There should be no holes in the paneling, in the roof and where the roof joins the
walls to inhibit access to birds’ rodents and insects. Floors should be made of good quality
concrete, without holes or cracks. The floor should be curved up to meet the wall to prevent
dirt collecting in corners. The floor should slope to a drainage channel, fitted with metal
grating that are easily removed for cleaning. A wire mesh should be fitted over the drain to
prevent rats and crawling insects from entering the room.
All interior walls should be plastered or rendered with concrete. They should have no cracks
that could harbor dirt or insects. The lower parts of the walls are most likely to get dirty and
they should be tiled or painted with white gloss water proof paint at least one and half meter
above the floor. Higher parts of walls can be painted with emulsion paints. All windows
should be screened with mosquito mesh to prevent access for flying insects. The windows
should also be made to slope so that they do not accumulate dust. Processing room doors
should be fitted with thin metal chains or strips of plastics hanged from door lintels. Store
room doors should not have gaps beneath them and should be kept closed to prevent insects
and rodents.
85

27 26 25 24 23 22 21
Figure 4.9 Processing plant Layout 1. Reception & weighing 16. packaging dried fruit 2. Cold room 17. bottle cleaning and rinsing 3. Fruit sorting & washing 18. Ingredients storage 4. Peeling/coring/destoning 19. packaging materials storage 5. Pulp extraction 20. Final products storage 6. Batch preparation 21. Cafeteria 7. Jam boiling 22. Office 8. Jam filling and sealing 23. Quality control office 9. Jam cooling 24. Women rest room 10. Labeling and packaging 25. Women shower room 11. Fruit slicing 26. Men rest room 12. Tray loading 27. Men shower room 13. Drying 28. Waste treatment 14. Unloading the dried fruit 29. Water tanker 15. Filling and sealing dried fruit
4 3
5
6
7
8
9
10
11
12
14
15
16
1
20 19 18 28
13
17
29
2
86
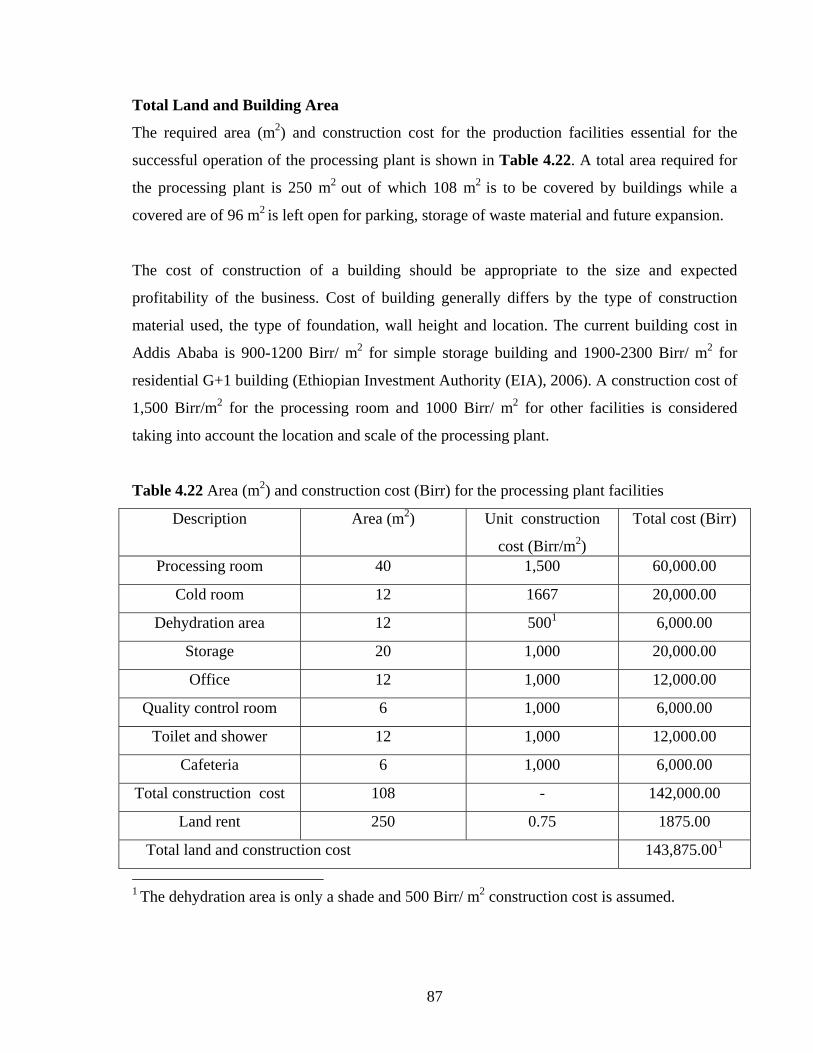
Total Land and Building Area
The required area (m2) and construction cost for the production facilities essential for the
successful operation of the processing plant is shown in Table 4.22. A total area required for
the processing plant is 250 m2 out of which 108 m2 is to be covered by buildings while a
covered are of 96 m2 is left open for parking, storage of waste material and future expansion.
The cost of construction of a building should be appropriate to the size and expected
profitability of the business. Cost of building generally differs by the type of construction
material used, the type of foundation, wall height and location. The current building cost in
Addis Ababa is 900-1200 Birr/ m2 for simple storage building and 1900-2300 Birr/ m2 for
residential G+1 building (Ethiopian Investment Authority (EIA), 2006). A construction cost of
1,500 Birr/m2 for the processing room and 1000 Birr/ m2 for other facilities is considered
taking into account the location and scale of the processing plant.
Table 4.22 Area (m2) and construction cost (Birr) for the processing plant facilities
Description Area (m2) Unit construction
cost (Birr/m
Total cost (Birr) 2)
Processing room 40 1,500 60,000.00
Cold room 12 1667 20,000.00 1Dehydration area 12 500 6,000.00
Storage 20 1,000 20,000.00
Office 12 1,000 12,000.00
Quality control room 6 1,000 6,000.00
Toilet and shower 12 1,000 12,000.00
Cafeteria 6 1,000 6,000.00
Total construction cost 108 - 142,000.00
Land rent 250 0.75 1875.00 1 Total land and construction cost 143,875.00
1 The dehydration area is only a shade and 500 Birr/ m2 construction cost is assumed.
87

In Ethiopia, land is public property. Both urban and rural land is available for investment on
leasehold basis with renewable period. The rental value and the lease period of rural land are
determined and fixed by land use regulation of each regional state. The cost of rural land in
SNNPR, where the processing plant would be located, is 30 Birr/hectare/year to 117
Birr/hectare per year. The average value of 75 Birr/ ha per year is considered for the lease
period of 10 years (EIA, 2006).
Basic services Three basic services are required for the operation of the processing plant: potable water,
electric power and energy source. Industrial good manufacturing practices and daily
consumptions of basic services are analyzed in this section. The detail description is given as
follows.
Water Consumption
Potable water is essential in all fruit processing plants. It is used as ingredients, for washing
down equipments and machineries, maintaining workers hygiene, as cooling and heating
medium and for fire fighting. An adequate supply of potable water shall be available from taps
in the processing room. Potable water is drinking water that is wholesome, clean and safe to
drink. It is free from any microorganism, parasite and any substance that in number and
concentration constitutes a potential danger to human health. Ethiopian standard ES 261:2001
specifies physical, chemical and microbiological specification for the potable water. The total
daily water consumption for the processing plant was determined on the basis of water
required for cleaning of raw materials and sanitization of processing plant and workers.
Additional 10% of total usage is included as safety factor.
1. Water consumption for raw material cleaning
Pineapple cleaning requires 2.5 L of water per kg of pineapple washed (Carlos et al., 2005).
From material balance it was found that 352 kg of pineapple is washed daily. Therefore, the
daily water consumption for raw material cleaning = 352 kg/day x 2.5 L/kg = 880 L/day.
88
2. Water consumption for processing plant hygiene
Equipment and workplace should be thoroughly cleaned after each day’s production, using a
cleaning routine. For cleaning of plant equipments, machineries and work place it was
considered 500 liter per day. About 50 % of it is needed for washing, 20 % for sanitization
and 30 % for rinsing without the use of chlorine. The recommended chlorine concentration for
sanitization is 200 ppm (Andrade, 1996). Therefore, the sanitizer consumption is determined
as:
Active chlorine quantity = 0.2 x 500 L/day x 200/1,000,000kg/l = 0.02 kg/day
In apart from this, 2 L water is considered to be consumed per bottle for bottle cleaning,
sterilization and jam cooling. From material balance it was found that 222 jars are required to
package daily production. Hence, additional 444 L of water is consumed per day. Therefore,
the total quantity of water consumption for processing plant hygiene is 944 L per day.
3. Water consumption for workers hygiene
There is a minimum recommended water volume per day per person for sanitary purpose and
comfort condition in workplace. In Ethiopia there is no such regulation laid until now. For
similarities in level of development Brazilian experience was taken. Brazilian labor ministry
regulations laid 60L/ day per person water as minimum water volume for sanitary purpose and
comfort condition in workplace (Carlos et al., 2005). The number of direct labor in the
processing plant is 10. Therefore the consumption is computed as follows
Daily water requirement = 10 persons x 60 L/ day per person = 600 Liters
Hence total water requirement per day including 10% safety margin = 1.1(880 + 944 + 600)
= 2, 424 L /day
From this total water 444 liters is utilized purely for jam production. The remaining 1980 L
could be apportioned to the two products based on the ratio of fresh pineapple handled to
produce the final products. From material balance it was found that 82% of the total fresh
pineapple is used for pineapple drying. Hence, the daily water consumption for pineapple
89

drying and jam production would be 64.94 liters per Kg and 8.00L per kg of final products
respectively. To ensure the supply of water on continuous basis two polyethylene plastic tanks
with the total capacity enough for one day production would be installed. The tanks would
have slopping base and be fitted with drain valves at the lowest point to periodically flush out
any sediment that has accumulated.
Electricity Consumption
Electrical power required to run plant machineries, for illumination and additional 10% of the
total consumption to account for miscellaneous consumptions was included in computing total
daily electricity consumption of the processing plant.
1. Electricity consumption for machinery
The daily electrical power required for running plant machineries is calculated based on
supplier’s data sheet for machinery power load (Table 4.23). The running hours are taken
from activity chart Figure 4.11.
Table 4.23 Daily electrical power consumption for plant machineries
Running time Electrical power
consumption (KWh) Equipment Power (KW) (hr)
Pulper 0.75 2.0 1.5
Slicer 1.8 2.9 5.3
Dryer fan 1.5 18.0 27.0
Heat sealer 0.1 2.0 0.2
Daily electricity consumption for machineries 34.0
2. Electricity required for illumination Electricity provides illumination of workplace in food processing plants. The efficiency of
workers in the processing plant will be dependent on availability of proper lightning.
Calculations for the Electricity required for illumination are based on the lumens method
(Filho, 2002). It was recommended that illumination intensity of 500 lux is required for raw
material reception, preparation, processing and packaging areas. In these areas ceilings and
90

walls will be painted with light colors but the floor would be constructed from dark material.
Wide lamps are used in continuous lines. Based on this consideration it was established the
light ratio /m2 which is 0.18 KWh/ day m2 is required for this areas (Filho, 2002). The total
area for the processing room is 40 m2. Hence daily electricity consumption due to illumination
of processing area is computed as:
Electricity consumption in processing area (E1) =0.18 KWh/day m2 * 40m2
E1 = 7.2 KWh/day
For the storage areas, ingredient, packaging materials and final products, it was considered the
need for 3 incandescent lamps 60W each. Hence the daily electricity consumption (E2) for
one operational hour (E2) is computed as
E2 = 3 X 0.06KW X 1Hr/day = 0.18KWh/day
The managing area includes two toilets restaurant, office and quality control room. It was
considered the need for 5 incandescent lamps 60W each. Therefore daily electricity
consumption (E3) for one operational hour in toilets and 6 operational hours for the other
rooms would be 1.56KWh/day. Therefore the total daily electricity consumption for plant
illumination (ET) would be:
ET = 7.2 + 1.56 + 0.18 = 8.94 KWh/day
The total daily electricity consumption for the processing plant is computed by summing the
daily consumption for plant machinery, illumination and 10% of the total value as safety
margin. The computed total daily electricity consumption of the processing plant is
47.2KWh/day. From this total energy 37.5 KWh/day is required for pineapple drying while
5.2 KWh/day is utilized for pineapple jam production.
Location of the processing plant
The basic criteria for selection of the fruit processing plant location was minimizing the
average production cost, including transport and handling. Beside the supply of good water,
availability of manpower, proximity to transport facilities and adequate market were taken
into consideration. The major raw material pineapple is produced in Sidama Zone on the way
91

92
from Awassa to Dilla. The major market for jam products is Addis Ababa while the dried
fruits are to be exported via air flight to EU countries. The packaging materials are produced
in Addis Ababa. Hence the choice for locating the processing plant near raw materials supply
or market proximity would depend on the annual quantity of raw materials, ingredients,
packaging materials and final products that are transported between the two sites.
As a result, three potential areas were selected, Addis Ababa, Awassa and Dilla, for locating
the processing plant. The cost comparison for transportation of raw materials, ingredients,
packaging materials and final products is shown in Table 4.24. The road transportation cost
was taken from Ethiopian road Transport Authority. the freight transport tariff rate from Addis
Ababa to Awassa and Dilla is 29.304 cents/ton per Km while for the return trip the cost is
25.641 cents/ton per Km. In Table 4.24 it is shown that the transportation cost could be
lowered by 1, 774 Birr or 1,446 birr per annum if the plant is to be constructed at Awassa than
Addis Ababa or Dilla respectively. Locating the plant in Awassa has additional benefit in
reducing injury from handling and deterioration from changes during long transportation after
harvest. In Awassa there are industry zones with full infrastructure to be supplied for
investors. It is also possible to get the required staff of the processing plant easily.

93
Table 4.24 Transportation cost comparison among potential sites for plant location
*it is considered that 25% of the jam will be sold in Awassa while the other 25% at 100 Km radius from Awassa and the rest would
be sold at Addis Ababa. ** It is considered that 25% of the jam will be sold in Awassa while the other 25% at 200 Km radius from Awassa and the rest
would be sold at Addis Ababa.
Addis Ababa Awassa Dilla
Transported
Materials
Distance
(Km)
Quantity
(ton)
Cost
(Birr)
Distance
(Km)
Quantity
(ton)
Cost
(Birr)
Distance
(Km)
Quantity
(ton)
Cost
(Birr)
Raw materials 360 95.1 8,535 77 95.1 1,878 5 95.1 1,220
Ingredients - - - 273 17.1 1,368 365 17.1 1,831
packaging - - - 273 17.7 1,416 365 17.7 1,893
Final product with
package
-
-
-
253
100
25.3*
12.7
2,099
365
77**
200
25.3
12.7
12.6
3,263
8,207 6,761 8,535 Total cost

4.3.11 Integration with medium and large scale industries At present there are few small scale fruit processing industries in Ethiopia. However, with the
development of these industries integration with medium and large scale only could help to
foster the overall profitability of the industries. This approach could be very helpful especially
for export market. In this specific case, the integration could be created so that small scale
industries sell their semi-finished products to the centralized finishing plant. The finishing
process would consists of packaging of product in standard consume packs, distribution and
marketing of products. This approach would help to meet higher market volume, reduce
transportation cost, reduce distribution and marketing costs and to comply with safety legislate
compulsory and product related legislations in the export market.
94

4.4 Organization and Management 4.4.1 Organizational Structure For the business to operate smoothly and effectively, there must be defined structure of
authority and responsibility (chain of command), division of labor, and definition of what each
one must do in the business (job description).
The organizational structure of the processing plant is shown in Figure 4.10. The organization
management team consists, Production Supervisor, Marketing Supervisor, and Administration
and Finance Officer who are working under the supervision of the General Manager. The
marketing supervisor is responsible for procurement of raw materials, ingredients and
accessories, promotion and distribution of final products. Administration and finance officer
handle personnel administration, financial book keeping and store management. The
production supervisor is responsible for planning organization and monitoring of production
process, quality assurance and repair and maintenance services.
General Manager
Marketing Supervisor
Production Supervisor
Administration & Finance Officer
Quality Inspector
Store keeper
Labor
Figure 4.10 Organizational structure for the processing plant
95

96
4.4.2 Human Resource Requirement The number and skill of work force that is required to operate the processing plant is
determined in conjunction with selection of plant machineries. For better management of the
work force, the production process has been broken down into sequence of activities that
should be performed in specified time frame. The activity chart (Figure 4.11) describes the
specific task and time frame each staff should carryout throughout the day. To ensure business
survival and growth, it is important that the people who run the business must have the proper
qualification and suitable experience. Human resource requirement including minimum
qualification level and estimated salary for each job title is presented in Table 4.25.
Table 4.25 Manpower requirement, qualification and salary scale of the personnel’s
Job title
Qualification
Experience
Quantity
Salary
Total salary Birr/ year
General manager
B.SC in Food Technology / B.A in Business Administration
2 years
1
1700.00
20,400.00
Production supervisor
College diploma Food Technology /Chemical Engineering
1 year
1
752.00
9,024.00
Marketing supervisor
College diploma in Marketing Management
1 year 1
752.00
9,024.00
Administration & finance officer
College diploma in Accounting
1 year
1
752.00
9,024.00
Quality inspector
Diploma in chemistry
-
1
752.00
7,752.00
Store keeper
12th grade
-
1
472.00
5,664.00
Labor
12th grade
-
8
472.00
45,312.00
Guard
10th grade
- 1
392.00
4,704.00
Total annual salary (Birr)
110,904.00
Source: Ethiopian Investment Authority. (2006), Factor Cost

97
Figure 4.11 Activity chart for drying and jam processing
Time
Task
8am
9am
10am
11am
12am
1pm
2pm
3pm
4pm
5pm
6pm
7pm
8pm
9pm
11pm
11pm
12pm
1am
2am
3am
4am
5am
6am
7am
Required
Human resource
Weighing /Sorting /cleaning
4a,b,c,d *
Peeling/coring/slicing
2a,b
Loading sliced fruit into dryer trays
2e,f
Drying
2h,i
Filling /sealing/packaging dried fruits
2e,f
Pulp extraction
2c,d
Batch formulation and jam boiling
2c,d
Cleaning and sterilization of jars
2a,b
Cooling /filling/ sealing/ labeling/ packaging of jam
2e,f
Cleaning machinery & work place
1g
Raw material inspection and process control
Quality controller
* Similar letters designate same person

The total human resource requirement is estimated as 15. The total annual salary of factory
staff is estimated as Birr 110,904. For this analysis the base salary is calculated based on
published data by Ethiopian investment authority in its brochure ‘Factor cost’ (EIA, 2006).
Salaries of skilled personnel, however, are determined by contractual agreements between the
parties based on the level of skill and type of profession.
4.4.3 Labor Availability and Training Requirement Shortage of unskilled and semi skilled labor forces are not expected since there is a large
number of unemployed persons and a few opportunity for alternative employment.
Furthermore, the various technical and vocational training schools, and higher learning
institutions supply sizable number of trained and skilled personnel required by the processing
plant. Training of the production staff can be carried out at the work place during the course of
work.
4.4.4 Direct Labor Expense
Direct labor expenses are attributable to a product in terms of a production labor. This
includes salaries and wages, benefits and social security contribution for workers directly
involved in the production process. For this study, 8 production laborers are taken as direct
labor. From Table 4.25 yearly salary and other payments are estimated as follows
Yearly gross salary of direct labor = Birr 45,312
Yearly payment for benefits and social security is assumed to be 10% of the yearly
gross salary = 45,312 X 0.10 = Birr 4,531
Therefore direct labor expense = 45,312 + 4,531 = Birr 49,843
The plant is going to be engaged in producing three different products, namely pineapple jam,
mango jam and dried pineapple. Hence, the above expenses are apportioned to the products
based on the ratio of raw material consumptions. The annual consumption of raw materials for
pineapple jam, mango jam and dried pineapple is 14,955 kg, 12,114 kg and 76,300 kg
respectively. Therefore the following ratio was assumed
98

Pineapple jam = 0.145
Mango jam = 0.117
Dried pineapple =0.738
Thus, the annual direct labor expense for the production of pineapple jam, mango jam and
dried pineapple would be Birr 7,227, Birr 5,832 and Birr 36,784 respectively.
4.4.5 Administrative and Selling Expense
Administrative and selling expense includes salary and benefits related to management,
functional staff and indirect labor. The expenses are determined from Table 4.25 excluding
direct labors.
Yearly overhead labor expense = Birr 65,592
Yearly payment for benefits and social security is assumed to be 10% of the yearly
gross salary = 65,592X 0.10 = Birr 3,280
Therefore, total indirect labor expense = 65,592 + 3,280 = Birr 68,872. Including the
selling expense which is assumed to be 5% of the total overhead labor, the total annual
administrative and selling expense would be Birr 69,036. Using the same cost distribution
ratio as in the preceding section, the share of pineapple jam, mango jam and dried
pineapple to these costs is Birr 10,010, Birr 8,077 and Birr 50,949 respectively.
4.5 Product quality safety and legal requirements 4.5.1 Quality Assurance System The quality assurance system has been developed for the processing plant which incorporates
all processes from purchase of raw materials and ingredients to the consumption of final
product. All aspects that could influence product quality have been identified and procedures
were developed to control these factors hence improve the product quality. The analysis
methods for quality control of raw materials and processed products are selected to be
relatively simple which have sufficient accuracy for routine use. Cost of equipments and level
of skill required is also considered as criteria for selection. The time and effort required for
99

this task are equivalent to the type of problems expected. A detail of the quality assurance
procedures for each stage of processing is presented below.
Raw Material Inspection
The inspection of raw materials should take place as they arrives the processing unit. A fruit
should be inspected for maturity, required variety, visible molds or rots, serious bruising,
presence of soil, leaves, or other foreign matter. Fruit weight, total soluble solids and fruit pH
should also be measured. Fruit inspection staff should be trained to monitor quality standards
and correct sorting procedures. This step is critical because most of fruit quality assessments
are carried to subjective assessment of the operators. Ingredients should also be checked to
make sure that they are the correct type and they are not contaminated or adultered. For pectin
and citric acid laboratory experiments need high skill and specialized equipments which are
expensive for small scale processors. Therefore, during procurement of these materials, the
processors should ask certificate of conformance from the suppliers.
Processing
The initial stage in processing of fruits into dried products and fruit jams involves preparing
fruits by washing, peeling, coring or destoning, slicing and/or pulping. Quality inspections at
this stage are to ensure that the water is potable, all peels are removed, fruits are uniformly
sliced, and the pulp yield is within expected range. The next stages are formulation of batch
ingredients, boiling, filling and sealing, jam cooling, labeling and packaging. The drying
process involves drying of sliced pineapple, filling and sealing dried slices into polypropylene
plastic bags and packaging in cardboard boxes.
The correct formulation of a batch of ingredients is critical for both keeping product quality
and financial viability of the operation. The staff responsible for batch formulation should be
given through training in accurate weighing and keeping records of amount of ingredients
used and batch codes. Another important quality control parameter is measurement of the total
soluble solids (TSS) content of the jam. This is very essential for correct preservation and
anticipated shelf life of the product in addition to ensuring uniform products. A hand held
refractometer which can measure 0-90˚Brix could be sufficient for measuring the TSS value
100
of jam. To obtain optimum firmness of the jam , the pH value of the fruit pulp should be
adjusted to the recommend value of 3.1 + 0.1 .This can be done by dropping acid buffers into
the fruit pulp and continually measuring the pH value using pH paper until the required value
is achieved.
The moisture content of dried fruits is determined using a laboratory drying oven. Finely
sliced samples are carefully dried in a laboratory oven at 100°C for 4 hours and reweighed.
They are put back into the oven and checked again at hourly intervals until they do not loose
any more weight. The moisture content is then determined by dividing the weight loss to
initial sample weight.
Strict hygiene in the processing and by operators is needed to reduce the risk of food spoilage
and food poisoning. This must include proper cleaning of equipments and processing rooms,
establishing standards for food handlers’ hygiene and immediate removal of waste.
Packaging
The quality assurance procedures were developed for packaging and storage because long
term preservation of the products depends on quality of the package. For glass containers the
critical faults are broken, cracked, strands of glass inside the pack or bubbles in the glass.
Major faults are variation in the size and shape of containers. Minor faults include uneven
surface, off colors and rough mold lines. All glass jars used in jam packages should be
checked for critical faults. As glass splinters in a food are very serious for consumer health,
every effort should be made to prevent them. One staff member should have responsibility for
checking the packages. The member should be fully trained to recognize faults in glass
containers.
Another key quality control measure is to check variation in the weight of jars as this
variations affect the fill weight. Random samples should be taken from delivery of containers
and weighed. The heaviest pack should then be used to calculate the final filled weight
required. A simple gauge can be made to check that the product has been filled to the correct
level. Moreover, random samples of jars should be checked to ensure the correct net weight
101

using a check weighing scale. Other quality control checks include: inspection for
contamination in re-used jars, proper sealing of jar. The label should be checked whether the
labels match the actual product in the pack, sell by date on the pack is correct and the batch
code numbers are correct.
The polypropylene film packages used for package of dried fruits should be inspected for
incorrect printing, smell of solvents, poor seal and incorrect thickness. The thickness can be
measured by cutting 10 squares of film, each 10 cm x 10 cm and carefully weighing them. The
result (gram/ inch2) is then checked against suppliers’ specification.
Storage and Distribution
Dehydrated products should be kept in a cool, clean and dry place. Exposure to sunlight
should be avoided as this result in sweating and oxidation. The product is very attractive to
insect and rodent infestation and therefore, should be kept away form them.
Jam should be stored in clean, dry, dark areas. Exposure to light can affect their color, making
them look less appetizing. The temperature of the storage area should be between 10 and
21°C. If canned and stored properly, the shelf life of these products is usually 12 to 18 months
(Angela & Heather, 2001). Foods that are older than this are safe to eat if the jar and its seal
are still intact. The quality of such products, however, may be diminished. Generally, the
higher the storage temperature, the shorter the shelf life of a product (Angela & Heather,
2001).
Products should be stored off the floor in a cool dark store room that has good ventilation and
protection against insects and rodents. Records should show the amount of products,
ingredients and packaging materials that are in the sore room, when they are transferred into
and out of the store room. When they are used or sold First in first out (FIFO) system of stock
control should be used.
The control of product quality does not finish when the product leaves the processing unit and
processors should monitor and control the distribution methods to retailers and discuss with
them the best way of storing and displaying the products.
102

4.5.2 Food Safety Requirements The safety of fruit and vegetable products can be assured by implementation of a management
method known as the hazard analysis critical control point (HACCP) system. The HACCP
system requires the food processing companies to identify each aspect of their activities which
have a bearing on the safety of food product and ensures that suitable safety procedures are
established, applied, maintained and revised on the basis of the HACCP system. Effective
hygienic control is vital to avoid the adverse human health and economic consequences of
food borne illness, food borne hazard and food spoilage. As part of EU food law, the HAACP
regulation has been extended to cover not only food companies in the EU, but other producers
that supply to the EU market as well. This means that as of January 2006, food processors in
developing countries that plan to export to the EU market need to have an approved HACCP
system, and the ability to trace their products origin.
Implementation of HACCP system involves the following stages
♦ Identify potential hazard
♦ Assess the level of risk and determine the critical control points.
♦ Determine maximum allowable deviations to the standard of each CCP.
♦ Design and implement a control system of tests or observations for each CCP.
♦ Design and implement corrective action plan for each CCP.
♦ Introduce a vilification procedure including additional tests and procedures to check
the efficiency and effectiveness of HACCP system.
♦ Document all the procedures and test results.
Ethiopian standard ES 577: 2001 (Recommended code of practice-general principles of food
hygiene) gives the code of practice recommended on the general principles of food hygiene.
The standard describes the necessary hygienic conditions for producing food which is safe and
wholesome for consumption through the food chain from primary production to the final
consumer. QSAE provide technical support on implementation of HACCP and training.
However there is no local accredited body for certification of the HACCP system. Recently
the certification is being carried out by foreign companies which make the cost beyond the
financial capacity of small scale processors.
103
4.5.3 Legislative Requirements The legislative requirements differ as per the product and where the product is being
marketed. Mango and pineapple jams are intended to be sold at domestic market. Therefore,
national legislations are applicable to these products currently there is no national standard for
jam and jelly products. The Quality and Standard Authority of Ethiopia, QSAE, is the national
standard body (NSB) of Ethiopia.
It is engaged in development of standards and enforcement of regulations for selected locally
manufactured, imported and export products. It enacted regulations for mandatory
certification of products that have a bearing on public health, safety and consumer protection.
However there are general legislative requirements for prepackage foods regarding the
labeling, weight and measure, hygiene and sanitation standard. Mandatory information that
should appear on labels for prepackaged products is specified in ‘General standard labeling of
prepackaged foods’ (ES 359:2001). Additional requirements for labeling product
identification, declaration of net quantity, name and place of manufacturer, packager and
distributor are covered in ‘labeling requirements for prepackaged products’ (ES OIML
R79:2001) which has been adapted form international organization of legal metrology (OIML)
Detail analysis of these requirements is presented under each title.
The dried pineapple is intended to be sold in the EU market. The codex alimentarious food
standards are the minimum standards to comply with. In addition to this the following
legislative requirements should be fulfilled. These are maximum residue levels, tracking and
tracing systems, and packaging and labeling legislations.
1. Labeling
The international organization of legal metrology (OIML) define label as any written, printed,
or graphic matter affixed to, applied to, attached to, blow into, formed into, embossed on, or
appearing up on a package containing any product for the purpose of branding, identifying, or
giving any information with respect to the product or to the content of the package .The label
is the primary point of contact between a processor and a customer; therefore it is a main
method of persuading a purchaser to buy a product without having sampled it. Labeling
104

legislations are being laid to protect the customer from false, misleading or deceptive labeling
of prepackaged foods.
In design of model label for pineapple jam (Figure 4.12) detail specifications that were
specified in codex international standard for jams and jellies (Codex Alimentarius, 1981) were
included. The following information is specified in ES-359:2001 to be mandatory and should
appear on label of pineapple and mango jams.
Name of the Product
It is stated in ES 359:2001 the label shall indicate the true nature of the food and the name
should be specific. A common or usual name existing by common usage as an appropriate
descriptive term shall be indicated on the label. A more detail specification for naming of jam
and jelly on the label is given by (Codex Alimentarius, 1981). It is specified that the name of
the food shall de declared ‘Extra Jam, High Fruit Jam, or Jam’ if it has been manufactured
from not less than 45 parts by weight of original fruit ingredient for each 100 parts by weight
of final product.
List of Ingredients
A complete list of ingredients shall be declared in descending order ingoing weight (m/m) at
the time of manufacture of the food. The list of ingredients shall be headed or preceded by an
appropriate title which consists of or include the term ‘ingredients’ (ES 359:2001). As to
quantitative labeling of characterizing ingredient codex standard declares the name of the food
shall be accompanied by a statement showing the part of the fruit ingredient used in the
preparation of 100 parts of finished product.
Declaration of Net Quantity
Detail specification for declaration of net quantity for prepackaged foods has been covered in
ES OIML R79:2001.A pre packed product shall bear a declaration of the net quantity of the
product on the principal display area.
105

Statement of the net quantity shall appear in easily legible boldface type or print that contrasts
conspicuously with the background and with other information on the package. The
declaration shall be either by mass or volume for semi solid foods. Each pack of jam have net
content of 450 g , hence the minimum height of numbers and letters should be 4 mm.
Appropriate phrases such as ‘net quantity’, ‘net content’ or ‘net’ may be used in connection
with net quantity declaration.
Expiration date: - Expiration date on prepackaged foods shall be declared on the label. After
this date, the food shall not be marketable. Any special condition for the ‘storage of the food
shall be declared on the label if the validity of the date depends there on.
Instruction for Use: - Instruction for storage condition shall be declared on the label if the
validity of the date depends there on.
Lot Identification: - Lot identification of each container shall be embossed or otherwise
permanently marked in code or in clear to identity the producing factory and the lot.
Name and business of the manufacturer, packager, distributor or importer: - The label of
prepackaged product shall specify conspicuously the name and place of the business of the
person responsible for any of the following: manufacturing, packing, distributing, importing,
or retailing the product. The statement of the place of business with complete mailing address
shall be in accordance with the national law and postal usage or may be represented by an
indicator if permitted by national standards (ES OIML R79:2001).
106

Figure 4.12 Model label for pineapple jam
2. Weight and Measure Legislation
Ethiopian standard (ES 682:2001) specifies for net content in pre-packaged products. Specific
requirements for net content verification of pre-packaged products declared in unit mass,
volume, length, width, thickness, area or number. In ES 682:2001, prepackaged product is
defined as any commodity that is enclosed in a container or wrapped in any manner, and for
which its quantity has been determined and indicated on its labor prior to being offered for
sale. The following mandatory requirements have been specified regarding the net content of
pre-packaged products.
a) Specifications
The checking of prepackaged products covers check on the net content of each package in the
sample and on the average of the actual contents of the prepackages in the sample. The
prepackaged product is said to be comply with the regulation if the following requirements
have been satisfied.
Hasset Fruit Processing plc Hasset Fruit Processing plc
PINEAPPLE JAM
Produced with 45 g fruit per 100 g Total sugar content: 66 g per 100 Ingred
Nutritional Fact
After Opening Store in Cool Place
g
ients:
Manufacturing date
Expiry date
apple, pectin, citric
ontent: 450 g
Sugar, pineacid
Net C Product code
Contact Address Tel 011-1-200000 P.o.Box 1000 Addis Ababa, Ethiopia
107

a) The actual content of the prepackages shall be not less than, on average, the nominal
net quantity
b) the proportion of the prepackages that has a negative error, the quantity by which the
actual quantity is less than the nominal quantity, greater than the tolerable negative
error laid down shall be not greater than 2.5% of the batch size.
c) No prepackage product that has a negative error greater than twice the tolerable
negative error.
The standard specifies the tolerable negative error for ranges of nominal net quantities (Q).
if the nominal net quantity of the product fall into 300<Q<500, the tolerable negative error
is 3 percent of the nominal net quantity. This implies if the nominal weight of the product
is 450 g, for example, the tolerable negative error is 13.5 g. Therefore the standard
specifies the producer to sell a single product with the actual content which is 27 g below
the nominal weight. However, the producer should not utilize the weight deliberately.
b) Measuring instruments
The measurement or check on a prepackage shall be carried out by means of a suitable
measuring, instrument which have been calibrated by QSAE with in the previously twenty-
four months. For analogue measuring instruments should have a division size equal to at least
one fifth of the tolerable negative error. The accuracy of the measuring instruments should be
verified and recorded every day using masterpiece that has been certified by QSAE.
Responsibility: - the standard specifies the pre-packer responsibility for
measuring and checking the actual quantity contained in a prepackaged product and
ensuring that the product comply to the requirement specified in the standard;
Carrying out production checks and retains the results of the check with details of the
corrective actions and verifications. The records for verification and calibration of
equipment, production and process control records, corrective action records and
disposal of non-conforming products should be retained at least for 3 years.
108
3. Tracking and Tracing System
Development of tracking and tracing systems are of critical importance for doing business
with international market. It has been enforced by law in most developed countries that
exporters shall demonstrate the tracking and tracing management system is in place. Product
traceability is also an important requirement in quality management and food safety
management systems. Traceability systems are joined up record keeping systems which bring
together information collected at each step of production, processing and distribution. This
requires specific chain management and food labeling procedures and a tracking and tracing
administration.
Traceability systems are important to support effective withdrawal or recall of products on
detection of problems. They are helpful also to assist in process control and management and
to enable to meet regulatory demands and customer requirements for information. Dried
pineapple is intended to be sold at international market especially EU in which tracking and
tracing system is mandatory. A model tracking and tracing system (Table 4.26 to 4.28) has
been developed for the processing plant in order to enable the product traceable back to the
origin of raw materials in the supply chain. The system incorporates unique identification of
ingredients, intermediates and products. This identification creates a batch that gives a link to
the product history.
1. Raw material Reception Records
Records at this stage form a critical traceability link in the food chain and the recording
system of the supplier. Raw materials receiving recording format (Table 4.26) has been
developed for fruit reception. Similar layout with little modification could be used for
recording incoming batch of ingredients and packing materials. The records include
identification for received goods (batch/lot identification, composition and quality
specifications), supplier, date received and quality inspection results at reception.
109

Table 4.26 Raw materials receiving record format
Quality inspection results Date Received quantity
Supplier Batch/lot #
Percent Reject Color maturity TSS pH variety
2. Production Records
The production records make the link between received raw materials, ingredients and product
delivered. The record contains temporary identification of work in process added ingredients,
date and time of processing and product identification code. A sample production record
format for fruit drying is shown below (Table 4.26). One week productions of dried fruit are
coded in similar code. Similar pattern could be developed for jam processing.
Table 4.27 Production record format for drying
Product code -------
Date Batch #
Weight of sliced fruit (kg)
Initial moisture content
(%)
Final moisture content (%)
Drying temperature°
C
Drying time(hr)
Package
size
3. Sales Records
Sales records form critical traceability link in the food trade chain by providing a link with
that of a customer. Without having sales records, traceability in food market chain would
break down completely. A sample of sales record formats (Table 4.27) have been developed.
The records include product code, sells date and volume and customer information.
110

Table 4.28 Sample sales record format
Date Product code Sells volume customer Remark (Kg)
4. Stock Control Records
Stock control records for product and raw material with their corresponding batch codes
should be recorded. This helps to control the amount and type of material and products present
in the storage.
5. Maximum residue levels
The EU has regulation in place to control the amount of contaminant, maximum residue levels
of pesticides and exporters of dried fruit to the EU have to comply with these regulations.
6. Packaging, Marking and Labeling
There are no important statutory obligations specifically for the packaging of dried fruits and
vegetables. The EU, however, has issued a directive for packaging and packaging materials
(Directive 94/62/ EC) in which minimum standards are regulated. This directive lays down the
maximum level of concentration of heavy metals in packaging. The maximum permissible
concentration of lead, cadmium, mercury and chromium in packaging are 100 ppm as of June
2006. The directive also descries requirements specify to manufacturing of packaging
material, in order to facilitate re-use or recycling to minimize negative environmental impact.
The use of PVC, chlorine, Cadmium and Chloro Fluro Carbons (CFC) should be minimized.
In addition to this directive, 89/109/EC and 90/128/EC laid regulation having a bearing on
product safety (use of approved material) and on the communication aspects to the consumer.
111

Other market requirements
- Environmental, social, health and safety issues are becoming increasing important on
the EU market. These issues are also important for the product group of dried fruit,
especially regarding the environmental circumstances in which the dried fruit is grown
and processed and the labor conditions of the workers on the farm yard and the plant.
112

4.6 Financial and Economic Feasibility The financial and economic analysis is based on the data provided in the preceding sections
and the following assumptions.
1. Project life: the pre-operating period of the project is estimated as 12 months. With
regard to the operational life of the project standard assumption of 10 years is
considered.
2. Depreciation : the asset of the project is assumed to be depreciated in the following
manner
i. Buildings 5%
ii. Machinery and equipment 20%
iii. pre-operating expenses 20%
3. Working capital: the working capital requirement of the project is computed based on the
minimum days of coverage required for the various components that constitute the working
capital. Accordingly, the following minimum days of coverage are assumed.
Working capital Minimum days of coverage
Cash in hand 30 days
Work in progress 1 day
Finished product 15 days
Raw materials
Foreign purchase 120 days
Local purchase 30 days
4. Source of finance: 30% of the finance for the project is expected form the investor
while the rest 70% is obtained from long term bank loan.
5. Pre-operating expenses: these costs are expenses which are incurred before the
business starts operating. These include business registration fees, licenses, training
cost, and cost of preparing business plan and travel expense to raw material and
equipment suppliers.
6. Other income: - it was assumed that the peel from pineapple and mango are changed to
compost or animal fed and sold to the farmers generating additional income.
113

4.6.1 Total Investment Cost The total investment cost of the processing plant including working capital is estimated as Birr
379,750.00. Owners are assumed to contribute 30 % (Birr 113,925.00) of the finance while the
remaining 70 % (Birr 265,825.00) is expected to be financed by long term bank loan.
Table 4.29 Total investment cost (Birr)
No. Items L.C F.C Total Share (%)1 Land 1,875.00 0 1,875.00 0.49 2 Building and civil works 142,000.00 0 142,000.00 37.39 3 Office equipments 5,000.00 0 5,000.00 1.32 4 Plant machinery and equipments 49,975.00 77,610.00 127,585.00 33.60
Total fixed capital 198,850.00 77,610.00 276,460.00 72.80 5 Pre-operating expenses 10,000.00 0 10,000.00 2.63 6 Working capital 78,390.00 14,900.00 93,290.00 24.57
Total initial investment capital 7 287,240.00 92,510.00 379,750.00 100.00
L.C= Local currency F.C = Foreign currency
The major component of the investment are building and civil works, machineries and
equipments and working capital expenses accounting 37.39 % , 33.60 % and 24.57 %
respectively. The foreign component of the project accounts for Birr 92,510.00 or 24.36 % of
the total initial investment cost (Table 4.29).
4.6.2 Production Cost The components of the production cost are shown on Table 4.30
Raw materials and auxiliary inputs include the cost of fruit crops, sugar, pectin, citric acid
packaging materials
Factory overhead expense: includes maintenance and repair cost and cost of utilities
(electricity, water and fuel).
Administrative and selling expense: include cost of indirect labor, office supplies and
communication.
Direct labor cost: includes is the cost of wage and benefits of the production staff.
114

Table 4.30 Total production cost (Birr) and unit production cost (Birr/ kg) for year 2008
The total production cost at first production year is estimated as Birr 521,013.00. Raw
materials and auxiliary inputs account for 61.1% while administrative and selling expense take
13.3 % of the production cost. The unit production cost of pineapple jam, mango jam and
dried pineapple is estimated as Birr 13.53, Birr 11.19, and Birr 46.33 per kg respectively.
4.6.3 Economic Evaluations The economic evaluation of the project is made under three scenario based on profit margin of
5%, 10% and 15%.
Scenario 1: The products are sold at product cost plus 5% profit margin and 15% value added
tax (VAT) at factory gate. Therefore, the selling price of pineapple jam, mango jam and dried
pineapple would be Birr 16.24, Birr 13.43 and Birr 55.60 per kg of the products respectively.
Products
Total Share Pineapple
jam
Mango
jam
Dried
pineapple No Items %
Raw materials and auxiliary inputs
1 141,620.00 74,863.00 101,640.00 318,123.0 61.1 2 Direct labor 7,227.00 5832.00 36,784.00 49,843.00 9.6 3 Factory overhead 3,409.00 2560.00 47,706.00 53,675.00 10.3
4 Depreciation 4,399.00 3549.00 22,388.00 30,336.00 5.8
5 production cost 156,655.00 86,804.00 208,518.00 451,977.00 86.8 6 Administrative &
selling expenses
10,010.00 8077.00 50,949.00 69,036.00 13.3 7 Total production
cost
166,665.00 94,881.00 259,467.00 521,013.00 100.08 Annual production
volume (Kg)
12,320.00 8480.00 5,600.00 26,400.00 9 Unit production
cost (Birr/Kg)
13.53 11.19 46.33 19.74
115

Scenario 2: : The products are sold at product cost plus 10% profit margin and 15% value
added tax (VAT) at factory gate. Therefore, the selling price of pineapple jam, mango jam and
dried pineapple would be Birr 16.90, 14.00, and Birr 57.90 per kg of the products respectively
Scenario 3: : The products are sold at product cost plus 15% profit margin and 15% value
added tax (VAT) at factory gate. Therefore, the selling price of pineapple jam, mango jam and
dried pineapple would be Birr 17.60, 14.55, and Birr 60.23 per kg of the products respectively. 1. Profitability
According to the projected income statement (Annex A.1 –A.3) the project will generate
profit beginning from first year of operation. The expected cumulative profit under the three
scenarios is shown in Table 4.31.
Table 4.31 Expected cumulative profit of the envisaged project under the three scenarios
Cumulative profit, thousands
Scenario 2008 2009 2010 2011 2012 2013 2014 2015 2016 2017
1 12.26 85.48 191.94 299.11 406.40 423.09 436.26 445.19 449.07 446.99
2 37.71 141.01 282.55 426.57 572.54 613.12 651.38 686.65 718.18 745.13
3 63.17 196.54 373.17 554.02 738.67 803.15 866.49 928.10 987.29 1,043.28
2. Break Even Point Analysis (BEA)
In addition to projected profits the break even production capacity should be determined to
avoid losses. For this purpose, the break even point sales, production and percentage are used
to indicate the level at which the project neither makes profit nor incurs loss. As a first step in
computing the break even point, the cost are divided into two broad categories, fixed cost and
variable cost, which may be defined as follows
Fixed cost: - refers to the cost that remains constant irrespective of changes in the volume of
output. A cost grouped under this category in the study includes direct labor expense,
administrative and selling expense, and financial costs.
Variable cost: - these costs vary directly with output. Costs that are group under this category
include raw materials and auxiliary inputs and factory overhead.
116

The BEA for scenario 1 is shown below. The results related to BEP for the three scenarios are
summarized in Table 4.32.
Scenario 1. The products are sold at product cost plus 5% profit margin and 15% value added
tax (VAT) at factory gate. Therefore, the selling price of pineapple jam, mango jam and dried
pineapple would be Birr 16.24, Birr 13.43 and Birr 55.60 per Kg of the products respectively.
From projected income statement (Annex A) assumptions made for fixed and variable costs,
the following data was obtained.
Annual sales = Birr 628,966.80
Annual fixed cost = Birr 149,215.00
Annual variable cost = Birr 371,798.00
Unit selling price = Birr 22.08 / Kg
A) Break Even Point (BEP) Sales: - this refers to the amount of sales value at which no
profit or loss is incurred by the business. It can be calculated as
BEP (sales) = Annual sales X Annual fixed cost
Annual sales – Annual variable cost
BEP (sales) = Birr 364,940
B) BEP (Production):- this is the quantity at which no profit or no loss is incurred by the
business. The BEP production can be computed using the following equation.
BEP (Production) =. BEP (Sales) .
Unit selling price
BEP (Production) = 15.32 tons
C) BEP (percentage):_ is the percentage of sales or production at which the business makes
neither profit nor loss. This can be computed as
BEP (percentage) = Annual fixed cost X 100%
Annual sales – Annual variable cost
BEP (percentage) = 58.02%
117
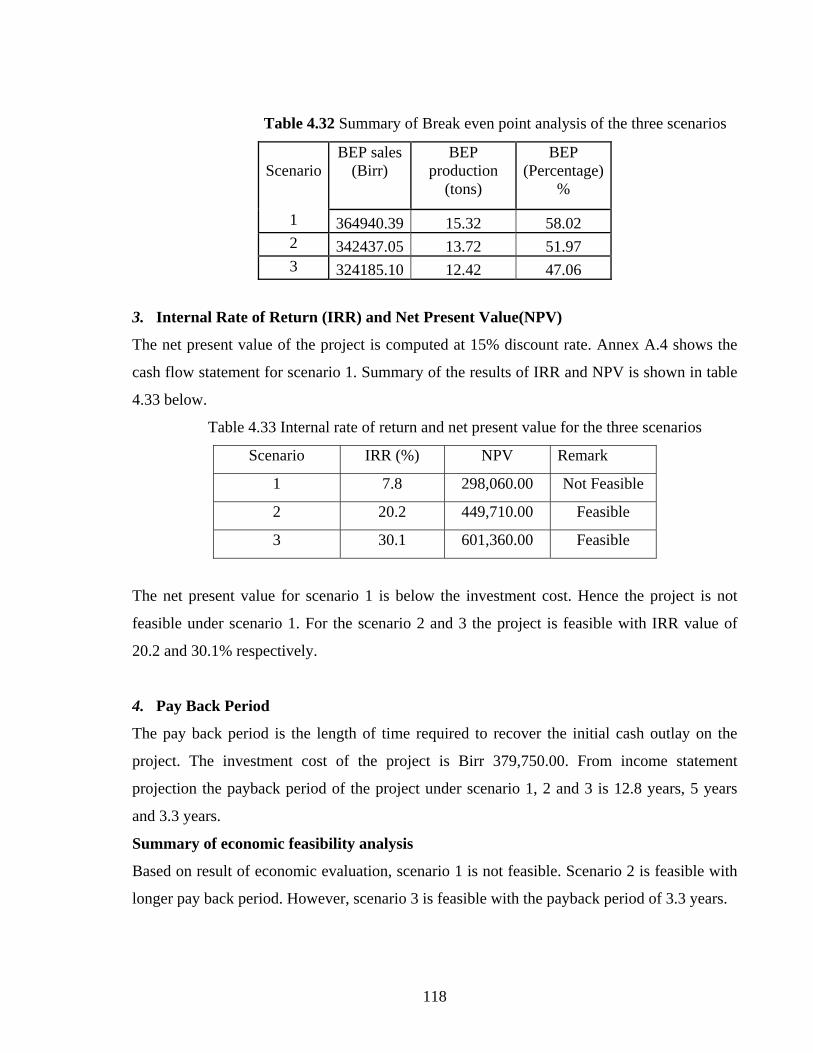
Table 4.32 Summary of Break even point analysis of the three scenarios
BEP sales (Birr)
BEP production
(tons)
BEP (Percentage) Scenario
%
1 364940.39 15.32 58.02 2 342437.05 13.72 51.97 3 324185.10 12.42 47.06
3. Internal Rate of Return (IRR) and Net Present Value(NPV)
The net present value of the project is computed at 15% discount rate. Annex A.4 shows the
cash flow statement for scenario 1. Summary of the results of IRR and NPV is shown in table
4.33 below.
Table 4.33 Internal rate of return and net present value for the three scenarios
Scenario IRR (%) NPV Remark
1 7.8 298,060.00 Not Feasible
2 20.2 449,710.00 Feasible
3 30.1 601,360.00 Feasible
The net present value for scenario 1 is below the investment cost. Hence the project is not
feasible under scenario 1. For the scenario 2 and 3 the project is feasible with IRR value of
20.2 and 30.1% respectively.
4. Pay Back Period
The pay back period is the length of time required to recover the initial cash outlay on the
project. The investment cost of the project is Birr 379,750.00. From income statement
projection the payback period of the project under scenario 1, 2 and 3 is 12.8 years, 5 years
and 3.3 years.
Summary of economic feasibility analysis
Based on result of economic evaluation, scenario 1 is not feasible. Scenario 2 is feasible with
longer pay back period. However, scenario 3 is feasible with the payback period of 3.3 years.
118
5. CONCLUSIONS AND RECOMMENDATIONS
5.1 Conclusions Based on the framework setout in this feasibility study the following conclusions were made
regarding the feasibility of proposed small scale pineapple jam, mango jam and dried
pineapple processing enterprise.
5.1.1 Market Feasibility A market opportunity was identified for the domestic production of pineapple and mango jams
for domestic market dried pineapple for export to EU countries. However the positive results
of the market feasibility are dependent on continuous and reliable production of high quality
products and the effectiveness of the firm marketing strategy. Stringent legal and market
requirements are categories that should be considered in the international market.
5.2.2. Technical Feasibility The analysis of technical feasibility of the proposed processing enterprise revealed that the
processing equipments, production facilities and services and the human resource could be
integrated for processing of jam and dried products at small scale. It was possible to show the
plant operate all year round by alternatively processing product from pineapple and mango
fruits. Both Smooth Cayenne and Red Spanish pineapple cultivars and local mango could
potentially be used for jam production. From process recovery point of view, Smooth Cayenne
cultivar with pulp yield (60%) and jam yield (95.5%) is preferable for jam production as
compared to the Red Spanish. However, the following constraints were identified
The supply of pineapple and mango is dependent on climatic factors because most of
the cultivation is rain fed agriculture. Drought and poor management could risk the
supply of raw materials. Irrigation using three perennial rivers, Gidabo, Burrier and
Melewo, crossing the areas should be promoted.
As pectin and citric acid are not locally produced or available at local market they
should be imported. The annual consumption for these chemicals is below the
minimum ordering lot for most traders. This may cause difficulties in the supply of
these chemicals.
119
Most of the equipments required for the processing plant are available in the local
market. Special equipments like pulper, peeler/corer, slicer and dryer could be
manufactured in the local workshop. However research centers and universities
working on food technology should give support to develop the manufacturing of
agro-processing machineries and equipments and prototypes that meet the needs of
both workshop and food processors.
5.2.3 Financial Feasibility The analysis on financial feasibility of the proposed enterprise revealed that based on the
assumptions made, the enterprise is profitable. The enterprise is projected to have a healthy
cash flow and is viable over long term. The positive financial feasibility is, however,
dependent on stable inflation and macro economic conditions. The profitability of the plant
can be further increased by using alternative energy costs.
5.2.4 Overall Feasibility Based on the framework set out in this feasibility study where feasibility is assessed in three
core areas, it can be concluded that the proposed processing enterprise is feasible. The results
of the feasibility study, however, are heavily dependent upon the assumptions made during the
study and other operating environments (political, environmental and economic conditions)
remain relatively stable.
5.2 Recommendations for Further Study I believe it is worthwhile if further investigation is made on the following points
Development of prototype small scale biogas fired tray dryer.
Studies on extraction of pectin from pineapple and mango peel or other
sources.
120
6. REFERENCE
ADC. (2002) Commercialisation Bulletin #11, Dried fruits, Uganda Addis Ababa Investment Authority. (2006). Business plan for the investing in jam industry,
Addis Ababa
Andrade, N. J, Macedo, J. A. B. (1996). Higienização na Indústria de Alimentos .
Departamento de Tecnologia de Alimentos. Universidade Federal de Viçosa . Viçosa ,
Angela M. F., Heather J. H., (2001) Making Jams and Jellies, North Carolina State
University, unpublished
Anon (1992), Do your own business plan- A manual for the Entrepreneur, CEFE international
AOAC (1984). Official methods of analysis. Association of official Analytical chemists, 14th
edn. Washington DC.
Axtell, B. and Russell, A. (2000). Small scale drying. London, Intermediate Technology
Publications
Baliga, B.P., Shitole, A.D. (1981). Cocoa butter substitute from mango fat. Journal of the
American Oil Chemists Letters, 58,110-114.
Bartholomew, A. P., Pilal, R. & Carmen, F. (1994). Pineapple fruit: Morphological
Characteristics, chemical composition of Red Spanish and smooth cayenne cultivars,
Journal of Food Chemistry, 53, 75-79.
Beerh, O.P., Raghuramaiah, B. & Muthy, G.V.K. (1976). Utilization of mango waste: peels as
a source of pectin. Journal of food science and Technology, 13, 96-97
121

Bhatnagar, H.C. and Subramanyam, H. (1973). Some aspects of preservation, processing and
export of mango and its products, Indian Food Packer, 27, 33-52
Bickerdyke, I., Lattimore, R. and Madge, A. (2000). Business failure and change: An
Australian Perspective. Canberra, Productivity commission research paper.
Brenndorfer, B., Kennedy, L., Oswin, B., C.O. & Trim, D.S. (1985). Solar dryers. Common
wealth science council, Pallmall, London
Candelaria, N. M., & Raymundo, L. C. (1994). Comparative drying and reconstitution
characteristics of some fruits and vegetables. Philippine Agriculturist, 77, 321– 326.
Carlos A. B., Ronaldo P., João F.A. José C.P., Marcello A.A., Fábia Á., Simone M. S. (2005).
Technical coefficients for utilization in the preparation of investment projects in the
fields of agro-industries and post-harvest, FAO, Rome, Italy
CBI, (2005). Dried fruit, EU market brief
Central Statistical Agency (CSA) (2006). Report on small scale manufacturing industries
survey, Statistical bulletin 381, Addis Ababa.
Chou, S. K., Hawlader, M. N. A., Chua, K. J. and Teo, C. C. (1997). A methodology for
tunnel dryer chamber design, International Journal of Energy Resources. 21: 395-410.
Chua, K. J. & Chou, S.K. (2003). Low-cost drying methods for developing countries. Journal
of Trends in Food Science & Technology, 14, 519-528.
Codex Alimentarius (1981). Standard for jams and jellies, FAO/WHO codex Alimentarius
commission.
Codex Alimentarius (1969). Recommended code of hygienic practices for dried fruits,
FAO/WHO codex alimentarius commission.
122
Collins, J. L. (1960). The pineapple. London, Leonard Hill.
Coveca. (2002). Comision veracruzana de comercializacion agropecuaria. Gobierno del
Estado de Vera Cruz, México.
Dendena, C., Desta H., Dvijrenbodl, A.R. (2005). Export potential of Ethiopian processed
fruits and vegetables, Export promotion department Addis Ababa, Ethiopia.
Doreyappa ING, Ramanjaneya KH (1995). Evaluation of some mango varieties for their
suitability for canned mango juice. Journal of Food Science & Technology. 32: 323 – 325.
Doymaz, I. (2004). Effect of pre-treatment using potassium metabisulphide and alkaline ethyl
oleate on the drying kinetics of apricots. Journal of Biosystems Engineering, 89(3),
281-287.
Drucker, P.F. (1985). Innovation & Entrepreneurship. New York, Harper Trade.
Dull, G. G. (1971). The pineapple: general. In: A. C. Hulme (ed.). The biochemistry of fruits
and their products, vol. 2, pp. 303-324, New York, Academic Press.
Earl, R. L. (1983). Unit Operations in Food Processing. 2nd (eds), Pergamon Press, Oxford
Elizabeth, L.A. and Judy, A.H. (2006). So easy to preserve. cooperative Extension service, the
university of Georgia, Athens.
ES 359 (2001). General standards for prepackaged foods-labeling. Quality and Standard
Authority of Ethiopia.
ES 577 (2001) Recommended code of practice- general principle of food hygiene, Quality and
Standard Authority of Ethiopia.
123

ES 682(2001). Net content in prepackaged products. Quality and Standard Authority of
Ethiopia
ES 343 (2001). Fresh pineapple-methods of storage and transport, Quality and Standard
Authority of Ethiopia
ES OIML R799 (2001). Labeling requirements for prepackaged products, Quality and
Standard Authority of Ethiopia
Ethiopian Agriculture Research Institute (2006). Business plan for tropical and temperate fruit
crops in SNNPR and Oromia region , Addis Ababa.
Ethiopian Investment Authority (2006). Investment opportunity profile for the production of
fruits and vegetables in Ethiopia
Ethiopian Investment Authority (2006). Factor cost , Addis Ababa.
Ethiraj, S. and Suresh, E.R. (1992). Studies on the utilization of mango processing waste for
production of vinegar. Journal of Food –Science and Technology, 29, 48-50
FAO. ( 2002). Statistical database. Tropical foods commodity notes
FAO (2004), processed food for improved livelihood diversification booklet, Rome, Italy.
Fellows, P.J., (1997). Guidelines for Small Scale fruit & Vegetable Processors, FAO
Technical Bulletin #127, FAO Publications, Rome, Italy.
Fellows, P. (2000) Food processing technology principles and practices, wood Head
publishing Ltd, England.
Filho , J. M. (2002). Instalações Elétricas Industriais : Iluminação Industrial , Cálculo de
Iluminação . 6 ed. Rio de Janeiro : LTC,. p 58-63.
124
Gauhar, A. M. (1998). Performance enhancement of the AIT solar tunnel dryer, Thesis, Asian
Institute of Technology, Bangkok, Thailand.
Gofton, L. (1997). Business market research. London, Kogan
Gowramma , R.V., Mahadevaiah,M.,Naresh, R.Dwarakamatja, T.R. & Anandaswamy B.
(1981) .Preliminary studies on suitability of flexible packaging materials for packing
processed food products, Indian Food Packer, 41, 7-13
Infoagro. Com. 2002. http://www.infoagro.com /frutas/frutas_tropicales/pina.htm, 2002
Germain, K, Bargni, K.B. Mbome, L. (2003). Effect of ripening on the composition and the
suitability of Jam processing of different varieties of mango, Journal of Biotechnology, 2
(2003), 301-306.
Hemavathy, J. (1987). Studies on lipids of tree origin-mango kernel and Mahua. Unpublished
PhD thesis, University of Mysore.
Hoagland, H. and Williamson, L. (2000). Feasibility studies. Kentucky, University of
Kwntucky.
Hossain, M.D., Bala, B.K., & Mondol, M.R.A. (2001). Sorption isotherms and heat of
sorption of pineapple. Journal of Food Engineering, 48,103-107
http://www.cbi.nl
Imrie, L. (1997). Solar Dryers, Industrial. Drying of Foods, In: C.G.J. Bake (eds), Blackie
Academic and Professional, London, pp.210-241
125
International Trade Centre. (1993). Exports from Small and Medium-Sized Enterprises in
Developing Countries: Issues and Perspectives. International Trade Centre
UNCTAD/WTO. Geneva, Switzerland.
Jha, S.N, Kingsly, Sangeeta , L. (2004), Physical and mechanical properties of mango during
growth and storage for determination of maturity, Journal Food Engineering, 2, 73-76.
Jobin-Decor, M.P. (1988). Mango ripening guide. Journal of Queensland Agric. 114, 369-371.
Kalra, S.K., Tandon, D.K., & Singh, B.P. (1995). In D.K.Salunthe & S.S Kandam
(eds),
Kameni, A., Mbofung, C. M., Ngnamtam, Z., Doassem, J., & Hamadou, L. (2003). Aptitude
au se´chage des fruits de quelques varie´te´s de manguiers cultive´es au Cameroun.
Fruits, 58, 89–98.
Krishnanand (1994) Biogas from food waste. Indian Food Industry.13, 22-34
Kortbech, R.O. (1997), World trade in processed tropical fruits, United Nations conference on
trade and development.
Lecup, I. & K. Nicholson. (2000). Community-based Tree and Forest Enterprises: Market
Analysis and Development. A Field Manual. FAO, Rome, Italy.
Legesse H., Getahun, D., Shiferaw, B. & Timerga, Y. (2006). Identification of suitable area
for pineapple development in SNNPR State, unpublished
Medina, J.C. (1987) Abacaxi: cultura , matéria-prima , processamento e aspectos econômicos
2. Ed. rev. e ampl. Campinas , Italy
Mujumdar, A.S., and Beke, J., Grain drying: basic principles, In: Handbook of post harvest
Technology: Cereals, Fruits, Vegetables, Tea, and Spices; Chakraverty, A., Mujumdar,
A.S., Raghavan, G.S.V., Ramaswamy, H.S., Eds, Marcel Dekker, Inc., NY (2003).
126
Narasimhachar, B.L., Reddy, B.R. and Thirumala Rao, S.D. (1977). Processing mango stones
for fat. Journal of the American Oil Chemists Society, 54,494-495
Oakenfull, D. and Scott, A. (1984): Hydrophobic Interaction in the Gelation of High Methoxyl
Pectins, Journal of Food Science. 49 (4), 1093-1098.
Pantastico, Er.B. (1975). Post harvest physiology, handling and utilization of tropical and
subtropical fruits and vegetables. AVI Pub., Westport, CT
Paull, R.E. 1993. Pineapple and papaya. In: G. Seymour, J. Taylor and G. Tucker (eds)
Biochemistry of Fruit Ripening, Chapman & Hall, London, pp. 291-323.
Pilnik, W. (1980): Gelling mechanism of High methysl esters, Forster pub., Zurich
Rameshwar, A. (1993). In: Advances in horticulture –fruit crops, K.L.Chadha & O.Pareek
(eds.), Malhotra Publishing House New Delhi ,Vol 4, pp.1661-1702
Roy, N. and Mitra, A.K. (1970). Amylose content of starch from unfamiliar source of food.
Journal of Food science and Technology, 7,164
Simal, S, Femenia, Castell, P.A, Rossello’, C. (2006). Water sorption description
thermodynamic properties of pineapple, Journal of Food Engineering
Singleton, V. L.; Gortner, W. A. (1965) Chemical and physical development of the pineapple.
fruit. 11. Carbohydrate and acid constituents. Journal of Food Science.,30,19-23
Smith, D. (2006). Fruit jellies, Food processing for entrepreneurs series, Nebraska-Lincoln
extension, institute of Agriculture and National Resources
127
128
Swaroopa, D.R., Nand, K. (2004), Ensilage of pineapple processing waste for methane
generation. Journal of Waste Management. 24, 523-528.
Sybille.N, Werner, M., Reinhold, C. (2005). Quality improvement of non- sulphited mango
slices by drying at high temperatures. Journal of innovative Food Science & Emerging
Technologies 6, 412-419
Tompson, A. (2003). Business feasibility study: dimensions of business viability. Perth, Best
entrepreneur
Truitt, W. (2002). Business Planning: A Comprehensive Framework and Process London,
Quorum Books
Youcef-Ali, S.; Messaoudi, H.; desmons, J. Y.; Abene, A. and Le Ray, M. (2001).
Determination of the average coefficient of internal moisture transfer during the drying
of a thin bed of potato slices. Journal of Food Engineering, 48(2): 95-101.

7. ANNEX A Annex A.1. Projected income statement for 5 % profit margin of the project from 2008- 2017
Production year Description 2008 2009 2010 2011 2012 2013 2014 2015 2016 2017
Production (TPA) 26.40 29.70 33.00 33.00 33.00 33.00 33.00 33.00 33.00 33.00 Capacity utilization (%) 80.00 90.00 100.00 100.00 100.00 100.00 100.00 100.00 100.00 100.00
Sales realization 628.97 742.97 866.79 910.13 955.64 1,003.42 1,053.59 1,106.27 1,161.59 1,219.67Cost of production
Raw materials and auxiliaries
318.12 340.85 397.65 417.54 438.41 460.33 483.35 507.52 532.89 559.54
Direct labor 49.84 54.83 60.31 66.34 72.98 80.27 88.30 97.13 106.84 117.53 Factory overhead 53.68 59.04 64.95 71.44 78.59 86.44 95.09 104.60 115.06 126.56
Depreciation 30.34 30.34 30.34 30.34 30.34 30.34 30.34 30.34 30.34 30.34 Administration and selling
expense 69.04 72.49 76.11 79.92 83.91 88.11 92.51 97.14 102.00 107.10
Gross profit before interest 107.95 185.43 237.44 244.56 251.42 257.93 264.00 269.55 274.46 278.61 Financial expenses 3.43 3.36 3.30 3.23 3.17 3.10 3.04 2.98 2.92 2.86
Other income 2.08 2.60 2.34 2.36 2.39 2.41 2.44 2.46 2.48 2.51 Profit/loss before tax 106.60 184.66 236.48 243.70 250.64 257.24 263.40 269.03 274.02 278.25
Provision for tax 94.35 111.45 130.02 136.52 143.35 240.55 250.23 260.10 270.15 280.34 Profit after tax 12.26 73.22 106.46 107.17 107.29 16.69 13.17 8.93 3.88 -2.09
Net profit accumulated 12.26 85.48 191.94 299.11 406.40 423.09 436.26 445.19 449.07 446.99
129
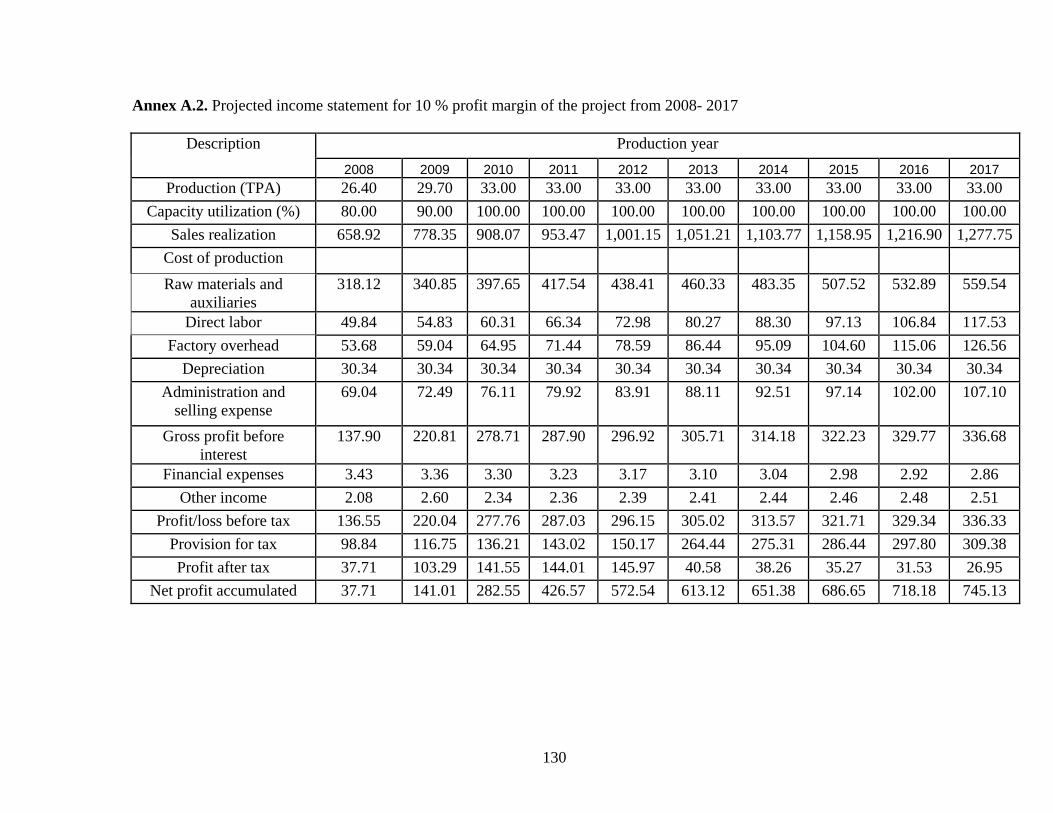
Annex A.2. Projected income statement for 10 % profit margin of the project from 2008- 2017
Production year Description 2008 2009 2010 2011 2012 2013 2014 2015 2016 2017
Production (TPA) 26.40 29.70 33.00 33.00 33.00 33.00 33.00 33.00 33.00 33.00 Capacity utilization (%) 80.00 90.00 100.00 100.00 100.00 100.00 100.00 100.00 100.00 100.00
Sales realization 658.92 778.35 908.07 953.47 1,001.15 1,051.21 1,103.77 1,158.95 1,216.90 1,277.75 Cost of production
Raw materials and auxiliaries
318.12 340.85 397.65 417.54 438.41 460.33 483.35 507.52 532.89 559.54
Direct labor 49.84 54.83 60.31 66.34 72.98 80.27 88.30 97.13 106.84 117.53 Factory overhead 53.68 59.04 64.95 71.44 78.59 86.44 95.09 104.60 115.06 126.56
Depreciation 30.34 30.34 30.34 30.34 30.34 30.34 30.34 30.34 30.34 30.34 Administration and
selling expense 69.04 72.49 76.11 79.92 83.91 88.11 92.51 97.14 102.00 107.10
Gross profit before interest
137.90 220.81 278.71 287.90 296.92 305.71 314.18 322.23 329.77 336.68
Financial expenses 3.43 3.36 3.30 3.23 3.17 3.10 3.04 2.98 2.92 2.86 Other income 2.08 2.60 2.34 2.36 2.39 2.41 2.44 2.46 2.48 2.51
Profit/loss before tax 136.55 220.04 277.76 287.03 296.15 305.02 313.57 321.71 329.34 336.33 Provision for tax 98.84 116.75 136.21 143.02 150.17 264.44 275.31 286.44 297.80 309.38 Profit after tax 37.71 103.29 141.55 144.01 145.97 40.58 38.26 35.27 31.53 26.95
Net profit accumulated 37.71 141.01 282.55 426.57 572.54 613.12 651.38 686.65 718.18 745.13
130

Annex A.3. Projected income statement for 15% profit margin of the project from 2008- 2017
Production year Description 2008 2009 2010 2011 2012 2013 2014 2015 2016 2017
Production (TPA) 26.40 29.70 33.00 33.00 33.00 33.00 33.00 33.00 33.00 33.00 Capacity utilization (%) 80.00 90.00 100.00 100.00 100.00 100.00 100.00 100.00 100.00 100.00
Sales realization 688.87 813.73 949.35 996.81 1,046.65 1,098.99 1,153.94 1,211.63 1,272.22 1,335.83 Cost of production
Raw materials and auxiliaries
318.12 340.85 397.65 417.54 438.41 460.33 483.35 507.52 532.89 559.54
Direct labor 49.84 54.83 60.31 66.34 72.98 80.27 88.30 97.13 106.84 117.53 Factory overhead 53.68 59.04 64.95 71.44 78.59 86.44 95.09 104.60 115.06 126.56
Depreciation 30.34 30.34 30.34 30.34 30.34 30.34 30.34 30.34 30.34 30.34 Administration and
selling expense 69.04 72.49 76.11 79.92 83.91 88.11 92.51 97.14 102.00 107.10
Gross profit before interest
167.86 256.19 319.99 331.24 342.43 353.49 364.35 374.91 385.09 394.76
Financial expenses 3.43 3.36 3.30 3.23 3.17 3.10 3.04 2.98 2.92 2.86 Other income 2.08 2.60 2.34 2.36 2.39 2.41 2.44 2.46 2.48 2.51
Profit/loss before tax 166.50 255.42 319.03 330.37 341.65 352.80 363.74 374.39 384.65 394.41 Provision for tax 103.33 122.06 142.40 149.52 157.00 288.33 300.40 312.78 325.46 338.42 Profit after tax 63.17 133.36 176.63 180.85 184.65 64.47 63.34 61.61 59.19 55.99
Net profit accumulated 63.17 196.54 373.17 554.02 738.67 803.15 866.49 928.10 987.29 1,043.28
131

Annex a.4 Projected cash flow statement for scenario 1
Particulars 2,007 2008 2009 2010 2011 2012 2013 2014 2015 2016 2017 CASH INFLOW Capital expenditure 379.75 0.00 0.00 0.00 0.00 0.00 0.00 0.00 0.00 0.00 0.00 Cash sales 576.55 681.05 794.56 834.29 876.00 919.80 965.80 1,014.08 1,064.79 1,118.03 Accounts receivable 52.41 61.91 72.23 75.84 79.64 83.62 87.80 92.19 96.80 101.64 Other income 2.08 2.60 2.34 2.36 2.39 2.41 2.44 2.46 2.48 2.51 Total cash inflow 379.75 631.05 745.57 869.13 912.50 958.03 1,005.83 1,056.03 1,108.73 1,164.07 1,222.18 CASH OUTFLOW Pre-operating expense 10.00 0.00 0.00 0.00 0.00 0.00 0.00 0.00 0.00 0.00 0.00 Purchase of fixed asset 276.46 0.00 0.00 0.00 0.00 0.00 0.00 0.00 0.00 0.00 0.00 Cost of goods sold 490.68 527.20 599.02 635.24 673.89 715.16 759.25 806.39 856.79 910.73 Finished goods inventory 27.98 0.00 0.00 0.00 0.00 0.00 0.00 0.00 0.00 0.00 0.00 Raw materials Inventory 65.30 0.00 0.00 0.00 0.00 0.00 0.00 0.00 0.00 0.00 0.00 Loan amortization 24.03 24.03 24.03 24.03 24.03 24.03 24.03 24.03 24.03 24.03 Interest expenses 3.19 3.19 3.19 3.19 3.19 3.19 3.19 3.19 3.19 3.19 Tax payable 94.35 111.45 130.02 136.52 143.35 240.55 250.23 260.10 270.15 280.34 Total cash outflow 379.74 612.24 665.87 756.26 798.98 844.46 982.93 1,036.70 1,093.71 1,154.16 1,218.29 Net cash inflow (outflow) -379.74 18.80 79.70 112.87 113.52 113.57 22.91 19.33 15.02 9.91 3.89 PV of cash flow 379.74 16.35 60.26 74.21 64.91 56.466 9.903 7.27 4.91 2.82 0.9615
Cumulative PV 379.74 16.35 76.61 150.83 215.73 272.20 282.10 289.37 294.28 297.10 298.06
132

133