technical article numerical validation of the … · numerical validation of the incremental...
TRANSCRIPT

T E C H N I C A L A R T I C L E
Numerical Validation of the Incremental Launching Methodof a Steel Bridge Through a Small-Scale Experimental StudyR. Chacon1, N. Uribe1, and S. Oller2
1 Construction Engineering Department, Universitat Politecnica de Catalunya. Barcelona Tech, Barcelona, Spain
2 International Centre for Numerical Methods in Engineering (CIMNE), Universitat Politecnica de Catalunya. Barcelona Tech, Barcelona, Spain
KeywordsIncremental Launching Method, Steel
Bridges, Bridge Monitoring
CorrespondenceR. Chacon,
Construction Engineering Department
Universitat Politecnica de Catalunya.
Barcelona Tech
Barcelona, Spain
Email: [email protected]
Received: July 3, 2013;
accepted: November 7, 2013
doi:10.1111/ext.12069
Abstract
This article presents an experimental and a numerical study of an incrementallaunching process of a steel bridge. The former is deployed in a scale-reducedlaboratory, whereas the latter is performed using the finite element method. Thenumerical simulation is based upon realistic transient boundary conditions andaccurately reproduces the elastic response of the steel bridge during launching.This numerical approach is validated experimentally with the scale-reducedtest performed at the laboratory. The properly validated numerical modelis subsequently systematically employed as a simulation tool of the process.The proposed simulation protocol might be useful for design and monitoringpurposes of steel bridges to be launched. Results concerning strains, stresses,and displacements might be inferred from the model and thus compared tofield measurements obtained in situ. The conditions presented at the end ofthe article are potentially useful for researchers and practice engineers alike.
Introduction
The incremental launching method (ILM) hasgained increasing popularity in last decades as aconstruction method of short- to large-multispannedsteel and/or concrete bridges.1 ILM consists ofassembling the superstructure on one side of theobstacle to be crossed and then pushed longitudinally(or ‘‘launched’’) into its final position. Generally,steel bridges are completely assembled prior tolaunching operations. In concrete bridges, however,the launching is typically performed in a seriesof increments so that additional sections can beadded to the rear of the superstructure unit prior tosubsequent launches. The ILM may offer advantagesover conventional construction techniques when theconstruction takes place in environmentally protectedareas, or areas at which minimal disturbances tosurroundings are needed, thus providing a moreconcentrated work area for the superstructureassembly. Safety concerns might also be reduced ifILM is employed.1–3 During the launching operation,the bridge superstructure is supported by a seriesof rollers or sliding bearings. The thrust required
to launch the bridge forward can be provided bya variety of jacking systems, including hydraulicpistons or hollow-core strand jacks.1 Figure 1 shows alateral schematic view of an incrementally launchedsteel girder. It is worth pointing out the continuouschange of the static conditions. In Fig. 1, the varyingbending moment diagrams are qualitatively includedfor illustration.
The ILM has reportedly been used for the firsttime in Venezuela during 1960s for a bridge overthe Caroni River.3 Ever since that hundreds of steeland/or concrete bridges have been built worldwideusing the ILM. A close inspection of the vastdatabase given in Ref. 1 gives a worth mentioningtwofold observation: Europe has a vaster traditionof systematic usage of ILM than the USA and thevast majority of launched bridges are made of post-tensioned concrete.
Admittedly, according to Ref. 1, there has his-torically been a knowledge gap between designers,contractors, and bridge owners when it comes to thesystematic usage of ILM. ILM requires a considerableamount of analysis and design expertise and special-ized construction equipment. A detailed structural
Experimental Techniques (2013) © 2013, Society for Experimental Mechanics 1

Numerical Validation of the Incremental Launching Method R. Chacon, N. Uribe, and S. Oller
Foundation
Falsework
Launching noseSteel girders
Structural model
Launching direction
Bearing
Pier
Foundation
Falsework
Steel girders
Bending moment
Launching direction
Bearing
Pier
Steel Girder
Foundation
Falsework
Launching nose
Launching direction
Bearing
Pier
Bending moment
Final position of thesteel girder before casting
Figure 1 Incremental launching method of a steel bridge.
2 Experimental Techniques (2013) © 2013, Society for Experimental Mechanics

R. Chacon, N. Uribe, and S. Oller Numerical Validation of the Incremental Launching Method
analysis of all construction phases is compulsory. It isnecessary to take into account the continuous changeof the structural scheme due to the transient con-ditions of the supports. Internal as well as externalforces acting on the rollers might considerably changethroughout the process. The stress state at the finalphase of the bridge girders might differ considerably(in magnitude and sign) from the stress states thathave been carried out during launching. Furthermore,it is a matter of fact that the launching of bridges madeof concrete requires a different set of solutions thanthose required for purely metallic bridges. For the for-mer, the design of the post-tensioning system mustconsider not only dead load stresses but also the con-siderable stress reversals that occur during launching.For the latter, there are a number of issues relatedto large concentrated forces applied to the girder(namely, patch loading) as well as to the torsionalstiffness of an open section, such as an I-girder, thatmust be carefully addressed by the designer in orderto avoid an undesired instability-related collapse.
This article presents numerical- and scale-reducedexperimental reproductions of a steel bridge whoseconstruction process is the ILM. The numerical repro-duction is performed using a FE-based commercialsoftware that is properly validated with a scale-reduced model deployed at the Laboratory of theChair of Strength of Materials-Technical University ofCatalonia (UPC). The numerical model is based upona contact formulation and allows to reproduce thecontinuous change of the boundary conditions of thelaunched girders. The results provided by the numeri-cal model include stresses, strains, displacements, andsupport reactions that might be compared in situ withfield measurements during the whole process. Thesecomparisons might be of the utmost importance forcontrol and monitoring engineers. Consequently, theresults presented at the end of the paper are aimed atshowing relevant information for designers, contrac-tors, and bridge owners alike.
State of the Art
The ILM has been depicted quite thoroughly duringthe last decades in several books and papers availablein the literature that address this topic with a broadperspective.1–6 More specific papers concerningparticular topics of the method have continuouslybeen published. Rosignoli has focused his research tothe design of the bridges, the launching noses and therolling devices,7–11 whereas Granath has pointed outthe structural response of particular elements of thesteel bridges that are exposed to concentrated loads
of considerable magnitude.12–14 On the other hand,several publications related to bridges constructedusing the ILM are available.1,15–17
Publications related to the numerical simulation ofincrementally launched steel bridges are, however,rather scarce. Marzouk et al.18 performed severalapplications of computer simulations of incrementallylaunched bridges. Their main purpose was toimprove the design of the bridge to be launchedby developing optimization algorithms. Ronggiao andShao19 developed a new beam finite element suitableto reproduce the continuous changes in the supportconditions when a superstructure is constructed usingthe ILM.
Moreover, it has been of the utmost importance tomonitor steel bridges while being launched. Duringthe launching phase, the process is usually monitoredvia reaction at supports/rollers or via displacementusing topography equipment.2 These controls are dis-cretely measured in regions that are anticipated tobe somewhat critical. Recently, Chacon et al.20 per-formed a research work aimed at monitoring thestrain levels of the steel girders with wireless sen-sors. The results have been useful at research levelsshowing that wireless technology might be con-siderably useful during such construction process.Other researchers have already implemented mon-itoring deployments over incrementally launchedsteel bridges with various levels of accuracy and/oramount of collected data.21–23 Publications relatedto computer-aid design and visualization of launchedbridges are also available.24
Scale-Reduced Experimental Simulation of the ILM
General
An experimental reproduction of an incrementallaunching procedure of a steel bridge was deployed atthe Laboratory of the Chair of Strength of Materials-Technical University of Catalonia (UPC). The objectivewas to reproduce a launching procedure of amedium-multispanned bridge assembled with steel I-girders. This prototype is a standard design routinelyemployed in road bridges.25 The chosen geometry forthe reproduction is a laterally restrained, steel multi-I-girder whose final configuration is a continuous andsymmetric two-spanned multi I-girder beam with atotal length of 150 m and a single central pier (Fig. 2).The generic cross-section dimensions of the analyzedgirder are also included. For the sake of simplicity,only one girder (bolded in Fig. 2) is considered in theanalysis. The other girders are displayed in dashedlines only for illustration purposes.
Experimental Techniques (2013) © 2013, Society for Experimental Mechanics 3

Numerical Validation of the Incremental Launching Method R. Chacon, N. Uribe, and S. Oller
A
A
Cross-Section A-AMulti-I girder bridge
75 m75 m
Cross-Section A-A
tw=10mm
tf=50mm
bf=500mm
hw=1900mm
Figure 2 Prototype longitudinal and transversal view.
The depicted prototype was scale-reduced for aproper adaptation to the laboratory facilities. Thereduced model was inferred from a thorough com-parison between the prototype geometry, the labo-ratory facilities, and by applying the PI-Buckinghamtheorem.26,27 The theorem roughly states that a phys-ically meaningful equation (in this case, structurallymeaningful) involving a certain number n of param-eters is equivalent to an equation involving a set ofp = n − k dimensionless parameters constructed fromthe original variable (being k the number of indepen-dent fundamental physical quantities).
Table 1 shows the considered n structural param-eters (including numerical values), whereas Table 2shows the p chosen dimensionless groups. Thus, theprototype was structurally scale-reduced to the exper-imental model.
A close inspection of Tables 1 and 2 leads to pinpointa threefold observation:
• Dimensionless groups 7 and 9 define the scale-reduced model geometry, that is to say, the ratiobetween vertical displacement and the span length.
Table 1 Structural parameters
Symbol Description SI units PrototypeScale-reduced
model
E Elasticity modulus N/mm2 210,000 210,000ν Poisson’s ratio – 0.3 0.3L Span length m 75 1Q Self-weight kN/m 5.42 1.88 × 10⁻²
M Bending moment kN m 15.23 9.42 × 10⁻³
σ Stress N/mm2 286 58.9ε Strain – 1.43 × 10⁻³ 2.94 × 10⁻⁴
δ Vertical displacement mm 2010 37ϕ Rotations at supports rad 3.58 × 10⁻² 4.91 × 10⁻²
W Section modulus mm3 53,257.5 160F Forces (Reactions) kN 406.24 1.88 × 10⁻²
Table 2 Dimensionless groups and similarity ratios
Dimensionlessgroup Similarity
Structuralparameters
Dimensionlessratios
Scalefactor
1 π1 − π ’1
FE·l2 = F
′
E′ ·l′2 λf = λl2
(1
75
)2
2 π2 − π ’2 v = v’ λv = 1 1
3 π3 − π ’3
qE·L = q
′
E′ ·L′ λl = λq(
175
)
4 π4 − π ’4
Mp·l = M
′
p′ ·l′ λM = λl(
175
)
5 π5 − π ’5 σ = σ ’ λσ = 1 1
6 π6 − π ’6 ε = ε ’ λε = 1 1
7 π7 − π ’7
δl = δ
l′ λδ = λl1
75
8 π8 − π ’8 φ = φ’ λφ = 1 1
9 π9 − π ’9
l3
w = l′3
w′ λw = λ13
(1
75
)3
• The self-weight is not considered in the structuralvariables as a mass force. The prototype and thescale-reduced model are made of the same material(steel). Therefore, both have identical values ofdensity, Young’s modulus, and Poisson’s ratio.
• Strains, stresses, and Poisson’s ratio (groups 2, 5,and 6) remained unaltered in the reduced model.These magnitudes do not play any role whencalculating the scaled model geometry. However,from a simplified static analysis of the phenomenon,it was inferred and verified that the stressesobtained at any point on the steel plate shouldnot exceed the yield point threshold.
In its final stage, the steel plate was a symmetrictwo-spanned continuous beam with a total length of2000 mm and a rectangular 60 × 4 mm cross-section.This section is chosen for the sake of accomplishingthe scale of the inertia (an I-beam would provide amajor-axis inertia that would require a longer span).The steel plate was designed with a launching nosewith the same cross-section and material. This platewas launched from one support another by means of
4 Experimental Techniques (2013) © 2013, Society for Experimental Mechanics

R. Chacon, N. Uribe, and S. Oller Numerical Validation of the Incremental Launching Method
a roller system designed at the laboratory facilities.The length scale (pointed out in Table 2) was notprecisely obtained since the cross-section had to beadapted the available commercial steel profiles.
Figure 3 depicts the rolling system, the rigid sup-ports that provided the central pier, the dimensionsof the launching nose as well as the end support.Figure 4 shows details A and B (displayed in Fig. 3)of the scale-reduced launching procedure. It is worthpointing out the following features:
• The rolling system was frictionless.• Lateral restraints were added to the system for the
sake of avoiding lateral displacements.• The launching nose allowed the plate to reposition
once the central and/or the end supports wereapproached by the launched steel plate.
• The launching was carried out as a series ofincrements with halts every 100 mm in orderto minimize the potential effect of vibrations(especially in advanced cantilever phases prior tocontact with the roller bearings).
• The test was repeated a statistically significantnumber of times (n = 30) and the results showedstatistical consistency.
Measurements
Two types of measurements were collected duringthe launching procedure: strains and displacements atkey points of the systems previously anticipated fromtheoretical calculations. For the former, two straingages were bonded (longitudinally and transversely)at the point where the maximum longitudinalstress was expected (precisely at the center of thesteel plate, see Fig. 4). The uni-axial gages (HBM
K-RY81-6) were bonded only on the upper fiber ofthe steel plate to avoid any contact between roller andstrain gage. For the latter, the vertical displacementsof key points of the steel plate were collected bymeans of a photogrammetric procedure using a HDcamera. The pictures were digitalized and scaledprecisely. Accurate measurements were performedon the digital files. These results were further used tovalidate a numerical model. The strain results werecollected with a Spider 8 data acquisition system. Thesignal was processed using the software CATMANEASY 6.10.28
Experimental results
Strain
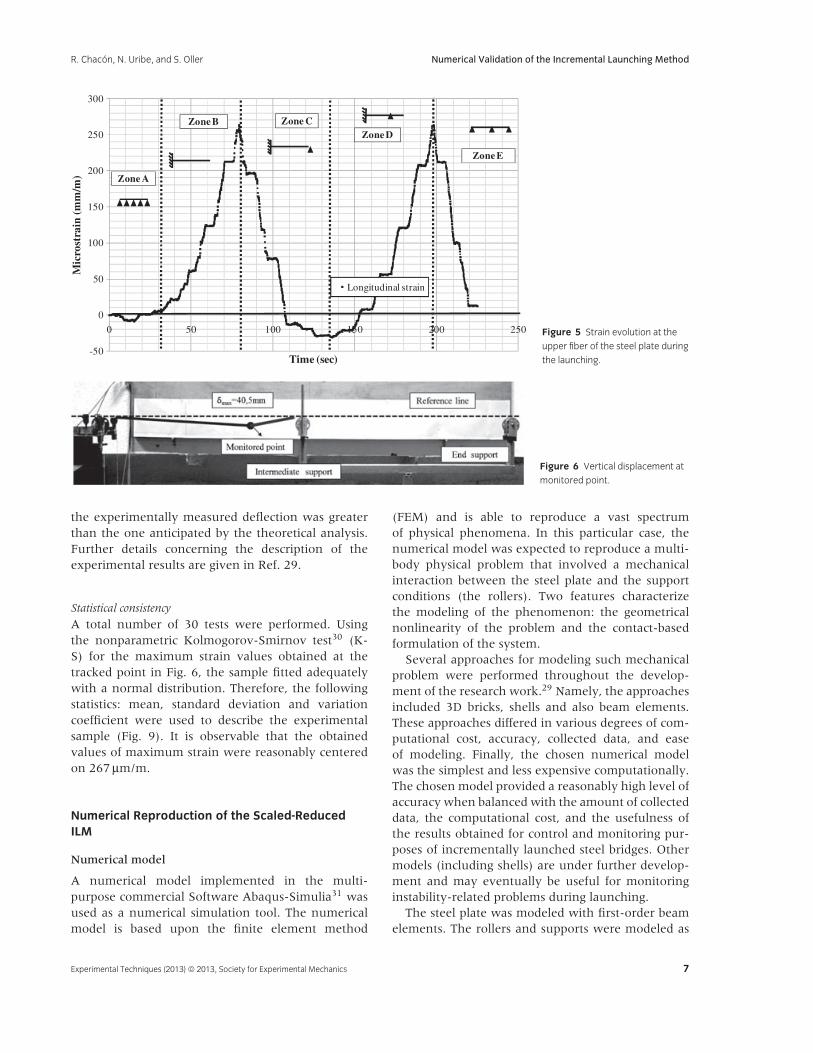
Figure 5 shows the results concerning the strainevolution on the top fiber of the steel plate duringincremental procedure. The procedure as well as theplot are divided into five stages for readability:
• Zone A: The steel plate is supported by therollers system, the measurement equipment wasinitialized, and the launching system was set up.
• Zone B: The launching procedure starts and theplate behaves like a cantilever with the upper fibersubjected to tensile stresses (positive in the plot).The maximum level of strain collected at this stagewas 264 μm/m before the launching nose reachedthe central supports. Assuming that the Hooke’s lawgoverns the relationship between stresses and strainof the steel plate, the maximum stress recorded atthis stage was approximately 54 N/mm2.
• Zone C: The launching nose approaches the centralsupport. The structural scheme suddenly changesand sign reversals of the internal forces areobserved. During this stage the plate undergoes a
1 m1 m
Auxiliary structure
End supportCentral support
HEA120 Rigid frame
launched beam
Rollers
Launching
Detail A. Fig. 4
Detail B. Fig. 4
Figure 3 Laboratory test setup.
Experimental Techniques (2013) © 2013, Society for Experimental Mechanics 5

Numerical Validation of the Incremental Launching Method R. Chacon, N. Uribe, and S. Oller
Figure 4 Details of the scale-reduced model.
sign reversal that ranges from the maximum tensilestrain to the maximum compression strain at thetop fiber (negative in the plot).
• Zone D: The launching procedure is continuouslyupdated by the transient support conditions andthe length of the cantilever which is formed at thesecond span. The longitudinal strain reaches a valueof 264 μm/m (approximately 58 MPa of tensile onthe top fiber) as it approaches the end support.
• Zone E: The launching nose reaches its finalconfiguration. The steel plate forms a continuoustwo-spanned beam. It is worth mentioning that atthis stage the registered strain level is considerablylower than the strain level recorded duringlaunching. This fact shows the importance of aprior detailed structural analysis that depicts thelaunching procedure.
It is worth pointing out that as the stepwise natureof the experimentally collected data comes as a resultof the elapsed time between successive increments ofthe experimental incremental launching procedure.
Vertical displacements
Figure 6 shows the schematic procedure that hasbeen used for tracking the vertical displacement of
the monitored point. The procedure consisted ofplacing a fixed HD camera that was shot regularlyby means of a time-lapse application. The series ofpictures were exported and treated with a CAD toolthat allowed to measure the location of the monitoredpoint with a high level of accuracy. Figure 7 shows thetracked vertical displacement at every step of 100 mm.In addition, the theoretical results of the verticaldisplacement of a similar system (the inclination ofthe launching nose of such system was disregardedfor simplicity) are included within the plot. Thesetheoretical results are based upon a classical Bernoullibeam formulation.
In Fig. 7, it is observable that the maximumdeflection was registered during the zone B, at whichthe plate acts as a cantilever. The maximum measuredvertical displacement is 40.5 mm. At this point, thetheoretical value calculated for a cantilever beamusing the elasticity theory is 38 mm. The differenceis attributable to the boundary conditions idealizedin theory (fully restrained length of the beam whileplaced on the roller system) as well as to the simpli-fication of the flat launching nose. The experimentaltest showed that at maximum cantilever stages, thesteel plate is not fully supported by the rollers sincesome gaps were observed (Fig. 8). Consequently,
6 Experimental Techniques (2013) © 2013, Society for Experimental Mechanics
R. Chacon, N. Uribe, and S. Oller Numerical Validation of the Incremental Launching Method
-50
0
50
100
150
200
250
300
0 50 100 150 200 250
Mic
rost
rain
(m
m/m
)
Time (sec)
Longitudinal strain
Zone A
Zone B Zone CZone D
Zone E
Figure 5 Strain evolution at the
upper fiber of the steel plate during
the launching.
Figure 6 Vertical displacement at
monitored point.
the experimentally measured deflection was greaterthan the one anticipated by the theoretical analysis.Further details concerning the description of theexperimental results are given in Ref. 29.
Statistical consistency
A total number of 30 tests were performed. Usingthe nonparametric Kolmogorov-Smirnov test30 (K-S) for the maximum strain values obtained at thetracked point in Fig. 6, the sample fitted adequatelywith a normal distribution. Therefore, the followingstatistics: mean, standard deviation and variationcoefficient were used to describe the experimentalsample (Fig. 9). It is observable that the obtainedvalues of maximum strain were reasonably centeredon 267 μm/m.
Numerical Reproduction of the Scaled-ReducedILM
Numerical model
A numerical model implemented in the multi-purpose commercial Software Abaqus-Simulia31 wasused as a numerical simulation tool. The numericalmodel is based upon the finite element method
(FEM) and is able to reproduce a vast spectrumof physical phenomena. In this particular case, thenumerical model was expected to reproduce a multi-body physical problem that involved a mechanicalinteraction between the steel plate and the supportconditions (the rollers). Two features characterizethe modeling of the phenomenon: the geometricalnonlinearity of the problem and the contact-basedformulation of the system.
Several approaches for modeling such mechanicalproblem were performed throughout the develop-ment of the research work.29 Namely, the approachesincluded 3D bricks, shells and also beam elements.These approaches differed in various degrees of com-putational cost, accuracy, collected data, and easeof modeling. Finally, the chosen numerical modelwas the simplest and less expensive computationally.The chosen model provided a reasonably high level ofaccuracy when balanced with the amount of collecteddata, the computational cost, and the usefulness ofthe results obtained for control and monitoring pur-poses of incrementally launched steel bridges. Othermodels (including shells) are under further develop-ment and may eventually be useful for monitoringinstability-related problems during launching.
The steel plate was modeled with first-order beamelements. The rollers and supports were modeled as
Experimental Techniques (2013) © 2013, Society for Experimental Mechanics 7

Numerical Validation of the Incremental Launching Method R. Chacon, N. Uribe, and S. Oller
-5
0
5
10
15
20
25
30
35
40
45
0 200 400 600 800 1000 1200 1400 1600 1800 2000
Ver
tica
l dis
plac
emen
t (m
m)
Launching progression (mm)
Test
Theoretical displacement-Zone B
Theoretical displacement-Zone D
Theoretical displacement-Zone E
Zone B
Zone C
Zone D
Zone E
Figure 7 Elastic curve at
monitored point.
Gap
Figure 8 Observable gaps on top of the rollers.
analytical, rigid and frictionless surfaces on whichthe steel plate was able to slide and/or transmitcontact stresses but conversely, was not able topenetrate through. These analytical surfaces weregeometrically defined as semicircular objects rigidlyconnected to the ground. Mathematically, this contactproblem is commonly referred to as the penalty-based method. Further mathematical backgroundbehind this procedure is available in29 and in theSoftware manuals.31 A convergence analysis bycomparing theoretical and experimental values to thenumerically obtained ones was also performed. Thebeam model proved relatively low mesh-dependent.Table 3 shows the principal characteristics of themodel, which is simple and straightforward.
Figure 10 displays a lateral view of the numericalreproduction of the scale-reduced test. The point 1 islocated precisely at the same position than the strain
gages bonded in the steel plate. Consequently, thestrain measurements could be compared. The point2 is located at the beginning of the launching noseand the displacement results (vertical) were comparedto those measured at the lab. The numerical modelincludes thus, a steel plate, 11 rollers as well as thecentral and end bearings (of the same numericalnature than the rollers).
Validation of the numerical model
The numerical model was validated by reproducingprecisely the experimental test depicted in section 3.The experimentally collected data related to strainand vertical displacements was used as a benchmark.The numerical model including the characteristicsdepicted in Table 3 provided similar results relatedto strain and vertical displacement as the steelplate was numerically launched. Figure 11 displaysthe comparison between the experimental and thenumerical results related to the longitudinal strainof the steel plate at the depicted point 1. Bothcurves practically coincide (stepwise nature of theexperimental results aside). The numerical modelreproduces quite satisfactorily the response observedexperimentally both qualitatively and quantitatively.A slight difference between the maximum strainvalues at both monitored peaks is observable. Thisdifference is attributed to the greater flexibility of theexperimental test (Fig. 8)
Figure 12 displays a comparison between theexperimental and the numerical results related to thevertical displacement of the steel plate at the depictedpoint 2. Both curves practically coincide qualitatively
8 Experimental Techniques (2013) © 2013, Society for Experimental Mechanics

R. Chacon, N. Uribe, and S. Oller Numerical Validation of the Incremental Launching Method
Figure 9 Frequency of the obtained values (maximum recorded microstrain).
Table 3 Characteristics of the numerical model,29,31
Numerical simulation
Software Abaqus
Solver Abaqus-Standard
Cross-section 60 mm × 4 mm
Material Steel
E (N/mm2) 210,000
Density (kg/m3) 7850
Constitutive equation (Elastic)fy
σ
εε
ELASTIC
Procedure Geometrically nonlinear
Contact-friction interaction Penalty-based contact
Tangentially: Frictionless
Normally: No penetration but separation
Load type Self-weight
Beam element B21 first-order, planar
Lspan,scale-reduced (mm) 2000
Mesh Uniform, Length= Lbeam/200
Bearings Semicircular rigid wires
but there is a difference in quantitative terms whencompared to the strain results at peak points. Thedifferences are, however, rather small. The numericalmodel yields a slightly more flexible response thanthe experimental data.
The main novel feature of the numerical model,which is the contact-based formulation between therollers and the girders, is adequately reproduced.
Numerical Reproduction of a Real-ScaleIncrementally Launched Bridge
A numerical reproduction of a hypothetical ILM ofthe steel bridge depicted in Fig. 2 was performed withthe validated model. The numerical characteristics ofsuch model are identical to those depicted in Table 3.There is, though, a difference worth mentioning:the bearings in this model were created accordingto the standard dimensions for these devices.23
These elements were equally modeled as analytical,rigid surfaces. In this case, a regular mesh of186 first-order beam elements (B21, whose lengthequals approximately the relationship Lspan/200) wasdeployed. The configuration of the launched structureis identical to the one depicted in Fig. 10 but in thiscase, L = 75,000 mm.
The numerical model allows the user to extractany kind of information related to the stress, strain,displacement, and the contact forces fields. Thisrepresents a vast amount of data, which is notnecessarily useful during the construction stages.In field bridge engineering, it might be of greatusefulness to accurately anticipate the forces, strains,and displacements the girder undergoes during theincremental launching procedure. Consequently, theresults that are displayed herein are aimed atshowing the potential control tools such simulationmay provide. Therefore, three structural results aremonitored and depicted:
• Strains at point A (exact middle point of the girder).• Vertical displacement at the front of the cantilever.• Reaction forces at central and end bearings.
Experimental Techniques (2013) © 2013, Society for Experimental Mechanics 9

Numerical Validation of the Incremental Launching Method R. Chacon, N. Uribe, and S. Oller
11 RollersSteel plate
Central andend bearings
1000 mm 1000 mm
Point 1. Strain measurementsAt x=1000 mm
Point 2. Displacementmeasurements
Figure 10 Numerical reproduction of the
scale-reduced test. Lateral view.
-50
0
50
100
150
200
250
300
0 50 100 150 200 250 300 350 400 450 500
Mic
rost
rain
Time (seg)
Experimental resultsNumerical results
Figure 11 Numerical versus experimental results related to longitudinal strain.
The above-mentioned magnitudes are usuallymonitored during the launching phase. A thoroughcomparison between the anticipated values andthe field measurements may clarify and/or confirmthe correct practice of the launching process orpotentially, may prevent undesired problems duringconstruction.
Strains
The results concerning stresses and strains are usefulin a twofold fashion:
• For design purposes, the model may warn about anypotential yielding of the girder during the ILM if thestrain is associated with the constitutive equationof the material.
• For control purposes, the results related to strainsmay be compared with in situ measurements thatare increasingly used nowadays.20–23
For the former, localized yielding of the steel girdersduring launching is highly undesired. The numerical
model provides information that may anticipate anypotential yielding of the girder at any point. Thenumerical model may flag any finite element thatoverpasses a defined threshold of stresses (namely, theyield stress fy). The yielded areas could be pinpointedat the end of the procedure and the design of the steelgirder may be changed at design stages.
For the latter, the model allows to track the strainat any given point of interest (that may be the pointsat which strain gages are located). The stress levelsmay also be inferred from the strain field via theconstitutive equation (which is reasonably expectedto be linear during construction).
Figure 13 displays a control plot of strain andstresses obtained with the numerical simulation of theILM. The strain–stress values are obtained from pointA, which is located where the maximum longitudinalstress occurs.
Noticeably, sign reversals are observable since thegirder undergoes consecutive sagging and hoggingbending moments. This information should reason-ably coincide with the field measurements. Finally,
10 Experimental Techniques (2013) © 2013, Society for Experimental Mechanics

R. Chacon, N. Uribe, and S. Oller Numerical Validation of the Incremental Launching Method
-10
0
10
20
30
40
50
60
0 200 400 600 800 1000 1200 1400 1600 1800 2000
Dis
plac
emen
t (m
m)
Launching progression (mm)
Numerical resultsExperimental results
Length/Displacement780mm/40mm=19,5
Monitored point
Launching progression
Figure 12 Numerical versus
experimental-vertical
displacement.
-250
-200
-150
-100
-50
0
50
100
150
200
250
0 20 40 60 80 100 120 140 160 180
Max
imum
long
itud
inal
str
ess
(N/m
m2 )
Launching progression(m)
Stress at top flange
Stress at bottom flange
Yield threshold (indicated qualitatively)
Yield threshold (indicated qualitatively)
Figure 13 Longitudinal stress
control at point A.
the plot includes thresholds that define warning areasof undesired levels of stress and strain (pinpointedqualitatively in the plot).
Vertical displacements
The vertical displacements of the steel girders aregenerally monitored and controlled in situ withbasic topographic equipment. These measurementsdo not require complex acquisition data systemsdespite the high level of accuracy provided by moderntotal stations. The contractors, designers and bridge
owners often rely on such measurements due to theiradequate balance between accuracy and ease. Anyindividual involved in the construction can track theprogression of the launching in terms of deflection ofthe steel girder.
Figure 14 displays the history of the verticaldisplacement of the point referred to as B in theplot obtained with the numerical model. This historyshould be read as follows, for a given distance x (mm)of the tracked point during launching, its verticaldisplacement is given. Noticeably, the displacementincreases in sagging zones and decreases as the girder
Experimental Techniques (2013) © 2013, Society for Experimental Mechanics 11

Numerical Validation of the Incremental Launching Method R. Chacon, N. Uribe, and S. Oller
-2000
-1500
-1000
-500
0
500
0 20 40 60 80 100 120 140 160 180
Ver
tica
l dis
plac
emen
t (m
m)
Launching progression(m)
Figure 14 Vertical displacement
control of a real-scale launched
steel bridge.
-100
0
100
200
300
400
500
600
700
800
0 20 40 60 80 100 120 140 160 180
Rea
ctio
n fo
rce
(kN
)
Launching progression (m)
Central pier bearing
End abutment bearing
The launching nose reaches the central pier bearing position
The launching nose reaches the end abutment position
Figure 15 Vertical reaction
control at central pier and end
abutment.
passes over a given bearing. Field measurements andnumerical predictions may also be compared andthus, conclusions related to the process may be drawn.
Reaction force at the bearings
Load cells are usually deployed at bearing duringlaunching.32 These measurements allow to monitorthe magnitude of the reaction forces. In bridges withmultigirder cross-sections, these measurements areof the utmost importance for the verification of theadequate position of the bridge during launching. Allload cells provided at a given bearing should reada proportional amount of the total load which isknown beforehand. If an undesired loss of symmetryoccurs during launching, the reactions forces woulddiffer considerably from one girder to another. This
implies repositioning of the bridge with all costs andtime-waste associated.
The numerical model provides information relatedto the contact stresses transmitted from the girdersto the bearing. In addition, it provides informationrelated to the internal forces that occur at thegirder (bending moment, shear). Figure 15 displaysa reaction force graph plotted against the distanceat which the launching nose is located (namely,the launching progression). The results might becompared with in situ measurements for controlpurposes but also, these results might be used atdesign stages. In steel launched bridges, it is well-known that the patch loading forces combined withthe bending moments are, among others, importantforces to be verified.
12 Experimental Techniques (2013) © 2013, Society for Experimental Mechanics

R. Chacon, N. Uribe, and S. Oller Numerical Validation of the Incremental Launching Method
Conclusions
In this paper, experimental and numerical modelsaimed at stimulating the structural behavior of a steelI-girder bridge constructed by the ILM are depicted.
On one hand, the experimental test has been per-formed in a scale-reduced fashion and has beenuseful for validation purposes. On the other hand, thenumerical model using beam elements proves versa-tile when simulating the launching process within ashort calculation time. The numerical model includesa contact-based formulation which reproduces satis-factorily the transient support conditions that occurduring the ILM.
The numerical simulation of the ILM represents auseful tool for monitoring and controlling the variousmagnitudes that are typically measured in situ withtraditional field equipment. This numerical controlallows bridge designers, contractors, and owners toanticipate the structural response of the steel girders.Results related to the strain–stress field, verticaldisplacements, and reaction forces at bearings mightbe easily inferred from the simulation and comparedto field measurements. The proposed simulation ofthe ILM model provides an adequate balance betweenaccuracy, collected data, and ease. The simulationpresented herein might be extended to box girders orother bespoken cross-sections.
References
1. LaViolette, M., Wipf, T., and Lee, Y., BridgeConstruction Practices Using Incremental Launching,American Association of State Highway andTransportation Officials, AASHTO, Ames, Iowa (2007).
2. Rosignoli, M., Bridge Launching, Thomas Telford,London, UK (2002).
3. Baur, W., ‘‘Bridge Erection by Launching is Fast,Safe and Efficient,’’ Civil Engineering–ASCE 47(3):60–63 (1977).
4. Gohler, B., and Pearson, P., Incrementally LaunchedBridges. Design and Construction, Ernst and Sohn, Berlin(2000).
5. Alistair, P., Large and Small Incrementally LaunchedStructures, Transportation Research Record 1696(5B0060), Transportation Research Board, WashingtonD.C. (2000).
6. Zellner, W., and Svensson, H., ‘‘IncrementalLaunching of Structures,’’ Journal of StructuralEngineering 109(2): 520–537 (1983).
7. Rosignoli, M., ‘‘Site Restrictions Challenge BridgeDesign,’’ Concrete International 20(8): 40–44 (1998).
8. Rosignoli, M., ‘‘Pre-sizing of Prestressed ConcreteLaunched Bridges,’’ ACI Structural Journal 96(5):705–711 (1999).
9. Rosignoli, M., ‘‘Nose-Deck Interaction in LaunchedPrestressed Concrete Bridges,’’ Journal of BridgeEngineering 3(1): 21–27 (1998).
10. Rosignoli, M., ‘‘Reduced-Transfer-Matrix Method ofAnalysis of Launched Bridges,’’ ACI Structural Journal96(4): 603–608 (1999).
11. Rosignoli, M., ‘‘Monolithic Launch of the ReggioloOverpass,’’ Concrete International 29(2): 26–30(2001).
12. Granath, P., ‘‘Distribution of Support ReactionAgainst a Steel Girder on a Launching Shoe,’’ Journalof Constructional Steel Research 47(3): 245–270 (1998).
13. Granath, P., Thorsson, A., and Edlund, B., ‘‘I-ShapedSteel Girders Subjected to Bending Moment andTravelling Patch Loading,’’ Journal of ConstructionalSteel Research 54(3): 409–421 (2000).
14. Granath, P., ‘‘Serviceability Limit State of I-ShapedSteel Girders Subjected to Patch Loading,’’ Journal ofConstructional Steel Research 54(3): 387–408 (2000).
15. Favre, R., Badoux, M., Burdet, O., and Laurencet, P.,‘‘Incremental Launching for the Ile Falcon Bridge,’’Concrete International 21(2): 46–51 (1999).
16. Hewson, N., and Hodgkinson, A., ‘‘IncrementalLaunch of Brides Glen Bridge, Ireland, Concrete,’’Vol. 38(7): 29–31 (2004).
17. Zhuravov, L., Chemerinsky, O., and Seliverstov, V.,‘‘Launching Steel Bridges in Russia,’’ Journal ofInternational Association for Bridge and StructuralEngineering (IABSE) 6(3): 183–186 (1996).
18. Marzouk, M., El-Dein, H., and El-Said, M.,‘‘Application of Computer Simulation toConstruction of Incrementally Launching Bridges,’’Journal of Civil Engineering and Management 13(1):27–36 (2007).
19. Xu, R., and Shao, B., ‘‘A New Beam Element forIncremental Launching of Bridges,’’ Journal of BridgeEngineering 17(5): 1–19 (2011).
20. Chacon, R., Guzman, F., Mirambell, E., Real, E., andOnate, E., ‘‘Wireless Sensor Networks for StrainMonitoring During Steel Bridges Launching,’’International Journal of Structural Health Monitoring8(3): 195–205 (2009).
21. Wipf, T., Phares, B., Abendroth, R., Chang, B.,Abraham, S., ‘‘Monitoring of the Launched GirderBridge over the Iowa River on US 20,’’ Final ReportCTRE Project 01–108. Center for TransportationResearch and Education, Iowa State University,Ames, Iowa (March 2004).
22. Lebet, J., Measurements Taken During the Launch of the130 m Span Vaux Viaduct, Steelbridge, OTUA, Millau(2004).
23. Zhang, Y., and Luo, R., ‘‘Patch Loading andImproved Measures of Incremental Launching ofSteel Box Girder,’’ Journal of Constructional SteelResearch 68(1): 11–19 (2012).
Experimental Techniques (2013) © 2013, Society for Experimental Mechanics 13

Numerical Validation of the Incremental Launching Method R. Chacon, N. Uribe, and S. Oller
24. Martins, O.P., and Sampaio, A.Z., ‘‘BridgeLaunching Construction Visualized in a VirtualEnvironment,’’ The International Journal of VirtualReality 10(2): 49–56 (2011).
25. Kuhlmann, U. et al. Combri Design Manual –Part IApplications of Euro Code Rules, 1st edition, Stuttgart,Germany (2008).
26. Buckingham, E., ‘‘On Physically Similar Systems.Illustrations of the Use of Dimensional Equations,’’Physical Review 4: 345–376 (1914).
27. Blanco, E., Oller, S., and Gill, L., Analisis Experimentalde estructuras, CIMNE, Barcelona (2007(in Spanish)).
28. CATMAN Easy V 6.10, Hottinger Baldwin MesstechnikHBM, Darmstadt, Germany (2012).
29. Uribe N. Reproduccion numerica y experimental delproceso de lanzamiento de un puente metalico por empujessucesivos, Master’s Thesis, Construction EngineeringDepartment, ETSICCPB, Universitat Politecnicade Catalunya (2012) (in Spanish), URL http://upcommons.upc.edu/pfc/handle/2099.1/14898[accessed on 25 November 2013].
30. Lindgren, B.W., Statistical Theory, 2nd Edition, TheMcmillan Company, New York (1962).
31. Abaqus FEA, Simulia© V6.10.3, Dassault Systemes,Paris, Boston, Tokyo (2012).
32. Marzouk, M., Said, H., and El-Said, M., ‘‘Frameworkfor Multiobjective Optimization of Launching GirderBridges,’’ Journal of Construction Engineering andManagement 135(8): 791–800 (2011).
14 Experimental Techniques (2013) © 2013, Society for Experimental Mechanics