technical analysis for long-term investorspoint-and-figure.technicalanalysis.org.uk/alle01a.pdf ·...
TRANSCRIPT

W. Clay Allen CFA Page 1 2/25/01
Technical Analysis for Long-term Investors Long-term investors often shun technical analysis because it is thought to be a tool used solely for short-term speculation. In fact, a large part of the literature of technical analysis is devoted to short-term timing, which confirms this belief. Many individual investors have experimented with various charting techniques and have dropped the technical approach after a few “bad” experiences. Professional long-term investors are often completely indoctrinated in the belief that the market is “efficient” and that technical analysis is of no practical value since the day-to-day fluctuations of stock prices are random. There can be little argument that the day-to-day movements of stock prices are random. And yet, the movements of individual stocks and the broad market demonstrate an uncanny ability to anticipate future fundamental developments and other factors that influence stock prices. Short-term randomness of stock prices does not seem to diminish the ability of the market to more-or-less consistently act as a long-term discounting mechanism. The random nature of stock price movements has led to the development of a primarily academic theory called the Efficient Market Hypothesis. The EMH is highly critical of professional investment management and is often used to justify a passive indexed approach to portfolio management. Most of the assumptions that make up the foundations of the efficient market hypothesis seem unrealistic to me – especially the ideas that new information is disseminated throughout the market instantly and that all investors interpret new information accurately and that stocks are always priced correctly. I have observed instances that are almost exactly opposite to this proposition so frequently as to represent a common occurrence. And still, the conclusions of the efficient market hypothesis seem to be borne out by the almost universal inability of the majority of institutional investors to “beat” the market as measured by a popular market average such as the S&P 500. The academic community smugly points to the lack of performance as an almost direct proof of the efficient market hypothesis. That “proof” is almost totally damaging to the practice of technical analysis by long-term fundamental investors. The inability

W. Clay Allen CFA Page 2 2/25/01
of institutional investors to achieve performance goals is used to justify avoiding a most important performance-enhancing tool. Basically the efficient market hypothesis says that you cannot predict the future of a stock price or the stock market by using technical analysis. The “strong” form says that you can’t predict stock prices with technical analysis, fundamental analysis or anything else – period! The implied assumption in this argument is that investment success must be the result of superior predictive capability. It appears that investment success may in fact be the result of activities other than attempting to make more accurate predictions of the future and better market forecasts.
Adaptation vs Prediction While the day-to-day movements of stocks prices are random, it can be shown conclusively that most stock prices, in essence, meander randomly around a dominant long-term trend. These long-term movements primarily reflect the financial performance of the companies they represent. These trends are also effected by many other factors including investor psychology, interest rates, consumer tastes, changing technology and competitive conditions, as well as government regulations and other circumstances such as market fads and bubbles that influence the supply-demand relationship for stocks. It appears to be nearly impossible to weigh these variables sufficiently correctly to reach a reliable prediction of future prices. It should be noted that the stock market exists because of change. The prices of shares are constantly being re-evaluated by investors to account for the perceived changes in the variables that most effect stock prices. The stock markets and the economy represent a highly complex system, which can be explained and understood but not necessarily predicted – it is similar to evolution in nature. Investors must constantly adapt to changes that they can’t fully understand and whose consequences may stretch out over months or years - just as species in nature must adapt to changes in their environments - or perish.

W. Clay Allen CFA Page 3 2/25/01
Also it must be realized that all of these influences are constantly being evaluated by investors in the market as a part of the price discovery process. The constantly changing relative importance of these inputs can only be guessed at - but the result, price, is constantly there for all to see. The successful solution to the problem of investment performance seems to be less a matter of prediction and more a function of an ability to measure and adapt to these trends in light of the objectives of the portfolio and the direction and durability of these movements. As the efficient market suggests, these stock price trends will be shaped by new information entering the marketplace but probably will not be felt instantaneously and maybe not even accurately. Trends will move strongly in one direction or another for an indeterminate period of time that probably can’t be predicted but can be tracked and evaluated by an analysis of the price movement. At other times, prices will meander in a meaningless back and forth oscillation, which can by its pattern indicate that the supply/demand relationship is in balance and little opportunity for investment success is present in those shares.
Long-term Technical Analysis The most important application of technical analysis is not to attempt to predict future prices but to evaluate the strength of ongoing trends and more particularly to help portfolio managers adapt to trends that are changing direction. In essence, we will use price movement to verify our fundamental predictions and validate our expectations regarding the future performance of the shares under study. Should the trend change direction we will need to critically reconsider our predictions and expectations regarding the future of the stock. In other words, “if this stock is so great, why is it performing so badly ”? It is well known that most predictions go awry not because of an incorrect analysis of the primary factors evaluated in the development of the forecast. The predictions fail, more often than not, because of variables that we didn’t consider. We didn’t take these items into account ether because we thought they didn’t matter or they occurred in a completely unpredictable manner. We also suffer from an inability to anticipate changes in the relationships that tie the independent variables together. One way or another our prediction may turn out to be wrong. The best evidence we

W. Clay Allen CFA Page 4 2/25/01
can get that alerts us to a deteriorating fundamental prediction is price action counter to our expectations. Our egos usually become involved in our predictions and forecasts and we are often unable to reverse our commitments by admitting that we are wrong. This seems to be especially true for highly intelligent, hard working, well-educated individuals that seem to occupy most investment portfolio management positions. The ongoing under-performance by most institutional portfolio managers may be more of a testimony to our inability to “fess up” when we are wrong than it is evidence of market efficiency!
80/20 rules
The most important use for technical trend analysis is to verify our expectations about stocks we already own. This indicates that technical analysis is critical to our thinking when considering a sell decision in the portfolio. It is not surprising, therefore, that most fundamentally oriented portfolio managers confess difficulty with the sell decision. In my opinion, they have needlessly cut themselves off from a source of extremely valuable information though neglect of technical analysis. I believe portfolio managers should weight the buy decision about 80% fundamental and only about 20% technical. But the sell decision should reverse the weights of the two inputs, 80% technical and only 20% fundamental. The proven ability of stocks to discount changing fundamentals suggests that stocks will experience a downturn in price before the bad news “comes out”. Very small negative divergences from consensus expectations can often have a devastating effect of the stock price. Therefore is seems appropriate to implement price analysis to anticipate bad news and therefore I suggest a heavy weighting of technical analysis when considering the sell decision in active portfolio management. Its not what you don’t own that hurts your performance – performance suffers because of the stocks that you hold because of a mistaken prediction - usually in

W. Clay Allen CFA Page 5 2/25/01
the face of directly contrary price action. The avoidance of just a few disasters can have a very big payoff in terms of improved portfolio performance.
Some Thoughts about the “Loser’s Game” I have included one of the concluding paragraphs from the now famous article by Charles D. Ellis that originally appeared in the Financial Analysts Journal in 1975. The Loser's Game 177 ... concentrate on your defenses. Almost all of the information in the investment management business is oriented toward purchase decisions. The competition in making purchase decisions is too good. It's too hard to outperform the other fellow in buying. Concentrate on selling instead. In a Winner's Game, 90 percent of all research effort should be spent on making purchase decisions; in a Loser's Game, most researchers should spend most of their time making sell decisions. Almost all of the really big trouble that you're going to experience in the next year is in your portfolio right now; if you could reduce some of those really big problems, you might come out the winner in the Loser's Game. The Losers Game By Charles D. Ellis Charles D. Ellis with James R. Vertin The Investors Anthology John Wiley & Sons 1997 ISBN 0-471-17605-2 P 177 I believe the advice to concentrate on defenses and sell decisions can make the difference between good performance and no performance at all. This advice is

W. Clay Allen CFA Page 6 2/25/01
even more emphatic when the shortcomings of fundamental analysis in the sell decision are considered. The attitude seems to pervade the investment community that if the buy decision is well considered then everything else will take care of itself. This belief does not seem to hold together in actual practice. In an economy and business environment of rapid change and innovation it seems that things don’t stay the same for very long. There are winners and losers – all the time. The portfolio must be kept fresh and out ahead of the changes that are driving the economy and markets. Errors in analysis will occur and some predictions will not “pan out”. We need to be able to identify “next year’s big trouble” that is already in our portfolios and sell it before the negative impact on portfolio performance becomes serious. This also has the not insignificant effect of freeing up a slot in the portfolio for a stock with better performance potential. The sell decision must be well considered and applied with discipline or the process of successful adaptation will not be accomplished. The search for sells must be continuous and effective in order to keep pace with important changes in the economy and business conditions. In my opinion the best way to approach the sell decision is with disciplined long-term technical analysis. This seems to be the best hope for winning the “loser’s game”. I believe the use of long-term relative strength charts in a point & figure format is a perfect tool to use for the sell decision.
Some Thoughts about Probabilities In my opinion there is no “answer”- fundamental or technical or otherwise - that will allow accurate and reliable “risk-free’ predictions of future stock prices. We must continually deal in probabilities regarding the future. Human beings seem to have considerable difficulty in dealing effectively with probabilities. (See literature in the field of Behavioral Finance) In the stock market, as professional investors we have to do the best we can to avoid biases in our decision-making and to limit self-destructive behaviors as well

W. Clay Allen CFA Page 7 2/25/01
as guard against a self-defensive policy of overly cautious do-nothing portfolio management. We must take risks intelligently to capitalize on opportunities and yet provide an element of damage control. In my experience the long-term, relative strength charts in a point & figure format provide an edge that suggests probabilities of success in the range of 65% to 75%. This is a totally subjective estimate of the probabilities drawn from my experience. It should be understood that these subjective probabilities of success are not constant but will vary up and down within and outside the estimated range of success depending on market conditions and the skill of the user. It is a certainty that a user who will use the technique until the first failure will drop the approach shortly after the trial starts because between 1out of 3 and 1 out of 4 of all decisions will be errors. Critics of the system will be able to readily find individual examples of failure of the system and this may result in the rejection of the approach because it is not a perfect predictor rather than its ability to achieve performance objectives. Used in the proper context the relative strength P&F approach seems to assure the elimination of big losers from the portfolio and the retention of winners for as long as they perform adequately. The objective is to achieve adequate performance for the risks taken and this approach offers hope for achieving this goal.
___________________________________________________
Some Thoughts about Portfolio Turnover Most fundamentally oriented portfolio managers point to increased portfolio turnover as a reason to reject technical analysis as a tool for portfolio management. Increased commissions and trading costs as well as price slippage are often cited as the increased costs associated with higher turnover and therefore a drag on performance. Higher taxes on short-term gains are also given as reasons to reject tools that might result in higher turnover.

W. Clay Allen CFA Page 8 2/25/01
The record seems to suggest otherwise! Trading commissions have probably never been lower. Price slippage and lack of liquidity are bona fide negative considerations and may act as a significant drag on the performance of large portfolios. Even so, long-term technical analysis should not be rejected as having no value because very important positive results may result. Recent studies in the field of behavioral finance suggest other factors may create negative consequences for the portfolio. This research suggests a strong tendency for portfolio managers to sell winners prematurely and to retain losers in the portfolio. The desire for enhanced tax efficiency adds to the tendency to hold losers in the portfolio. This is what I call “negative turnover”. This is turnover that directly hurts the performance of the portfolio and downgrades the potential for future appreciation. Negative turnover often results from a short-term emotional response to news or market rumors and it is a serious threat to performance where no long-term methods are “in place” to keep the portfolio manager “on course”. Long-term technical analysis, when properly applied, provides a tool to help a portfolio manager retain winners and to identify losers for sale. “Positive turnover” is achieved whenever the portfolio manager can hold the winners and sell the losers. This should also enhance the tax efficiency of the portfolio as well as improve the performance of the portfolio. The key seems to reside in the orientation of the analysis to a long-term perspective. This is why the long-term bullish support lines incorporated in the relative strength point & figure analysis are so important in providing a method to retain the winners in the portfolio. Care must be exercised when using long-term relative strength point & figure analysis to correctly categorize stocks into the proper classifications of major winners, major losers and stocks in trading ranges. This classification technique allows the portfolio manager to continually upgrade the appreciation potential of the portfolio and to adapt to important fundamental changes in a timely manner. Any portfolio management approach that cannot consistently produce positive turnover should be rejected as damaging to portfolio performance. Positive turnover depends upon the reduction/ elimination of short-term market noise, as well as, a long-term market adjusted trend perspective. The long-term charts of

W. Clay Allen CFA Page 9 2/25/01
relative strength in a point & figure format were designed to provide just such a tool for portfolio management.
The Mystique of Point & Figure Charting I believe that the 3-box, point & figure charting system is the best choice of technical inputs for long-term investors. The 3-box method acts like a filter to eliminate the noisy, random, minor, day-to-day price fluctuations from the analysis. I think this is why point & figure charting has survived the test of time. Another advantage of the 3-box, point & figure method is the ability to include a long price history in a compact chart. Many charts in the Market Dynamics system are based on over four years of data. This perspective is appropriate for long-term portfolio managers. A primary advantage of the 3-box, p&f charting technique is the use of more or less objective decision rules. The signals are hard to miss and support and resistance zones show up clearly. The charts are presented in a compressed format where Xs represent increases in price and Os represent declines. The unusual appearance of the charts has led to an air of mystique surrounding the approach. There is nothing mysterious about their construction and use but the unusual appearance of alternating columns of Xs and Os gives some new users a negative impression of an initially puzzling chart. The most significant advantage of the 3-box, p&f approach is the fact that the charts do not track price vs time. They record price movement up and down on the y-axis relative to alternations of trend across the x-axis. It requires a significant movement in the direction opposite to the recently recorded trend to create a reversal along the x-axis on the chart. These reversals are a function of volatility (i.e. more volatility produces more reversals – less volatility fewer reversals). Since volatility is usually a proxy for risk these charts can be characterized as tracking price versus risk. Volatility changes as trends ebb and flow and the movements of price versus risk are critical to trend evaluation.

W. Clay Allen CFA Page 10 2/25/01
RELATIVE STRENGTH The Market Dynamics charting system presents the relative strength of the stock in a 3-box P&F format. This makes these charts appropriate for the evaluation of trends relative to the market. The S&P 500 represents the market. The use of relative strength ratios removes the performance of the market from the presentation and what is left is the price action that is specific to the stock in question. This presentation is particularly important for institutional investors whose objective is to “beat the market”. The relative strength presentation also incorporates the application of trendlines with predetermined slopes to evaluate the performance of the issue. The 45-degree bullish support lines and 45-degree bearish resistance lines are important tools in the trend evaluation techniques used by Market Dynamics. These trendlines and their application are thoroughly discussed in later chapters of the tutorial.
Relative Strength in Long-term Point & Figure Format Several examples of major long-term trends follow. Since this section of the tutorial is focused on technical analysis for long-term investors and the application of relative strength in a point & figure format primarily to the sell decision – most of the examples that follow show stocks in major long-term downtrends. As the trend turns down it is impossible to estimate how far down the stock might fall but it is enough to know that the trend is down and the downside surprises investors by its severity more often than not! Many of these examples were drawn form stocks that comprise the NASDAQ 100 index.

W. Clay Allen CFA Page 11 2/25/01
Examples – Major Long-term Downtrends
AMZN
Conventional trendline – less steep than a 45-degree bearish resistance line
Many of the examples that follow will also show a pattern of repeated failures of 45-degree bullish support lines. This is usually the case with stocks in major long-term downtrends. These support line failures provide recurring confirmation that the trend is indeed down. It is temping to say that the stock is too cheap and it should stop going down - but this is often a mistake.

W. Clay Allen CFA Page 1
ATHM
After the relative strength reversethe downside there was almost noserious challenge of the 45-degrebearish resistance line. If held forlong-term this stock would have seriously impacted the performanof the whole portfolio.
Portfolio managers who must communexample shown above to be a source ofsuch a loss of credibility that the accoulong-term losers can create an impressiperhaps even incompetent. It is far bettportfolio before they damage client rela
This is an example of a downward sloping 45-degree bearish resistance line. It is amazing how frequently the relative strength trend will honor thesebearish resistance lines.
2 2/25/01
d to e the
ce
icate with clients will find stocks like the conflict with clients and may even cause nt will be lost. Stocks that become major on of the money manager as stubborn and er to eliminate these stocks from the tionships.

W. Clay A
BRCM
45-degree bearish resistance line
The repeated failures of the 45-degree bullish support lines show clearly.
llen CFA Page 13 2/25/01

W. Clay Allen CFA Page 14
CSCO
e
45-degree bullish support
Shallow conventional down lin
A conventional trendline is usually less steep than a45-degree bearish resistance line. Good practice requires that the line touch therelative strength plot in at least three places to be a valid trend line. The conventional trendline, when it can be drawn, seems to have more significance in describing the long-term trend that a 45-degreebearish resistance line.
2/25/01

W. Clay Allen CFA Page 15 2/25/01
CMGI
45-degree bearish resistance line
This is an example of an extreme decline by a speculative stock.
W. Clay Allen CFA Page 16 2/25/01
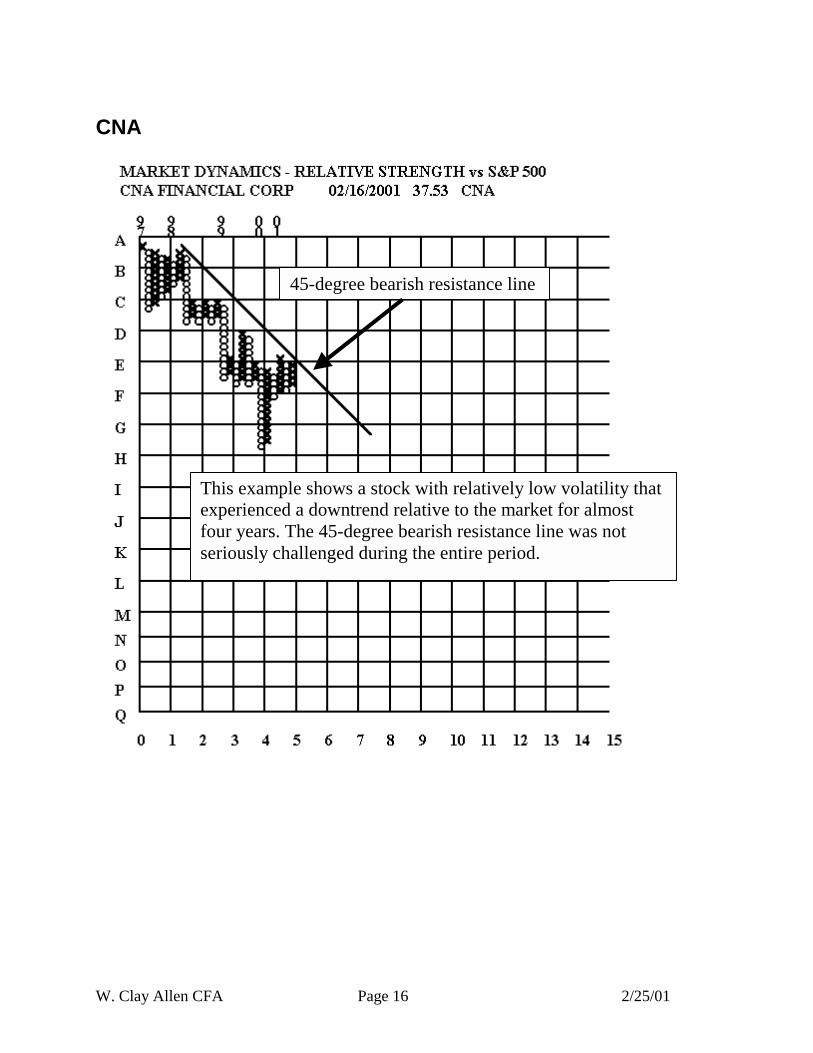
CNA
45-degree bearish resistance line
This example shows a stock with relatively low volatility that experienced a downtrend relative to the market for almost four years. The 45-degree bearish resistance line was not seriously challenged during the entire period.

W. Clay Allen CFA Page 17 2/25/01
CMRC
45-degree bearish resistance line
45-degree bullish support line

W. Clay Allen CFA Page 18
CNXT
45-degree bearish resistance line
e
Shallow conventional downtrend lin2/25/01

W. Clay Allen CFA Page 19 2/25/01
CNC
45-degree bearish resistance line
This is another example of repeated failures of the 45-degree bullish support lines. These lines are drawn from a prominent low point on the chart upward to the right.

W. Clay Allen CFA Page 20 2/25/01
CORL
45-degree bearish resistance line
45-degree bullish support line

W. Clay Allen CFA Page 21 2/25/01
CPTH
45-degree bearish resistance line
45-degree bullish support line
45-degree bullish support line

W. Clay Allen CFA Page 22
DELL
e
45-degree bullish support line
Another example of a successionfailures of 45-degree bullish supp
Shallow conventional downtrend lin
2/25/01
of repeating ort lines.

W. Clay Allen CFA Page 23 2/25/01
DT
45-degree bullish support line
45-degree bearish resistance line

W. Clay Allen CFA Page 24 2/25/01
INKT
45-degree bearish resistance line
45-degree bullish support line

W. Clay Allen CFA
JDSU
e
Shallow conventional downtrend linPage 25 2/25/01

W. Clay Allen CFA Page 26 2/25/01
JNPR
45-degree bearish resistance line
45-degree bullish support line

W. Clay Allen CFA Page
LU
e
45-degree bullish support
Shallow conventional downtrend lin
27 2/25/01
line

W. Clay Allen CFA Page 28 2/25/01
MCK
45-degree bearish resistance line

W. Clay Allen CFA Page
MSFT
e
Shallow conventional downtrend lin29 2/25/01

W. Clay Allen CFA Page 30 2/25/01
NTAP
45-degree bearish resistance line
45-degree bullish support line

W. Clay Allen CFA Page 31 2/25/01
PMCS
45-degree bearish resistance line
45-degree bullish support line

W. Clay Allen CFA
PUMA
Shallow conventional downtrend linePage 32 2/25/01

W. Clay Allen CFA
RNWK
e
45-degree bullish s
Shallow conventional downtrend lin
Page 33 2/25/01
upport line

W. Clay Allen CFA Page 34 2/25/01
RAD
45-degree bearish resistance line
45-degree bullish support line

W. Clay Allen CFA Page 35 2/25/01
SEBL
45-degree bearish resistance line
45-degree bullish support line

W. Clay Allen CFA Page 36 2/25/01
SUNW
45-degree bearish resistance line
45-degree bullish support line
The long-term bullish support line on this stock persisted for several years. When the break of this trendline finally occurred it was highly significant.

W. Clay Allen CFA Page 37 2/25/01
VRSN
45-degree bearish resistance line
45-degree bullish support line

W. Clay Allen CFA Page 38 2/25/01
VRTS
45-degree bearish resistance line
45-degree bullish support line

W. Clay Allen CFA Page
WCOM
e
45-degree bullish support lin
A succession of 45-degree bulsignificant top. It is often a mithat the stock won’t go any lomust be treated with respect. Ireally surprise investors on ttendency for investors to und
Shallow conventional downtrend lin
39 2/25/01
e
lish support line failures usually indicates a stake to believe that the damage is done and wer. As long as the trend is headed down it n my experience, these downtrends can he downside. There seems to be a universalerestimate the downside risk.

W. Clay Allen CFA Page 40 2/25/01
XRX
45-degree bearish resistance line
45-degree bullish support line

W. Clay Allen CFA Page 41 2/25/01
YHOO
45-degree bearish resistance line
45-degree bullish support line

W. Clay Allen CFA Page 42 2/25/01
Examples – Trendless Patterns – Trading Ranges
CRTK
A trendless, trading range stock almost needs no explanation. It should be sold as it approaches the old relative strength high and possibly bought when it approaches the low. The extremes of the past few years will define the boundaries of the trading range. The distribution of returns from common stocks suggests that most stocks are in trading ranges most of the time. Somewhere between 60% and 70% of all stocks are in trading ranges all the time. This is especially true for large mature companies whose business has settled down into a more or less stable pattern.

W. Clay Allen CFA Page 43 2/25/01
FLEX
The heavy black lines represent the upper and lower boundaries of the trading range. Itseems that long-term relative strength charts in point & figure format are ideal for the analysis of trading ranges.

W. Clay Allen CFA Page 44 2/25/01
IBM
This stock has a wide trading range at almost 25 boxes on the relative strength P&F chart. It seems to offer considerable opportunity for performance, just by moving from one extreme to the other.

W. Clay Allen CFA Page 45 2/25/01
LLTC
This stock has a more representative width for its trading range at about 15 boxes. Not a lot of potential in the trading range for this stock.

W. Clay Allen CFA Page 46 2/25/01
LOW
This is another example of a fairly wide trading range. The width of the trading range and the extremes offers a method to estimate upside potential and downside risk.

W. Clay Allen CFA Page 47 2/25/01
ORCL
This is an example of a trading range that may turn out to be a major top. After a big move up the sideways movement sets up a trading range but a downside break below the lower boundary of the trading range should be considered to be a very negative development. It is too early to tell but a drop to row E or below would be a powerful sell signal.

W. Clay Allen CFA Page 48 2/25/01
MXIM
The best approach is to buy at the lower boundary of the trading range and to sell at the upper boundary. If the relative strength should breakout beyond the boundary by a significant amount the position should be reversed quickly. Trading ranges are not a guarantee of success but the odds favor entry and exit at the extremes of the range.

W. Clay Allen CFA Page 49 2/25/01
TLAB
It seems that breaking down from a trading range is a more likely development than an upside breakout. If the stock is purchased at the low end of a trading range then the portfolio manager must be willing to reverse the position on a downside failure from the trading range.

W. Clay Allen CFA Page 50 2/25/01
WMT
This is another example of a more-or-less mature stock in a long-term trading range.

W. Clay Allen CFA Page 51 2/25/01
Examples – Major Long-term Uptrends
AAS
45-degree bullish support line
The years are shown at the top of each chart. These examples have been chosen to illustrate the long-term persistence of these trends.
Most of the following examples of major long-term uptrends were chosen because of the extreme nature of the upside movements. These stocks were among the top performing stocks of the prior year. These examples show how stocks can move dramatically when they reach theright-hand tail of the distribution of returns.

W. Clay Allen
COLM
45-degree bullish support line
This stock based out and turned up in mid ’99. It has consistently remained above the 45-degree bullish support line ever since. Clearly it will “Top- out” someday but there are no signs of a topat this time.
CFA Page 52 2/25/01

W. Clay Allen CFA Page 53 2/25/01
CPN
45-degree bullish support line
This uptrend probably started in ’98 and has continued to outperform the S&P 500 by a large margin. Significant corrections have occurred but the stock has remained bullish.

W. Clay Allen CFA Page 54 2/25/01
EOG
45-degree bullish support line
This uptrend started in late ’99 or early 2000. The relative strength chart shows repeated upside breakouts above 45-degree bearish resistance lines.

W. Clay A
HSE
45-degree bullish support line
This stock based out and turned up in early ’99 and it demonstrates theimportance of the 45-degree bullish support lines.llen CFA Page 55 2/25/01

W. Clay Allen CFA Page 56 2/25/01
IFIN
45-degree bullish support line
The bullish trend was repeatedly confirmed by upside breakouts above 45-degree bearish resistance lines.

W. Clay Allen CFA Page 57 2/25/01
LH
45-degree bullish support line

W. Clay Allen CFA Page 58 2/25/01
MND
45-degree bullish support line

W. Clay Allen CFA Page 59 2/25/01
RHB
45-degree bullish support line
The base on this stock required over a year to complete but it preceded a major long-term bullish trend.

W. Clay Allen CFA Page 60 2/25/01
RJR
45-degree bullish support line

W. Clay Allen CFA Page 61 2/25/01
ROIL
45-degree bullish support line

W. Clay Allen CFA Page 62 2/25/01
RYL
45-degree bullish support line
The recent major bullish move was preceded by a long-term bearish trend that lasted for over two years.

W. Clay Allen CFA Page 63 2/25/01
SEIC
45-degree bullish support line
This is an example of a more volatile NASDAQ stock that has been in an uptrend for a little more than a year. The volatility creates more back and forth movement on the chart.

W. Clay
SFY
45-degree bullish support line
The transition from a long-term bearish trend to a long-term bullish trend usuallyrequires an extended period of sideways movement, which is referred to as a base. Major bases may take as long as several years to complete.Allen CFA Page 64 2/25/01

W. Clay Allen CFA Page 65 2/25/01
SGR
45-degree bullish support line
This uptrend started in late ’98. The transitional basing period shows clearly.

W. Clay Allen CFA Page 66 2/25/01
TBL
45-degree bullish support line
This example shows an upside breakout from an extended trading range.
Upper boundary of trading range

W. Clay Allen CFA Page 67 2/25/01
TLB
45-degree bullish support line

W. Clay Allen CFA Page 68 2/25/01
Summary and Conclusions This section of the tutorial was constructed to demonstrate the usefulness of long-term technical analysis to managers of long-term investment portfolios. The long-term relative strength in point and figure format helps the portfolio manager achieve positive turnover by holding winners and identifying and selling losers. The emphasis should be on the sell decision, which is primarily a technical analysis function. The buy decision should remain primarily a fundamental analysis function. The users of the Market Dynamics System will benefit from the clarity and simplicity of the presentation that damps out noise and meaningless price variation and lets the more important long-term trends show through. This approach facilitates adaptation to changing conditions and reduces the performance costs of prediction errors. It provides a method to successfully implement the recommendations of The Loser’s Game. W. Clay Allen CFA
To Return to the tutorial Market Dynamics Tutorial.pdf 303-804-0507 or FAX @ 303-804-0513 http://www.clayallen.com/