technical analysis explained - mta.org · pdf file1. prices are determined by psychology,...
TRANSCRIPT

Presented by
Technical Analysis Explained
Martin J. Pring
www.pring.com

1. Prices are determined by psychology, people’s attitude to the emerging fundamentals not the fundamentals themselves.
2. Keep things simple and apply common sense at all times.
3. Only use approaches that make sense to you.
Three Points to Take Home.
www.pring.com
2 3
4
1
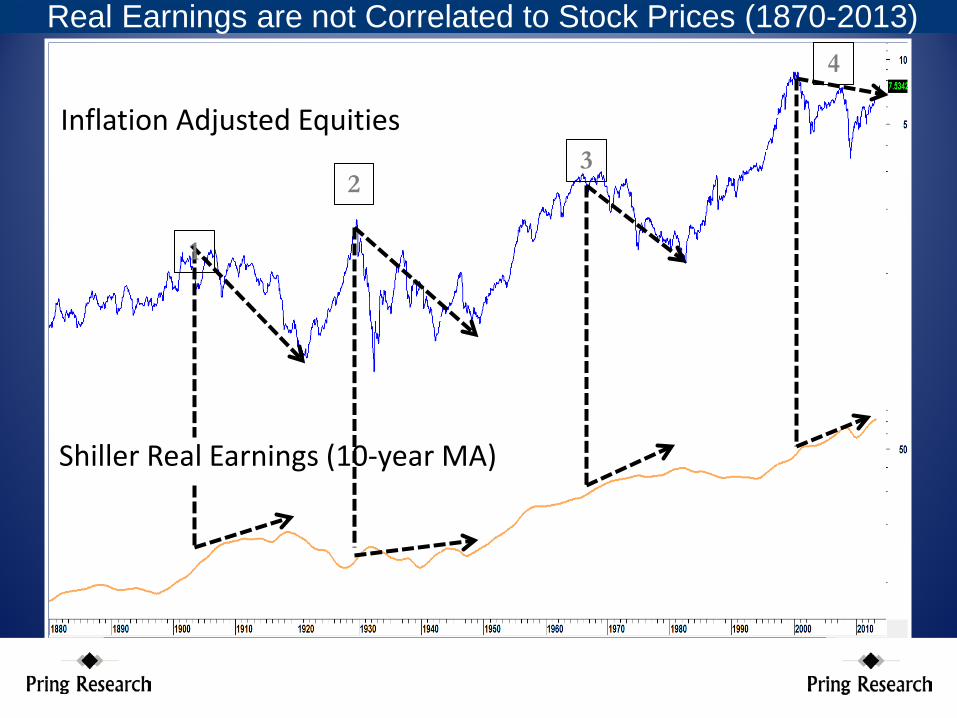
Real Earnings are not Correlated to Stock Prices (1870-2013)
Inflation Adjusted Equities
Shiller Real Earnings (10-year MA)

CPI Adjusted S&P Composite
Shiller P/E
Deflated US Stock Prices versus Shiller P/E Ratio1900-2013
??
Deflated US Stock Prices

Definition of Technical Analysis:
The art of identifying a price trend reversal at a relatively early stage and riding on that trend until….
….the weight of the evidence
shows or proves that the trend has reversed.
www.pring.com

In technical analysis we are dealing in probabilities, never certainties.
www.pring.com

The hopes and fears of all market participants are reflected in one thing ….the price !!
www.pring.com

Technical analysis assumes that prices move in trends.
www.pring.com

Trends have a tendency to perpetuate because...
www.pring.com

Prices in any freely traded market are determined by the attitude of all market participants to the underlying fundamentals.
www.pring.com
“A trend is a trend is a trend.”
Always assume the prevailing trend is in existence.
www.pring.com
There is no known technique for determining the duration and exact magnitude of a price move. We can only recognize a change in direction.
www.pring.com

It doesn’t matter what time frame you are following...
…the principles of technical analysis remain constant.
www.pring.com

The only difference is…
…the longer the time frame, the greater the significance of any given trend reversal.
www.pring.com
It doesn’t matter what security you are following...
…the principles of technical analysis remain constant.
If human nature ever changes technical analysis will die!!
www.pring.com

Trends
www.pring.com

What is a trend?
www.pring.com

Primary trend 9 months to 2 years
Short-term trend 2 to 6 weeks
Intermediate trend 6 weeks to 9 months
Market Cycle Model
Source: Yelton Fiscal
www.pring.com
3-4-years

Short-term trend 2-6-weeks
Now Becomes….
Market Cycle Model
www.pring.com
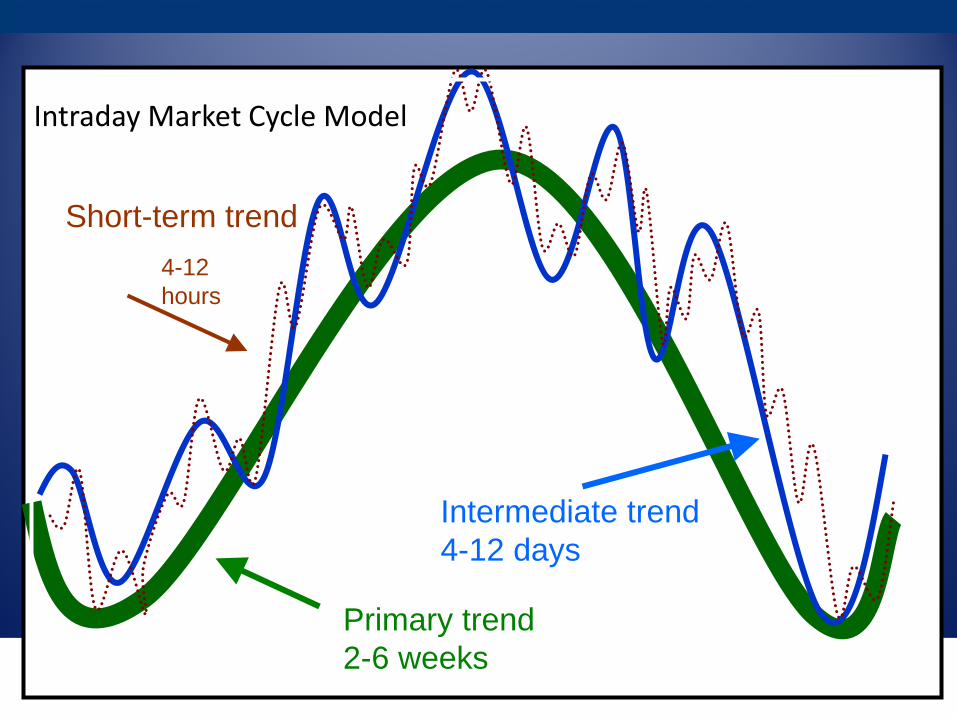
Short-term trend 4-12 hours
Intermediate trend 4-12 days
Primary trend 2-6 weeks
Intraday Market Cycle Model

Psychology and Momentum
www.pring.com

Keycorp
Earnings up
Earnings up
Earnings
Keycorp
Price down

Earnings up
Earnings
Keycorp
Price down
Earnings up
Keycorp

Ebay
Ebay Earnings
Price sideways to down
Earnings Up
www.pring.com
Ebay
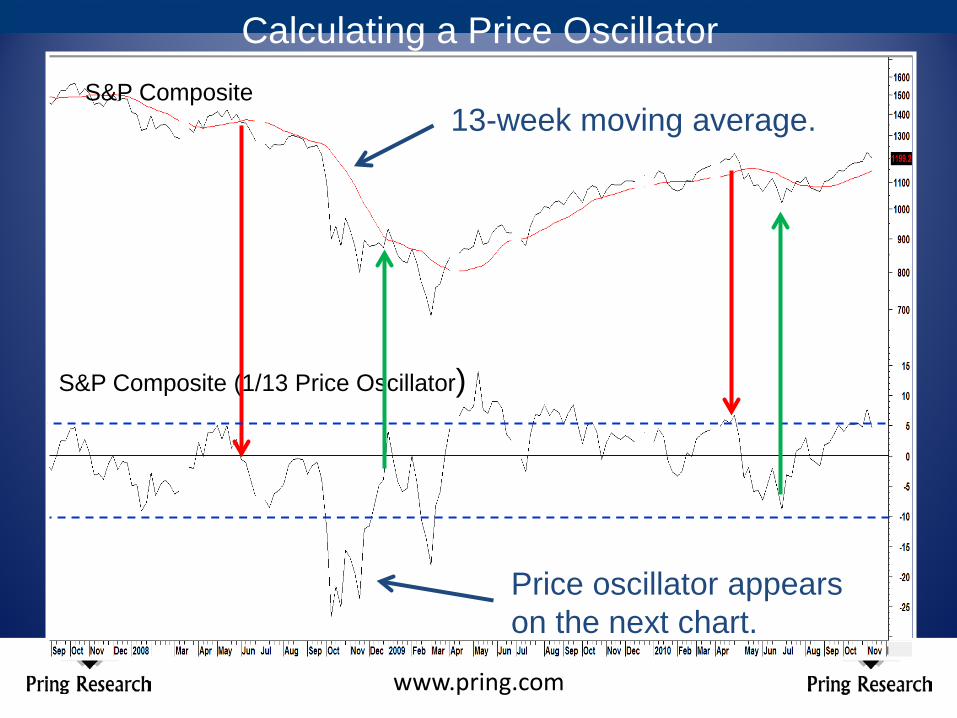
S&P Composite (1/13 Price Oscillator)
S&P Composite 13-week moving average.
Calculating a Price Oscillator
Price oscillator appears on the next chart.
www.pring.com
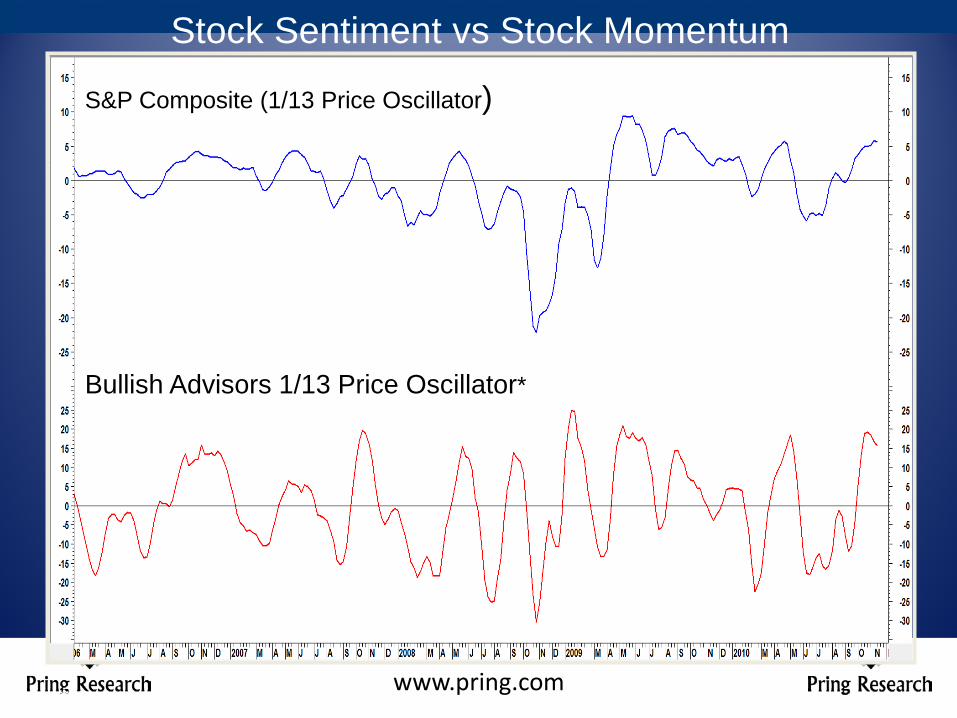
Bullish Advisors 1/13 Price Oscillator*
S&P Composite (1/13 Price Oscillator)
* Source Investors Intelligence.com
Stock Sentiment vs Stock Momentum
www.pring.com

S&P momentum
Bullish advisors momentum
Stock Sentiment vs Stock Momentum
www.pring.com

Govt Bond Prices)
Bond Bulls (10-week MA)*
14-week RSI (10-week MA)
Bond Sentiment vs Bond Momentum
*Source Market Vane www.pring.com
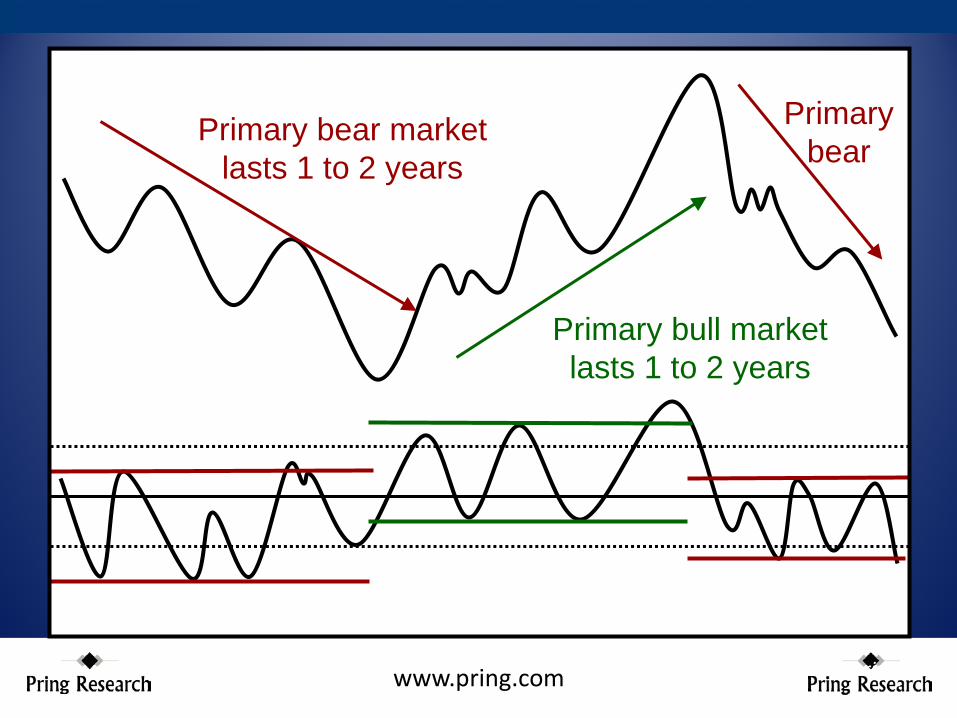
Primary bear market lasts 1 to 2 years
Primary bear
Primary bull market lasts 1 to 2 years
www.pring.com www.pring.com

Oversold in a bull market . . .
. . . means that the price will very likely rally.
www.pring.com www.pring.com

Overbought in a bear market . . .
. . . probably means the top of the rally.
www.pring.com www.pring.com

Followed by a trading range
Overbought in a bull market
www.pring.com www.pring.com

Followed by a trading range
Oversold in a bear market
www.pring.com www.pring.com

Doesn’t necessarily result in much of a rally
Oversold in a bear market
www.pring.com www.pring.com

Goldman Sachs Commodity Index Bull trend
Bear trend 30-day ROC
Bear trend Extreme overbought is a bull market characteristic
www.pring.com www.pring.com
Goldman Sachs Commodity Index

Goldman Sachs Commodity Index
30-day ROC
Extreme overbought is a bull market characteristic
www.pring.com www.pring.com
Goldman Sachs Commodity Index

Psychology and One and Two Bar Price Patterns
www.pring.com

Outside bars
www.pring.com
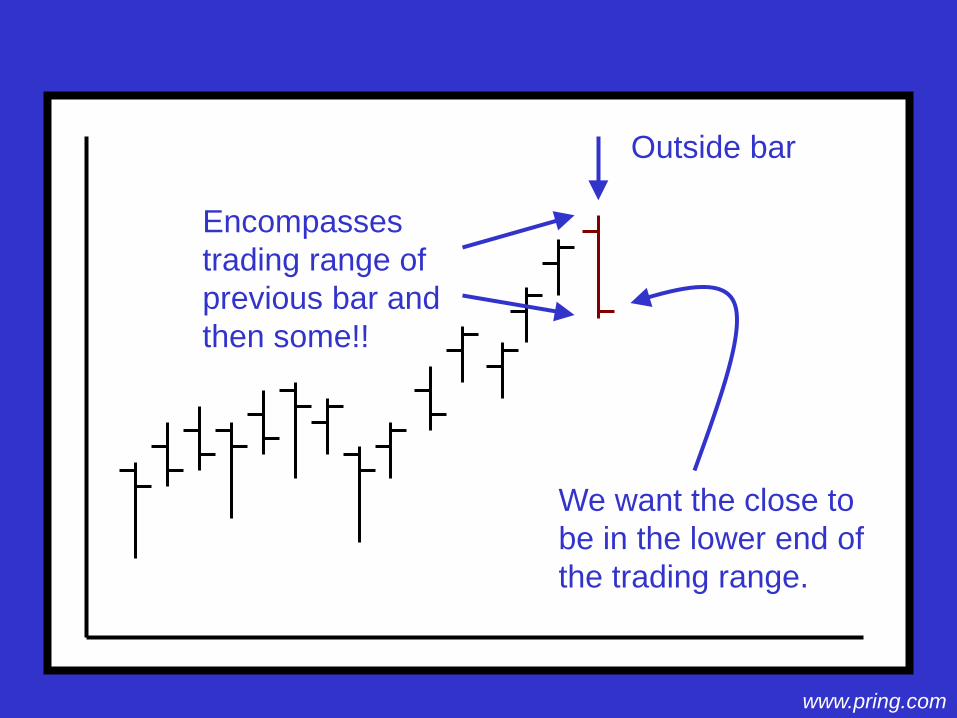
Encompasses trading range of previous bar and then some!!
We want the close to be in the lower end of the trading range.
www.pring.com
Outside bar

Encompasses trading range of previous bar and then some!!
Close should be in the upper part of the range.
www.pring.com
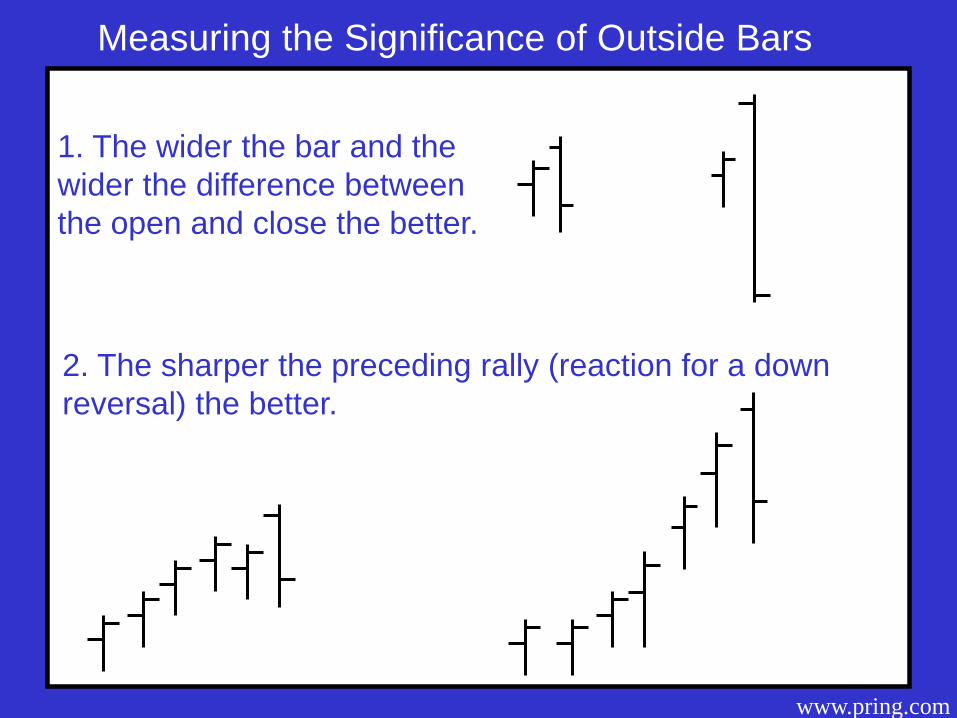
Measuring the Significance of Outside Bars
1. The wider the bar and the wider the difference between the open and close the better.
2. The sharper the preceding rally (reaction for a down reversal) the better.
www.pring.com

Bank of India Outside bar
Bank of India Daily
www.pring.com

Two Bar Reversals

Sharp rally
www.pring.com

www.pring.com
Closes near the high
First bar opens near the low.

www.pring.com
Second bar opens near the high
Closes near the low

Resistance zone The lower the resistance zone the better.
www.pring.com

CRB Composite Two bar reversal
www.pring.com www.pring.com

Look at Different Time Frames
www.pring.com

December 2006 British Pound IMM
10-minute bar
False breakout
www.pring.com www.pring.com

December 2006 British Pound IMM
Hourly bar
Two bar reversal signals false breakout
www.pring.com www.pring.com

December 2006 Dow
30-minute bar
Not much of a reversal signal.
www.pring.com www.pring.com

December 2006 Dow
Hourly bar
Strong two bar reversal
www.pring.com www.pring.com
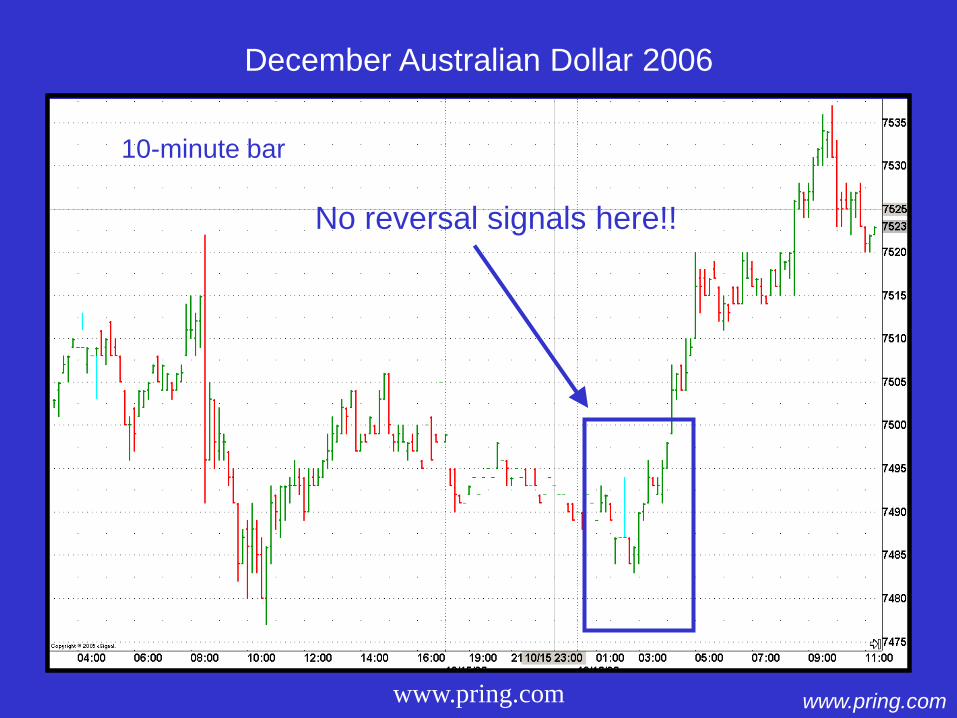
December Australian Dollar 2006
10-minute bar
No reversal signals here!!
www.pring.com www.pring.com

December Australian Dollar 2006
Hourly bar
Two bar reversal
Instant confirmation
www.pring.com www.pring.com

December Australian Dollar 2006
S&P ETF (SPY) Two bar reversal
Outside bar
www.pring.com
Outside bar
www.pring.com

• Strong economy
• Preceded by rising short-term interest rates.
• Rotation already moved to earnings driven sectors. RS momentum of leaders rolling over. • Market breadth leads the way down.
• Net new highs diverge negatively
Partial Checklist for Identifying a Stock Market Peak

• Long-term momentum peaking.
• Confirmed by trendline breaks and negative 12-month MA crossovers.
• Bullish sentiment. Question is no longer if, but when and by how much is the market going higher?
Partial Checklist for Identifying a Stock Market Peak
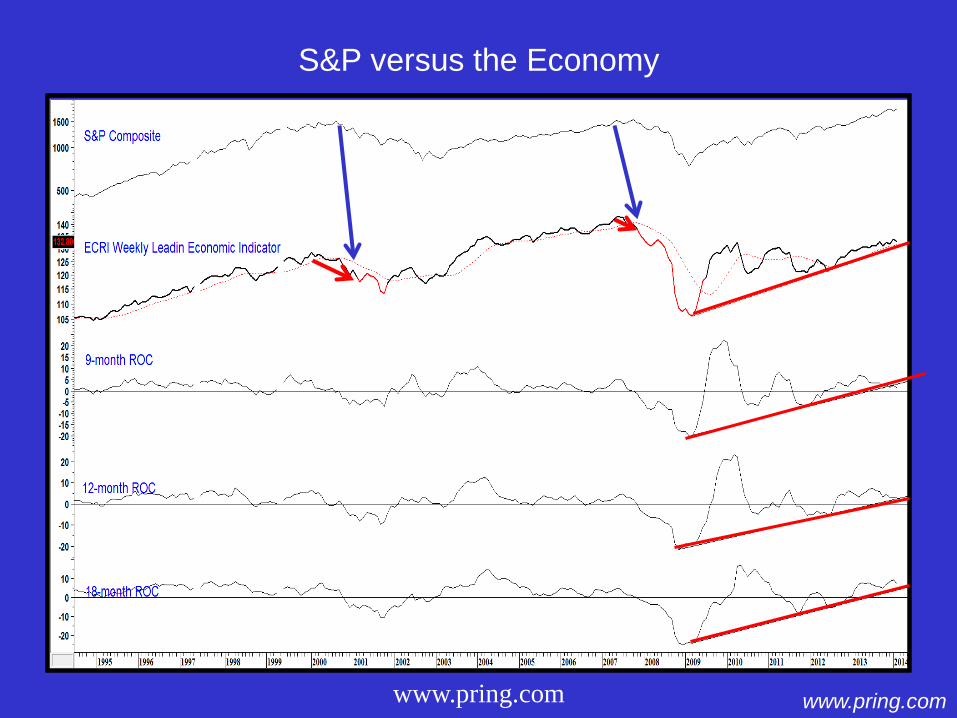
S&P versus the Economy
www.pring.com www.pring.com
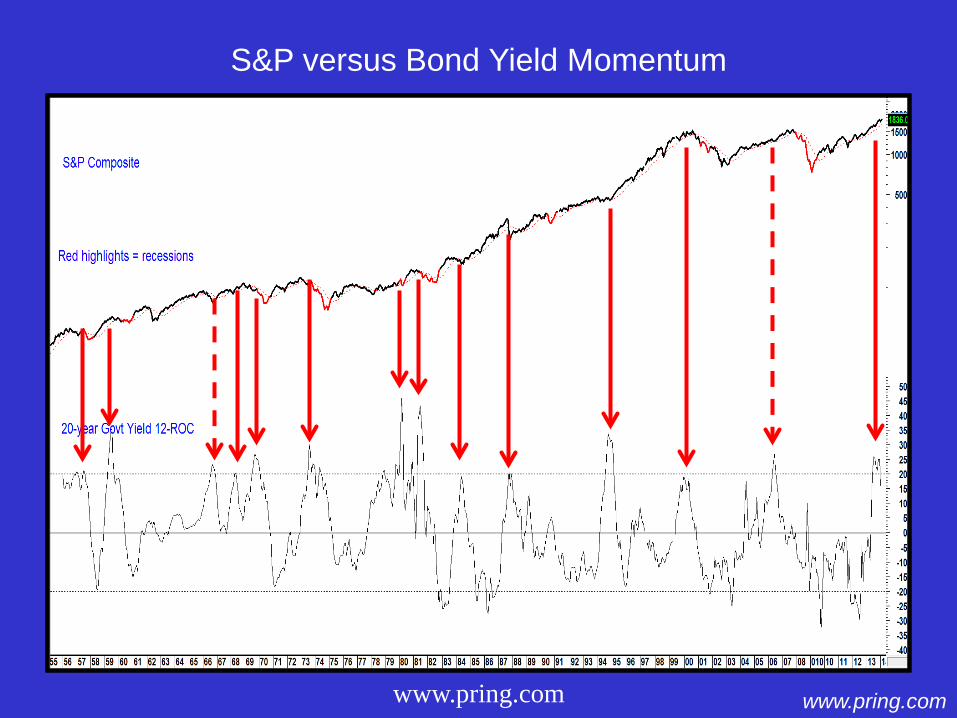
S&P versus Bond Yield Momentum
www.pring.com www.pring.com

Inflation/Deflation Ratio)
KST
Sector Momentum Position August 31 2013
Green highlights show when KST is rising.
www.pring.com

World Stocks versus Long-term Momentum
www.pring.com
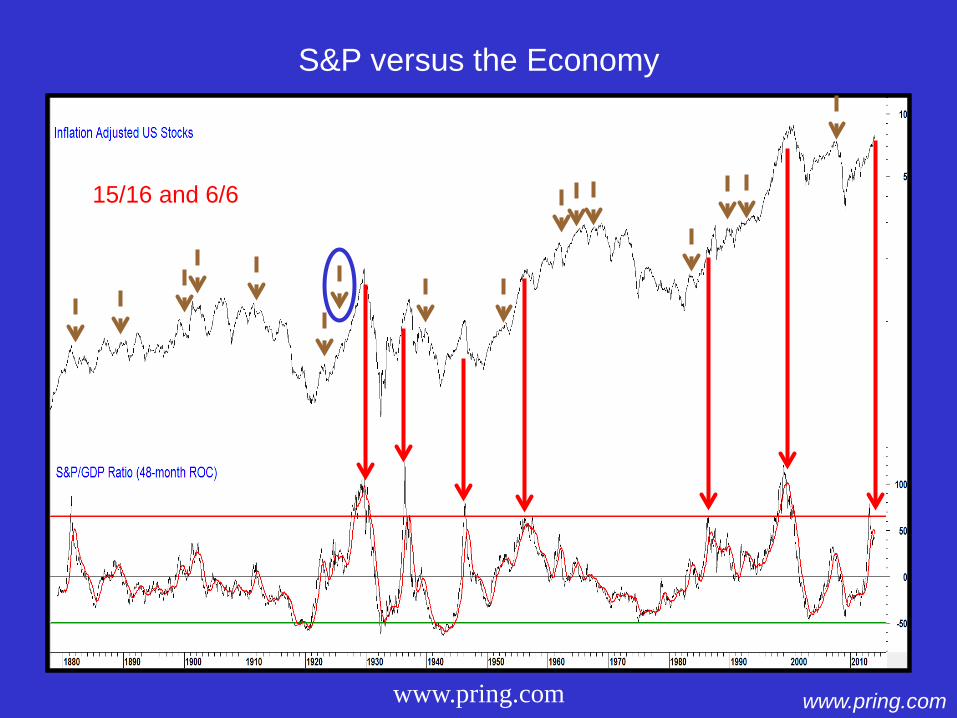
S&P versus the Economy
www.pring.com www.pring.com
15/16 and 6/6

The End
pring.com and pringturner.com
pring.com and pringturner.com
Register for timely articles and chart packs