technical analysis, business cycle, and stock market … 5_2_3.pdf · technical analysis, business...
TRANSCRIPT

Advances in Management & Applied Economics, vol. 5, no.2, 2015, 43-61
ISSN: 1792-7544 (print version), 1792-7552(online)
Scienpress Ltd, 2015
Technical Analysis, Business Cycle, and Stock Market
Returns
Jinpeng Ma1 and Yuming Wang2
Abstract
This article provides nine profitable timing strategies based on the technical analysis of two
specific macroeconomic variables (i.e., capacity utilization rate and unemployment rate).
The success of our strategies is explained by the high persistence in the business cycle,
which allows the two macroeconomic variables to anticipate future business conditions
better than the S&P500 index. Furthermore, they create additional value in timing the
market as the changes in stock prices reflect subsequent changes in business conditions.
JEL classification numbers: C53, E44, G14
Keywords: Technical analysis, Business-cycle forecasting, Market timing using real
variables
1 Introduction
In a pioneering work, Levy (1966, pp.83) summarizes the technical theory as follows:
“1. Market value is determined solely by the interaction of supply and demand. 2. Supply
and demand are governed by numerous factors, both rational and irrational. […]. 3.
Disregarding minor fluctuations in the market, stock prices tend to move in trends, which
persist for an appreciable length of time. 4. Changes in trend […] can be detected sooner or
later in the action of the market itself.”
Unfortunately, the theoretical foundation laid out by Levy (1966) has been subject to
extensive critiques. Academic researchers tend to hold views that differ from those of the
chartist. Particularly, advocates of the random walk hypothesis argue that the time series of
stock returns has no reliable trends. The past price history of the stock market cannot
provide any meaningful information that investors can utilize to achieve superior returns.
1Department of Economics, Rutgers University-Camden, New Jersey, 08102, USA. 2School of Finance, Shanghai University of Finance and Economics (SHUFE), Shanghai, 200433,
China.
Article Info: Received : November 20, 2014. Revised : December 19, 2014.
Published online : March 5, 2015

44 Jinpeng Ma and Yuming Wang
Fama (1965, pp.59) makes an excellent point in this aspect: “If the random walk model is
a valid description of reality, the work of the chartist, like that of astrologer, is of no real
value in stock market analysis.”
A natural question arises. Is it possible to accommodate the technical analysis with the
random walk hypothesis? Indeed, is it possible to achieve a superior performance using
technical analysis even if investors are rational? In this paper, we explore such a possibility
by reexamining the vital link between the business cycle and stock market returns.3
Our paper is based on two well-known facts. First, it is well known that the long-term stock
returns have to reflect the changes in business conditions, which affect the expected cash
flows and returns, although the short-term stock returns may be affected by both rational
and irrational factors. Second, with few exceptions, once a recession or expansion begins,
it will last for a period of time.4
Given the vital link between the stock market and business conditions, the high persistence
in the business cycle delivers us a novel idea for timing the stock market by identifying the
turning points in business conditions. The success of a typical timing strategy may be
illustrated by the following analysis. If we identify the trough and the peak at month t1 +
m1 and t1 + k + m1, respectively, for an actual expansion period from month t1 to t1 + k, then
we successfully predict the future business conditions of k - m1 months consecutively from
month t1 + m1 to t1 + k. Under the assumption that the stock market leads the future business
conditions by n months, we can successfully time the stock market by k - m1 – n months
from t1 + m1 to t1 + k –n. If k (the duration of persistence in business conditions) is
substantially large and n (the time lead of stock market to the business conditions) and m1
(the time lag of the identified turning points to the actual ones) are relatively small, then it
is possible to form some investment strategies to successfully time the stock market over a
substantially long sample period.
For example, the expansion spanning 1991-2001 began in March 1991 and ended in March
2001. Our representative model identifies the trough in July 1991 and the peak in May 2001,
demonstrating that our model successfully predicts future business conditions of 117
months consecutively from July 1991 to March 2001. Under the empirical fact that the
stock market leads future business conditions by 9 months, the model has superior
predictability to the stock market over the 107 months from July 1991 to May 2001 and it
can successfully time the stock market during these periods of time.
It should be noted that timing the market is not the sole purpose of this paper. We hope to
reveal a new perspective on how stock returns are related to fundamentals and the business
cycle. Moreover, the timing strategies’ success or failure can demonstrate if the
3Motivated by the widespread use of technical analysis in industry practice, academic researchers
have been trying to test the performance of numerous technical trading rules against the market
efficiency hypothesis. The majority of the studies in this area focus on analyzing the financial trading
data without any reasonable attention assigned to the fundamentals. The discrepancy between
technical analysis and fundamental analysis has been dramatically described as the difference
between astrology and astronomy. In this article, we distinguish ourselves from the typical chartist
by switching the attention from financial trading data to fundamentals. See Park and Irwin (2007)
for a review on the profitability of technical trading rules. 4According to the statistics released by the National Bureau of Economic Research (NBER), there
were 33 recessions and expansions of the U.S. economy during the period of 1854 to 2009. Each
recession lasted an average of 16 months, and each expansion lasted an average of 42 months.
Technical Analysis, Business Cycle, and Stock Market Returns 45
predictability of our technical analysis of the fundamentals has passed the test of the equity
market.
We summarize our idea into three theoretical hypotheses by rewriting the technical theory
in Levy (1966) as follows:
1). The stock market in the long term has to reflect the changes in business conditions, but
it cannot precisely lead the future business conditions without a limit (i.e., n is nonnegative
but relatively small).
2). Business conditions have a high degree of persistence. A(n) recession or expansion,
once it begins, will last for a period of time (i.e., k is substantially large).
3). The persistence of the business conditions can be captured by some variables, and the
turning points in the business conditions can be detected by these variables in a relatively
timely way (i.e., m1 and m2 have small absolute value).
All the theoretical hypotheses listed above are independent of random walk hypothesis. The
stock returns can reflect the fundamentals in a random-walk or nonrandom-walk way.
Furthermore, distinguished from the typical practice of chartist, we do not forecast the
trajectory of the market or the expected returns, which remains unknown throughout our
nine timing strategies. Instead, we aim to find fundamental variables that can provide us
useful information about when the economy is about to change a direction. Although the
specific time when the market makes a turn is not necessarily coherent with the time the
economy is about to turn, the two points should be closely related if the stock market
reflects the changes in business conditions over a relatively long horizon. Therefore, the
predictability of the turn of the market is accomplished to the extent that there is
predictability of the turn of aggregate economic activities. The critical procedure for
successfully implementing such an idea of predicting the stock returns is to identify some
variables that can consistently capture the nature of business cycle persistence.
Our research methods also differ from the existing literature in terms of predicting the
expected returns of equity. Most researchers in this area employ financial variables to
forecast stock returns,5 while applying an important hypothesis on how expectations may
be formed. Because there is no direct data on expectations, the predictability of these
financial variables is not necessarily driven by the expected future economic activity
(Campbell and Diebold, 2009). Speculative elements may well be important at equilibrium;
however, there are other objections as well. Ferson et al. (2003) document that many of the
regressions used to predict stock returns in the literature may be spurious. Timmermann
(2001), Rapach and Wohar (2006), Pesaran and Timmermann (2002) and Hartmann et al.
(2008), among others, claim that the relationship between stock returns and predictor
variables may be subject to structural breaks, which put the reliability of the predictive
power of the related regression models into question. In this paper, we avoid these obstacles
by exploring macroeconomic, not financial, variables in a nonparametric way to identify
the economic turning points and time the stock market.
Dotsey and King (2005) and Alvarez-Lois (2006) provide some sophisticated models that
use endogenous real variables in the form of variable capacity utilization, labor supply
5Noted examples can be found in Keim and Stambaugh (1986), Campbell (1987), Campbell and
Shiller (1988), Fama and French (1988, 1989), among others. Furthermore, Chordia and Shivakumar
(2002) and Avramov and Chordia (2006), among others, build a business cycle model with financial
variables to resolve certain financial anomalies which are considered to contradict the market
efficiency.
46 Jinpeng Ma and Yuming Wang
variability, and materials inputs to explain the high persistence in business conditions. They
argue that “these real flexibilities considerably reduce the elasticity of the marginal cost
with respect to output and thus lead to more gradual price adjustment, which in turn implies
greater persistence in business conditions.” Indeed, we find from the historical data of the
U.S. economy (see Figure 1 and Table 1) that the variation of the unemployment rate is
useful for determining if an expansion is about to end, and the variation of the capacity
utilization rate is useful for determining if a recession is over.6 Therefore, we use the
information embodied in the unemployment rate to identify the peak point(s) of a business
cycle, and we use the information embodied in the capacity utilization rate to identify the
trough point(s). Our nine timing strategies are designed accordingly. A typical timing
strategy of ours is to sell the S&P500 stock price index and buy the 1-month treasury bill
once the peak point(s) have been identified and vice versa. With an initial investment of
one dollar, the terminal values of these nine strategies—over the 40-year period from 1970
to 2009 with monthly compounding returns—range from 18.44 to 26.78. In contrast, the
terminal value of the passive buy-and-hold strategy of the S&P500 stock price index over
the same period is 12.11. The profitability of the nine strategies remains robust over
different periods from 1980-2009, 1990-2009, and 2000-2009. Furthermore, our various
tests, including the reality check for data snooping, have shown that our strategies have
successfully timed the S&P500 index across different time periods.
2 Data Description and Economic Implication
The data employed in this article are obtained from the CRSP (Center for Research in
Securities Prices) and the FRED (Federal Reserve Economic Data) at the Federal Reserve
Bank of St. Louis. The capacity utilization rate and the civilian unemployment rate are
monthly data. Because the unemployment rate and the capacity utilization rate are released
on different dates by the Federal Reserve System and the U.S. Department of Labor, the
monthly returns on our timing portfolios are calculated from the daily return data on the
S&P 500 stock price index and the 1-month T-bill. To emphasize the issue of real-time data,
we replace the revised capacity utilization rate data currently available on the FRB website
with the real-time data from 1983 to 2009.7 All of the empirical results are robust regarding
whether we use the real-time data or not because the revisions on the capacity utilization
rate and the unemployment rate are usually minor.
6 The labor market performs very differently before and after a recession. This should be a key to
understanding the causes of the business cycle. 7 We thank senior economist Charlie Gilbert at the Federal Reserve Bank and economist Eleni
Theodossiou at the Bureau of Labor Statistics for providing key information such as the release dates
and some real-time data on the capacity utilization rate and the release dates on the unemployment
rate, which enable us to implement our timing strategies in a more practical way.

Technical Analysis, Business Cycle, and Stock Market Returns 47
Figure 1: The Capacity Utilization Rate, the Unemployment Rate, and the Business Cycle
Dates Identified by the NBER (Recessions are the Shaded Areas) from 1970-2009.
Figure 1 describes the capacity utilization and the unemployment rates against the business
cycle reference dates identified by the NBER from 1970 to 2009. The shaded areas are the
recessions announced by NBER. It shows that the capacity utilization rate starts to climb,
with rare hesitations, when a recession is over. The unemployment rate goes down with
very low volatility during an expansion until the expansion nears its end. The peak and
trough dates of the unemployment rates and the capacity utilization rates of each recession
since 1970 as well as the reference dates of the NBER are provided in Table 1. The analysis
in Table 1 reveals that the unemployment rate reaches its bottom for each expansion earlier
than the starting date of its subsequent recession, and the capacity utilization rate reaches
its bottom for each recession just slightly later than the starting date of its subsequent
recovery.
Capacity Utilization Rate
Unemployment Rate

48 Jinpeng Ma and Yuming Wang
Table 1: Dates of Troughs and Peaks of the NBER Business Cycle, the Capacity
Utilization Rate and the Unemployment Rate
Troughs Announced by NBER Troughs of CUR Peaks of UR
November-70 November-70 August-71
March-75 May-75 May-75
July-80 July-80 July-80
November-82 December-82 November-82
March-91 March-91 June-92
November-01 December-01 June-03
June-09 June-09 October-09
Peaks Announced by NBER Peaks of CUR Troughs of UR
November-73 February-73 October-73
January-80 December-78 May-79
July-81 December-80 December-80
July-90 January-89 March-89
March-01 December-94 April-00
December-07 April-07 October-06
Why does the U.S. economy behave in such a manner? We provide a simple model to
explain such behavior. Let F(µK, L) be the production function of the economy, where K is
the stock of (business fixed and residential) capital, L is the units of labor, and µ is the
capacity utilization rate. Consider a dynamic process under which the economy makes a
turn from its expansion to contraction. There are three possible adjustments for the economy
to make in the short-run: a). reduction in the stock of capital K; b). reduction in µ; and c).
reduction in L. Because the capital is typically irreversible in the short run, the other two
reductions in b) and c) are possible. To determine why firms are willing to reduce L in
response to a contraction in production output, we write down the economic profit function
F(µK, L)-wL-(d(µ)+r) pkK, where w is the real wage, r is the expected real interest rate,
pk is the real price of a unit capital, and d(µ) is the rate at which capital depreciates. Assume
that d´(µ)>0 and d´´(µ)>0. It is reasonable to assume that d´(µ) is close to zero for some
low level µ, which may be considered as an endogenous variable at certain range (see
Alvarez Lois (2006) and Dotsey and King (2006) for detail). Assume that w and r are rigid
in the short run. Thus, firms choose µ such that F´1(µK,L)=d´(µ) pk and L such that
F´2(µK,L)=w. As the economy starts to contract, we will see a decline in µ and L at the
same time, at least in the short-run. If a contraction lasts for a sustainable period, we will
see sustainable reductions in µ and L. Note that at a high level µ, a decline in µ does not
necessarily imply that the economy will start to contract. This implies that the
unemployment rate is left as a reliable indicator for timing if an expansion is about to end.
On the other hand, as the economy recovers from a recession, we expect that µ stays at a
low level so that d´(µ)pk is close to zero. Firms raise µ without a significant increase in
the marginal costs (Alvarez Lois, 2006; Dotsey and King, 2006). Therefore, as the
aggregate demand recovers by the end of a recession, we should be able to see a rise in µ.
Note that there is no guarantee that the unemployment rate also makes a turn as the capacity
utilization rate does, as the economy may well experience a “jobless recovery.” Note also
that firms may not increase the stock of capital at the very early stages of a recovery. As a
result, the capacity utilization rate provides a reliable variable to time when a recession is
Technical Analysis, Business Cycle, and Stock Market Returns 49
about to end. As the recovery continues, the economy will eventually start to generate jobs
because a increase in µ cannot continue indefinitely without raising the cost d´(µ)pk. The
analysis here is embarrassingly simple, although it may yet be far from the reality.
Importantly, the model fits the empirical evidence in Figure 1 and Table 1 extremely well.
Thus, we find that the unemployment rate provides valuable information regarding the time
when an expansion is about to end, but it is less informative about the time when a recession
is over. Interestingly, the capacity utilization rate is very informative about the time when a
recession is over, but it is less informative about the time when an expansion is over.
Therefore, we use the information embodied in the unemployment rate to identify the peak
point(s) and the information embodied in the capacity utilization rate to identify the trough
point(s). Our market timing strategies are based on this disparity of the two rates in their
predictability of the business cycle.
3 Description of Timing Strategies
Forecasting future business conditions has been an exciting topic for researchers, see,
among others, Harvey (1988, 1989), Stock and Waston (1989,1991), Estrella and
Hardouvelis (1991), Friedman and Kuttner (1994), Chauvet (1998), Estrella and Mishkin
(1996), Kim and Nelson (1998), Chauvet and Potter (2005), Chauvet and Hamilton (2006),
Chauvet and Piger (2008) and Espinoza, Fornari and Lombardi (2011).8 However, most of
these studies employ financial variables and parametric methods to forecast future business
conditions. They do not address if the predictability of their models is sufficient to
successfully time the stock market and achieve superior returns. This article focuses on the
use of macroeconomic variables and how the information withdrawn from them can be used
to time both the trough and the peak of a business cycle. In the perspective of business cycle
persistence, the predictability of business conditions is used to design the market timing
strategies.
Specifically, we set up a non-parametric method to identify the peak or trough of a business
cycle by following certain criteria.
Identify a Peak: Define DUR by
DUR(p) = URp – min(URm, URm+1, …, URp)
where URν is the observed unemployment rate at time v, v=m, m+1, …, p, and m is the
month of the nearest maximal point of the unemployment rate curve. Let DUR be a given
threshold value of the unemployment rate. Suppose that DUR(p)>DUR̅̅ ̅̅ ̅̅ at time p* for the
first time. If k is the month such that URk = min(URm, URm+1, …, URp*) where p*≥k≥m
then we say that the unemployment rate reaches its local bottom at month k. If the
unemployment rate rises from its bottom at month k by more than the threshold value of
DUR̅̅ ̅̅ ̅̅ , then the unemployment rate starts to reverse from a downward trend to an upward
trend. We say that the economy is recessionary once the month k has been identified.
8 See Hamilton (2010) for an excellent survey on most of these papers.

50 Jinpeng Ma and Yuming Wang
Identify a Trough: Define DCUR by
DCUR(t) = CURt − min(CURn, CURn+1, … , CURt )
where CUR𝑣 is the observed capacity utilization rate at time v, v=n, n+1, …, t, and n is
the month of the nearest maximal point of the capacity utilization rate curve. Let DCUR̅̅ ̅̅ ̅̅ ̅̅
be a given threshold value of the capacity utilization rate. Suppose that DCUR(t)>DCUR̅̅ ̅̅ ̅̅ ̅̅
at time t* for the first time. If j is the month such that CURj =
min(CURn, CURn+1, … , CURt∗), where t*≥j≥ n, then we can infer that the capacity
utilization rate reaches its local bottom at month j. If the capacity utilization rate rises from
its bottom at month j by more than the threshold value of DCUR̅̅ ̅̅ ̅̅ ̅̅ , then the capacity
utilization rate starts to return from a downward trend to an upward trend. We say that the
economy is in recovery once the month j has been identified.
Timing Strategies: A market timing strategy is based on the S&P500 stock price index and
the 1-month T-bill. Note that p* is the month when the economy is first identified to be
recessionary after a proceeding expansion in a business cycle and t* is the month when the
economy is first identified to be in recovery after a proceeding recession. A timing strategy
operates as follows: Once the economy is identified to be recessionary at month p*, we sell
all of our holdings in the S&P500 stock price index and invest our funds in the 1-month T-
bill. We keep our positions in the T-bill until the economy is identified to be in recovery at
month t*. Once the economy is identified to be in recovery at month t*, we sell all of our
holdings in the 1-month T-bill and invest our funds in the S&P500 stock price index.
In this article, we study nine timing strategies by setting DUR̅̅ ̅̅ ̅̅ at 0.4%, 0.5% or 0.6% and
DCUR̅̅ ̅̅ ̅̅ ̅̅ at 0.5%, 1% or 1.5%. It is important to note that these threshold values we choose
for DUR̅̅ ̅̅ ̅̅ and DCUR̅̅ ̅̅ ̅̅ ̅̅ are not the result of data snooping in stock returns, as illustrated in
subsequent sections. Values that are too small for DUR̅̅ ̅̅ ̅̅ or DCUR̅̅ ̅̅ ̅̅ ̅̅ would not capture the
nature of the persistence in business cycle, while values that are too large for DUR̅̅ ̅̅ ̅̅ or
DCUR̅̅ ̅̅ ̅̅ ̅̅ would not forecast the economic turning point in a relatively timely way. Both
small and large values are excluded by the theoretical foundation that we build in the
introduction.
4 Performances of Timing Strategies
Table 2 provides the terminal values of a one dollar initial investment over the 40-year
period from 1970-2009 with monthly compounding returns on the nine timing strategies
described in Section 3. The terminal value 18.44 of the strategy DUR̅̅ ̅̅ ̅̅ = 0.6% and
DCUR̅̅ ̅̅ ̅̅ ̅̅ =0.5% is the least while the terminal value 26.78 of the strategy DUR̅̅ ̅̅ ̅̅ = 0.4%
and DCUR̅̅ ̅̅ ̅̅ ̅̅ =1% is the greatest among all nine strategies. This is in comparison with the
terminal value 12.11 of the passive buy-and-hold strategy of the S&P500 over the same
period. A typical timing strategy DUR̅̅ ̅̅ ̅̅ = 0.5% and DCUR̅̅ ̅̅ ̅̅ ̅̅ =1% over the sample
period of 1970-2009 has been given in Figure 2.

Technical Analysis, Business Cycle, and Stock Market Returns 51
Table 2: Performance of the Timing Strategies over the Period of 1970-2009
DUR̅̅ ̅̅ ̅̅ (%) DCUR̅̅ ̅̅ ̅̅ ̅̅ (%)= 0.5 1 1.5
0.4 Terminal
Value 26.2182 26.7879 20.1895
α 0.0018 0.0019 0.0013
t-stat 1.8630 1.9017 1.3000 β 0.6598 0.6519 0.5660
β1
− β2 0.1840 0.1910 0.0201
F-stat 7.6954 8.1875 0.0830
0.5 Terminal
Value 22.2773 24.0629 21.8286
α 0.0015 0.0016 0.0014
t-stat 1.5291 1.6991 1.4593 β 0.6982 0.6953 0.6360
β1
− β2 0.1328 0.1346 0.0523
F-stat 4.1681 4.2828 0.5924
0.6 Terminal
Value 18.4440 19.9224 24.4911
α 0.0011 0.0012 0.0017
t-stat 1.1179 1.2896 1.7309
β 0.7117 0.7089 0.6846 β
1− β
2 0.1270 0.1288 0.1348
F-stat 3.8987 4.0083 4.2469
Note: The three threshold values in DUR̅̅ ̅̅ ̅̅ (DCUR ̅̅ ̅̅ ̅̅ ̅̅ ) are given in the first column (row).
This provides a combination of nine timing strategies. Both DUR̅̅ ̅̅ ̅̅ and DCUR ̅̅ ̅̅ ̅̅ ̅̅ function as
indicators to determine if the investment should be held in the S&P500 or in the one month
T-bill. If the unemployment rate climbs up from its nearest bottom more than the threshold
value DUR̅̅ ̅̅ ̅̅ for the first time, the investment strategy will be to buy and hold the T-bill. If
the capacity utilization rate climbs up from its nearest bottom more than the threshold value
DCUR ̅̅ ̅̅ ̅̅ ̅̅ for the first time, the investment strategy will be to buy and hold the S&P500 index.
The terminal value presented in the table is the terminal values of a $1 investment on a
strategy over the 40-year period from 1970-2009 with monthly compounding returns The
terminal value of the passive buy-and-hold S&P500 stock price index over the period of
1970-2009 is 12.11. α and β are estimated from regression 1: Rp − Rf = α + β(Rm −
Rf) + ε, where Rp, Rm, and Rf are the returns on the timing strategy portfolio, the S&P500
stock price index and the risk-free asset, respectively β1 and β2 are estimated from
regression 2: Rp − Rf = β0 + β1max(Rm − Rf, 0) + β2min(Rm − Rf, 0) + ε . max(Rm −
Rf, 0) is the bull market risk premium, and min(Rm − Rf, 0) is the bear market risk
premium. β1is the bull-market beta, and β2is the bear-market beta. The t-stat below α is
to test the null hypothesis α = 0, and the F-stat below β1 − β2 is to test the null
hypothesis β1 − β2=0.

52 Jinpeng Ma and Yuming Wang
Figure 2: Performance of the Timing Strategy with DUR̅̅ ̅̅ ̅̅ =0.5 and DCUR̅̅ ̅̅ ̅̅ ̅̅ =1 over 1970-
2009.
Note: We sell the S&P stock index and then buy and hold the 1-month T-bill once DUR̅̅ ̅̅ ̅̅ >0.5
until DCUR̅̅ ̅̅ ̅̅ ̅̅ >1, after which we sell the 1-month T-bill and buy and hold the S&P stock price
index until DUR̅̅ ̅̅ ̅̅ >0.5 of the next business cycle. Shaded areas are the recessions identified
by the NBER. The R-axis is the terminal value of a $1 investment of the timing strategy
with DUR̅̅ ̅̅ ̅̅ =0.5 and DCUR̅̅ ̅̅ ̅̅ ̅̅ =1 over the 40-year period from 1970-2009 with monthly
compounding returns.
Next, we use the market model (Regression 1),
Rp − Rf = α + β(Rm − Rf) + ε
and the Henriksson-Merton model (Regression 2),
Rp − Rf = β0 + β1max(Rm − Rf, 0) + β2min(Rm − Rf, 0) + ε
to test how successful our strategies are in timing the stock returns, where Rp,
Rm and Rf are the returns on the timing strategy portfolio, the stock market portfolio and
the risk-free asset, respectively. In Regression 2, max(Rm − Rf, 0) is the bull market risk
premium and min(Rm − Rf, 0) is the bear market risk premium. β1is the bull-market
beta and β2 is the bear-market beta. The estimates α and β in Regression 1 show
whether a timing strategy can gain positive market risk adjusted returns. A successful
Technical Analysis, Business Cycle, and Stock Market Returns 53
market-timing in Regression 2 requires β1-β2>0.9
Table 2 shows that in Regression 1, all nine strategies have positive excess returns adjusted
by market risk, and the monthly returns on these strategies are less volatile than the market
index of the S&P500 because the estimates of β are all significantly less than 1. In
Regression 2, all nine strategies have strictly positive β1-β2 , which means that these
strategies have successfully timed the market in the sense of Henriksson and Merton (1981).
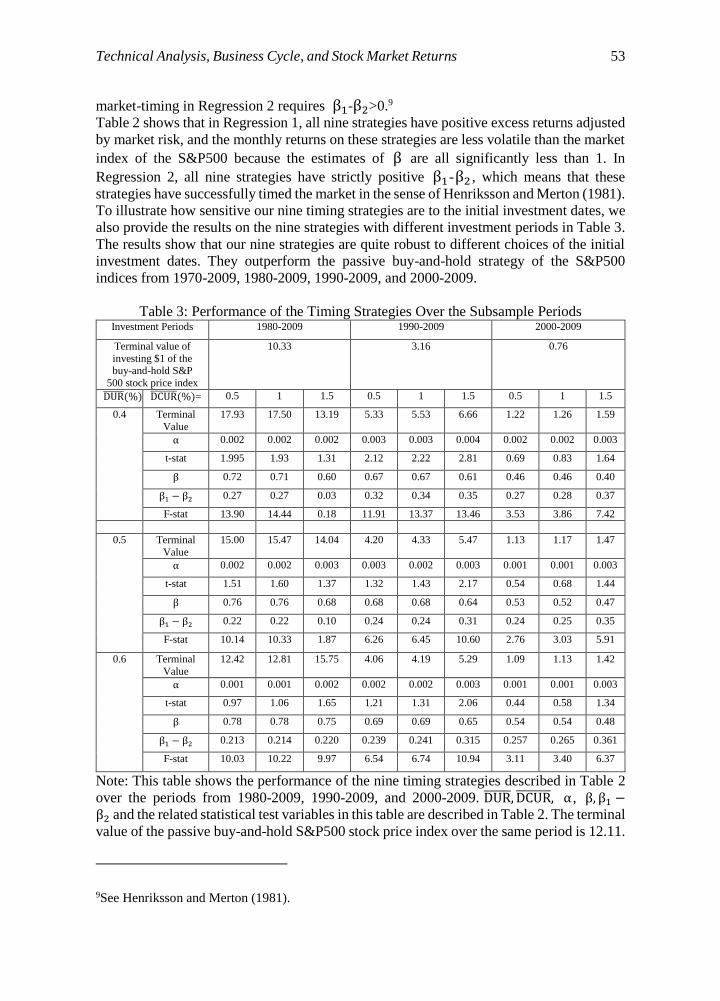
To illustrate how sensitive our nine timing strategies are to the initial investment dates, we
also provide the results on the nine strategies with different investment periods in Table 3.
The results show that our nine strategies are quite robust to different choices of the initial
investment dates. They outperform the passive buy-and-hold strategy of the S&P500
indices from 1970-2009, 1980-2009, 1990-2009, and 2000-2009.
Table 3: Performance of the Timing Strategies Over the Subsample Periods Investment Periods 1980-2009 1990-2009 2000-2009
Terminal value of
investing $1 of the buy-and-hold S&P
500 stock price index
10.33 3.16 0.76
DUR̅̅ ̅̅ ̅̅ (%) DCUR̅̅ ̅̅ ̅̅ ̅̅ (%)= 0.5 1 1.5 0.5 1 1.5 0.5 1 1.5
0.4 Terminal
Value
17.93 17.50 13.19 5.33 5.53 6.66 1.22 1.26 1.59
α 0.002 0.002 0.002 0.003 0.003 0.004 0.002 0.002 0.003
t-stat 1.995 1.93 1.31 2.12 2.22 2.81 0.69 0.83 1.64
β 0.72 0.71 0.60 0.67 0.67 0.61 0.46 0.46 0.40
β1 − β2 0.27 0.27 0.03 0.32 0.34 0.35 0.27 0.28 0.37
F-stat 13.90 14.44 0.18 11.91 13.37 13.46 3.53 3.86 7.42
0.5 Terminal
Value
15.00 15.47 14.04 4.20 4.33 5.47 1.13 1.17 1.47
α 0.002 0.002 0.003 0.003 0.002 0.003 0.001 0.001 0.003
t-stat 1.51 1.60 1.37 1.32 1.43 2.17 0.54 0.68 1.44
β 0.76 0.76 0.68 0.68 0.68 0.64 0.53 0.52 0.47
β1 − β2 0.22 0.22 0.10 0.24 0.24 0.31 0.24 0.25 0.35
F-stat 10.14 10.33 1.87 6.26 6.45 10.60 2.76 3.03 5.91
0.6 Terminal
Value
12.42 12.81 15.75 4.06 4.19 5.29 1.09 1.13 1.42
α 0.001 0.001 0.002 0.002 0.002 0.003 0.001 0.001 0.003
t-stat 0.97 1.06 1.65 1.21 1.31 2.06 0.44 0.58 1.34
β 0.78 0.78 0.75 0.69 0.69 0.65 0.54 0.54 0.48
β1 − β2 0.213 0.214 0.220 0.239 0.241 0.315 0.257 0.265 0.361
F-stat 10.03 10.22 9.97 6.54 6.74 10.94 3.11 3.40 6.37
Note: This table shows the performance of the nine timing strategies described in Table 2
over the periods from 1980-2009, 1990-2009, and 2000-2009. DUR̅̅ ̅̅ ̅̅ , DCUR̅̅ ̅̅ ̅̅ ̅̅ , α , β, β1 −β2 and the related statistical test variables in this table are described in Table 2. The terminal
value of the passive buy-and-hold S&P500 stock price index over the same period is 12.11.
9See Henriksson and Merton (1981).

54 Jinpeng Ma and Yuming Wang
4.1 Tests on the Theoretical Hypotheses
In this section, we will focus on the timing strategy with DUR̅̅ ̅̅ ̅̅ =0.5 and DCUR̅̅ ̅̅ ̅̅ ̅̅ =1 to test
the theoretical hypotheses we summarize in the introduction. Since the persistence in
business conditions is a stylized fact about the macro-economy, we will mainly provide
empirical evidence on the other two theoretical hypotheses.
1). The time lead of stock market to the business conditions (n is nonnegative but relatively
small).
We set up a Probit model as follows:
Pr(It = 1) = F(β0 + β1Rt−1 + β2Rt−2 + β2Rt−3 + ⋯ + β2Rt−m)
where Pr is the probability of the event It =1. It is a binominal variable that equals 1 if the
economy at time t is in a recession and equals 0 otherwise. F is the cumulative normal
distribution function, and Rt−1, Rt−2, Rt−3, …, Rt−m are the investment returns on the
S&P500 stock price index at months t-1, t-2, t-3,…, t-m, respectively. If the stock price
leads the future business conditions by m months, then we should achieve estimates
of β1,β2, β3, … , βm, which are significant with the correct signs.
Table 4 presents the empirical result of the Probit model using the NBER business cycle
reference dates and the monthly S&P500 stock price index over the sample period of 1970
to 2009. As shown in Table 4, all the returns on the S&P500 stock price index at month
from t-1 to t-9 have predictive power, at significance level of 5%, on the future of economic
conditions at time t. In contrast, the returns on the S&P500 stock price index at time from
t-10 to t-13 have lost their predictive power on the future of economic conditions at time t.
The above empirical results show that the stock market or the average investor, may lead
for some time (approximately 9 months in Table 4), but it cannot lead without a limit ( n is
nonnegative but relatively small) .
Table 4: The Time Lead of Stock Market to the Business Conditions Rt−1 Rt−2 Rt−3 Rt−4 Rt−5 Rt−6 Rt−7 Rt−8 Rt−9 Rt−10 Rt−11 Rt−12 Rt−13
Parameters
βi
-5.06 -8.25 -8.07 -10.99 -9.62 -9.11 -9.37 -8.24 -5.42 -3.83 -3.75 -2.91 0.99
Wald Chi-
squared
6.48 16.25 15.77 28.02 22.5
7
19.5
2
18.7
6
14.3
2
6.36 3.15 2.97 1.62 0.18
p-value 0.01 0.00 0.00 0.00 0.00 0.00 0.00 0.00 0.02 0.08 0.09 0.20 0.67
Note: This table presents the parameters and related statistical test variables estimated from
the following model: Pr(It = 1) = F(β0 + β1Rt−1 + β2Rt−2 + β2Rt−3 + ⋯ + β2Rt−m) ,
where Pr is the probability of the event It = 1, It is a binominal variable that equals 1 if
the economy at time t is in recession and equals 0 if otherwise, F is the cumulative normal
distribution function, Rt−1, Rt−2, Rt−3, …, Rt−m are the returns on the S&P stock price
index at the months t-1, t-2, t-3,…, t-m, respectively. If the stock price leads the
macroeconomic economy by the m months, then we can obtain significant estimates of β1,
β2, β3, … , βm. Wald Chi-squared and related p-value are used to test the null hypothesis that
the estimated parameters equal 0. The larger the Wald Chi-squared or the lower the p-value,
the less likely the null hypothesis is to be true. The stock market leads the economy, with
limited predictive power (approximately 9 months).
Technical Analysis, Business Cycle, and Stock Market Returns 55
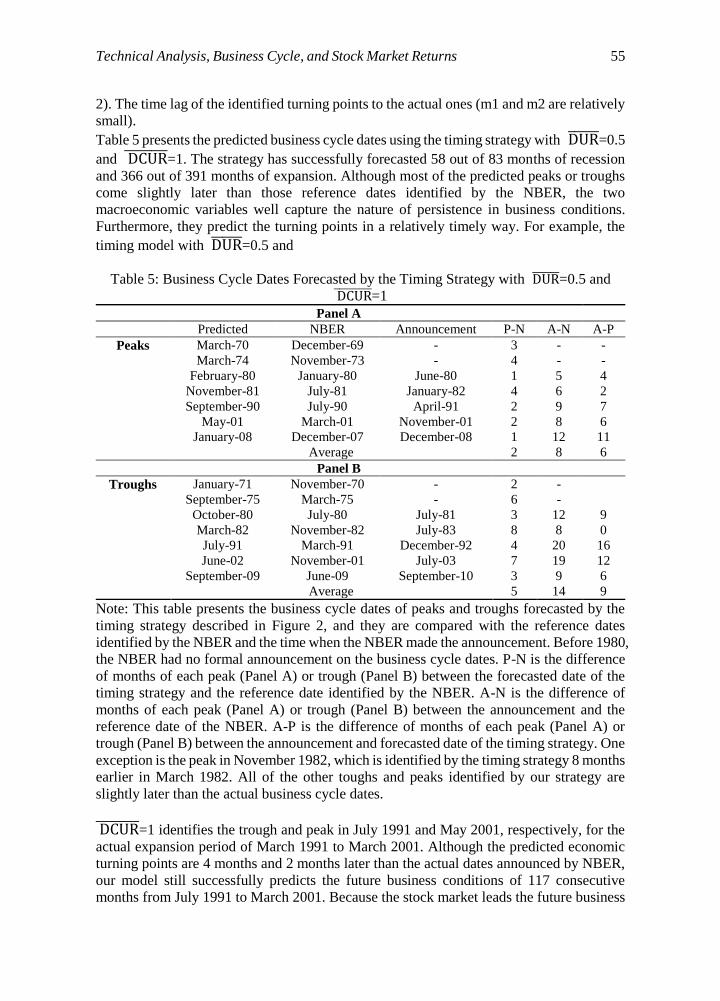
2). The time lag of the identified turning points to the actual ones (m1 and m2 are relatively
small).
Table 5 presents the predicted business cycle dates using the timing strategy with DUR̅̅ ̅̅ ̅̅ =0.5
and DCUR̅̅ ̅̅ ̅̅ ̅̅ =1. The strategy has successfully forecasted 58 out of 83 months of recession
and 366 out of 391 months of expansion. Although most of the predicted peaks or troughs
come slightly later than those reference dates identified by the NBER, the two
macroeconomic variables well capture the nature of persistence in business conditions.
Furthermore, they predict the turning points in a relatively timely way. For example, the
timing model with DUR̅̅ ̅̅ ̅̅ =0.5 and
Table 5: Business Cycle Dates Forecasted by the Timing Strategy with DUR̅̅ ̅̅ ̅̅ =0.5 and
DCUR̅̅ ̅̅ ̅̅ ̅̅ =1
Panel A
Predicted NBER Announcement P-N A-N A-P
Peaks March-70 December-69 - 3 - -
March-74 November-73 - 4 - -
February-80 January-80 June-80 1 5 4
November-81 July-81 January-82 4 6 2
September-90 July-90 April-91 2 9 7
May-01 March-01 November-01 2 8 6
January-08 December-07 December-08 1 12 11
Average 2 8 6
Panel B
Troughs January-71 November-70 - 2 -
September-75 March-75 - 6 -
October-80 July-80 July-81 3 12 9
March-82 November-82 July-83 8 8 0
July-91 March-91 December-92 4 20 16
June-02 November-01 July-03 7 19 12
September-09 June-09 September-10 3 9 6
Average 5 14 9
Note: This table presents the business cycle dates of peaks and troughs forecasted by the
timing strategy described in Figure 2, and they are compared with the reference dates
identified by the NBER and the time when the NBER made the announcement. Before 1980,
the NBER had no formal announcement on the business cycle dates. P-N is the difference
of months of each peak (Panel A) or trough (Panel B) between the forecasted date of the
timing strategy and the reference date identified by the NBER. A-N is the difference of
months of each peak (Panel A) or trough (Panel B) between the announcement and the
reference date of the NBER. A-P is the difference of months of each peak (Panel A) or
trough (Panel B) between the announcement and forecasted date of the timing strategy. One
exception is the peak in November 1982, which is identified by the timing strategy 8 months
earlier in March 1982. All of the other toughs and peaks identified by our strategy are
slightly later than the actual business cycle dates.
DCUR̅̅ ̅̅ ̅̅ ̅̅ =1 identifies the trough and peak in July 1991 and May 2001, respectively, for the
actual expansion period of March 1991 to March 2001. Although the predicted economic
turning points are 4 months and 2 months later than the actual dates announced by NBER,
our model still successfully predicts the future business conditions of 117 consecutive
months from July 1991 to March 2001. Because the stock market leads the future business
56 Jinpeng Ma and Yuming Wang
conditions for 9 months, the model has superior predictability relative to the stock market
over the 107 months from July 1991 to May 2001. In overall, the average time lag of the
identified troughs and peaks to the reference date announced by the NBER are 5 months
and 2 months, respectively. Both of them are small relative to the duration of the business
cycle. Taking into account the above empirical facts, it is not surprising for our models to
successfully time the stock market and achieve superior returns over the sample period of
1979 to 2009.
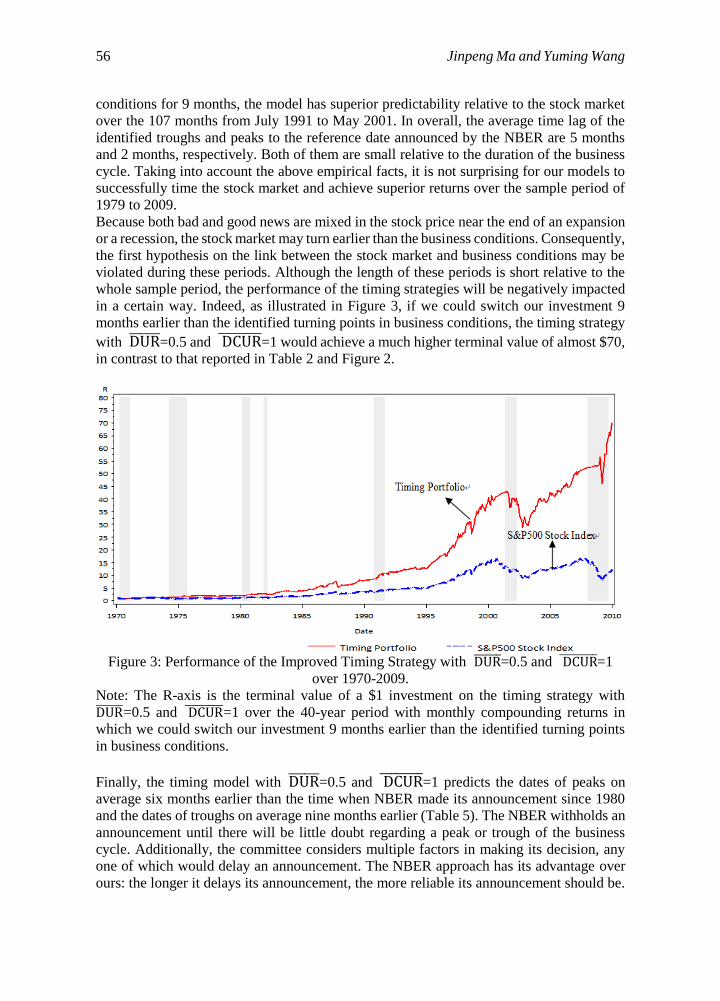
Because both bad and good news are mixed in the stock price near the end of an expansion
or a recession, the stock market may turn earlier than the business conditions. Consequently,
the first hypothesis on the link between the stock market and business conditions may be
violated during these periods. Although the length of these periods is short relative to the
whole sample period, the performance of the timing strategies will be negatively impacted
in a certain way. Indeed, as illustrated in Figure 3, if we could switch our investment 9
months earlier than the identified turning points in business conditions, the timing strategy
with DUR̅̅ ̅̅ ̅̅ =0.5 and DCUR̅̅ ̅̅ ̅̅ ̅̅ =1 would achieve a much higher terminal value of almost $70,
in contrast to that reported in Table 2 and Figure 2.
Figure 3: Performance of the Improved Timing Strategy with DUR̅̅ ̅̅ ̅̅ =0.5 and DCUR̅̅ ̅̅ ̅̅ ̅̅ =1
over 1970-2009.
Note: The R-axis is the terminal value of a $1 investment on the timing strategy with
DUR̅̅ ̅̅ ̅̅ =0.5 and DCUR̅̅ ̅̅ ̅̅ ̅̅ =1 over the 40-year period with monthly compounding returns in
which we could switch our investment 9 months earlier than the identified turning points
in business conditions.
Finally, the timing model with DUR̅̅ ̅̅ ̅̅ =0.5 and DCUR̅̅ ̅̅ ̅̅ ̅̅ =1 predicts the dates of peaks on
average six months earlier than the time when NBER made its announcement since 1980
and the dates of troughs on average nine months earlier (Table 5). The NBER withholds an
announcement until there will be little doubt regarding a peak or trough of the business
cycle. Additionally, the committee considers multiple factors in making its decision, any
one of which would delay an announcement. The NBER approach has its advantage over
ours: the longer it delays its announcement, the more reliable its announcement should be.

Technical Analysis, Business Cycle, and Stock Market Returns 57
The disadvantage of such an approach is a long delay, which makes it less valuable for
timing the market. The multiple factor approach also shows how little we have known about
timing the business cycle. Our two variables approach does not imply that other factors are
not important for timing the business cycle. For example, the term structure remains a
successful and robust prediction of recessions over the years (see, e.g., Harvey, 1988, 1989;
Estrella and Hardouvelis, 1991). Nevertheless, our empirical and theoretical studies show
that these two macroeconomic variables are important and reliable to establish the timing
of the business cycle.
4.2 Reality Check for Data Snooping
Although we have summarized the theoretical hypotheses for the technical analysis of
fundamentals and provided some supporting evidence in the above, our analysis may still
suffer from the critiques of data snooping in stock returns. Some researchers may suggest
that the superior performances of our timing models just accommodate the historical returns
by chance. In this section, we employ the Reality Check, proposed by White (2000) and
Sullivan, Timmermann and White (1999), to document that the performances of our timing
rules are not result of data snooping in stock returns.10
Following Neuhierl and Schluschey (2011), we define the performance statistic for the k-
th timing rule as
fk̅ =1
n∑ fk,t+1
n
t=1
where n is the number of trading days over the sample period of January 1970 to December
2009; fk,t+1 is the observed performance measure for the k-th timing rule at time t+1.
Particularly, the performance measure of mean return for the timing rule k at time t+1 can
be calculated as follows:
fk,t+1 = In(1 + RMt+1Xk,t+1 + RFt+1(1 − Xk,t+1)) − In(1 + RMt+1X0)
1-month T-bill at time t+1. Xk,t+1 is the “timing function” that equals 1 for a forecasted
expansion at time t+1 and equals 0 for a forecasted recession at time t+1. X0 represents
the buy-and-hold strategy of the S&P500 stock price index, which equals 1 at all times.
Formally, the null hypothesis is:
H0 = maxk=1,2,…,9
{E(fk)} ≤ 0
If we can find one timing rule that achieve performance superior to the buy-and-hold
strategy of the S&P500 stock price index, then the null hypothesis should be rejected at a
significant level.
As shown in White (2000), Sullivan, Timmermann and White (2000) and Neuhierl and
8Neuhierl and Schluschey (2011) employ White’s Reality Check for market-timing rules, and they
find that market-timing rules do not remain significantly profitable after correcting for data snooping.

58 Jinpeng Ma and Yuming Wang
Schluschey (2011), the null hypothesis can be evaluated by applying the stationary
bootstrap of Politis and Romano (1994) to resample the observed return series for sufficient
times.11 We denote the resampled performance statistics for the k-th timing rule by f ∗̅k,j,
where j=1,2,…, 500 is the j-th repetition of the bootstrap. Then, we compute the following
statistics for the nine timing rules proposed in this article.12
Vk = maxk=1,2…,9
{√nfk̅}
V∗k,j = max
k=1,2…,9{√n( f ∗̅
k,j − fk̅)} j = 1,2, … , 500
By comparing Vk to the quantiles of V∗k,j, we can obtain the White’s Reality Check p-
value for the null hypothesis that the best timing model cannot outperform the buy-and-
hold strategy of the S&P 500 Stock Price Index.13 The empirical results are reported in
Table 6.
As shown in Table 6, all the White’s Reality Check p-values for the mean return criterion
are different from zero at a significant level of 5%, and all the White’s Reality Check p-
values for the Sharpe Ratio criterion are different from zero at a significant level of 1%,
both of which definitely suggest that the superior performances of the timing rules proposed
in this article are not the result of data snooping in historical returns. Notice that the
stationary bootstrap depends on the smoothing parameter q to determine the mean length
of the blocks (1/q) drawn from the original return series. A large value of q can be chosen
for the time series with little dependence, while a smaller value of q can be chosen for the
time series with a larger dependence. Because the return data we use are at the daily
frequency, q that equals 0.1 is appropriate for our experiment (Sullivan, Timmermann and
White, 1999). However, the empirical results are not sensitive to the variation in the values
of q.
9See the Appendix C in Sullivan, Timmermann and White (2000) for a detailed description of the
stationary bootstrap of Politis and Romano (1994). We follow exactly the three steps described there
to generate the pseudo-time series of returns. 10Because we do not actually document if other technical rules such as moving average meet the
theoretical hypotheses summarized in the introduction, we limit the universe of technical trading
rules to the nine timing rules proposed in this article. 11The above procedures can be easily revised to accommodate the performance statistics of Sharpe
Ratio. See Sullivan, Timmermann and White (1999) for the details.

Technical Analysis, Business Cycle, and Stock Market Returns 59
Table 6: White’s Reality Check p-values Smoothing
Parameter
q=0.01 q=0.1 q=0.5
Performance
Criterion
Mean
Return
Sharp
Ratio
Mean
Return
Sharp
Ratio
Mean
Return
Sharp
Ratio
1970-2009 0.004 0.000 0.006 0.000 0.000 0.000
1980-2009 0.030 0.000 0.040 0.006 0.050 0.000
1990-2009 0.000 0.000 0.004 0.000 0.000 0.000
2000-2009 0.000 0.000 0.002 0.000 0.000 0.000
Note: This table presents the White’s Reality Check p-value for several sample period and
performance criterion combinations, along with three different values of the smoothing
parameter q (i.e., 0.01, 0.1 and 0.5). The stationary bootstrap depends on the smoothing
parameter q to determine the mean length of the blocks (1/q) drawn from the original return
series. A large value of q can be chosen for a time series with little dependence, while a
smaller value of q can be chosen for a time series with larger dependence. Because the
return data we use are at the daily frequency, q that equals 0.1 is appropriate for our
experiment (Sullivan, Timmermann and White, 1999).
5 Conclusions
This paper presents nine timing strategies that have successfully timed the S&P500 stock
price index over the 1970-2009 period based on the technical analysis of two specific
macroeconomic variables (i.e., capacity utilization rate and unemployment rate). The
significance of this paper lies in at least three fronts. First, the technical analysis is not
necessarily conflictive with fundamental analysis or the random walk hypothesis. All of the
technical analysis of the fundamentals that meet the theoretical hypotheses we summarize
in the introduction part should be capable of achieving a performance superior to the buy-
and-hold strategy of a market index. Future research can continue to test the profitability of
other technical rules such as moving average, under the guidance of our theoretical
hypotheses. Second, investors should not ignore the information embodied in the
macroeconomic variables when they make their investment decisions. Indeed, this article
provides successful examples on how to time the stock market based on the stylized fact of
the persistence in the business cycle. It is of vital interest to find out other ways in which
the stock market and macroeconomic conditions are related and examine if the relationship
can be transformed into profitable investment strategies. Third, policy makers can follow
our footprints to identify the business cycle in a timelier manner than the announcements
of the NBER. We predict the dates of peaks on average six months earlier than the time
when NBER made its announcement since 1980 and the dates of troughs on average nine
months earlier. The value of such timing should not be underestimated for conducting the
monetary and fiscal policy.
ACKNOWLEDGEMENTS: This paper supersedes the one entitled “Timing Stock
Market Using Real Variables”. We thank two anonymous referees for their helpful and
positive comments that lead to this publication. Most financial journals take it as a norm
that the passive buy-and-hold strategy always wins. But, if that is the case, there is no point
at all of doing investment related analyses. Clearly, the practice says otherwise.

60 Jinpeng Ma and Yuming Wang
References
[1] Alvarez-Lois, P. P., Endogenous capacity utilization and macroeconomic persistence,
Journal of Monetary Economics 53, 2006, 2213-2237.
[2] Avramov, D. and T. Chordia, Asset pricing models and financial market anomalies,
Review of Financial Studies 19, 2006, 1001-1040.
[3] Campbell, J.Y., Stock returns and the term structure, Journal of Financial Economics
18, 1987, 373 -399.
[4] Campbell, J.Y. and R. J. Shiller, The dividend–price ratio and expectations of future
dividends and discount factors, Review of Financial Studies 1, 1988, 195–227.
[5] Campbell, S.D. and F.X. Diebold, Stock returns and expected business conditions:
half a century of direct evidence, Journal of Business and Economic Statistics, 2009,
266-278.
[6] Chauvet, M., An economic characterization of business cycle dynamics with factor
structure and regime switches, International Economic Review 39, 1998, 969-996.
[7] Chauvet, M. and S. Potter, Forecasting recessions using the yield curve, Journal of
Forecasting 24, 2005, 77-103.
[8] Chauvet, M. and J.D. Hamilton, “Dating business cycle turning points”, in Costas M.,
P. Rothman, and D. V. Dijk, eds.: Nonlinear Time Series Analysis of Business Cycles,
2006, Elsevier, Amsterdam.
[9] Chauvet, M. and J.Piger, A comparison of the real-time performance of business cycle
dating methods, Journal of Business Economics and Statistics 26, 2008, 42-49.
[10] Chordia, T. and L. Shivakumar, Momentum, business cycle and time-varying
expected returns, Journal of Finance 57, 2002, 985-1019.
[11] Dotsey, M. and R.G. King, Pricing, production, and persistence, Journal of the
European Economic Association 4, 2006, 893-928.
[12] Espinoza, R., F. Fornari and M. J. Lombardi, The role of financial variables in
predicting economic activity, Journal of Forecasting 31(1), 2012, 15–46.
[13] Estrella, A. and F.S. Mishkin, 1996, Predicting U.S. recessions: financial variable as
leading indicators, The Review of Economics and Statistics 80, 1996, 45-61.
[14] Estrella, A. and G.A. Hardouvelis, 1991, The term structure as a predictor of real
economic activity, Journal of Finance 46, 1991, 555-576.
[15] Fama, E.F., Random walks in stock market prices, Financial Analyst Journal
(September-October), 1965, 55-59.
[16] Fama, E.F. and K.R. French, 1988, Permanent and temporary components of stock
prices, Journal of Political Economy 96, 1988, 246-273.
[17] Fama, E.F. and K.R. French, Business conditions and expected returns on stocks and
Bonds, Journal of Financial Economics 25, 1989, 23-49.
[18] Ferson, W. E., S. Sarkissian and T.T. Simin, Spurious regressions in Financial
Economics, Journal of Finance 58, 2003, 1393-1414.
[19] Friedman, B.M. and K.N. Kuttner, Why does the paper-bill spread predict real
economic activity, 1994, NBER Working Paper 3879.
[20] Hamilton, J.D., Calling recessions in real time, International Journal of Forecasting
27, 2010, 1006-1026.
[21] Hartmann, D., B. Kempa, and C. Pierdzioch, Economic and financial crises and the
predictability of U.S. stock returns, Journal of Empirical Finance 15, 2008, 468-480.
[22] Harvey, C.R., The Real Term Structure and Consumption Growth, Journal of
Financial Economics 22, 1988, 305-334.
Technical Analysis, Business Cycle, and Stock Market Returns 61
[23] Harvey, C.R., Forecasting Economic Growth with the Bond and Stock Markets,
Financial Analysts Journal (September-October), 1989, 38-45.
[24] Henriksson, R.D. and R. C. Merton, On the market timing and investment
performance of managed portfolios II - statistical procedures for evaluating
forecasting skills, Journal of Business 54, 1981, 513-533.
[25] Keim, D.B. and R.F. Stambaugh, Predicting returns in the stock and bond markets,
Journal of Financial Economics 17, 1986, 357-390.
[26] Kim, C., and C.R. Nelson, Business cycle turning points, a new coincident index, and
tests of duration dependence based on a dynamic factor model with regime-switching,
Review of Economics and Statistics 80, 1998, 188-201.
[27] Levy, R.A., Conceptual foundations of technical analysis, Financial Analyst Journal
(June-August), 1966, 83-89.
[28] Neuhierl, A. and B. Schlussche, Data snooping and market-timing rule performance,
Journal of Financial Econometrics, 2011, forthcoming.
[29] Park, C. and S.H. Irwin, What do we know about the profitability of technical analysis,
Journal of Economic Surveys 21, 2007, 786-826.
[30] Pesaran, M. H. and A. Timmermann, Market timing and return prediction under
model instability, Journal of Empirical Finance 9, 2002, 495-510.
[31] Politis, D. and J. Romano, The Stationary Bootstrap, Journal of The American
Statistical Association 89, 1994, 1303-1313.
[32] Rapach, D.E. and M. E. Wohar, Structural breaks and predictive regressions models
of aggregate U.S. stock returns, Journal of Financial Econometrics 4, 2006, 238-274.
[33] Stock, J.H., and M.W. Watson, New indexes of coincident and leading economic
indicators, in Blanchard, O. J. and F. Stanley, eds.: NBER Macroeconomics Annual,
1989, MIT Press, Cambridge, MA.
[34] Stock, J.H. and M.W. Watson, A probability model of the coincident economic
indicators, in Lahiri, K. and G. H. Moore, eds.: Leading Economic Indicators: New
Approaches and Forecasting Records, 1991, Cambridge University Press, Cambridge,
U.K.
[35] Sullivan, R., A. Timmermann and H. White, Data-snooping, technical trading rule
performance, and the bootstrap, Journal of Finance 54, 1999, 1647-1691.
[36] Timmermann, A., Structural breaks, incomplete information, and stock prices,
Journal of Business and Economics Statistics 19, 2001, 299-314.
[37] White, H., A reality check for data snooping, Econometrica 68, 2000, 1097-1126.