tech581 analyze presentation fall 2008 date: 11/11/08 team members: xxxxx xxxxx sound removed
TRANSCRIPT

TECH581 Analyze Presentation Fall 2008
Date: 11/11/08Team Members: xxxxxxxxxx
Sound Removed

Brief Review of Project Charter
Information Technology Department of major Insurance Company attempting to collect metrics on business requirements changes throughout application project lifecycle.
If collected, measure is taken at the end of the project, amounting to 8 hours of work for a project manager.
Tracking and recording the changes throughout the lifecycle of a project and the associated process that can be implemented across the organization can be a significant improvement to a maximum of 1 hour total for each project.
The process of requirements counts/metrics can be used to further analyze and estimate future projects.
Goal: To understand current processes for requirements metrics gathering to identify and eliminate non value add steps. Identify value added steps performed inefficiently and implement improvements.

CTQ Tree(s)
Requirements need to be
counted at each stage gate of
project lifecycle
Tool being used for requirements
tracking.
Size of project
Enterprise Project Office(EPO)
CTQ
KPOVs
KPIVs
Customers
Project Management
Office(PMO)
Quality and Process
Improvement (QPI)
Executive Management
Time that PM spends on collecting
requirements counts needs to be as minimal
as possible.
PM Experience
Awareness of Relative
Priority to Collect Requirements
Counts
Requirements Complexity

Data Collection Summarized
Random sample of historical projects. PMs estimated time it took to measure requirements changes over time
Random sample of new projects that were initiated soon before and/or after start of class project.
Stratified by tool used for requirements collection and tier (size in forecasted dollars).

Data Collection Chart – Historical Data
Process Observation Worksheet - Historical Information
Completed Project Number
Tool for Collecting Requirements Counts Project Tier (size)
Estimated Time to collect Requirements Change Counts by phase at end of project
1 ClearQuest 1 82 ClearQuest 1 63 Excel 2 84 Word 2 95 ClearQuest 3 76 Excel 3 87 Word 4 88 ClearQuest 4 7
7.625Estimate average hours to count requirements changes over time at the end of the project

Pivot Tables - Historical DataData by stratification factors
Tool for Collecting Requirements Counts (All) Project Tier (size) (All)
Average of Estimated Time to collect Requirements Change Counts by phase at end of project
Average of Estimated Time to collect Requirements Change Counts by phase at end of project
Project Tier (size) Total Tool for Collecting Requirements Counts Total1 7 ClearQuest 72 8.5 Excel 83 7.5 Word 8.54 7.5 Grand Total 7.625
Grand Total 7.625
Historically, Tier 2 projects took longer to count
requirements changes at the end of the project
lifecycle.
Historically, requirements kept in MS Word took longer to count changes at
the end of the project lifecycle.
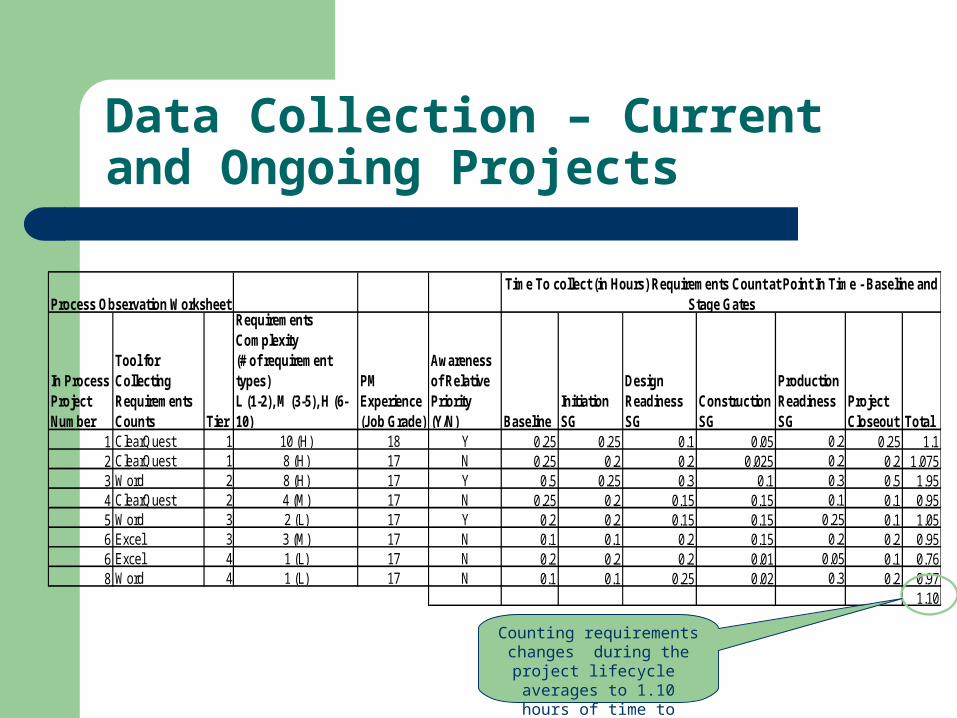
Data Collection – Current and Ongoing Projects
Process Observation Worksheet
In Process Project Number
Tool for Collecting Requirements Counts Tier
Requirements Complexity(# of requirement types)L (1-2), M (3-5), H (6-10)
PM Experience(Job Grade)
Awareness of Relative Priority(Y/N) Baseline
Initiation SG
Design Readiness SG
Construction SG
Production Readiness SG
Project Closeout Total
1 ClearQuest 1 10 (H) 18 Y 0.25 0.25 0.1 0.05 0.2 0.25 1.12 ClearQuest 1 8 (H) 17 N 0.25 0.2 0.2 0.025 0.2 0.2 1.0753 Word 2 8 (H) 17 Y 0.5 0.25 0.3 0.1 0.3 0.5 1.954 ClearQuest 2 4 (M) 17 N 0.25 0.2 0.15 0.15 0.1 0.1 0.955 Word 3 2 (L) 17 Y 0.2 0.2 0.15 0.15 0.25 0.1 1.056 Excel 3 3 (M) 17 N 0.1 0.1 0.2 0.15 0.2 0.2 0.956 Excel 4 1 (L) 17 N 0.2 0.2 0.2 0.01 0.05 0.1 0.768 Word 4 1 (L) 17 N 0.1 0.1 0.25 0.02 0.3 0.2 0.97
1.10
Time To collect (in Hours) Requirements Count at Point In Time - Baseline and Stage Gates
Counting requirements changes during the project lifecycle
averages to 1.10 hours of time to collect.

Fishbone Diagram
Takes too long to gather/report requirements
metrics (~ 7.6 hrs)
Man Method Machine
Material Environment
Not knowledgeable ofrequirements processes
Not aware of priority of reporting metrics
Requirements reporting process is not documented Tool not intuitive
Tool does not support ease of counting requirements
Fear of retribution
Large number of requirements
Must manually count requirements for each
requirement type

Chart by Project Size
Average By Project Tier
0.00
0.20
0.40
0.60
0.80
1.00
1.20
1.40
1.60
1 2 3 4
Tier (Size)
Avg
Ho
urs
Tier 2 included a project with Word as the requirements tool.

Chart by Requirements Complexity
Average Hours by Requirements Complexity
0.000.200.400.600.801.001.201.401.60
H L M
Complexity
Avg
Hour
s

Chart by PM Experience (Grade)
Average Hours by PM Experience (Grade)
1.00
1.02
1.04
1.06
1.08
1.10
1.12
17 18
PM Grade
Avg
Hour
s

Chart by PM Awareness
Average Hours by Awareness
0.00
0.50
1.00
1.50
N Y
Awareness of Priority?
Avg
Hou
rs

Chart by Awareness and Tool
Avg Hours by Awareness and Tool
0.00
0.50
1.00
1.50
2.00
N Y N N Y
ClearQuest Excel Word
Awareness/Tool
Avg
Hou
rs
Tier 4 and low complexity
Higher complexity
and size (tier)

Chart by Requirement Tracking Tool
Average Hours by Requirement Tool
0.000.200.400.60
0.801.001.201.40
ClearQuest Excel Word
Requirements Tool
Avg
Hour
s

Chart by Tool and Project Size
Average Hours by Tool and Project Size
0
0.5
1
1.5
2
2.5
ClearQuest ClearQuest Word Excel Word Excel Word
1 2 3 4
Tier/Tool
Avg
Ho
urs

Conclusions
Total hours to count requirements changes over the project lifecycle at the end of the project averages 7.6 hours based on historical information.
Average hours to count requirement changes over the lifecycle of the project during the project lifecycle averages 1.1 hours based on sample of projects studied.

Conclusions based on sample of projects studied:
Requirements took longer to count when using MS Word as the requirements tracking tool.
Projects with high complexity requirements took longer to count.
No correlation found between awareness of the priority of the task and the effort to report requirements counts.
No correlation found between PM experience (grade) and the effort to report requirements counts.