tech data 2008 annual report
TRANSCRIPT

Every day
Year Ended January 31, 20082008ANNUAL REPORT
IT depends on us.

a conduit through which the power of
technology flows to the world—a single
point of purchase for thousands of IT products
from hundreds of hardware and software
vendor partners.
Vendor Partners
Hundreds of the world’s
leading producers of IT
hardware and software
Ware
Tech Data—A strategic link in the information technology (IT) ecosystem

Purpose
Mission
Strategic Objectives
IT depends on us
To be the IT distributor of choice
Over 100,000 customers served
Value-added resellers (VARs)
Corporate resellers
Small and medium business (SMB)
Consumer
EnterpriseCredit services
Tech Data Resellers End Users
1

-
highlight recent customer solutions that
driving our success and the success of our
Fiscal 2008 financial performance
validates strategy
-
-
execution and improvements in gross margin
-
fast approach to improving cash management
metrics and shareholder returns generated
cash from operations totaling more than
Strength in execution
-
headcount focused on customers serving
Bob Dutkowsky
strategic building blocks
focused on execution, diversification and
innovation,
2008
$23,423
GAAP operating income (loss) $ 188 )
(1) $ 219
GAAP net income (loss) per diluted share $ 1.96 )
(1) $ 2.51
28
Cash and cash equivalents $ 447
Total debt $ 383
$ 1,921
2
implementation and training processes in
We outperformed peers in several categories
expertise and post-sales support—each a
critical component of our ever-expanding
-
-
performing operations in Europe combined
-
income and cash metrics at or above our
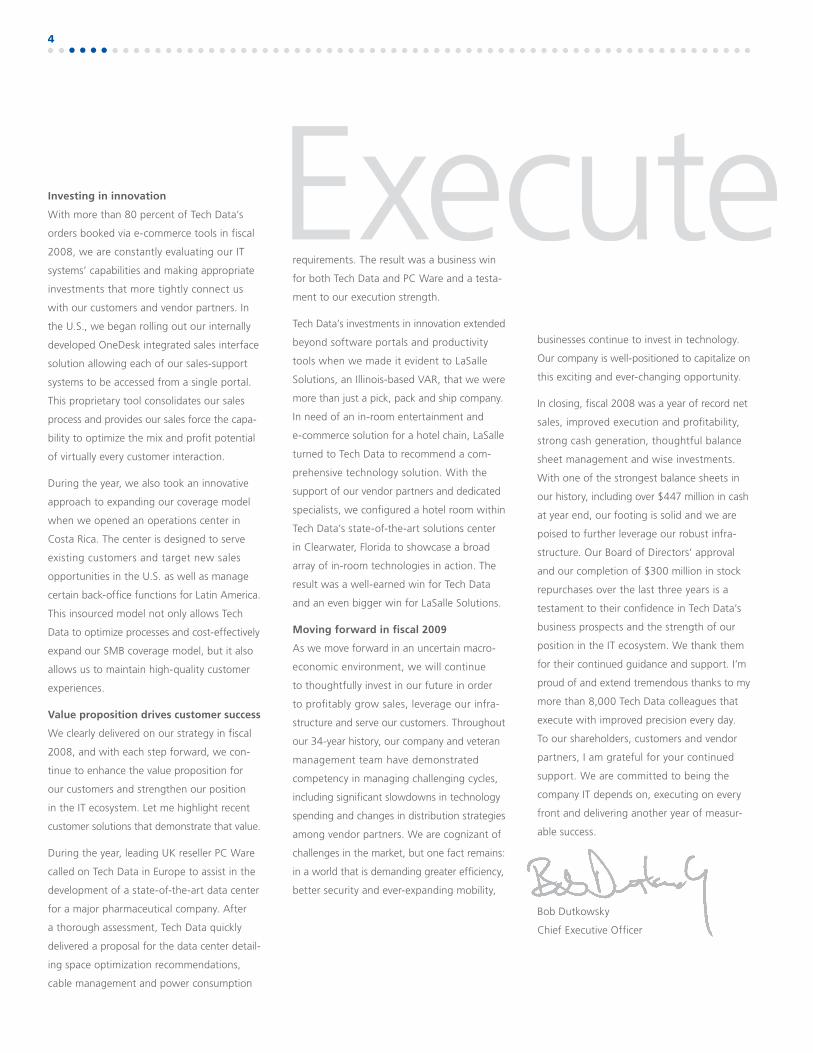
Over $90 million in IT products
shipped every day.
$23.4
$19.7$20.5
$21.4
$17.4
in billions
‘04 ‘05 ‘06 ‘07 ‘08
Net sales
Diversifying our business
-
has been instrumental in building a portfolio
-
to a multi-vendor approach and have signed
a number of leading mobile device vendor
further expand our vendor partner relation-
3
Investing in innovation
process and provides our sales force the capa-
approach to expanding our coverage model
expand our SMB coverage model, but it also
Value proposition drives customer success
-
tinue to enhance the value proposition for
our customers and strengthen our position
development of a state-of-the-art data center
delivered a proposal for the data center detail-
-
e-commerce solution for a hotel chain, LaSalle
-
support of our vendor partners and dedicated
Moving forward in fiscal 2009
-
management team have demonstrated
spending and changes in distribution strategies
strong cash generation, thoughtful balance
With one of the strongest balance sheets in
poised to further leverage our robust infra-
business prospects and the strength of our
To our shareholders, customers and vendor
-
Chief Executive Officer
Execute4

Tech Data Corporation 5
FINANCIAL TABLE OF CONTENTS
Selected Consolidated Financial Data 6
Management’s Discussion and Analysis of Financial Condition and Results of Operations
8
Reports of Independent Registered Certified Public Accounting Firm 28
Consolidated Balance Sheet 30
Consolidated Statement of Operations 31
Consolidated Statement of Shareholders’ Equity 32
Consolidated Statement of Cash Flows 33
Notes to Consolidated Financial Statements 35
Market for the Registrant’s Common Stock, Related Shareholder Mattersand Issuer Purchases of Equity Securities
57
Stock Performance Chart 59
GAAP to Non-GAAP Reconciliation (Unaudited) 60
SELECTED CONSOLIDATED FINANCIAL DATA
6
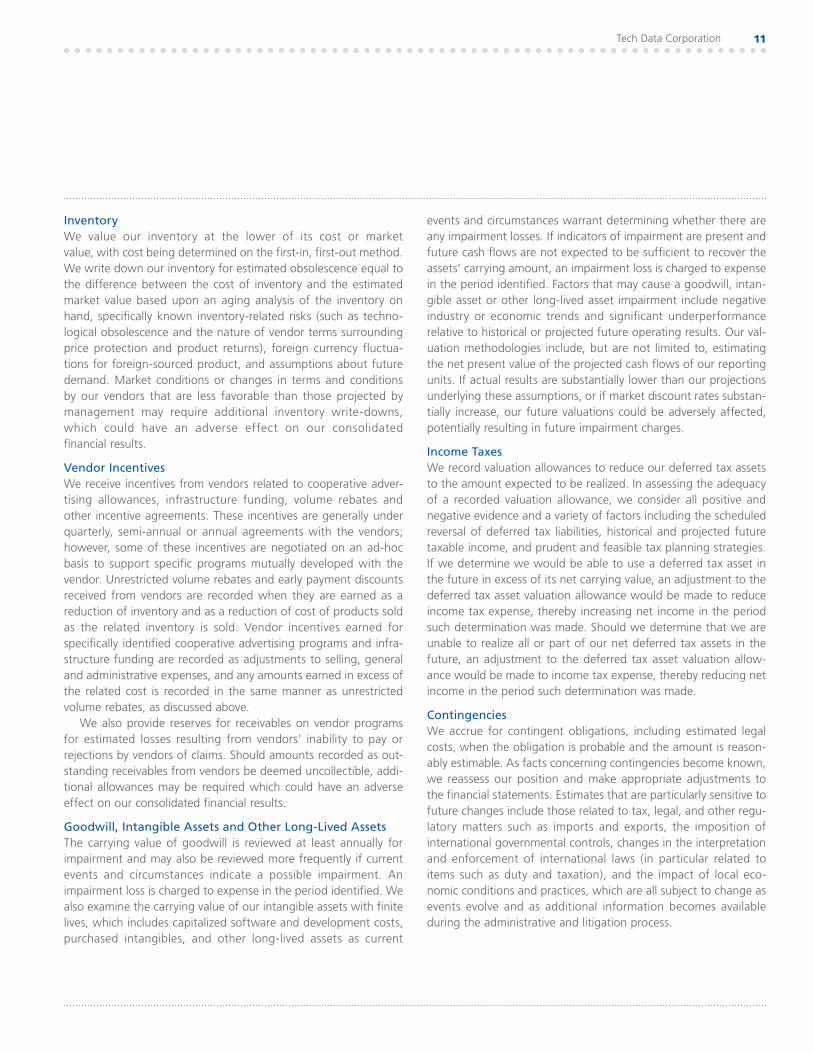
The following table sets forth certain selected consolidated financial data. In the first quarter of fiscal 2007, management sold the European training business (the “Training Business”). The results of operations of the Training Business have been reclassified and pre-sented as “income (loss) from discontinued operations, net of tax,” for all periods presented below. The balance sheet data has not been reclassified as the net assets of the Training Business are less than 0.5% of the total net assets of the Company. This information should be read in conjunction with Management’s Discussion and Analysis of Financial Condition and Results of Operations on our consolidated financial statements and notes thereto appearing elsewhere in this Annual Report.
Year ended January 31,
Five Year Financial Summary 2008 2007 2006 2005 2004
(In thousands, except per share data)Income statement data:Net sales . . . . . . . . . . . . . . . . . . . . . . . . . . . . . . . . . . . . $23,423,078 $21,440,445 $20,482,851 $19,730,917 $17,358,525Cost of products sold . . . . . . . . . . . . . . . . . . . . . . . . . . 22,288,670 20,433,674 19,460,332 18,667,184 16,414,773
Gross profit . . . . . . . . . . . . . . . . . . . . . . . . . . . . . . . . . 1,134,408 1,006,771 1,022,519 1,063,733 943,752
Operating expenses:Selling, general and administrative expenses . . . . . . . 915,434 851,097 828,278 832,178 771,786Goodwill impairment(1) . . . . . . . . . . . . . . . . . . . . . . . — 136,093 — — —Loss on disposal of subsidiaries(4) . . . . . . . . . . . . . . . 14,471 — — — —Restructuring charges(2) . . . . . . . . . . . . . . . . . . . . . . . 16,149 23,764 30,946 — —Special charges . . . . . . . . . . . . . . . . . . . . . . . . . . . . . — — — — 3,065
946,054 1,010,954 859,224 832,178 774,851
Operating income (loss) . . . . . . . . . . . . . . . . . . . . . . . . 188,354 (4,183) 163,295 231,555 168,901
Other expense (income):Discount on sale of accounts receivable . . . . . . . . . . 7,219 12,509 5,503 — —Interest expense, net . . . . . . . . . . . . . . . . . . . . . . . . . 15,256 28,742 23,996 22,867 16,566Net foreign currency exchange (gain) loss . . . . . . . . . (3,994) (15) 1,816 (2,959) (1,893)
18,481 41,236 31,315 19,908 14,673
Income (loss) from continuing operations before income taxes and minority interest . . . . . . . . 169,873 (45,419) 131,980 211,647 154,228
Provision for income taxes(3) . . . . . . . . . . . . . . . . . . . . . 65,163 55,508 109,013 52,025 47,040
Income (loss) from continuing operations before minority interest . . . . . . . . . . . . . . . . . . . . . . . 104,710 (100,927) 22,967 159,622 107,188
Minority interest in net loss of joint venture . . . . . . . . . 3,559 — — — —
Income (loss) from continuing operations . . . . . . . . . . . 108,269 (100,927) 22,967 159,622 107,188Discontinued operations, net of tax . . . . . . . . . . . . . . . — 3,946 3,619 2,838 (3,041)
Net income (loss) . . . . . . . . . . . . . . . . . . . . . . . . . . . . . $ 108,269 $ (96,981) $ 26,586 $ 162,460 $ 104,147
(continued)

Tech Data Corporation 7
Year ended January 31,
Five Year Financial Summary 2008 2007 2006 2005 2004
(In thousands, except per share data)Income (loss) per common share—basic:
Continuing operations . . . . . . . . . . . . . . . . . . . . . . . $ 1.97 $ (1.83) $ 0.40 $ 2.74 $ 1.88Discontinued operations. . . . . . . . . . . . . . . . . . . . . . — 0.07 0.06 0.05 (0.05)
Net income (loss) per common share—basic . . . . . . $ 1.97 $ (1.76) $ 0.46 $ 2.79 $ 1.83
Income (loss) per common share—diluted:Continuing operations . . . . . . . . . . . . . . . . . . . . . . . $ 1.96 $ (1.83) $ 0.39 $ 2.69 $ 1.86Discontinued operations. . . . . . . . . . . . . . . . . . . . . . — 0.07 0.06 0.05 (0.05)
Net income (loss) per common share—diluted. . . . . $ 1.96 $ (1.76) $ 0.45 $ 2.74 $ 1.81
Weighted average common shares outstanding:Basic . . . . . . . . . . . . . . . . . . . . . . . . . . . . . . . . . . . . 54,904 55,129 57,749 58,176 56,838
Diluted. . . . . . . . . . . . . . . . . . . . . . . . . . . . . . . . . . . 55,287 55,129 58,414 59,193 57,501
Dividends per common share . . . . . . . . . . . . . . . . . . . — — — — —
2008 2007 2006 2005 2004
Balance sheet data:Working capital . . . . . . . . . . . . . . . . . . . . . . . . . . . . . . $ 2,044,418 $ 1,816,564 $ 1,392,108 $ 1,488,617 $ 1,525,432Total assets . . . . . . . . . . . . . . . . . . . . . . . . . . . . . . . . . 5,220,935 4,703,864 4,404,634 4,557,736 4,167,886Revolving credit loans . . . . . . . . . . . . . . . . . . . . . . . . . 18,315 77,195 235,088 68,343 80,221Current portion of long-term debt. . . . . . . . . . . . . . . . 1,243 2,376 1,605 291,625 9,258Long-term debt . . . . . . . . . . . . . . . . . . . . . . . . . . . . . . 363,639 363,604 14,378 17,215 307,934Other long-term liabilities . . . . . . . . . . . . . . . . . . . . . . 58,011 46,252 38,598 45,178 46,591Shareholders’ equity . . . . . . . . . . . . . . . . . . . . . . . . . . 1,920,721 1,702,720 1,760,307 1,927,471 1,658,489
(1) See Note 6 of Notes to Consolidated Financial Statements for discussion of the goodwill impairment recorded in fiscal 2007. (2) See Note 8 of Notes to Consolidated Financial Statements for discussion of restructuring costs incurred in fiscal 2008, 2007 and 2006, respectively. (3) See Note 11 of Notes to Consolidated Financial Statements for discussion of the $7.5 million decrease in the deferred tax asset valuation allowance in fiscal 2008 and the
$8.4 million and $56.0 million increases in the deferred tax asset valuation allowance in fiscal 2007 and 2006, respectively. (4) See Note 7 of Notes to Consolidated Financial Statements for discussion of the $14.5 million loss on disposal of subsidiaries recorded in fiscal 2008.

8
Forward-Looking Statements
This Annual Report, including this Management’s Discussion and Analysis of Financial Condition and Results of Operations (“MD&A”), contains forward-looking statements, as described in the “safe harbor” provision of the Private Securities Litigation Reform Act of 1995. These statements involve a number of risks and uncertainties and actual results could differ materially from those projected. These forward-looking statements regarding future events and the future results of Tech Data Corporation are based on current expectations, estimates, forecasts, and projec-tions about the industries in which we operate and the beliefs and assumptions of our management. Words such as “expects,” “anticipates,” “targets,” “goals,” “projects,” “intends,” “plans,” “believes,” “seeks,” “estimates,” variations of such words, and similar expressions are intended to identify such forward-looking statements. In addition, any statements that refer to projections of our future financial performance, our anticipated growth and trends in our businesses, and other characterizations of future events or circumstances, are forward-looking statements. Readers are cautioned that these forward-looking statements are only predictions and are subject to risks, uncertainties, and assumptions. Therefore, actual results may differ materially and adversely from those expressed in any forward-looking statements. Readers are referred to the cautionary statements and important factors discussed in Risk Factors in this Annual Report. We undertake no obligation to revise or update publicly any forward-looking state-ments for any reason.
Factors that could cause actual results to differ materially include the following:
Overview
Tech Data is a leading distributor of information technology (“IT”) products, logistics management and other value-added services. We distribute microcomputer hardware and software products to value-added resellers, corporate resellers, direct marketers and retailers. Our offering of value-added customer services includes training and technical support, external financing options, config-uration services, outbound telemarketing, marketing services and a suite of electronic commerce solutions. We manage our busi-ness in two geographic segments: the Americas (including North America and Latin America) and Europe.
Our strategy is to leverage our efficient cost structure com-bined with our multiple service offerings to generate demand and cost efficiencies for our suppliers and customers around the world. The IT distribution industry in which we operate is characterized by narrow gross profit as a percentage of sales (“gross margin”) and narrow income from operations as a percentage of sales (“operating margin”). Historically, our gross and operating mar-gins have been impacted by intense price competition, as well as changes in terms and conditions with our suppliers, including those terms related to rebates and other incentives and price pro-tection. We expect these competitive pricing pressures to con-tinue in the foreseeable future, and therefore, we will continue to evaluate our pricing policies and terms and conditions offered to our customers in response to changes in our vendors’ terms and conditions and the general market environment. We will continue to focus on not only disciplined pricing and purchasing practices, but also on realigning our customer and vendor portfolio to support a sustainable higher margin business that will help drive long-term profitability throughout all of our operations. As we continue to evaluate our existing pricing policies and make future changes, if any, within our customer or vendor portfolio, we may experience moderated sales growth or sales declines. In addi-tion, increased competition and changes in general economic conditions within the markets in which we conduct business may hinder our ability to maintain and/or improve gross margin from its current level.
MANAGEMENT’S DISCUSSION AND ANALYSIS OF FINANCIAL CONDITION AND RESULTS OF OPERATIONS

Tech Data Corporation 9
From a balance sheet perspective, we require working capital primarily to finance accounts receivable and inventory. We have historically relied upon debt, trade credit from our vendors, and accounts receivable financing programs for our working capital needs. We believe our balance sheet at January 31, 2008 was one of the strongest in the industry, with a debt to capital ratio (calcu-lated as total debt divided by the aggregate of total debt and total shareholders’ equity) of 17%.
In fiscal 2008, we delivered solid and consistent performance in the Americas, achieving an operating margin in excess of 1.5% while at the same time continuing to invest in growth and productivity enhancement initiatives. In Europe, we are making measurable progress towards improving our profitability with improving sales coverage in many of our European regions. We have executed our restructuring programs throughout Europe, which are improving our operating performance going forward. In fiscal 2008, the vast majority of our European businesses delivered improved operating income and cash metrics in com-parison with fiscal 2007. We continue to fall short of our operat-ing targets in Germany and in response, we have made significant changes to our German management structure. The new team is taking aggressive action to improve our execution throughout our German operations. These changes will take time to take effect. While we still have opportunities and expectations for additional improvement, we believe that our current performance within the majority of the European countries is a positive indicator of the Company’s ability to improve our operating performance.
As discussed above, we believe our fiscal 2008 financial perfor-mance demonstrates our ability to execute as we delivered solid performance in the Americas and achieved significant improve-ments in our operating performance in Europe compared to fiscal 2007. During fiscal 2008, we announced several initiatives designed to further enhance our long-term profitability and return on invested capital in Europe, including the following:
During fiscal 2008, our results included a loss on disposal of this subsidiary of approximately $10.8 million, representing a $9.8 million foreign currency exchange loss on our investment in the subsidiary (previously recorded in shareholders’ equity as a component of accumulated other comprehensive income) and $1.0 million for severance costs and fixed asset write-offs.
-mately $0.9 million during fiscal 2008, comprised primarily of inventory write-downs and occupancy-related expenses.
insignificant relative to our consolidated financial results.
approximating local currency net book value. During fiscal 2008, we recorded a loss on disposal of this subsidiary of approxi-mately $3.7 million, representing a $2.7 million foreign currency exchange loss on our investment in the subsidiary (previously recorded in shareholders’ equity as a component of accumu-lated other comprehensive income) and $1.0 million for costs related to the sale. In addition, Israel had operating losses of $0.1 million during fiscal 2008. Israel’s operating results during fiscal 2007 and 2006 were insignificant relative to our consolidated financial statements.
“Moers logistics center”) during the second quarter of fiscal
term synergies of having one logistics center serving Germany, Austria and the Czech Republic. Related to the Moers logistics center exit, we are expanding our logistics center located in Bor, Czech Republic. We expect the net result of these transactions to be a reduction in our future operating expenses. During fiscal 2008, we recorded $18.1 million in restructuring charges related to the closure of the Moers logistics center, comprised of $8.7 million of workforce reductions and $9.4 million for facility costs and other fixed asset write-offs.
Corporation, one of the world’s largest wireless distributor and supply chain solutions providers. The joint venture will distribute mobile phones and other wireless devices to a variety of cus-tomers including mobile operators, dealers, agents, retailers and e-tailers throughout the European market. Each of the joint ven-ture partners has a 50% ownership in the entity. Throughout fiscal 2008, we executed vendor agreements with Motorola, Samsung, Nokia and LG in selected regions around Europe. The joint venture commenced sales during the third quarter of fiscal 2008 and the operating results of the joint venture did not have a material impact on the fiscal 2008 results of operations.
base of Actebis Switzerland AG in the third quarter of fiscal 2008, for a purchase price of approximately $21.5 million. While not significant to our worldwide operations, we believe this acquisition will strengthen and further diversify our position in Switzerland and will provide our existing and new customers with a broader portfolio of vendors and improved sales coverage and support.

continued
10
MANAGEMENT’S DISCUSSION AND ANALYSIS OF FINANCIAL CONDITION AND RESULTS OF OPERATIONS
In early March 2008, we announced the execution of an agreement for the acquisition of certain assets of Scribona, AB, a publicly traded IT distribution company in the Nordic region of Europe, with operations in Sweden, Finland and Norway (“Scribona”). The purchase price for the assets is the net asset value plus a premium for the transferred assets, including inven-tory, intellectual property, material contracts, office equipment and certain other assets. The premium is estimated to be in the range of 13.5 million to 16.5 million euros (approximately $20.0 to $25.0 million). The transaction is subject to various contingencies
and Scribona shareholder approval with a targeted completion in the second quarter of fiscal 2009.
We have seen stronger recent performance in virtually all markets in Europe, with the exception of Germany. We believe our strategy focused on execution, diversification and innovation will provide further improvements to our financial results. However, the competitive environment and changes in general economic conditions within the markets in which we conduct business may hinder our ability to improve our operating margins, both in Europe and the Americas. We will continue to work to selectively grow our net sales, profitability and market share. We will also continue to make targeted investments across our worldwide operations in IT enhancements, sales programs and new business units.
Critical Accounting Policies and Estimates
The information included within MD&A is based upon our consoli-dated financial statements, which have been prepared in accor-
States. The preparation of these financial statements requires us to make estimates and judgments that affect the reported amounts of assets, liabilities, revenues and expenses, and related disclosures. On an on-going basis, we evaluate these estimates, including those related to bad debts, inventory, vendor incentives, goodwill and intangible assets, deferred taxes, and contingencies. Our estimates and judgments are based on currently available information, historical results, and other assumptions we believe are reasonable. Actual results could differ materially from these estimates. We believe the critical accounting policies discussed below affect the more significant judgments and estimates used in the preparation of our consolidated financial statements.
In addition to those policies discussed below, it is important to note that effective February 1, 2006, we adopted the fair value recognition provisions of Statement of Financial Accounting Standards No. 123 (revised 2004), “Share-Based Payments” (“SFAS No. 123R”), using the modified prospective transition method, and therefore have not restated our results of operations for the
-sation expense for fiscal 2007 includes compensation expense for stock-based compensation awards granted prior to, but not yet vested as of January 31, 2006, and for stock-based compensation awards granted after January 31, 2006. SFAS No. 123R eliminates the ability to account for stock-based compensation transactions using the intrinsic value method under Accounting Principles Board Opinion No. 25, “Accounting for Stock Issued to Employees.” In accordance with SFAS No. 123R, we recognize stock-based compensation expense, reduced for estimated forfeitures, on a straight-line basis over the requisite service period of the award. During fiscal 2008 and 2007, we recognized $10.3 million and $8.0 million, respectively, of stock-based compensation expense as a result of the adoption of SFAS No. 123R. See further discus-sion related to our adoption of SFAS No. 123R included in Note 1 of Notes to Consolidated Financial Statements.
Accounts Receivable We maintain allowances for doubtful accounts for estimated losses resulting from the inability of our customers to make required payments. In estimating the required allowance, we take into consideration the overall quality and aging of the receivable portfolio, the existence of credit insurance and specifically identi-fied customer risks. Also influencing our estimates are the follow-ing: (1) the large number of customers and their dispersion across
adequacy of collateral received from customers, if any and 4) our historical loss experience. If actual customer performance were to deteriorate to an extent not expected by us, additional allowances may be required which could have an adverse effect on our con-solidated financial results. Conversely, if actual customer perfor-mance were to improve to an extent not expected by us, a reduction in allowances may be required which could have a favorable effect on our consolidated financial results.
Tech Data Corporation 11
Inventory We value our inventory at the lower of its cost or market value, with cost being determined on the first-in, first-out method. We write down our inventory for estimated obsolescence equal to the difference between the cost of inventory and the estimated market value based upon an aging analysis of the inventory on hand, specifically known inventory-related risks (such as techno-logical obsolescence and the nature of vendor terms surrounding price protection and product returns), foreign currency fluctua-tions for foreign-sourced product, and assumptions about future demand. Market conditions or changes in terms and conditions by our vendors that are less favorable than those projected by management may require additional inventory write-downs, which could have an adverse effect on our consolidated financial results.
Vendor Incentives We receive incentives from vendors related to cooperative adver-tising allowances, infrastructure funding, volume rebates and other incentive agreements. These incentives are generally under
however, some of these incentives are negotiated on an ad-hoc basis to support specific programs mutually developed with the
received from vendors are recorded when they are earned as a reduction of inventory and as a reduction of cost of products sold as the related inventory is sold. Vendor incentives earned for specifically identified cooperative advertising programs and infra-structure funding are recorded as adjustments to selling, general and administrative expenses, and any amounts earned in excess of the related cost is recorded in the same manner as unrestricted volume rebates, as discussed above.
We also provide reserves for receivables on vendor programs for estimated losses resulting from vendors’ inability to pay or rejections by vendors of claims. Should amounts recorded as out-standing receivables from vendors be deemed uncollectible, addi-tional allowances may be required which could have an adverse effect on our consolidated financial results.
Goodwill, Intangible Assets and Other Long-Lived Assets The carrying value of goodwill is reviewed at least annually for impairment and may also be reviewed more frequently if current events and circumstances indicate a possible impairment. An impairment loss is charged to expense in the period identified. We also examine the carrying value of our intangible assets with finite lives, which includes capitalized software and development costs, purchased intangibles, and other long-lived assets as current
events and circumstances warrant determining whether there are any impairment losses. If indicators of impairment are present and future cash flows are not expected to be sufficient to recover the assets’ carrying amount, an impairment loss is charged to expense in the period identified. Factors that may cause a goodwill, intan-gible asset or other long-lived asset impairment include negative industry or economic trends and significant underperformance relative to historical or projected future operating results. Our val-uation methodologies include, but are not limited to, estimating the net present value of the projected cash flows of our reporting units. If actual results are substantially lower than our projections underlying these assumptions, or if market discount rates substan-tially increase, our future valuations could be adversely affected, potentially resulting in future impairment charges.
Income Taxes We record valuation allowances to reduce our deferred tax assets to the amount expected to be realized. In assessing the adequacy of a recorded valuation allowance, we consider all positive and negative evidence and a variety of factors including the scheduled reversal of deferred tax liabilities, historical and projected future taxable income, and prudent and feasible tax planning strategies. If we determine we would be able to use a deferred tax asset in the future in excess of its net carrying value, an adjustment to the deferred tax asset valuation allowance would be made to reduce income tax expense, thereby increasing net income in the period such determination was made. Should we determine that we are unable to realize all or part of our net deferred tax assets in the future, an adjustment to the deferred tax asset valuation allow-ance would be made to income tax expense, thereby reducing net income in the period such determination was made.
Contingencies We accrue for contingent obligations, including estimated legal costs, when the obligation is probable and the amount is reason-ably estimable. As facts concerning contingencies become known, we reassess our position and make appropriate adjustments to the financial statements. Estimates that are particularly sensitive to future changes include those related to tax, legal, and other regu-latory matters such as imports and exports, the imposition of international governmental controls, changes in the interpretation and enforcement of international laws (in particular related to items such as duty and taxation), and the impact of local eco-nomic conditions and practices, which are all subject to change as events evolve and as additional information becomes available during the administrative and litigation process.

continued
12
Recent Accounting Pronouncements and Legislation
See Note 1 of Notes to Consolidated Financial Statements for the discussion on recent accounting pronouncements and legislation.
Results of Operations
We do not consider stock-based compensation expense recognized under SFAS No. 123R in assessing the performance of our operating segments, therefore the Company is reporting this as a separate amount. The following table summarizes our net sales, change in net sales and operating income, by geographic region, for the fiscal years ended January 31, 2008, 2007 and 2006:
2008% of
net sales 2007% of
net sales 2006% of
net sales
Net sales by geographic region ($ in thousands):Americas . . . . . . . . . . . . . . . . . . . . . . . . . . . . . . . . . . . . . . . . . . . $11,003,893 47.0% $ 9,965,074 46.5% $ 9,464,667 46.2%Europe . . . . . . . . . . . . . . . . . . . . . . . . . . . . . . . . . . . . . . . . . . . . 12,419,185 53.0 11,475,371 53.5 11,018,184 53.8
Worldwide . . . . . . . . . . . . . . . . . . . . . . . . . . . . . . . . . . . . . . . . . $23,423,078 100.0% $21,440,445 100.0% $20,482,851 100.0%
2008 2007 2006
Year-over-year increase (decrease) in net sales (%): . . . . . . . . . . . . . . . . . . . . . . . . . . . . . . . . . . . . . . . . . . . . . . . . . . . . . . . . . . . . . . . . . . . . . . . . . . . . . . . . 10.4% 5.3% 11.6%
. . . . . . . . . . . . . . . . . . . . . . . . . . . . . . . . . . . . . . . . . . . . . . . . . . . . . . . . . . . . . . . . . . . . . . . . . . . . . . . . . . 8.2% 4.1% (2.0)%Europe (Euro) . . . . . . . . . . . . . . . . . . . . . . . . . . . . . . . . . . . . . . . . . . . . . . . . . . . . . . . . . . . . . . . . . . . . . . . . . . . . . . . . . (1.4)% 1.5% (0.6)%
. . . . . . . . . . . . . . . . . . . . . . . . . . . . . . . . . . . . . . . . . . . . . . . . . . . . . . . . . . . . . . . . . . . . . . . . . . . . . . 9.2% 4.7% 3.8%
2008% of
net sales 2007% of
net sales 2006% of
net sales
Operating income (loss) ($ in thousands):Americas . . . . . . . . . . . . . . . . . . . . . . . . . . . . . . . . . . . . . . . . . . . $ 170,685 1.55% $ 160,720 1.61% $ 154,839 1.64%Europe . . . . . . . . . . . . . . . . . . . . . . . . . . . . . . . . . . . . . . . . . . . . 27,956 0.23% (156,930) (1.37)% 8,456 0.08%
Stock-based compensation expense recognized under SFAS No. 123R . . . . . . . . . . . . . . . . . . . . . . . . . . . . . . . (10,287) (0.04)% (7,973) (0.04)% — —
Worldwide . . . . . . . . . . . . . . . . . . . . . . . . . . . . . . . . . . . . . . . . . $ 188,354 0.80% $ (4,183) (0.02)% $ 163,295 0.80%
We sell many products purchased from the world’s leading peripheral, system and networking manufacturers and software publishers. Products purchased from Hewlett Packard generated 28% of our net sales in fiscal 2008, 2007 and 2006, respectively. There were no other manufacturers or publishers that accounted for 10% or more of our net sales in the past three years.
MANAGEMENT’S DISCUSSION AND ANALYSIS OF FINANCIAL CONDITION AND RESULTS OF OPERATIONS

Tech Data Corporation 13
The following table sets forth our Consolidated Statement of Operations as a percentage of net sales for each of the three most recent fiscal years:
2008 2007 2006
Net sales . . . . . . . . . . . . . . . . . . . . 100.00% 100.00% 100.00%Cost of products sold . . . . . . . . . . 95.16 95.30 95.01
Gross profit . . . . . . . . . . . . . . . . . 4.84 4.70 4.99
Operating expenses: Selling, general and
administrative expenses. . . . . 3.91 3.98 4.04Goodwill impairment . . . . . . . . — 0.63 —
Loss on disposal of subsidiaries . . . . . . . . . . . . 0.06 — —
Restructuring charges . . . . . . . . 0.07 0.11 0.15
4.04 4.72 4.19
Operating income (loss) . . . . . . . . 0.80 (0.02) 0.80
Other expense (income):Interest expense . . . . . . . . . . . . 0.12 0.18 0.16
Discount on sale of accounts receivable . . . . . . . . 0.03 0.06 0.03
Interest income . . . . . . . . . . . . . (0.06) (0.05) (0.04) Net foreign currency
exchange (gain) loss . . . . . . . (0.02) — 0.01
0.07 0.19 0.16
Income (loss) from continuing operations before income taxes and minority interest . . . . 0.73 (0.21) 0.64
Provision for income taxes . . . . . . 0.28 0.26 0.53
Income (loss) from continuing operations before minority interest . . . . . . . . . . . . 0.45 (0.47) 0.11
Minority interest in net loss of joint venture . . . . . . . . . 0.01 — —
Income (loss) from continuing operations . . . . . . . . 0.46 (0.47) 0.11
Discontinued operations, net of tax . . . . . . . . . . . . . . . . . — 0.02 0.02
Net income (loss) . . . . . . . . . . . . . 0.46% (0.45)% 0.13%
Net Sales Our consolidated net sales were $23.4 billion in fiscal 2008, an increase of 9.2% when compared to fiscal 2007. On a regional basis, during fiscal 2008, net sales in the Americas increased by 10.4% over fiscal 2007 and increased by 8.2% in Europe (a decrease of 1.4% on a euro basis). Our fiscal 2008 sales performance in the Americas is primarily the result of stronger execution and increased sales and product management resources compared to the same period of the prior year. These actions delivered strong growth across the Americas, most notably in the direct marketer and small- and medium-sized business space. We are generally pleased with our sales performance in Europe and we believe it is a reflec-tion of our improved stability and stronger execution in the major-ity of our European operations. The year-over-year sales decline in euros can largely be attributed to our conscious efforts to remix our customer portfolio across Europe to those markets providing more acceptable operating margins and/or requiring less working capital to serve. These efforts are consistent with our focus on increasing our overall return on capital employed in the European region. Declining average selling prices for the majority of the products we sell continued to have an offsetting impact on our sales growth results within both the Americas and Europe.
Our consolidated net sales were $21.4 billion in fiscal 2007, an increase of 4.7% when compared to fiscal 2006. On a regional basis, during fiscal 2007, net sales in the Americas increased by 5.3% over fiscal 2006 and increased by 4.1% in Europe (an increase of 1.5% on a euro basis). Our sales performance in the Americas is primarily due to stronger sales to direct marketers and retailers compared to the prior year somewhat offset by declining average selling prices of many of the products we sell. The increase in European sales in fiscal 2007 is primarily the result of the improved IT demand experienced in the second semester of fiscal 2007 and improved stability in our European operations partially offset by much lower demand in Western Europe during the first semester of fiscal 2007 (particularly in the second quarter).

continued
14
Gross Profit Gross profit as a percentage of net sales (“gross margin”) during fiscal 2008 was 4.84%, a 14 basis point increase from 4.70% in fiscal 2007. The increase in gross margin is primarily attributable to continued improvements in our inventory and pricing manage-ment practices in Europe as well as continued changes in the customer and product mix worldwide, partially offset by the com-petitive pricing conditions in the Americas.
Gross margin during fiscal 2007 was 4.70%, a decrease from 4.99% in fiscal 2006. The decrease in gross margin is primarily attributable to the more challenging pricing environment in Europe, particularly in the second quarter of fiscal 2007 and the internal distractions of management related to the final phases of our comprehensive IT systems upgrade and harmonization project and the implementation of the restructuring program in Europe, as discussed above. Since the completion of these initiatives dur-ing the third quarter of fiscal 2007, we saw our European opera-tions begin to stabilize and gross margins in the region improve sequentially during the third and fourth quarters of fiscal 2007.
We continue to remain cautiously optimistic as the competitive environment and changes in general economic conditions within the markets in which we conduct business may hinder our ability to maintain and/or continue to improve gross margin from its current level.
Operating Expenses Selling, general and administrative expenses (“SG&A”) SG&A as a percentage of net sales decreased to 3.91% in fiscal 2008, compared to 3.98% in fiscal 2007. The decrease in SG&A as a percentage of net sales in fiscal 2008 is primarily the result of improvements in credit performance, productivity improvements and the leveraging of our fixed costs in Europe, offset by strategic investments made in personnel and information systems to support our long-term growth and productivity initiatives.
In absolute dollars, worldwide SG&A increased by $64.3 mil-lion in fiscal 2008 compared to fiscal 2007. The year-over-year increase in SG&A is primarily attributable to the stronger euro
longer-term growth initiatives, start-up and other operating expenses related to the Brightstar joint venture (which is consoli-dated for financial statement reporting purposes) and an addi-tional $2.3 million of stock compensation expense related to SFAS No. 123R. These increases were partially offset by a reduction in
credit costs, as discussed above, and cost decreases of $8.6 million of external consulting costs related to the European restructuring program incurred during fiscal 2007 that did not recur in fiscal 2008.
SG&A as a percentage of net sales decreased to 3.98% in fiscal 2007, compared to 4.04% in fiscal 2006. The decrease in SG&A as a percentage of net sales in fiscal 2007 is the result of improve-ments in productivity, particularly in Europe, where we began to realize the benefits associated with our restructuring efforts.
In absolute dollars, worldwide SG&A increased by $22.8 mil-lion in fiscal 2007 compared to fiscal 2006. The increase in SG&A in fiscal 2007 is primarily attributable to an increase in credit costs in both the Americas and Europe due to higher than anticipated bankruptcies and other credit losses, increased labor costs in the
compared to fiscal 2006, and an additional $8.0 million of com-pensation expense related to the adoption of SFAS No. 123R in fiscal 2007. These increases were offset in part by the productivity improvements and benefits realized in Europe from the restructur-ing program, which we completed during the third fiscal quarter of 2007. SG&A includes external consulting costs related to the European restructuring program of $8.6 million and $9.6 million for fiscal 2007 and 2006, respectively.
Goodwill Impairment In fiscal 2007, due to certain indicators of impairment within our European reporting unit, the Company performed an impairment test for goodwill as of July 31, 2006. This testing included the determination of the European reporting unit’s fair value using market multiples and discounted cash flows modeling. The Company’s reduced earnings and cash flow forecast for our European region resulted in the Company determining that a goodwill impairment charge was necessary. As of July 31, 2006, the Company recorded a $136.1 million non-cash charge for the goodwill impairment in Europe.
Restructuring Charges Restructuring charges were $16.1 million and $23.8 million during fiscal 2008 and 2007, respectively. As further discussed below, these restructuring charges include the charges related to the closure of the German logistics center, announced in the second quarter of fiscal 2008, and charges related to the European restructuring program completed in October 2006.
MANAGEMENT’S DISCUSSION AND ANALYSIS OF FINANCIAL CONDITION AND RESULTS OF OPERATIONS

Tech Data Corporation 15
Closure of European Logistics Center On May 1, 2007, our Board of Directors approved the exit from our logistics center in Germany (the “Moers logistics center”). The decision to exit this logistics center was made to enable the Company to capitalize on the long-term synergies of hav-ing one logistics center serving Germany, Austria and the Czech Republic and to reduce the Company’s expenses. In connection with the Moers logistics center exit, Tech Data is expanding its logistics center located in Bor, Czech Republic. The Company expects the net result of these transactions to be a reduction in our future operating expenses.
During the year ended January 31, 2008, the Company completed its exit of the Moers logistics facility and recorded $18.1 million in restructuring charges related to the closure, comprised of $8.7 million of workforce reductions and $9.4 million for facility costs and other fixed asset write-offs.
European Restructuring Program As discussed earlier in this MD&A, in May 2005, we announced a formal restructuring program to better align the European operating cost structure with the business environment prevail-ing at the time. As of October 31, 2006, the initiatives related to the European restructuring program had been completed.
During fiscal 2008, we recorded credits of $2.0 million related to changes in estimates of previously recorded restruc-turing accruals, comprised of a $1.6 million credit for facility costs and a $0.4 million credit for workforce reductions. During fiscal 2007, we incurred $23.8 million related to the restructur-ing program, comprised of $20.0 million for workforce reduc-tions and $3.8 million for facility costs. In total, from inception through completion of the program, we incurred $54.7 million related to the restructuring program, comprised of $38.9 million for workforce reductions and $15.8 million for facility costs.
Loss on Disposal of Subsidiaries We incurred losses on the disposal of subsidiaries of $14.5 million during fiscal 2008 for charges related to both the closure of our
million loss includes $10.8 million of losses related to the closure
operations includes a $9.8 million impairment on our investment
recorded in shareholders’ equity as a component of other com-prehensive income) and $1.0 million in severance costs and certain asset write-offs related to the exit. The $3.7 million loss related to
the sale of our Israel operations includes a $2.7 million impairment on our investment in Israel due to a foreign currency exchange loss (previously recorded in shareholders’ equity as a component of other comprehensive income) and $1.0 million in selling costs (see further discussion in Note 7 of Notes to Consolidated Financial Statements).
Interest Expense, Discount on Sale of Accounts Receivable, Interest Income, Foreign Currency Exchange Gains/Losses Interest expense decreased 25.3% to $28.8 million in fiscal 2008 compared to $38.5 million in the prior year. The decrease in inter-est expense in fiscal 2008 is primarily attributable to two factors. First, we issued $350.0 million of convertible senior debentures in the fourth quarter of fiscal 2007, which bear interest at 2.75%. Second, we improved our daily management of our cash conver-sion cycle, which resulted in lower average outstanding debt balances. The interest expense reduction resulting from these two factors was partially offset by higher interest rates on revolving credit loans during fiscal 2008 compared to the prior year.
Interest expense increased 22.5% to $38.5 million in fiscal 2007 compared to $31.4 million in fiscal 2006. The increase in interest expense in fiscal 2007 is primarily attributable to the repurchase of the $290.0 million convertible subordinated deben-tures in the fourth quarter of fiscal 2006 using revolving credit facilities, which have higher short-term borrowing rates. In addi-tion, average short-term interest rates increased in comparison to the prior fiscal year, resulting in an increase in interest expense in fiscal 2007 compared to fiscal 2006.
Discount on the sale of accounts receivable totaled $7.2 mil-lion, $12.5 million and $5.5 million, respectively, in fiscal 2008, 2007 and 2006. The discount is associated with the accounts receivable purchase facility agreements executed in fiscal 2006 (see further discussion below in this MD&A and in Note 4 of Notes to Consolidated Financial Statements). The decrease in the dis-count on sale of accounts receivables in fiscal 2008 compared to fiscal 2007 is primarily related to a decrease in the average period outstanding of the accounts receivables sold during fiscal 2008 compared to fiscal 2007. The increase in the discount on sale of accounts receivable from fiscal 2006 to fiscal 2007 reflects the fact that the Company began selling accounts receivable under the program in the second quarter of fiscal 2006 which resulted in an increase in the average amount of accounts receivables sold under the programs and an increase in the discount rates charged in fiscal 2007 compared to fiscal 2006.

continued
16
Interest income increased 38.2% to $13.5 million in fiscal 2008 compared to $9.8 million in fiscal 2007. The increase in interest income during fiscal 2008 is primarily attributable to higher aver-age cash balances available for investment and higher interest rates earned on short-term cash investments compared to the prior year. Interest income increased 31.5% to $9.8 million in fiscal 2007 compared to $7.4 million in fiscal 2006. The increase in interest income during fiscal 2007 compared to fiscal 2006 is primarily attributable to higher interest rates earned on short-term cash investments and higher average investment balances compared to the prior fiscal year.
We realized a net foreign currency exchange gain of $4.0 mil-lion in fiscal 2008 compared to a net foreign currency exchange gain of $0.1 million in fiscal 2007 and a net foreign currency exchange loss of $1.8 million during fiscal 2006. We recognize net foreign currency exchange gains and losses primarily due to the
lesser extent, versus other currencies. It continues to be our goal to minimize foreign currency exchange gains and losses through an effective hedging program. Our hedging policy prohibits speculative foreign currency exchange transactions.
Minority Interest in Net Loss of Joint Venture Minority interest was $3.6 million in fiscal 2008 and reflects the loss of our European joint venture attributable to Brightstar Corporation’s ownership share in the joint venture. The minority interest represents Brightstar Corporation’s share of the joint ven-ture losses, which is comprised primarily of start-up costs, as the joint venture is a consolidated subsidiary in our financial state-ments. The joint venture commenced sales in the third quarter of fiscal 2008, but sales to date have not been significant.
Provision for Income Taxes Our effective tax rate for continuing operations was 38.4% in fis-cal 2008 and (122.2)% in fiscal 2007. The change in the effective tax rate during fiscal 2008 compared to fiscal 2007 is primarily the result of the fiscal 2007 goodwill impairment in Europe of $136.1 million, which is non-deductible for tax purposes, and an increase in net operating losses in certain tax jurisdictions for which no tax benefit was recognized. The change in the effective tax rate between fiscal 2008 and fiscal 2007 was also impacted by the reversal of a $7.5 million deferred tax valuation allowance for Brazil in the fourth quarter of fiscal 2008. The reversal of the $7.5 million valuation allowance was recorded as an income tax benefit (see Note 11 of Notes to Consolidated Financial Statements for further discussion). In addition, in fiscal 2007, we recorded an
increase in the deferred tax valuation allowance related to certain jurisdictions in Europe of $8.4 million related to net operating losses recorded in previous years.
On an absolute dollar basis, the provision for income taxes increased 17.4% to $65.2 million in fiscal 2008 compared to $55.5 million in fiscal 2007. The increase in the provision for income taxes is primarily the result of increased income within both the Americas and Europe in fiscal 2008 compared to fiscal 2007, off-set by the $7.5 million reversal of the Brazilian valuation allowance on deferred tax assets discussed above and the effect of the $8.4 million increase in the deferred tax valuation allowance related to certain jurisdictions in fiscal 2007.
Our effective tax rate for continuing operations was (122.2)% in fiscal 2007 and 82.6% in fiscal 2006. The change in the effective tax rate during fiscal 2007 compared to fiscal 2006 is primarily the result of the previously discussed goodwill impairment in Europe of $136.1 million, which is non-deductible for tax purposes, and an increase in net operating losses in certain tax jurisdictions for which no tax benefit was recognized. Additionally, we recorded an increase in the deferred tax valuation allowance related to certain jurisdictions in Europe of $8.4 million and $56.0 million in fiscal years 2007 and 2006, respectively, related to net operating losses recorded in previous years. On an absolute dollar basis, the provision for income taxes decreased 49.1% to $55.5 million in fiscal 2007 as compared to $109.0 million in fiscal 2006 primarily as a result of the decrease in the adjustment to the deferred tax asset valuation allowance.
While we believe our restructuring efforts are improving the operating performance within the European operations, we deter-mined the respective increases in the valuation allowances on deferred tax assets in fiscal 2007 to be appropriate due to cumula-tive losses realized or expected to be realized within the respective fiscal year, after considering the effect of prudent and feasible tax planning strategies. To the extent we generate future consistent taxable income within those operations currently requiring the valuation allowance, the valuation allowance on the related deferred tax assets will be reduced, thereby reducing tax expense and increasing net income in the same period. The underlying net operating loss carryforwards remain available to offset future tax-able income in the specific jurisdictions requiring the valuation allowance, subject to applicable tax laws and regulations.
rate of 35% during these periods due to the relative mix of earn-ings or losses within the tax jurisdictions in which we operate around the world such as: a) losses in tax jurisdictions where we
MANAGEMENT’S DISCUSSION AND ANALYSIS OF FINANCIAL CONDITION AND RESULTS OF OPERATIONS

Tech Data Corporation 17
where we have previously recorded a valuation allowance on
because such earnings are planned to be reinvested indefinitely
The overall effective tax rate will continue to be dependent upon the geographic distribution of our worldwide earnings or losses and changes in tax laws or interpretations of these laws in these operating jurisdictions. We monitor the assumptions used in estimating the annual effective tax rate and adjust these estimates accordingly. If actual results differ from these estimates, future income tax expense could be materially affected.
Our future effective tax rates could be adversely affected by lower earnings than anticipated in countries with lower statutory rates, changes in the relative mix of taxable income and taxable loss jurisdictions, changes in the valuation of our deferred tax assets or liabilities or changes in tax laws or interpretations thereof. In addition, our income tax returns are subject to continuous examination by the Internal Revenue Service and other tax authorities. We regularly assess the likelihood of adverse out-comes from these examinations to determine the adequacy of our provision for income taxes. To the extent we prevail in matters for which accruals have been established or are required to pay amounts in excess of such accruals, our effective tax rate could be materially affected.
Discontinued Operations, Net of Tax The results of operations and the gain on sale of the Training Business have been reclassified and presented as “discontinued operations, net of tax,” within the Consolidated Statement of Operations for all periods presented. In fiscal 2007, we realized income from discontinued operations, net of tax, of $3.9 million, comprised of a $3.8 million gain, net of tax, on the sale of the Training Business and $0.1 million of income from operations of the Training Business prior to the sale in March 2006. We realized $3.6 million of income from discontinued operations, net of tax, in fiscal 2006.
Impact of Inflation
During the fiscal years ended January 31, 2008, 2007 and 2006, we do not believe that inflation had a material impact on our consolidated operations or on our financial position.
Quarterly Data—Seasonality
Our quarterly operating results have fluctuated significantly in the past and will likely continue to do so in the future as a result of currency fluctuations and seasonal variations in the demand for the products and services we offer. Narrow operating margins may magnify the impact of these factors on our operating results. Recent historical seasonal variations have included an increase in European demand during our fiscal fourth quarter and decreased demand in other fiscal quarters, particularly quarters which include summer months. Given that a significant portion of our revenues are derived from Europe, the worldwide results closely follow the seasonality trends in Europe. Additionally, the life cycles of major products, as well as the impact of future acquisitions and dispositions, may also materially impact our business, financial condition, or results of operations. See Note 16 of Notes to Consolidated Financial Statements for further information regarding our quarterly results.
Liquidity and Capital Resources
Our discussion of liquidity and capital resources includes an analy-sis of our cash flows and capital structure, which includes both continuing and discontinued operations for all periods presented. The absence of cash flows from discontinued operations is not expected to affect the Company’s future liquidity.
The following table summarizes Tech Data’s Consolidated Statement of Cash Flows for the fiscal years ended January 31, 2008, 2007 and 2006:
Years ended January 31,
2008 2007 2006
(In thousands)Net cash provided by (used in):
Operating activities . . . . . . . . . $ 357,422 $ (13,988) $ 257,439Investing activities . . . . . . . . . . (52,701) (23,666) (51,583)Financing activities . . . . . . . . . (136,933) 121,753 (235,438)
Effect of exchange rate changes on cash and cash equivalents . . . . . . . . . 14,546 24,242 (8,809)
Net increase (decrease) in cash and cash equivalents. . . . $ 182,334 $108,341 $ (38,391)

18
MANAGEMENT’S DISCUSSION AND ANALYSIS OF FINANCIAL CONDITION AND RESULTS OF OPERATIONS
continued
Net cash provided by operating activities was $357.4 million in fiscal 2008 compared to $14.0 million of cash used in operations in fiscal 2007. The $357.4 million cash provided by operations in fiscal 2008 was due primarily to our earnings and the timing of both cash receipts from our customers and payments to our ven-dors. We continue to focus on working capital management by monitoring several key metrics, including our cash conversion cycle (also referred to as “net cash days”) and owned inventory levels, that we use to manage our working capital. Our net cash days are defined as days of sales outstanding in accounts receiv-able (“DSO”) plus days of supply on hand in inventory (“DOS”), less days of purchases outstanding in accounts payable (“DPO”). Owned inventory is calculated as the difference between our inventory and accounts payable balances divided into the inven-tory balance. Our net cash days improved to 28 days at the end of fiscal 2008 compared to 30 days at the end of fiscal 2007. Our owned inventory level (the percentage of inventory not financed by our vendor partners) was a negative 39% at the end fiscal 2008, meaning our accounts payable balances exceeded our inventory balances by 39%. This compares to negative owned inventory of 29% at the end fiscal 2007.
The following table presents the components of Tech Data’s cash conversion cycle, in days, as of January 31, 2008, 2007 and 2006:
As of January 31,
2008 2007 2006
Days of sales outstanding . . . . . . . . . . . . . . . 37 37 36Days of supply in inventory . . . . . . . . . . . . . . 24 24 26Days of purchases outstanding . . . . . . . . . . . (33) (31) (33)
Cash conversion cycle (days) . . . . . . . . . . . . 28 30 29
Net cash used in investing activities of $52.7 million during fiscal 2008 was primarily the result of our purchase of certain assets from Actebis Switzerland AG for $21.5 million and capital expenditures of $38.4 million for the continuing expansion and upgrading of our IT systems, office facilities and equipment for our logistics centers, offset by $7.2 million of proceeds received from the sale of our Israel operations. We expect to make total capital expenditures of approximately $40.0 million during fiscal 2009 for equipment and machinery in our logistics centers, office facilities and IT systems.
Net cash used in investing activities of $23.7 million during fiscal 2007 was primarily due to $43.7 million of expenditures for the continuing expansion and upgrading of our IT systems, office facilities and equipment for our logistics centers, offset by $16.5 million proceeds received from the sale of the Training Business and $3.6 million of proceeds from the sale of property and equipment.
Net cash used in financing activities of $136.9 million during fiscal 2008 primarily reflects $56.3 million of net repayments on our revolving credit lines and long-term debt and $100.0 million used in the repurchase of 2,698,654 shares of our common stock, offset by $12.5 million in proceeds received for the reissuance of treasury stock related to the exercises of equity-based incentives and purchases made through our Employee Stock Purchase Plan (“ESPP”) and $9.0 million of capital contributions from our partner in the European joint venture discussed above.
Net cash provided by financing activities of $121.8 million dur-ing fiscal 2007 is primarily the result of net proceeds of $342.6 million received from the issuance of $350.0 million of convertible debentures in December 2006, $25.2 million in proceeds received for the reissuance of treasury stock related to exercises of equity-based incentives and purchases made through our ESPP, offset by $166.4 million of net repayments on our revolving credit lines and long-term debt and the use of $80.1 million for the repurchase of 2,222,720 shares of our common stock.
As of January 31, 2008, we maintained a Receivables Securitization Program with a syndicate of banks, amended in December 2007, which allows us to transfer an undivided interest
basis, to provide security or collateral for borrowings up to $305.0 million. We pay interest (rate of 5.16% at January 31, 2008) on the Receivables Securitization Program at designated commercial paper rates plus an agreed-upon margin. Additionally, we main-tained a $250.0 million Multi-currency Revolving Credit Facility with a syndicate of banks, amended in March 2007, which expires in March 2012. We pay interest (rate of 3.77% at January 31, 2008) under this facility at the applicable LIBOR rate plus a margin based on our credit ratings. In addition to these credit facilities, we maintained lines of credit and overdraft facilities totaling approximately $768.5 million at January 31, 2008 (average interest rate on the borrowing was 5.33% at January 31, 2008).

Tech Data Corporation 19
The total capacity of the aforementioned credit facilities was approximately $1.3 billion, of which $18.3 million was outstanding at January 31, 2008. Our credit agreements contain limitations on the amounts of annual dividends and repurchases of common stock. Additionally, the credit agreements require compliance with certain warranties and covenants. The financial ratio covenants contained within the credit agreements include a debt to capital-ization ratio, an interest to EBITDA (earnings before interest, taxes, deprecation and amortization) ratio, and a tangible net worth requirement. At January 31, 2008, we were in compliance with all such covenants. The ability to draw funds under these credit facili-ties is dependent upon sufficient collateral (in the case of the Receivables Securitization Program) and meeting the aforemen-tioned financial covenants, which may limit our ability to draw the full amount of these facilities. As of January 31, 2008, the maxi-mum amount that could be borrowed under these facilities, in consideration of the availability of collateral and the financial covenants, was approximately $753.1 million.
At January 31, 2008, we had issued standby letters of credit of $26.2 million. These letters of credit typically act as a guarantee of payment to certain third parties in accordance with specified terms and conditions. The issuance of these letters of credit reduces our available capacity under the above mentioned facilities by the same amount.
In December 2006, we issued $350.0 million of convertible senior debentures due 2026. The debentures bear interest at 2.75% per year. We pay interest on the debentures on June 15 and December 15 of each year, beginning on June 15, 2007. In addition, beginning with the period commencing on December 20, 2011 and ending on June 15, 2012 and for each six-month period thereafter, we will pay contingent interest on the interest payment date for the applicable interest period, if the market price of the debentures exceeds specified levels. The con-vertible senior debentures are convertible into our common stock and cash anytime after June 15, 2026, or i) if the market price of the common stock, as defined, exceeds 135% of the conversion price per share of common stock, or ii) if the Company calls the debentures for redemption, or iii) upon the occurrence of certain corporate transactions, as defined. Holders have the right to con-vert the debentures into 18.4310 shares per $1,000 principal amount of debentures, equivalent to a conversion price of approx-
equal to the lesser of the aggregate principal amount of the debentures to be converted and our total conversion obligation and shares of our common stock in respect of the remainder, if any, of our conversion obligation. Holders have the option to
require us to repurchase the debentures in cash on any of the fifth, tenth or fifteenth anniversary dates from the issue date at 100% of the principal amount plus accrued interest to the repur-chase date. The debentures are redeemable in whole or in part for cash at our option at any time on or after December 20, 2011. Additionally, the debentures are senior, unsecured obligations and rank equally in right of payment with all of our other unse-cured and unsubordinated indebtedness. The debentures are effectively subordinated to all of our existing and future secured debt and are structurally subordinated to the indebtedness and other liabilities of our subsidiaries. The proceeds from the offering were used to pay off short-term debt and for other general corporate purposes.
In September 2007, our Board of Directors authorized a share repurchase program of up to $100.0 million of our common stock. As of January 31, 2008, the share repurchase program authorized in September 2007 was complete. During fiscal 2008, we repur-chased 2,698,654 shares comprised of 2,698,126 shares pur-chased in connection with the share repurchase program and 528 shares purchased outside of the stock repurchase program, at an average of $37.06 per share, for a total cost, including expenses, of $100.0 million.
In fiscal 2006, our Board of Directors also authorized a share repurchase program of up to $200.0 million of our common stock. Share repurchases under the program were made on the open market through block trades or otherwise. During fiscal 2007, we repurchased 2,222,720 shares comprised of 2,220,132 shares pur-chased in conjunction with our share repurchase program and 2,588 shares purchased outside of the stock repurchase program, at an average of $36.03 per share, for a total cost, including expenses, of $80.1 million. As of October 31, 2006, the share repurchase program authorized in fiscal 2006 was completed.
For our share repurchase programs, the number of shares pur-chased and the timing of the purchases was based on working capital requirements, general business conditions and other fac-tors, including alternative investment opportunities. Shares we repurchase are held in treasury for general corporate purposes, including issuances under employee equity incentive plans.
Our debt to capital ratio was 17% at January 31, 2008. We believe that our existing sources of liquidity, including cash resources and cash provided by operating activities, supplemented as necessary with funds available under our credit arrangements, will provide sufficient resources to meet our present and future working capital and cash requirements for at least the next 12 months. Changes in our credit rating or other market factors may increase our interest expense or other costs of capital, or

continued
20
capital may not be available to us on acceptable terms to fund our working capital needs. The Company will continue to need addi-tional financing, including debt financing. The inability to obtain such sources of capital could have an adverse effect on the Company’s business. The Company’s credit facilities contain vari-ous financial and other covenants that may limit the Company’s ability to borrow or limit the Company’s flexibility in responding to business conditions.
Contractual Obligations
As of January 31, 2008, future payments of long-term debt and amounts due under future minimum lease payments, including minimum commitments under IT outsourcing agreements, are as follows (in thousands):
Operating leases
Capital leases
Long-termdebt Total
Fiscal year:2009 . . . . . . . . . . . . . . $ 65,663 $ 2,253 $ — $ 67,9162010. . . . . . . . . . . . . . . 54,293 2,065 — 56,3582011 . . . . . . . . . . . . . . . 46,138 2,065 — 48,2032012 . . . . . . . . . . . . . . . 27,323 2,065 350,000 379,3882013 . . . . . . . . . . . . . . . 25,498 2,065 — 27,563Thereafter . . . . . . . . . . 50,810 8,335 — 59,145
Total payments . . . . . . . 269,725 18,848 350,000 638,573Less amounts
representing interest . . . . . . . . . . . — (3,966) — (3,966)
Total principal payments . . . . . . . . . $ 269,725 $14,882 $350,000 $634,607
Fair value renewal and purchase options and escalation clauses exist for a substantial portion of the operating leases included above. Purchase orders for the purchase of inventory and other goods and services are not included in the table above. We are not able to determine the aggregate amount of such purchase orders that represent contractual obligations, as purchase orders typically represent authorizations to purchase rather than binding agreements. For the purposes of this table, contractual obligations for purchase of goods or services are defined as agreements that are enforceable and legally binding on Tech Data and that specify all significant terms, including: fixed or minimum quantities to be
approximate timing of the transaction. Our purchase orders are based on our current demand expectations and are fulfilled by our vendors within short time horizons. We do not have significant non-cancelable agreements for the purchase of inventory or other goods specifying minimum quantities or set prices that exceed our
expected requirements for the next three months. We also enter
under these contracts were not significant and the contracts generally contain clauses allowing for cancellation without significant penalty.
At January 31, 2008, we have $13.7 million recorded as a current liability for uncertain tax positions under FIN 48. We are not able to reasonably estimate the timing of long-term payments, or the amount by which our liability will increase or decrease over
of $5.0 million has not been included in the contractual obliga-tions table above (see Note 11 of Notes to Consolidated Financial Statements).
Off-Balance Sheet Arrangements
Synthetic Lease Facility We have a Synthetic Lease facility with a group of financial institu-tions under which we lease certain logistics centers and office facilities from a third-party lessor. The Synthetic Lease expires in fiscal 2009 and we intend to renew the lease for an additional five years. At any time during the lease term, we may, at our option, purchase up to four of the seven properties, at an amount equal to each property’s cost. If we elect to remarket the properties, we have guaranteed the lessor a percentage of the cost of each of the properties, in an aggregate amount of approximately $118.4 million (the “residual value”). We pay interest on the Synthetic Lease at LIBOR plus an agreed-upon margin. The Synthetic Lease contains covenants that must be complied with, similar to the cov-enants described in certain of the credit facilities discussed above and in Note 9 of Notes to Consolidated Financial Statements. The amount funded under the Synthetic Lease (approximately $133.2 million at January 31, 2008) is treated as debt under the definition of the covenants required under both the Synthetic Lease and the credit facilities. As of January 31, 2008, we were in compliance with all such covenants.
In January 2007, we sold approximately 6 acres of excess land located in Miami, Florida. The sale was executed pursuant to the “excess sale” provisions of the Synthetic Lease agreement and resulted in a gain of $3.6 million recorded during the quarter ended January 31, 2007. This gain is included within SG&A in our Consolidated Statement of Operations.
MANAGEMENT’S DISCUSSION AND ANALYSIS OF FINANCIAL CONDITION AND RESULTS OF OPERATIONS

Tech Data Corporation 21
The sum of future minimum lease payments under the Synthetic Lease at January 31, 2008 was approximately $3.8 million. Properties leased under the Synthetic Lease facility are located in
Bend, Indiana. The Synthetic Lease has been accounted for as an operating
lease. FASB Interpretation (“FIN”) No. 46 requires us to evaluate whether an entity with which we are involved meets the criteria of a variable interest entity (“VIE”) and, if so, whether we are required to consolidate that entity. We have determined that the third-party lessor of this synthetic lease facility does not meet the criteria of a VIE and, therefore, is not subject to the consolidation provisions of FIN No. 46.
Trade Receivables Purchase Facility Agreements We have uncommitted revolving trade receivables purchase facility agreements (the “Receivables Facilities”) with third-party financial institutions to sell accounts receivable on a non-recourse basis. We use the Receivables Facilities as a source of working capital funding. The Receivables Facilities limit the amount of purchased accounts receivable the financial institutions may hold to $428.2 million at January 31, 2008, based on currency exchange rates at
accounts receivable (the “Receivables”) in exchange for cash less a discount based on LIBOR plus a margin. Such transactions have been accounted for as a true sale, in accordance with SFAS No. 140, “Accounting for Transfers and Servicing of Financial Assets and Extinguishment of Liabilities.” The Receivables Facilities, which have various expiration dates, require that we continue to service, administer and collect the sold accounts receivable.
During fiscal 2008, 2007 and 2006, we received gross pro-ceeds of $1.2 billion, $1.3 billion and $796.1 million, respectively, from the sale of the Receivables and recognized related discounts totaling $7.2 million, $12.5 million and $5.5 million, respectively. The proceeds, net of the discount incurred, are reflected in the Consolidated Statement of Cash Flows in operating activities within cash received from customers and the change in accounts receivable. Prior to the second quarter of fiscal 2006, the Company did not utilize the Receivables Facilities as a source of funding.
Guarantees As is customary in the IT industry, to encourage certain customers to purchase product from us, we have arrangements with certain finance companies that provide inventory-financing facilities for our customers. In conjunction with certain of these arrangements, we have agreements with the finance companies that would require us to repurchase certain inventory, which might be repos-sessed from the customers by the finance companies. Due to vari-ous reasons, including among other items, the lack of information regarding the amount of saleable inventory purchased from us still on hand with the customer at any point in time, our repurchase obligations relating to inventory cannot be reasonably estimated. Repurchases of inventory by us under these arrangements have been insignificant to date. We also provide additional financial guarantees to finance companies on behalf of certain customers. The majority of these guarantees are for an indefinite period of time, where we would be required to perform if the customer is in default with the finance company. The Company reviews the underlying credit for these guarantees on at least an annual basis. As of January 31, 2008 and 2007, the aggregate amount of guarantees under these arrangements totaled approximately $19.4 million and $11.5 million, respectively, of which approximately $14.7 million and $7.0 million, respectively, was outstanding. We believe that, based on historical experience, the likelihood of a material loss pursuant to both of the above guarantees is remote.
Additionally, in connection with the sale of the Training Business discussed in Note 3 of Notes to Consolidated Financial Statements, we continue to negotiate the assignment of several of the related facility lease obligations with the lessors of such prop-erties. To the extent the lessors are unwilling to agree to a direct lease arrangement with the purchaser, we will remain liable in the event of default by the purchaser of the Training Business. The majority of these lease obligations expire at various dates over the next four years and would require that we make all required payments under the lease agreements in the event of default by the purchaser. The maximum potential amount of future pay-ments (undiscounted) that we could be required to make under the guarantees is approximately $7.2 million as of January 31, 2008. We believe that the likelihood of a material loss pursuant to these guarantees is remote.
We also provide residual value guarantees related to our Synthetic Lease which have been recorded at the estimated fair value of the residual value guarantees.

22
continued
Qualitative and Quantitative Disclosures About Market Risk
As a large global organization, we face exposure to adverse move-ments in foreign currency exchange rates. These exposures may change over time as business practices evolve and could have a material impact on our financial results in the future. In the nor-mal course of business, we employ established policies and proce-dures to manage our exposure to fluctuations in the value of foreign currencies. It is our policy to utilize financial instruments to reduce risks where internal netting cannot be effectively employed. Additionally, we do not enter into derivative instruments for speculative or trading purposes.
Our primary foreign currency exposure relates to transactions in Europe, where the currency collected from customers can be different from the currency used to purchase the product. During fiscal 2008 and 2007, the underlying exposures are denominated
Canadian dollar, Czech koruna, Danish krone, euros, Norwegian krone, Polish zloty, Swedish krona and Swiss franc. Our foreign currency risk management objective is to protect our earnings and cash flows from the adverse impact of exchange rate changes and is managed by using foreign currency forward, option and swap contracts to hedge both intercompany and third party a) loans, b) accounts receivable and c) accounts payable.
We are also exposed to changes in interest rates primarily as a result of our short-term and long-term debt used to maintain liquidity and to finance working capital, capital expenditures and business expansion. Interest rate risk is also present in the forward foreign currency contracts hedging intercompany and third-party loans. Our interest rate risk management objective is to limit the impact of interest rate changes on earnings and cash flows and to minimize overall borrowing costs. To achieve our objective, we use a combination of fixed and variable rate debt. The nature and amount of our long-term and short-term debt can be expected to vary as a result of future business requirements, market conditions and other factors. As of January 31, 2008 and 2007, approxi-mately 95% and 83%, respectively, of our outstanding debt had fixed interest rates. We utilize various financing instruments, such as receivables securitization, leases, revolving credit facilities, con-vertible senior debentures and trade receivable purchase facilities, to finance working capital needs.
In order to provide an assessment of the Company’s foreign currency exchange rate and interest rate risk, the Company per-formed a sensitivity analysis using a value-at-risk (“VaR”) model. The VaR model consisted of using a Monte Carlo simulation to generate 1,000 random market price paths. The VaR model deter-mines the potential impact of the fluctuation in foreign exchange rates and interest rates assuming a one-day holding period, normal market conditions and a 95% confidence level. The VaR is the maximum expected loss in fair value for a given confidence inter-val to the Company’s foreign exchange and debt portfolio due to adverse movements in the rates. The model is not intended to represent actual losses but is used as a risk estimation and man-agement tool. Firm commitments, assets and liabilities denomi-nated in foreign currencies were excluded from the model.
Prior to January 31, 2008, the Company presented market risk exposures using a tabular format. In an effort to provide more meaningful information as to the Company’s exposure to future fluctuations in foreign currency exchange rates and interest rates the Company has made the change to present market risk exposures using the VaR model.
The following table represents the estimated maximum poten-tial one-day loss in fair value, calculated using the VaR model at January 31, 2008 and 2007. We believe that the hypothetical loss in fair value of our foreign exchange derivatives would be offset by the gains in the value of the underlying transactions being hedged.
VaR as of January 31,
2008 2007
(in thousands)Currency rate sensitive
financial instruments . . . . . . . . . . . . . . . . . . . $(2,143.3) $(1,191.8)Interest rate sensitive
financial instruments . . . . . . . . . . . . . . . . . . . (407.7) (501.0)
Combined portfolio . . . . . . . . . . . . . . . . . . . . . $(2,551.0) $(1,692.8)
Actual future gains and losses associated with the Company’s derivative positions may differ materially from the analyses per-formed as of January 31, 2008 due to the inherent limitations associated with predicting the changes in the timing and amount of interest rates, foreign currency exchanges rates, and the Company’s actual exposures and positions.
MANAGEMENT’S DISCUSSION AND ANALYSIS OF FINANCIAL CONDITION AND RESULTS OF OPERATIONS
Tech Data Corporation 23
Risk Factors
The following are certain risk factors that could affect our busi-ness, financial position and results of operations. These risk factors should be considered in connection with evaluating the forward-looking statements contained in this Annual Report because these factors could cause the actual results and conditions to differ materially from those projected in the forward-looking statements. Before you buy our common stock or other securities, you should know that making such an investment involves risks, including the risks described below. The risks that have been highlighted below are not the only risks of our business. If any of the risks actually occur, our business, financial condition or results of operations could be negatively affected. In that case, the trading price of our common stock or other securities could decline, and you may lose all or part of your investment. Certain risk factors that could cause actual results to differ materially from our forward-looking state-ments include the following:
Competition The Company operates in a highly competitive environment. The computer wholesale distribution industry is characterized by intense competition, based primarily on product availability, credit availability, price, speed of delivery, ability to tailor specific solu-tions to customer needs, quality and depth of product lines and training, service and support. Weakness in demand in the market intensifies the competitive environment in which the Company operates. The Company competes with a variety of regional, national and international wholesale distributors, some of which have greater financial resources than the Company. The Company also faces competition from companies entering or expanding into the logistics and product fulfillment and e-commerce supply chain services market.
Narrow Profit Margins As a result of intense price competition in the industry, the Company has narrow gross profit and operating profit margins. These narrow margins magnify the impact on operating results attributed to variations in sales and operating costs. Future gross
profit and operating margins may be adversely affected by changes in product mix, vendor pricing actions and competitive and economic pressures. In addition, failure to attract new sources of business from expansion of products or services or entry into new markets may adversely affect future gross profit and operating margins.
Dependence on Information Systems The Company is highly dependent upon its internal computer and telecommunication systems to operate its business. There can be no assurance that the Company’s information systems will not fail or experience disruptions, that the Company will be able to attract and retain qualified personnel necessary for the operation of such systems, that the Company will be able to expand and improve its information systems, that the Company will be able to convert to new systems efficiently, or that the Company will be able to integrate new programs effectively with its existing pro-grams. Any of such problems could have an adverse effect on the Company’s business.
Acquisitions and Dispositions As part of its growth strategy, the Company pursues the acquisi-tion of companies that either complement or expand its existing business. As a result, the Company regularly evaluates potential acquisition opportunities, which may be material in size and scope. Acquisitions involve a number of risks and uncertainties, including expansion into new geographic markets and business areas, the requirement to understand local business practices, the diversion of management’s attention to the assimilation of the operations and personnel of the acquired companies, the possible require-ment to upgrade the acquired companies’ management informa-tion systems to the Company’s standards, potential adverse short-term effects on the Company’s operating results and the amortization or impairment of any acquired intangible assets. The Company also regularly evaluates the divestiture of business units which may not meet the Company’s strategic, financial and/or risk tolerance objectives. No assurance can be given that the Company will be able to dispose of business units on favorable terms or on particular timelines.

Exposure to Natural Disasters, War and Terrorism The Company’s headquarters facilities and some of its logistics centers as well as certain vendors and customers are located in areas prone to natural disasters such as floods, hurricanes, torna-does, or earthquakes. In addition, demand for the Company’s ser-vices is concentrated in major metropolitan areas. Adverse weather conditions, major electrical failures or other natural disasters in these major metropolitan areas may disrupt the Company’s busi-ness should its ability to distribute products be impacted by such an event.
The Company operates in multiple geographic markets, several of which may be susceptible to acts of war and terrorism. The Company’s business could be adversely affected should its ability to distribute products be impacted by such events.
The Company and many of its suppliers receive parts and products from Asia and operate in many parts of the world that may be susceptible to disease or epidemic that may disrupt the Company’s ability to receive or deliver products or other disruptions in operations.
Dependence on Independent Shipping Companies The Company relies on arrangements with independent shipping
the delivery of its products from vendors and to customers. The failure or inability of these shipping companies to deliver products, or the unavailability of their shipping services, even temporarily, could have a material adverse effect on the Company’s business. The Company may also be adversely affected by an increase in freight surcharges due to rising fuel costs and added security. There can be no assurance that Tech Data will be able to pass along the full effect of an increase in these surcharges to its customers.
Labor Strikes The Company’s labor force is currently non-union with the excep-tion of employees of certain European and Latin American subsid-iaries, which are subject to collective bargaining or similar arrangements. The Company does business in certain foreign
countries where labor disruption is more common than is experi-
by the Company are unionized. A labor strike by a group of the Company’s employees, one of the Company’s freight carriers, one of its vendors, a general strike by civil service employees, or a gov-ernmental shutdown could have an adverse effect on the Company’s business. Many of the products the Company sells are manufactured in countries other than the countries in which the Company’s logistics centers are located. The inability to receive products into the logistics centers because of government action or labor disputes at critical ports of entry may have a material adverse effect on the Company’s business.
Risk of Declines in Inventory Value The Company is subject to the risk that the value of its inventory will decline as a result of price reductions by vendors or techno-logical obsolescence. It is the policy of most of the Company’s vendors to protect distributors from the loss in value of inventory due to technological change or the vendors’ price reductions. Some vendors, however, may be unwilling or unable to pay the Company for price protection claims or products returned to them under purchase agreements. Moreover, industry practices are sometimes not embodied in written agreements and do not pro-tect the Company in all cases from declines in inventory value. No assurance can be given that such practices to protect distributors will continue, that unforeseen new product developments will not adversely affect the Company, or that the Company will be able to successfully manage its existing and future inventories.
Product Availability The Company is dependent upon the supply of products available from its vendors. The industry is characterized by periods of severe product shortages due to vendors’ difficulties in projecting demand for certain products distributed by the Company. When such product shortages occur, the Company typically receives an allocation of product from the vendor. There can be no assurance that vendors will be able to maintain an adequate supply of products to fulfill all of the Company’s customer orders on a timely
24
continued
MANAGEMENT’S DISCUSSION AND ANALYSIS OF FINANCIAL CONDITION AND RESULTS OF OPERATIONS
Tech Data Corporation 25
basis. Failure to obtain adequate product supplies could have an adverse effect on the Company’s business.
Vendor Terms and Conditions The Company relies on various rebates, cash discounts, and coop-erative marketing programs offered by its vendors to support expenses associated with distributing and marketing the vendors’ products. Currently, the rebates and purchase discounts offered by vendors are influenced by sales volumes and percentage increases in sales, and are subject to changes by the vendors. Additionally, certain of the Company’s vendors subsidize floorplan financing arrangements for the benefit of our customers. Terminations of a supply or services agreement or a significant change in supplier terms or conditions of sale could negatively affect our operating margins, revenue or the level of capital required to fund our operations.
The Company receives a significant percentage of revenues from products it purchases from relatively few manufacturers. As has historically been the case, a manufacturer may make rapid, significant and adverse changes in its sales terms and conditions, such as reducing the amount of price protection and return rights as well as reducing the level of purchase discounts and rebates they make available to us, or may merge with or acquire other significant manufacturers. The Company’s gross margins could be materially and negatively impacted if the Company is unable to pass through the impact of these changes to the Company’s cus-tomers or cannot develop systems to manage ongoing supplier programs. In addition, the Company’s standard vendor distribu-tion agreement permits termination without cause by either party upon 30 days notice. The loss of a relationship with any of the Company’s key vendors, a change in their strategy (such as increas-ing direct sales), the merging of significant manufacturers, or sig-nificant changes in terms on their products may adversely affect the Company’s business.
Loss of Significant Customers Customers do not have an obligation to make purchases from the Company. In some cases, the Company has made adjustments to its systems, vendor offerings, and processes, and made staffing decisions, in order to accommodate the needs of a significant cus-tomer. In the event a significant customer decides to make its pur-chases from another distributor, experiences a significant change in demand from its own customer base, becomes financially
unstable, or is acquired by another company, the Company’s receipt of revenues may be significantly affected, resulting in an adverse effect on the Company’s business.
Customer Credit Exposure The Company sells its products to a large customer base of value-added resellers, direct marketers, retailers and corporate resellers. The Company finances a significant portion of such sales through trade credit. As a result, the Company’s business could be adversely affected in the event of a deterioration of the financial condition of its customers, resulting in the customers’ inability to repay the Company. This risk may increase if there is a general economic downturn affecting a large number of the Company’s customers and in the event the Company’s customers do not adequately manage their business or properly disclose their financial condition.
Need for Liquidity and Capital Resources; Fluctuations in Interest Rates The Company’s business requires substantial capital to operate and to finance accounts receivable and product inventory that are not financed by trade creditors. The Company has historically relied upon cash generated from operations, bank credit lines, trade credit from its vendors, proceeds from public offerings of its common stock and proceeds from debt offerings to satisfy its capital needs and finance growth. The Company utilizes various financing instruments such as receivables securitization, leases, revolving credit facilities and trade receivable purchase facilities. As the financial markets change and new regulations come into effect, the cost of acquiring financing and the methods of financ-ing may change. Changes in our credit rating or other market fac-tors may increase our interest expense or other costs of capital, or capital may not be available to us on acceptable terms to fund our working capital needs. The inability to obtain such sources of capital could have an adverse effect on the Company’s business. The Company’s credit facilities contain various financial and other covenants that may limit the Company’s ability to borrow or limit the Company’s flexibility in responding to business conditions. These financing instruments involve variable rate debt, thus expos-ing the Company to risk of fluctuations in interest rates. Such fluc-tuations in interest rates could have an adverse effect on the Company’s business.
26
Foreign Currency Exchange Risks; Exposure to Foreign Markets
States, which exposes the Company to fluctuations in foreign cur-rency exchange rates. The Company may enter into short-term
-theless, fluctuations in foreign currency exchange rates could have an adverse effect on the Company’s business. In particular, the value of the Company’s equity investment in foreign countries may fluctuate based upon changes in foreign currency exchange rates. These fluctuations, which are recorded in a cumulative translation adjustment account, may result in losses in the event a foreign subsidiary is sold or closed at a time when the foreign currency is weaker than when the Company initially invested in the country.
The Company’s international operations are subject to other risks such as the imposition of governmental controls, export license requirements, restrictions on the export of certain technol-ogy, political instability, trade restrictions, tariff changes, difficul-ties in staffing and managing international operations, changes in the interpretation and enforcement of laws (in particular related to items such as duty and taxation), difficulties in collecting accounts receivable, longer collection periods and the impact of local economic conditions and practices. There can be no assur-ance that these and other factors will not have an adverse effect on the Company’s business.
Changes in Income Tax and Other Regulatory Legislation The Company operates in compliance with applicable laws and regulations. When new legislation is enacted with minimal advance notice, or when new interpretations or applications of existing laws are made, the Company may need to implement changes in its policies or structure.
In addition, recent legislation requires all member states of the
regarding Waste in Electrical and Electronic Equipment (“WEEE Directive”) and 2002/95/EC regarding restrictions of the use of certain hazardous substances in electrical and electronic equip-ment (“RoHS Directive”) into national law. The manner and timing of adoption of these laws impacts the Company as, in some
countries, it remains unclear to what extent and the manner in which the Company will be subject to compliance with these reg-ulations and the financial costs and guarantees thereby required.
The Company makes plans for its structure and operations based upon existing laws and anticipated future changes in the law. The Company is susceptible to unanticipated changes in legislation, especially relating to income and other taxes, import/export laws, hazardous materials and electronic waste recovery legislation, and other laws related to trade, accounting, and busi-ness activities. Such changes in legislation, both domestic and international, may have a significant adverse effect on the Company’s business.
Changes in Accounting Rules The Company prepares its financial statements in conformity with
These accounting principles are subject to interpretation by the Financial Accounting Standards Board, the Public Company Accounting Oversight Board, the Securities and Exchange Commission, the American Institute of Certified Public Accountants and various other bodies formed to interpret and create appropri-ate accounting policies. A change in these policies or a new inter-pretation of an existing policy could have a significant effect on our reported results and may affect our reporting of transactions before a change is announced.
Volatility of Common Stock Price Because of the foregoing factors, as well as other variables affect-ing the Company’s operating results, past financial performance should not be considered a reliable indicator of future perfor-mance, and investors should not use historical trends to anticipate results or trends in future periods. In addition, the Company’s par-ticipation in a highly dynamic industry often results in significant volatility of the common stock price. Some of the factors that may affect the market price of the common stock, in addition to those discussed above, are changes in investment recommendations by securities analysts, changes in market valuations of competitors and key vendors, and fluctuations in the overall stock market, but particularly in the technology sector.
continued
MANAGEMENT’S DISCUSSION AND ANALYSIS OF FINANCIAL CONDITION AND RESULTS OF OPERATIONS

Tech Data Corporation 27
Controls and Procedures
Evaluation of Disclosure Controls and Procedures The Company maintains disclosure controls and procedures designed to ensure that information required to be disclosed in reports filed under the Securities Exchange Act of 1934, as amended (the “Exchange Act”), is recorded, processed, summa-rized and reported within the specified time periods. In designing and evaluating our disclosure controls and procedures, manage-ment recognized that disclosure controls and procedures, no mat-ter how well conceived and operated, can provide only reasonable, not absolute, assurance that the objectives of the disclosure con-trols and procedures are met. Further, the design of a control sys-tem must reflect the fact that there are resource constraints, and the benefits of controls must be considered relative to their costs. Because of the inherent limitations in all control systems, no eval-uation of controls can provide absolute assurance that all control issues and instances of fraud, if any, within the Company have been detected. These inherent limitations include the realities that judgments in decision-making can be faulty, and that breakdowns can occur because of a simple error or mistake. Additionally, con-trols can be circumvented by the individual acts of some persons, by collusion of two or more people, or by management override of the controls. The design of any system of controls also is based in part upon certain assumptions about the likelihood of future events, and there can be no assurance that any design will suc-ceed in achieving its stated goals under all potential future condi-tions. Over time, controls may become inadequate because of changes in conditions, or the degree of compliance with the poli-cies or procedures may deteriorate. Because of the inherent limita-tions in a cost-effective control system, misstatements due to error or fraud may occur and not be detected.
Tech Data’s management, with the participation of the Company’s Chief Executive Officer (“CEO”) and Chief Financial Officer (“CFO”), has evaluated the effectiveness of the Company’s disclosure controls and procedures (as defined in Rules 13a-15(e) and 15(d)-15(e) under the Securities Exchange Act of 1934), as of January 31, 2008. Based on that evaluation, the Company’s CEO and CFO concluded that the Company’s disclosure controls and procedures were effective in providing reasonable assurance that the objectives of the disclosure controls and procedures are met as of January 31, 2008.
Management’s Report on Internal Control over Financial Reporting Management of the Company is responsible for establishing and maintaining adequate internal control over financial reporting as defined in Rules 13a-15(f) under the Securities Exchange Act of 1934. The Company’s internal control over financial reporting is designed to provide reasonable assurance regarding the reliability of financial reporting and the preparation of financial statements for external purposes in accordance with generally accepted accounting principles.
Because of its inherent limitations, internal control over financial reporting may not prevent or detect misstatements. Therefore, even those systems determined to be effective can pro-vide only reasonable assurance with respect to financial statement preparation and presentation. Also, projections of any evaluation of the effectiveness to future periods are subject to the risk that controls may become inadequate because of changes in condi-tions, or that the degree of compliance with the policies or procedures may deteriorate.
-ment, including our principal executive officer and principal finan-cial officer, we assessed the effectiveness of the Company’s internal control over financial reporting as of January 31, 2008. In making this assessment, management used the criteria set forth by the Committee of Sponsoring Organizations of the Treadway Commission (“COSO”) in Internal Control—Integrated Framework. Based on our assessment, we have concluded that, as of January 31, 2008, the Company’s internal control over financial reporting was effective based on those criteria.
The effectiveness of internal control over financial reporting as of January 31, 2008 has been audited by Ernst & Young, LLP, the independent registered certified public accounting firm who also audited the Company’s consolidated financial statements, as stated in their report below.
Changes in Internal Control over Financial Reporting There were no changes in our internal control over financial reporting (as defined in Rules 13a-15(f) and 15d-15(f) under the Exchange Act) identified in connection with management’s evalu-ation during our last quarter of fiscal 2008 that have materially affected, or are reasonably likely to materially affect, the Company’s internal control over financial reporting.

28
The Board of Directors and Shareholders of Tech Data Corporation:
We have audited the accompanying consolidated balance sheets of Tech Data Corporation and subsidiaries as of January 31, 2008 and 2007, and the related consolidated statements of oper-ations, shareholders’ equity, and cash flows for each of the three years in the period ended January 31, 2008. These financial state-ments are the responsibility of the Company’s management. Our responsibility is to express an opinion on these financial statements based on our audits.
We conducted our audits in accordance with the standards of
Those standards require that we plan and perform the audit to obtain reasonable assurance about whether the financial state-ments are free of material misstatement. An audit includes exam-ining, on a test basis, evidence supporting the amounts and disclosures in the financial statements. An audit also includes assessing the accounting principles used and significant estimates made by management, as well as evaluating the overall financial statement presentation. We believe that our audits provide a reasonable basis for our opinion.
In our opinion, the financial statements referred to above pres-ent fairly, in all material respects, the consolidated financial posi-tion of Tech Data Corporation and subsidiaries at January 31, 2008 and 2007, and the consolidated results of their operations and their cash flows for each of the three years in the period
accounting principles. As discussed in Note 11 to the consolidated financial state-
ments, effective February 1, 2007, the Company adopted the provisions of Financial Accounting Standards Board Interpretation No. 48, Accounting for Uncertainty in Income Taxes. Also, as discussed in Note 1 to the consolidated financial statements, effective February 1, 2006, the Company adopted the provisions of Statement of Financial Accounting Standards No. 123(R), Share-Based Payment.
We also have audited, in accordance with the standards of
Tech Data Corporation’s internal control over financial reporting as of January 31, 2008, based on criteria established in Internal Control—Integrated Framework issued by the Committee of Sponsoring Organizations of the Treadway Commission and our report dated March 26, 2008, expressed an unqualified opinion thereon.
Tampa, Florida March 26, 2008
REPORT OF INDEPENDENT REGISTERED CERTIFIED PUBLIC ACCOUNTING FIRM

Tech Data Corporation 29
The Board of Directors and Shareholders of Tech Data Corporation:
We have audited Tech Data Corporation’s internal control over financial reporting as of January 31, 2008, based on criteria estab-lished in Internal Control—Integrated Framework issued by the Committee of Sponsoring Organizations of the Treadway Commission (the COSO criteria). Tech Data Corporation’s man-agement is responsible for maintaining effective internal control over financial reporting and for its assessment of the effectiveness of internal control over financial reporting included in the accom-panying Management’s Report on Internal Control Over Financial Reporting. Our responsibility is to express an opinion on the company’s internal control over financial reporting based on our audit.
We conducted our audit in accordance with the standards of
Those standards require that we plan and perform the audit to obtain reasonable assurance about whether effective internal control over financial reporting was maintained in all material respects. Our audit included obtaining an understanding of inter-nal control over financial reporting, assessing the risk that a mate-rial weakness exists, testing and evaluating the design and operating effectiveness of internal control based on the assessed risk, and performing such other procedures as we considered nec-essary in the circumstances. We believe that our audit provides a reasonable basis for our opinion.
A company’s internal control over financial reporting is a pro-cess designed to provide reasonable assurance regarding the reli-ability of financial reporting and the preparation of financial statements for external purposes in accordance with generally accepted accounting principles. A company’s internal control over financial reporting includes those policies and procedures that (1) pertain to the maintenance of records that, in reasonable detail, accurately and fairly reflect the transactions and dispositions of
transactions are recorded as necessary to permit preparation of financial statements in accordance with generally accepted accounting principles, and that receipts and expenditures of the company are being made only in accordance with authoriza-
(3) provide reasonable assurance regarding prevention or timely detection of unauthorized acquisition, use, or disposition of the company’s assets that could have a material effect on the financial statements.
Because of its inherent limitations, internal control over financial reporting may not prevent or detect misstatements. Also, projections of any evaluation of effectiveness to future peri-ods are subject to the risk that controls may become inadequate because of changes in conditions, or that the degree of compli-ance with the policies or procedures may deteriorate.
In our opinion, Tech Data Corporation maintained, in all mate-rial respects, effective internal control over financial reporting as of January 31, 2008, based on the COSO criteria.
We also have audited, in accordance with the standards of the
consolidated balance sheets of Tech Data Corporation and subsid-iaries as of January 31, 2008 and 2007, and the related consolidated statements of operations, shareholders’ equity, and cash flows for each of the three years in the period ended January 31, 2008 of Tech Data Corporation and subsidiaries and our report dated March 26, 2008, expressed an unqualified opinion thereon.
Tampa, Florida March 26, 2008
REPORT OF INDEPENDENT REGISTERED CERTIFIED PUBLIC ACCOUNTING FIRM
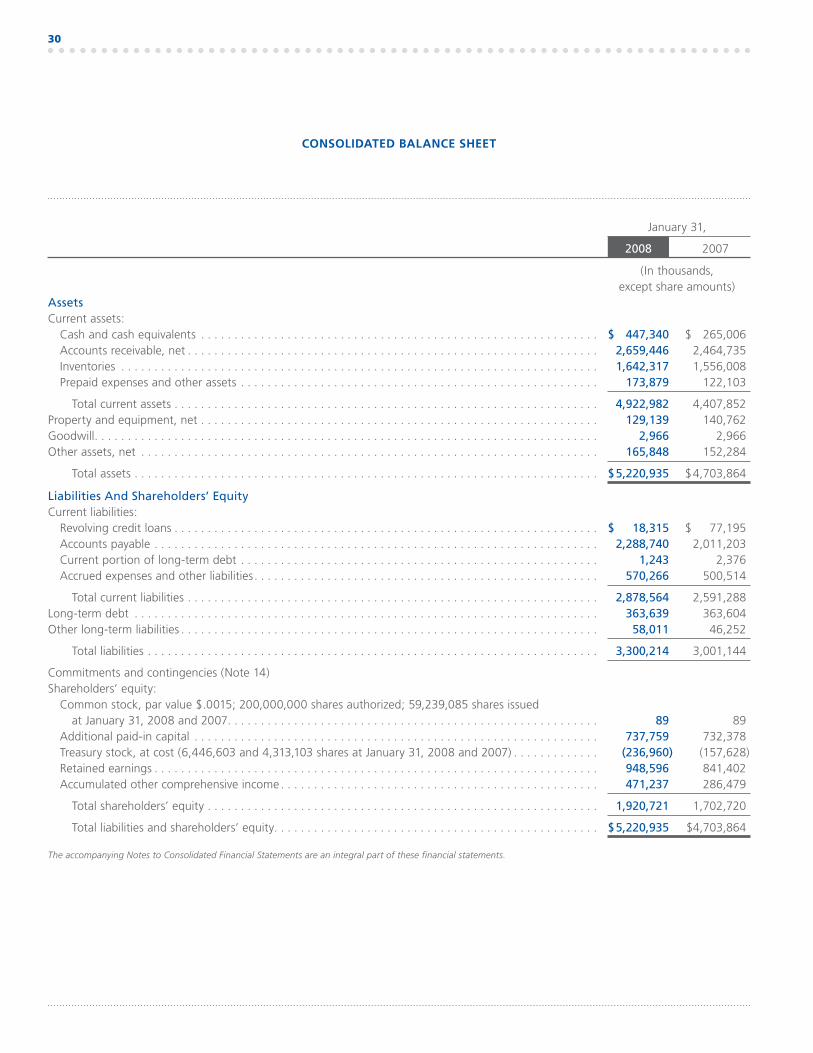
30
CONSOLIDATED BALANCE SHEET
January 31,
2008 2007
(In thousands,except share amounts)
AssetsCurrent assets:
Cash and cash equivalents . . . . . . . . . . . . . . . . . . . . . . . . . . . . . . . . . . . . . . . . . . . . . . . . . . . . . . . . . . . . $ 447,340 $ 265,006Accounts receivable, net . . . . . . . . . . . . . . . . . . . . . . . . . . . . . . . . . . . . . . . . . . . . . . . . . . . . . . . . . . . . . . 2,659,446 2,464,735Inventories . . . . . . . . . . . . . . . . . . . . . . . . . . . . . . . . . . . . . . . . . . . . . . . . . . . . . . . . . . . . . . . . . . . . . . . . 1,642,317 1,556,008Prepaid expenses and other assets . . . . . . . . . . . . . . . . . . . . . . . . . . . . . . . . . . . . . . . . . . . . . . . . . . . . . . 173,879 122,103
Total current assets . . . . . . . . . . . . . . . . . . . . . . . . . . . . . . . . . . . . . . . . . . . . . . . . . . . . . . . . . . . . . . . . 4,922,982 4,407,852Property and equipment, net . . . . . . . . . . . . . . . . . . . . . . . . . . . . . . . . . . . . . . . . . . . . . . . . . . . . . . . . . . . . 129,139 140,762Goodwill . . . . . . . . . . . . . . . . . . . . . . . . . . . . . . . . . . . . . . . . . . . . . . . . . . . . . . . . . . . . . . . . . . . . . . . . . . . . 2,966 2,966Other assets, net . . . . . . . . . . . . . . . . . . . . . . . . . . . . . . . . . . . . . . . . . . . . . . . . . . . . . . . . . . . . . . . . . . . . . 165,848 152,284
Total assets . . . . . . . . . . . . . . . . . . . . . . . . . . . . . . . . . . . . . . . . . . . . . . . . . . . . . . . . . . . . . . . . . . . . . . $5,220,935 $4,703,864
Liabilities And Shareholders’ EquityCurrent liabilities:
Revolving credit loans . . . . . . . . . . . . . . . . . . . . . . . . . . . . . . . . . . . . . . . . . . . . . . . . . . . . . . . . . . . . . . . . $ 18,315 $ 77,195Accounts payable . . . . . . . . . . . . . . . . . . . . . . . . . . . . . . . . . . . . . . . . . . . . . . . . . . . . . . . . . . . . . . . . . . . 2,288,740 2,011,203Current portion of long-term debt . . . . . . . . . . . . . . . . . . . . . . . . . . . . . . . . . . . . . . . . . . . . . . . . . . . . . . 1,243 2,376Accrued expenses and other liabilities . . . . . . . . . . . . . . . . . . . . . . . . . . . . . . . . . . . . . . . . . . . . . . . . . . . . 570,266 500,514
Total current liabilities . . . . . . . . . . . . . . . . . . . . . . . . . . . . . . . . . . . . . . . . . . . . . . . . . . . . . . . . . . . . . . 2,878,564 2,591,288Long-term debt . . . . . . . . . . . . . . . . . . . . . . . . . . . . . . . . . . . . . . . . . . . . . . . . . . . . . . . . . . . . . . . . . . . . . . 363,639 363,604Other long-term liabilities . . . . . . . . . . . . . . . . . . . . . . . . . . . . . . . . . . . . . . . . . . . . . . . . . . . . . . . . . . . . . . . 58,011 46,252
Total liabilities . . . . . . . . . . . . . . . . . . . . . . . . . . . . . . . . . . . . . . . . . . . . . . . . . . . . . . . . . . . . . . . . . . . . 3,300,214 3,001,144
Commitments and contingencies (Note 14)Shareholders’ equity:
at January 31, 2008 and 2007 . . . . . . . . . . . . . . . . . . . . . . . . . . . . . . . . . . . . . . . . . . . . . . . . . . . . . . . . 89 89Additional paid-in capital . . . . . . . . . . . . . . . . . . . . . . . . . . . . . . . . . . . . . . . . . . . . . . . . . . . . . . . . . . . . . 737,759 732,378Treasury stock, at cost (6,446,603 and 4,313,103 shares at January 31, 2008 and 2007) . . . . . . . . . . . . . (236,960) (157,628)Retained earnings . . . . . . . . . . . . . . . . . . . . . . . . . . . . . . . . . . . . . . . . . . . . . . . . . . . . . . . . . . . . . . . . . . . 948,596 841,402Accumulated other comprehensive income . . . . . . . . . . . . . . . . . . . . . . . . . . . . . . . . . . . . . . . . . . . . . . . . 471,237 286,479
Total shareholders’ equity . . . . . . . . . . . . . . . . . . . . . . . . . . . . . . . . . . . . . . . . . . . . . . . . . . . . . . . . . . . 1,920,721 1,702,720
Total liabilities and shareholders’ equity . . . . . . . . . . . . . . . . . . . . . . . . . . . . . . . . . . . . . . . . . . . . . . . . . $5,220,935 $4,703,864
The accompanying Notes to Consolidated Financial Statements are an integral part of these financial statements.
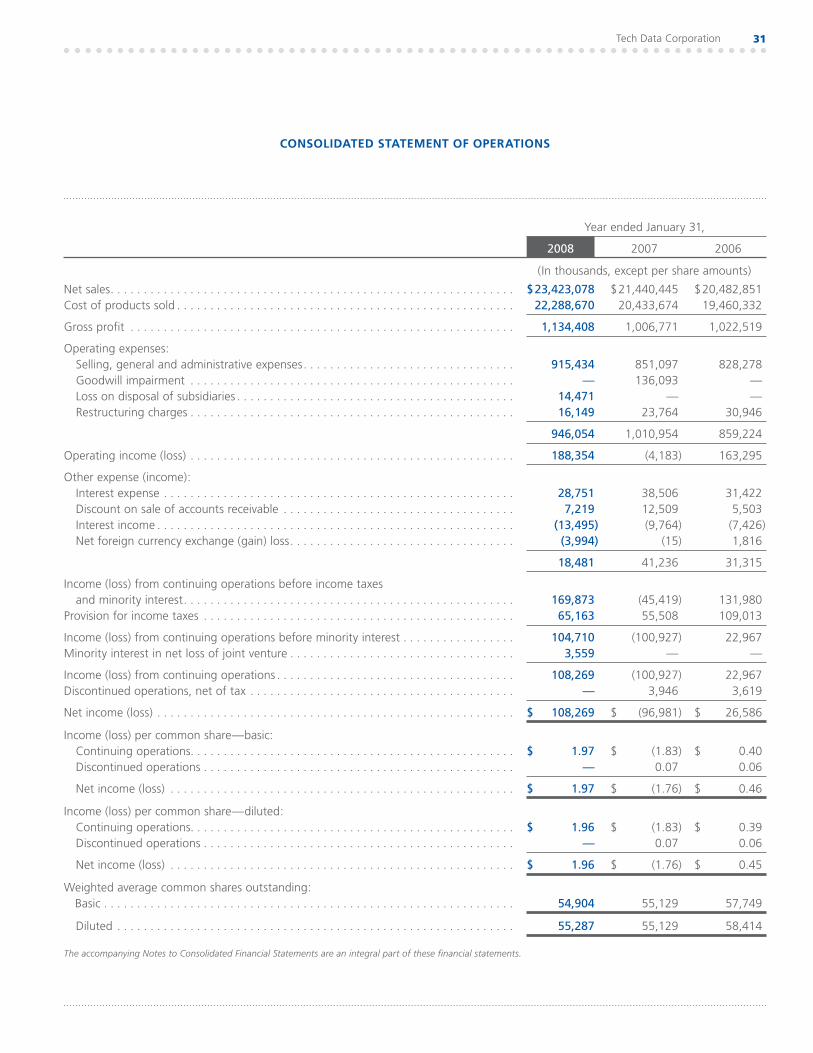
Tech Data Corporation 31
CONSOLIDATED STATEMENT OF OPERATIONS
Year ended January 31,
2008 2007 2006
(In thousands, except per share amounts)
Net sales . . . . . . . . . . . . . . . . . . . . . . . . . . . . . . . . . . . . . . . . . . . . . . . . . . . . . . . . . . . . . $23,423,078 $21,440,445 $20,482,851Cost of products sold . . . . . . . . . . . . . . . . . . . . . . . . . . . . . . . . . . . . . . . . . . . . . . . . . . . 22,288,670 20,433,674 19,460,332
Gross profit . . . . . . . . . . . . . . . . . . . . . . . . . . . . . . . . . . . . . . . . . . . . . . . . . . . . . . . . . . 1,134,408 1,006,771 1,022,519
Operating expenses:Selling, general and administrative expenses . . . . . . . . . . . . . . . . . . . . . . . . . . . . . . . . 915,434 851,097 828,278Goodwill impairment . . . . . . . . . . . . . . . . . . . . . . . . . . . . . . . . . . . . . . . . . . . . . . . . . — 136,093 —Loss on disposal of subsidiaries . . . . . . . . . . . . . . . . . . . . . . . . . . . . . . . . . . . . . . . . . . 14,471 — —Restructuring charges . . . . . . . . . . . . . . . . . . . . . . . . . . . . . . . . . . . . . . . . . . . . . . . . . 16,149 23,764 30,946
946,054 1,010,954 859,224
Operating income (loss) . . . . . . . . . . . . . . . . . . . . . . . . . . . . . . . . . . . . . . . . . . . . . . . . . 188,354 (4,183) 163,295
Other expense (income):Interest expense . . . . . . . . . . . . . . . . . . . . . . . . . . . . . . . . . . . . . . . . . . . . . . . . . . . . . 28,751 38,506 31,422Discount on sale of accounts receivable . . . . . . . . . . . . . . . . . . . . . . . . . . . . . . . . . . . 7,219 12,509 5,503Interest income . . . . . . . . . . . . . . . . . . . . . . . . . . . . . . . . . . . . . . . . . . . . . . . . . . . . . . (13,495) (9,764) (7,426)Net foreign currency exchange (gain) loss . . . . . . . . . . . . . . . . . . . . . . . . . . . . . . . . . . (3,994) (15) 1,816
18,481 41,236 31,315
Income (loss) from continuing operations before income taxes and minority interest . . . . . . . . . . . . . . . . . . . . . . . . . . . . . . . . . . . . . . . . . . . . . . . . . . 169,873 (45,419) 131,980
Provision for income taxes . . . . . . . . . . . . . . . . . . . . . . . . . . . . . . . . . . . . . . . . . . . . . . . 65,163 55,508 109,013
Income (loss) from continuing operations before minority interest . . . . . . . . . . . . . . . . . 104,710 (100,927) 22,967Minority interest in net loss of joint venture . . . . . . . . . . . . . . . . . . . . . . . . . . . . . . . . . . 3,559 — —
Income (loss) from continuing operations . . . . . . . . . . . . . . . . . . . . . . . . . . . . . . . . . . . . 108,269 (100,927) 22,967Discontinued operations, net of tax . . . . . . . . . . . . . . . . . . . . . . . . . . . . . . . . . . . . . . . . — 3,946 3,619
Net income (loss) . . . . . . . . . . . . . . . . . . . . . . . . . . . . . . . . . . . . . . . . . . . . . . . . . . . . . . $ 108,269 $ (96,981) $ 26,586
Income (loss) per common share—basic:Continuing operations. . . . . . . . . . . . . . . . . . . . . . . . . . . . . . . . . . . . . . . . . . . . . . . . . $ 1.97 $ (1.83) $ 0.40Discontinued operations . . . . . . . . . . . . . . . . . . . . . . . . . . . . . . . . . . . . . . . . . . . . . . . — 0.07 0.06
Net income (loss) . . . . . . . . . . . . . . . . . . . . . . . . . . . . . . . . . . . . . . . . . . . . . . . . . . . . $ 1.97 $ (1.76) $ 0.46
Income (loss) per common share—diluted:Continuing operations. . . . . . . . . . . . . . . . . . . . . . . . . . . . . . . . . . . . . . . . . . . . . . . . . $ 1.96 $ (1.83) $ 0.39Discontinued operations . . . . . . . . . . . . . . . . . . . . . . . . . . . . . . . . . . . . . . . . . . . . . . . — 0.07 0.06
Net income (loss) . . . . . . . . . . . . . . . . . . . . . . . . . . . . . . . . . . . . . . . . . . . . . . . . . . . . $ 1.96 $ (1.76) $ 0.45
Weighted average common shares outstanding:Basic . . . . . . . . . . . . . . . . . . . . . . . . . . . . . . . . . . . . . . . . . . . . . . . . . . . . . . . . . . . . . . 54,904 55,129 57,749
Diluted . . . . . . . . . . . . . . . . . . . . . . . . . . . . . . . . . . . . . . . . . . . . . . . . . . . . . . . . . . . . 55,287 55,129 58,414
The accompanying Notes to Consolidated Financial Statements are an integral part of these financial statements.

32
AccumulatedAdditional other Total
Common Stock paid-in Treasury Retained comprehensive shareholders’Shares Amount capital stock earnings income (loss)(1) equity
(In thousands)
Balance—January 31, 2005 . . . . . . . . . . 58,984 $88 $724,562 $ — $911,797 $291,024 $1,927,471Issuance of common stock for benefit
plans and stock options exercised,including related tax benefit of $1,460 . . . . . . . . . . . . . . . . 255 1 8,001 — — — 8,002
Purchase of treasury stock, at cost . . . . . — — — (127,027) — — (127,027)Issuance of treasury stock for benefit
plans and stock options exercised, including related tax benefit of $1,174 . . . . . . . . . . . . . . . . . — — (3,108) 14,426 — — 11,318
Comprehensive income (loss) . . . . . . . . . — — — — 26,586 (86,043) (59,457)
Balance—January 31, 2006 . . . . . . . . . . 59,239 89 729,455 (112,601) 938,383 204,981 1,760,307Purchase of treasury stock, at cost . . . . . — — — (80,093) — — (80,093)Issuance of treasury stock for benefit
plans and equity-based awards exercised, including related tax benefit of $2,680 . . . . . . . . . . . . . . . . — — (5,123) 32,986 — — 27,863
Contribution of treasury stock to 401(k) savings plan . . . . . . . . . . . . . . . — — 73 2,080 — — 2,153
Stock-based compensation expense . . . . — — 7,973 — — — 7,973Comprehensive (loss) income . . . . . . . . . — — — — (96,981) 81,498 (15,483)
Balance—January 31, 2007 . . . . . . . . . . 59,239 89 732,378 (157,628) 841,402 286,479 1,702,720Purchase of treasury stock, at cost . . . . . — — — (100,019) — — (100,019)Issuance of treasury stock for benefit
plans and equity-based awards exercised, including related tax benefit of $1,078 . . . . . . . . . . . . . . . . — — (4,970) 18,590 — — 13,620
Contribution of treasury stock to 401(k) savings plan . . . . . . . . . . . . . . . — — 64 2,097 — — 2,161
Stock-based compensation expense . . . . — — 10,287 — — — 10,287Adjustment for the cumulative effect of prior years of the adoption of FIN 48 . . . — — — — (1,075) — (1,075)Comprehensive income . . . . . . . . . . . . . — — — — 108,269 184,758 293,027
Balance—January 31, 2008 . . . . . . . . . 59,239 $89 $737,759 $(236,960) $948,596 $471,237 $1,920,721
(1) The Company’s accumulated other comprehensive income (loss) is comprised exclusively of changes in the Company’s cumulative foreign currency translation adjustment account.
The accompanying Notes to Consolidated Financial Statements are an integral part of these financial statements.
CONSOLIDATED STATEMENT OF SHAREHOLDERS’ EQUITY
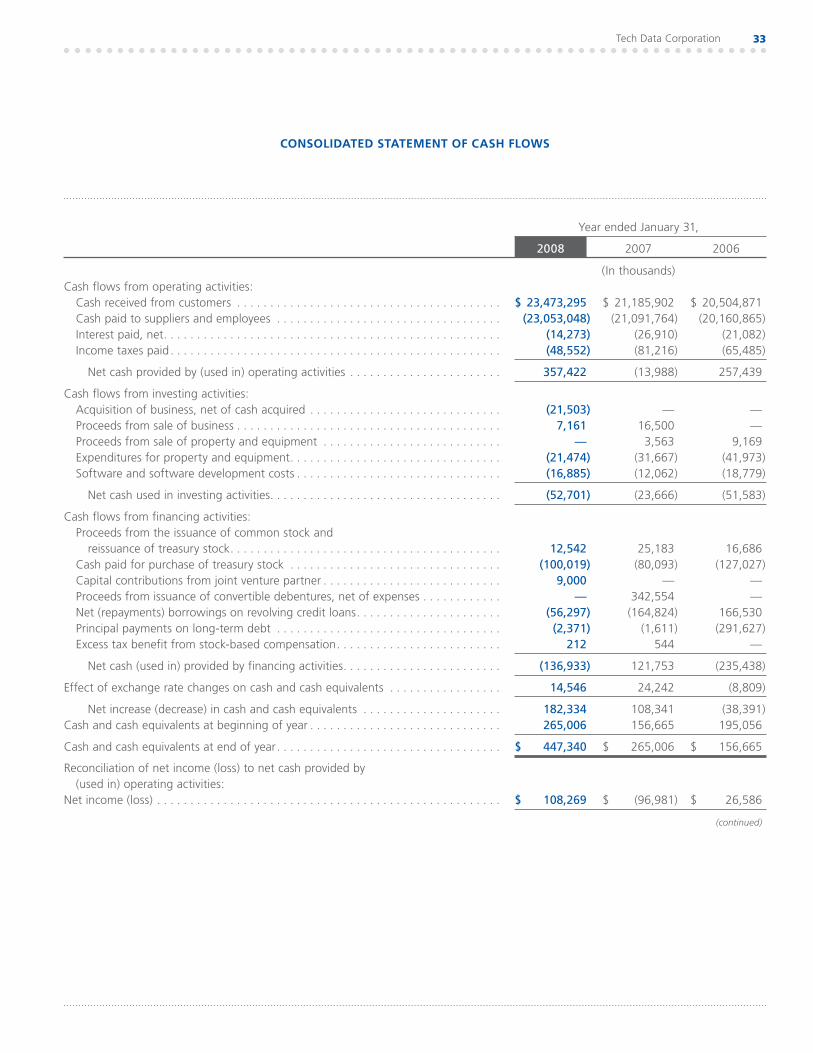
Tech Data Corporation 33
Year ended January 31,
2008 2007 2006
(In thousands)Cash flows from operating activities:
Cash received from customers . . . . . . . . . . . . . . . . . . . . . . . . . . . . . . . . . . . . . . . . $ 23,473,295 $ 21,185,902 $ 20,504,871Cash paid to suppliers and employees . . . . . . . . . . . . . . . . . . . . . . . . . . . . . . . . . . (23,053,048) (21,091,764) (20,160,865)Interest paid, net . . . . . . . . . . . . . . . . . . . . . . . . . . . . . . . . . . . . . . . . . . . . . . . . . . . (14,273) (26,910) (21,082)Income taxes paid . . . . . . . . . . . . . . . . . . . . . . . . . . . . . . . . . . . . . . . . . . . . . . . . . . (48,552) (81,216) (65,485)
Net cash provided by (used in) operating activities . . . . . . . . . . . . . . . . . . . . . . . 357,422 (13,988) 257,439
Cash flows from investing activities:Acquisition of business, net of cash acquired . . . . . . . . . . . . . . . . . . . . . . . . . . . . . (21,503) — —Proceeds from sale of business . . . . . . . . . . . . . . . . . . . . . . . . . . . . . . . . . . . . . . . . 7,161 16,500 —Proceeds from sale of property and equipment . . . . . . . . . . . . . . . . . . . . . . . . . . . — 3,563 9,169Expenditures for property and equipment . . . . . . . . . . . . . . . . . . . . . . . . . . . . . . . . (21,474) (31,667) (41,973)Software and software development costs . . . . . . . . . . . . . . . . . . . . . . . . . . . . . . . (16,885) (12,062) (18,779)
Net cash used in investing activities . . . . . . . . . . . . . . . . . . . . . . . . . . . . . . . . . . . (52,701) (23,666) (51,583)
Cash flows from financing activities: Proceeds from the issuance of common stock and
reissuance of treasury stock . . . . . . . . . . . . . . . . . . . . . . . . . . . . . . . . . . . . . . . . . 12,542 25,183 16,686Cash paid for purchase of treasury stock . . . . . . . . . . . . . . . . . . . . . . . . . . . . . . . . (100,019) (80,093) (127,027)Capital contributions from joint venture partner . . . . . . . . . . . . . . . . . . . . . . . . . . . 9,000 — —Proceeds from issuance of convertible debentures, net of expenses . . . . . . . . . . . . — 342,554 —Net (repayments) borrowings on revolving credit loans . . . . . . . . . . . . . . . . . . . . . . (56,297) (164,824) 166,530Principal payments on long-term debt . . . . . . . . . . . . . . . . . . . . . . . . . . . . . . . . . . (2,371) (1,611) (291,627)Excess tax benefit from stock-based compensation . . . . . . . . . . . . . . . . . . . . . . . . . 212 544 —
Net cash (used in) provided by financing activities . . . . . . . . . . . . . . . . . . . . . . . . (136,933) 121,753 (235,438)
Effect of exchange rate changes on cash and cash equivalents . . . . . . . . . . . . . . . . . 14,546 24,242 (8,809)
Net increase (decrease) in cash and cash equivalents . . . . . . . . . . . . . . . . . . . . . 182,334 108,341 (38,391)Cash and cash equivalents at beginning of year . . . . . . . . . . . . . . . . . . . . . . . . . . . . . 265,006 156,665 195,056
Cash and cash equivalents at end of year . . . . . . . . . . . . . . . . . . . . . . . . . . . . . . . . . . $ 447,340 $ 265,006 $ 156,665
Reconciliation of net income (loss) to net cash provided by (used in) operating activities:
Net income (loss) . . . . . . . . . . . . . . . . . . . . . . . . . . . . . . . . . . . . . . . . . . . . . . . . . . . . $ 108,269 $ (96,981) $ 26,586
(continued)
CONSOLIDATED STATEMENT OF CASH FLOWS

34
Year ended January 31,
2008 2007 2006
(In thousands)Adjustments to reconcile net income (loss) to net cash provided by
(used in) operating activities:Goodwill impairment . . . . . . . . . . . . . . . . . . . . . . . . . . . . . . . . . . . . . . . . . . . . . . . $ — $ 136,093 $ —Loss on disposal of subsidiaries . . . . . . . . . . . . . . . . . . . . . . . . . . . . . . . . . . . . . . . . 14,471 — —Gain on sale of discontinued operations, net of tax . . . . . . . . . . . . . . . . . . . . . . . . — (3,834) —Gain on sale of land . . . . . . . . . . . . . . . . . . . . . . . . . . . . . . . . . . . . . . . . . . . . . . . . — (3,563) —Depreciation and amortization . . . . . . . . . . . . . . . . . . . . . . . . . . . . . . . . . . . . . . . . 53,881 53,280 53,744Provision for losses on accounts receivable . . . . . . . . . . . . . . . . . . . . . . . . . . . . . . . 11,200 27,655 6,172Stock-based compensation expense . . . . . . . . . . . . . . . . . . . . . . . . . . . . . . . . . . . . 10,287 7,973 —Deferred income taxes . . . . . . . . . . . . . . . . . . . . . . . . . . . . . . . . . . . . . . . . . . . . . . 6,537 4,296 26,466Excess tax benefit from stock-based compensation . . . . . . . . . . . . . . . . . . . . . . . . . (212) (544) —Minority interest . . . . . . . . . . . . . . . . . . . . . . . . . . . . . . . . . . . . . . . . . . . . . . . . . . . (3,559) — —Changes in operating assets and liabilities:
Accounts receivable . . . . . . . . . . . . . . . . . . . . . . . . . . . . . . . . . . . . . . . . . . . . . . . 57,419 (242,305) (32,585) Inventories . . . . . . . . . . . . . . . . . . . . . . . . . . . . . . . . . . . . . . . . . . . . . . . . . . . . . . 57,904 25,806 (83,311) Prepaid expenses and other assets . . . . . . . . . . . . . . . . . . . . . . . . . . . . . . . . . . . (40,721) 5,636 3,078 Accounts payable . . . . . . . . . . . . . . . . . . . . . . . . . . . . . . . . . . . . . . . . . . . . . . . . 83,845 21,985 214,804 Accrued expenses and other liabilities . . . . . . . . . . . . . . . . . . . . . . . . . . . . . . . . . (1,899) 50,515 42,485
Total adjustments . . . . . . . . . . . . . . . . . . . . . . . . . . . . . . . . . . . . . . . . . . . . . . 249,153 82,993 230,853
Net cash provided by (used in) operating activities . . . . . . . . . . . . . . . . . . . . . . . $ 357,422 $ (13,988) $ 257,439
The accompanying Notes to Consolidated Financial Statements are an integral part of these financial statements.
CONSOLIDATED STATEMENT OF CASH FLOWS
continued
Tech Data Corporation 35
NOTE 1—BUSINESS AND SUMMARY OFSIGNIFICANT ACCOUNTING POLICIES
Description of Business Tech Data Corporation (“Tech Data” or the “Company”) is a lead-ing provider of information technology (“IT”) products, logistics management and other value-added services. The Company distributes microcomputer hardware and software products to value-added resellers, direct marketers, retailers and corporate resellers. The Company is managed in two geographic segments: the Americas (including North America and Latin America) and Europe.
Principles of Consolidation The consolidated financial statements include the accounts of Tech Data and its subsidiaries. All significant intercompany accounts and transactions have been eliminated in consolidation. Minority interest is recognized for the portion of a consolidated joint venture not owned by the Company. The Company operates on a fiscal year that ends on January 31.
Basis of Presentation In accordance with Statement of Financial Accounting Standards (“SFAS” or “Statement”) No 144, “Accounting for the Impairment or Disposal of Long-lived Assets,” the Company has accounted for the European training business (the “Training Business”) as a discontinued operation. The results of operations of the Training Business have been reclassified and presented as “discontinued operations, net of tax,” for all periods presented. The cash flows of the Training Business have not been reported separately within the Company’s Consolidated Statement of Cash Flows as the net cash flows of the Training Business are not material and the absence of cash flows from discontinued operations has not affected the Company’s liquidity subsequent to the sale of the Training Business. The transaction is further discussed in Note 3—Discontinued Operations.
Method of Accounting The Company prepares its financial statements in conformity with
These principles require management to make estimates and assumptions that affect the reported amounts of assets and liabili-ties and disclosure of contingent assets and liabilities at the date of the financial statements and the reported amounts of revenues and expenses during the reporting period. Actual results could differ from those estimates.
Revenue Recognition Revenue is recognized once four criteria are met: (1) the Company
delivery must occur, which generally happens at the point of ship-ment (this includes the transfer of both title and risk of loss, pro-
assured. Shipping revenue is included in net sales while the related costs, including shipping and handling costs, are included in the cost of products sold. The Company allows its customers to return product for exchange or credit subject to certain limitations. A provision for such returns is recorded at the time of sale based upon historical experience.
Service revenue associated with configuration, training and other services is recognized when the work is complete and the four criteria discussed above have been met. Service revenues have represented less than 10% of total net sales for fiscal years 2008, 2007 and 2006.
Accounts Receivable The Company maintains an allowance for doubtful accounts for estimated losses resulting from the inability of our customers to make required payments. In estimating the required allowance, the Company takes into consideration the overall quality and aging of the receivable portfolio, the existence of credit insurance, specifically identified customer risks and historical write-off expe-rience. If actual customer performance were to deteriorate to an extent not expected by the Company, additional allowances may be required which could have an adverse effect on the Company’s financial results. Conversely, if actual customer performance were to improve to an extent not expected by us, a reduction in the allowance may be required which could have a favorable effect on the Company’s consolidated financial results.
Inventories Inventories, consisting entirely of finished goods, are stated at the lower of cost or market, cost being determined on the first-in, first-out (“FIFO”) method. Inventory is written down for estimated obsolescence equal to the difference between the cost of inven-tory and the estimated market value, based upon an aging analy-sis of the inventory on hand, specifically known inventory-related risks (such as technological obsolescence and the nature of ven-dor terms surrounding price protection and product returns), for-eign currency fluctuations for foreign-sourced product and assumptions about future demand.
NOTES TO CONSOLIDATED FINANCIAL STATEMENTS
continued
36
Vendor Incentives The Company receives incentives from vendors related to cooper-ative advertising allowances, infrastructure funding, volume rebates and other incentive agreements. These incentives are gen-erally under quarterly, semi-annual or annual agreements with the
ad-hoc basis to support specific programs mutually developed
discounts received from vendors are recorded when they are earned as a reduction of inventory and as a reduction of cost of products sold as the related inventory is sold. Vendor incentives earned for specifically identified cooperative advertising programs and infrastructure funding are recorded as adjustments to selling, general and administrative expenses, and any amounts earned in excess of the related cost is recorded in the same manner as unre-stricted volume rebates, as discussed above.
Reserves for receivables on vendor programs are recorded for estimated losses resulting from vendors’ inability to pay or rejec-tions by vendors of claims. Should amounts recorded as outstand-ing receivables from vendors be deemed uncollectible, additional allowances may be required which could have an adverse effect on the Company’s consolidated financial results.
Property and Equipment Property and equipment are stated at cost and property and equipment under capital leases are stated at the present value of the future minimum lease payments. Depreciation expense includes depreciation of purchased property and equipment and assets recorded under capital leases. Depreciation expense is com-puted over the shorter of the estimated economic lives or lease periods using the straight-line method as follows:
Years
Buildings and improvements. . . . . . . . . . . . . . . . . . . . . . . . . . . . . 15-39Leasehold improvements . . . . . . . . . . . . . . . . . . . . . . . . . . . . . . . 3-10Furniture, fixtures and equipment . . . . . . . . . . . . . . . . . . . . . . . . 3-10
Expenditures for renewals and improvements that significantly add to productive capacity or extend the useful life of an asset are capitalized. Expenditures for maintenance and repairs are charged to operations when incurred. When assets are sold or retired, the cost of the asset and the related accumulated depreciation are eliminated and any gain or loss is recognized at such time.
Long-Lived Assets Long-lived assets are reviewed for potential impairment at such time when events or changes in circumstances indicate that the carrying amount of the asset may not be recoverable.
An impairment loss is evaluated when the sum of the expected, undiscounted future net cash flows is less than the carrying amount of the asset. Any impairment loss is measured by comparing the fair value of the asset to its carrying value.
Goodwill The Company accounts for goodwill and other intangible assets in accordance SFAS No. 142, “Goodwill and Other Intangible Assets.” SFAS No. 142 requires an annual review for impairment, or more frequently if impairment indicators arise. This testing includes the determination of each reporting unit’s fair value using market multiples and discounted cash flow modeling. The Company per-forms its annual review for goodwill impairment in the fourth quarter of each fiscal year.
Intangible Assets Included within other assets at both January 31, 2008 and 2007 are certain intangible assets including capitalized software costs, as well as value assigned to the acquired customer lists and trade-marks primarily related to the acquisitions of Computer 2000 AG (“Computer 2000”) and Azlan Group PLC (“Azlan”). Such capital-ized costs and intangibles are being amortized over a period of three to ten years.
The Company capitalizes computer software costs that meet both the definition of internal-use software and defined criteria for capitalization in accordance with the American Institute of Certified Public Accountants’ Statement of Position No. 98-1, “Accounting for the Cost of Computer Software Developed or
The Company’s accounting policy is to amortize capitalized software costs on a straight-line basis over periods ranging from three to ten years, depending upon the nature of the software, the stability of the hardware platform on which the software is installed, its fit in the Company’s overall strategy, and our experi-ence with similar software. It is the Company’s policy to amortize personal computer-related software, such as spreadsheet and word processing applications, over three years, which reflects the rapid changes in personal computer software. Mainframe soft-ware licenses are amortized over five years, which is in line with the longer economic life of mainframe systems compared to per-sonal computer systems. Finally, strategic applications such as cus-tomer relationship management and enterprise-wide systems are amortized over seven to ten years based on their strategic fit and the Company’s historical experience with such applications.
NOTES TO CONSOLIDATED FINANCIAL STATEMENTS
Tech Data Corporation 37
Product Warranty The Company’s vendors generally warrant the products distrib-uted by the Company and allow the Company to return defective products, including those that have been returned to the Company by its customers. The Company does not independently warrant the products it distributes. However, in several countries where the Company operates, the Company is responsible for defective product as a matter of law. The time period required by law in certain countries exceeds the warranty period provided by the manufacturer. The Company is obligated to provide warranty pro-
where vendors have not affirmatively agreed to provide pass-through protection. To date, the Company has not incurred any significant costs for defective products under these legal require-ments. The Company does warrant services with regard to prod-ucts integrated for its customers. A provision for estimated warranty costs is recorded at the time of sale and periodically adjusted to reflect actual experience. To date, the Company has not incurred any significant service warranty costs. Fees charged for products configured by the Company represented less than 10% of net sales for fiscal years 2008, 2007 and 2006.
Income Taxes Income taxes are accounted for under the liability method. Deferred taxes reflect the tax consequences on future years of differences between the tax basis of assets and liabilities and their financial reporting amounts. Deferred taxes have not been provided on the cumulative undistributed earnings of foreign subsidiaries or the cumulative translation adjustment related to those investments because such amounts are expected to be reinvested indefinitely.
The Company’s future effective tax rates could be adversely affected by earnings being lower than anticipated in countries with lower statutory rates, changes in the valuation of its deferred tax assets or liabilities or changes in tax laws or interpretations thereof. In addition, the Company is subject to the continuous examination of its income tax returns by the Internal Revenue Service and other tax authorities. The Company regularly assesses the likelihood of adverse outcomes resulting from these examina-tions to determine the adequacy of its provision for income taxes. To the extent the Company were to prevail in matters for which accruals have been established or be required to pay amounts in excess of such accruals, the Company’s effective tax rate in a given financial statement period could be materially affected.
Concentration of Credit Risk The Company sells its products to a large base of value-added resellers, direct marketers, retailers and corporate resellers throughout North America, Latin America and Europe. The Company performs ongoing credit evaluations of its customers and generally does not require collateral. The Company has obtained credit insurance, which insures a percentage of credit extended by the Company to certain of its customers against pos-sible loss. The Company makes provisions for estimated credit losses at the time of sale. No single customer accounted for more than ten percent of the Company’s net sales during fiscal years 2008, 2007 and 2006.
Foreign Currency Translation Income and expense accounts of foreign operations are translated at weighted average exchange rates during the year. Assets and liabilities of foreign operations that operate in a local currency
in effect at the balance sheet date, with the related translation gains or losses reported as components of accumulated other comprehensive income in shareholders’ equity.
Derivative Financial Instruments The Company faces exposure to changes in foreign currency exchange rates and interest rates. The Company reduces its expo-sure by creating offsetting positions through the use of derivative financial instruments. The majority of these instruments have terms of 90 days or less. It is the Company’s policy to utilize finan-cial instruments to reduce risk where appropriate and prohibit entering into derivative financial instruments for speculative or trading purposes.
Derivative financial instruments are marked-to-market each period with gains and losses on these contracts recorded in the Company’s Consolidated Statement of Operations within “net foreign currency exchange (gain) loss” in the period in which their value changes, with the offsetting entry for unsettled positions being booked to either other current assets or other current liabilities.
The notional amount of forward exchange contracts is the amount of foreign currency to be bought or sold at maturity. Notional amounts are indicative of the extent of the Company’s involvement in the various types and uses of derivative financial instruments and are not a measure of the Company’s exposure to credit or market risks through its use of derivatives. The estimated fair value of derivative financial instruments represents the amount required to enter into similar offsetting contracts with similar remaining maturities based on quoted market prices.
continued
38
The Company’s derivative financial instruments outstanding at January 31, 2008 and 2007 are as follows:
January 31, 2008 January 31, 2007
Notional amounts
Estimated fair value
Notional amounts
Estimated fair value
(In thousands)Foreign exchange
forward contracts . . . . . . $1,114,349 $(4,935) $1,043,076 $(1,604)
Fair Value of Financial Instruments The carrying amounts of cash and cash equivalents, accounts receivable, accounts payable and accrued expenses approximate fair value because of the short maturity of these items. The carry-ing amount of debt outstanding pursuant to bank credit agree-ments approximates fair value as interest rates on these instruments approximate current market rates. The estimated fair value of the convertible senior debentures was approximately $325.5 million and $339.0 million at January 31, 2008 and 2007, respectively, based upon available market information.
Comprehensive Income (Loss) Comprehensive income (loss) is defined as the change in equity (net assets) of a business enterprise during a period from transac-tions and other events and circumstances from non-owner sources, and is comprised of “net income (loss)” and “other com-prehensive income (loss).” The Company’s other comprehensive (loss) income is comprised exclusively of changes in the Company’s currency translation adjustment account (“CTA account”), including income taxes attributable to those changes.
Comprehensive income (loss), net of taxes, for the years ended January 31, 2008, 2007 and 2006 is as follows:
Year ended January 31,
2008 2007 2006
(In thousands)Comprehensive income (loss):
Net income (loss) . . . . . . . . . . . . $108,269 $(96,981) $ 26,586Change in CTA(1) . . . . . . . . . . . . . 184,758 81,498 (86,043)
Total . . . . . . . . . . . . . . . . . . . . $293,027 $(15,483) $(59,457)
(1) Net of income tax benefit of $5.6 million for the year ended January 31, 2008. There was no income tax effect in fiscal years 2007 or 2006.
Accumulated comprehensive (loss) income includes $23.0 mil-lion of income taxes at January 31, 2008 and $28.6 million of income taxes at both January 31, 2007 and 2006.
Stock-Based Compensation Effective February 1, 2006 (the “Effective Date”), the Company adopted the fair value recognition provisions of SFAS No. 123 (revised 2004), “Share-Based Payments” (“SFAS No. 123R”). SFAS No. 123R requires all stock-based payments to employees and non-employee members of the board of directors, including grants of all employee equity incentives, to be recognized in the Company’s Consolidated Statement of Operations based on their fair values. In March 2005, the SEC issued Staff Accounting Bulletin No. 107 (“SAB No. 107”) regarding its interpretation of SFAS No. 123R and the valuation of stock-based payments for public companies. The Company has applied the provisions of SAB No. 107 in its adoption of SFAS No. 123R.
SFAS No. 123R eliminates the ability to account for stock-based compensation transactions using the intrinsic value method pre-scribed under APB Opinion No. 25, “Accounting for Stock Issued to Employees,” and instead, generally requires that such transac-tions be accounted for using a fair-value based method. Through fiscal 2005, the Company used the Black-Scholes option-pricing model to determine the fair value of its stock options under SFAS No. 123, “Accounting for Stock-Based Compensation” (“SFAS No. 123”), for the pro forma disclosures required under this pro-nouncement. Beginning in fiscal 2006, the Company began issu-ing maximum value stock-settled stock appreciation rights (“MV Stock-settled SARs”) and maximum value stock options (“MVOs”), both of which are further discussed below. The fair value of MV Stock-settled SARs and MVOs under SFAS No. 123R is determined using a two-step valuation model utilizing both the Hull-White Lattice (binomial) and Black-Scholes option-pricing models, which is consistent with the valuation method used for the MV Stock-settled SARs and MVOs previously included in the Company’s pro forma disclosures under SFAS No. 123.
The Company has elected the “modified prospective” method as permitted by SFAS No. 123R, and accordingly, prior periods have not been restated to reflect the impact of SFAS No. 123R. The modified prospective method requires compensation expense to be recognized for all stock-based awards granted after the
NOTES TO CONSOLIDATED FINANCIAL STATEMENTS

Tech Data Corporation 39
Effective Date as well as for all awards granted prior to the Effective Date that remain unvested on the Effective Date. Stock-based compensation expense for awards granted prior to February 1, 2006 is based on the grant date fair value as previously determined under the provisions of SFAS No. 123. Effective February 1, 2006 the Company began to recognize com-pensation expense, reduced for estimated forfeitures, on a straight-line basis over the requisite service period of the award, which is generally the vesting term of the outstanding stock awards. The Company estimated the forfeiture rates for the fiscal years ended January 31, 2008 and 2007 based on its historical experience during the preceding five fiscal years. For the fiscal years ended January 31, 2008 and 2007, the Company recorded $10.3 million and $8.0 million, respectively, of stock-based compensation expense, which is included in “selling, general and administrative expenses” in the Consolidated Statement of Operations.
In accordance with SFAS No. 123R, beginning in the quarter ended April 30, 2006, the Company has presented the tax bene-fits resulting from tax deductions in excess of compensation cost recognized for stock-based awards (excess tax benefits) both as an operating activity and as a financing activity in the Consolidated Statement of Cash Flows. Cash received from stock option exer-cises during the fiscal years ended January 31, 2008 and 2007 was $12.5 million and $25.2 million, respectively, and the actual benefit received from the tax deduction from stock option exer-cises of the stock-based payment awards was $1.1 million and $2.7 million, respectively, for the fiscal years ended January 31, 2008 and 2007.
Prior to the adoption of SFAS No. 123R, the Company mea-sured compensation expense for its stock-based compensation plans using the intrinsic value method prescribed by APB Opinion No. 25 and related interpretations. Options granted under these plans had an exercise price equal to or greater than the market value of the underlying common stock on the date of grant. The Company applied the disclosure only provisions of SFAS No. 148, which amends SFAS No. 123. SFAS No. 148 allowed for the con-tinued use of recognition and measurement principles of APB Opinion No. 25 and related interpretations in accounting for those plans, but required disclosure of compensation expense as if the fair value-based method had been applied.
The following table illustrates the pro forma net income and pro forma income per share for fiscal year ended January 31, 2006, reflecting the compensation cost that the Company would have recorded on its equity incentive plans had it used the fair value-based method at grant date for awards under the plans consistent with the method prescribed by SFAS No. 123.
Year endedJanuary 31, 2006
(In thousands, exceptper share amounts)
Net income, as reported . . . . . . . . . . . . . . . . . . . . $ 26,586Deduct: Total stock-based employee
compensation expense determined under fair value-based method for all awards, net of related tax effects(1) . . . . . . . . . . . . . . . . (22,804)
Pro forma net income . . . . . . . . . . . . . . . . . . . . . . $ 3,782
Earnings per share:
Basic—as reported . . . . . . . . . . . . . . . . . . . . . . $ 0.46
Basic—pro forma . . . . . . . . . . . . . . . . . . . . . . . $ 0.07
Diluted—as reported . . . . . . . . . . . . . . . . . . . . $ 0.45
Diluted—pro forma . . . . . . . . . . . . . . . . . . . . . $ 0.06
(1) Pro-forma stock compensation expense for the year ended January 31, 2006 includes incremental expense, net of the related tax effects, of approximately $15.4 million related to the accelerated vesting of stock options issued in March 2004.
Treasury Stock Treasury stock is accounted for at cost. The reissuance of shares from treasury stock for exercises of stock-based awards or other corporate purposes is based on the weighted average purchase price of the shares.
Cash Management System
that cash is unavailable locally, disbursements cleared by the bank are reimbursed on a daily basis from available credit facilities. As a result, checks issued but not yet presented to the bank by the payee are classified in accounts payable. Included in accounts pay-able are $136.6 million and $115.5 million at January 31, 2008 and 2007, respectively, for which checks are outstanding.

continued
40
Statement of Cash Flows Short-term investments which are highly liquid and have an original maturity of ninety days or less are considered cash equivalents.
Contingencies The Company accrues for contingent obligations, including esti-mated legal costs, when the obligation is probable and the amount is reasonably estimable. As facts concerning contingen-cies become known, the Company reassesses its position and makes appropriate adjustments to the financial statements. Estimates that are particularly sensitive to future changes include those related to tax, legal and other regulatory matters such as imports and exports, the imposition of international governmental controls, changes in the interpretation and enforcement of inter-national laws (particularly related to items such as duty and taxa-tion), and the impact of local economic conditions and practices, which are all subject to change as events evolve and as additional information becomes available during the administrative and litigation process.
Recent Accounting Pronouncements & Legislation In December 2007, the Financial Accounting Standards Board (“FASB”) issued Statement of Financial Accounting Standards No. 141(R), “Business Combinations” (“SFAS No. 141R”). SFAS No. 141R supercedes Statement of Financial Accounting Standards No. 141, “Business Combinations,” and establishes principles and requirements as to how an acquirer in a business combination recognizes and measures in its financial statements: the identifiable assets acquired, the liabilities assumed and any
-
the acquirer to record contingent consideration at the estimated fair value at the time of purchase and establishes principles for treating subsequent changes in such estimates which could affect earnings in those periods. SFAS No. 141R also requires additional disclosure designed to enable users of the financial statements to evaluate the nature and financial effects of the business combina-tion and disallows the capitalization of acquisition costs. SFAS No. 141R is to be applied prospectively by the Company to business combinations beginning February 1, 2009 and early adoption is prohibited. The Company will implement the provisions of SFAS No. 141R for any acquisitions made by the Company subsequent to February 1, 2009.
In December 2007, the FASB issued Statement of Financial Accounting Standards No. 160, “Noncontrolling Interests in Consolidated Financial Statements—an amendment of ARB No. 51” (“SFAS No. 160”). SFAS No. 160 establishes new accounting and
reporting standards for the noncontrolling interest in a subsidiary and the accounting for the deconsolidation of a subsidiary. SFAS No. 160 also clarifies that changes in a parent’s ownership interest in a subsidiary that do not result in deconsolidation are equity transactions if the parent retains its controlling financial interest and requires that a parent recognize a gain or loss in net income when a subsidiary is deconsolidated. The gain or loss will be mea-sured using the fair value of the noncontrolling equity investment on the deconsolidation date. SFAS No. 160 also includes expanded disclosure requirements regarding the interests of the parent and its noncontrolling interest. SFAS No. 160 is effective for the Company beginning February 1, 2009. Early adoption is prohib-ited, but upon adoption SFAS No. 160 requires retroactive presen-tation and disclosure related to existing minority interests. The Company is currently in the process of assessing what impact SFAS No. 160 may have on its consolidated financial position, results of operations or cash flows.
In February 2007, the FASB issued Statement of Financial Accounting Standard No. 159, “The Fair Value Option for Financial Assets and Liabilities” (“SFAS No. 159”). SFAS No. 159 permits companies to make an election to carry certain eligible financial assets and liabilities at fair value, even if fair value measurement has not historically been required for such assets and liabilities
-tive for the Company’s fiscal year beginning February 1, 2008. The adoption of the provisions of SFAS No. 159 did not have an impact on the Company’s consolidated financial position, results of operations or cash flows as the Company elected not to record eligible instruments in the financial statements at their respective fair value.
In September 2006, the FASB issued Statement of Financial Accounting Standards No. 157, “Fair Value Measurements” (“SFAS No. 157”). SFAS No. 157 defines fair value, establishes a frame-work for measuring fair value in accordance with generally accepted accounting principles and expands disclosures about fair value measurements. The adoption of the provisions of this state-ment became effective for the Company’s fiscal year beginning on February 1, 2008 and is to be applied prospectively. In February 2008, the Financial Accounting Standards Board issued Staff Position Nos. 157-1 and 157-2 which partially deferred the effective date of SFAS No. 157 for one year for certain nonfinan-cial assets and liabilities and removed certain leasing transactions from the scope of SFAS No. 157. The Company is currently evalu-ating the impact and disclosure requirements of this standard, but does not expect SFAS No. 157 to have a material impact on its consolidated financial position, results of operations or cash flows.
NOTES TO CONSOLIDATED FINANCIAL STATEMENTS

Tech Data Corporation 41
NOTE 2—EARNINGS PER SHARE (“EPS”)
Basic EPS is computed by dividing net income by the weighted average number of shares outstanding during the reported period. For the years ended January 31, 2008, 2007 and 2006, diluted EPS reflects the potential dilution that could occur assuming the exercise of the stock options and similar equity incentives (as further discussed below) using the treasury stock or if-converted method, as applicable. The composition of basic and diluted EPS is as follows:
Year ended January 31, 2008 Year ended January 31, 2007 Year ended January 31, 2006
Net income
Weighted average shares
Per share
amountNetloss
Weighted average shares
Per share
amountNet
income
Weighted average shares
Per share
amount
(In thousands, except per share data)Net income (loss) per common
share—basic . . . . . . . . . . . . . . . . . . . . . . . . $108,269 54,904 $1.97 $(96,981) 55,129 $(1.76) $26,586 57,749 $0.46
Effect of dilutive securities:Equity-based compensation awards . . . . . . — 383 — — — 665
Net income (loss) per common share—diluted . . . . . . . . . . . . . . . . . . . . . . $108,269 55,287 $1.96 $(96,981) 55,129 $(1.76) $26,586 58,414 $0.45
At January 31, 2008, 2007 and 2006, there were 6,017,838, 6,912,122 and 3,215,066 shares, respectively, excluded from the computation of diluted earnings per share because their effect would have been antidilutive.
In December 2006, the Company issued $350.0 million of con-vertible senior debentures due 2026. The dilutive impact of the $350.0 million convertible senior debentures does not impact earn-ings per share at either January 31, 2008 or 2007, respectively, as the conditions for the contingent conversion feature have not been met (see further discussion in Note 10—Long Term Debt).
NOTE 3—DISCONTINUED OPERATIONS
In the fourth quarter of fiscal 2006, in order to dedicate strategic efforts and resources to core growth opportunities, the Company made the decision to sell the European training business (the “Training Business”). On March 10, 2006, the Company closed the sale of the Training Business to a third-party (the “Purchaser”) for total cash consideration of $16.5 million, resulting in an after-tax gain of $3.8 million. Net assets and other related costs included in the sale of the Training Business totaled $11.5 million, including $1.4 million of allocated goodwill. The Company provided IT ser-vices for a transitional period of approximately six months, but had no other significant continuing involvement in the operations of the Training Business subsequent to the closing of the sale. In addition, the Company has realized no continuing cash flows from the Training Business subsequent to the closing of the sale.
In accordance with SFAS No. 144, the sale of the Training Business qualifies as a discontinued operation. Accordingly, the results of operations and the gain on sale of the Training Business have been reclassified and included in “discontinued operations, net of tax,” within the Consolidated Statement of Operations for the fiscal years ended January 31, 2007 and 2006, respectively.
The following table reflects the results of the Training Business reported as discontinued operations for all periods presented:
Year ended January 31,
2007 2006
(In thousands)
Net sales . . . . . . . . . . . . . . . . . . . . . . . . . . . . . . . . . . $5,634 $59,290Cost of products sold . . . . . . . . . . . . . . . . . . . . . . . . 1,259 11,519
Gross profit . . . . . . . . . . . . . . . . . . . . . . . . . . . . . . . 4,375 47,771Selling, general and administrative expenses . . . . . . 4,056 42,545
Operating income from discontinued operations . . . . . . . . . . . . . . . . . . . . 319 5,226
Provision for income taxes . . . . . . . . . . . . . . . . . . . . 207 1,607
Income from discontinued operations, net of tax . . . . . . . . . . . . . . . . . . . . . . . . . . . . . . . 112 3,619
Gain on sale of discontinued operations, net of tax . . . . . . . . . . . . . . . . . . . . . . . . . . . . . . . 3,834 —
Total . . . . . . . . . . . . . . . . . . . . . . . . . . . . . . . . . . . . . $3,946 $ 3,619
No amounts related to interest expense or interest income have been allocated to discontinued operations.
continued
42
NOTE 4—ACCOUNTS RECEIVABLE, NETAccounts receivable, net is comprised of the following:
January 31,
2008 2007
(In thousands)
Accounts receivable . . . . . . . . . . . . . . . . . . $2,723,592 $2,533,702Allowance for doubtful accounts . . . . . . . . (64,146) (68,967)
Total . . . . . . . . . . . . . . . . . . . . . . . . . . . . . . $2,659,446 $2,464,735
Trade Receivables Purchase Facility Agreements The Company has uncommitted revolving trade receivables pur-chase facility agreements (the “Receivables Facilities”) with third-party financial institutions to sell accounts receivable on a non-recourse basis. The Company uses the Receivables Facilities as a source of working capital funding. The Receivables Facilities limit the amount of purchased accounts receivable the financial institu-tions may hold to $428.2 million at January 31, 2008, based on
Facilities, the Company may sell certain accounts receivable (the “Receivables”) in exchange for cash less a discount based on LIBOR plus a margin. Such transactions have been accounted for as a true sale in accordance with SFAS No. 140, “Accounting for Transfers and Servicing of Financial Assets and Extinguishment of Liabilities.” The Receivables Facilities, which have various expiration dates, require that the Company continue to service, administer and collect the sold accounts receivable.
During the fiscal years ended January 31, 2008, 2007 and 2006, the Company received gross proceeds of $1.2 billion, $1.3 billion and $796.1 million, respectively, from the sale of the Receivables and recognized related discounts totaling $7.2 million, $12.5 million and $5.5 million, respectively. The proceeds, net of the discount incurred, are reflected in the Consolidated Statement of Cash Flows in operating activities within cash received from customers and the change in accounts receivable. Prior to the sec-ond quarter of fiscal 2006, the Company did not utilize the Receivables Facilities as a source of funding.
NOTE 5—PROPERTY AND EQUIPMENT, NET
January 31,
2008 2007
(In thousands)
Land . . . . . . . . . . . . . . . . . . . . . . . . . . . . . . . . $ 7,352 $ 6,584Buildings and leasehold improvements . . . . . . 85,875 91,370Furniture, fixtures and equipment . . . . . . . . . 348,728 340,398
441,955 438,352Less accumulated depreciation . . . . . . . . . . . . (312,816) (297,590)
$ 129,139 $ 140,762
Depreciation expense, including amortization expense of assets recorded under capital leases, included in income from continuing operations for the years ended January 31, 2008, 2007 and 2006 totaled $29.8 million, $31.0 million and $30.6 million, respectively. The Company has property and equipment leased under capital leases for the German logistics center, which was vacated during fiscal 2008 (see further discussion at Note 8—Restructuring Programs). As of January 31, 2008, the net book value of $8.9 million for property and equipment under capital leases is classi-fied as an asset held for sale in “other assets, net” within the Consolidated Balance Sheet. As of January 31, 2007, “property and equipment, net” includes the originally capitalized value of the German logistics center of $24.3 million and accumulated depreciation of $10.5 million.
NOTE 6—GOODWILL AND INTANGIBLE ASSETS
The Company accounts for goodwill and other intangible assets in accordance with SFAS No. 142, “Goodwill and Other Intangible Assets.” SFAS No. 142 requires goodwill and indefinite-lived intan-gible assets be reviewed annually for possible impairment, or more frequently if impairment indicators arise. Due to certain indicators of impairment within our European reporting unit, the Company performed an impairment test for goodwill as of July 31, 2006.These impairment indicators included significantly lower than expected revenues in Europe during the quarter, further decelera-tion in IT demand during the quarter and a heightened level of pricing pressure in Europe during the quarter. The Company’s impairment testing included the determination of the European
NOTES TO CONSOLIDATED FINANCIAL STATEMENTS
Tech Data Corporation 43
reporting unit’s fair value using market multiples and discounted cash flows modeling. The Company’s reduced earnings and cash flow forecast for Europe, primarily due to the increasingly competitive market conditions and uncertain demand, resulted in the Company determining that a goodwill impairment charge was necessary. During the second quarter of fiscal 2007, the Company recorded a $136.1 million non-cash charge for the goodwill impairment in Europe.
The changes in the carrying amount of goodwill for the years ended January 31, 2008 and 2007, respectively, are as follows:
Americas Europe Total
(In thousands)
Balance as of January 31, 2006 . . . . . . . . . . . . . . . . . . . . . . . . . . . . . . . . . . . . . . . . . . . . . . . . . . . . . . . . . . . . . . . $2,966 $ 131,361 $ 134,327Allocation of goodwill to sale of Training Business . . . . . . . . . . . . . . . . . . . . . . . . . . . . . . . . . . . . . . . . . . . . . . . . . — (1,400) (1,400)Adjustments to allocation of previously recorded purchase price . . . . . . . . . . . . . . . . . . . . . . . . . . . . . . . . . . . . . . — 990 990Goodwill impairment . . . . . . . . . . . . . . . . . . . . . . . . . . . . . . . . . . . . . . . . . . . . . . . . . . . . . . . . . . . . . . . . . . . . . . . — (136,093) (136,093)Other(1) . . . . . . . . . . . . . . . . . . . . . . . . . . . . . . . . . . . . . . . . . . . . . . . . . . . . . . . . . . . . . . . . . . . . . . . . . . . . . . . . . — 5,142 5,142
Balance as of January 31, 2007 and 2008 . . . . . . . . . . . . . . . . . . . . . . . . . . . . . . . . . . . . . . . . . . . . . . . . . . . . . $2,966 $ — $ 2,966
(1) “Other” primarily relates to the effect of fluctuations in foreign currencies.
Included within “other assets, net” are intangible assets as follows:
January 31, 2008 January 31, 2007
Grosscarrying amount
Accumulated amortization
Net book value
Gross carrying amount
Accumulated amortization
Net book value
(In thousands) (In thousands)Amortized intangible assets:Capitalized software and development costs . . . . . . . . . . . . . . . . $231,365 $142,504 $88,861 $202,342 $120,847 $81,495Customer lists . . . . . . . . . . . . . . . . . . . . . . . . . . . . . . . . . . . . . . . . 37,474 28,442 9,032 31,356 20,829 10,527Trademarks . . . . . . . . . . . . . . . . . . . . . . . . . . . . . . . . . . . . . . . . . . 9,208 8,613 595 7,806 5,985 1,821Other intangible assets . . . . . . . . . . . . . . . . . . . . . . . . . . . . . . . . . 2,363 1,184 1,179 2,191 666 1,525
Total . . . . . . . . . . . . . . . . . . . . . . . . . . . . . . . . . . . . . . . . . . . . . $280,410 $180,743 $99,667 $243,695 $148,327 $95,368
The Company capitalized intangible assets of $18.4 million, $12.1 million and $18.8 million for the years ended January 31, 2008, 2007 and 2006, respectively. These capitalized intangible assets included capitalized interest of $0.3 million for the fiscal year ended January 31, 2006. There was no interest capitalized during the fiscal years ended January 31, 2008 and 2007. These capitalized assets related primarily to software and software development expenditures to be used in the Company’s operations.
The weighted average amortization period for all intangible assets capitalized during fiscal 2008, 2007 and 2006 approxi-mated five, six and nine years, respectively. The weighted average amortization period of all intangible assets was approximately seven years for fiscal 2008, approximately eight years for fiscal 2007 and approximately nine years for fiscal year 2006.
Amortization expense included in income from continuing operations for the years ended January 31, 2008, 2007 and 2006 totaled $24.1 million, $22.1 million and $21.2 million, respectively. Estimated amortization expense of currently capitalized costs for assets placed in service is as follows (in thousands):
Fiscal year:
2009. . . . . . . . . . . . . . . . . . . . . . . . . . . . . . . . . . . . . . . . . . . . . $22,8002010. . . . . . . . . . . . . . . . . . . . . . . . . . . . . . . . . . . . . . . . . . . . . 18,8002011. . . . . . . . . . . . . . . . . . . . . . . . . . . . . . . . . . . . . . . . . . . . . 13,2002012. . . . . . . . . . . . . . . . . . . . . . . . . . . . . . . . . . . . . . . . . . . . . 11,3002013. . . . . . . . . . . . . . . . . . . . . . . . . . . . . . . . . . . . . . . . . . . . . 10,500

continued
44
NOTE 7—LOSS ON DISPOSAL OF SUBSIDIARIES
The Company’s loss on disposal of subsidiaries is the result of the
profitability and return on capital employed. In late March 2007, the Company made the decision to cease
completed by the end of the second quarter of fiscal 2008. During the year ended January 31, 2008, the Company recorded a loss on disposal of this subsidiary of $10.8 million, which includes a
due to a foreign currency exchange loss (previously recorded in shareholders’ equity as accumulated other comprehensive income) and $1.0 million for severance costs and fixed asset write-offs. These costs are reflected in the Consolidated Statement of Operations as “loss on disposal of subsidiaries,” which is a
operating losses of approximately $0.9 million during the year ended January 31, 2008, comprised primarily of inventory write-downs and occupancy-related expenses.
During the quarter ended July 31, 2007, the Company executed an agreement for the sale of the Israel operations at an amount approximating local currency net book value. In connection with this agreement, the Company recorded a loss on disposal of this subsidiary of $3.7 million, which includes a $2.7 million impair-ment on the Company’s investment in Israel due to a foreign currency exchange loss (previously recorded in shareholders’ equity as accumulated other comprehensive income) and $1.0 million for costs related to the sale. These costs are reflected in the Consolidated Statement of Operations as “loss on disposal of subsidiaries,” which is a component of operating income. The sale of the Israel operation closed during the quarter ended October 31, 2007. Israel had an operating loss of $0.1 million during fiscal 2008 through the date of closing.
NOTE 8—RESTRUCTURING PROGRAMS
The Company’s restructuring charges discussed below were incurred pursuant to formal plans developed by management and are accounted for in accordance with the guidance set forth in SFAS No. 146, “Accounting for Costs Associated with Exit or Disposal Activities.” The costs related to these restructuring pro-grams are reflected in the Consolidated Statement of Operations as “restructuring charges,” which is a component of operating income. The accrued restructuring charges are included in “accrued expenses and other liabilities” in the Consolidated Balance Sheet.
Closure of European Logistics Center On May 1, 2007, the Company’s Board of Directors approved the exit from our logistics center in Germany (the “Moers logistics center”). The decision to exit this logistics center was made to enable the Company to capitalize on the long-term synergies of having one logistics center serving Germany, Austria and the Czech Republic. Related to the Moers logistics center exit, Tech Data is expanding its logistics center located in Bor, Czech Republic. The Company expects the net result of these transactions to be a reduction in our future operating expenses.
In connection with this closure, the Company recorded $18.1 million in restructuring charges, comprised of $8.7 million of workforce reductions and $9.4 million for facility costs and other fixed asset write-offs. The recognition of the restructuring charges requires the Company’s management to make judgments and estimates regarding the nature, timing and amounts of costs asso-ciated with the closure of the Moers logistics center. Cash pay-ments related to the restructuring program have been funded by operating cash flows and the Company’s credit facilities. Although the Company believes its estimates are appropriate and reason-able based upon available information, actual results could differ from these estimates. The remaining net book value of the Moers logistics center of $8.9 million at January 31, 2008 is classified as an asset held for sale under SFAS No. 144, “Accounting for the Impairment or Disposal of Long-lived Assets” and, accordingly, reclassified from “property and equipment, net” to “other assets, net” in the Consolidated Balance Sheet.
European Restructuring Program In May 2005, the Company announced a formal restructuring program to better align the European operating cost structure with the business environment prevailing at the time. The initia-tives related to the restructuring program were completed during the third quarter of fiscal 2007. In connection with this restructur-ing program, the Company recorded charges for workforce reduc-tions and the optimization of facilities and systems. During the year ended January 31, 2008, the Company recorded credits of $2.0 million related to changes in estimates of previously recorded restructuring accruals. Through January 31, 2008 (since inception of the program), the Company has incurred $52.7 million related to the restructuring program, comprised of $38.5 million for workforce reductions and $14.2 million for facility costs. Cash payments related to the restructuring program have been funded by operating cash flows and the Company’s credit facilities.
NOTES TO CONSOLIDATED FINANCIAL STATEMENTS

Tech Data Corporation 45
In addition, during the years ended January 31, 2007 and 2006, the Company incurred $8.6 million and $9.6 million, respec-tively, of external consulting costs related to the restructuring program. These consulting costs are included in “selling, general and administrative expenses” in the Consolidated Statement of Operations.
Summarized below is the activity related to accruals for restruc-turing charges under the restructuring programs discussed above, recorded during the years ended January 31, 2008, 2007 and 2006:
Employeetermination
benefitsFacility costs Total
(In thousands)
Balance as of January 31, 2005 . . . . $ — $ — $ —Charges to operations . . . . . . . . . . . 18,888 12,058 30,946Cash payments . . . . . . . . . . . . . . . . . (16,980) (2,198) (19,178)Other(2) . . . . . . . . . . . . . . . . . . . . . . . 151 564 715
Balance as of January 31, 2006 . . . . 2,059 10,424 12,483Charges to operations . . . . . . . . . . . 19,989 3,775 23,764Cash payments . . . . . . . . . . . . . . . . . (17,508) (8,825) (26,333)Other(2) . . . . . . . . . . . . . . . . . . . . . . . (518) 1,821 1,303
Balance as of January 31, 2007 . . . . 4,022 7,195 11,217Charges to operations . . . . . . . . . . . 7,920 8,229 16,149Impairment of assets leased
under capital lease and fixed asset write-offs(1) . . . . . . . . . — (5,767) (5,767)
Cash payments . . . . . . . . . . . . . . . . . (10,932) (3,142) (14,074)Other(2) . . . . . . . . . . . . . . . . . . . . . . . 1,104 1,098 2,202
Balance as of January 31, 2008 . . . $ 2,114 $ 7,613 $ 9,727
(1) The impairment of assets leased under capital lease and fixed asset write-offs were related to the Moers logistics facility and were recorded against the respective asset accounts.
(2) “Other” primarily relates to the effect of fluctuations in foreign currencies.
NOTE 9—REVOLVING CREDIT LOANSJanuary 31,
2008 2007
(In thousands)Receivables Securitization Program, interest
rate of 5.16% at January 31, 2008, expiring December 2008 . . . . . . . . . . . . . . . . . . $ — $ —
Multi-currency Revolving Credit Facility, interest rate of 3.77% at January 31, 2008, expiring March 2012 . . . . . . . . . . . . . . . . . . . . . . — —
Other revolving credit facilities, average interest rate of 5.33% at January 31, 2008, expiring on various dates throughout fiscal 2009 . . . . . . . . . . . . . . . . . . . . . . . . . . . . . 18,315 77,195
$18,315 $77,195
The Company has an agreement (the “Receivables Securitization Program”), amended in December 2007, with a syndicate of banks that allows the Company to transfer an undivided interest in a
to provide security or collateral for borrowings up to a maximum
into a wholly-owned bankruptcy remote special purpose entity. Such receivables, which are recorded in the Consolidated Balance Sheet, totaled $510.5 million and $571.3 million at January 31, 2008 and 2007, respectively. As collections reduce accounts receivable balances included in the pool, the Company may transfer interests in new receivables to bring the amount available to be borrowed up to the maximum. The Company pays interest on advances under the Receivables Securitization Program at designated commercial paper rates plus an agreed-upon margin. The Company plans to renew this program in December 2008.
Credit Facility with a syndicate of banks, amended in March 2007, the Company is able to borrow funds in major foreign currencies
expires in March 2012, the Company has provided either a pledge of stock or a guarantee of certain of its significant subsidiaries. The Company pays interest on advances under this facility at the applicable LIBOR rate plus a margin based on the Company’s credit ratings. The Company can fix the interest rate for periods of seven to 180 days under various interest rate options.
In addition to the facilities described above, the Company has additional lines of credit and overdraft facilities totaling approximately $768.5 million at January 31, 2008 to support its worldwide operations. Most of these facilities are provided on an unsecured, short-term basis and are reviewed periodically for renewal.
The total capacity of the aforementioned credit facilities was approximately $1.3 billion, of which $18.3 million was outstanding at January 31, 2008. The Company’s credit agreements contain limitations on the amounts of annual dividends and repurchases of common stock. Additionally, the credit agreements require compliance with certain warranties and covenants. The financial ratio covenants contained within the credit agreements include a debt to capitalization ratio, an interest to EBITDA (earnings before interest, taxes, deprecation and amortization) ratio and a tangible net worth requirement. At January 31, 2008, the Company was in compliance with all such covenants. The ability to draw funds under these credit facilities is dependent upon sufficient collateral (in the case of the Receivables Securitization Program) and meeting the aforementioned financial covenants, which may limit the Company’s ability to draw the full amount of these facilities.

continued
46
As of January 31, 2008, the maximum amount that could be borrowed under these facilities, in consideration of the availability of collateral and the financial covenants, was approximately $753.1 million.
At January 31, 2008, the Company had issued standby letters of credit of $26.2 million. These letters of credit typically act as a guarantee of payment to certain third parties in accordance with specified terms and conditions. The issuance of these letters of credit reduces the Company’s available capacity under the above mentioned facilities by the same amount.
NOTE 10—LONG-TERM DEBT
January 31,
2008 2007
(In thousands)Convertible senior debentures, interest
at 2.75% payable semi-annually, due December 2026 . . . . . . . . . . . . . . . . . . . $350,000 $350,000
Capital leases . . . . . . . . . . . . . . . . . . . . . . . . . . 14,882 15,980
364,882 365,980
Less—current maturities . . . . . . . . . . . . . . . . . . (1,243) (2,376)
$363,639 $363,604
In December 2006, the Company issued $350.0 million of convertible senior debentures due 2026. The debentures bear interest at 2.75% per year. The Company pays interest on the debentures on June 15 and December 15 of each year, beginning on June 15, 2007. In addition, beginning with the period com-mencing on December 20, 2011 and ending on June 15, 2012 and for each six-month period thereafter, the Company will pay con-tingent interest on the interest payment date for the applicable interest period if the market price of the debentures equals speci-fied levels. The convertible senior debentures are convertible into the Company’s common stock and cash, anytime after June 15, 2026, or i) if the market price of the common stock, as defined, exceeds 135% of the conversion price per share of common stock or ii) if the Company calls the debentures for redemption or iii) upon occurrence of certain corporate transactions, as defined. Holders have the right to convert the debentures into cash and shares of the Company’s common stock, if any, at a conversion rate of 18.4310 shares per $1,000 principal amount of deben-tures, equivalent to a conversion price of approximately $54.26
to the lesser of the aggregate principal amount of the debentures to be converted and the Company’s total conversion obligation and shares of the Company’s common stock in respect of the
remainder, if any, of the Company’s conversion obligation. Holders have the option to require the Company to repurchase the deben-tures in cash on any of the fifth, tenth or fifteenth anniversary dates from the issue date at 100% of the principal amount plus accrued interest to the repurchase date. The debentures are redeemable in whole or in part for cash at the Company’s option at any time on or after December 20, 2011. Additionally, the debentures are senior, unsecured obligations and rank equally in right of payment with all of the Company’s other unsecured and unsubordinated indebtedness. The debentures are effectively subordinated to all of the Company’s existing and future secured debt and are structurally subordinated to the indebtedness and other liabilities of the Company’s subsidiaries. The proceeds from the offering were used to pay off short-term debt and for other general corporate purposes.
Future payments of long-term debt and capital leases at January 31, 2008 and for succeeding fiscal years, which assumes the $350 million convertible senior debentures will be redeemed on the first redemption date of December 20, 2011, are as follows (in thousands):
Fiscal year:
2009 . . . . . . . . . . . . . . . . . . . . . . . . . . . . . . . . . . . . . . . . . . $ 2,2532010. . . . . . . . . . . . . . . . . . . . . . . . . . . . . . . . . . . . . . . . . . . 2,0652011 . . . . . . . . . . . . . . . . . . . . . . . . . . . . . . . . . . . . . . . . . . . 2,0652012 . . . . . . . . . . . . . . . . . . . . . . . . . . . . . . . . . . . . . . . . . . . 352,0652013 . . . . . . . . . . . . . . . . . . . . . . . . . . . . . . . . . . . . . . . . . . . 2,065Thereafter . . . . . . . . . . . . . . . . . . . . . . . . . . . . . . . . . . . . . . 8,335
Total payments . . . . . . . . . . . . . . . . . . . . . . . . . . . . . . . . . . . 368,848Less amounts representing interest on capital leases . . . . . . (3,966)
Total principal payments . . . . . . . . . . . . . . . . . . . . . . . . . . . . $364,882
NOTE 11—INCOME TAXES
The Company accounts for income taxes in accordance with SFAS No. 109, “Accounting for Income Taxes.” The Company evaluates the realizability of its deferred tax assets on a quarterly basis. This evaluation considers all positive and negative evidence and fac-tors, such as the scheduled reversal of temporary differences, his-torical and projected future taxable income, and prudent and feasible tax planning strategies.
As a result of the Company’s quarterly deferred tax asset eval-uation during the fourth quarter of fiscal 2008, the Company determined that a valuation allowance against deferred tax assets related to Brazil was no longer necessary. Therefore, the Company reversed the $7.5 million deferred tax asset valuation allowance associated with Brazil, which was recorded as an income tax benefit during the fourth quarter of fiscal 2008.
NOTES TO CONSOLIDATED FINANCIAL STATEMENTS
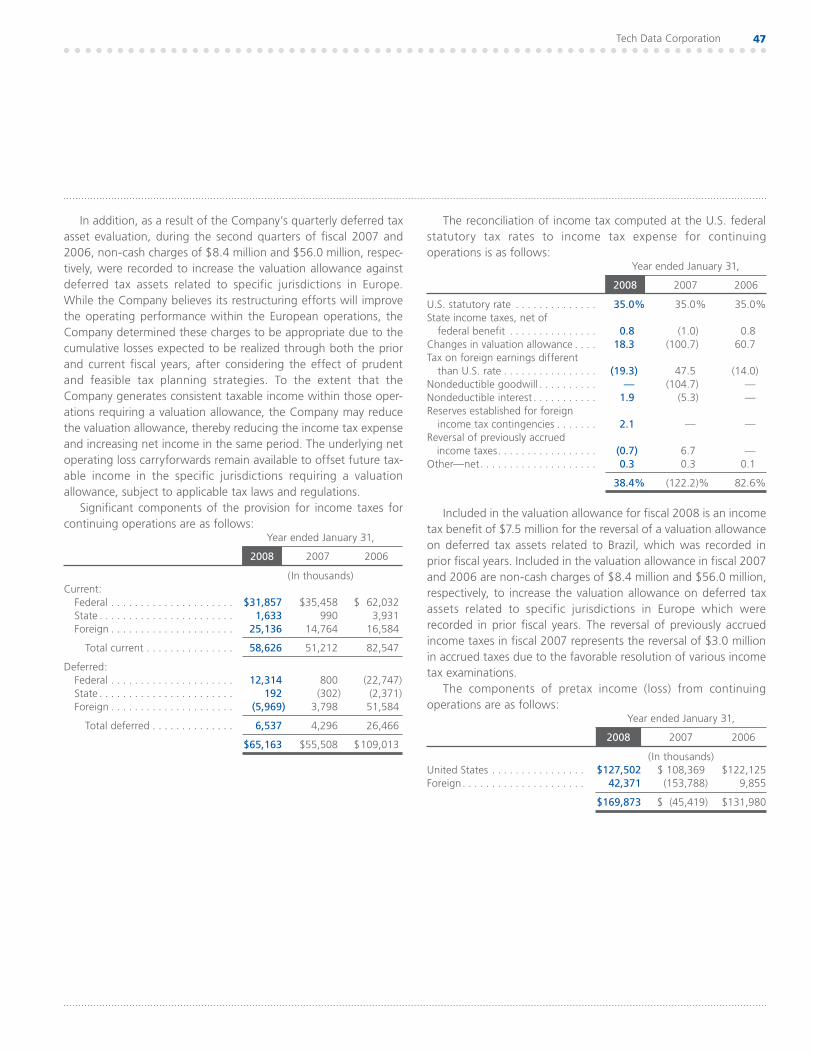
Tech Data Corporation 47
In addition, as a result of the Company’s quarterly deferred tax asset evaluation, during the second quarters of fiscal 2007 and 2006, non-cash charges of $8.4 million and $56.0 million, respec-tively, were recorded to increase the valuation allowance against deferred tax assets related to specific jurisdictions in Europe. While the Company believes its restructuring efforts will improve the operating performance within the European operations, the Company determined these charges to be appropriate due to the cumulative losses expected to be realized through both the prior and current fiscal years, after considering the effect of prudent and feasible tax planning strategies. To the extent that the Company generates consistent taxable income within those oper-ations requiring a valuation allowance, the Company may reduce the valuation allowance, thereby reducing the income tax expense and increasing net income in the same period. The underlying net operating loss carryforwards remain available to offset future tax-able income in the specific jurisdictions requiring a valuation allowance, subject to applicable tax laws and regulations.
Significant components of the provision for income taxes for continuing operations are as follows:
Year ended January 31,
2008 2007 2006
(In thousands)Current:
Federal . . . . . . . . . . . . . . . . . . . . . $31,857 $35,458 $ 62,032State . . . . . . . . . . . . . . . . . . . . . . . 1,633 990 3,931Foreign . . . . . . . . . . . . . . . . . . . . . 25,136 14,764 16,584
Total current . . . . . . . . . . . . . . . 58,626 51,212 82,547
Deferred:Federal . . . . . . . . . . . . . . . . . . . . . 12,314 800 (22,747)State . . . . . . . . . . . . . . . . . . . . . . . 192 (302) (2,371)Foreign . . . . . . . . . . . . . . . . . . . . . (5,969) 3,798 51,584
Total deferred . . . . . . . . . . . . . . 6,537 4,296 26,466
$65,163 $55,508 $109,013
statutory tax rates to income tax expense for continuing operations is as follows:
Year ended January 31,
2008 2007 2006
. . . . . . . . . . . . . . 35.0% 35.0% 35.0%State income taxes, net of
federal benefit . . . . . . . . . . . . . . . 0.8 (1.0) 0.8Changes in valuation allowance . . . . 18.3 (100.7) 60.7Tax on foreign earnings different
. . . . . . . . . . . . . . . . (19.3) 47.5 (14.0)Nondeductible goodwill . . . . . . . . . . — (104.7) —Nondeductible interest . . . . . . . . . . . 1.9 (5.3) —Reserves established for foreign
income tax contingencies . . . . . . . 2.1 — —Reversal of previously accrued
income taxes . . . . . . . . . . . . . . . . . (0.7) 6.7 —Other—net . . . . . . . . . . . . . . . . . . . . 0.3 0.3 0.1
38.4% (122.2)% 82.6%
Included in the valuation allowance for fiscal 2008 is an income tax benefit of $7.5 million for the reversal of a valuation allowance on deferred tax assets related to Brazil, which was recorded in prior fiscal years. Included in the valuation allowance in fiscal 2007 and 2006 are non-cash charges of $8.4 million and $56.0 million, respectively, to increase the valuation allowance on deferred tax assets related to specific jurisdictions in Europe which were recorded in prior fiscal years. The reversal of previously accrued income taxes in fiscal 2007 represents the reversal of $3.0 million in accrued taxes due to the favorable resolution of various income tax examinations.
The components of pretax income (loss) from continuing operations are as follows:
Year ended January 31,
2008 2007 2006
(In thousands) . . . . . . . . . . . . . . . . $127,502 $ 108,369 $122,125
Foreign . . . . . . . . . . . . . . . . . . . . . 42,371 (153,788) 9,855
$169,873 $ (45,419) $131,980

continued
48
Significant components of the Company’s deferred tax liabilities and assets are as follows:
January 31,
2008 2007
(In thousands)Deferred tax liabilities:
Depreciation and amortization . . . . . . . . . . $ 23,802 $ 25,922Capitalized marketing program costs . . . . . 3,990 2,074Convertible debenture interest . . . . . . . . . . 6,685 687Accruals currently deductible . . . . . . . . . . . 10,252 9,591Other, net . . . . . . . . . . . . . . . . . . . . . . . . . . 1,376 6,521
Total deferred tax liabilities . . . . . . . . . . . 46,105 44,795
Deferred tax assets:Accrued liabilities . . . . . . . . . . . . . . . . . . . . 50,886 59,284Loss carryforwards . . . . . . . . . . . . . . . . . . . 151,775 143,896Amortizable goodwill . . . . . . . . . . . . . . . . . 28,410 29,655Depreciation and amortization . . . . . . . . . . 5,017 9,946Other, net . . . . . . . . . . . . . . . . . . . . . . . . . . 5,716 2,333
241,804 245,114Less: valuation allowance . . . . . . . . . . . . . . . . (182,464) (187,027)
Total deferred tax assets . . . . . . . . . . . . . 59,340 58,087
Net deferred tax asset . . . . . . . . . . . . . $ 13,235 $ 13,292
The net change in the deferred income tax valuation allowance was a decrease of $4.6 million in fiscal 2008 and an increase of $50.5 million in fiscal 2007. The valuation allowance at January 31, 2008 and 2007 primarily relates to foreign net operating loss carryforwards of $776.9 million and $549.8 million, respectively. The majority of the net operating losses have an indefinite carry-forward period with the remaining portion expiring in fiscal years 2011 through 2023. The Company evaluates a variety of factors in determining the realizability of deferred tax assets, including the scheduled reversal of temporary differences, projected future taxable income, and prudent and feasible tax planning strategies.
The activity in deferred tax liabilities during fiscal 2008 includes an adjustment of $5.6 million to reduce the deferred tax liability on accumulated other comprehensive income (loss) which lapsed due to statute expirations. This adjustment did not impact deferred income tax expense for fiscal 2008.
At January 31, 2008, there are no consolidated cumulative undistributed earnings of foreign subsidiaries. It is not currently
income tax that might be payable if any earnings were to be distributed by individual foreign subsidiaries.
Effective February 1, 2007, the Company adopted the provisions
Income Taxes—an interpretation of SFAS No. 109” (“FIN No. 48”). FIN No. 48 clarifies the accounting for uncertainty in income taxes recognized in an enterprise’s financial statements in accordance with SFAS No. 109, “Accounting for Income Taxes,” and prescribes a recognition threshold and measurement attribute for the finan-cial statement recognition and measurement of a tax position taken or expected to be taken in a tax return. FIN No. 48 also provides guidance on derecognition, classification, interest and penalties, accounting in interim periods, disclosure and transition. The adoption of FIN No. 48 resulted in the reduction of the Company’s consolidated beginning retained earnings of $1.1 mil-lion. As of the adoption date, the Company had gross unrecog-nized tax benefits of $10.5 million, $6.9 million of which, if recognized, would affect the effective tax rate.
to the foreign taxation of certain transactions have a reason-able possibility of significantly decreasing within the 12 months following January 31, 2008.
Consistent with prior periods, the Company recognizes interest and penalties related to unrecognized tax benefits in the provision for income taxes. The Company has accrued interest of $2.7 mil-lion and $1.6 million at January 31, 2008 and February 1, 2007, respectively, of which $1.9 million and $1.0 million, respectively, all of which would impact the effective tax rate if reversed.
The provision for income taxes for the fiscal year ended January 31, 2008 includes interest expense of $1.0 million on unrecognized income tax benefits for current and prior years. The change in the balance of accrued interest includes the current year end accrual, an interest benefit resulting from the expiration of statutes of limitation, and the translation adjustments on foreign currencies.
A reconciliation of the beginning and ending balances of the total amount of gross unrecognized tax benefits, excluding accrued interest and penalties, for the year ended January 31, 2008 is as follows (in thousands):
Gross unrecognized tax benefits at February 1, 2007. . . . . . . . $10,481Increases in tax positions for prior years . . . . . . . . . . . . . . . . . . 5,137Increases in tax positions for current year . . . . . . . . . . . . . . . . . 3,132Expiration of statutes of limitation . . . . . . . . . . . . . . . . . . . . . . (359)Changes due to translation of foreign currencies . . . . . . . . . . . 1,190
Gross unrecognized tax benefits at January 31, 2008 . . . . $19,581
NOTES TO CONSOLIDATED FINANCIAL STATEMENTS
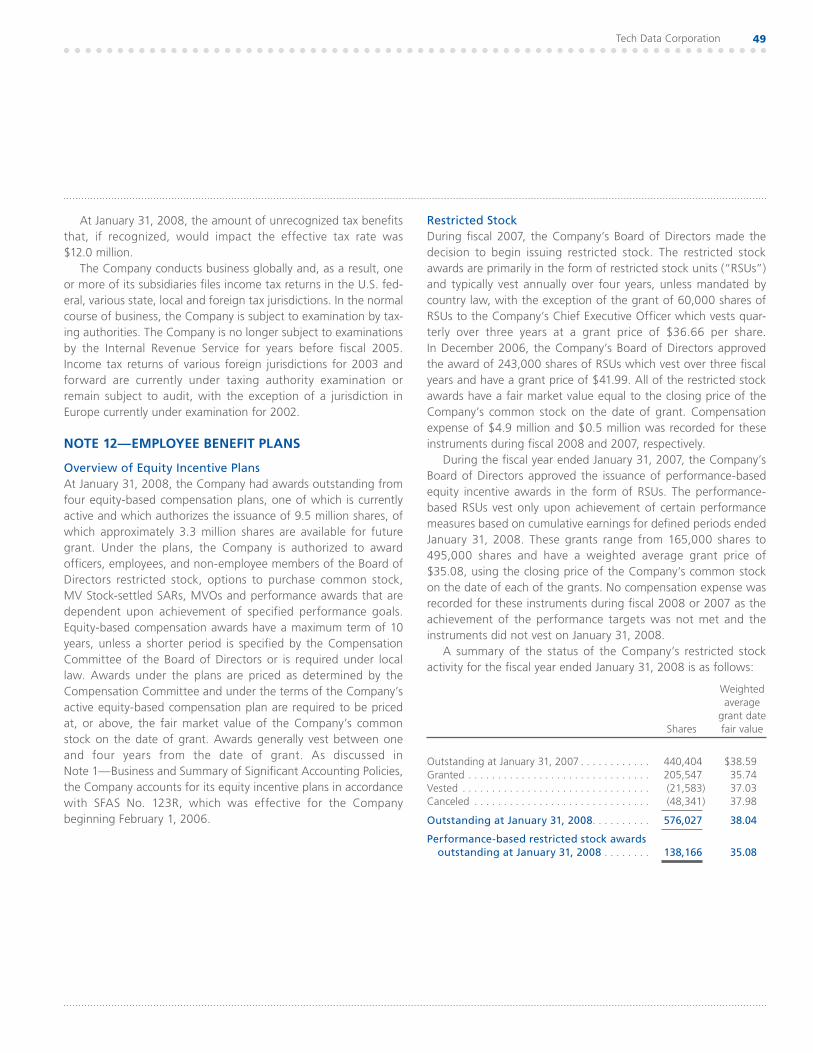
Tech Data Corporation 49
At January 31, 2008, the amount of unrecognized tax benefits that, if recognized, would impact the effective tax rate was $12.0 million.
The Company conducts business globally and, as a result, one -
eral, various state, local and foreign tax jurisdictions. In the normal course of business, the Company is subject to examination by tax-ing authorities. The Company is no longer subject to examinations by the Internal Revenue Service for years before fiscal 2005. Income tax returns of various foreign jurisdictions for 2003 and forward are currently under taxing authority examination or remain subject to audit, with the exception of a jurisdiction in Europe currently under examination for 2002.
NOTE 12—EMPLOYEE BENEFIT PLANS
Overview of Equity Incentive Plans At January 31, 2008, the Company had awards outstanding from four equity-based compensation plans, one of which is currently active and which authorizes the issuance of 9.5 million shares, of which approximately 3.3 million shares are available for future
officers, employees, and non-employee members of the Board of Directors restricted stock, options to purchase common stock, MV Stock-settled SARs, MVOs and performance awards that are dependent upon achievement of specified performance goals. Equity-based compensation awards have a maximum term of 10 years, unless a shorter period is specified by the Compensation Committee of the Board of Directors or is required under local law. Awards under the plans are priced as determined by the Compensation Committee and under the terms of the Company’s active equity-based compensation plan are required to be priced at, or above, the fair market value of the Company’s common stock on the date of grant. Awards generally vest between one and four years from the date of grant. As discussed in Note 1—Business and Summary of Significant Accounting Policies, the Company accounts for its equity incentive plans in accordance with SFAS No. 123R, which was effective for the Company beginning February 1, 2006.
Restricted Stock During fiscal 2007, the Company’s Board of Directors made the decision to begin issuing restricted stock. The restricted stock
and typically vest annually over four years, unless mandated by country law, with the exception of the grant of 60,000 shares of
-terly over three years at a grant price of $36.66 per share. In December 2006, the Company’s Board of Directors approved
years and have a grant price of $41.99. All of the restricted stock awards have a fair market value equal to the closing price of the Company’s common stock on the date of grant. Compensation expense of $4.9 million and $0.5 million was recorded for these instruments during fiscal 2008 and 2007, respectively.
During the fiscal year ended January 31, 2007, the Company’s Board of Directors approved the issuance of performance-based
measures based on cumulative earnings for defined periods ended January 31, 2008. These grants range from 165,000 shares to 495,000 shares and have a weighted average grant price of $35.08, using the closing price of the Company’s common stock on the date of each of the grants. No compensation expense was recorded for these instruments during fiscal 2008 or 2007 as the achievement of the performance targets was not met and the instruments did not vest on January 31, 2008.
A summary of the status of the Company’s restricted stock activity for the fiscal year ended January 31, 2008 is as follows:
Shares
Weighted average
grant date fair value
Outstanding at January 31, 2007 . . . . . . . . . . . . 440,404 $38.59Granted . . . . . . . . . . . . . . . . . . . . . . . . . . . . . . . 205,547 35.74Vested . . . . . . . . . . . . . . . . . . . . . . . . . . . . . . . . (21,583) 37.03Canceled . . . . . . . . . . . . . . . . . . . . . . . . . . . . . . (48,341) 37.98
Outstanding at January 31, 2008 . . . . . . . . . . 576,027 38.04
Performance-based restricted stock awards outstanding at January 31, 2008 . . . . . . . . 138,166 35.08

continued
50
NOTES TO CONSOLIDATED FINANCIAL STATEMENTS
The total fair value of restricted stock vested during the fiscal year ended January 31, 2008 is $0.8 million. As of January 31, 2008, the unrecognized stock-based compensation expense
Company expects to be recognized over the next four years (over a remaining weighted average period of one year).
MV Stock-settled SARs, MVOs and Stock Options MV Stock-settled SARs and MVOs are similar to traditional stock options, except these instruments contain a predetermined cap on the maximum earnings potential a recipient can expect to receive upon exercise. In addition, upon exercise, holders of an MV Stock-settled SAR will only receive shares with a value equal to the spread (the difference between the current market price per share of the Company’s common stock subject to the predetermined cap and the grant price). The grant price of the MV Stock-settled SARs and MVOs is determined using the last sale price of the Company’s common stock as quoted on the NASDAQ on the date of grant (or such higher price as may be required by applicable laws and regulations of specific foreign jurisdictions). The other
terms of the awards (i.e., vesting schedule, contractual term, etc.) are not materially different from the terms of traditional stock options previously granted by the Company.
During the fiscal years ended January 31, 2008, 2007 and 2006, the Company’s Board of Directors approved the issuance of 0.2 million, 1.5 million and 1.6 million, respectively, of long-term incentive awards in the form of MV Stock-settled SARs and MVOs pursuant to the Amended and Restated 2000 Equity Incentive Plan of Tech Data Corporation, as amended. Compensation expense of $5.3 and $7.6 million was recorded for these instru-ments during fiscal 2008 and 2007, respectively. Prior to the adop-tion of SFAS No. 123R, the Company accounted for MV Stock-settled SARs and MVOs as variable awards. In accordance with APB No. 25, these variable awards were remeasured on a quarterly basis and changes in value were recorded in the Company’s Consolidated Statement of Operations as compensa-tion expense. Compensation expense of approximately $0.1 mil-lion was recorded for these instruments during the year ended January 31, 2006.
A summary of the status of the Company’s MV Stock-settled SARs, MVOs and stock options for the fiscal year ended January 31, 2008 is as follows:
Shares
Weighted average
exercise price
Weighted average remaining contractual term
(in years)
Aggregate intrinsic value (in thousands)
Outstanding at January 31, 2007 . . . . . . . . . . . . . . . . . . . . . . . . . . . . . . . . . . . . . . 6,770,221 $36.14Granted . . . . . . . . . . . . . . . . . . . . . . . . . . . . . . . . . . . . . . . . . . . . . . . . . . . . . . . . . 205,000 35.44Exercised . . . . . . . . . . . . . . . . . . . . . . . . . . . . . . . . . . . . . . . . . . . . . . . . . . . . . . . . (546,264) 26.88Canceled . . . . . . . . . . . . . . . . . . . . . . . . . . . . . . . . . . . . . . . . . . . . . . . . . . . . . . . . (465,358) 39.14
Outstanding at January 31, 2008 . . . . . . . . . . . . . . . . . . . . . . . . . . . . . . . . . . . . 5,963,599 36.73 5.5 $9,600
Vested and expected to vest at January 31, 2008 . . . . . . . . . . . . . . . . . . . . . . 5,915,575 36.73 5.4 $9,600
Exercisable at January 31, 2008 . . . . . . . . . . . . . . . . . . . . . . . . . . . . . . . . . . . . . 4,306,985 36.71 4.4 $9,600
The aggregate intrinsic value in the table above represents the difference between the closing price of the Company’s common stock on January 31, 2008 and the grant price for all “in-the-money” options at January 31, 2008. The intrinsic value of the equity-based awards changes based on the fair market value of the Company’s common stock. The intrinsic value of the MV Stock-settled SARs, MVO and stock option awards exercised during the fiscal year ended January 31, 2008 was $6.6 million. As of January 31, 2008, the Company expects $8.5 million of total unrecognized compensation cost related to MV Stock-settled SARs, MVOs and stock options to be recog-nized over the next four fiscal years (over a weighted average period of one year). The total fair value of MV Stock-settled SARs, MVOs and stock options vested during the fiscal year ended January 31, 2008 was $8.3 million.
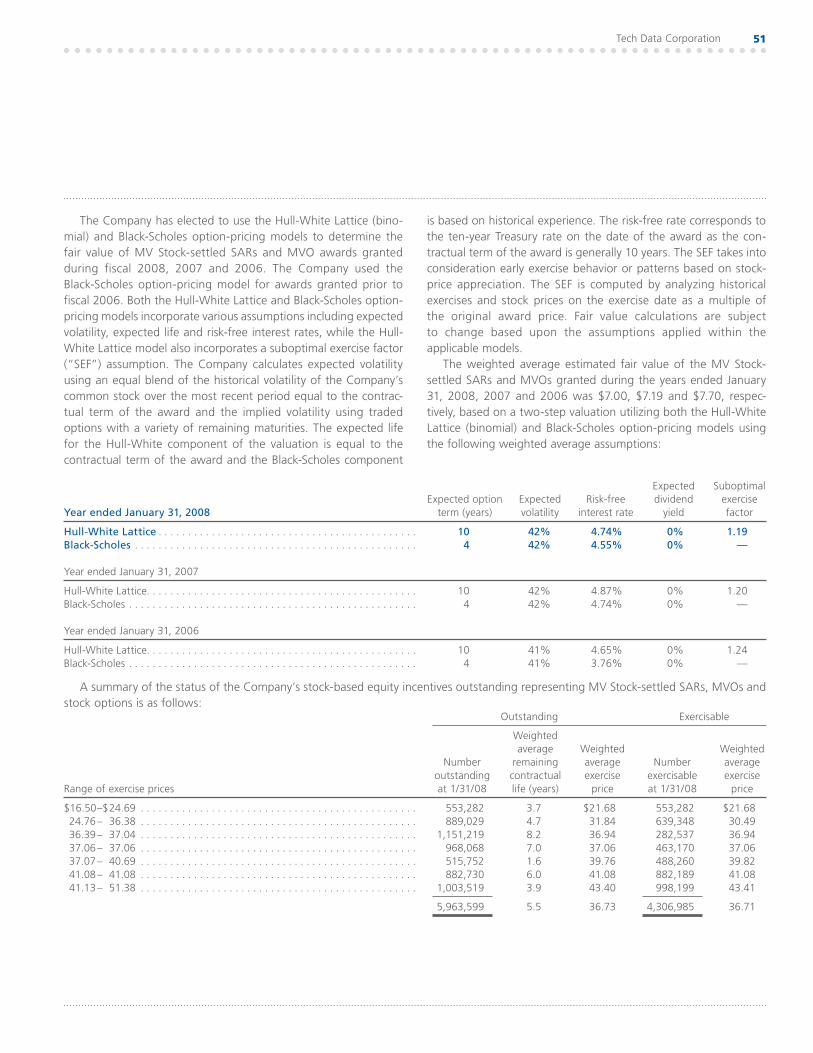
Tech Data Corporation 51
The Company has elected to use the Hull-White Lattice (bino-mial) and Black-Scholes option-pricing models to determine the fair value of MV Stock-settled SARs and MVO awards granted during fiscal 2008, 2007 and 2006. The Company used the Black-Scholes option-pricing model for awards granted prior to fiscal 2006. Both the Hull-White Lattice and Black-Scholes option-pricing models incorporate various assumptions including expected volatility, expected life and risk-free interest rates, while the Hull-White Lattice model also incorporates a suboptimal exercise factor (“SEF”) assumption. The Company calculates expected volatility using an equal blend of the historical volatility of the Company’s common stock over the most recent period equal to the contrac-tual term of the award and the implied volatility using traded options with a variety of remaining maturities. The expected life for the Hull-White component of the valuation is equal to the contractual term of the award and the Black-Scholes component
is based on historical experience. The risk-free rate corresponds to the ten-year Treasury rate on the date of the award as the con-tractual term of the award is generally 10 years. The SEF takes into consideration early exercise behavior or patterns based on stock-price appreciation. The SEF is computed by analyzing historical exercises and stock prices on the exercise date as a multiple of the original award price. Fair value calculations are subject to change based upon the assumptions applied within the applicable models.
The weighted average estimated fair value of the MV Stock-settled SARs and MVOs granted during the years ended January 31, 2008, 2007 and 2006 was $7.00, $7.19 and $7.70, respec-tively, based on a two-step valuation utilizing both the Hull-White Lattice (binomial) and Black-Scholes option-pricing models using the following weighted average assumptions:
Year ended January 31, 2008Expected option
term (years)Expected volatility
Risk-free interest rate
Expected dividend
yield
Suboptimal exercise factor
Hull-White Lattice . . . . . . . . . . . . . . . . . . . . . . . . . . . . . . . . . . . . . . . . . . . . 10 42% 4.74% 0% 1.19Black-Scholes . . . . . . . . . . . . . . . . . . . . . . . . . . . . . . . . . . . . . . . . . . . . . . . . 4 42% 4.55% 0% —
Year ended January 31, 2007
Hull-White Lattice. . . . . . . . . . . . . . . . . . . . . . . . . . . . . . . . . . . . . . . . . . . . . . 10 42% 4.87% 0% 1.20Black-Scholes . . . . . . . . . . . . . . . . . . . . . . . . . . . . . . . . . . . . . . . . . . . . . . . . . 4 42% 4.74% 0% —
Year ended January 31, 2006
Hull-White Lattice. . . . . . . . . . . . . . . . . . . . . . . . . . . . . . . . . . . . . . . . . . . . . . 10 41% 4.65% 0% 1.24Black-Scholes . . . . . . . . . . . . . . . . . . . . . . . . . . . . . . . . . . . . . . . . . . . . . . . . . 4 41% 3.76% 0% —
A summary of the status of the Company’s stock-based equity incentives outstanding representing MV Stock-settled SARs, MVOs and stock options is as follows:
Outstanding Exercisable
Range of exercise prices
Number outstanding at 1/31/08
Weighted average
remaining contractual life (years)
Weighted averageexercise
price
Numberexercisableat 1/31/08
Weighted average exercise
price
$16.50–$24.69 . . . . . . . . . . . . . . . . . . . . . . . . . . . . . . . . . . . . . . . . . . . . . . . 553,282 3.7 $21.68 553,282 $21.6824.76– 36.38 . . . . . . . . . . . . . . . . . . . . . . . . . . . . . . . . . . . . . . . . . . . . . . . 889,029 4.7 31.84 639,348 30.4936.39– 37.04 . . . . . . . . . . . . . . . . . . . . . . . . . . . . . . . . . . . . . . . . . . . . . . . 1,151,219 8.2 36.94 282,537 36.9437.06– 37.06 . . . . . . . . . . . . . . . . . . . . . . . . . . . . . . . . . . . . . . . . . . . . . . . 968,068 7.0 37.06 463,170 37.0637.07– 40.69 . . . . . . . . . . . . . . . . . . . . . . . . . . . . . . . . . . . . . . . . . . . . . . . 515,752 1.6 39.76 488,260 39.8241.08– 41.08 . . . . . . . . . . . . . . . . . . . . . . . . . . . . . . . . . . . . . . . . . . . . . . . 882,730 6.0 41.08 882,189 41.0841.13– 51.38 . . . . . . . . . . . . . . . . . . . . . . . . . . . . . . . . . . . . . . . . . . . . . . . 1,003,519 3.9 43.40 998,199 43.41
5,963,599 5.5 36.73 4,306,985 36.71

52
The Company’s policy is to utilize shares of its treasury stock, to the extent available, for the exercise of awards. See further discussion of the Company’s share repurchase program in Note 13—Shareholders’ Equity below.
Employee Stock Purchase Plan
approved in June 1995, the Company is authorized to issue up to 1,000,000 shares of common stock to eligible employees in the
the ESPP, employees can choose to have a fixed dollar amount or percentage deducted from their bi-weekly compensation to pur-chase the Company’s common stock and/or elect to purchase shares once per calendar quarter. The purchase price of the stock is 85% of the market value on the exercise date and employees are limited to a maximum purchase of $25,000 in fair market value each calendar year. From the inception of the ESPP through January 31, 2008, the Company has issued 414,631 shares of common stock to the ESPP. All shares purchased under the ESPP must be held for a period of one year.
Retirement Savings Plan The Company sponsors the Tech Data Corporation 401(k) Savings Plan (“the 401(k) Savings Plan”) for its employees. At the Company’s discretion, participant deferrals are matched monthly, in the form of company stock, in an amount equal to 50% of the first 6% of participant deferrals and participants are fully vested following four years of qualified service. Effective January 1, 2008, the Company’s 401(k) Savings Plan employee match will be in cash. At January 31, 2008 and 2007, the number of shares of Tech Data common stock held by the Company’s 401(k) Savings Plan totaled 280,000 and 270,000 shares, respectively. Aggregate con-tributions made by the Company to the 401(k) Savings Plan were $2.2 million, $2.2 million and $2.3 million for fiscal 2008, fiscal 2007 and fiscal 2006, respectively.
NOTE 13—SHAREHOLDERS’ EQUITY
In September 2007, the Company’s Board of Directors authorized a share repurchase program of up to $100.0 million of the Company’s common stock. As of January 31, 2008, the Company’s share repurchase program authorized in September 2007 was complete. During fiscal 2008, the Company repurchased 2,698,654 shares comprised of 2,698,126 shares purchased in connection with the Company’s share repurchase program and 528 shares purchased outside of the stock repurchase program, at an average of $37.06 per share, for a total cost, including expenses, of $100.0 million.
In fiscal 2006, the Company’s Board of Directors authorized a share repurchase program of up to $200.0 million of the Company’s common stock. As of January 31, 2007, the Company’s share repurchase program authorized in fiscal 2006 was complete. During fiscal 2007, the Company repurchased 2,222,720 shares comprised of 2,220,132 shares purchased in conjunction with the Company’s share repurchase program and 2,588 shares purchased outside of the stock repurchase program, at an average of $36.03 per share, for a total cost, including expenses, of $80.1 million. During fiscal 2006, the Company repurchased 3,443,131 shares comprised of 3,260,576 shares purchased in conjunction with the Company’s share repurchase program and 182,555 shares purchased outside of the stock repurchase program, at an average of $36.89 per share, for a total cost, including expenses, of approximately $127.0 million.
The Company’s share repurchases were made on the open market through block trades or otherwise and the number of shares purchased and the timing of the purchases were based on working capital requirements, general business conditions and other factors, including alternative investment opportunities. Shares repurchased by the Company are held in treasury for general corporate purposes, including issuances under equity incentive and employee benefit plans.
NOTE 14—COMMITMENTS AND CONTINGENCIES
Operating Leases The Company leases logistics centers, office facilities and certain equipment under noncancelable operating leases, the majority of which expire at various dates through fiscal 2016. Fair value renewal and purchase options and escalation clauses exist for a substantial portion of the operating leases included above. Rental expense related to continuing operations for all operating leases, including minimum commitments under IT outsourcing agree-ments, totaled $60.6 million, $59.3 million, and $59.0 million in fiscal years 2008, 2007 and 2006, respectively. Future minimum lease payments at January 31, 2008 under all such leases, includ-ing minimum commitments under IT outsourcing agreements and the minimum lease payments accrued in the Company’s restruc-turing programs (see Note 8—Restructuring Programs) for succeeding fiscal years are as follows (in thousands):
Fiscal year:
2009 . . . . . . . . . . . . . . . . . . . . . . . . . . . . . . . . . . . . . . . . . . . $ 65,6632010. . . . . . . . . . . . . . . . . . . . . . . . . . . . . . . . . . . . . . . . . . . . 54,2932011 . . . . . . . . . . . . . . . . . . . . . . . . . . . . . . . . . . . . . . . . . . . . 46,1382012 . . . . . . . . . . . . . . . . . . . . . . . . . . . . . . . . . . . . . . . . . . . . 27,3232013 . . . . . . . . . . . . . . . . . . . . . . . . . . . . . . . . . . . . . . . . . . . . 25,498Thereafter . . . . . . . . . . . . . . . . . . . . . . . . . . . . . . . . . . . . . . . 50,810
Total payments . . . . . . . . . . . . . . . . . . . . . . . . . . . . . . . . . . . . $ 269,725
NOTES TO CONSOLIDATED FINANCIAL STATEMENTS
continued

Tech Data Corporation 53
Synthetic Lease Facility The Company has a Synthetic Lease facility with a group of finan-cial institutions under which the Company leases certain logistics centers and office facilities from a third-party lessor. The Synthetic Lease expires in fiscal year 2009 and the Company intends to renew the lease for an additional five years. At any time during the lease term, the Company may, at its option, purchase up to four of the seven properties, at an amount equal to each proper-ty’s cost. If the Company elects to remarket the properties, it has guaranteed the lessor a percentage of the cost of each of the properties, in an aggregate amount of approximately $118.4 million (the “residual value”). The Company pays interest on the Synthetic Lease at LIBOR plus an agreed-upon margin. The Synthetic Lease contains covenants that must be complied with, similar to the covenants described in certain of the credit facilities discussed in Note 9—Revolving Credit Loans. The amount funded under the Synthetic Lease (approximately $133.2 million at January 31, 2008) is treated as debt under the definition of the covenants required under both the Synthetic Lease and the credit facilities. As of January 31, 2008 the Company was in compliance with all such covenants.
In January 2007, the Company sold approximately 6 acres of excess land located in Miami, Florida. The sale was executed pur-suant to the “excess sale” provisions of the Synthetic Lease agree-ment and resulted in a gain of $3.6 million recorded during the quarter ended January 31, 2007. This gain is included within “sell-ing, general and administrative expenses” in the Company’s Consolidated Statement of Operations.
The sum of future minimum lease payments under the Synthetic Lease at January 31, 2008 was approximately $3.8 million. Properties leased under the Synthetic Lease are located in
Bend, Indiana. The Synthetic Lease has been accounted for as an operating
lease. FASB Interpretation (“FIN”) No. 46 requires the Company to evaluate whether an entity with which it is involved meets the criteria of a variable interest entity (“VIE”) and, if so, whether the Company is required to consolidate that entity. The Company has determined that the third-party lessor of its synthetic lease facility does not meet the criteria of a VIE and, therefore, is not subject to the consolidation provisions of FIN No. 46.
Contingencies Prior to fiscal 2004, one of the Company’s European subsidiaries was audited in relation to various value-added tax (“VAT”) matters. As a result of those audits, the subsidiary received notices
of assessment that allege the subsidiary did not properly collect and remit VAT. It is management’s opinion, based upon the opin-ion of outside legal counsel, that the Company has valid defenses related to a substantial portion of these assessments. Although the Company is vigorously pursuing administrative and judicial action to challenge the assessments, no assurance can be given as to the ultimate outcome. The resolution of such assessments could be material to the Company’s operating results for any particular period, depending upon the level of income for such period.
The Company is subject to various other legal proceedings and claims arising in the ordinary course of business. The Company’s management does not expect that the outcome in any of these other legal proceedings, individually or collectively, will have a material adverse effect on the Company’s financial condition, results of operations, or cash flows.
Guarantees As is customary in the IT industry, to encourage certain customers to purchase products from Tech Data, the Company has arrange-ments with certain finance companies that provide inventory financing facilities to the Company’s customers. In conjunction with certain of these arrangements, the Company would be required to purchase certain inventory in the event the inventory is repossessed from the customers by the finance companies. As the Company does not have access to information regarding the amount of inventory purchased from the Company still on hand with the customer at any point in time, the Company’s repurchase obligations relating to inventory cannot be reasonably estimated. Repurchases of inventory by the Company under these arrange-ments have been insignificant to date. The Company believes that, based on historical experience, the likelihood of a material loss pursuant to these inventory repurchase obligations is remote.
The Company provides additional financial guarantees to finance companies on behalf of certain customers. The majority of these guarantees are for an indefinite period of time, where the Company would be required to perform if the customer is in default with the finance company. The Company reviews the underlying credit for these guarantees on at least an annual basis. As of January 31, 2008 and January 31, 2007, the aggregate amount of guarantees under these arrangements totaled $19.4 million and $11.5 million, respectively, of which $14.7 million and $7.0 million, respectively, was outstanding. The Company believes that, based on historical experience, the likelihood of a material loss pursuant to the above guarantees is remote.
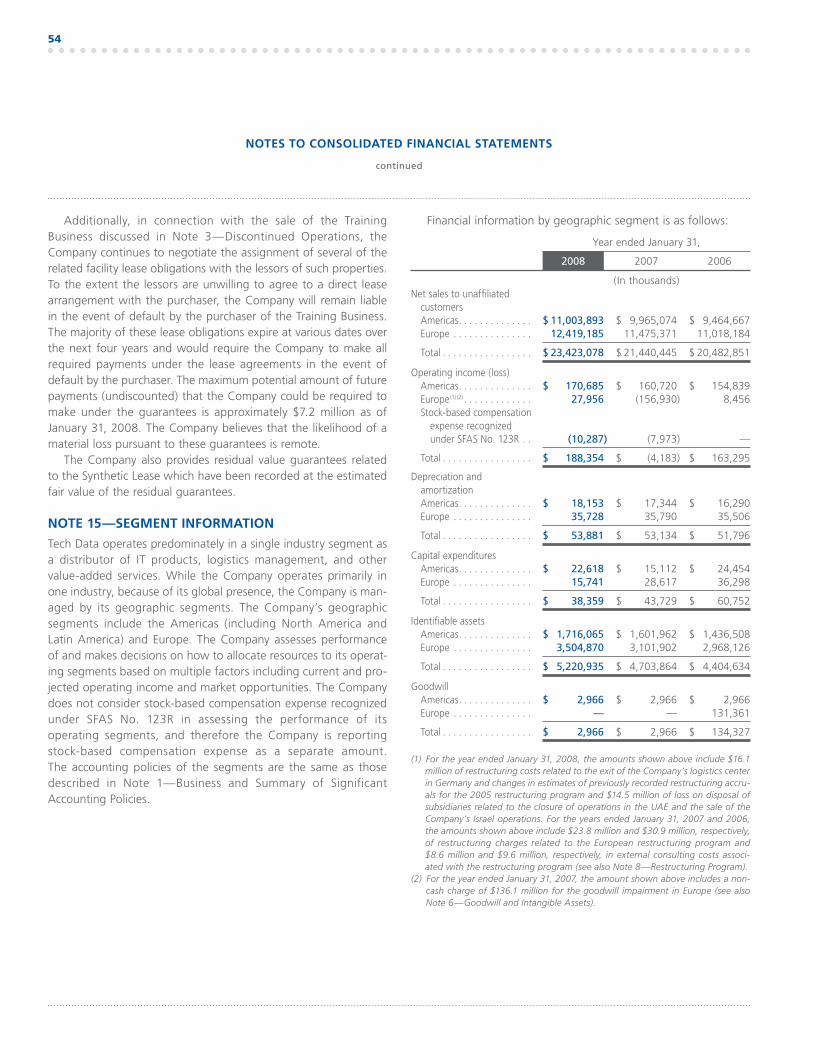
continued
54
Additionally, in connection with the sale of the Training Business discussed in Note 3—Discontinued Operations, the Company continues to negotiate the assignment of several of the related facility lease obligations with the lessors of such properties. To the extent the lessors are unwilling to agree to a direct lease arrangement with the purchaser, the Company will remain liable in the event of default by the purchaser of the Training Business. The majority of these lease obligations expire at various dates over the next four years and would require the Company to make all required payments under the lease agreements in the event of default by the purchaser. The maximum potential amount of future payments (undiscounted) that the Company could be required to make under the guarantees is approximately $7.2 million as of January 31, 2008. The Company believes that the likelihood of a material loss pursuant to these guarantees is remote.
The Company also provides residual value guarantees related to the Synthetic Lease which have been recorded at the estimated fair value of the residual guarantees.
NOTE 15—SEGMENT INFORMATION
Tech Data operates predominately in a single industry segment as a distributor of IT products, logistics management, and other value-added services. While the Company operates primarily in one industry, because of its global presence, the Company is man-aged by its geographic segments. The Company’s geographic segments include the Americas (including North America and Latin America) and Europe. The Company assesses performance of and makes decisions on how to allocate resources to its operat-ing segments based on multiple factors including current and pro-jected operating income and market opportunities. The Company does not consider stock-based compensation expense recognized under SFAS No. 123R in assessing the performance of its operating segments, and therefore the Company is reporting stock-based compensation expense as a separate amount. The accounting policies of the segments are the same as those described in Note 1—Business and Summary of Significant Accounting Policies.
Financial information by geographic segment is as follows:
Year ended January 31,
2008 2007 2006
(In thousands)Net sales to unaffiliated
customersAmericas . . . . . . . . . . . . . . $ 11,003,893 $ 9,965,074 $ 9,464,667Europe . . . . . . . . . . . . . . . 12,419,185 11,475,371 11,018,184
Total . . . . . . . . . . . . . . . . . $ 23,423,078 $ 21,440,445 $ 20,482,851
Operating income (loss)Americas . . . . . . . . . . . . . . $ 170,685 $ 160,720 $ 154,839Europe(1)(2) . . . . . . . . . . . . . 27,956 (156,930) 8,456
Stock-based compensation expense recognized under SFAS No. 123R . . (10,287) (7,973) —
Total . . . . . . . . . . . . . . . . . $ 188,354 $ (4,183) $ 163,295
Depreciation and amortizationAmericas . . . . . . . . . . . . . . $ 18,153 $ 17,344 $ 16,290Europe . . . . . . . . . . . . . . . 35,728 35,790 35,506
Total . . . . . . . . . . . . . . . . . $ 53,881 $ 53,134 $ 51,796
Capital expendituresAmericas . . . . . . . . . . . . . . $ 22,618 $ 15,112 $ 24,454Europe . . . . . . . . . . . . . . . 15,741 28,617 36,298
Total . . . . . . . . . . . . . . . . . $ 38,359 $ 43,729 $ 60,752
Identifiable assets Americas . . . . . . . . . . . . . . $ 1,716,065 $ 1,601,962 $ 1,436,508Europe . . . . . . . . . . . . . . . 3,504,870 3,101,902 2,968,126
Total . . . . . . . . . . . . . . . . . $ 5,220,935 $ 4,703,864 $ 4,404,634
GoodwillAmericas . . . . . . . . . . . . . . $ 2,966 $ 2,966 $ 2,966Europe . . . . . . . . . . . . . . . — — 131,361
Total . . . . . . . . . . . . . . . . . $ 2,966 $ 2,966 $ 134,327
(1) For the year ended January 31, 2008, the amounts shown above include $16.1 million of restructuring costs related to the exit of the Company’s logistics center in Germany and changes in estimates of previously recorded restructuring accru-als for the 2005 restructuring program and $14.5 million of loss on disposal of subsidiaries related to the closure of operations in the UAE and the sale of the Company’s Israel operations. For the years ended January 31, 2007 and 2006, the amounts shown above include $23.8 million and $30.9 million, respectively, of restructuring charges related to the European restructuring program and $8.6 million and $9.6 million, respectively, in external consulting costs associ-ated with the restructuring program (see also Note 8—Restructuring Program).
(2) For the year ended January 31, 2007, the amount shown above includes a non-cash charge of $136.1 million for the goodwill impairment in Europe (see also Note 6—Goodwill and Intangible Assets).
NOTES TO CONSOLIDATED FINANCIAL STATEMENTS
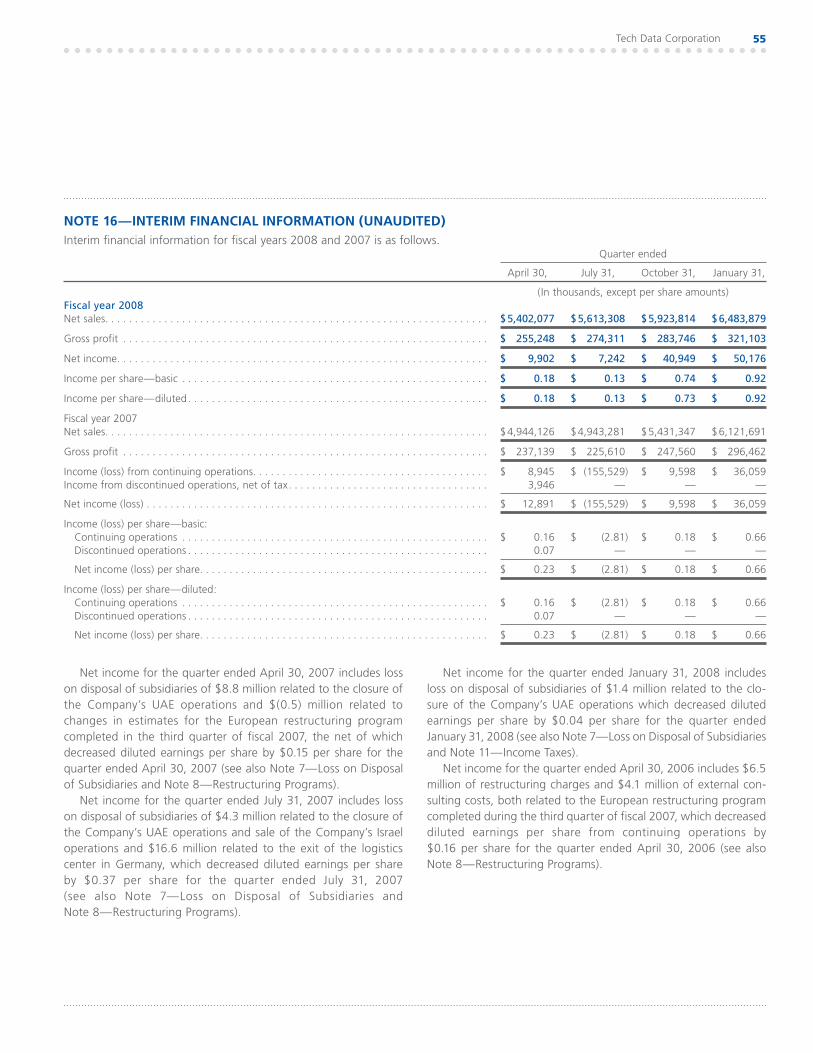
Tech Data Corporation 55
NOTE 16—INTERIM FINANCIAL INFORMATION (UNAUDITED)Interim financial information for fiscal years 2008 and 2007 is as follows.
Quarter ended
April 30, July 31, October 31, January 31,
(In thousands, except per share amounts)Fiscal year 2008Net sales . . . . . . . . . . . . . . . . . . . . . . . . . . . . . . . . . . . . . . . . . . . . . . . . . . . . . . . . . . . . . . . . . $5,402,077 $5,613,308 $5,923,814 $6,483,879
Gross profit . . . . . . . . . . . . . . . . . . . . . . . . . . . . . . . . . . . . . . . . . . . . . . . . . . . . . . . . . . . . . . $ 255,248 $ 274,311 $ 283,746 $ 321,103
Net income . . . . . . . . . . . . . . . . . . . . . . . . . . . . . . . . . . . . . . . . . . . . . . . . . . . . . . . . . . . . . . . $ 9,902 $ 7,242 $ 40,949 $ 50,176
Income per share—basic . . . . . . . . . . . . . . . . . . . . . . . . . . . . . . . . . . . . . . . . . . . . . . . . . . . . $ 0.18 $ 0.13 $ 0.74 $ 0.92
Income per share—diluted . . . . . . . . . . . . . . . . . . . . . . . . . . . . . . . . . . . . . . . . . . . . . . . . . . . $ 0.18 $ 0.13 $ 0.73 $ 0.92
Fiscal year 2007Net sales . . . . . . . . . . . . . . . . . . . . . . . . . . . . . . . . . . . . . . . . . . . . . . . . . . . . . . . . . . . . . . . . . $4,944,126 $4,943,281 $5,431,347 $6,121,691
Gross profit . . . . . . . . . . . . . . . . . . . . . . . . . . . . . . . . . . . . . . . . . . . . . . . . . . . . . . . . . . . . . . $ 237,139 $ 225,610 $ 247,560 $ 296,462
Income (loss) from continuing operations. . . . . . . . . . . . . . . . . . . . . . . . . . . . . . . . . . . . . . . . $ 8,945 $ (155,529) $ 9,598 $ 36,059Income from discontinued operations, net of tax . . . . . . . . . . . . . . . . . . . . . . . . . . . . . . . . . . 3,946 — — —
Net income (loss) . . . . . . . . . . . . . . . . . . . . . . . . . . . . . . . . . . . . . . . . . . . . . . . . . . . . . . . . . . $ 12,891 $ (155,529) $ 9,598 $ 36,059
Income (loss) per share—basic:Continuing operations . . . . . . . . . . . . . . . . . . . . . . . . . . . . . . . . . . . . . . . . . . . . . . . . . . . . $ 0.16 $ (2.81) $ 0.18 $ 0.66Discontinued operations . . . . . . . . . . . . . . . . . . . . . . . . . . . . . . . . . . . . . . . . . . . . . . . . . . . 0.07 — — —
Net income (loss) per share. . . . . . . . . . . . . . . . . . . . . . . . . . . . . . . . . . . . . . . . . . . . . . . . . $ 0.23 $ (2.81) $ 0.18 $ 0.66
Income (loss) per share—diluted:Continuing operations . . . . . . . . . . . . . . . . . . . . . . . . . . . . . . . . . . . . . . . . . . . . . . . . . . . . $ 0.16 $ (2.81) $ 0.18 $ 0.66Discontinued operations . . . . . . . . . . . . . . . . . . . . . . . . . . . . . . . . . . . . . . . . . . . . . . . . . . . 0.07 — — —
Net income (loss) per share. . . . . . . . . . . . . . . . . . . . . . . . . . . . . . . . . . . . . . . . . . . . . . . . . $ 0.23 $ (2.81) $ 0.18 $ 0.66
Net income for the quarter ended April 30, 2007 includes loss on disposal of subsidiaries of $8.8 million related to the closure of
changes in estimates for the European restructuring program completed in the third quarter of fiscal 2007, the net of which decreased diluted earnings per share by $0.15 per share for the quarter ended April 30, 2007 (see also Note 7—Loss on Disposal of Subsidiaries and Note 8—Restructuring Programs).
Net income for the quarter ended July 31, 2007 includes loss on disposal of subsidiaries of $4.3 million related to the closure of
operations and $16.6 million related to the exit of the logistics center in Germany, which decreased diluted earnings per share by $0.37 per share for the quarter ended July 31, 2007 (see also Note 7—Loss on Disposal of Subsidiaries and Note 8—Restructuring Programs).
Net income for the quarter ended January 31, 2008 includes loss on disposal of subsidiaries of $1.4 million related to the clo-
earnings per share by $0.04 per share for the quarter ended January 31, 2008 (see also Note 7—Loss on Disposal of Subsidiaries and Note 11—Income Taxes).
Net income for the quarter ended April 30, 2006 includes $6.5 million of restructuring charges and $4.1 million of external con-sulting costs, both related to the European restructuring program completed during the third quarter of fiscal 2007, which decreased diluted earnings per share from continuing operations by $0.16 per share for the quarter ended April 30, 2006 (see also Note 8—Restructuring Programs).

continued
56
NOTES TO CONSOLIDATED FINANCIAL STATEMENTS
Net loss for the quarter ended July 31, 2006 includes a $136.1 million goodwill impairment in Europe, $11.2 million of restructur-ing charges and $1.6 million of external consulting costs, both related to the European restructuring program completed during the third quarter of fiscal 2007 and an $8.4 million increase in the valuation allowance recorded against deferred tax assets related to specific jurisdictions in Europe, primarily Germany, the total of which decreased diluted earnings per share from continu-ing operations by $2.82 per share for the quarter ended July 31, 2006. (see also Note 7—Loss on Disposal of Subsidiaries, Note 8—Restructuring Programs and Note 11—Income Taxes).
Net income for the quarter ended October 31, 2006 includes $6.1 million of restructuring charges and $2.8 million of external consulting costs, both related to the European restructuring pro-gram, completed during the third quarter of fiscal 2007, which decreased diluted earnings per share from continuing operations by $0.15 per share for the quarter ended October 31, 2006 (see also Note 8—Restructuring Programs).
NOTE 17—SUBSEQUENT EVENT
In early March 2008, the Company entered into an agreement for the acquisition of certain assets of Scribona, AB, a publicly traded IT distribution company in the Nordic region of Europe, with oper-ations in Sweden, Finland and Norway (“Scribona”). The purchase price for the assets is the net asset book value plus a premium for the transferred assets, including inventory, intellectual property, material contracts, office equipment and certain other assets. The premium is estimated to be in the range of 13.5 million to 16.5 million euros (approximately $20.0 to $25.0 million). The transaction is subject to various contingencies including labor
shareholder approval with a targeted completion in the second quarter of fiscal 2009.

MARKET FOR THE REGISTRANT’S COMMON STOCK, RELATED SHAREHOLDER MATTERSAND ISSUER PURCHASES OF EQUITY SECURITIES
Tech Data Corporation 57
Our common stock is traded on the NASDAQ Stock Market, Inc. (“NASDAQ”) under the symbol “TECD.” We have not paid cash dividends since fiscal 1983 and the Board of Directors has no current plans to institute a cash dividend payment policy in the foreseeable future. The table below presents the quarterly high and low sale prices for our common stock as reported by the NASDAQ. As of February 29, 2008, there were 341 holders of record. We believe that there are approximately 53,000 beneficial holders.
Sales Price
High Low
Fiscal year 2008Fourth quarter . . . . . . . . . . . . . . . . . . . . . . . . . . . . . $39.36 $31.36Third quarter . . . . . . . . . . . . . . . . . . . . . . . . . . . . . . 41.40 33.01Second quarter . . . . . . . . . . . . . . . . . . . . . . . . . . . . 39.47 34.90First quarter . . . . . . . . . . . . . . . . . . . . . . . . . . . . . . . 38.80 34.86
High Low
Fiscal year 2007Fourth quarter . . . . . . . . . . . . . . . . . . . . . . . . . . . . . . $43.74 $36.23Third quarter . . . . . . . . . . . . . . . . . . . . . . . . . . . . . . . 40.00 32.10Second quarter . . . . . . . . . . . . . . . . . . . . . . . . . . . . . . 38.75 33.99First quarter . . . . . . . . . . . . . . . . . . . . . . . . . . . . . . . . 42.65 34.94
Equity Compensation and Stock Purchase Plan Information The number of shares issuable upon exercise of outstanding share-based equity incentives granted to employees and non-employee directors, as well as the number of shares remaining available for future issuance, under our equity compensation and stock purchase plans as of January 31, 2008 are summarized in the following table:
Plan category
Number of shares to be issued upon
exercise of outstanding share-based incentives
Weighted average exercise price
of outstanding share-based incentives(1)
Number of shares remaining available for future issuance
under equitycompensation plans
Equity compensation plans approved by shareholders for:Employee equity compensation(2) . . . . . . . . . . . . . . . . . . . . . . . . . . . . . . . . . . . 5,684,087 $32.68 3,279,408Employee stock purchase . . . . . . . . . . . . . . . . . . . . . . . . . . . . . . . . . . . . . . . . . — — 585,369Non-employee directors’ equity compensation . . . . . . . . . . . . . . . . . . . . . . . . . 77,000 35.36 —
Total . . . . . . . . . . . . . . . . . . . . . . . . . . . . . . . . . . . . . . . . . . . . . . . . . . . . . . . . . 5,761,087 32.71 3,864,777Employee equity compensation plan not approved by shareholders . . . . . . . . . . . 778,539 39.25 —
Total . . . . . . . . . . . . . . . . . . . . . . . . . . . . . . . . . . . . . . . . . . . . . . . . . . . . . . . . . 6,539,626 33.49 3,864,777
(1) The calculation of the weighted average exercise price includes both outstanding performance share awards and restricted stock awards that do not have an exercise price. Excluding the performance share awards and restricted stock awards, the weighted average exercise price of outstanding options and stock appreciation rights would be $36.35 for equity compensation plans approved by security holders, $39.25 for equity compensation plans not approved by shareholders and $36.73 for all equity compensation plans.
(2) The share-based incentives outstanding include 2,200,698 maximum value stock-settled stock appreciation rights (“MV Stock-settled SARs”) and maximum value stock options (“MVOs”), have an average exercise price of $36.79. Assuming the maximum cap of $20 is reached, the maximum number of shares that would be issued from the exercise of MV Stock-settled SARs and MVOs would be approximately 775,000 shares. The share-based incentives outstanding include a total of 43,016 shares outstanding for non-employee directors.

58
Unregistered Sales of Equity Securities None.
Issuer Purchases of Equity Securities In September 2007, the Company’s Board of Directors authorized a share repurchase program of up to $100.0 million of the Company’s common stock. As of January 31, 2008, the Company’s share repurchase program authorized in September 2007 was complete. The share repurchases were made on the open market, through block trades or otherwise. The number of shares
purchased and the timing of the purchases were based on working capital requirements, general business conditions and other factors, including alternative investment opportunities. Shares repurchased by the Company are held in treasury for general corporate purposes, including issuances under equity incentive and benefit plans.
The following table presents information with respect to purchases of common stock by the Company under the share repurchase program during the quarter ended January 31, 2008:
MARKET FOR THE REGISTRANT’S COMMON STOCK, RELATED SHAREHOLDER MATTERSAND ISSUER PURCHASES OF EQUITY SECURITIES
Issuer Purchases of Equity Securities
Period
Total number of shares purchased
Average price paid per share
Total numbers of shares purchased as part of publicly announced plan or programs
Maximum dollar value of shares that may yet be purchased under the plan or programs
November 1–November 30, 2007 . . . . . . . . . . . . . . . . . . . . . . 156,400 $37.59 156,400December 1–December 31, 2007 . . . . . . . . . . . . . . . . . . . . . . . 1,812,771 $37.48 1,812,771January 1–January 31, 2008 . . . . . . . . . . . . . . . . . . . . . . . . . . . 721,255 $35.86 721,255
Total . . . . . . . . . . . . . . . . . . . . . . . . . . . . . . . . . . . . . . . . . . . . . 2,690,426 $37.06 2,690,426 $—
continued
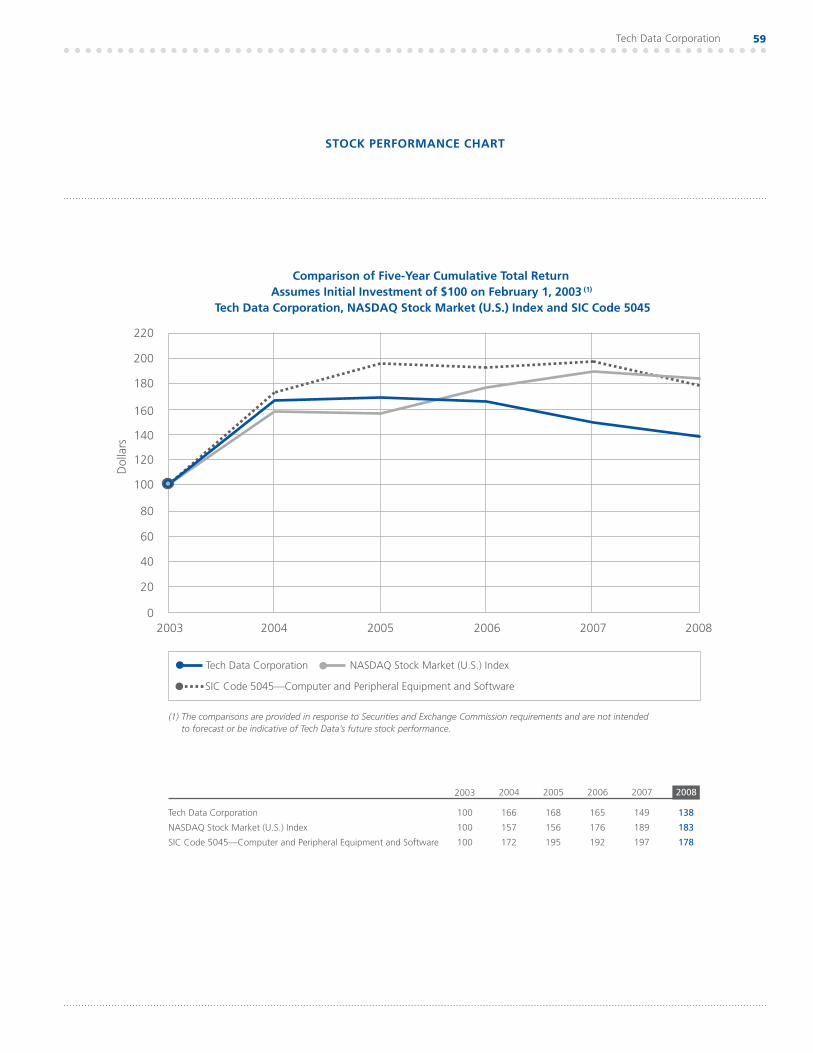
Tech Data Corporation 59
STOCK PERFORMANCE CHART
0
40
20
60
80
140
120
100
160
180
200
220
Comparison of Five-Year Cumulative Total ReturnAssumes Initial Investment of $100 on February 1, 2003 (1)
Tech Data Corporation, NASDAQ Stock Market (U.S.) Index and SIC Code 5045
Dol
lars
2003 2004
Tech Data Corporation
NASDAQ Stock Market (U.S.) Index
SIC Code 5045—Computer and Peripheral Equipment and Software
100
2003
100
100
166
2004
157
172
168
2005
156
195
165
2006
176
192
149
2007
189
197
138
2008
183
178
2005 2006 2007 2008
(1) The comparisons are provided in response to Securities and Exchange Commission requirements and are not intended to forecast or be indicative of Tech Data’s future stock performance.
Tech Data Corporation NASDAQ Stock Market (U.S.) Index
SIC Code 5045—Computer and Peripheral Equipment and Software

60
GAAP TO NON-GAAP RECONCILIATION (UNAUDITED)
Fiscal year ended January 31,
2008 2007 2006
(In thousands, except per share amounts)
Operating IncomeGAAP operating income (loss) . . . . . . . . . . . . . . . . . . . . . . . . . . . . . . . . . . . . . . . . . . . . . . . . . . . . . . . . . . . . . . . . $188,354 $ (4,183) $163,295Goodwill impairment . . . . . . . . . . . . . . . . . . . . . . . . . . . . . . . . . . . . . . . . . . . . . . . . . . . . . . . . . . . . . . . . . . . . . . . — 136,093 —Loss on disposal of subsidiaries(1) . . . . . . . . . . . . . . . . . . . . . . . . . . . . . . . . . . . . . . . . . . . . . . . . . . . . . . . . . . . . . . 14,471 — —Restructuring charges(2) . . . . . . . . . . . . . . . . . . . . . . . . . . . . . . . . . . . . . . . . . . . . . . . . . . . . . . . . . . . . . . . . . . . . . 16,149 23,764 30,946Other costs(3) . . . . . . . . . . . . . . . . . . . . . . . . . . . . . . . . . . . . . . . . . . . . . . . . . . . . . . . . . . . . . . . . . . . . . . . . . . . . . — 8,596 9,632
Non-GAAP operating income . . . . . . . . . . . . . . . . . . . . . . . . . . . . . . . . . . . . . . . . . . . . . . . . . . . . . . . . . . . . . . . . . $218,974 $ 164,270 $203,873
Net IncomeGAAP income (loss) from continuing operations . . . . . . . . . . . . . . . . . . . . . . . . . . . . . . . . . . . . . . . . . . . . . . . . . . $108,269 $(100,927) $ 22,967Discontinued operations, net of tax . . . . . . . . . . . . . . . . . . . . . . . . . . . . . . . . . . . . . . . . . . . . . . . . . . . . . . . . . . . . — 3,946 3,619
GAAP net income (loss) . . . . . . . . . . . . . . . . . . . . . . . . . . . . . . . . . . . . . . . . . . . . . . . . . . . . . . . . . . . . . . . . . . . . . 108,269 (96,981) 26,586Goodwill impairment . . . . . . . . . . . . . . . . . . . . . . . . . . . . . . . . . . . . . . . . . . . . . . . . . . . . . . . . . . . . . . . . . . . . . . . — 136,093 —Loss on disposal of subsidiaries(1) . . . . . . . . . . . . . . . . . . . . . . . . . . . . . . . . . . . . . . . . . . . . . . . . . . . . . . . . . . . . . . 14,471 — —Restructuring charges(2) . . . . . . . . . . . . . . . . . . . . . . . . . . . . . . . . . . . . . . . . . . . . . . . . . . . . . . . . . . . . . . . . . . . . . 16,149 23,764 30,946Other costs(3) . . . . . . . . . . . . . . . . . . . . . . . . . . . . . . . . . . . . . . . . . . . . . . . . . . . . . . . . . . . . . . . . . . . . . . . . . . . . . — 8,596 9,632Tax effect on non-GAAP adjustment items . . . . . . . . . . . . . . . . . . . . . . . . . . . . . . . . . . . . . . . . . . . . . . . . . . . . . . (10) (2,502) (1,603)Deferred tax assets valuation allowance . . . . . . . . . . . . . . . . . . . . . . . . . . . . . . . . . . . . . . . . . . . . . . . . . . . . . . . . . — 8,352 56,039
Non-GAAP net income . . . . . . . . . . . . . . . . . . . . . . . . . . . . . . . . . . . . . . . . . . . . . . . . . . . . . . . . . . . . . . . . . . . . . $138,879 $ 77,322 $121,600
Net Income per Diluted Share(4)
GAAP net income (loss) per share from continuing operations . . . . . . . . . . . . . . . . . . . . . . . . . . . . . . . . . . . . . . . $ 1.96 $ (1.83) $ .39Discontinued operations, net of tax . . . . . . . . . . . . . . . . . . . . . . . . . . . . . . . . . . . . . . . . . . . . . . . . . . . . . . . . . . . . — .07 .06
GAAP net income (loss) per share . . . . . . . . . . . . . . . . . . . . . . . . . . . . . . . . . . . . . . . . . . . . . . . . . . . . . . . . . . . . . 1.96 (1.76) .45Goodwill impairment . . . . . . . . . . . . . . . . . . . . . . . . . . . . . . . . . . . . . . . . . . . . . . . . . . . . . . . . . . . . . . . . . . . . . . . — 2.46 —Loss on disposal of subsidiaries(1) . . . . . . . . . . . . . . . . . . . . . . . . . . . . . . . . . . . . . . . . . . . . . . . . . . . . . . . . . . . . . . .26 — —Restructuring charges(2) . . . . . . . . . . . . . . . . . . . . . . . . . . . . . . . . . . . . . . . . . . . . . . . . . . . . . . . . . . . . . . . . . . . . . .29 .43 .53Other costs(3) . . . . . . . . . . . . . . . . . . . . . . . . . . . . . . . . . . . . . . . . . . . . . . . . . . . . . . . . . . . . . . . . . . . . . . . . . . . . . — .16 .16Tax effect on non-GAAP adjustment items . . . . . . . . . . . . . . . . . . . . . . . . . . . . . . . . . . . . . . . . . . . . . . . . . . . . . . — (.04) (.03)Deferred tax assets valuation allowance . . . . . . . . . . . . . . . . . . . . . . . . . . . . . . . . . . . . . . . . . . . . . . . . . . . . . . . . — .15 .96
Non-GAAP net income per diluted share . . . . . . . . . . . . . . . . . . . . . . . . . . . . . . . . . . . . . . . . . . . . . . . . . . . . . . . . $ 2.51 $ 1.40 $ 2.08
Weighted average common shares outstandingBasic . . . . . . . . . . . . . . . . . . . . . . . . . . . . . . . . . . . . . . . . . . . . . . . . . . . . . . . . . . . . . . . . . . . . . . . . . . . . . . . . . . 54,904 55,129 57,749Diluted . . . . . . . . . . . . . . . . . . . . . . . . . . . . . . . . . . . . . . . . . . . . . . . . . . . . . . . . . . . . . . . . . . . . . . . . . . . . . . . . 55,287 55,289 58,414
(1) Loss on disposal of subsidiaries relates to the exit of the company’s operations in the UAE and Israel.(2) Restructuring charges for the fiscal year ended January 31, 2008 include $18.1 million related to the closure of a European logistics center and $(2.0) million for changes
in estimates related to the European restructuring program. Restructuring charges for the fiscal years ended January 31, 2007 and 2006 relate to the company’s European restructuring program completed in October 2006.
(3) Other costs represent consulting costs related to the company’s European restructuring program completed in October 2006.(4) Periods that incurred a GAAP net loss per share from continuing operations are calculated using basic weighted average common shares outstanding.
CorporateBoard of Directors
Steven A. RaymundChairman of the Board of DirectorsTech Data Corporation
Charles E. AdairPartner, Cordova Ventures and Kowaliga Capital, Inc.
Maximilian ArdeltManaging Director, ConDigit Consult GmbH
Robert M. DutkowskyChief Executive Officer, Tech Data Corporation
Jeffery P. HowellsExecutive Vice President and Chief Financial Officer, Tech Data Corporation
Kathy MisunasFounder and Principal,Essential Ideas
Thomas I. MorganRetired Chief Executive Officer, Hughes Supply, Inc.
David M. UptonAlbert J. Weatherhead IIIProfessor of Business Administration,Technology and Operations Management,Harvard Business School
John Y. WilliamsManaging Director,Equity-South Advisors, LLC
Officers
Robert M. DutkowskyChief Executive Officer
Jeffery P. HowellsExecutive Vice President and Chief Financial Officer
Néstor CanoPresident, Europe
Kenneth LamneckPresident, the Americas
Joseph A. OsbournExecutive Vice President and Chief Information Officer
Charles V. DannewitzSenior Vice President, Tax and Treasurer
Joseph B. TrepaniSenior Vice President,Corporate Controller
David R. VetterSenior Vice President, General Counsel and Secretary
Corporate HeadquartersTech Data Corporation5350 Tech Data DriveClearwater, FL 33760727-539-7429www.techdata.com
Independent Registered Certified Public Accounting FirmErnst & Young LLP, Tampa, FL
Ethics Reporting Hotline866-TD ETHIC—866-833-8442
Stock ListingThe NASDAQ Stock Market, Inc. Ticker symbol: TECD
Transfer AgentBNY Mellon Shareowner Services480 Washington BoulevardJersey City, NJ 07310-1900 866-357-3551www.bnymellon.com/shareowner/isd
Annual Meeting of ShareholdersAll interested parties are cordially invited to attend the Annual Meeting of Shareholders on Wednesday, June 4th, 2008 at 3:00 p.m. at the company headquarters, Raymund Center, 5350 Tech Data Drive, Clearwater, FL 33760.
Financial ReportsFinancial reports, including Form 10-K and annual reports, can be accessed online at: www.techdata.com. You may also obtain a copy upon written request to:
Tech Data CorporationAttention: Investor Relations5350 Tech Data DriveClearwater, FL 33760
Investor InquiriesInvestor RelationsPhone: 800-292-7906Fax: 727-538-5860Email: [email protected]
De
sig
ned
by
Cur
ran
& C
onn
ors
, Inc
. / w
ww
.cur
ran
-co
nno
rs.c
om
Tech Data Corporation
Information

Tech Data Corporation5350 Tech Data DriveClearwater, Florida 33760
P: 727-539-7429www.techdata.com