team members: jarret vian bryan rowley john murray me 191 final presentation spring 2009
TRANSCRIPT

FSAE Suspension
Team Members:
Jarret Vian
Bryan Rowley
John Murray
ME 191 Final Presentation
Spring 2009

Outline
Introduction Re-Design Manufacturing Testing Conclusion

Introduction

Design Requirements Minimum 60” wheel base
Unequal front & rear track widths Minimum 1” ground clearance Minimum 2” total suspension travel Template must pass through frame Spherical bearings must be in double shear Design must handle applied loading
Rate of camber angle change with respect to both body roll and wheel displacement
Design Goal

Re-Design Original Final Design
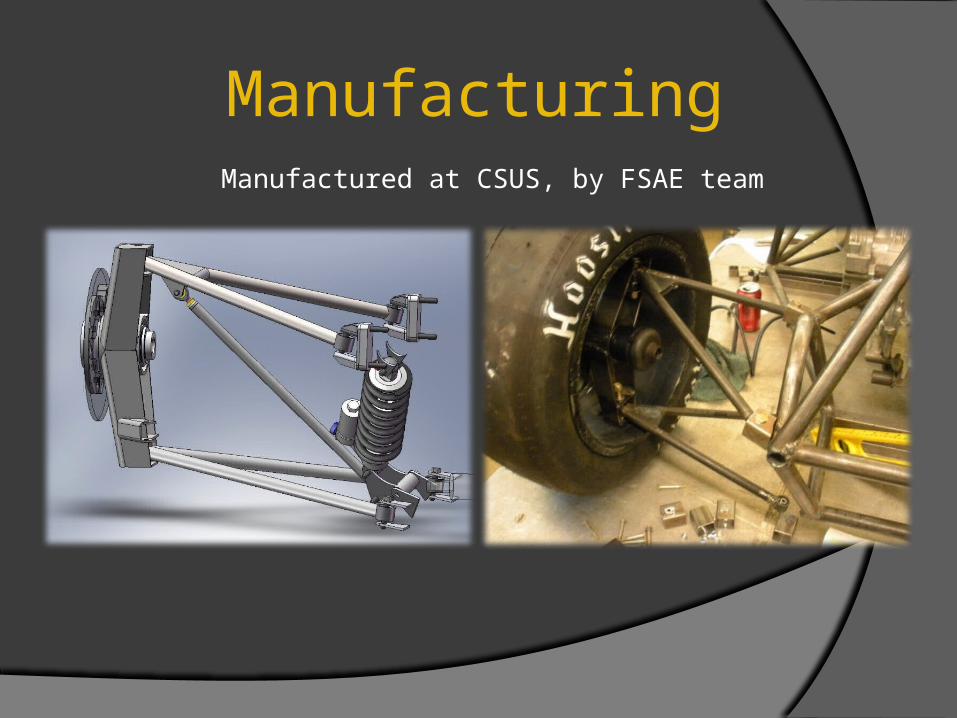
Manufacturing Manufactured at CSUS, by FSAE team

Manufacturing A - Arms

Bearing Holder
Hub & Spindle
Upright

Geometry Testing
Camber Caster
Wheelbase Track Width

Goals Rate of camber angle change per degree body roll
0.00 1.00 2.00 3.00 4.00 5.00-1.00
-0.50
0.00
0.50
1.00
1.50
2.00
2.50
3.00
3.50
f(x) = 0.749438440006965 x − 0.562065161316245R² = 0.998341705106564
Camber Angle vs. Body Roll (The-oretical)
Camber
Linear (Camber)
Body Roll (Degrees)
Ca
mb
er
An
gle
(D
eg
ree
s)
0.00 0.50 1.00 1.50 2.00 2.50 3.00-2.00
-1.50
-1.00
-0.50
0.00
0.50
1.00
f(x) = 0.785714285714286 x − 1.51190476190476R² = 0.997252747252747
Camber Angle vs. Body Roll (Experimental)
Camber
Linear (Camber)
Body Roll (Degrees)
Ca
mb
er
An
gle
(D
eg
ree
s)

-2.00 -1.00 0.00 1.00 2.00-2.00
-1.50
-1.00
-0.50
0.00
0.50
1.00
f(x) = − 0.7564 x − 0.546333333333333R² = 0.99690060688313
Camber Angle vs. Wheel Displacement (Theoretical)
Camber
Linear (Camber)
Wheel Displacement (Inches)
Ca
mb
er
An
gle
(D
eg
ree
s)
-1.00 0.00 1.00 2.00 3.00-3.00
-2.50
-2.00
-1.50
-1.00
-0.50
0.00
f(x) = − 0.808454425363276 x − 1.22661822985469R² = 0.963345226484278
Camber Angle vs. Wheel Displacement (Experimen-
tal)
Camber
Linear (Camber)
Wheel Displacement (Inches)C
am
be
r A
ng
le (
De
gre
es
)
Rate of camber angle change per inch of wheel displacement

Upright Testing
Strain Gages

Strain Gage Installation
Degrease Abrade Burnish Condition Neutralize M-Bond 200
Solder Connect to instrumentation
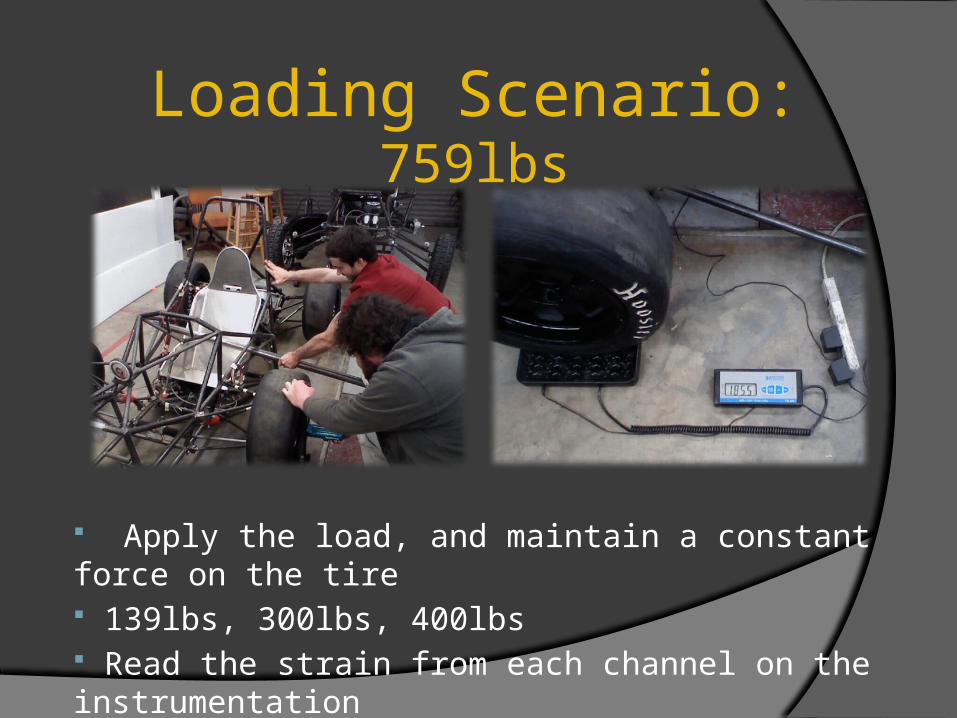
Loading Scenario: 759lbs
Apply the load, and maintain a constant force on the tire 139lbs, 300lbs, 400lbs Read the strain from each channel on the instrumentation

Strain StressLoad (lbs)
Gage(s)Instrument
Channelε
(microstrain)γxy
(microstrain)ε1
(microstrain)ε2
(microstrain)σ1
(psi)σ2
(psi)
Von Mises (psi)
1 42 -183 -134 135 126 297 48 -59 -8
-27
-18
Rosette 1
Rosette 2
Rosette 3 -6
139 1,001
280
179
1,156
663-20
9
-9 -238
11
33
5
-556
601
71
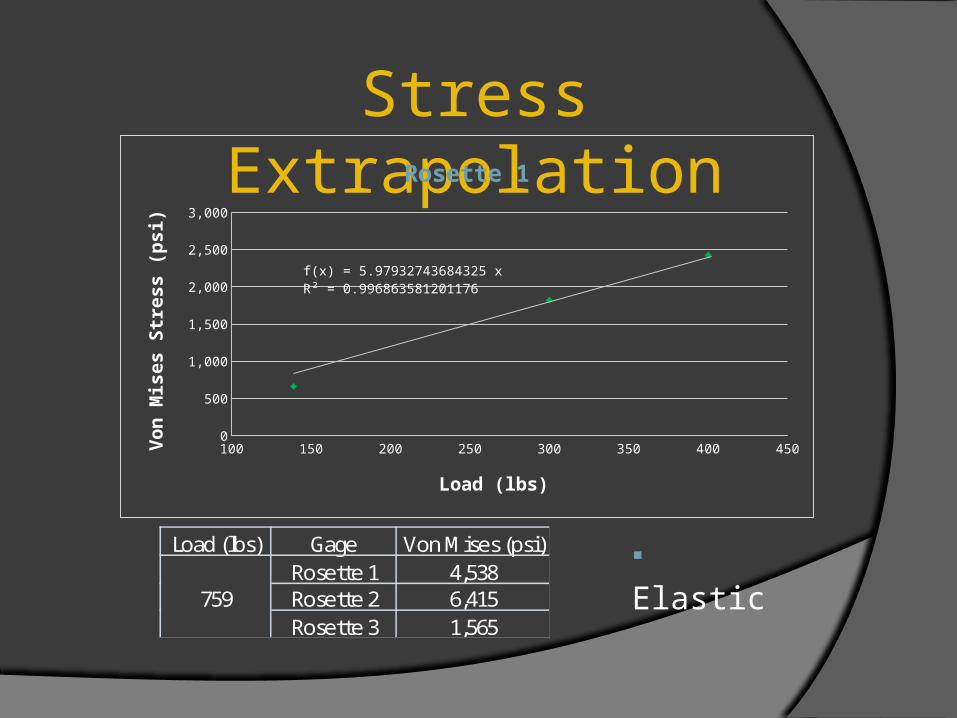
Stress Extrapolation
100 150 200 250 300 350 400 4500
500
1,000
1,500
2,000
2,500
3,000
f(x) = 5.97932743684325 xR² = 0.996863581201176
Rosette 1
Load (lbs)
Vo
n M
ise
s S
tre
ss
(p
si)
Load (lbs) Gage Von Mises (psi)Rosette 1 4,538Rosette 2 6,415Rosette 3 1,565
759
Elastic
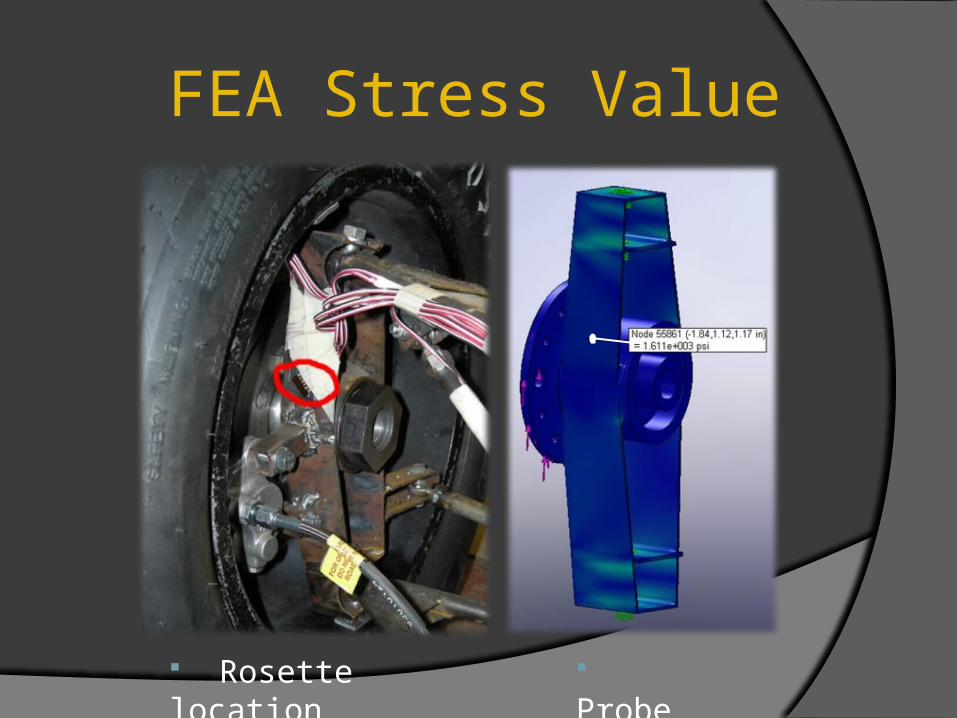
FEA Stress Value
Rosette location Probe

Theoretical Experimental
Assumption: rigid Assumption: smooth
GageTheoretical Stress (psi)
Experimental Stress (psi)
Percent difference
Rosette 1 1,611 4,538 95%Rosette 2 3,358 6,415 63%Rosette 3 565 1,565 94%
Sy = 50,800psi

Future Testing PlansStrain gauge and accelerometer data logged during driving
Mychron 3 data logger with internal Accelerometer
Strain gauges

ConclusionsRequirement: Theoretical Experimental (Actual) Pass/Fail or % Diff
Wheel Base ≥ 60" 61.5" Pass
Unequal track length Front: 48" Rear: 45" Front: 49" Rear: 45" Pass
Smaller track at least 75% of larger 94% 92% Pass
Minimum 2" total travel 3" 2.625" Pass
Template must pass throuh frame Pass
Spherical bearings must be in double shear
Pass
Material must not fail Pass
Camber vs Displacement goal -.7654 deg/in -.8085 deg/in 6.89%
Camber vs Body Roll goal .7494 deg/deg .7857 deg/deg 4.84%
Pass/Fail by design
Pass/Fail by design
See test and analysis section
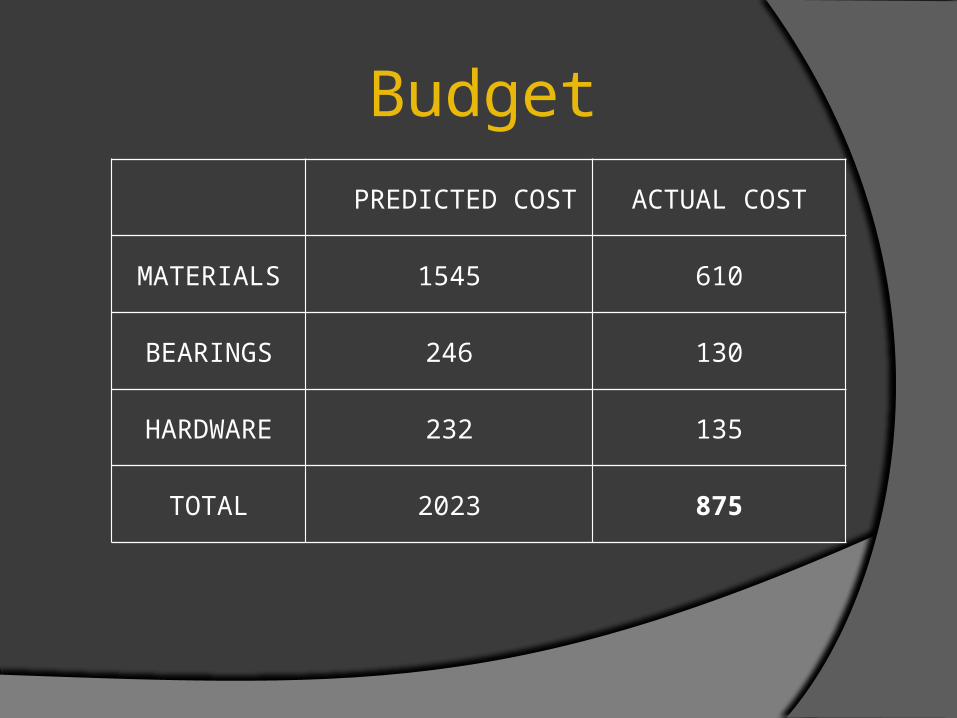
Budget PREDICTED COST ACTUAL COST
MATERIALS 1545 610
BEARINGS 246 130
HARDWARE 232 135
TOTAL 2023 875

Lessons Learned
Engineering is challenging and rewarding
Never underestimate the scope of a project
Always test to verify assumptions

Questions
?