team extreme - nasa extreme: the statistics of success© educational product educators grades 6-8...
TRANSCRIPT
EG-2005-11-10-LARC
An Educator Guide with Activities in Mathematics, Science, and Technology
Team Ex t reme : The St a t i s t i c s o f Succe s s ©
www.nasa.gov
Educational Product
Educators Grades 6-8TM
National Aerospace Space Administration

Team Extreme: The Statistics of Success©EG-2005-11-10-LARC
Program OverviewSUMMARY AND OBJECTIVES
In NASA CONNECT™, Team Extreme: The Statistics of Success©, students learn about the teamwork involved in a successful mission and the importance of statistics in project design and management. Using the video component and a hands-on lesson, students develop an understanding of statistical analysis and how people use statistics, such as mean, median, mode, and range, to make decisions. Members of the Penske Racing Team and engineers from Pratt & Whitney Rocketdyne help students investigate the relationship between work, energy, and power as they look at race car design; the Space Shuttle; and NASA’s most extreme machine, the International Space Station.
Student Involvement
Inquiry-Based Questions Host, Derek Wang, NASA engineers, and scientists will pose inquiry-based questions throughout the program. These questions allow the students to investigate, discover, and think critically about the concepts being presented. When viewing a videotape or DVD version of NASA CONNECT™, educators should pause the program at the designated segments so students can answer and discuss the inquiry-based questions. During the program, Derek Wang, NASA engineers, and scientists will indicate the appropriate point to pause the tape or DVD.
Teacher note: It is recommended that you preview the program before introducing it to your students so you will know where the pause points occur.
Hands-On ActivityThe hands-on activity is teacher created and is aligned with the National Council of Teachers of Mathematics (NCTM) Standards, the National Science Education Standards (NSES), and the ITEA Technology Standards of Edu-cation. Students use teamwork and statistics to design and create a spool car using specific materials. They collect data about the distances the spool cars roll and the number of rubber band twists used to power the cars. Students analyze their data by calculating mean, median, mode, and range. Students use their data to predict the success of each car, choosing one spool car for the class competition.

Team Extreme: The Statistics of Success© EG-2005-11-10-LARC
Background
Stock car racing has been popular since the late 1940’s. The cars that were raced in the early years were the same ones people drove on the streets. These cars were not made for the extremely bumpy dirt tracks where they raced. Rules did not allow modifications to the cars which quickly became damaged beyond repair. Eventually, the rules were changed to allow modifications, and stock-cars were designed to be safer, more durable, and faster.
Today every part of a stock car is designed specifically for race conditions. Teams of scientists, engineers, mechanics, and racing experts work together to determine the best designs for each type of track The tire design is incredibly important because dangerous blow-outs at high speeds can easily occur. The smooth tread-free tires are designed for traction in all kinds of weather, must remain stable at very high temperatures and speeds, and must be changed quickly. Tires are filled with nitrogen gas instead of air. Nitro-gen gas contains less moisture, which limits how much the tire expands when it gets hot. The use of inner tires allows the driver to come to a controlled stop in case an outer tire blows. Teamwork is essential to a winning team. An efficient pit crew is able to replace the tires and refuel the car at each pit stop in only 12 to 14 seconds!
The engine is the most important part of any stock car. The engine is responsible for turning the stored energy in fuel into huge amounts of power throughout the race. Engineering designs create engines for today’s race cars that produce more than 750 horsepower. Stock car engines are very large (about 5.9 liters compared to most cars that are from 1.5 liters to 4.0 liters). Carbu-retors, rather than fuel injection systems, are used to allow huge volumes of air and fuel into the engine. The air and fuel are put under great pressure and combust producing a much more powerful controlled explosion than a normal car. The more powerful the explosion within the cylinder of the engine, the greater the amount of horsepower produced. The various parts of the engines, including the intake and exhaust systems, coolant pumps, oil pumps, steering pumps, and alternators, have been designed to allow the gases and liquids to flow as smoothly as possible at high speeds and temperatures to create the most powerful car possible.
Before a stock car is ready to race, it must undergo a variety of tests and inspections to ensure that it is safe and efficient. The car is run on a dynamometer for hours in order to measure the engine’s power output at various speeds. A dynamometer actually measures the torque, or ability to turn the crankshaft in an engine. Think about using a wrench to loosen a large bolt. Twice as much force must be applied to a wrench with a 30 cm handle than to a wrench with a 60 cm handle to loosen the nut. In this case, torque is the force times the handle length. The dynamometer adds a load or weight to the engine, and measures the revolutions per minute, or rpm, of the crankshaft. The rpm tells how many times the crankshaft revolves to move the pistons up and down in the engine. The higher the rpm, the faster the crankshaft is turning, and the more power the engine is generating. In this example, power is torque times the rotation speed. The dynamometer measures the maximum load the engine can handle. The product of torque and rpm can then be converted to horsepower with a simple conversion factor.
Engine parts are checked for abnormal wear and pressure changes. The stock car team collects large amounts of data, which are analyzed and used to make decisions about stock car improvements. Team members, both in the pit crew and on the design team, must work incredibly well together to win stock car races.
Just like racing teams, NASA has its own extreme team that works to provide power to one of the most radical rides of all. This machine, the International Space Station (ISS), orbits the Earth about every 90 minutes and contains within it a kitchen, bathroom, gym, sleeping quarters, and laboratories. A large amount of energy is needed to power all the components of the ISS. This power is generated by utilizing the energy of the Sun. Eight solar arrays, each measuring about 34 meters by 11 meters, form the enormous “wings” which catch the Sun’s energy. The completed solar array is large enough to cover a football field. These solar arrays make up the four large, flexible photovoltaic (photo; light; voltaic: producing electricity) modules. The silicon-based photovoltaic cells generate small currents of electricity when exposed to energy from the Sun. These modules produce approximately 144 kilowatts of power per day, which is enough to run 60 average-sized homes for an entire year.
The power obtained from the solar arrays is distributed in several ways. Half of the power obtained will charge the Space Station’s six back up batteries. These rechargeable batteries are used when the Space Station is not in sunlight. The batteries are also used when more power is needed for experiments and research. The other half of the power produced will go directly to the laborato-ries and rooms of the Space Station to run the life support systems. Teams of NASA engineers, scientists, and astronauts worked together to get these giant solar arrays into space in the first place and continue to work together to provide the power necessary to operate this valuable research station. Whether on the race track or orbiting the earth, teamwork is an important part of success.
Team Extreme: The Statistics of Success©EG-2005-11-10-LARC
Instructional ObjectivesStudents will
• construct a model.
• make observations, collect and interpret data.
• calculate the mean, median, mode, and range of a data set.
National StandardsNCTM Mathematics Standards:
Algebra
• Understand patterns, relations, and functions.
Measurement
• Apply appropriate techniques, tools, and formulas to determine measurements.
Data Analysis and Probability
• Formulate questions that can be addressed with data and collect, organize, and display relevant data to answer them.
• Select and use appropriate statistical methods to analyze data.
• Develop and evaluate inferences and predictions that are based on data.
Problem Solving
• Build new mathematical knowledge through problem solving.
• Solve problems that arise in mathematics and other contexts.
• Apply and adapt a variety of appropriate strategies to solve problems.
• Monitor and reflect on the process of mathematical problem solving.
Communication
• Organize and consolidate their mathematical thinking through communication.
• Communicate their mathematical thinking coherently and clearly to peers, teachers, and others.
• Analyze and evaluate the mathematical thinking and strategies of others.
• Use the language of mathematics to express mathematical ideas precisely.
Connections
• Recognize and apply mathematics in contexts outside of mathematics.
• measure linear distances using metric units.
• use data to improve car design.
• work cooperatively in teams.
Representation
• Create and use representations to organize, record, and communicate mathematical ideas.
• Select, apply, and translate among mathematical representations to solve problems.
NSES Science Standards:
Science as Inquiry
• Abilities necessary to do scientific inquiry
• Understandings about scientific inquiry
Physical Science
• Motions and forces
• Transfer of energy
Science and Technology
• Abilities of technological design
• Understandings about science and technology
History and Nature of Science
• Science as a human endeavor
• Nature of science
ITEA Technology Standards of Education
• Standard 8: Students will develop an understanding of the attributes of design.
• Standard 9: Students will develop an understanding of engineering design.
• Standard 10: Students will develop an understanding of the role of troubleshooting, research and development, invention and innovation, and experimentation in problem solving.
Team Extreme: The Statistics of Success© EG-2005-11-10-LARC
NASA Relevance Scientific investigation, engineering, and teamwork are all essential to the success of both stock car racing and space exploration. In fact, the work of the two often overlaps because both have similar problems to overcome. Controlling body temperatures is a critical concern for both NASA astronauts and stock car drivers. In the 1960s, “cool suits” were developed by NASA to keep astronauts’ body temperatures at comfortable levels while walking in space. Elevated heat contributes to fatigue, dehydration, and possible collapse. The cool suits, made up of helmet liners, vests, and pants with small tubes running throughout the material, circulate chilled water, which dissipates heat and provides a cooler environment. The science and technology that was needed to maintain healthy body temperatures for astronauts working in space is also used to help keep stock car drivers from overheating while racing. Fundamental aeronautics research, fuel cells made of reinforced, flexible material that won’t crack or leak, polarized driving glasses, and lubricants used in both the Space Shuttles and race cars are other scientific advancements that have helped stock car drivers and NASA astronauts.
The International Space Station will serve as a major research outpost. Because of its research and technology, the ISS will serve as an indispensable step in preparing for future human space exploration. The research completed aboard the ISS will lead to discoveries in medicine, materials, and fundamental science that will benefit people all over the world.
Preparing for the Activity
Student MaterialsEach group will need:large spool of thread (~4 cm diameter)assorted rubber bandspaperclipsmall craft sticks metal washer (~2 cm diameter)piece of transparent tapemasking tapemetric ruler or measuring tapestudent handoutsjournal
Teaching Note: You may want to experiment in advance to determine what size washer will work with the type and size of spool selected. All students, however, should be given the same size and type of spool as well as the same size washer in order to control specific variables
Teacher MaterialsCopy of NASA CONNECT™, Team Extreme: The Statistics of Success© video or DVD
Vocabularyenergy – the capacity to do work
gimbal – a device that allows an object to remain horizontal even as the support tips or turns
kinetic energy – energy in the form of motion; depends on the mass and velocity of the object
mean- the sum of the values in a data set divided by the number of values; also known as the arithmetic average median- the middle value in a data set when the values are listed from lowest to highest (If there is an even number of data points, the median is the mean of the two middle data points.)
mode- the value that occurs the most frequently in a data set
potential energy – stored energy which can be converted to kinetic energy when something acts to release it
power – the amount of work done in a certain amount of time; measured in joules per second or watts
range – the difference between the highest and lowest values in a data set
statistics – the science of classifying and interpreting numbers and numerical data
work – transfer of energy that occurs when a force makes an object move; measured in joules
Time for Activitiy30 minutes for NASA CONNECT™ show100 minutes for activity
Team Extreme: The Statistics of Success©EG-2005-11-10-LARC
The Activity
Brief Lesson Description
In this hands-on lesson, students build a model race car using a spool, rubber bands, a paperclip, washer, and a craft stick. Students collect data about the distance each car travels and the number of times a rubber band is twisted to power the car. The mean, median, mode, and range of the data sets are calculated. Students work together in teams to modify their designs while investigating the relationship between work, energy, and power.
Video Component
View NASA CONNECT™, Team Extreme: The Statistics of Success© and answer all inquiry-based questions.
Engage
1. Give students an assortment of rubber bands and ask them to classify the rubber bands by size. Separate like rubber bands into containers. Number the containers. Ask students to develop a scientific key so other rubber bands can be sorted in the same manner. Talk about the observable attributes the students should consider for this activity. Determine which ones are important (size, width, thickness) and which ones are irrelevant (color).
Teaching Note: Give students examples of scientific or classification keys, or ask them to do an Internet search for their own examples.
2. After the rubber bands are sorted, ask each group to choose three different rubber bands to use as the “fuel” for their spool cars. Record the number assigned to each kind of rubber band (from the container number).
3. Give each student a spool, a craft stick, a piece of tape, a washer, and a paperclip.
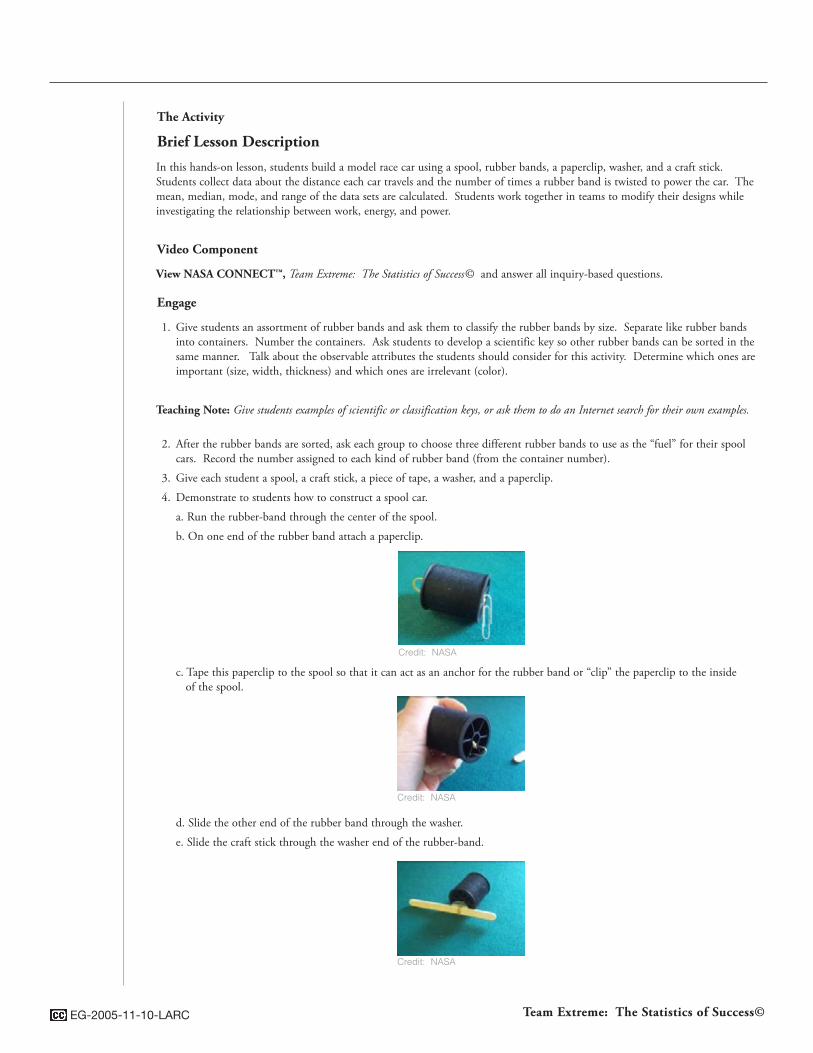
4. Demonstrate to students how to construct a spool car.
a. Run the rubber-band through the center of the spool.
b. On one end of the rubber band attach a paperclip.
c. Tape this paperclip to the spool so that it can act as an anchor for the rubber band or “clip” the paperclip to the inside of the spool.
Credit: NASA
Credit: NASA
Credit: NASA
d. Slide the other end of the rubber band through the washer.
e. Slide the craft stick through the washer end of the rubber-band.

Team Extreme: The Statistics of Success© EG-2005-11-10-LARC
Teaching note: The car will roll in a straighter path if the craft stick is slightly off-center. Allow students to experiment to find the best position.
5. Explain to students that as you turn the craft stick, the rubber band twists. The rubber band begins to store potential energy. Twist the rubber band several times, place the spool on the floor, and release. The spool rolls forward as the potential (stored) energy in the rubber band is turned into kinetic (moving) energy.
6. Ask the students to identify the variables that play a key role in whether or not the spool rolls and how far it rolls. List these variables on the board. Several possibilities include: size of rubber band, number of times the rubber band is twisted, size of spool, the surface on which it is rolled, the size of the washer, and the position of the craft stick.
7. Have students in each group measure out a work area that is at least four meters in length and is clear of all objects. Students should draw a diagram of the “test track” in their journals. Include the dimensions of the test track. Use masking tape to mark a starting line.
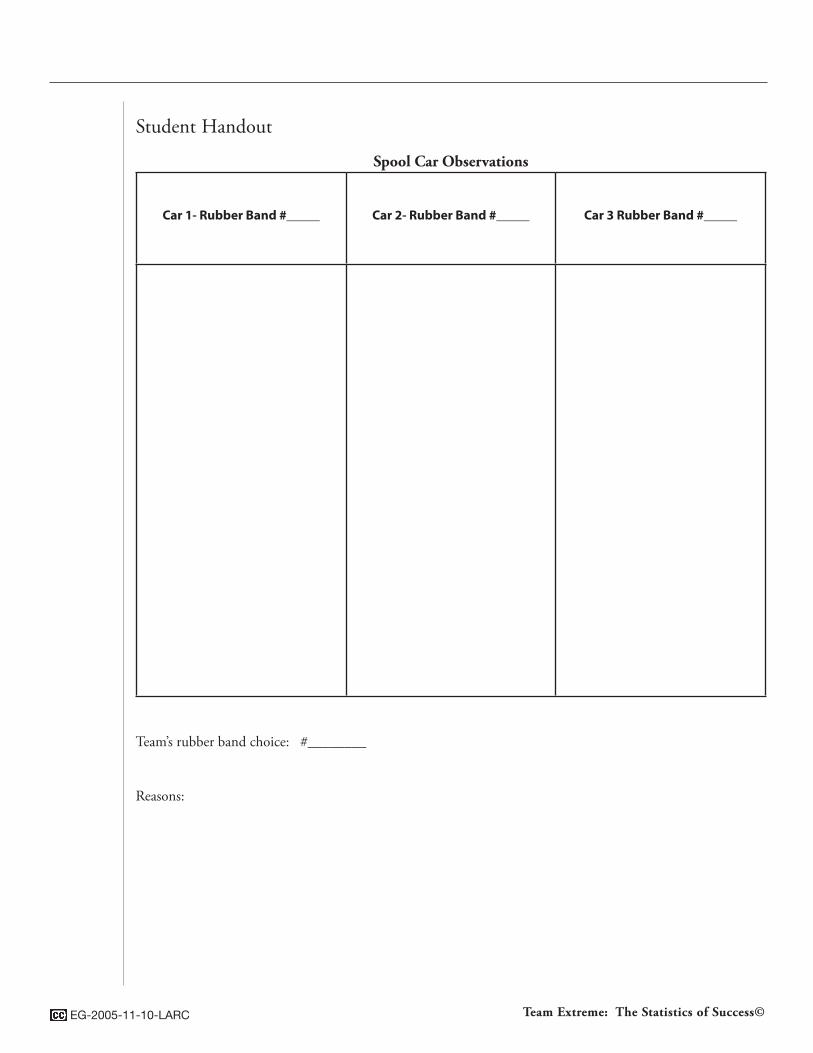
8. Allow the students about 10 minutes to “play” with their spool cars. Instruct the students to record observations for each car on the Spool Car Observations handout. Did the cars move in a straight line? How far did each car roll? Did some cars move faster than others? Using their observations, students must decide which one of the three rubber bands they will use for the class competition. (See Student Handouts.)
9. As a group, allow students to share their observations about the different rubber bands and how they worked. Talk about the factors they considered when making their choices. Were some results different from what they expected?
Journal Write # 1:
Explain how your team decided which rubber band to use for your spool car. What factors did you consider? How did the group make its decision?
Explore
1. After determining which spool car and rubber band each team will use, have students return the other spool cars to the teacher. Instruct students to then get a second rubber band like the one they have chosen. Set this rubber band aside. It will be used in the final race.
2. Discuss with students the difference between independent variables and dependent variables. Independent variables are those variables you manipulate or change to influence your outcome. You try to predict the behavior of dependent variables. These variables are affected by the change in the independent variables. For the rubber band cars, the size of the rubber band is one independent variable. The dependent variable is the distance the spool car rolls.
3. Introduce a new independent variable for the students to test: the number of times the rubber band is twisted. Have each group run tests on their chosen spool car to determine the number of twists needed to make the spool car roll the longest straight-line distance. Increase the number of twists by five each time. Have students record the straight-line distance (to the nearest centimeter) from the starting line to the place the car stopped. If the car does not roll in a straight line, measure the perpendicular distance from the starting line to the place the car stopped. (See diagram on Student Handout.)
4. Students should conduct ten trials each time the independent variable (number of twists) is changed. Measure the straight-line distance the spool car rolls and record on the Data Collection Sheet. (See Student Handouts.)
Teaching Note: Make sure that for each trial, the rubber band is completely unwound before they begin counting the number of twists.
5. The students should continue to collect data until the rubber band breaks or will no longer move the car.
6. Have students calculate and record, on the Data Collection Sheet, the mean, median, mode, and range for each set of trials. (See Student Handouts.)
Teaching note: Check to see that students are adding the numbers in the columns, not the rows so they are calculating the mean, median, and mode for the same independent variable (number of twists) each time.
Team Extreme: The Statistics of Success©EG-2005-11-10-LARC
Journal Write #2:
In your own words, explain work, kinetic energy, potential energy, and power. Using your spool car as an example, tell how work, kinetic energy, potential energy, power relate to each part of the car, and its motion. Discuss how energy changes from potential to kinetic energy during the motion of your spool car.
Explain
1. Have students create graphic representations, such as charts, tables, or graphs, of their data. Post the data so it is clearly visible.
2. Discuss the students’ journal entries about how the parts of the car relate to power, kinetic energy, potential energy, and work. (Kinetic energy is related to the motion of the car. Potential energy is stored by the rubber band when it is twisted. Work is done on the car as the rubber band releases its stored energy and transforms it into kinetic energy. More power is delivered if the energy is transferred more rapidly and the car is moving faster. The energy, or ability to do the work, is dependent on the type of rubber band used and the number of twists. Some students may draw a parallel between the craft stick and the crankshaft in an engine.)
3. Compare and contrast the student findings. Use the rubber band classification system that was developed by the students to compare the results of similar rubber bands.
4. For each class of rubber band, what is the range of twists before the band was no longer effective? What was the range for the distance the cars traveled?
Teaching note: After students have calculated the range for their own cars, compare the class results. All students who chose #2 rubber bands, for example, can compile their data to determine the range for that type of rubber band.
5. Ask students to identify other ways the statistics could be used. Were they always able to identify a mode? Why or why not? What was the most efficient number of twists to operate the car?
Teaching note: The data collected by the students and analyzed by finding mean, median, and mode is similar to the data collected with a dynamometer. Students should be able to use their data to find the most efficient number of rubber band twists (rpm) to operate the load (spool car). How would a different size spool affect their results? What might happen if the spool were made of wood instead of plastic?
6. Sometimes data are recorded that do not fit a particular pattern. An out of place data point is called an outlier. Outliers may significantly affect the mean and median. Ask students to identify any outliers they may have found and analyze the effect the outlier had on their statistics.
Teaching note: You may want to use this problem to explain the effect of outliers.
The average race car tire has a life expectancy of between 160 and 320 kilometers. In a test for one particular kind of tire, the following numbers were recorded:
160 km, 190 km, 228 km, 292 km, and 850 km.
The range for this data set is 690 kilometers. That range far exceeds the anticipated life expectancy of the tires. 850 km is an outlier, or number that does not fit the expected pattern. If the median is calculated using the outlier, the median is 228 km. Without the outlier, the median is 209 km. Both numbers are similar and fall within the expected range. However, if the outlier is included in the calculation for the mean distance, the answer of 344 km is greater than the anticipated life expectancy. The mean without the outlier is 217.5 km. Discuss with students which groups might want to include the outlier (tire manufacturers) and which group might want to discount the outlier (racing team). Ask them to explain their reasons.
7. As a group, decide what performance standards are the most important (distance the car traveled, the speed of the car, the number of trials the rubber band withstood). Determine which of these standards were measured in your tests. Design tests to measure additional standards.
8. Replace the rubber band on each team’s spool car with the one that was set aside earlier. Conduct a class competition to see whose spool car will roll the farthest. Have teams analyze the class data and determine how many rubber band twists they will use to power the vehicle for the race. The car that travels the greatest straight line distance is the winner!

Team Extreme: The Statistics of Success© EG-2005-11-10-LARC
Teaching note: Discuss with students why the rubber band should be replaced. Encourage them to think about elasticity and the wear and tear on parts. Many of the students’ original rubber bands are broken, while others have lost their ability to move the vehicle. The part is simply worn out and must be replaced with a comparable part. Machine parts have specific life expectancies. The Shuttle tires, for example, were replaced after every mission to avoid complications from abnormal wear. The solar cells on the International Space Station were designed to provide the right amount of power even as the system aged. Students may wish to conduct experiments on the worn rubber band to see how much longer it will last, or to begin the test trials over again comparing the amount of energy generated from the worn rubber band to the energy generated when it was new.
Technology Insertion Point: Ask students to graph their data using a graphing calculator or Excel spreadsheet.
Extend
1. Have the students create a multi-media advertisement to “sell” their spool car. Students should use the data they gathered and must decide whether mean, median, mode, or range gives the best picture of their cars’ success.
2. Ask students to make a poster or Power Point presentation to explain the benefits of space research and technology transfer. Identify the NASA inventions that are used by racing teams.
3. Ask students to conduct research about James Watt and Alessandro Volta. Design a simple experiment that can be shown to the class to explain the scientific work of these scientists.
4. Find real world examples of how mean, median, mode, and range are used. Look in newspapers, magazines, and on the Internet. Collect examples and write an explanation of how these statistics are used and what they mean. (Sports and marketing examples are easy to find.)
Evaluate
Create a rubric that assesses how well the students work together as a team, the accuracy of their data collection and data analysis, and the distance their spool cars traveled.
Assign Journal Write # 3
How well did your team work together on this project? Why is teamwork important? What design changes would you make in a spool car to allow it to travel farther?

Team Extreme: The Statistics of Success©EG-2005-11-10-LARC
Student HandoutActivity Directions Part 1:
1. Classify rubber bands by size and thickness, putting similar rubber bands into containers. Number the containers. Develop a scientific key that will allow you to sort other rubber bands in the same way. Rubber bands will be identified and compared by the container number.
2. Construct a rubber band spool car by following these directions.
a. Run rubber-band through the center of the spool.
b. On one end of the rubber band attach a paperclip.
c. Tape this paperclip to the spool so that it can act as an anchor for the rubber band or “clip” the inside of the spool with the paperclip.
Credit: NASA
Credit: NASA
Credit: NASA
d. Slide the other end of the rubber band through the washer.
e. Slide the craft stick through the washer end of the rubber band.
3. Predict how you think the size of the rubber band will affect the distance the spool car rolls. Your team should choose three different rubber bands to test.
4. Measure your team’s test track, or work space, on the floor. The area should be at least four meters in length and should be clear of all objects so the spool car can roll freely. Use masking tape to mark a starting line. Draw a diagram of your test track in your journal. Include the dimensions.
5. Now your group will test the rubber bands you chose. Create a spool car for each rubber band. Twist the rubber band several times, place the spool on the floor, and release.
6. Record observations for each rubber band spool car on the Spool Car Observations Student Handout. Did the cars move in a straight line? How far did each car roll? Did some cars move faster or slower than others? What changes can you make to improve the movement of the car?
7. Compare the three cars. As a team, decide which one of the three spool cars performs the best. Return the other spool cars to your teacher.
8. Complete Journal Write 1.
Team Extreme: The Statistics of Success© EG-2005-11-10-LARC
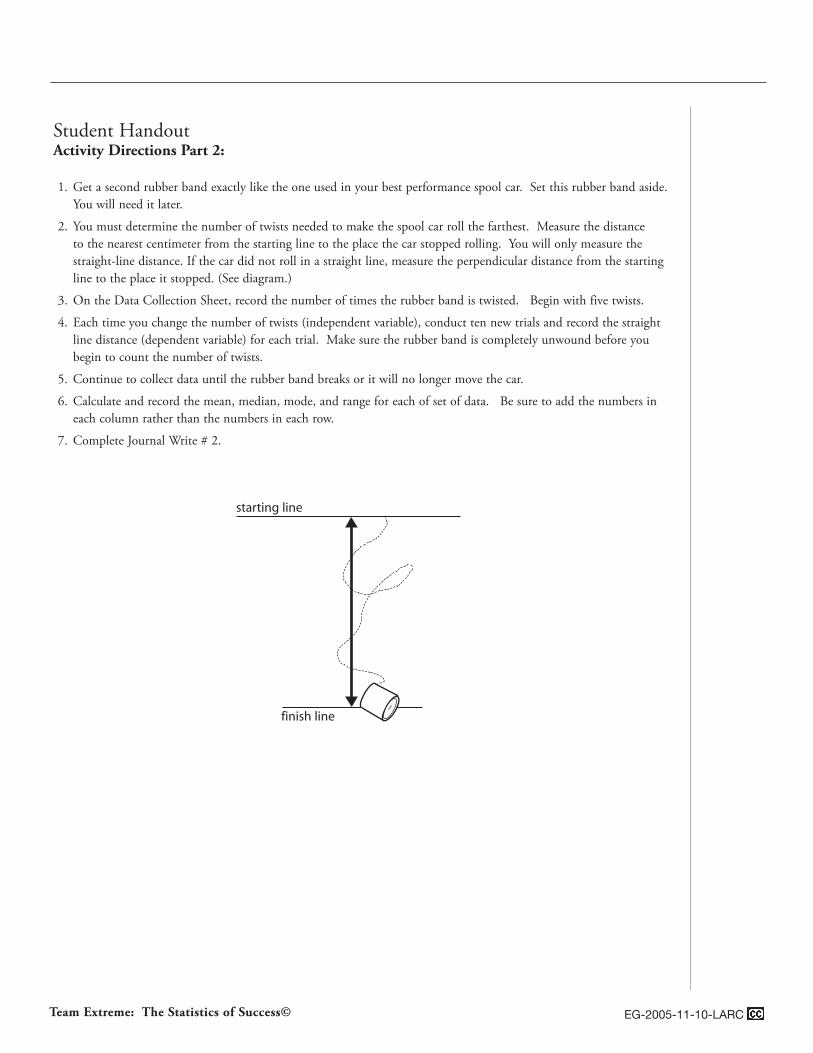
Student HandoutActivity Directions Part 2:
1. Get a second rubber band exactly like the one used in your best performance spool car. Set this rubber band aside. You will need it later.
2. You must determine the number of twists needed to make the spool car roll the farthest. Measure the distance to the nearest centimeter from the starting line to the place the car stopped rolling. You will only measure the straight-line distance. If the car did not roll in a straight line, measure the perpendicular distance from the starting line to the place it stopped. (See diagram.)
3. On the Data Collection Sheet, record the number of times the rubber band is twisted. Begin with five twists.
4. Each time you change the number of twists (independent variable), conduct ten new trials and record the straight line distance (dependent variable) for each trial. Make sure the rubber band is completely unwound before you begin to count the number of twists.
5. Continue to collect data until the rubber band breaks or it will no longer move the car.
6. Calculate and record the mean, median, mode, and range for each of set of data. Be sure to add the numbers in each column rather than the numbers in each row.
7. Complete Journal Write # 2.
starting line
finish line
Team Extreme: The Statistics of Success©EG-2005-11-10-LARC
Student Handout
Spool Car Observations
Car 1- Rubber Band #_____ Car 2- Rubber Band #_____ Car 3 Rubber Band #_____
Team’s rubber band choice: #________
Reasons:

Team Extreme: The Statistics of Success© EG-2005-11-10-LARC
Student Handout
Dep
end
ant V
aria
ble
DATA COLLECTION SHEET
Independant Variable
Trials 5 10
Twists Twists Twists Twists Twists Twists Twists Twists Twists Twists
1
2
3
4
5
6
7
8
9
10
Total
Mean
Median
Mode
Range

Team Extreme: The Statistics of Success©EG-2005-11-10-LARC
Student HandoutJournal Write
Journal Write #1
Explain how your team decided which rubber band to use for your spool car? What factors did you consider? How did the group make its decision?
Journal Write #2
In your own words, explain work, kinetic energy, potential energy, and power. Using your spool car as an example, tell how work, kinetic energy, potential energy, and power relate to each part of the car and its motion. Discuss how energy changes from potential to kinetic energy during the motion of your spool car.
Journal Write #3
How well did your team work together on this project? Why is teamwork important? What design changes would you make in a spool car to allow it travel farther?