teaching pack for key stages 3, 4 & a-levelf014/usefulresources/aric/resources/teaching... ·...
TRANSCRIPT

ACE is supported by the Department for Environment, Food & Rural Affairs
Atmosphere, Climate & Environment
Information Programme, aric Manchester Metropolitan University
Chester Street, Manchester M1 5GD Tel: 0161 247 1590
Fax: 0161 247 6332 E-Mail: [email protected]
Internet: http://www.ace.mmu.ac.uk/
Teaching Pack for
Key Stages 3, 4 & A-Level
Sue Hare
1999 (updated 2002)

ACE Information Programme aric
Urban Air Quality Teaching Pack: KS4 & A 2
Lesson 1. The History of Urban Air Pollution
Lesson 2. Changing Patterns of Urban Air Pollution
Lesson 3. Urban Air Pollution in the 1990s
Lesson 4. Transport and Urban Air Pollution
Lesson 5. Industries and Urban Air Pollution
Lesson 6. The Effects of Urban Air Pollution
Lesson 7. Responses to Urban Air Pollution
Glossary
References & Further Information
OHPs

ACE Information Programme aric
Urban Air Quality Teaching Pack: KS4 & A 3
AIM:
To highlight and investigate the quality of urban air in the UK.
OBJECTIVE:
To increase awareness and understanding of the sources andeffects of the main urban pollutants and to identify possibleresponses to improve air quality.
TARGET AUDIENCE:
Teachers of students aged 12 - 18 years studying geography,science and environmental studies/ science for Key Stages 3 to 4 ofthe National Curriculum (GCSE), and A-level.
SKILLS ENHANCEMENT:
Students will develop an awareness and understanding of thecurrent environmental issue of air quality in urban areas. Thehistorical perspective and changes in air quality to the present daywill be appreciated through the use of this pack. Students will alsogain an up to date appreciation of air quality in urban areas, and theimportance of the contribution of vehicular pollution in particular as amajor source of urban air pollution today. Students will also increasetheir knowledge and understanding of the effects of urban airpollution and gain an insight into the responses that can be taken toimprove the quality of air in towns and cities of the UK.

ACE Information Programme aric
Urban Air Quality Teaching Pack: KS4 & A 4
THE USE OF THIS PACK:
Teachers are strongly encouraged to read this pack thoroughlybefore embarking upon its use.
Students will gain maximum benefit if all of the lessons arecovered in the order set out in this pack. However, lessons maybe used in isolation if teaching time does not permit, or if certainlessons prove relevant for a particular syllabus.
The optional exercises at the end of each lesson are designedto aid students in understanding the topic covered in eachsection. Usually the exercises require students to draw oninformation supplied with each lesson topic, or to investigate theissue by their own personal research. These exercises may bemost useful for Key Stage 3 & 4 students.
Sheets for photocopying as OHPs have been included at theend of the pack to help teachers convey factual and graphicalinformation to their students.

ACE Information Programme aric
Urban Air Quality Teaching Pack: KS4 & A 5
A Brief Summary of Air Pollution History
Urban air pollution is certainly not a new problem. Back in the daysof the Middle Ages the use of coal in cities such as London wasbeginning to escalate. By the end of the 16th century the problemsof urban air pollution are well documented.
The Industrial Revolution in the 18th and 19th centuries was basedon the use of coal. Industries were often located in towns and cities,and together with the burning of coal in homes for domestic heat,urban air pollution levels often reached devastating levels. Duringfoggy conditions, pollution levels escalated and urban smogs(smoke and fog) were formed. These often brought cities to a halt,disrupting traffic but more dangerously causing death rates todramatically rise. The effects of this pollution on buildings andvegetation also became obvious. The 1875 Public Health Actcontained a smoke abatement section to try and reduce smokepollution in urban areas.
The 1926 Smoke Abatement Act was aimed at reducing smokeemissions from industrial sources, but the remaining problem thatwas not being tackled was pollution from domestic sources.
The Great London Smog of 1952 which resulted in around 4,000extra deaths in the city, led to the introduction of the Clean Air Actsof 1956 and 1968. These introduced smokeless zones in urbanareas, with a tall chimney policy to help disperse industrial airpollutants away from built up areas into the atmosphere.
ACE Information Programme aric
Urban Air Quality Teaching Pack: KS4 & A 6
Following the Clean Air Acts, air quality improvements continuedthroughout the 1970s and further regulations were required throughthe 1974 Control of Air Pollution Act. This included regulations forthe composition of motor fuel and limits for the sulphur content ofindustrial fuel oil.
However, during the 1980s the number of motor vehicles in urbanareas steadily increased and air quality problems associated withmotor vehicles became more prevalent. In the early 1980s, the maininterest was the effects of lead pollution on human health, but by thelate 1980s and early 1990s, the effects of other motor vehiclepollutants became a major concern. The 1990s have seen theoccurrence of wintertime and summertime smogs. These are notcaused by smoke and sulphur dioxide pollution but by chemicalreactions occurring between motor vehicle pollutants and sunlight.These are known as ‘photochemical smogs’.
Key Dates for the History of Air Pollution in the UK
The following key dates identify some of the major facts relating tourban air pollution in the UK over recent centuries.
1661 British scientists John Evelyn & John Graunt found that polluted
air from industry could affect vegetation and people. Theysuggested that industries be located in the countryside to
minimise effects on health.
1852 Robert Angus Smith identifies acid rain in Manchester.
1872 Robert Angus Smith became the first air pollution inspector inBritain.
1875 The Public Health Act. This contained a smoke abatement
section; legislation to the present day has been based on this.

ACE Information Programme aric
Urban Air Quality Teaching Pack: KS4 & A 7
1890 Sulphurous smogs had been reported for over 100 years in many British cities. ‘Smog’ became the term to describe severe air pollution conditions, derived from a combination of smoke and fog.
1926 Public Health (Smoke Abatement) Act. This amended and
extended the previous Public Health Acts of 1875 and 1891. 1930/1 Additional deaths occurred in a smog in Manchester & Salford.
This began a campaign which ultimately led to the introduction of smoke control.
1952 The famous London Smog occurred in December 1952 and
resulted in thousands of premature deaths. 1956 & 1968 Clean Air Acts. These had a dramatic effect on air quality
and eliminated the occurrence of the types of smogs of previous decades.
1974 Control of Pollution Act. Regulations concerning lead content in
fuel and sulphur content in fuel were made. Also, local authorities were given power to obtain and publish information about air pollution emissions.
1990 Environmental Protection Act. This Act was introduced to ensure
acceptable standards of pollution prevention and control in industry.
1995 Environment Act. This introduces local air quality management,
requiring local authorities to meet air quality standards set by central government.
1997 National Air Quality Strategy. This defines standards and
objectives for the key urban pollutants to help improve UK air quality. It was updated in 2000.

ACE Information Programme aric
Urban Air Quality Teaching Pack: KS4 & A 8
Historical Smogs In 1905 Dr. HA Des Voeux used the term smog to describe the conditions of fuliginous or sooty / smoky fogs but they were also known as “pea soupers” and “great stinking fogs”. Back in the 1600s, the writer and scientist John Evelyn reported industries to be the obvious cause of pollution in London; he noted that pollution almost vanished on Sundays. However, Rollo Russell observed in the mid nineteenth century that there were more fogs on Sundays and holidays than on working days. He therefore concluded that the main cause of the problem was the domestic burning of coal. The reason for this change was that some industrial smoke control had been achieved. However, domestic and industrial sources were still both contributing to urban air pollution. Smogs occurred as a result of particular meteorological conditions. November was often the worst month for fogs, especially long lasting thick fogs. Many people described the days as “gloomy”. Of course, during the winter months emissions of smoke and sulphur dioxide pollution were much greater in urban areas than during the summer months due to the burning of fossil fuels (mainly coal) for heat. Smoke particles trapped in the fog gave it a yellow / black colour and these smogs often settled over cities for many days. Wind speeds would be low at these times causing the smoke and fog to stagnate; hence pollution levels would increase near ground level. During smog periods the effects on human health were very evident particularly when smogs persisted for several days. Many people suffered respiratory problems and increased deaths were recorded, notably those relating to bronchial causes. One of the major London smogs occurred in December 1892. It lasted for 3 days and resulted in approximately 1000 excess deaths.
SMOKE+
FOG =
SMOG

ACE Information Programme aric
Urban Air Quality Teaching Pack: KS4 & A 9
London became quite famous for its smogs. By the nineteenth century, many visitors to London came to see the capital in the fog. For some the fogs were not all gloom. As an excerpt from a letter in 1888 reveals:
“today we are having a yellow fog, and that always enlivens me, it has such a knack of transfiguring things...It is very picturesque also...Even the grey, even the black fogs make a new and unexplored world not unpleasing to one who is getting palled with familiar landscapes” (Brimblecombe, 1987).
The Pollutants of Historical Smogs Smoke and sulphur dioxide were the main pollutants that caused smogs to form. Compared to the values that we find in air today, levels of these pollutants were very high indeed. Air pollutants in towns and cities were not measured on a regular basis using standardised techniques until the 1960s. However, writings and measurements taken by some scientists give us an indication of the levels of air pollution in history (see fact File One on the next page). Sources of Pollution
The burning of coal in industries and homes was the main source of smoke and sulphur dioxide pollution. Industries were located amongst housing estates which caused urban air to be considerably more polluted than in the countryside. City smoke concentrations occasionally exceeded 4000µgm-3 when fog was intense. (The mean UK concentration of smoke in 1990 was about 15µgm-3). Many paintings by the famous artist Lowry in the 1930s illustrate the density of smoke that was regularly emitted into the atmosphere.

ACE Information Programme aric
Urban Air Quality Teaching Pack: KS4 & A 10
Further Information
There are various sources of literature and art which can help to identify what air pollution was like in previous centuries. The art work of L.S. Lowry is one of these. Details of how to obtain resources to support this section are given below: L. S. Lowry (1887 - 1976) Lowry was a British painter, born in Manchester. He worked as a clerk until his retirement at 65, painting during his spare time. From the 1920s he exhibited regularly in Manchester. His work is characterised by bleak industrial landscapes and towns dotted with matchstick figures. Many of his paintings are now exhibited in the Lowry Centre in Salford, the city where many of his paintings were created.
FACT FILE ONE
City: Manchester Period: 1850s Industries: Cotton, engineering, metal working, chemicals Air Pollution Facts: Manchester Smoke Inspector visited 500 factory
premises; 300 of these were issued with notices or cautions.
A Manchester cotton mill was observed to emit black smoke for 8 hours 52 minutes out of a 9 hour period.
Robert Angus Smith, the first air pollution inspector described the polluted atmosphere of Manchester.
Air Pollution Levels: Sulphur dioxide levels were not routinely monitored. Estimates for Manchester in the late nineteenth century were 2930 µg m-3 (micro grams per cubic metre of air).
Sources: Brimblecombe, 1989; Longhurst & Mann, 1994
ACE Information Programme aric
Urban Air Quality Teaching Pack: KS4 & A 11
For further information on Lowry you can visit the following website: • = http://www.thelowry.com/ or visit the Lowry Centre The Lowry, Pier 8, Salford Quays, M5 2AZ Tel:0161 876 2000 Fax: 0161 876 2001 Email: [email protected] The Lowry Centre contains the world's largest public collection by the City's most famous painter, L.S. Lowry. There is also a shop from which you can buy Lowry prints, postcards and other goods.
Questions
1. What does the term ‘smog’ mean? 2. Who was the first air pollution inspector and where did he work? 3. Identify three terms which describe smog. 4. What were the main sources of urban air pollution before the
1956 & 1968 Clean Air Acts? 5. Identify one weather condition associated with the formation of
smog. 6. Why did air pollution levels build up when it was foggy?

ACE Information Programme aric
Urban Air Quality Teaching Pack: KS4 & A 12
7. How many excess deaths occurred in the December 1892 London smog?
8. Re-write the 1888 excerpt from a letter in your own words. 9. Which pollutants were the main ones found in historical smogs? 10. What was the estimated sulphur dioxide level for Manchester in
the late 1800s?

ACE Information Programme aric
Urban Air Quality Teaching Pack: KS4 & A 13
The Early 1900s
Fog and smog frequencies began to reduce in UK urban areasduring the early 1900s, compared with the latter half of thenineteenth century. Air pollution was still a severe problem but thenumber of major smogs began to decrease. Several changes helpedto contribute to this situation, including:
• changing social conditions;
• tighter industrial controls;
• declining importance of coal as a domestic fuel;
• changes in fuel type - gas and electricity became alternatives tocoal.
The famous London smogs seemed to have become a thing of thepast.
The Great London Smog
On December 4th 1952, however, an anticyclone settled overLondon. The wind dropped and the air grew damp; a thick fog beganto form. The Great London Smog lasted for five days and led toaround four thousand more deaths than usual.
Figure 2.1 shows the average smoke and sulphur dioxide levels for12 London sites and the relationship with deaths recorded during thesmog period in December 1952. The peak in the number of deathscoincided with the peak in both smoke and sulphur dioxide pollutionlevels.

ACE Information Programme aric
Urban Air Quality Teaching Pack: KS4 & A 14
Figure 2.1: The Relationship Between Smoke And Sulphur DioxidePollution And Deaths During The London Smog, December 1952
Source: Wilkins, 1954
Burki, 24 Heures

ACE Information Programme aric
Urban Air Quality Teaching Pack: KS4 & A 15
Air Pollution During The Great London Smog, 1952
Smoke and sulphur dioxide pollution was monitored at various sitesin London at the time of the December 1952 smog. The dailyaverage measurements for 10 of these sites are given in Table 2.1.
Table 2.1: Pollution Concentrations, London, December 1951 & 1952
Source: Wilkins, 1954
Site and distance Mean Smoke (milligrams per cubic metre)from Charing Cross Dec. December 1952 (foggy days 5th -9th)(miles) 1952 2nd 3rd 4th 5th 6th 7th 8th 9th 10th
1. Lambeth (0.5) 0.43 0.49 0.61 0.49 2.64 3.45 4.46 4.46 1.22 1.22
2. Westminster (0.8) 0.34 0.38 0.38 0.52 1.93 2.40 1.20 1.20 1.44 0.48
3. Southwark (1.8) 0.44 0.78 0.85 0.49 1.44 3.95 2.66 2.66 3.95 0.68
4. City (2.0) 0.20 0.21 0.26 0.26 1.00 1.02 1.06 1.06 1.10 0.22
5. Greenwich (5.5) 0.34 0.18 0.36 0.36 0.99 1.09 2.06 2.06 0.95 0.19
6. Chiswick (6.0) 0.20 0.21 0.22 0.66 0.64 0.42 0.35 0.35 0.50 0.09
7. Leyton (6.3) 0.49 0.35 0.57 0.43 1.12 1.55 1.66 1.66 2.05 0.46
8. Woolwich (9.0) 0.43 0.27 0.79 0.41 1.47 1.62 3.28 3.28 0.92 0.26
9. Twickenham (11.3) 0.15 0.30 0.31 0.24 0.63 1.44 0.67 0.67 0.48 0.06
10. Hornchurch (15.5) 0.12 0.03 0.18 0.03 0.03 0.34 0.56 0.56 0.37 0.07
Sulphur dioxide (ppm)
1. Lambeth (0.5) 0.22 0.16 0.22 0.14 0.75 0.86 1.34 1.34 0.47 0.47
2. Westminster (0.8) 0.16 0.15 0.24 0.99 0.63 0.63 1.23 0.99
3. Southwark (1.8) 0.11 0.19 0.26 0.18 0.41 0.95 1.14 1.14 0.80 0.14
4. City (2.0) 0.17 0.12 0.19 0.19 0.62 0.72 0.80 1.22 1.21 0.22
5. Greenwich (5.5) 0.10 0.09 0.27 0.27 0.33 0.42 0.72 0.72 0.36 0.03
6. Chiswick (6.0) 0.09 0.05 0.02 0.07 0.34 0.85 0.31 0.31 0.17 0.02
7. Leyton (6.3) 0.11 0.06 0.12 0.09 0.25 0.29 0.62 0.62 0.64 0.17
8. Woolwich (9.0) 0.23 0.02 0.20 0.08 0.33 0.23 0.67 0.67 0.21 0.11
9. Twickenham (11.3) 0.07 0.66 0.21 0.23 0.32 0.89 0.57 0.57 0.14 0.02
10. Hornchurch (15.5) 0.07 0.02 0.08 0.03 0.17 0.14 0.34 0.34 0.19 0.05

ACE Information Programme aric
Urban Air Quality Teaching Pack: KS4 & A 16
Table 2.1 and Figure 2.1 show the dramatic increase in smoke andsulphur dioxide levels during the smog which occurred between 5thand 9th December. The mean levels for December 1951, whenthere was no fog, are given in Table 2.1 for comparison.
The Clean Air Acts, 1956 & 1968
The Government could not ignore the Great London Smog. TheClean Air Act was eventually introduced in 1956 following theBeaver Committee Report. This Act aimed to control domesticsources of smoke pollution by introducing smokeless zones. Inthese areas, smokeless fuels had to be burnt. The Clean Air Actfocussed on reducing smoke pollution but the measures takenactually helped to reduce sulphur dioxide levels at the same time.Air pollution in cities dramatically reduced in the following ways:
• domestic emissions reduced because of smoke control areas;
• electricity and gas useage increased and the use of solid fuelsdecreased;
• cleaner coals were burnt which had a lower sulphur content;
• use of tall chimney stacks on power stations;
• relocation of power stations to more rural areas;
• continuing decline in heavy industry.
Tall Chimneys
The Clean Air Act of 1968 brought in thebasic principle for the use of tallchimneys for industries burning coal,liquid or gaseous fuels. At the time of thislegislation it was recognised that smokepollution could be controlled but thatsulphur dioxide removal was generallyimpracticable. Hence, the higher the

ACE Information Programme aric
Urban Air Quality Teaching Pack: KS4 & A 17
chimney, the better the dispersal of the air pollution.
Urban Air Quality After The Clean Air Acts
Urban air quality improved following the Clean Air Acts. In particular,the smoke, grit and dust that arose from industrial and domesticsources due to coal burning had been controlled through theintroduction of smokeless zones and the controls imposed onindustries to reduce their particulate emissions. Fact File 2 providesan insight into air pollution in Manchester during the 1960s.
Levels of smoke and sulphur dioxide fell considerably in towns andcities during the 1960s and 1970s and levelled off during the 1980s.The success in reducing urban air pollution and the smogs of the
FACT FILE TWO
City: ManchesterPeriod: 1960sIndustries: Chemicals, light engineeringAir Pollution Facts: A survey of air pollution was carried out in
Manchester between 1961 and 1971, as part of anational survey.In 1962 it was noted that on the hills to the eastof Manchester ‘at times the smoke can be seencrossing the summits in a shallow layer at groundlevel, and a fresh fall of snow may be heavily soiledin 2 hours’.
Air Pollution Levels: Smoke and sulphur dioxide levels in central areasof Manchester were falling but were still higherthan all other regions in the North West. Theaverage smoke concentration during the winter of1964/65 for Manchester city centre was 248µgm-3
(micro grams per cubic metre of air) and for SO2
was 436µgm-3.
Sources: Longhurst & Mann, 1994 & Lewis, 1995

ACE Information Programme aric
Urban Air Quality Teaching Pack: KS4 & A 18
past was due to the introduction of the legislation, particularly theClean Air Acts. Figures for smoke and sulphur dioxide forManchester for the winters (October - March) between 1960 and1990 are shown in Table 2.2.
Table 2.2. Winter Smoke And Sulphur Dioxide Concentrations,Manchester 1960-1990
Source: Lewis, 1995
Winter (Oct-Mar) Manchester Centre North Manchester† South Manchester‡
Year Smoke SO2 Smoke SO2 Smoke SO2
All figures in microgrammes per cubic metre of air (µgm-3)
1960/61 326 481 n/a n/a n/a n/a1961/62 443 587 n/a n/a n/a n/a1962/63 401 543 628 576 423 3841963/64 294 385 341 269 236 2181964/65 248 436 386 351 199 2481965/66 161 344 174 267 118 2101966/67 140 345 129 243 95 1831967/68 135 395 90 252 95 1921968/69 156 391 178 271 98 1871969/70 116 307 152 235 67 149
1970/71 142 312 158 240 91 1671971/72 86 244 84 195 45 1181972/73 83 232 84 178 41 1301973/74 80 177 75 131 44 1091974/75 71 167 53 123 40 1181975/76 56 179 21 151 19 1191976/77 56 199 44 162 16 1161977/78 44 163 42 159 26 1161978/79 47 153 33 130 31 1131979/80 42 126 28 97 26 72
1980/81 24 91 17 88 17 771981/82 40 122 31 104 32 1001982/83 28 80 11 72 8 591983/84 32 78 25 67 27 661984/85 29 76 31 74 23 581985/86 26 59 23 60 21 561986/87 29 57 20 75 19 541987/88 24 59 15 71 13 571988/89 32 63 20 42 21 411989/90 25 58 17 43 19 51
† Crumpsall, approximately 3 miles north of city centre, ‡Withington, approximately 4 miles south of the city centre.
ACE Information Programme aric
Urban Air Quality Teaching Pack: KS4 & A 19
Exercises
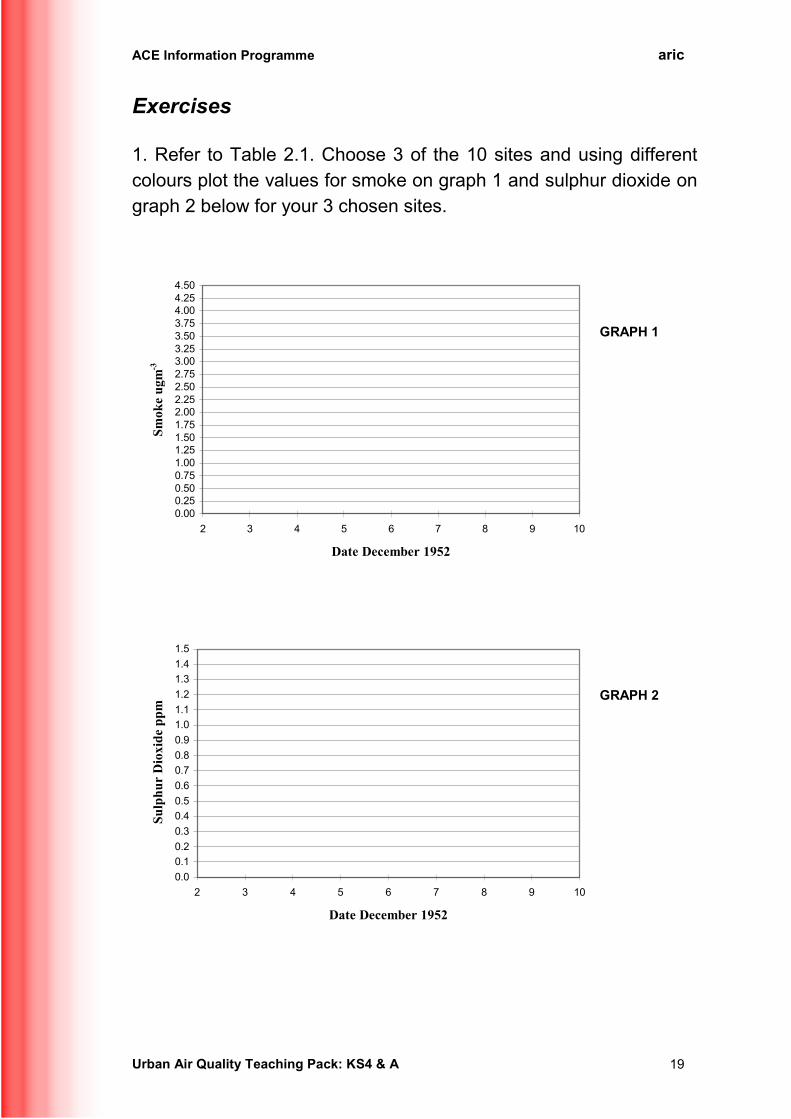
1. Refer to Table 2.1. Choose 3 of the 10 sites and using differentcolours plot the values for smoke on graph 1 and sulphur dioxide ongraph 2 below for your 3 chosen sites.
GRAPH 1
0.000.250.500.751.001.251.501.752.002.252.502.753.003.253.503.754.004.254.50
2 3 4 5 6 7 8 9 10
Date December 1952
Sm
oke
ugm
-3
GRAPH 2
0.0
0.1
0.2
0.3
0.4
0.5
0.6
0.7
0.8
0.9
1.0
1.1
1.2
1.3
1.4
1.5
2 3 4 5 6 7 8 9 10
Date December 1952
Su
lph
ur
Dio
xid
e p
pm

ACE Information Programme aric
Urban Air Quality Teaching Pack: KS4 & A 20
2. Charing Cross is in central London. List below the names of the 3sites that you have chosen for your graphs in Exercise 1 and theirdistance from Charing Cross (see Table 2.1).
Site Name Distance from Charing Cross
Refer to the graphs in exercise 1. Describe what the graphs show interms of highest pollution levels, occurrence of fog (5th - 9thDecember) and distance from central London.
3. Use a computer spreadsheet to produce a graph of the meansmoke and sulphur dioxide levels for all of the 10 sites given inTable 2.1.
4. You require an A4 sheet of graph paper for this exercise.Plot a graph to show the changes in smoke and sulphur dioxidelevels between 1960 and 1990 for one of the Manchester sites givenin Table 2.2. Write some comments about your graph and identifythe reasons for the change in air quality for this period.

ACE Information Programme aric
Urban Air Quality Teaching Pack: KS4 & A 21
Major Sources Urban air pollutants arise from a wide variety of sources although they are mainly a result of combustion processes. The largest source in most urban areas is motor vehicles and industry. The impact of transport on urban air quality will be looked at in more detail in Section 4, whilst the impact of industry will be studied in Section 5. Fact File 3 identifies some of the urban air quality issues today. These contrast quite significantly from those identified in Fact Files 1 & 2 in previous sections.
FACT FILE THREE
City: Manchester Period: 1990s Industries: Light engineering, commerce and financial enterprises. Air Pollution Facts: Several monitoring networks operate in Greater
Manchester to provide air quality data. A national monitoring site for urban pollutants is
located in the city centre. The main source of air pollution in Manchester is road
transport. Air Pollution Levels: Manchester city centre smoke and sulphur dioxide
concentrations for winter 1993/4 were 27 and 38 µg m-3
(microgrammes per cubic metre of air) respectively. The mean nitrogen dioxide (NO2) concentration for
Manchester in 1993 was 26ppb (parts per billion) and for carbon monoxide (CO) was 0.6 ppm (parts per million).
Sources: Longhurst & Mann, 1994; DOE, 1995 & Lewis, 1995

ACE Information Programme aric
Urban Air Quality Teaching Pack: KS4 & A 22
Major Urban Pollutants In most urban areas of the UK, traffic generated pollutants have become the most common pollutants; primarily nitrogen oxides, carbon monoxide, hydrocarbons and particulates. Some of these are emitted directly into the atmosphere (primary pollutants) whilst others are formed in the air as a result of chemical reactions (secondary pollutants). The main urban air pollutants and their sources are shown in Table 3.1.
Table 3.1. The Main Urban Air Pollutants. Source: DEFRA, 2001 Pollutant Main Sources UK (1996) Figures
Nitrogen oxides
Combustion of motor spirit and other fuel, combustion for domestic heating, power stations, industrial boilers, chemical processes etc.
Road transport 44% Power stations 21% Other industry 9%
Sulphur dioxide Fuel combustion for power stations, domestic heating, industrial boilers, diesel vehicles, waste incinerators.
Power stations 65% Other industry 10% Refineries 8%
Carbon monoxide Combustion of motor spirit and other combustion processes.
Road transport 69% Off-road sources 9% Domestic 5%
Ozone Secondary pollutant resulting from chemical reactions with nitrogen oxides and VOCs.
See NOx & VOCs.
Particulates Fuel combustion for power stations, transport, heating, other industrial processes.
Construction, mining, quarrying 13% Road transport 20% Power stations 10% Domestic 20%
Volatile Organic Compounds (VOCs)
Transport, oil combustion, chemical processes, solvent use, waste incinerators.
Road transport 27% Solvent use 27% Extraction & distribution of fossil fuels 15% Production processes 12%
Benzene Combustion of motor spirit, evaporation from petrol pumps and fuel tanks.
Road transport 71%
Lead Combustion of leaded petrol, coal combustion, metal production.

ACE Information Programme aric
Urban Air Quality Teaching Pack: KS4 & A 23
There are over 1500 sites across the UK which monitor air quality. They are organised into networks that gather a particular kind of information, using a particular method. The pollutants measured and method used by each network depend on the reason for setting up the network, and what the data is to be used for. There are two major types - automatic and non-automatic networks. Automatic Networks produce hourly pollutant concentrations, with data being collected continuously from individual sites by computer. The data go back as far as 1972 at some sites. Non-automatic Networks measure less frequently - either daily, weekly or monthly - and samples are collected by some physical means (such as diffusion tube or filter). These samples are then subjected to chemical analysis, and final pollutant concentrations calculated from these results. All the following pollutants are now automatically monitored at many urban sites across the UK. Oxides of Nitrogen (NOx) NOx is a term used to refer to two species of oxides of nitrogen: nitric oxide (NO) and nitrogen dioxide (NO2). The major sources of NOx in the UK are vehicles and power stations. Levels of NOx in urban areas vary significantly during the day, with peaks generally occurring with ‘rush hour’ traffic. Sulphur Dioxide (SO2) Sulphur dioxide is a colourless gas and is the principal pollutant associated with the problem of acid deposition. Power stations and industries are the main source of SO2 pollution in the UK. Sulphur dioxide monitoring is relatively extensive in the UK. A national monitoring survey for smoke and sulphur dioxide was set up in 1961. In 1982, the sites were reorganised to form the Basic Urban and EC Directive networks.

ACE Information Programme aric
Urban Air Quality Teaching Pack: KS4 & A 24
Carbon Monoxide (CO) Carbon monoxide is a gas which slowly oxidises in the atmosphere to CO2. The main source of CO in the UK is vehicles. Ozone (O3) Ozone is a secondary pollutant; there are no direct emissions of O3 to the atmosphere. Most ozone in the troposphere (lower atmosphere) is formed directly by the action of sunlight on nitrogen dioxide. As a result of the various reactions that take place, O3 tends to build up downwind of urban centres where most of the NOx is emitted from vehicles. Particulate Matter Particulate matter is a mixture of coarse and fine organic and inorganic substances, present in the atmosphere as both solids and liquids. Coarse particles have a diameter of more than 2.5 µm and fine particles less than 2.5 µm. Particles are often referred to as PM10 which means they have a diameter of less than 10µm. The main sources of particulates are industry, vehicles and domestic coal burning. Volatile Organic Compounds (VOCs) VOCs include a very wide range of individual substances, such as hydrocarbons, halocarbons and oxygenates. All VOCs are compounds of carbon and exist as atmospheric vapours. In comparison to other pollutants, the monitoring of VOCs is not yet well developed and there is no long term database of information. In June 1992 the Department of the Environment began to develop a small network known as the UK Hydrocarbon Monitoring Network. Hydrocarbons measured include benzene, xylene and toluene.

ACE Information Programme aric
Urban Air Quality Teaching Pack: KS4 & A 25
Benzene Benzene is a volatile organic compound, i.e. it readily evaporates. About 80% of human made emissions come from petrol fuelled vehicles. Benzene is monitored as part of the UK Government’s Hydrocarbon Monitoring Network. Lead (Pb) Lead is a bluish or silver-grey soft metal. In the context of air pollution, two of its most important compounds are used as ‘anti knock’ additives in leaded petrol. The concentration of lead emitted in the UK has fallen over recent years due to increasing use of unleaded petrol. Leaded petrol is no longer sold in the UK. Lead is monitored under five different networks in the UK. Lead has also been widely studied in the UK due to concern over health implications.

ACE Information Programme aric
Urban Air Quality Teaching Pack: KS4 & A 26
A Case Study of Air Pollution in London Today GEOGRAPHY Location: Situated in the south east of England on the banks of the River Thames, 65 km west of its estuary on the North Sea. Area: 1 579 km2
Altitude: 5m above sea level. DEMOGRAPHY Population: (1998) 7.2 million - Greater London. CLIMATE Rainfall: Mean annual precipitation is 597mm. Temperature range: 5.5 -18.1°C. London causes a noticeable urban heat island effect, showing typical temperatures of 2-3°C higher than in the surrounding rural areas. TRANSPORT Motor Vehicle Registrations: 2,845,700 (2001). Air Transport: There are two airports located within the Greater London area and a number of heliports, the largest and busiest being at Battersea. Total number of passengers (2000): Heathrow: 64,279,000
INDUSTRY London is one of the most important banking and commercial centres in the world. Until the 1960s it was also an important port. However, changes in working practices and a decrease in Britain’s manufacturing base led to the closure of most of the docks, although a few wharves remain in operation. The industries which were associated with the docks have tended to relocate out of London. Some major industrial areas still exist in the east, along the Thames, whilst smaller industrial areas are located to the north along the River Lea, in the west along the Grand Union Canal and to the south in Croydon. Power generation is mainly from gas and oil fired power stations located in the outer area of Greater London. During the second half of the 20th century emissions from motor vehicles have become increasingly important in terms of affecting air quality in London.
ACE Information Programme aric
Urban Air Quality Teaching Pack: KS4 & A 27
It is estimated that road traffic in London has roughly doubled over the past 25 years, yet the road area has increased by only 10 percent over the same period. Such growth in traffic has resulted in increased emissions of CO, NO and secondary pollutants such as NO2 and O3. The increasing level of traffic is also likely to offset any reductions in NOx and CO emissions brought about by the introduction of MOT exhaust emission tests and catalytic converters. Petrol engined vehicles already account for the vast majority of CO emissions into London’s atmosphere, and under certain weather conditions London-wide episodes of elevated CO levels occur. Indeed, in 1989 the WHO eight-hour guideline for CO was exceeded on 27 days at the central London background air quality monitoring station (Bell, 1993). More recently, however, concentrations of CO in London have fallen due to improved engine technology and lower emissions. Air transport also has a small impact on air quality in London. The most significant pollutant emissions from London’s airports are CO, NOx and hydrocarbons. Heathrow airport accounts for 6%
of the total NOx emissions in Greater London and 2% of Greater London’s total CO emissions. London’s enormous size and energy use mean that it still experiences sulphur levels higher than many European cities, the main source of sulphur pollution in London being from power stations. These emissions often descend on London with light easterly winds; conditions usually responsible for the worst SO2 episodes in Greater London. The main sources of air pollutants in London are shown in Table 3.2, clearly identifying transport as the principle polluter in the city. Smoke levels have decreased dramatically in London over the past century. This has led to increased sunlight levels resulting in the photo-oxidation of urban air pollutants known as photochemical smog. The NOx and VOC gases that contribute to these smogs mainly arise from motor vehicles. Ground level ozone has become an increasing problem in London in recent years. In hot, sunny conditions ozone concentrations in excess of WHO guidelines

ACE Information Programme aric
Urban Air Quality Teaching Pack: KS4 & A 28
frequently occur in central London (Brimblecombe, 1987). The highest pollutant levels in London are most commonly experienced during the autumn months. This is due to the typical high pressure over the south-east of England, which results in light winds and thus less dilution of air pollution (WHO, 1992). Temperature inversions also cause a problem in the city, trapping emissions and preventing them from dispersing into the upper atmosphere. In the early 1990s the London Air Quality Network was set up - see website at: http://www.erg.kcl.ac.uk/london/asp/home.asp The UK Government also improved access to air quality information by setting up a freephone number, and providing details on teletext and the Internet at: http://www.airquality.co.uk/ A comparison of emissions at a kerbside and a background monitoring site are shown in Tables 3.3 and 3.4. In general, higher concentrations are recorded at the kerbside site,
whilst background levels are more representative of the average levels of human exposure in the city. The introduction of the UK National Air Quality Strategy in 1997 (DETR, 1997) is aimed at improving air quality in the UK. Standards and objectives for all of the main urban pollutants have been set to ensure that urban air quality improves in future years. CONCLUSIONS The air quality in London has undergone changes in the last few decades, due mainly to the decline in industrial and domestic sources of pollution in the city and the increase in vehicular pollution. The consequence of this is the move from thick, dense smogs to photochemical smogs. The introduction of the UK National Air Quality Strategy and greatly increased access to information on air quality in the late 1990s should lead to an improvement in urban air quality in London. However, to achieve the air qualiy objectives set in the Stratgy, there will be a need to be a dramatic shift in transport use in London, from cars to public transport.

ACE Information Programme aric
Urban Air Quality Teaching Pack: KS4 & A 29
Table 3.2. Sources of the Main Air Pollutants in London, 1991
SOURCE Carbon dioxide (as carbon)
Sulphur dioxide
Black smoke
Carbon monoxide
Nitrogen oxides
Road Transport 33 22 96 99 76 Other Transport 3 1 2 1 4 Electricity Gen. 2 0 0 0 1 Other Industry 13 43 1 0 5 Domestic 30 1 0 0 6 Other 19 32 2 0 8 Total emissions (000 tonnes)
8503 26 19 648 137
Source: London Research Centre, 1993
Table 3.3. Concentrations of Major Air Pollutants in London, (Cromwell Road Kerbside Site), 2001
POLLUTANT Annual mean
Max. hour concentration
Air Quality Strategy objectives
Ozone n/a n/a 50ppb (8 hour mean)
Nitrogen dioxide
39.8 ppb 107 ppb 105ppb (hourly mean) Exceeded once in 2001, max allowed 18.
Carbon monoxide
1.0 ppm 4.7ppm (max 8hr 3.5 ppm)
10ppm (8 hour mean)
Sulphur dioxide
2.7 ppb 25 ppb 132 ppb (1 hour mean)
Source: NETCEN

ACE Information Programme aric
Urban Air Quality Teaching Pack: KS4 & A 30
Table 3.4. Concentrations Of Major Pollutants in London, (London Brent Background Monitoring Site), 2001
POLLUTANT Annual mean
Max. hour concentration
Air Quality Strategy objectives
Ozone 18.6 ppb 91 ppb (max 8hr 76 ppb)
50ppb (8 hour mean) Exceeded on 21 days (max. allowed 10 days)
Nitrogen dioxide
19.1 ppb 79 ppb 105ppb (hourly mean)
Carbon monoxide
0.3 ppm 6.1 ppm (max 8hr 3.5 ppm)
10ppm (8 hour mean)
Sulphur dioxide
1.6 ppb 27 ppb 132 ppb (1 hour mean)
Source: NETCEN NB In tables 3.3 and 3.4, concentrations are given in parts per billion (ppb) and parts per million (ppm). If you wish to compare these with others given in this pack, you can use the conversion figures below:
Pollutant gas ppb to µg m-3 multiply by Ozone
2.00
Nitrogen Dioxide
1.91
Nitric Oxide
1.25
Carbon Monoxide
1.16 (ppm to mgm-3)
Sulphur Dioxide
2.66

ACE Information Programme aric
Urban Air Quality Teaching Pack: KS4 & A 31
Exercises 1. In your own words write a summary of the air quality in London
today. 2. Telephone the Department for Environment, Food & Rural Affairs'
freephone number: Find out what levels of pollutants have been monitored in London today. Alternatively, this information is available on: How was the air quality described for London?
Low Moderate High Very High
What levels of nitrogen dioxide (NO2), sulphur dioxide (SO2), ozone (O3) and carbon monoxide (CO) were recorded? (All in parts per billion - ppb except CO in parts per million - ppm).
0800 556677
TELETEXT pages 155 & 169 or the Internet:
http://www.airquality.co.uk/

ACE Information Programme aric
Urban Air Quality Teaching Pack: KS4 & A 32
Site NO2 SO2 O3 London Bexley London Southwark Sutton roadside

ACE Information Programme aric
Urban Air Quality Teaching Pack: KS4 & A 33
Introduction In most urban areas of the UK transport is the largest source of air pollution, particularly for emissions of carbon monoxide, particulates (including black smoke), nitrogen oxides and hydrocarbons. The emissions of pollutants from road traffic in the UK for 1999 are summarised in Table 4.1.
Table 4.1. Emissions From Road Traffic in the UK, 1999
Pollutant Emissions (000 tonnes)
% of total UK Emissions
Carbon Monoxide (CO) 3,293 69 Black Smoke 130 48 Nitrogen Oxides (NOx) 714 44 Volatile Organic Compounds (VOCs) 473 27 Carbon Dioxide (CO2) 31,200 22 Sulphur Dioxide (SO2) 12 1
Source: DEFRA, 2001
Road transport is an important source of the precursor pollutants that lead to the formation of ground level ozone. This is particularly problematic during periods with long hours of bright sunlight, temperatures above 20°C and light winds. Recently there has been concern over emissions of benzene (a hydrocarbon) as it can cause cancer. The major source of benzene in the atmosphere is the combustion and distribution of Bengt Good

ACE Information Programme aric
Urban Air Quality Teaching Pack: KS4 & A 34
petrol; approximately 70% of benzene emissions are from petrol fuelled cars. In recent years there has been a large increase in the number of vehicles in the UK which has been overshadowed by the even greater increase in vehicle usage. For example, between 1980 - 2000, vehicle ownership in the UK increased by about a third to approximately 29 million vehicles. However, vehicle usage during the same period increased by 70% to 460 billion vehicle kilometres. This was reflected in increases in vehicle related pollutant emissions. Transport related pollution is likely to become increasingly important in the future as vehicle numbers and usage are expected to continue to rise.
Reducing Air Pollution From Road Traffic There are many ways in which road traffic pollution can by reduced. including restriction of traffic, technological solutions and changes in people’s travelling behaviour. Many of these measures are only effective if they are carried out alongside other methods of pollution reduction. Therefore it is important that a balanced plan is made for reducing air pollution which includes several actions.
ACE Information Programme aric
Urban Air Quality Teaching Pack: KS4 & A 35
In recent years there have been substantial developments in thetechnology and design of cars which are aimed at reducing theemissions of air pollutants. Some of these are outlined below.
Catalytic Concerters
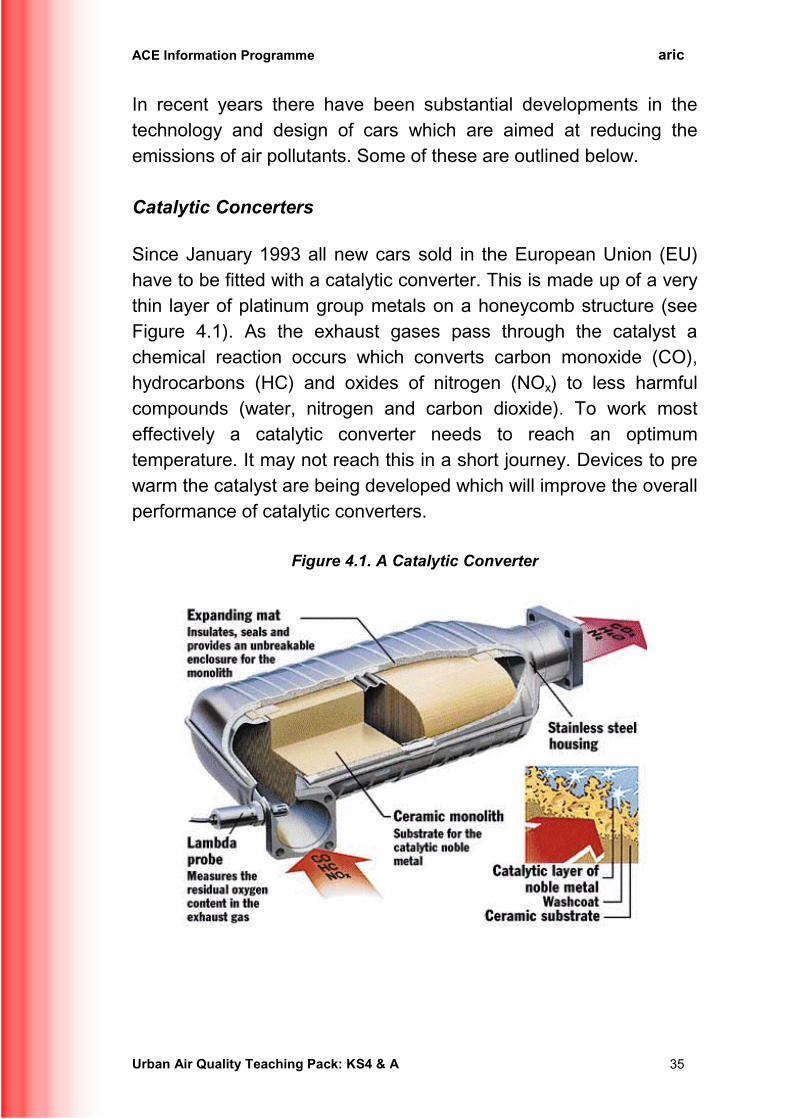
Since January 1993 all new cars sold in the European Union (EU)have to be fitted with a catalytic converter. This is made up of a verythin layer of platinum group metals on a honeycomb structure (seeFigure 4.1). As the exhaust gases pass through the catalyst achemical reaction occurs which converts carbon monoxide (CO),hydrocarbons (HC) and oxides of nitrogen (NOx) to less harmfulcompounds (water, nitrogen and carbon dioxide). To work mosteffectively a catalytic converter needs to reach an optimumtemperature. It may not reach this in a short journey. Devices to prewarm the catalyst are being developed which will improve the overallperformance of catalytic converters.
Figure 4.1. A Catalytic Converter
ACE Information Programme aric
Urban Air Quality Teaching Pack: KS4 & A 36
The use of catalytic converters leads to a dramatic reduction in theemissions of CO, HC and NOx. However, they also result in anincrease of CO2 emissions which do not cause a problem for urbanair quality but do contribute to global warming.
Lean Burn Engines
Lean burn engines are more fuel efficient than other engines andproduce less NOx and CO, but they do emit higher levels ofhydrocarbons. At the present time they are still under developmentand have not yet been able to meet EU emission standards,especially at high speeds.
Exhaust Gas Recirculation
This involves returning exhaust air to the air fuel inlet, which resultsin a reduction in peak engine temperatures and emissions of NOx
gases from petrol vehicles. Levels of CO and HC are also reduced.
Alternative Fuels
Fuels to replace the more polluting traditional fuels are also beingpromoted as a method for reducing emissions from road transport.The main alternative fuels that have been developed to date include,natural gas, liquefied petroleum gas, hydrogen, alcohol fuels andbattery operated vehicles.
Whilst technical fixes such as those outlined above may providecleaner air for the next 10 - 15 years, they do not represent a longterm solution to transport related urban air pollution. They need tobe combined with planning and policy measures which balance theneed for people to travel with a reduction in urban air pollution.These measures will be discussed in the role play that follows.(They are also examined in lesson 7, which may provide usefulbackground information for the role play.)
ACE Information Programme aric
Urban Air Quality Teaching Pack: KS4 & A 37
Role Play Exercise
The aim of this exercise is to promote a discussion of the variousissues that arise when planning decisions need to be made. Theemphasis of the discussion should focus on the effects of thetransport plan on the quality of the air. A teacher will therefore needto chair the role play discussion to ensure that each group hasopportunity to put foward their opinions and that an orderlydiscussion follows.
Instructions:
1. Divide the class into 6 groups and give each group a role playcard:
Group 1) Suburban CommutersGroup 2) Friends of the EnvironmentGroup 3) Northshire Retailers AssociationGroup 4) Northshire City Centre Residents GroupGroup 5) Health Protection SocietyGroup 6) Goods R Us
2. Each group should be given a copy of the backgroundinformation (pages 38-41). These should be read by allparticipants along with the role card and any extra information.
3. Each group should discuss the proposed measures in thetransport plan and decide their views on each of the proposals,choosing which measures (if any) they wish to support.Groups may also suggest ideas of their own to be included inthe plan. Notes should be made by each group on theirsupport or rejection of the proposed transport plan, statingalternative proposals where appropriate.

ACE Information Programme aric
Urban Air Quality Teaching Pack: KS4 & A 38
4. Each group should present their case to the meeting,explaining the reason for their decision.
5. After each group has presented their views the other groupsshould raise questions about their decisions and discussopposing views in the transport debate. The teacher shouldchair this debate.
6. Once the discussion has ended the class should vote on themeasures that have been proposed, to reach agreement onwhat the Council’s transport plan should include.
Role Play Exercise Background Information
Northshire City
Population: 300 000
Industry:There is a small industrial area to the north of the city. The othermain area of employment is the business district, which containsmany service related businesses and commercial ventures, locatedto the west of the city.
Transport: car ownership is high (many households have one or more cars); commuting from the residential areas is very common (mostcommuters live in the suburbs of Northshire);
cycle routes exist to the south of the city; local rail services operate to some parts of the suburbs; car parking in the city centre is heavily subsidised.
The Northshire City Council is preparing a transport plan for the city.They are holding a public meeting to get ideas from local people andinterest groups that will be affected by the plan.

ACE Information Programme aric
Urban Air Quality Teaching Pack: KS4 & A 39
Details have been produced to introduce each of the possiblemeasures which could be included in the transport plan. Theseinclude pedestrian areas in the city centre, improving publictransport, a park and ride scheme, a parking policy and road pricing,details of which are as follows:
Pedestrianisation Of The City Centre
all vehicles to be banned from the central area of the citybetween 11am and 4pm, with exemptions for disabled people(permits to be issued) and certain delivery services;
areas surrounding the pedestrianised zone are to have widenedpavements and reduced road area, with lower speed limits todiscourage through traffic;
bus corridors will be introduced to allow access for publictransport;
lighting, security cameras and seating are to be improved.
Improving The Public Transport Network
Improvement of information about services;
improvement of facilities at stations to provide a clean, safe andattractive environment;
bus lanes to the city centre to be introduced with strictenforcement of parking / driving restrictions in the lanes;
bus only corridors through pedestrianised areas;
improvement of links between bus and train services;

ACE Information Programme aric
Urban Air Quality Teaching Pack: KS4 & A 40
increased frequency and reliability of services;
extension of network to areas currently lacking public transport;
improved night services;
increased range of saver tickets;
improved facilities for disabled persons.
Park and Ride Scheme
4 000 free parking spaces to be provided at two bus terminalsand two train stations in different parts of the suburban area;
fixed low cost fares to the city centre;
bus routes to the city centre from various suburban locationsevery 5 minutes (peak times) and 10 minutes (other times);
bus routes to the business park as above (same frequency);
services stop at railway stations, bus stations, majoremployment areas in city centre and city tourist attractions.
Parking Policy
number of parking spaces in city centre to be reduced andconcentrated in car parks;
parking costs to be increased;
all street parking to be scrapped;

ACE Information Programme aric
Urban Air Quality Teaching Pack: KS4 & A 41
strict enforcement of parking restrictions on bus and cycle lanes.
Cycling Policy
new developments must provide on site parking for cycles;
increase in the number of cycle parking spaces in the city,especially outside large businesses, railway and bus stations,public amenities etc.;
more cycle lanes in the city centre to be introduced, space to betaken from the road, not the pavement;
extra time to be allowed at traffic signals for cyclists;
public awareness campaign to provide information about cyclingin the city.
Road Pricing
drivers to be charged using pre-paid cards (similar to phonecards) for travel in the city zone between 0600 and 1700 hours,Monday to Saturday;
exemptions for disabled drivers, taxis and public transport;
the funds collected will be used to finance improvements to thetransport networks, public transport and other transport relatedschemes. Charges will be higher at peak periods of the day andwill be different for various types of vehicle. Charges will also beincreased during periods of poor air quality.

ACE Information Programme aric
Urban Air Quality Teaching Pack: KS4 & A 42
ROLE CARD: GROUP 1
SUBURBAN COMMUTERSYou are a group of people who work in the business park and drive into thecity centre in your cars. You enjoy the freedom that you get from drivingand think that buses / trains are crowded, uncomfortable, dirty andinefficient, You also think that something should be done to reduce thecongestion on the roads into the city.
Points to consider:• cost of travelling;• changes that would make you use public transport;• personal freedom;• door to door driving;• journey time.
ROLE CARD: GROUP 2
FRIENDS OF THE ENVIRONMENTFriends of the Environment are an international pressure group who campaignon a wide range of environmental issues. Air pollution from transport is oneof their major campaign areas. Friends of the Environment are a non-governmental organisation..
Supplementary notesMotor vehicle emissions have an impact on various areas of the environment:vegetation, freshwater, buildings, etc. The principle pollutants emitted fromvehicles which cause damage to the environment are oxides of nitrogen andsulphur dioxide. Other exhaust gases called hydrocarbons can react withnitrogen oxides to form ozone. This process results in photochemical smog.
Motor vehicle emissions can contribute to the erosion and soiling ofbuildings. Air pollution from vehicles also affects health; some of thepollutants are known to be carcinogenic. The number of private cars in GreatBritain continues to rise each year at a very fast rate.

ACE Information Programme aric
Urban Air Quality Teaching Pack: KS4 & A 43
ROLE CARD: GROUP 3
NORTHSHIRE RETAILERS ASSOCIATIONThe Northshire Retailers Association campaign about issues that affect shopowners in the city. They represent the views of a range of retailers, bothlarge and small. They want to see a reduction in air pollution in the city butare worried that preventing traffic from entering the city centre will lead toa decline in trade.
Points to consider:• how a reduction in traffic could have an impact on city centre businesses• would pedestrianisation be beneficial?• the impact of a restriction on delivery times• would travel by public transport encourage or discourage shoppers, e.g.
those with young children, the elderly, weekend shoppers (weekdayworkers), those with heavy / bulky items to purchase?
ROLE CARD: GROUP 4
NORTHSHIRE CITY CENTRE RESIDENTS GROUPThe Northshire City Centre Residents Group provide a forum for residentsof the city centre to discuss issues that affect them in the city. They arecampaigning for cleaner air in the city and want safe, traffic-free pedestrian/ cycle routes which provide access to shops, employment, schools and localamenities.
Points to consider:• which proposals would be of most benefit for local residents?• other ideas to improve the environment of the city?

ACE Information Programme aric
Urban Air Quality Teaching Pack: KS4 & A 44
ROLE CARD: GROUP 5
HEALTH PROTECTION SOCIETYThe Health Protection Society is a local group that aims to promoteinformation about the impacts of pollution on health and campaigns for theintroduction of measures to reduce air pollution in towns and cities.
Supplementary notesAir pollution can affect human health, ranging from slight feelings ofdiscomfort to major respiratory problems. This may be caused by a singlepollutant or the combined effect of a number of pollutants. People most atrisk from air pollution are children up to and including the age of 14 (withchildren under 5 most at risk), asthma sufferers, the elderly, pregnant womenand unborn babies, as well as those taking vigorous exercise and peoplesuffering from pre-existing conditions such as heart or circulatory diseaseand reduced breathing capacity. The effects of various air pollutants onhuman health are outlined in Table 6.1 in Lesson 6 of this pack.
Concentrations of pollutants such as carbon monoxide, nitrogen oxides andlead are higher inside cars than background levels. Emissions of carbonmonoxide and hydrocarbons are higher in congested slow moving traffic andpeak during the morning and evening rush hours.
ROLE CARD: GROUP 6
GOODS R USYou are a goods distribution / courier firm who are based in the outskirts ofNorthshire and deliver to businesses throughout the city. Heavy traffic atpeak times often causes delays to urgent deliveries. You believe that it isimportant for you to be able to reach any address in the city at any time ofthe day and therefore have access to all customers.
Points to consider:• how would road closure and road pricing affect business?

ACE Information Programme aric
Urban Air Quality Teaching Pack: KS4 & A 45
Follow Up Work
Look out for reports about air pollution and transport in your localnewspaper.
Does your local town or city have any of the measures discussedin the role play? If so, do you think they are effective?
Do you think that transport causes an air pollution problem inyour nearest town / city?
How do the people in your family travel into your local town?Could this way of travelling be changed to reduce the emissionsof air pollutants from this mode of travel?

ACE Information Programme aric
Urban Air Quality Teaching Pack: KS4 & A 46
Air Pollution from Industries in the UK Industries contribute significantly to the air pollution problem in the UK. Lessons 1 and 2 have identified that during the Industrial Revolution industries were often located in urban areas. Following the Clean Air Acts and with the decline of heavy industry, few large industries are located in towns and cities today. Many large industries and power stations are now located in more rural areas of the UK. However, most urban areas have some smaller industries and possibly a power station. The larger industrial sources, even though located out of town, also have an impact on urban air quality. Industrial Smoke Pollution Smoke pollution can be defined as particulate material smaller than 15µm in diameter which arises from the incomplete combustion of fuel. Estimates for emissions of smoke in the UK for 1999 identify that power stations account for 5% of UK emissions and other industries for 3%. The significant sources of smoke pollution are therefore not industries but rather vehicles (48%) and domestic sources (29%). In the past, urban air pollution was dominated by thick black smoke which was emitted from industries and power plants burning coal. Levels of smoke in cities and towns during the wintertime in particular were at much higher concentrations than those measured today. Table 2.2 in Lesson 2 shows that in the early 1960s, winter smoke concentrations in central Manchester averaged at more than 250 µgm-3. Today, the typical urban annual mean for smoke is 10-40 µgm-3. The reason for this has been due to technical air pollution control, the decline in the use of coal for domestic purposes and the

ACE Information Programme aric
Urban Air Quality Teaching Pack: KS4 & A 47
general shift of power stations and industries from town and city centres to more rural locations. Industrial Sulphur Dioxide Pollution Industries are the major source of the UK sulphur dioxide pollution, as identified in Figure 5.1. Power stations and all other types of industry account for 90% of all UK SO2 pollution. Most industries and power stations are now located in rural areas but urban areas often lie in the prevailing wind path of these industries.
Source: DETR (2001) Sulphur dioxide, along with smoke, are both pollutants which have long been associated with urban air pollution. As a consequence of the Clean Air Acts, SO2 levels have fallen dramatically in urban areas. This gives a misleading picture of SO2 pollution in the UK because whilst levels in urban areas may have reduced to an annual
Figure 5.1 Sources of Sulphur Dioxide Pollution in the UK. (1999)
65%6%
12%
10%
3% 4%Power StationsDomestic & CommercialRefineries, Iron & SteelOther IndustryTransportOther

ACE Information Programme aric
Urban Air Quality Teaching Pack: KS4 & A 48
mean concentration way below 100µgm-3, coal burning industries and power stations still emit large quantities of SO2 into the atmosphere via their tall chimney stacks. Small industries located within urban areas may greatly affect local SO2 levels as their emissions may become trapped by temperature inversions in the urban environment. Sulphur dioxide pollution is one of the main pollutants that causes acid rain when it combines with water in the atmosphere to form sulphuric acid. Because the main source of SO2 in the UK is industry, industries are therefore major contributors to rainfall acidity. Acid rain affects urban areas by causing faster erosion of certain building materials, and it can cause damage to urban vegetation. Industrial Oxides of Nitrogen Pollution Power stations contribute significantly to the total emission of nitrogen oxides in the UK. In 1999, 21% of NOx came from this source and a further 13% arose from other industries, iron and steel and refineries. Figure 5.2 shows the major sources of NOx pollution in the UK to be road transport and power stations. Whilst the majority of NOx emissions arise from road transport, the contribution of industrial NOx pollution is still important. Nitrogen oxides are also converted into nitric acid when combined with water in the atmosphere, hence, like SO2, contributing to acid rain.

ACE Information Programme aric
Urban Air Quality Teaching Pack: KS4 & A 49
Source: DEFRA (2001)
Other Industrial Pollutants Industries do not emit large quantities of the other major urban air pollutants. The UK contribution of power stations and industries in 1999 for carbon monoxide was 3% and for volatile organic compounds (hydrocarbons) was negligible.
Figure 5.2: Sources of Nitrogen Oxide Pollution in the UK. (1999)
21%
6%
4%
9%54%
6%Power StationsDomestic & CommercialRefineries, Iron & SteelOther IndustryTransportOther
ACE Information Programme aric
Urban Air Quality Teaching Pack: KS4 & A 50
Exercise 1. Carry out fieldwork in your locality to gain information on possible
air pollution problems that may occur in the area around your school / college. Look out for sources of air pollution such as industries and major roads, and for historical buildings, vegetation, densely populated areas which may be subject to the effects of air pollutants.
2. Devise a questionnaire of approximately ten questions in an
attempt to discover how local residents feel about the quality of air where you live. You could include questions based on your fieldwork, which may include:
• = particular industries or busy roads that are located in your
area;
• = concerns about the effects of air pollution on health, buildings, vegetation;
• = attitudes on increasing use of vehicles. 3. Conduct as many questionnaires as you can on members of
your family, friends or neighbours. 4. Write a short report on the general conclusions that you have
obtained from your questionnaire surveys.

ACE Information Programme aric
Urban Air Quality Teaching Pack: KS4 & A 51
Human Health & Air Pollution
As individuals we all depend on clean air and there is little doubt thatpolluted air is detrimental to health, especially to the respiratorysystem. The effects of air pollution can range from slight feelings ofdiscomfort to major breathing difficulties and even death. Forexample, high concentrations of SO2 and smoke were responsiblefor increased mortality rates during the smogs of the 1950s asdescribed in lessons 1 & 2.
Individual responses to a given concentration of air pollution aredependant upon a number of factors:
Age & Health
Children up to the age of 14, and particularly children under 5 yearsold, are susceptible as pollutants are quickly absorbed into the body.Also the elderly and those with respiratory ailments are more at risk.Asthma sufferers are especially sensitive and attacks may betriggered by raised pollution levels.
• age & general health of the individual;• type of pollutant;• activity being undertaken when exposed to air pollution;• concentration and length of exposure to the pollutant.

ACE Information Programme aric
Urban Air Quality Teaching Pack: KS4 & A 52
Type of Pollutant
Adverse human health effects may be caused by a single pollutantor the synergistic effect, the acting together, of a number ofpollutants.
Individual pollutants have differing effects on human health, forexample carbon monoxide, when entering the body, displaces theoxygen in the bloodstream and thus reduces the oxygen carryingcapacity of the blood. This leads to oxygen starvation which canresult in headaches and vomiting, can cause an individual tocollapse and ultimately can lead to death. Table 6.1 summarises themain effects of air pollutants on health. There are also concernsabout the ‘cocktail’ or mix of pollutants in urban air although little isknown to date about the health effects of a combination ofpollutants.
Activity and Exposure to Pollutants
Individuals taking vigorous exercise, especially close to sources ofpollution (e.g. jogging along a main road), may also be at risk frompollution. When taking exercise increased amounts of inhaled airenters the body and as a result pollutants are inhaled deep into thelungs.

ACE Information Programme aric
Urban Air Quality Teaching Pack: KS4 & A 53
Concentration and Length of Exposure to Pollutants
Effects of pollution on human health are dependent upon both theduration of exposure and the concentration of the pollutant. In orderto protect human health there are different air quality standards andguidelines for differing averaging times. For those pollutants forwhich long term exposure is significant, air quality guidelines andstandards are based on pollution concentrations over long timeperiods i.e. annually, while those pollutants for which short termexposure is important guidelines and standards are based onbetween 10 minutes exposure to 24 hours.
Table 6.1: The Effects of Air Pollution on Human Health
Pollutant Effects on human health
Sulphur dioxide (SO2) Can cause respiratory problems, leading tochronic bronchitis, can cause narrowing of theairways and can affect asthmatics.
Carbon monoxide(CO)
Interferes with blood’s capacity to absorb andcirculate oxygen. Worsens emphysema,chronic bronchitis and other lung disease. Canaffect those suffering from heart disease andcan have impacts on the central nervoussystem.
Nitrogen dioxide(NO2)
Can cause respiratory disorders such asaltered lung function, lung tissue damage,increased prevalence of acute respiratoryillness. Young children and asthmatics aremost at risk.
Ozone (O3) Can aggravate chronic respiratory diseasesand can cause permanent lung damage. Canaffect the eyes, nose and throat, as well ascausing chest discomfort, coughing andheadaches.

ACE Information Programme aric
Urban Air Quality Teaching Pack: KS4 & A 54
Benzene (C6H6) Can cause cancer, anaemia and injury to bonemarrow.
Lead (Pb) Can cause mental retardation, drowsiness andproblems with the kidneys and reproductionsystem. Long term exposure interferes withnormal development and functioning of thebrain.
Particulates(PM10)
Can cause acute respiratory disorders anddecrements in lung function and can lead topremature death.
Volatile organiccompounds(VOCs)
Health effects are dependent upon the specificVOC, however a number of VOCs are knownor suspected to cause cancer.
Buildings & Air Pollution
It is widely acknowledged that high concentrations of sulphur dioxidepose a threat to building materials. However, despite the reducedlevels of SO2, damage to buildings is still evident. This could becaused by increased concentrations of ozone and nitrogencompounds within the urban environment. Experiments carried outhave shown that a combination of pollutants, i.e. ozone, nitrogendioxide and sulphur dioxide corrode stone faster than they wouldseparately.
An important issue associated with urban air pollution is the soilingof buildings. Urban areas are increasingly becoming congested, andas such smoke and other airborne particles from predominantlydiesel-engined vehicles have now taken over from coal smoke asthe major cause of blackening of building surfaces. Soot and otherairborne particles can also combine with pollutants to increase theerosion damage to buildings.

ACE Information Programme aric
Urban Air Quality Teaching Pack: KS4 & A 55
Urban Vegetation
Within the urban environment there are trees, hedgerows andherbaceous plant species found in public parks, along roadsides, inprivate gardens and allotments. Prior to the Clean Air Act of 1956few species were able to grow and thrive within towns and cities.However, today a greater diversity of species can be found,although this diversity is being threatened by pollutantspredominantly from motor vehicles.
Air quality in urban areas is a major factor influencing growth ofurban vegetation. Some studies have shown that crops and plantswhich have been planted along major routes from suburban areas tocity centres show poor growth rates nearer they city. It is however,difficult to single out the effect from any one single pollutant, andplant deterioration is probably a result of a mixture of airbornepollutants. However, high ozone levels have shown deterioration ofplant species in a number of studies.
A number of plant species, particularly those with short leaves suchas spinach and clover, are sensitive to ozone, and visible damagemay become evident after a short exposure. Whilst there is nodetailed knowledge of the effects of ozone on plant species, it hasbeen assumed that the damage to the cell structure is a result ofozone penetrating into the stomata. This can also disturb thefunctioning of the stomata and thus upset the plant’s moisturebalance.

ACE Information Programme aric
Urban Air Quality Teaching Pack: KS4 & A 56
Exercise: Crossword
3 4
1 2
5
6
7
8
9 10
11
12
13
14 15
16
17
18
Crossword Clues
Across1) Type of fuel - not petrol (6)3) Young humans affected by pollution (8)
5) Pollution damages this and makes you ill (6)6) Mixture of gases essential for life (3)7) This gas is created during photochemical smogs (5)
8) A disease which causes breathing difficulties (6)11) Certain air pollutants do this to buildings and metals (7)
12) Mix of pollutants (8)15) Pollutants corrode these (9)
16) Shrubs, plants and trees make up this (10)17) Airborne particles (5)
18) Type of cancer caused by benzene (9)
Down2) Major chemical which causes acid rain (7,7)3) Legislation to prevent smog (5,3,3)
4) NO2 and NO are these (8,6)9) A chemical which displaces oxygen in the blood
(6,8)10) Opposite of exhale (6)
13) Respiratory organs (5)14) Invisible constituents of air (5)

ACE Information Programme aric
Urban Air Quality Teaching Pack: KS4 & A 57
Answers to Crossword
C H I L D R E N
D I E S E L L I
U H E A L T H T
L A A I R
P O Z O N E O
A S T H M A A G
U C I I E
C O R R O D E A R N N
D R A H O
I B C A X
O C O C K T A I L I
X N E D
I M L E
D G O B U I L D I N G S
V E G E T A T I O N N
S O G
E X S M O K E
S I
D
L E U K A E M I A

ACE Information Programme aric
Urban Air Quality Teaching Pack: KS4 & A 58
The Government’s Response The UK National Air Quality Strategy published by the Government in 1997 (and updated in 2000) sets air quality standards and guidelines for key pollutants: The standards and objectives set in the Strategy are based on the effects on human health and have been set at levels similar to those adopted by the World Health Organisation and the European Union. Through the Environment Act 1995, the Government has legislated a new framework for local air quality management, based on local air quality management areas. As a result the responsibility of meeting the new standards and targets will fall with the local authorities. The local authorities will therefore be required to:
• = sulphur dioxide • = nitrogen dioxide • = carbon monoxide
• = benzene • = 1,3-Butadiene
• = particles • = lead
• = ozone

ACE Information Programme aric
Urban Air Quality Teaching Pack: KS4 & A 59
• periodically review air quality in their local area;
• establish air quality management areas in sectors of theirauthority where air quality targets are unlikely to be met;
• prepare plans for remedying air quality problems in the identifiedair quality management areas;
• co-ordinate activities which will influence air quality improvement,i.e. planning and transport policies.
In addition, the local authority will be expected to provide day to dayinformation to the public on the air quality situation within themanagement areas.
The Domestic Sector
Since 1956 the smoke control policy has provided an effectivesystem for the regulation of smoke and sulphur dioxide fromdomestic sources. This system has proved to be effective, anddomestic emissions now represent negligible problems in mostcities.
There are, however, parts of the UK where smoke and sulphurdioxide are still a problem.
EXAMPLE: NORTHERN IRELAND
In Northern Ireland domestic heating still relies heavily on coal burning,as natural gas has not been widely available there. Regulations are beingimplemented to limit the sulphur content of domestic coal. Natural gashowever will be made available more widely in future years in NorthernIreland which should help to reduce urban air pollution in the Belfastarea. For other parts of the UK the Government has no plans toimplement further controls as emissions are continuing to decline.

ACE Information Programme aric
Urban Air Quality Teaching Pack: KS4 & A 60
The Industrial Sector
Emissions from a range of industrialprocesses are controlled by HerMajesty’s Inspectorate of Pollution(HMIP), or by the local authority. Thelocal authority is required to use theBest Available Technique NotEntailing Excessive Cost (BATNEEC)to prevent or reduce emissions.
The Transport Sector
Road transport is the single greatest source of many air pollutantswithin the urban environment. Therefore, the future quality of urbanair will be largely determined by the future pattern of motor vehicleemissions. Technical solutions such as catalytic converters andtighter MOT emission tests will result in a reduction of emissions ona per vehicle basis, but increasing vehicles on the road will, if notrestrained, counteract these measures.
A combination of measures need to be put in place to achieve goodair quality, such as balancing motor traffic restraint with increaseduse of public transport, walking and cycling and effective land useplanning to avoid the need to travel, plus technical solutions from themotor vehicle industry.
Land Use Planning
The land use planning system has an important role to play inseeking to reduce pollution from vehicles. The location of newdevelopments relative to a transport provision and vice versa caninfluence the need to travel. For example, new developments thatattract large numbers of people, i.e. shopping centres and

ACE Information Programme aric
Urban Air Quality Teaching Pack: KS4 & A 61
educational establishments should be encouraged to locate in townswhich have good public transport links and are easily accessible byfoot or cycle.
Pedestrians & Cyclists
Pedestrians and cyclists can be encouraged to make short journeysby providing purpose built paths and rights of way, pavementimprovements and cycle parking.
Public Transport
A well-used public transport system is energy efficient compared tothe use of the private car. However, for public transport to be anattractive alternative, it needs to be reliable, efficient, cheap,convenient and attractive to use. This can be achieved by:
subsidising public transport to reduce the cost to thetraveller;
providing good facilities at rail and bus stations; developing bus priority measures to prevent traffic hold-up; developing good interchange facilities so passengers can
reach their destinations quickly and efficiently; providing park-and-ride facilities; upgrading local networks; supplying good information services; extending transport systems; restraining car access on roads and increasing car parking
charges to make buses / trains / trams more attractive.

ACE Information Programme aric
Urban Air Quality Teaching Pack: KS4 & A 62
Traffic Restraint
Towns and cities cannot take unrestricted traffic growth, thereforeplans have to be put in place to restrain growth. Methods to restraintraffic include:
traffic calming; parking policies; road pricing; traffic-free areas; planned congestion.
Traffic Calming
Traffic calming uses physical barriers such as road humps and legalmeasures to reduce traffic speed.
Parking Policy
Parking policies can reduce the amount of parking space availableand increase the cost of parking in an attempt to reduce the volumeof traffic entering the urban area. This can be achieved by theremoval of parking meters and short-stay car parking.
EXAMPLE: MANCHESTER
Manchester has introduced the MetroLink system, which isaccessible to all travellers; it improves access to Manchester citycentre and reduces congestion and pollution.

ACE Information Programme aric
Urban Air Quality Teaching Pack: KS4 & A 63
Road Pricing
This method aims to charge road users directly for the road spacethey use. A major problem associated with this method is that it cancause congestion due to the fact that cars have to stop and queue topay road tolls. New techniques, however, such as the ‘smart card’can reduce congestion. This card is used like a phone card at aroadside toll station where payment is automatically debited from apre-paid card.
Traffic Free Areas
These include pedestrianised zones which are generally put intoaction in small sections of towns and cities. Some Europeancountries have taken this further.
EXAMPLE: HONG KONG
A road-pricing scheme was developed and tested during the 1980s inHong Kong. Many people were angered at what they saw as an invasionof their privacy as vehicles were recorded by computer and billsproduced individually. Therefore the system failed.
EXAMPLE: AMSTERDAM
Amsterdam has excluded cars from a large area around its maintourist areas; bicycles and trams provide non-pedestrian access butthe car and delivery vehicles are restricted to small time periods atthe beginning of the day.

ACE Information Programme aric
Urban Air Quality Teaching Pack: KS4 & A 64
Planned Congestion
Congestion exists at certain times of the day, i.e. rush hour. Thecongestion can be planned or managed to enhance movement ofselected modes of transport, whilst making it less attractive to othermodes, i.e. bus or tram priority lanes. Further advances couldinclude priority signals for public transport and bus activated signals.
No one traffic restraint can be considered in isolation. Transport andland use planners need to implement a balance portfolio ofmeasures to:
restrain motor traffic; encourage use of public transport and provide incentives to walk or cycle.
Traffic Bans & Poor Air Quality
Summertime smogs in urban areas are theresult of vehicular exhausts. Some countriesoperate a policy of banning all vehicles, orthose without a catalytic converter, from urbanroads when the air quality is considered poor.Los Angeles is the most famous of these smogcities and such traffic bans are common in this city. Many otherEuropean cities have adopted such measures including Rome andAthens.

ACE Information Programme aric
Urban Air Quality Teaching Pack: KS4 & A 65
Exercise The average car driver has little knowledge of the damage to the environment being caused by their vehicle. Find out about the effects of motor vehicle exhaust on the environment by contacting the information providers below: Atmospheric Research & Information Centre (aric) Manchester Metropolitan University Chester Street, Manchester M1 5GD Tel: 0161 247 1590/3 Fax: 0161 247 6332 E-mail: [email protected] Internet: http://www.ace.mmu.ac.uk/ Department for Environment, Food & Rural Affairs Air Quality Ashdown House 123 Victoria Street London SW1E 6DE Internet: http://www.defra.gov.uk/
National Society for Clean Air & Environmental Protection 44 Grand Parade Brighton BN2 2QA Tel: 01273 878770 E-Mail: [email protected] Internet: http://www.nsca.org.uk/
Transport 2000 The Impact Centre 12-18 Hoxton Street London N1 6NG Tel: 0020 7613 0743 E-Mail: [email protected] Internet: http://www.transport2000.org.uk/ Design a leaflet to inform car owners using the information that you have received.
ACE Information Programme aric
Urban Air Quality Teaching Pack: KS4 & A 66
• = air pollution: term to describe anything which contaminates the
air that we breathe. • = atmosphere: the envelope of gases which surrounds the Earth. • = benzene: a colourless, flammable, aromatic liquid; a volatile
organic compound which readily evaporates. • = carbon monoxide: a highly poisonous gas produced when fuel is
burnt in insufficient air. • = catalytic converter: a device fitted to the exhaust system of a
vehicle which converts the majority of harmful vehicle exhaust gases into less harmful ones.
• = combustion: burning. • = emissions: the discharge of waste gases into the atmosphere. • = emphysema: a medical condition in which the air sacs become
grossly enlarged causing breathlessness and wheezing. • = Expert Panel on Air Quality Standards: a group of scientists
who recommend standards and guidelines for air pollutants to the UK Government.
• = fossil fuel: any naturally occurring carbon or hydrocarbon fuel
such as coal, petroleum, peat and natural gas, formed from the decomposition of organic matter.
• = fuliginous: sooty or smoky.

ACE Information Programme aric
Urban Air Quality Teaching Pack: KS4 & A 67
• = hydrocarbons: organic compounds containing carbon and
hydrogen. • = meteorological: weather. • = monitoring (air quality) : scientific equipment is used to
measure a particular air pollutant. • = nitrogen oxides: collective term for nitric oxide (NO) and
nitrogen dioxide (NO2). • = ozone: a gas formed when nitrogen oxides and hydrocarbons
react in the presence of sunlight; a secondary pollutant (O3). • = particulates: coarse and fine particles of organic or inorganic
substances present in the atmosphere. • = photochemical smog: describes the hazy conditions which
occur when air pollutants are trapped at ground level. High levels of ozone may be produced as nitrogen oxides and hydrocarbons react in the presence of sunlight. Pollution concentrations may become very high and the air quality may be classed as ‘poor’ or ‘very poor’. In summertime, they usually occur on warm, still, sunny days. In winter, smogs may occur on cold, calm days when air pollutants are trapped in urban areas by a layer of warmer air above.
• = platinum group metals: group of precious metals which includes
ruthenium, rhodium, platinum, palladium, osmium and iridium. • = sulphur dioxide: a colourless gas which is given off during fossil
fuel combustion. • = sulphurous: containing sulphur.

ACE Information Programme aric
Urban Air Quality Teaching Pack: KS4 & A 68
• = urban: a built up area with a large population, i.e. town or city • = urban smog: historical smog in which air pollutants, particularly
smoke and sulphur dioxide were trapped at ground level. They usually occurred on cold, calm winter days. The term smog was derived from smoke + fog. Not to be confused with photochemcial smog.
• = WHO: World Health Organisation. In relation to air quality, WHO
recommend guide values for particular pollutants which are considered safe for human health.

ACE Information Programme aric
Urban Air Quality Teaching Pack: KS4 & A 69
References Association of London Authorities, London Boroughs Association and South East Institute of Public Health (1994) Air Quality in London - The First Report of the London Air Quality Network, South East Institute of Public Health, Tunbridge Wells, UK. Bell, S. (1993) Capital Killer II : Still Fuming Over London’s Traffic Pollution, London Boroughs Association. Brimblecombe, P. (1987), The Big Smoke, Routledge, London. Department for Environment, Food & Rural Affairs (2001) The Air Quality Strategy for England, Scotland, Wales & Northern Ireland, The Stationery Office, London. http://www.defra.gov.uk/environment/airquality/strategy/index.htm Department for Environment, Food & Rural Affairs (2001) Digest of Environmental Statistics, The Stationery Office, London. http://www.defra.gov.uk/environment/statistics/des/index.htm Department of the Environment (1997) The National Air Quality Strategy, The Stationery Office, London. Lewis, R.H. (1995) Air Quality Monitoring Report, Manchester City Council, Planning & Environmental Health Dept., Manchester City Council. London Research Centre (1993) London Energy Study - Energy Use and the Environment, London Research Centre, London.

ACE Information Programme aric
Urban Air Quality Teaching Pack: KS4 & A 70
Longhurst, J.W.S. & Mann C. (1994) Changing Air Quality in Greater Manchester, ARIC, Manchester. National Environmental Technology Centre, National Air Quality Archive, http://www.airquality.co.uk National Statistics, StatBase® - National Statistics data and references, http://www.statistics.gov.uk/statbase/mainmenu.asp NSCA (1995), NSCA Handbook 1995, NSCA, Brighton. QUARG - Quality of Urban Air Review Group (1993) Urban Air Quality in the UK, DOE, London. WHO & UNEP (1992) Urban Air Pollution in Megacities of the World, Blackwell, Oxford. Wilkins, E.T. (1954) Air Pollution Aspects of the London Fog of December 1952, Quarterly Journal Royal Meteorological society, Vol. 80, pp 267-271.

ACE Information Programme aric
Urban Air Quality Teaching Pack: KS4 & A 71
Sources of Further Information
The following addresses may be useful contacts for further information on urban air quality: AEA Technology: The National Environment Technology Centre (NETCEN) Culham Abingdon Oxford OX14 3DB Internet: http://www.airquality.co.uk
Atmospheric Research & Information Centre (aric) Manchester Metropolitan University Chester Street, Manchester M1 5GD Tel: 0161 247 1590/3 Fax: 0161 247 6332 E-mail: [email protected] Internet: http://www.ace.mmu.ac.uk/
British Lung Foundation 78 Hatton Gardens London EC1N 8LD Tel: 020 7831 5831 Fax: 020 7831 5832 Internet: http://www.lunguk.org/
Department for Environment, Food & Rural Affairs Air Quality Ashdown House 123 Victoria Street London SW1E 6DE Tel: 0171 890 6295 Internet: http://www.defra.gov.uk/ Friends of the Earth 26-28 Underwood Street London N1 7JQ Tel: 020 7490 0881 Internet: http://www.foe.co.uk/

ACE Information Programme aric
Urban Air Quality Teaching Pack: KS4 & A 72
Greenpeace Canonbury Villas London N1 2PN Tel: 020 7865 8100 Internet: http://www.greenpeace.org/ Johnson Matthey Catalytic Systems Orchard Road Royston SG8 5HE Tel: 01763 253000 Fax: 01763 253492 National Asthma Campaign Providence House Providence Place London N1 0NT Tel: 020 7226 2260 Fax: 020 7704 0740 Internet: http://www.asthma.org.uk/
National Society for Clean Air & Environmental Protection 44 Grand Parade Brighton BN2 2QA Tel: 01273 878770 E-Mail: [email protected] Internet: http://www.nsca.org.uk/ Transport 2000 The Impact Centre 12-18 Hoxton Street London N1 6NG Tel: 0020 7613 0743 E-Mail: [email protected] Internet: http://www.transport2000.org.uk/

ACE Information Programme aric
Urban Air Quality Teaching Pack: KS4 & A 73
These can be printed out onto transparencies tosupport teaching, if required.
OHP 1: Key dates for the history of air pollutionin the UK.
OHP 2: The relationship between smoke andsulphur dioxide pollution and deathsduring the London Smog, December1952.
OHP 3: The main urban air pollutants.
OHP 4: The effects of urban air pollution onhuman health.
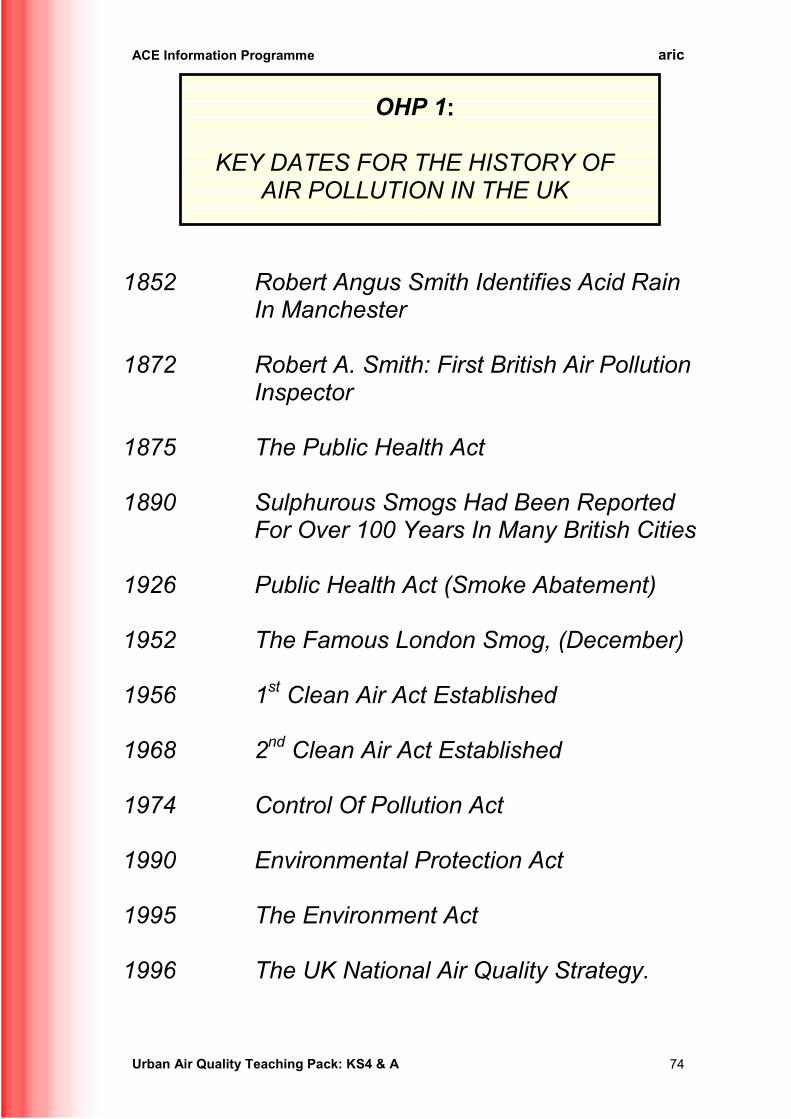
ACE Information Programme aric
Urban Air Quality Teaching Pack: KS4 & A 74
OHP 1:
KEY DATES FOR THE HISTORY OFAIR POLLUTION IN THE UK
1852 Robert Angus Smith Identifies Acid RainIn Manchester
1872 Robert A. Smith: First British Air PollutionInspector
1875 The Public Health Act
1890 Sulphurous Smogs Had Been ReportedFor Over 100 Years In Many British Cities
1926 Public Health Act (Smoke Abatement)
1952 The Famous London Smog, (December)
1956 1st Clean Air Act Established
1968 2nd Clean Air Act Established
1974 Control Of Pollution Act
1990 Environmental Protection Act
1995 The Environment Act
1996 The UK National Air Quality Strategy.

ACE Information Programme aric
Urban Air Quality Teaching Pack: KS4 & A 75
OHP 2:
THE RELATIONSHIP BETWEEN SMOKE ANDSULPHUR DIOXIDE POLLUTION AND DEATHS
DURING THE LONDON SMOG, DECEMBER 1952
Source: Wilkins, 1954

ACE Information Programme aric
Urban Air Quality Teaching Pack: KS4 & A 76
OHP 3:
THE MAIN URBAN AIR POLLUTANTS
Pollutant Main Sources UK (1996) Figures
Nitrogenoxides
Combustion of motorspirit and other fuelcombustion for domesticheating, power stations,industrial boilers,chemical processes etc.
Road transport 47%Power stations 22%Other industry 7%
Sulphurdioxide
Fuel combustion forpower stations, domesticheating, industrial boilers,diesel vehicles, wasteincinerators.
Power stations 65%Other industry 10%Refineries 6%
Carbonmonoxide
Combustion of motorspirit and othercombustion processes.
Road transport 71%Off-road sources16%Domestic 5%
Ozone Secondary pollutantresulting from chemicalreactions with nitrogenoxides and VOCs.
See NOx & VOCs.
Particulates Fuel combustion forpower stations, transport,heating, other industrialprocesses.
Production processes28%Road transport 25%Power stations 16%Domestic 14%
VolatileOrganicCompounds(VOCs)
Transport, oilcombustion, chemicalprocesses, solvent use,waste incinerators.
Road transport 30%Solvent use 29%Extraction & distribution offossil fuels 14%Production processes 13%
Benzene Combustion of motorspirit, evaporation frompetrol pumps and fueltanks.
Road transport(approximately 80%)
Lead Combustion of leadedpetrol, coal combustion,metal production.

ACE Information Programme aric
Urban Air Quality Teaching Pack: KS4 & A 77
OHP 4:
THE EFFECTS OF AIR POLLUTION ONHUMAN HEALTH
Pollutant Effects on human health
Sulphur dioxide(SO2)
Can cause respiratory problems, leading to chronicbronchitis, can cause narrowing of the airways and canaffect asthmatics.
Carbonmonoxide(CO)
Interferes with blood’s capacity to absorb and circulateoxygen. Worsens emphysema, chronic bronchitis andother lung disease. Can affect those suffering fromheart disease and can have impacts on the centralnervous system.
Nitrogen dioxide(NO2)
Can cause respiratory disorders such as altered lungfunction, lung tissue damage, increased prevalence ofacute respiratory illness. Young children andasthmatics are most at risk.
Ozone(O3)
Can aggravate chronic respiratory diseases and cancause permanent lung damage. Can affect the eyes,nose and throat, as well as causing chest discomfort,coughing and headaches.
Benzene (C6H6) Can cause cancer, anaemia and injury to bone marrow.
Lead(Pb)
Can cause mental retardation, drowsiness andproblems with the kidneys and reproduction system.Long term exposure interferes with normaldevelopment and functioning of the brain.
Particulates(PM10)
Can cause acute respiratory disorders and decrementsin lung function and can lead to premature death.
Volatile organiccompounds(VOCs)
Health effects are dependent upon the specific VOC,however a number of VOCs are known or suspected tocause cancer.