teaching material on trade and gender -...
TRANSCRIPT
TEACHING MATERIAL ON
VOLUME 1: UNFOLDING THE LINKS
MODULE 4TRADE AND GENDER LINKAGES: AN ANALYSIS OF COMESA
TRADE AND GENDER


U N I T E D N A T I O N S C O N F E R E N C E O N T R A D E A N D D E V E L O P M E N T
Teaching MaTerial onTRADE AND GENDER
Volume 1
MODULE 4Trade and gender linkages: An analysis of COMESA
Unfolding the links

i i
UNITED NATIONS PUBLICATIONUNCTAD/DITC/2016/1
Copyright © United Nations, 2017All rights reserved.
noTe
The designations employed and the presentation of the material do not imply the expression of any opinion on the part of the United Nations concerning the legal status of any country, territory, city or area, or of its authorities, or concerning the delimitation of its frontiers or boundaries.
Material in this publication may be freely quoted or reprinted, but acknowledgement of UNCTAD is requested, together with a reference to the document number. A copy of the publication containing the quotation or reprint should be sent to the Trade, Gender and Development Programme, Division on International Trade in Goods and Services, and Commodities, Palais des Nations, 1211 Geneva 10, Switzerland.
This publication has been edited externally.
The Trade, Gender and Development Programme carries out UNCTAD’s work programme on trade and gender with the aim of making trade policy a force for inclusive development.
For further information about the UNCTAD work programme on trade, gender and development, please contact:
Ms. Simonetta ZarrilliChief, Trade, Gender and Development ProgrammeDivision on International Trade in Goods and Services, and CommoditiesE-mail: [email protected] Website: http://unctad.org/gender
i i i
acknowledgeMenTs
Module 4, Trade and gender linkages: An analysis of COMESA, complements the three modules of the first volume of the UNCTAD teaching manual on trade and gender titled Unfolding the links. The module was prepared by an UNCTAD team including Maria Masood, Irene Musselli, Bruce Thomson, Mariangela Linoci and Jacqueline Salguero. Comments were provided by Sheba Tejani and Elizabeth Jane Casabianca. The module was coordinated and supervised by Simonetta Zarrilli. Design and layout were created by Ornella Baldini. David Einhorn was in charge of English editing. The development of the module was inspired by conversations and exchanges of views with the COMESA Secretariat. Special thanks go to Beatrice Hamusonde, Director, and Mekia Redi, Senior Gender Mainstreaming Officer, Gender and Social Affairs Division, COMESA Secretariat, for their comments and encouragement all along the process.
The publication of this module was made possible by the financial support of the governments of Finland and Sweden. Their contributions are gratefully acknowledged.

iv

v
4m
od
ule
Trade and gender linkages: An analysis of COMESA 1
1 Introduction 2
1.1 The COMESA region: an overview 2
1.2 Gender mainstreaming in COMESA 3
2 Trade and gender in the agricultural sector 5
2.1 The gender structure of agriculture in the COMESA region 5
2.1.1 Overview 5
2.1.2 Gender structure of agriculture 5
2.1.3 Gender patterns of employment in agriculture 7
2.2 Gender-based inequalities, competitiveness, and trade 10
2.2.1 The gender gap in agriculture and its underlying factors 11
2.2.2 Implications for competitiveness and trade 12
2.3 Gender implications of COMESA’s trade and agricultural strategies 14
3 Trade and gender in the manufacturing sector 16
3.1 The consequences of export processing zones on women in COMESA countries 16
3.1.1 Export processing zones and female employment 17
3.1.2 Export processing zones and the gender wage gap 18
3.1.3 Export processing zones and women's working conditions 19
3.2 The impact of trade liberalization on women in COMESA countries 20
3.2.1 Interaction channels and firm-level evidence 20
3.2.2 Estimation of the impact of trade changes on women in COMESA countries 21
4 Trade and gender in the services sector 23
4.1 Stylized facts on women’s participation in the services sector 23
4.2 The consequences of trade liberalization in services on gender outcomes 24
4.2.1 Exports and skilled services enabled by information and communications technology 25
4.2.2 Tourism and gender in COMESA 28
5 Conclusions 30
Exercises and questions for discussion 34
Annex 35
A.1 Descriptive statistics on women’s participation in COMESA countries 35
A.1.1 Manufacturing 35
A.1.2 Information and communications technology 35
A.2 Methodology to estimate the impact of trade changes on women in COMESA 35
A.2.1 Methodology 35
A.2.2 Results of the estimation 36
A.3 Case study in Egypt: Al Azzawi (2014) 37
A.3.1 Context 37
A.3.2 Data and methodology 37
A.3.3 Findings 38
rEfErEnCES 39
EnDnOTES 43
Table of conTenTs
noTe ii
acknowledgeMenTs iii
lisT of boXes vi
lisT of figUres vi
lisT of Tables vi
lisT of abbreviaTions vii
vi
lisT of boXes
lisT of figUres
lisT of Tables
Box 1 Who are own-account workers and contributing family workers? 9
Box 2 Gender patterns in rural employment: Evidence from Malawi and Rwanda 10
Box 3 Gender-sensitive land regulation and control over the land: The case of Ethiopia 12
Box 4 Competitive advantage is not only about labour costs 14
Box 5 Who are the women hired in export processing zones in Madagascar? 17
Box 6 Sample of COMESA actions and areas of focus to promote services trade 23
Box 7 Gender-sensitive educational programmes for information and communications technology in Africa 29
Box 8 Case study on gender in the Kenyan tourism industry 31
Figure 1 Sector composition of the female workforce in COMESA 4
Figure 2 Income sources in rural areas 6
Figure 3 Share of male and female agricultural holders in selected COMESA countries 11
Figure 4 Female share in the manufacturing sector, 1998–2014 19
Figure 5 Impact of tariff reductions on the female-to-male employment ratio, by occupation type and partner countries 22
Figure 6 Women’s growing participation in the services workforce in COMESA, 1995–2020 25
Figure 7 Heterogeneity in female services employment as a per cent of total female employment across COMESA countries,
2015 25
Figure 8 Correlation between the share of female graduates working in the services sector and the percentage of firms with
female managers 29
Figure 9 Female-to-male employment ratio across sectors 36
Table 1 COMESA: Selected economic and social indicators 3
Table 2 Gender inequality indicators in COMESA countries, 2014 4
Table 3 Relative importance of agriculture across COMESA countries 6
Table 4 Male and female shares of agricultural employment in COMESA countries 7
Table 5 Share of employment in agriculture, by gender 8
Table 6 Gender wage gap in agriculture 8
Table 7 Female share of employment in the manufacturing sector 16
Table 8 Export processing zones in COMESA countries 17
Table 9 Distribution of employed persons in information and communications technology by gender in selected COMESA
countries 26
Table 10 Proportion of firms in COMESA countries with at least one woman in the top two manager positions 27
Table 11 Descriptive statistics on female-to-male ratios within firms by sector 35
Table 12 Distribution of employed persons in information and communications technology by occupation in Ethiopia 36
Table 13 Estimation of the impact of tariff variations on female-to-male employment ratios 37

vii
BuSinESS prOCESS OuTSOurCinG
COMprEhEnSivE AfriCA AGriCulTurAl DEvElOpMEnT prOGrAMME
COnvEnTiOn On ThE EliMinATiOn Of All fOrMS Of DiSCriMinATiOn AGAinST WOMEn
COMMOn MArkET fOr EASTErn AnD SOuThErn AfriCA
EAST AfriCAn COMMuniTy
ECOnOMiC pArTnErShip AGrEEMEnT
ExpOrT prOCESSinG zOnE
EurOpEAn uniOn
fOOD AnD AGriCulTurE OrGAnizATiOn
GrOSS DOMESTiC prODuCT
GrOSS nATiOnAl inCOME
hArMOnizED COMMODiTy DESCripTiOn AnD CODinG SySTEM
uniTED nATiOnS inTEr-AGEnCy nETWOrk On WOMEn AnD GEnDEr EquAliTy
infOrMATiOn AnD COMMuniCATiOnS TEChnOlOGy
inTErnATiOnAl funD fOr AGriCulTurAl DEvElOpMEnT
inTErnATiOnAl lABOur OrGAnizATiOn
inTErnATiOnAl STAnDArD inDuSTriAl ClASSifiCATiOn
nOMEnClATurE STATiSTiquE DES ACTiviTéS éCOnOMiquES DAnS lA COMMunAuTé EurOpéEnnE
(STATiSTiCAl ClASSifiCATiOn Of ECOnOMiC ACTiviTiES in ThE EurOpEAn COMMuniTy)
nEW pArTnErShip fOr AfriCA’S DEvElOpMEnT
OrGAniSATiOn fOr ECOnOMiC CO-OpErATiOn AnD DEvElOpMEnT
pArTnErShip fOr SkillS in AppliED SCiEnCES, EnGinEErinG, AnD TEChnOlOGy
rEST Of ThE WOrlD
SOuThErn AfriCAn DEvElOpMEnT COMMuniTy
STAnDArD inTErnATiOnAl TrADE ClASSifiCATiOn
TripArTiTE frEE TrADE AGrEEMEnT
TrADE AnAlySiS AnD infOrMATiOn SySTEM
uniTED nATiOnS COnfErEnCE On TrADE AnD DEvElOpMEnT
uniTED nATiOnS DEvElOpMEnT prOGrAMME
uniTED nATiOnS EDuCATiOnAl, SCiEnTifiC AnD CulTurAl OrGAnizATiOn
uniTED nATiOnS pOpulATiOn funD
uniTED nATiOnS WOrlD TOuriSM OrGAnizATiOn
WOrlD BAnk EnTErpriSE SurvEyS
WOrlD BAnk WOrlD DEvElOpMEnT inDiCATOrS
WOrlD TrAvEl AnD TOuriSM COunCil
BpO
CAADp
CEDAW
COMESA
EAC
EpA
Epz
Eu
fAO
GDp
Gni
hS
iAnWGE
iCT
ifAD
ilO
iSiC
nACE
nEpAD
OECD
pASET
rOW
SADC
SiTC
TfTA
TrAinS
unCTAD
unDp
unESCO
unfpA
unWTO
WBES
WDi
WTTC
lisT of abbreviaTions


4Module 4
Trade and gender linkages:An analysis of COMESA
mo
du
leTrade and gender linkages: An analysis of COMESA4
2
1 Introduction
This document is the fourth module in the first of two volumes of the teaching manual on trade and gender prepared by the United Nations Con-ference on Trade and Development (UNCTAD). The manual was developed with the aim of enhancing the capacity of a global audience of policymak-ers, civil society organizations, and academics to mainstream gender into trade policy.
To tailor the content of the teaching manual to the specific needs and contexts of target regions and promote broader dissemination of the manual’s analytical tools, UNCTAD has undertaken the lo-calizations of Volume 1 Unfolding the links with an overall approach that focuses on topics that best illustrate and address regional context and specif-icities. The present module is the first of a series of regional modules and has been developed with the aim of applying the analytical framework pre-sented in Volume 1 to the specificities of the mem-ber countries of the Common Market for Eastern and Southern Africa (COMESA).
The previous modules of Volume 1 examined the relationship between trade and gender inequali-ties. Module 1 introduced the basic concepts indis-pensable to understanding the trade and gender nexus through a discussion of the economy as a gendered structure, an analysis of the definition of trade, and a presentation of the measures of gender biases. Module 2 described the various transmission channels through which trade lib-eralization affects women, relying on both theo-retical expectations and empirical evidence in the different economic sectors. Module 3 focused on the reverse relationship and exposed how gender inequality influences export competitiveness and trade performance. Building upon the content of the previous modules, Module 4 applies the ana-lytical grid previously developed to the member countries of COMESA. The concepts and transmis-sion mechanisms introduced in the training ma-terial are employed to understand and outline the interactions between trade and gender inequali-ties in COMESA countries.
Since COMESA involves countries that differ great-ly in terms of economic structures and social de-velopment, this module examines the trade and gender nexus through a thematic lens, focusing on common features across the different eco-nomic sectors, namely agricultural, manufactur-ing, and services.
At the end of this module, students should be able to:
• Interpret critical data about gender inequali-ties and female labour force participation in COMESA countries;
• Understand the interactions of trade and gender outcomes in the different economic sectors in light of the transmission channels described previously;
• Illustrate how trade integration has influ-enced gender inequality in COMESA countries in the different economic sectors.
1.1 The COMESA region: An overview
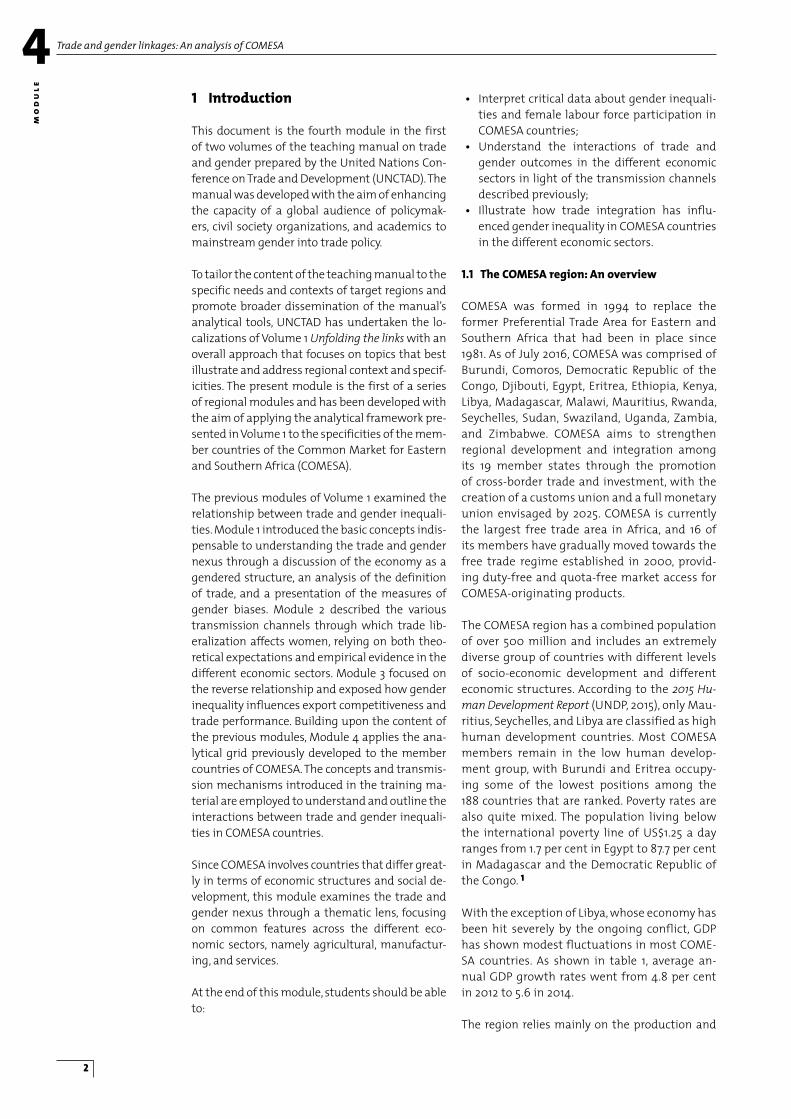
COMESA was formed in 1994 to replace the former Preferential Trade Area for Eastern and Southern Africa that had been in place since 1981. As of July 2016, COMESA was comprised of Burundi, Comoros, Democratic Republic of the Congo, Djibouti, Egypt, Eritrea, Ethiopia, Kenya, Libya, Madagascar, Malawi, Mauritius, Rwanda, Seychelles, Sudan, Swaziland, Uganda, Zambia, and Zimbabwe. COMESA aims to strengthen regional development and integration among its 19 member states through the promotion of cross-border trade and investment, with the creation of a customs union and a full monetary union envisaged by 2025. COMESA is currently the largest free trade area in Africa, and 16 of its members have gradually moved towards the free trade regime established in 2000, provid-ing duty-free and quota-free market access for COMESA-originating products.
The COMESA region has a combined population of over 500 million and includes an extremely diverse group of countries with different levels of socio-economic development and different economic structures. According to the 2015 Hu-man Development Report (UNDP, 2015), only Mau-ritius, Seychelles, and Libya are classified as high human development countries. Most COMESA members remain in the low human develop-ment group, with Burundi and Eritrea occupy-ing some of the lowest positions among the 188 countries that are ranked. Poverty rates are also quite mixed. The population living below the international poverty line of US$1.25 a day ranges from 1.7 per cent in Egypt to 87.7 per cent in Madagascar and the Democratic Republic of the Congo. 1
With the exception of Libya, whose economy has been hit severely by the ongoing conflict, GDP has shown modest fluctuations in most COME-SA countries. As shown in table 1, average an-nual GDP growth rates went from 4.8 per cent in 2012 to 5.6 in 2014.
The region relies mainly on the production and

Trade and gender linkages: An analysis of COMESA 4
mo
du
le
3
COMESA: Selected economic and social indicators
Table 1
2010 2012 2014
Totalpopulation(millions) 443 462 500
AnnualGDPgrowth(percent)a 4.8 4.8 5.6
Trade(percentofGDP) 77.5 75.7 73.9
Grossnationalincomepercapita(constant2010U.S.dollars)b
2,429 2,370 2,172
Femalelabourforceparticipationrate(percentofthefemalepopulationages15-64)
62.9 63.0 63.2
Primaryandsecondaryschoolenrolment(GenderParityIndex)c
0.9 0.9 1.0
Tertiaryschoolenrolment(GenderParityIndex)c 0.8 1.1 1.0
Source: Calculations by the UNCTAD secretariat based on data from the World Bank’s World Development Indicators database (accessed on 9 August 2016). Notes: If not otherwise indicated, figures are expressed in mean values calculated based on available data for selected years. a To avoid distortions, average rates of GDP growth do not include Libya due to the effects of the current political situation on the economy. b Gross national income figures are calculated based on latest available data from Seychelles for 2010. c Figures for the Gender Parity Index on school enrolment refer to 2013 instead of 2014.
export of primary products. Intra-COMESA trade share ranks third after larger international trad-ing partners such as the European Union (EU) and China. (COMESA, 2013). With an average trade-to-GDP ratio of about 74 per cent, trade openness among COMESA members varies sig-nificantly. Seychelles, Mauritius, and Libya have the highest levels of integration into the world economy, with trade-to-GDP ratios above 100 per cent. 2
Per capita gross national income (GNI) ranged from US$213 for Burundi to US$10,200 for Sey-chelles in 2010, whereas the regional average was over US$2,000. There are large gender disparities in the estimated GNI per capita: as shown in ta-ble 2, male GNI per capita is twice that of women (UNDP, 2015).
Gender inequalities are also evident in labour force participation rates. About 63 per cent of working-age women, versus 81 per cent of men, are economically active in the COMESA group. The lowest female labour force participation is found in Egypt (26 per cent), Libya, and Sudan (about 32 per cent each), as opposed to Rwanda, Zimbabwe, Malawi, Burundi, and Eritrea, where participation rates of women in the labour force were above 80 per cent in 2014 (table 2).
The aggregate figures of the Gender Parity Index for primary, secondary, and tertiary education enrolment point to full gender parity achieved in 2014.3 Yet, when looking at school attainment, the number of years of education of people aged 25 and older remains remarkably lower for women
than men in most COMESA countries. As shown in table 2, girls complete on average 4.9 years of school as compared to 6.2 years for boys. Broader inequalities in achievement between women and men in the COMESA group are usefully il-lustrated in the ranking of the Gender Inequality Index below.
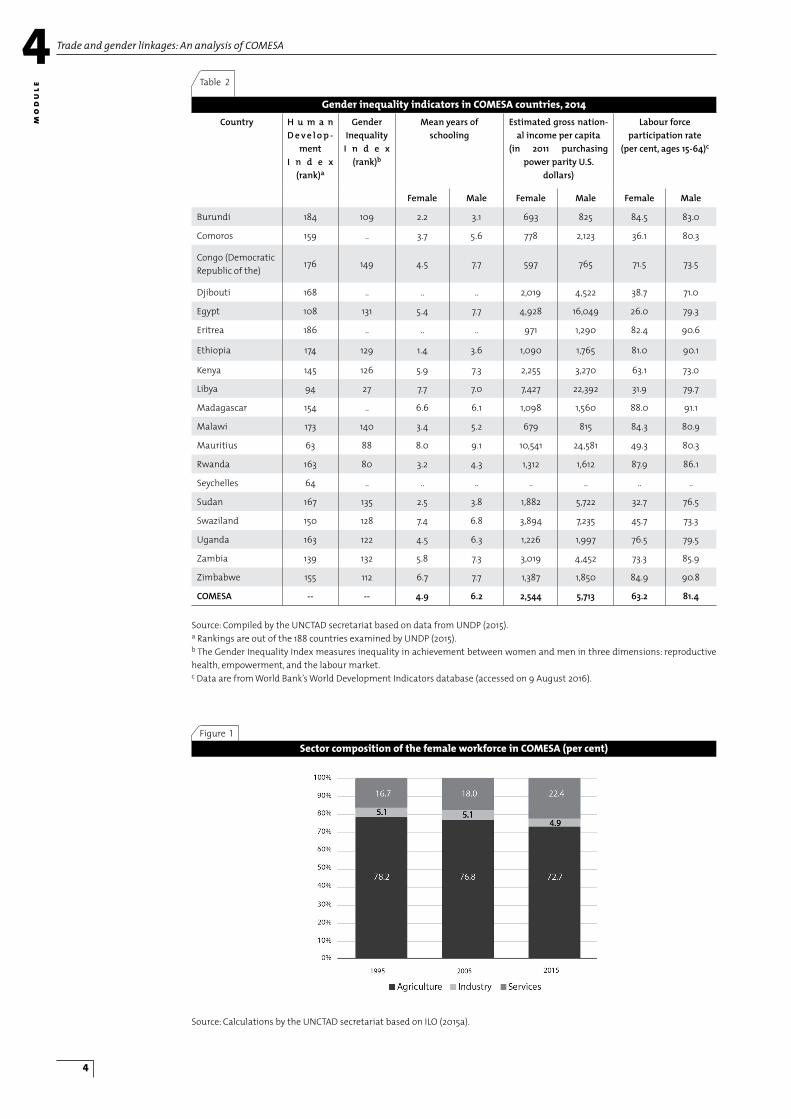
Data on the distribution of the workforce across economic sectors in COMESA countries, sum-marized in figure 1, show that women predomi-nantly work in the agricultural sector. Although the share of women working in agriculture has decreased over the past 20 years, the proportion remains high (73 per cent in 2015). The increasing share of women involved in the services sector is also worth noting: while 17 per cent of the fe-male workforce was working in services in 1995, this proportion amounted to 22 per cent in 2015, implying a 34 per cent increase over the period.
1.2 Gender mainstreaming in COMESA
Articles 154 and 155 of the COMESA Treaty recog-nize the importance of ensuring the effective and equal participation of women, men, and youth to achieve sustainable economic and social devel-opment in the region. COMESA members adopt-ed the Regional Gender Policy and the Addis Ababa Declaration on Gender in 2002, and com-mitted to mainstream gender across all areas of socio-economic life and regional integration and cooperation. The COMESA Gender Policy provides a comprehensive gender and development strat-egy to redress gender inequalities and advance gender-responsive measures at the national and
mo
du
leTrade and gender linkages: An analysis of COMESA4
4
Gender inequality indicators in COMESA countries, 2014
Sector composition of the female workforce in COMESA (per cent)
Table 2
Country H u m a nDeve l op -
mentI n d e x(rank)a
GenderInequalityI n d e x(rank)b
Meanyearsofschooling
Estimatedgrossnation-alincomepercapita
(in 2011 purchasingpowerparityU.S.
dollars)
Labourforceparticipationrate
(percent,ages15-64)c
Female Male Female Male Female Male
Burundi 184 109 2.2 3.1 693 825 84.5 83.0
Comoros 159 .. 3.7 5.6 778 2,123 36.1 80.3
Congo (Democratic Republic of the)
176 149 4.5 7.7 597 765 71.5 73.5
Djibouti 168 .. .. .. 2,019 4,522 38.7 71.0
Egypt 108 131 5.4 7.7 4,928 16,049 26.0 79.3
Eritrea 186 .. .. .. 971 1,290 82.4 90.6
Ethiopia 174 129 1.4 3.6 1,090 1,765 81.0 90.1
Kenya 145 126 5.9 7.3 2,255 3,270 63.1 73.0
Libya 94 27 7.7 7.0 7,427 22,392 31.9 79.7
Madagascar 154 .. 6.6 6.1 1,098 1,560 88.0 91.1
Malawi 173 140 3.4 5.2 679 815 84.3 80.9
Mauritius 63 88 8.0 9.1 10,541 24,581 49.3 80.3
Rwanda 163 80 3.2 4.3 1,312 1,612 87.9 86.1
Seychelles 64 .. .. .. .. .. .. ..
Sudan 167 135 2.5 3.8 1,882 5,722 32.7 76.5
Swaziland 150 128 7.4 6.8 3,894 7,235 45.7 73.3
Uganda 163 122 4.5 6.3 1,226 1,997 76.5 79.5
Zambia 139 132 5.8 7.3 3,019 4,452 73.3 85.9
Zimbabwe 155 112 6.7 7.7 1,387 1,850 84.9 90.8
COMESA -- -- 4.9 6.2 2,544 5,713 63.2 81.4
Source: Compiled by the UNCTAD secretariat based on data from UNDP (2015).a Rankings are out of the 188 countries examined by UNDP (2015).b The Gender Inequality Index measures inequality in achievement between women and men in three dimensions: reproductive health, empowerment, and the labour market.c Data are from World Bank’s World Development Indicators database (accessed on 9 August 2016).
Source: Calculations by the UNCTAD secretariat based on ILO (2015a).
Figure 1
Trade and gender linkages: An analysis of COMESA 4
mo
du
le
5
regional levels. It also facilitates the engendering of national legislation by its member states.
In line with these principles, the COMESA Secre-tariat has been implementing its Gender Main-streaming Strategic Action Plan since 2009. Sectoral guidelines have been developed and disseminated to provide a practical tool for poli-cymakers to apply gender equality principles to all areas of the regional integration agenda.4 A specific framework to mainstream gender in the trade sector is also in place to provide in-sights into measures that help assess the gen-der redistributive effects of trade. These include strengthening sex-disaggregated data, providing a knowledge base through gender analysis and impact assessments of national and regional trade instruments, formulating a dedicated gen-der policy for the trade sector, and implementing interventions that advance women’s economic empowerment.
2 Trade and gender in the agricultural sector
The gender implications of agricultural trade policy are complex and multidimensional, as discussed in the core training manual (UNCTAD, 2014b; see also UNCTAD, 2016). Trade integration policies do not have clear-cut positive or negative effects on women in agriculture: the effects vary across subgroups of women depending on the agricultural sectors and markets where they are active, and are often double-edged, with different impacts on women as consumers and producers. Note in this respect that the economic roles of men and women in agriculture reflect ingrained socio-cultural norms that vary across and within countries, which adds complexity to the analysis. Furthermore, the competitiveness implications for the sector of gender-based discrimination are complex. As discussed in the core training manual, gender-based inequalities adversely im-pact women’s productivity on-farm and off-farm, turning women into “underachievers of com-petitive advantage” in their own enterprises. Yet low-cost female labour can also enhance export competitiveness, turning gender inequality into a “source of competitive advantage” for labour-intensive, export-oriented agri-business. Against this backdrop, this section explores the trade and agriculture gender nexus in relation to the COMESA region. Based on descriptive statistics, it briefly reviews the gendered structure of agri-culture in the COMESA region; assesses how gen-der-specific constraints and inequalities impact trade and agricultural trade potential in COME-
SA (i.e. how gender inequality affects trade); and considers the potential impacts of COMESA’s ag-ricultural trade and regional integration on rural women (i.e. how trade affects gender).
2.1 The gender structure of agriculture in the COMESA region
2.1.1Overview
As shown in table 3, agriculture is the backbone of the economy in the COMESA region: it provides livelihoods for about 80 per cent of the region’s labour force and accounts for approximately 65 per cent of foreign exchange earnings. However, even though agriculture is the mainstay of em-ployment and export proceeds, it accounts for a comparatively lower share of value added (32 per cent of COMESA’s GDP), which reflects the high persistence of subsistence farming and the inci-dence of low-value staples in the crop mix.
2.1.2Genderstructureofagriculture
The agricultural sector in the COMESA region is not distinctly female-intensive or male-inten-sive. 5 At the regional level, men and women are equally involved in agriculture, accounting for an equal share (50 per cent) of agricultural employ-ment (table 4). However, this aggregate figure masks wide variations across COMESA member states: agriculture is female-intensive in Uganda, Zambia, the Democratic Republic of the Congo, Rwanda, Malawi, Eritrea, and Zimbabwe, where-as men prevail in agricultural employment in Libya, Egypt, Sudan, Mauritius, Comoros, and Ethiopia. The aggregate figure also conceals the female-intensive nature of specific sub-sectors and activities: women tend to dominate employ-ment in value chains for high-value products such as fresh fruit, vegetables, and flowers. For instance, women account for about 75 per cent of employment in the flower industry in Kenya and Tanzania. 6 Note also that there has been a slight increase in the proportion of women in to-tal agricultural employment in the region, from 47 per cent in 1995 to an estimated 50 per cent in 2014. In particular, women’s share of agricultural employment has risen sharply in some COMESA countries, including Zambia and Uganda, ex-ceeding 60 per cent of total employment (table 4). This indicates a pattern of progressive “femi-nization” of agriculture that reflects increased female participation in employment and male mobility out of agriculture, among other factors. In particular, while the region is experiencing a declining share of agricultural employment in total employment for both men and women,

mo
du
leTrade and gender linkages: An analysis of COMESA4
6
Relative importance of agriculture across COMESA countries (per cent)
Table 3
Country Agriculture(percentofGDP)
Agriculture(percentofmerchandise
exports)
Employmentinagriculture(percentoftotalemployment)
2014 WDI (1)
2011–2013 average value UNCTADStat (2)
2013 ILO (3)
Burundi 39.3 62.35 90.8
Comoros 35.6 42.21 75.4
Congo, Dem.Rep 21.2 3.1 71.9
Djibouti 3.9 (2007) 38.59 …
Egypt, Arab Rep. 11.1 15.71 28.0
Eritrea 14.5 (2009) 28.06 73.4
Ethiopia 41.9 83.47 72.7
Kenya 30.3 54.15 65.8
Libya 1.9 (2008) 0.09 9.7
Madagascar 26.5 39.26 81.9
Malawi 33.3 79.61 78.7
Mauritius 3.2 31.42 7.4
Rwanda 33.1 39.98 76.3
Seychelles 2.3 86.09 …
Sudan 29.2 10.85 52.7
Swaziland 6.3 36.48 41.8
Uganda 27.2 64.13 60.2
Zambia 9.6 (2013) 13.55 55.3
Zimbabwe 14.0 45.65 65.7
Source: Calculations by the UNCTAD secretariat based on:(1) Data from the World Bank’s World Development Indicators (WDI) (accessed on 10 May 2016); (2) Data from the UNCTADStat database: Merchandise trade matrix - product groups, exports, 1995–2013; Merchandise trade by trading partner and product based on SITC, Rev. 3; Agriculture covers categories “All food items” (SITC 0 + 1 + 22 + 4) + “Agricultural raw materials” (SITC 2 less 22, 27 and 28) (accessed on 16 February 2015); and (3) Data from the International Labour Organization (ILO, 2015b): Share of employment in agriculture, forestry, hunting and fishing, male and female) (accessed on 17 May 2016).
Income sources in rural areasFigure 2
Source: Food and Agriculture Organization’s RIGA database classification of income sources. Notes: Note that category boundaries are not clear-cut. Contract farming and modern supply chains for high-value agricultural products, in particular, straddle across on-farm work (though contracted), off-farm agricultural wage work, and non-farm activi-ties (processing and packing segments).

Trade and gender linkages: An analysis of COMESA 4
mo
du
le
7
male agricultural employment rates have de-clined slightly more, as more men than women find employment out of agriculture. 7 Interest-ingly, although the total share of agricultural employment is in decline, women tend to cluster in this sector. Socio-cultural gender norms and different types of constraints, including women’s limited mobility, reduced access to training, and a disproportionate burden of care work, are some of the key factors that are holding rural women back, hindering their ability to benefit from em-ployment opportunities outside of agriculture on equal terms as men.
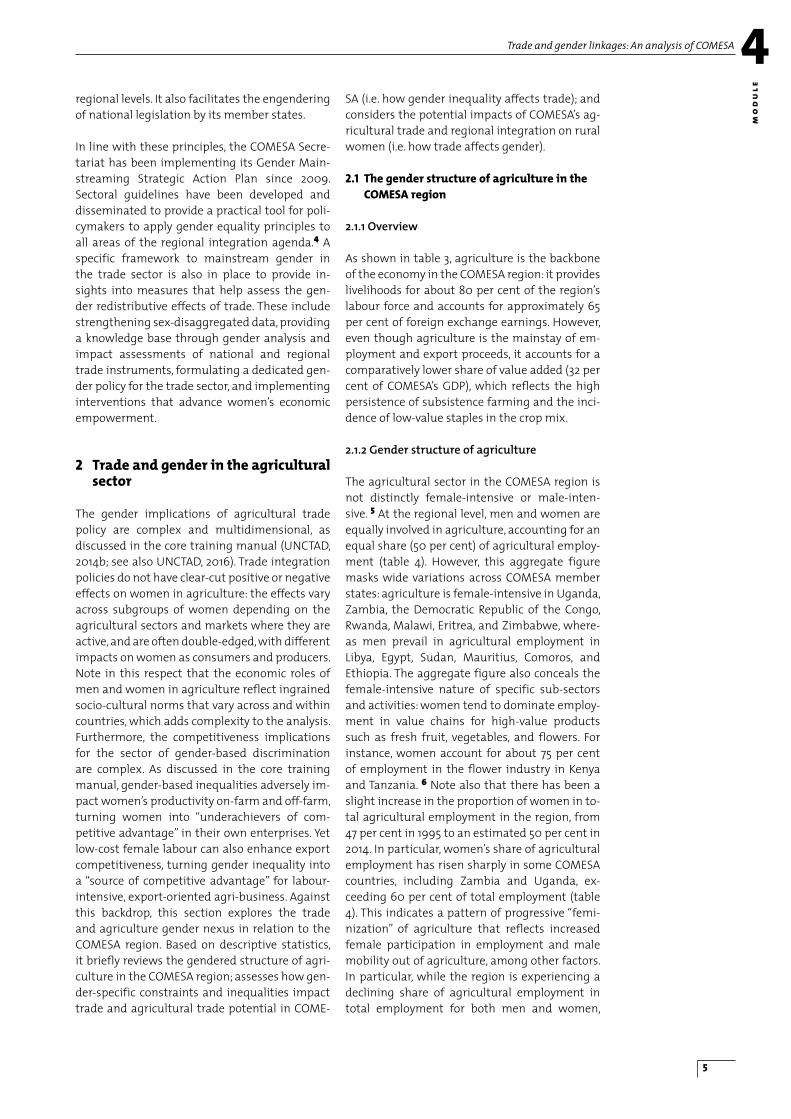
Though not female-intensive in terms of labour input, agriculture remains by far the most impor-tant source of employment for women in most COMESA countries. Overall, nearly three-quarters of employed women in COMESA work in agricul-ture. As table 5 shows, in a number of countries, including Burundi, Malawi, the Democratic Re-public of the Congo, Rwanda, Eritrea, and Kenya, more than 80 per cent of employed women work in agriculture. The share has declined for the re-gion as a whole, from 78 per cent in 1995 to an estimated 74 per cent in 2014, which reflects
some labour mobility of women out of agricul-ture. Yet, the share of agriculture in total female employment remains consistently high across most COMESA countries, and has increased in a number of them.
2.1.3Genderpatternsofemploymentin agriculture
When assessing gender patterns in rural employ-ment in the region, it is important to resist over-simplifications. In the COMESA member states, as elsewhere, rural households pursue diversified livelihood strategies by engaging in on-farm and off-farm activities, and in agricultural and non-agricultural work (figure 2). In particular, women work in agriculture as self-employed farmers on their own plots, as contributing family work-ers on the household plot, as wage labourers on other farms, and in agro-enterprises. Many de-rive complementary income from non-agricul-tural sources, including remittances and petty trade. Given this rural diversification of income sources, it is hard to discern clear gender-spe-cific impacts of trade on rural women. Different sub-groups of women are impacted differently
Male and female shares of agricultural employment in COMESA countries
Table 4
Maleshare Femaleshare
1995 2014e 1995 2014e
Burundi 45 47 55 53
Comoros 70 66 29 34
Congo, Dem.Rep of 43 39 57 61
Egypt 77 69 23 31
Eritrea 47 44 53 56
Ethiopia 60 59 40 41
Kenya 42 40 58 60
Libya 96 95 5 5
Madagascar 51 50 49 50
Malawi 44 43 56 57
Mauritius 77 70 25 30
Rwanda 44 41 56 59
Sudan 75 72 25 28
Swaziland 49 52 52 48
Uganda 44 37 56 63
Zambia 48 38 52 62
Zimbabwe 45 47 55 53
All COMESA countries 53 50 47 50
World 59 56 41 44
Source: UNCTAD secretariat aggregations based on data from ILO (2015b). Notes: The male share of agricultural employment is calculated as the total number of men employed in agriculture divided by to-tal agricultural employment; the female share is the total number of women employed in agriculture divided by total agricultural employment. Employment includes wage and non-wage labour. Figures for 2014 are estimates (e).
mo
du
leTrade and gender linkages: An analysis of COMESA4
8
Share of employment in agriculture by sex (per cent)
Gender wage gap in agriculture (per cent)
Table 5
Table 6
Femaleemploymentinagricultureasashareoftotalfemale
employment
Maleemploymentinagricultureasashareoftotalmaleemployment
1995 2014e 1995 2014e
Burundi 95 95 86 86
Comoros 83 85 70 71
Congo,Dem.Rep of 91 88 65 55
Egypt 42 43 32 24
Eritrea 87 86 63 61
Ethiopia 78 64 87 79
Kenya 87 85 55 49
Libya 3 2 11 14
Madagascar 80 83 77 81
Malawi 90 90 68 68
Mauritius 10 6 14 8
Rwanda 88 86 72 65
Sudan 56 55 57 52
Swaziland 57 53 36 35
Uganda 78 77 62 43
Zambia 75 72 67 39
Zimbabwe 66 72 48 60
All COMESA countries 78 74 60 55
World 42 33 41 27
Country Source 1998 2000 2001 2002 2003 2004 2005 2009 2010 2011 2012
Egypta
European Commission - Employment, wages and hours of work survey
12 23.9 13.5 25 30.2 53.7
Ethiopia
Labour Force Survey - Urban employment -unemployment survey
42.5 46.2
Madagascara
Household Survey - Enquête périodique auprès des mé-nages / Direction des Statistiques des Ménages
9.8
Mauritius
Labour Force Sur-vey - Continuous multi-purpose household survey
60.4 63
Source: UNCTAD secretariat aggregations based on data from ILO (2015b). Notes: Data for 2014 are estimates (e).
Source: ILOSTAT database, available at: http://www.ilo.org/global/statistics-and-databases/lang--en/index.htm (accessed on 10 May 2016). Note: Table refers to agriculture, hunting and forestry (ISIC, Rev. 3). The gender wage gap is unadjusted and is calculated as the dif-ference between average earnings of men and average earnings of women expressed as a percentage of average earnings of men.a Includes fisheries.

Trade and gender linkages: An analysis of COMESA 4
mo
du
le
9
often to the detriment of pastoralist herders and subsistence-oriented farmers (men and women). To give another example, cheap food imports as a result of trade liberalization benefit women as consumers, but they may at the same time erode rural women’s already meagre earnings as pro-ducers in the sector. Thus, given the diversity of women’s roles in agriculture, over-generalization does not seem appropriate.
In spite of this complexity, there are recurrent gender patterns in terms of income sources and conditions of employment that bear importantly on the trade analysis. In four COMESA countries for which data are available (Egypt, Ethiopia, Mauritius, and Madagascar), data show a widen-ing wage gap between men and women in agri-culture. 8 Available evidence thus suggests that women are often paid less than men for agricul-tural work (table 6).
Gender inequalities also exist in terms of vulner-ability of employment, as larger shares of wom-en in many lower-income economies, including COMESA countries, are typically employed as con-tributing family workers and as own-account or
casual workers (box 1).
An analysis based on scattered data for two COMESA countries (Rwanda and Malawi) sug-gests that rural women are less likely than men to have formal work arrangements, as they main-ly work as own-account workers and unpaid fam-ily workers (on-farm work) (box 2). 9 In addition, when women are formally employed in modern agricultural value chains (off-farm wage labour), they tend to be segregated in jobs characterized by low wages, high job insecurity, and generally poor labour standards.
Most rural women appear to still be significantly concentrated in subsistence-oriented agricul-ture. This attenuates their exposure to exter-nal shocks, as subsistence farmers are relatively shielded from trade shocks and economic down-turns. Note, however, that most subsistence farmers complement their income with other jobs, mainly seasonal off-farm work, and are ex-posed to external developments in these roles. 10 Further, most subsistence-oriented farmers pro-duce a surplus that is marketed locally, or even traded across the borders, and are vulnerable to
Who are own-account workers and contributing family workers?Box 1
by trade-led price developments, or the same women are impacted differently in their discrete roles or across their life cycle, due to age-specific patterns within employment in the agriculture
sector. For instance, flower farms create employ-ment opportunities for women in contract farm-ing, estate production, and agro-processing, but put a strain on water resources and divert land,
TheInternationalLabourOrganization(ILO)definesanown-account workerasapersonwhoworksonhis/herownaccountandholdsaself-employmenttypeofjob.Own-accountworkersmayruntheirowneconomicenterpriseorengageindependentlyinaprofessionortrade,anddonotusuallyhireemployeesonacontinu-ousbasis.Remunerationisdirectlydependentontheprofitmade,thusthecategoryofown-accountworkerscanincludeentrepreneurialactivitieswithrelativelysecureearningsaswellasmorecasualactivitiesatthemarginofsurvival.
Contributing family workers orunpaid family workers alsoholdself-employmentjobsbutareengagedinaneconomicenterpriseoperatedbyafamilymember.Theyusuallyreceivenoremunerationfortheirworkandhavenoindependentaccesstoincome.
Workersinthesetwocategories–own-accountworkersandcontributingfamilymembers–typicallyhavenoformalworkarrangementsoraccesstosocialprotectionprogrammesorotherbenefits,anddonotenjoydecentworkingconditions.Theyarethusconsideredtobeinthemostvulnerabletypesofemployment.Thus,vulnerableemploymentisdefinedbytheILOasthesumoftheemploymentstatusgroupsofown-accountworkersandcontributingfamilyworkers.
Inlower-incomecountrieswomenaretypicallymorelikelythanmentobeinvulnerableformsofemploy-ment.Thisismainlyduetoamuchlargershareofwomeninthecategoryof“unpaidfamilyworkers,”particu-larlyintheagriculturalsector.ThetrendisalsofoundinallCOMESAcountrieswheretheshareofvulnerableemploymentishigherforwomenthanformen(ILO,2014).

mo
du
leTrade and gender linkages: An analysis of COMESA4
10
trade developments to the extent that they have a marketable surplus.
Evidence from Rwanda and Malawi also suggests that vulnerability in agriculture is not only asso-ciated with own-account workers and unpaid family labourers (on-farm work): wage agricul-tural employment (off-farm work) also raises considerable concerns about vulnerability (box 2). Poverty in formal wage employment has a discrete gender dimension, as women tend to be over-represented among casual workers under vulnerable employment arrangements. Given this pattern of job segregation, off-farm agricul-tural activity does not necessarily offer a pathway out of poverty for rural women. What is crucial for poverty alleviation and inclusive economic growth is promoting decent agricultural off-farm employment by fostering policy dialogue among agriculture, trade, and labour stakeholders. It is also critically important to empower women as
small-scale farmers on their own account (on-farm work). As discussed below, this strategy has complex competitiveness implications.
2.2 Gender-based inequalities, competitiveness, and trade
The employment patterns outlined above reflect ingrained social norms, together with market im-perfections and failures. These gender structures impact export competitiveness and trade perfor-mance in a twofold way. As discussed in Module 3 of the core training manual, gender inequality hinders women’s productive and entrepreneurial potential, turning women into “underachievers of competitive advantage.” But gender inequality can also be used as a source of competitive ad-vantage, particularly in labour-intensive export agriculture. The following analysis considers how gender inequality impacts trade, with spe-cific reference to the COMESA region. It focuses
Gender patterns in rural employment: Evidence from Malawi and Rwanda Box 2
1 Subsistence does not mean that production is not marketed. Typically, subsistence-oriented farmers produce a surplus that is marketed locally. In border districts, part of the surplus is even traded across borders. This occurs via highly informal trade across porous borders with neighbouring countries. In most developing countries, the distinction between subsistence (for own consumption) and commercial (marketed) is, at best, artificial.Source: UNCTAD secretariat based on FAO (2011a) and UNCTAD (2014c).
Ruralwomenarelesslikelythanmentohaveformalworkarrangementsinagriculture,astheymainlyworkasown-accountworkersandunpaidfamilyworkers.InMalawi,86percentoftheruralworkingpopulationisemployedasunpaid/subsistencefarmers,andthisisespeciallythecaseforruralwomen(93percentofwomenworkinthesubsistencesector,comparedto79percentofmen)(FAO,2011a).InRwanda,about62percentofworkers(72percentofemployedwomen,comparedto49percentofemployedmen)workon-farm(independentfarming)astheirmainjob,whileonlyapproximately10percent(9.7percentofwomenand10.2ofmen)areinwagefarmingastheirmainjob(UNCTAD,2014c;IntegratedHouseholdLivingConditionsSurvey3-EICV3).InRwanda,asinothersub-SaharanAfricancountries,on-farmworkisstillmainlysubsist-ence-oriented.1
Whenwomenworkinwageagriculturallabour,theytendtobesegregatedinvulnerableemployment.Thispatternofsegregationcanbeseenintworelatedrespects.First,womenoutnumbermeninpart-time/sea-sonal/casual-wageemployment.InMalawi,forexample,lessthanathirdofruralwomenengagedinwagelabourastheirmainjobworkfull-timethroughtheyear,comparedtonearlyhalfofruralmen.Whentakingintoaccountwagelabourasasecondjob,88percentofwomen,comparedto65percentofmen,workincasual,part-time(ganyu)work(FAO,2011a,basedonthe2004/2005RIGAdatabase).InRwanda,theestimatedshareofruralwomeninvolved inseasonalwork is68percent,comparedto52percentofmen(UNCTAD,2014c,basedonEICV3).Second,andinarelatedvein,womentendtobeover-representedinlow-paidjobs.InMalawi,61percentofruralwomeninwageemploymentfallwithinthelow-wagecategory,comparedto37percentoftheirmalecounterparts(FAO,2011a,basedthe2004/2005RIGAdatabase).
Theincidenceofpovertyisparticularlyhighinagriculturalwagelabour.InMalawi,forexample,thepooresthouseholds,andinparticularfemale-headedones,aremorelikelytobeinvolvedinagriculturalwagelabour(which is likely lowpaidandcasual) thanhigher-incomehouseholds (FAO,2011a,basedon the2004/2005RIGAdatabase).InRwanda,61percentofruralworkersinwageemploymentweredefinedaspoor,whilethepercentagedecreasedto46percentforown-accountfarmers(on-farmwork)andto22percentforwagedworkersoutsideagriculture(UNCTAD,2014c,basedonEICV3).Povertyinformalwageemploymenthasadis-cretegenderdimension,aswomentendtobeover-representedamongcasualworkersundervulnerableem-ploymentarrangements.
Trade and gender linkages: An analysis of COMESA 4
mo
du
le
11
on major gender-specific obstacles that rural women face in the COMESA context and reviews the competitiveness implications of those obsta-cles for trade.
2.2.1Thegendergapinagricultureandits underlyingfactors
Women farmers and rural entrepreneurs face a wide array of gender-specific obstacles that hin-der their productivity and entrepreneurial poten-tial. The multiple challenges that female farmers face have been widely detailed in policy analysis (for an overview, see FAO, 2011b, and UNCTAD, 2015a). Suffice it to recall here the main factors that explain why women tend to be segregated in vulnerable rural employment, with specific ref-erence to the COMESA context.
The burden of domestic care work. At the outset, it is important to stress that women’s partici-pation in rural employment is affected by their domestic work burden. Women tend to have the primary responsibility for household duties, in-cluding caring for children and the elderly. For example, according to the World Bank and ONE Campaign, female farmers in Ethiopia spend al-most nine hours fewer per week working on their farm than males, and this disparity is held to ac-count for 13 per cent of the overall gender gap in agricultural productivity (O’Sullivan et al., 2014). In Rwanda, women devote 27 hours per week to
domestic duties, compared to nine hours for men (UNCTAD, 2014c). In Malawi, rural women dedi-cate more time to domestic activities than men (FAO, 2011a). This pattern is common across other COMESA countries. Women’s domestic work bur-dens limit the number of hours they can devote to productive activities, on-farm and off-farm, and constrain their mobility.
Educational attainment. In some contexts, rural women tend to have lower literacy rates and few-er years of education than men. In Ethiopia, for example, only 37 per cent of rural women are able to read and write without difficulty, compared to 55 per cent of men (Central Statistical Agency of Ethiopia and World Bank, 2015). In Rwanda as well, there are significant gender differences in rural literacy rates: 62.4 per cent of female heads of households in rural areas are illiterate, compared to only 28.7 per cent of male heads of households, according to 2008 survey data from the National Institute of Statistics of Rwanda. In Malawi, rural women in the lowest income quintile have, on average, one year of education compared to four years for their male counterparts (FAO, 2011a) Uganda’s female agricultural farm managers complete on average 1.9 fewer years of schooling than male managers (O’Sullivan et al., 2014). Low-er literacy rates and education for rural women translate into substantial competitive disadvan-tages for female farmers and rural entrepreneurs in key respects, including their ability to apply for
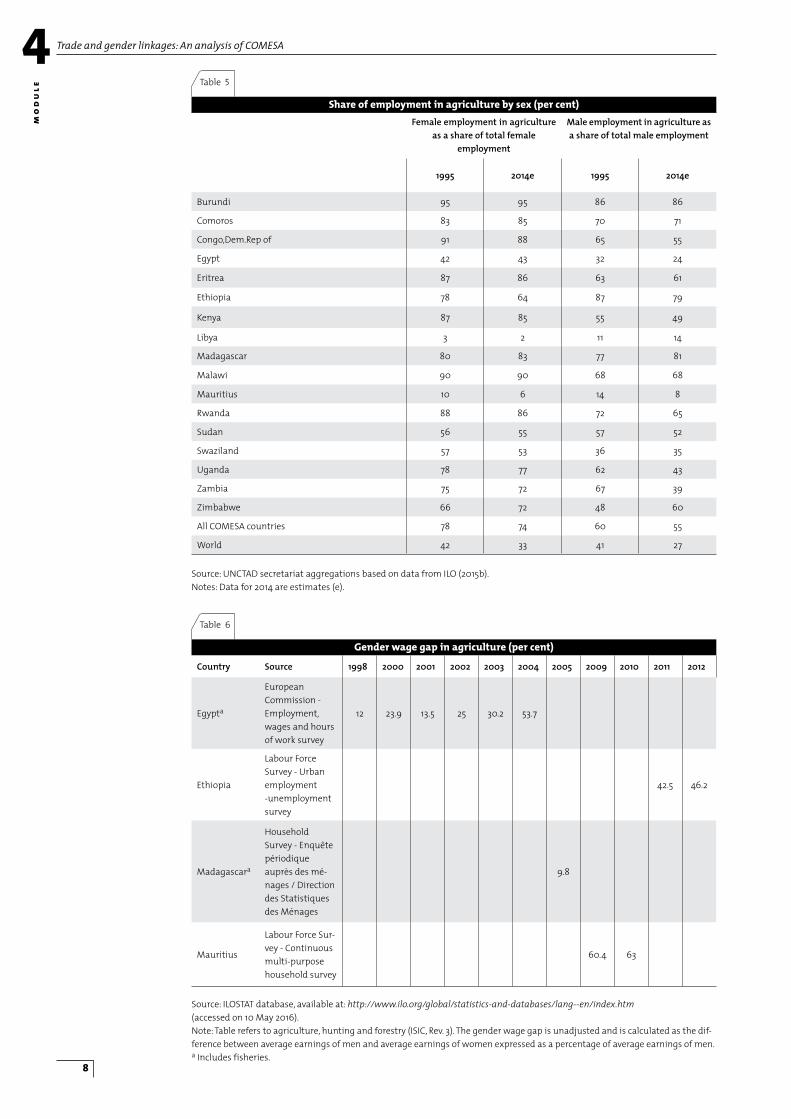
Share of male and female agricultural holders in selected COMESA countries (per cent)Figure 3
Source: Food and Agriculture Organization Gender and Land Rights Database (http://www.fao.org/gender-landrights-database/en/, accessed on 15 May 2015) based on data from national agricultural censuses. Notes: Per cent of female holders: (number of women agricultural holders/total agricultural holders)*100; per cent of male holders: (number of men agricultural holders/total agricultural holders)*100. The agricultural holder is defined as the person who makes the major decisions regarding the use of resources, and exercises management control over the agricultural holding. An agricul-tural holding is an economic unit of agricultural production under single management. Percentages of women and men holders by country do not always add up to 100 in the event, for example, of joint holdings or unreported gender.

mo
du
leTrade and gender linkages: An analysis of COMESA4
12
credit, use market information, or meet market requirements such as specifications..
Land ownership. Data from numerous COMESA countries also show a consistent pattern of gen-der inequality in control over land (figure 3). This inequality generally reflects socio-cultural norms enshrined in customary law and practice, rather than formal discrimination in land ownership and inheritance rights. This is the case in Ethio-pia, for example (box 3). In some instances, how-ever, the inequality also stems from discrimina-tion in the law. 11
Household farm labour. Availability of house-hold farm labour is another major constraint to female farmers’ productivity (O’Sullivan et al., 2014). Female-headed households tend to have fewer working members than male-headed households. Likewise, female farmers in male-headed households face difficulties in mobiliz-ing extra labour for their own plots. In Malawi, for example, female-headed households have on average about one-third fewer working mem-bers than male-headed households and thus can draw upon a smaller pool of farm labourers than men (FAO, 2011a). Ethiopia’s female farm manag-ers live in households with 1.7 fewer members on average than male farm managers, and this difference is held to explain nearly a quarter of the overall gender productivity gap (O’Sullivan et al., 2014). A similar pattern is observed for female farm managers in Uganda (O’Sullivan et al., 2014). Limited availability of household farm labour re-sults in significant labour constraints for female
farmers, which holds back their growth potential.
Access to resources and market opportunities. Finally, across different contexts, women consist-ently face structural biases in access to credit, ag-ricultural inputs, extension services, and markets (COMESA, undated). In Ethiopia, for example, only 6 per cent of rural women have access to credit and only 1 per cent have vocational skills training (UNFPA et al. undated). Another important issue is limited access to farm inputs and lower returns on their use. In Uganda, plots managed by men or jointly with other family members are nearly twice as likely to use pesticides and organic fer-tilizer as plots managed by women (O’Sullivan et al., 2014). Ethiopia’s women farmers gener-ate smaller yield improvements than men even when they apply the same amount of fertilizer on their farms, which suggests that women may receive less effective extension advice or guid-ance than men (O’Sullivan et al., 2014). Gender biases in transport facilities, logistics, and market information further contribute to marginalizing women in trade.
2.2.2Implicationsforcompetitivenessandtrade
The key obstacles and differences outlined above have important competitiveness implications. Two aspects deserve attention: women as under-achievers of competitive advantage, and women as a source of competitive advantage.
Gender-sensitive land regulation and control over land: The case of Ethiopia Box 3
Source: Food and Agriculture Organization Legal Assessment Tool for gender-equitable land tenure.
InEthiopia,only20percentofthosewhoexercisecontroloverland(agriculturalholders)arewomen.YetEthi-opia’slegalframeworkisprogressiveandgender-sensitiveonmattersoflandtenureinanumberofareas:• Thecountryhasratifiedkeyhumanrightsinstruments,includingtheConventionontheEliminationof
AllFormsofDiscriminationagainstWomen;• Theprohibitionofgender-baseddiscriminationisenshrinedintheConstitution,whichsupersedesdis-
criminatorycustomarylaw;• Womenhavelegalcapacity,includingtoconcludecontracts,underthesameconditionsasmen;• Thelawrecognizesgenderequalityintherighttoownorcontrolpropertyregardlessofthetypeofmar-
riage;• Communityofpropertyisthedefaultmaritalpropertyregimeandthewife’sconsentismandatoryfor
anytransactioninvolvingmatrimonialproperty;• Brothersandsistershaveequalinheritancerights;and• Thereareprovisionsforthepromotionofwomen’srightstoland.Genderdifferencesincontroloverlandmainlyreflectsociallyingrainedgendernormsthatmayleadwomenandgirlstogiveuptheirclaimsonthefamilyproperty,ortodelegatemanagerialdecisionsinpracticetothespouse.Lackofawarenessoflawsandlegalvenues,oroffreelegalsupportincivilprocedures,alongsidelogisticalandfinancialconstraintsandfearofreprisalorostracism,furtherdiscouragewomenfromseekinglegalredressincourts.
Trade and gender linkages: An analysis of COMESA 4
mo
du
le
13
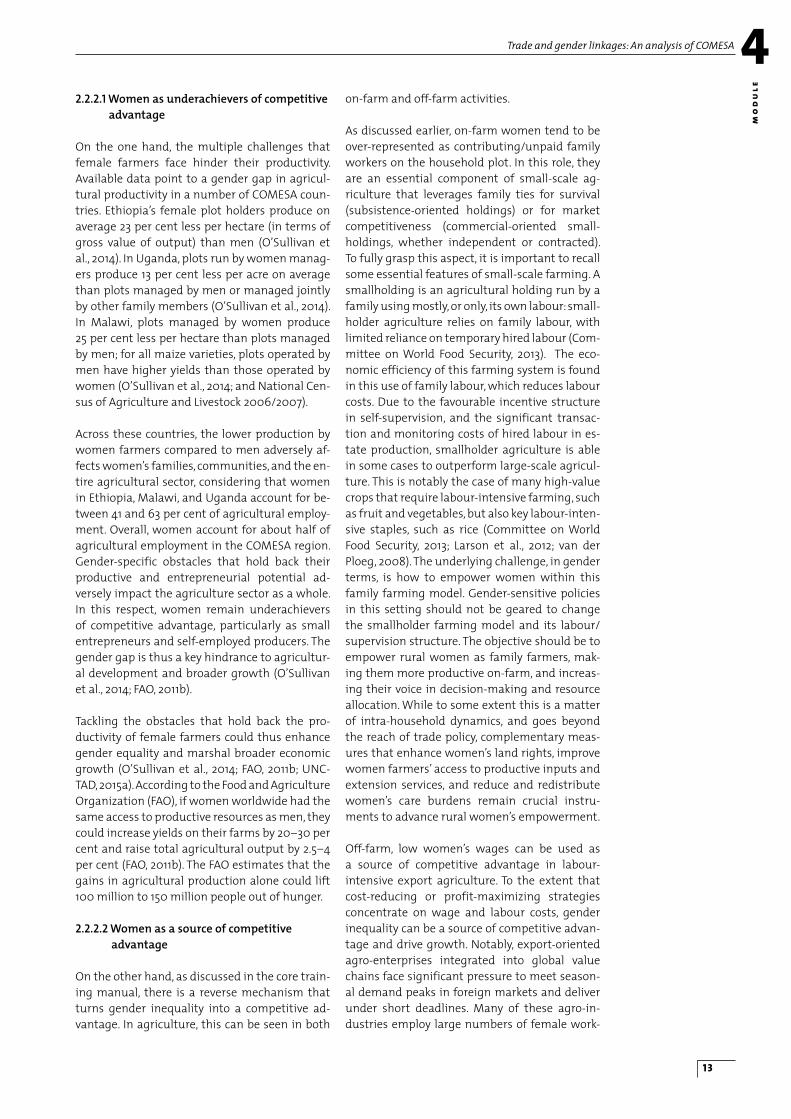
2.2.2.1Womenasunderachieversofcompetitiveadvantage
On the one hand, the multiple challenges that female farmers face hinder their productivity. Available data point to a gender gap in agricul-tural productivity in a number of COMESA coun-tries. Ethiopia’s female plot holders produce on average 23 per cent less per hectare (in terms of gross value of output) than men (O’Sullivan et al., 2014). In Uganda, plots run by women manag-ers produce 13 per cent less per acre on average than plots managed by men or managed jointly by other family members (O’Sullivan et al., 2014). In Malawi, plots managed by women produce 25 per cent less per hectare than plots managed by men; for all maize varieties, plots operated by men have higher yields than those operated by women (O’Sullivan et al., 2014; and National Cen-sus of Agriculture and Livestock 2006/2007).
Across these countries, the lower production by women farmers compared to men adversely af-fects women’s families, communities, and the en-tire agricultural sector, considering that women in Ethiopia, Malawi, and Uganda account for be-tween 41 and 63 per cent of agricultural employ-ment. Overall, women account for about half of agricultural employment in the COMESA region. Gender-specific obstacles that hold back their productive and entrepreneurial potential ad-versely impact the agriculture sector as a whole. In this respect, women remain underachievers of competitive advantage, particularly as small entrepreneurs and self-employed producers. The gender gap is thus a key hindrance to agricultur-al development and broader growth (O’Sullivan et al., 2014; FAO, 2011b).
Tackling the obstacles that hold back the pro-ductivity of female farmers could thus enhance gender equality and marshal broader economic growth (O’Sullivan et al., 2014; FAO, 2011b; UNC-TAD, 2015a). According to the Food and Agriculture Organization (FAO), if women worldwide had the same access to productive resources as men, they could increase yields on their farms by 20–30 per cent and raise total agricultural output by 2.5–4 per cent (FAO, 2011b). The FAO estimates that the gains in agricultural production alone could lift 100 million to 150 million people out of hunger.
2.2.2.2Womenasasourceofcompetitive advantage
On the other hand, as discussed in the core train-ing manual, there is a reverse mechanism that turns gender inequality into a competitive ad-vantage. In agriculture, this can be seen in both
on-farm and off-farm activities.
As discussed earlier, on-farm women tend to be over-represented as contributing/unpaid family workers on the household plot. In this role, they are an essential component of small-scale ag-riculture that leverages family ties for survival (subsistence-oriented holdings) or for market competitiveness (commercial-oriented small-holdings, whether independent or contracted). To fully grasp this aspect, it is important to recall some essential features of small-scale farming. A smallholding is an agricultural holding run by a family using mostly, or only, its own labour: small-holder agriculture relies on family labour, with limited reliance on temporary hired labour (Com-mittee on World Food Security, 2013). The eco-nomic efficiency of this farming system is found in this use of family labour, which reduces labour costs. Due to the favourable incentive structure in self-supervision, and the significant transac-tion and monitoring costs of hired labour in es-tate production, smallholder agriculture is able in some cases to outperform large-scale agricul-ture. This is notably the case of many high-value crops that require labour-intensive farming, such as fruit and vegetables, but also key labour-inten-sive staples, such as rice (Committee on World Food Security, 2013; Larson et al., 2012; van der Ploeg, 2008). The underlying challenge, in gender terms, is how to empower women within this family farming model. Gender-sensitive policies in this setting should not be geared to change the smallholder farming model and its labour/supervision structure. The objective should be to empower rural women as family farmers, mak-ing them more productive on-farm, and increas-ing their voice in decision-making and resource allocation. While to some extent this is a matter of intra-household dynamics, and goes beyond the reach of trade policy, complementary meas-ures that enhance women’s land rights, improve women farmers’ access to productive inputs and extension services, and reduce and redistribute women’s care burdens remain crucial instru-ments to advance rural women’s empowerment.
Off-farm, low women’s wages can be used as a source of competitive advantage in labour-intensive export agriculture. To the extent that cost-reducing or profit-maximizing strategies concentrate on wage and labour costs, gender inequality can be a source of competitive advan-tage and drive growth. Notably, export-oriented agro-enterprises integrated into global value chains face significant pressure to meet season-al demand peaks in foreign markets and deliver under short deadlines. Many of these agro-in-dustries employ large numbers of female work-

mo
du
leTrade and gender linkages: An analysis of COMESA4
14
ers, mainly because of women’s lower wages and weaker bargaining power, with the result that female workers often remain clustered in sea-sonal, casual, and temporary work. This issue has been considered quite extensively with reference to the flower industry, particularly in light of the tight margins and labour-intensive nature of the cut-flower segment. Further, international price competition is intense, including among COME-SA suppliers, 12 and the price elasticity of demand is relatively high, which translates back into pres-sures to keep labour costs low. As discussed in the core training module, the relatively lower pay that women receive makes them an attractive la-bour force for firms that face stiff competition in the international market. To maintain a competi-tive edge over competitors, some maintain that the industry needs to keep wages low. The same holds for labour-intensive processing of other specialty crops. Yet, this line of reasoning simpli-fies the complexity of market requirements (box 4).
2.3 Gender implications of COMESA's trade and agricultural strategies
The previous analysis has briefly considered some channels through which gender inequal-ity impacts trade. We now explore the other side of the equation: how trade affects gender, and more precisely, what the consequences are of deeper trade integration for the economic em-powerment and well-being of rural women in the COMESA region.
COMESA has endorsed the Comprehensive Africa Agricultural Development Programme (CAADP) as its strategic framework for agriculture. 13 The strategy is geared towards transforming the still largely traditional and subsistence agricultural sector into a productive, high-value, and market-oriented sector with forward and backward link-
ages to other sectors. In terms of staple foods, the COMESA framework ambitiously seeks to achieve food security through self-sufficiency at the re-gional level. 14 This assumes two key advances: increased agricultural productivity of crops, livestock, fisheries, and forestry; and a freer flow of intra-COMESA agricultural trade by remov-ing all trade barriers so that commodities will move from surplus to deficit areas in the region driven primarily by market forces. Agriculture in the COMESA region will undergo a significant transformation in order to meet the challenge of achieving regional food security through in-creased output and more fluid intra-regional flows of food. Investment is being directed to-wards increasing productivity of food staples, mainly through improved yields. 15 This typically implies more intensive and higher external-in-put production systems through mechanization and increased use of commercial inputs (fertiliz-ers, higher-value seeds, improved breeds in live-stock); more efficient extension advice, coupled with training and backed by agronomic research; and credit/financing schemes. Infrastructure in-vestment is also critical to establish, expand, and connect markets. The focus is on both physical assets (bulking structures for storage, transport, grading, and marketing; feeder roads; transit cor-ridors) and “soft” infrastructure, or operational mechanisms, including credit guarantee fa-cilities, warehouse receipt systems, quality and grading facilities, market information and intelli-gence services, and cooperative structures. Over-all, the trend is towards intensive, high-external-input production systems, scale economies, and proprietary models of knowledge generation and diffusion.
The question is whether rural women will be able to reap the benefit of this trade-led transforma-tion process. As mentioned, different groups of women will be variously affected by deeper
Competitive advantage is not only about labour costsBox 4
Adynamicexaminationofmarketsgivesamorenuancedpictureofcompetitivenessthatgoesbeyondthecostsoflabour:“decentwork”intheflowerindustrydoesnotnecessarilytranslateintoadisadvantageouscompetitiveposition.Ithasbeenobserved,inthisrespect,thatfactorsotherthanlabourcostsarelikelytohavemajorimpactsonthecompetitivenessofcompaniesintheflowerbusiness.Thesefactorsincludeclimateandweatherconditions,currencyratefluctuations,andoilprices(externalfactors),alongsidecompetitiveairfreightcostsandresearchanddevelopment(internalfactors)(Rikken,2011).Inthissetting,increasedlabourcostscanbeoffsetbyhigheryieldsorefficiencygainsinlogistics,asshownbytheDutchcase.Notealsothat,inanincreasinglycomplexmarketenvironment,competitionisnolongerrestrictedtocostsandprices.Otherfactorssuchasconnectivity,qualitystandardsandcertifications,innovation,andexploitationofculturalandgeographic identityall contribute to thecompetitiveedgeof the industry (Rikken,2011). Inparticular, thedownwardpressureonlabourcostsis,inthecut-flowerindustry,offsetbyacountervailingmarketpressurethatstemsfromthe“green”or“fairtrade”labellingmovement(Davies,2000).Eventually,theroomisopenfora“highpath”todevelopment,wherebyincreasedlabourcostsareoffsetbyhigheryieldsandpricepremiums.

Trade and gender linkages: An analysis of COMESA 4
mo
du
le
15
agricultural market integration in the COMESA region. More fluid cross-border flows of food sta-ples 16 will create opportunities for female (and male) farmers in food surplus (exporting) areas, but may also adversely affect female farmers (to the extent that they produce a marketable sur-plus) in deficit (importing) countries by disrupt-ing markets in which they operate. 17 Similarly, the process will likely favour women in modern supply chains (high-value smallholder contract-farming, large-scale estate production, and agro-industrial processing), while diverting resources (including land and water) from, and further marginalizing, women in traditional, subsist-ence-oriented farming. These redistributive ef-fects are part of the political economy of agricul-tural trade, which is inherently redistributive and dynamic. 18 Given the diversity of women’s roles in agriculture, there is no single answer to the question of whether women will benefit or lose from expanded trade.
As widely discussed elsewhere (FAO, IFAD, and ILO, 2010; Kinyanjui, 2006; UNCTAD, 2015a and 2016), the commercialization process in agricul-ture may magnify existing gender inequalities, absent proactive gender-sensitive and gender-redistributive measures. Indeed, to reap the full benefit from agricultural trade liberalization policies, farmers must dynamically adapt (UNC-TAD, 2009). As discussed, female farmers face a wide array of supply-side constraints and chal-lenges – limited flexibility in terms of time and mobility, limited access to credit, lack of collat-eral, and small scale, among others – that hinder their ability to upgrade and meet increasingly demanding market requirements. The relatively poor adaptation of women to the challenges and opportunities of integrated markets is among the most important reasons why trade policies pose gender-specific problems in agriculture (FAO, IFAD, and ILO, 2010; UNCTAD, 2009, 2015a, 2016). As stated in the COMESA Gender Policy, “[w]omen are…likely to be inadvertently excluded from the benefits of a Free Trade Area due to complicated procedures such as adherence to rules of origin in order for goods to be excluded from customs duty charges. Most women may not be aware of this requirement due to illiteracy and lack of in-formation while the majority may not qualify for certificates of origin due to the simple produc-tion processes used by them. Inadequate access to credit and finance is a major barrier to effec-tive participation in regional and international trade. Collateral requirements disqualify many women, who have limited access to and control over property, from effective and adequate bor-rowing. The low quality of goods produced by women is another main barrier to their partici-
pation in regional trade. This contributes to their inability to compete effectively under the liberal-ized economy” (COMESA, 2002, 13).
Gender-sensitive policy interventions are thus needed to holistically address the multiple chal-lenges faced by female farmers, and to ease the constraints on their ability to meet market re-quirements. The COMESA Gender Policy in Agri-cultural Development and the COMESA Strategic Framework, alongside reports from the World Bank, FAO, and the International Fund for Ag-ricultural Development (IFAD), offer a detailed menu of actions and best practices that govern-ments can consider in their efforts to boost farm productivity for the benefit of women farmers.19 Key policies include providing community-based child-care centres; strengthening the enforce-ment of women’s land rights; enhancing wom-en’s use of tools and equipment that reduce the amount of farm labour; encouraging women farmers to efficiently use agricultural inputs; tailoring extension services to women’s needs; leveraging social networks to spread agricultural knowledge; strengthening women’s associations to pool resources and production and to scale up; facilitating women’s access to and effective participation in markets; and raising the edu-cation levels of women farmers. Beyond these supply-side interventions, UNCTAD and the In-ternational Trade Centre have offered specific in-sights on how to leverage trade value chains and meso-level structures (including procurement) to empower rural women in producing countries (UNCTAD, 2014c).
It is also important to raise fundamental ques-tions as to the development pathway to be pur-sued in agriculture. A transformative pathway towards industrial agriculture (based on mech-anization, commercial high-yielding varieties, agrochemicals, etc.) tends to favour commer-cially-oriented farmers who have easier access to inputs and marketing networks, and crowd out poor, risk-averse small-scale producers. This paradigm has been increasingly questioned on account of its social consequences and negative environmental externalities. Alternative models are being explored that put more emphasis on the competitiveness of smallholder agriculture, the functional complementarities between large and small farms, and the new value-added prod-ucts and services that leverage traditional agri-culture, including the delivery of so-called green and blue services and high-value niche products. These models leverage women’s knowledge and farming methods. They are worth being fully ex-plored for their potential to offer a socially inclu-sive and sustainable pathway out of poverty.

mo
du
leTrade and gender linkages: An analysis of COMESA4
16
3 Trade and gender in the manufacturing sector
This section focuses on the trade-gender nexus in the manufacturing sector in COMESA coun-tries. Table 7 provides stylized facts on the partici-pation of women in the manufacturing sector of COMESA countries.
Although COMESA countries are relatively diverse along many dimensions (economic size, social de-velopment, production structures, etc.), this sec-tion concentrates on certain common features in order to understand how trade in manufacturing goods affects women in these countries. First to be explored is existing evidence on how women have been affected by similar export-oriented policies in the manufacturing sector adopted in COMESA countries, namely the setting up of ex-port processing zones (EPZs). Second, the section investigates the consequences of tariff changes on gender labour outcomes in the context of fu-ture trade agreements of COMESA countries with the European Union and with the East African Community and the Southern African Develop-ment Community.
3.1 The consequences of export processing zones on women in COMESA countries
Starting in the 1960s, a number of developing
countries initiated policies aimed at diversifying and boosting their exports. The implementation of EPZs has been critical in that regard. Although EPZs differ across countries, they have in com-mon the promotion of “exports of goods and/or services by offering a more competitive business environment through provision of special incen-tives including in particular tariff exemptions to inputs either in a geographically defined area or through a specification process” (Engman et al., 2007, 11). Under this regime, firms can be exempt-ed from customs and excise duties for scheduled equipment, and benefit from free repatriation of capital, profits, and dividends. In certain cases, firms operating in an EPZ also take advantage of preferential interest rates and more flexible la-bour laws, especially regarding overtime and dis-missal. Within COMESA, 11 countries have created EPZs: Egypt, Eritrea, Kenya, Madagascar, Malawi, Mauritius, Namibia, Rwanda, Uganda, Zambia, and Zimbabwe (table 8). In all these countries, the predominant sector in the EPZs is textiles and garments. Although most EPZs in COMESA were created in the early 1990s, this strategy remains topical, as illustrated by the ongoing discussions in Zimbabwe on re-introducing of EPZs to foster economic activity.
This section gathers existing evidence about the impact of EPZs in COMESA countries on women’s employment, wages, and working conditions.
Female share of employment in the manufacturing sector (per cent)
Table 7
Country Femaleshareoftotalemployment(percent)
Shareoffemaleemployment(percentoftotalfemaleemployment)
Burundi n.a. 0.7
Congo, DR n.a. 4.9
Egypt 7.6 5
Ethiopia 43.7 8
Kenya 18.4 2.3
Madagascar 63.7 8.1
Malawi n.a. 5
Mauritius 42.6 26.1
Namibia 32.6 5.3
Rwanda 34 2.4
Seychelles 41.3 10.4
Uganda 38.7 4.6
Zambia 27 3.4
Zimbabwe 22.5 3
Sources: ILOSTAT (2016); World Bank (2015); and national authorities. Notes: Data in the second column refer to the share of women in employment as a per cent of both sexes (from ILOSTAT, 2015). Data in the third column refer to the share of women as a per cent of total female employment (from World Bank, 2015, and national authorities). n.a.: not available.

Trade and gender linkages: An analysis of COMESA 4
mo
du
le
17
Export processing zones in COMESA countries
Table 8
Country Establishment of the first exportprocessingzone
Mainsector
Egypt 1989 Textiles, electronic assembling, petroleum
Eritrea 2006 Agro-processing, transport, mining
Kenya 1990 Textiles, agro-processing, services, pharmaceuticals
Madagascar 1989Textiles, information and communications tech-
nology, agro-processing
Malawi 1995 Textiles, rubber, agro-processing, flowers
Namibia 1995 Textiles, electronic assembling, agro-processing
Mauritius 1970 Textiles, agro-processing
Rwanda 2006 Agro-processing, petroleum
Uganda 2002 Agro-processing, steel
Zambia 2006Horticulture, processed food, mining and mineral
processing
Zimbabwe 1995–2006 --
Sources: National authorities.
Who are the women hired in the export processing zone in Madagascar? Box 5
RelyingonadetailedlaboursurveyimplementedbytheMalagasyNationalStatisticsOffice,GlickandRou-baud(2004)investigatedatthemicroeconomicleveltheindividualcharacteristicsofwomenemployedintheexportprocessingzone(EPZ)between1995and2002.TheauthorsfindthatwomenemployedintheMalagasyEPZtendtobeyoung(28yearsoldonaverage)andyoungercomparedtowomenworkinginotherinstitu-tionalsectors(34yearsoldonaverageintheprivateformalsector).Inaddition,womenworkingintheEPZarelikelytoholdalowereducationaldegree.ThesepatternsareconsistentwiththecharacteristicsofwomeninvolvedinEPZselsewhere(KusagoandTzannatos,1998),exceptforthefactthatbeingmarrieddoesnotap-pearasadiscriminantfactorinMadagascar(Seguino,1997).
3.1.1Exportprocessingzonesandfemale employment
As discussed in Section 2 of Module 1, the im-plementation of export-oriented strategies in most countries has been correlated with a mas-sive influx of women into the labour-intensive manufacturing sector, a phenomenon known as the feminization of labour. This shift has been explained by the cost-minimizing behaviour of employers confronted with stiff international competition (Standing, 1989, 1999). In the EPZ setting, hiring women as a source of competi-tive advantage allows firms to lower their labour costs, owing to the gender wage gap, while in-creasing their flexibility to respond to demand fluctuations because of the generally minimal bargaining power of workers regarding work-ing conditions, overtime, and social protection (Tejani, 2011). In addition to these factors, gender scholars have stressed the influence of gender stereotypes according to which women are en-dowed with labour-intensive compliant traits
such as dexterity, docility, and submissiveness (Elson and Pearson, 1981).
Existing statistics about female employment in EPZs provide evidence for the feminization of la-bour in the COMESA countries as well. In Mau-ritius, the textile sector, the main activity in the EPZ, has attracted an increasing number of wom-en. In 1970, women accounted for 40 per cent of the labour force employed in the Mauritian tex-tile sector; by 1976, this proportion exceeded 70 per cent (Blin, 2008). Between 1983 and 2001, the number of female workers in the manufactur-ing sector increased from 18,400 to 61,200. Some economists (Milner and Wright, 1998; Subrama-nian and Roy, 2001) have even argued that the mobilization of women in the EPZ in Mauritius has been a key ingredient in the so-called “Mauri-tius success story.” In Madagascar, data from the National Statistics Office reveal that although the vast majority (87 per cent) of active Malagasy women work in the informal sector, they are pre-dominant in the formal sector only in the EPZ (or
mo
du
leTrade and gender linkages: An analysis of COMESA4
18
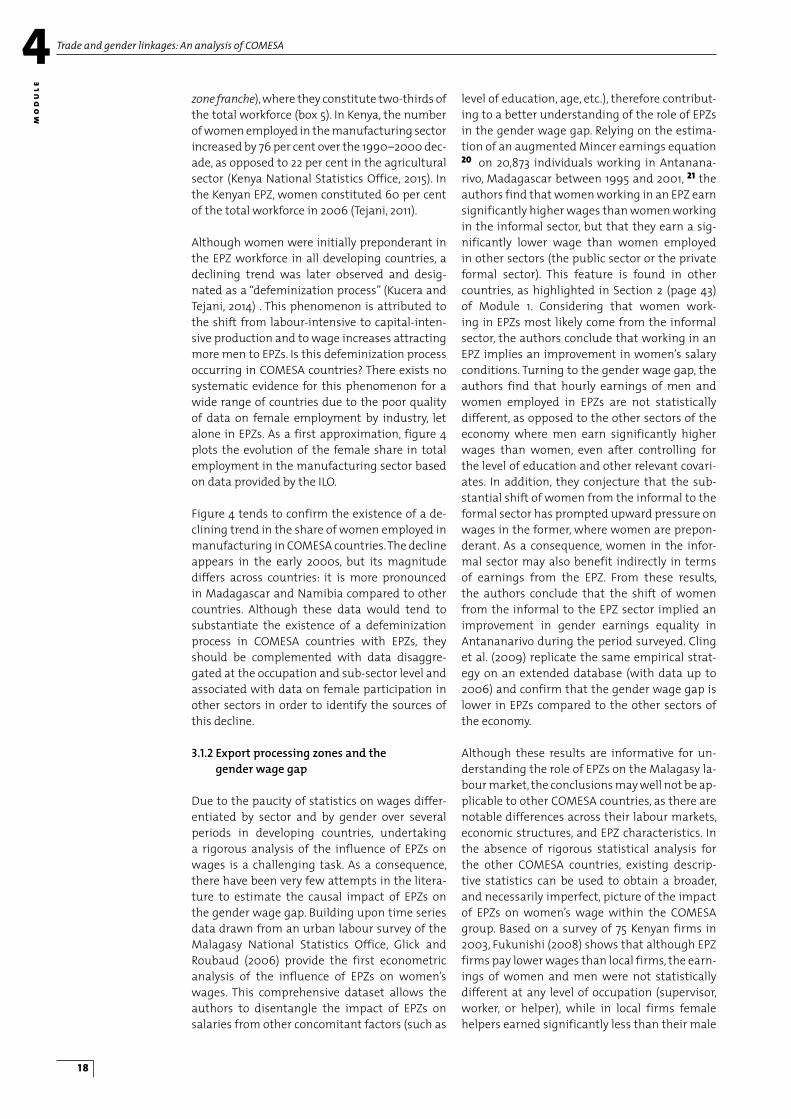
zone franche), where they constitute two-thirds of the total workforce (box 5). In Kenya, the number of women employed in the manufacturing sector increased by 76 per cent over the 1990–2000 dec-ade, as opposed to 22 per cent in the agricultural sector (Kenya National Statistics Office, 2015). In the Kenyan EPZ, women constituted 60 per cent of the total workforce in 2006 (Tejani, 2011).
Although women were initially preponderant in the EPZ workforce in all developing countries, a declining trend was later observed and desig-nated as a “defeminization process” (Kucera and Tejani, 2014) . This phenomenon is attributed to the shift from labour-intensive to capital-inten-sive production and to wage increases attracting more men to EPZs. Is this defeminization process occurring in COMESA countries? There exists no systematic evidence for this phenomenon for a wide range of countries due to the poor quality of data on female employment by industry, let alone in EPZs. As a first approximation, figure 4 plots the evolution of the female share in total employment in the manufacturing sector based on data provided by the ILO.
Figure 4 tends to confirm the existence of a de-clining trend in the share of women employed in manufacturing in COMESA countries. The decline appears in the early 2000s, but its magnitude differs across countries: it is more pronounced in Madagascar and Namibia compared to other countries. Although these data would tend to substantiate the existence of a defeminization process in COMESA countries with EPZs, they should be complemented with data disaggre-gated at the occupation and sub-sector level and associated with data on female participation in other sectors in order to identify the sources of this decline.
3.1.2Exportprocessingzonesandthe genderwagegap
Due to the paucity of statistics on wages differ-entiated by sector and by gender over several periods in developing countries, undertaking a rigorous analysis of the influence of EPZs on wages is a challenging task. As a consequence, there have been very few attempts in the litera-ture to estimate the causal impact of EPZs on the gender wage gap. Building upon time series data drawn from an urban labour survey of the Malagasy National Statistics Office, Glick and Roubaud (2006) provide the first econometric analysis of the influence of EPZs on women’s wages. This comprehensive dataset allows the authors to disentangle the impact of EPZs on salaries from other concomitant factors (such as
level of education, age, etc.), therefore contribut-ing to a better understanding of the role of EPZs in the gender wage gap. Relying on the estima-tion of an augmented Mincer earnings equation 20 on 20,873 individuals working in Antanana-rivo, Madagascar between 1995 and 2001, 21 the authors find that women working in an EPZ earn significantly higher wages than women working in the informal sector, but that they earn a sig-nificantly lower wage than women employed in other sectors (the public sector or the private formal sector). This feature is found in other countries, as highlighted in Section 2 (page 43) of Module 1. Considering that women work-ing in EPZs most likely come from the informal sector, the authors conclude that working in an EPZ implies an improvement in women’s salary conditions. Turning to the gender wage gap, the authors find that hourly earnings of men and women employed in EPZs are not statistically different, as opposed to the other sectors of the economy where men earn significantly higher wages than women, even after controlling for the level of education and other relevant covari-ates. In addition, they conjecture that the sub-stantial shift of women from the informal to the formal sector has prompted upward pressure on wages in the former, where women are prepon-derant. As a consequence, women in the infor-mal sector may also benefit indirectly in terms of earnings from the EPZ. From these results, the authors conclude that the shift of women from the informal to the EPZ sector implied an improvement in gender earnings equality in Antananarivo during the period surveyed. Cling et al. (2009) replicate the same empirical strat-egy on an extended database (with data up to 2006) and confirm that the gender wage gap is lower in EPZs compared to the other sectors of the economy.
Although these results are informative for un-derstanding the role of EPZs on the Malagasy la-bour market, the conclusions may well not be ap-plicable to other COMESA countries, as there are notable differences across their labour markets, economic structures, and EPZ characteristics. In the absence of rigorous statistical analysis for the other COMESA countries, existing descrip-tive statistics can be used to obtain a broader, and necessarily imperfect, picture of the impact of EPZs on women’s wage within the COMESA group. Based on a survey of 75 Kenyan firms in 2003, Fukunishi (2008) shows that although EPZ firms pay lower wages than local firms, the earn-ings of women and men were not statistically different at any level of occupation (supervisor, worker, or helper), while in local firms female helpers earned significantly less than their male

Trade and gender linkages: An analysis of COMESA 4
mo
du
le
19
Female share in the manufacturing sector, 1998–2014 (per cent)Figure 4
Source: Prepared by the UNCTAD secretariat based on the ILOSTAT (2016). Notes: Linear fits were estimated for missing values.
counterparts. This corroborates that the gender wage gap tends to be lower in EPZs. Yet, these fig-ures should be considered with caution as they do not take into account individual characteris-tics (such as education and experience) that may also influence the gender wage gap.
Relying on the results of the Household Budget Survey conducted by the Central Statistics Office of Mauritius in 2001, Khadaroo (2013) investi-gates the gender pay gap in Mauritius. Contrast-ing the previous results, the author finds that the gender pay gap is higher in the EPZ sector, where men earn 54 per cent more than women. However, these results are not fully comparable to the previous ones as they result from the di-rect comparison of the wage of operators (main-ly women) to the wage of supervisors (mainly men) and therefore likely overestimate the gen-der pay gap.
Taken together, these studies highlight the ne-cessity to go further than simple descriptive sta-tistics when estimating the gender wage gap, and suggest that the impact of EPZs on women’s wages is likely context-specific. Furthermore, ad-ditional research should be done on the impact of EPZs on women’s wages in other sectors of the economy and also on how the defeminization process may affect the gender wage gap in the export-oriented sector.
3.1.3Exportprocessingzonesandwomen’s workingconditions
Although EPZs have resulted in new formal
employment opportunities for women and in certain cases higher earnings, the quality of employment in these free zones has been ques-tioned. That is because the setting up of EPZs is often correlated either with the granting of exceptions in labour legislation, with weak en-forcement of national labour laws, or with the interdiction of trade unions. As a matter of fact, overtime is standard in most, if not all, EPZs (Mil-berg and Amengual, 2008). In Madagascar, Glick and Roubaud (2006) find that on average women employed in EPZs worked 209 hours per month, whereas women in the non-EPZ private sector worked on average 168 hours (and 147 hours in the public sector). Notably, these differences are larger for women than for men. Similarly, in Mau-ritius, specific labour laws are applied in the EPZs authorizing longer legal working hours (45 hours a week plus 10 hours overtime, as opposed to 35 to 48 hours in non-EPZ firms). This feature of EPZs is particularly problematic for women who are still in charge of care activities at home because it exacerbates their work burden (Blin, 2008). An-other characteristic observed in many EPZs is the high rate of turnover (Milberg and Amengual, 2008), which raises questions about the quality of employment in these zones. Using Malagasy data, Cling et al. (2009) calculate that one-fifth of EPZ employees leave their jobs annually, while this proportion falls to one out of 10 in the pri-vate sector. Related to these aspects, it is worth noting that in some cases freedom of association and collective bargaining are not guaranteed in EPZs (ICFTU, 2004). Before 2003, Kenyan EPZ work-ers were banned from joining a trade union. To protest against their harsh working conditions

mo
du
leTrade and gender linkages: An analysis of COMESA4
20
and obtain more rights in the workplace, the EPZ workers, predominantly women, organized mas-sive strikes and eventually obtained from the Kenyan government the right to organize them-selves and negotiate collective bargaining agree-ments. A further recurring criticism of EPZs is the precariousness of employment and the absence of long-term employment opportunities. In Ken-ya, 85 per cent of female workers are employed on short-term contracts (Akoth, 2006). Glick and Roubaud (2006) use an econometric analysis to estimate the likelihood of promotion in Mala-gasy EPZs and find that women are statistically less likely than men with similar qualifications to be promoted.
To conclude, EPZs appear to have been instru-mental in integrating women into the formal sector in COMESA countries, and studies suggest that at least in two countries (Madagascar and Kenya) the free zones contributed to reducing the gender wage gap. However, anecdotal evidence also suggests that EPZs provide less favourable working conditions and are even likely to worsen women’s work burden.
3.2 The impact of trade liberalization on women in COMESA countries
COMESA countries are currently involved in ne-gotiations for the creation of new trade agree-ments such as the Economic Partnership Agree-ment (EPA) with the European Union and the Tripartite Free Trade Agreement (TFTA) with the East African Community (EAC) and Southern Af-rican Development Community (SADC). The EPA is under discussion with most COMESA member countries. An interim EPA agreement entered into force in 2012 with a limited number of COMESA countries (Madagascar, Mauritius, Seychelles, and Zimbabwe). 22 In July 2016, the EU signed an EPA with Botswana, Lesotho, Mozambique, Na-mibia, South Africa, and Swaziland that is known as the SADC EPA group.” 23
The TFTA negotiations were launched in 2011, a deal was signed in June 2015, and implementa-tion of the TFTA should follow ratification by each member’s parliament. However, very little is known about the consequences of these current and future agreements on gender outcomes. This section relies on the most recent contributions of the economic literature to analyze how changes in the trade environment of COMESA countries impacted women and how that impact may vary across partners. The corresponding results should provide relevant insights about the gen-der impact of these agreements.
3.2.1Interactionchannelsandfirm-level evidence
As explained in the core training manual (UNC-TAD, 2014b), there are multiple channels of inter-action between trade and gender in the work-place. To summarize, trade liberalization entails a pro-competitive effect that renders discrimina-tion more costly and stimulates the upgrading of technology, thereby contributing to a reduction in the gender wage gap. However, liberalization can also induce a change in the sectoral structure of production that can be either beneficial (in the case of reallocation into female-intensive sectors) or detrimental (in the case of reallocation into male-intensive sectors) to women. Hence, there is no clear general pattern in the impact of trade on gender in the workplace. In addition to the production-structure channel, trade may impact gender through the induced changes in the rela-tive prices of goods and services that can affect men and women differently depending on their consumption patterns and livelihood strategies, but also through the variation of tariff revenues, as shown in the core training manual (UNCTAD, 2014b). This section concentrates on the estima-tion of the first transmission channel, namely the impact of trade on gender in the workplace, as it is more easily identifiable.
Confronted with the difficulty of identifying a one-fits-all model, the literature has started to explore the correlation between trade liberaliza-tion episodes and gender outcomes relying on firm-level panel data that better identify the gender-trade relationship. Volume 2 of the train-ing manual (UNCTAD, 2014d) explicitly outlines the benefits of using micro-level data to analyze the effects of trade policy on gender outcomes. This approach allows for more precisely assess-ing the impact of trade policy changes on gender outcomes within firms (the most disaggregated level of analysis), thereby taking into account sectoral and firm-level specificities. Furthermore, these data also allow for assessing the impact of tariff changes across occupation types. As an il-lustration, studies conducted by Juhn et al. (2013, 2014) use panel data on Mexican firms to esti-mate the impact of tariff reductions in Mexico associated with the North American Free Trade Agreement. Their theoretical framework predicts that a reduction in trade costs prompts the most productive firms to start exporting and to up-grade their technology. 24 Due to technological upgrading, women’s labour market outcomes in blue-collar tasks improve, as the upgrading in-creases their productivity, but remain unchanged in white-collar tasks. The empirical results of Juhn et al. (2013, 2014) corroborate their predic-

Trade and gender linkages: An analysis of COMESA 4
mo
du
le
21
tions: tariff changes improved women labour outcomes through technological upgrading. A Mexican firm experiencing the average reduc-tion in United States' tariffs increased the female employment share in blue-collar occupations by 20 per cent and women’s relative wage bill by 24 per cent (compared to a similar firm confronted with a zero tariff change). These studies highlight the positive effect of trade-led technological up-grading on women compared to men by reduc-ing the needs for physical strength in blue-collar occupations. Employing a different estimation strategy based on state-level data, Sauré and Zoabi (2014) show that the gender consequences of tariff changes may vary according to the level of economic development of the trading partner.
3.2.2EstimationoftheimpactoftradechangesonwomeninCOMESAcountries
Building on these recent developments in the trade-gender literature, this section investigates how tariff changes have impacted women in a sample of COMESA countries through a micro-econometric analysis in the spirit of Juhn et al. (2013, 2014). The present analysis goes further in investigating the consequences of tariff changes on women by differentiating the impact across partners, including European partners, partners that are members of the future TFTA, and other country partners. This distinction allows for test-ing whether the consequences of tariff changes on women’s labour market outcomes differ across partners due to differences in traded prod-ucts or specialization patterns. Therefore, the re-sults of the study will be particularly informative about the expected impact of the trade agree-ments currently being negotiated namely the EPA and the TFTA. Consequently, this analysis can be interpreted as an ex-ante impact assessment of the consequences of future trade agreements of the COMESA countries on women’s labour market outcomes. 25
3.2.2.1Data
The present empirical investigation of the con-sequences of tariff changes on women’s labour outcomes relies on data collected in the World Bank Enterprise Surveys (WBES). The WBES pro-vide firm-level information for a number of coun-tries surveyed following the same methodology. These surveys are available in panel (i.e. for more than one period) for five COMESA countries: the Democratic Republic of the Congo (2006 and 2010); Kenya (2007 and 2013); Egypt (2008 and 2013); Uganda (2006 and 2013); and Zambia (2007 and 2013). These surveys are particularly relevant for the present analysis because they include
information on the participation of women, dis-tinguished by occupation type (production and non-production tasks), in addition to a large number of economic characteristics of the firms. In the WBES, the only available information on the occupation of employees is the classification between "production" and "non-production" ac-tivities. Non-production gathers the activities re-lated to management, sales, administrative tasks, etc. 26 The WBES are designed to be representative at the sectoral, size, and geographical levels, and so conclusions drawn from them can be applied to the countries considered as a whole. Based on this information, female-to-male employment ratios are computed for production and non-pro-duction occupations. In addition, tariff changes are measured using UNCTAD’s Trade Analysis and Information System (TRAINS) database. More precisely, the average export duties (export tariff) faced in the destination countries and the aver-age tariffs imposed on imports (import tariff) are computed for each country, each year, and each sector. Detailed descriptive statistics on the female-to-male ratio across sectors and occupa-tion types are provided in table 11 in the Annex.
These data are used for estimating the impact of tariff changes on the gender employment gap, for which the methodology is presented in detail in the Annex.
3.2.2.2Findings
Figure 5 summarizes the results from estimat-ing the impact of tariff changes on gender la-bour outcomes, differentiated by the partner countries, in exporting firms of a subsample of COMESA countries. This figure relies on the esti-mated coefficients that are provided in table 13 in the Annex. The results confirm the significant impact of tariff changes on female-to-male la-bour ratios.
According to the results summarized in figure 5, trade liberalization affects workers differently across categories. Women involved in production tasks are more negatively affected by trade open-ing than men: a 1 per cent decrease in export duties faced in the destination market is corre-lated with a 5 per cent decrease in the female-to-male labour ratio in exporting firms. Interest-ingly, this negative effect of trade liberalization on the female-to-male employment ratio varies little across partners (European countries, future partner countries within the TFTA, and the rest of the world). The negative correlation of trade lib-eralization with the female-to-male employment ratio in production activities suggests that more trade may coincide with the growth of male-in-

mo
du
leTrade and gender linkages: An analysis of COMESA4
22
tensive, export-oriented production activities at the expense of women, contributing to the de-feminization of certain sectors, as mentioned in previous works (Kucera and Tejani, 2014). A con-comitant explanation for this result is related to the fact that lower export costs prompt export-ing firms to upgrade their technology, thereby re-ducing the opportunities for production workers. This in turn more negatively affects women, who are particularly vulnerable in the workplace.
However, the reverse phenomenon seems to oc-cur in non-production activities: women benefit more than men from trade liberalization: a 1 per cent decrease in export tariffs is correlated with a 3.4 per cent increase in the female-to-male la-bour ratio in exporting firms. This result can be interpreted in light of previous studies (Galor and Weil, 1996; Juhn et al., 2013, 2014; Weinberg, 2000) that found that women involved in non-production blue-collar activities may benefit from technological upgrading induced by trade opening in the destination market because that upgrading raises those women’s relative produc-tivity by reducing the need for physical skills ver-sus cognitive skills.
Another interesting result in figure 5 is the nega-tive impact on women’s labour force participa-
tion of reducing protectionist import measures. Indeed, the results indicate that a 1 per cent de-crease in import tariffs is correlated with a 0.01 per cent decrease in the female-to-male labour ratio in exporting firms. The impact is similar across occupation types, which is not the case via-à-vis export duties. This negative impact, al-though small in magnitude, might arise from the fact that increased competition with foreign firms in the domestic market negatively affects firms’ activities that might be correlated with a reduction in the workforce that primarily affects women.
These findings can be used to assess the poten-tial consequences of the future trade agreements on women. For instance, within the future EPA, manufactured products should be imported into the EU free of customs duties. Based on these es-timates, in Zambia, which faces average export duties in the European market of 4 per cent, the signing of the EPA should translate into a 20 per cent decrease in the female-to-male employ-ment ratio in production tasks, and an increase of 13 per cent in the female-to-male employment ratio in non-production tasks, all else held con-stant. 27 However, the EPA should also translate into a reduction in import tariffs imposed by the COMESA countries. According to our results, this
Impact of tariff reductions on the female-to-male employment ratio, by occupation type and partner countries (per cent)
Figure 5
Source: Calculations by the UNCTAD secretariat based on the results of table 13 in the Annex.Notes: The reported coefficients report the impact of a 1 per cent decrease in the tariff on the female-to-male employment ratio in the exporting firms of a subsample of COMESA countries. Export tariff refers to the average export duties faced in the destination countries. Import tariff refers to the average tariff imposed on imports. EU: European Union; TFTA: Tripartite Free Trade Agreement; RoW: rest of the world.

Trade and gender linkages: An analysis of COMESA 4
mo
du
le
23
Sample of COMESA actions and areas of focus to promote services trade Box 6
• Adoptabusinessvisatofacilitatethemovementofbusinesspersonswithintheregion,withtheaimoffacilitatingtrade,investment,andoverallbusi-nessdevelopment
• Develop practical approaches to addressing labour migration challengessuchastherecognitionofqualifications,workpermits,andsocialsecurity
• EstablishaMemorandumofUnderstandingwithMicrosoftAfricaforfuturecollaborationintheareasofaccesstotechnology,developmentofrelevantskills,andfosteringofinnovation
• EstablishtheRegionalPaymentandSettlementSystemtofacilitatetheset-tlementoftradeandservicespaymentsamongmemberstates
• Supportthemobilizationofsavingsandfacilitateaccesstocreditforall.
Facilitateintra-regionaltrade
Capacity-building • COMESAhasbeenactivelyprovidingcapacity-buildingprogrammesamongmemberstatesthataddresssuchtopicsastheCOMESARulesofOriginandliberalizationoftradeinservices
Sources: Addis Standard (2015); Daily Monitor (2015); MADOTE (2015); Microsoft (2015); and SAIIA (2013).
should also affect the gender employment ratio at the expense of women, albeit to a lesser extent (assuming a 20 per cent decrease in import tar-iffs would translate into a 1.7 per cent decrease in the overall female-to-male employment ratio). 28
This empirical investigation highlights the im-portant implications of trade liberalization on gender labour outcomes in COMESA countries. Relying on these results, trade liberalization should be accompanied by specific measures supporting women involved in production activi-ties, as these women are disproportionately af-fected by a reduction in trade barriers. Therefore, policies aimed at raising women’s human capi-tal and skills, and at improving the social safety net, could reduce or mitigate the adverse effect of trade liberalization on women in the labour market.
4 Trade and gender in the services sector
COMESA has initiated programmes to promote services trade among its members (box 6). The COMESA Treaty explicitly identifies liberalization of trade in services as central to the communi-ty’s regional integration objectives. In particular, Articles 4(4)(c), 164, 148, 151, and 152 all present a mandate for COMESA and its member countries to collectively work towards removing barriers to services trade and promoting the free move-ment of services across the region. In 2009, the Committee on Trade in Services launched efforts
to promote services liberalization and adopted the Guidelines for Services Negotiations under the COMESA Regulations on Trade in Services. Furthermore, though at present the TFTA nego-tiations are focused primarily on merchandize trade across COMESA, SADC, and EAC member states, services can be expected to factor impor-tantly into future discussions.
Given the attention this area is receiving from COMESA governments as well as regional and global development organizations, it is critical to consider the implications of liberalized trade in services on gender and women’s economic em-powerment.
4.1 Stylized facts on women’s participation in the services sector
A principal means through which services trade can benefit women is through employment, both formal and informal. Due to the difficulty of measuring employment in the informal sector, this section essentially focuses on the formal ser-vices sector. Globally, the services sector has be-come the predominant source of jobs for women. By 2015, the ILO estimates that 61.5 per cent of the female workforce was employed in services (ILO, 2015a). In COMESA, however, agriculture remains the principal sector for female employment. ILO data summarized in figure 1 indicate that in 2015, 72.7 per cent of the female workforce in COMESA was employed in agriculture versus 22.4 per cent in services and just 4.9 per cent in industry. 29

mo
du
leTrade and gender linkages: An analysis of COMESA4
24
However, in recent years the services sector has exhibited greater dynamism as a growing source of jobs for women. While the overall size of the fe-male workforce in COMESA increased by 86.8 per cent in the 20 years between 1995 and 2015, the number of women working in the services sec-tor expanded by 152 per cent. This compares to a 94 per cent increase in men working in services over the same period. The ILO estimates that this trend will continue in COMESA, with the growth of female employment in services between 2015 and 2020 (25 per cent) outpacing overall growth in the total female workforce (18 per cent) and the male services workforce (18 per cent) (figure 6).
The dramatic increase in women’s participation in the services workforce in COMESA was most-ly due to relative movement out of agriculture (participation in industry has remained fairly constant). However, in spite of representing a growing share of the total workforce, women in COMESA are still under-represented in services, as can be seen when examining the male-female ratio of workers.
It is also important to point out the heterogeneity of COMESA member states in terms of the female services workforce, likely owing primarily to vari-ances in the economic structure of the countries. Whereas the services sector accounts for over 80 per cent of women’s employment in Mauri-tius (where travel and tourism accounts for over a quarter of the country’s GDP; see WTTC, 2015), services contribute to less than 25 per cent of fe-male employment in nine member states where agriculture remains the overwhelmingly pre-dominant employment sector (figure 7). Women account for a larger portion of the services work-force than the overall workforce in Egypt, Eritrea, Ethiopia, Mauritius, Swaziland, and Zimbabwe. In the remaining member states, however, women are under-represented in the sector.
4.2 The consequences of trade liberalization in services on gender outcomes
The descriptive statistics above give only a broad overview of women’s participation in services in COMESA. These trends and figures may provide useful insight into the quantity of jobs and gen-eral participation in services, but they say little about the quality of those jobs. In practice, the kinds of services women provide matters. Services jobs are often viewed through a high-value lens, with technology, financial, and business services receiving much of the attention surrounding ser-vices trade. Indeed, medium- and high-skill ser-vices may open new opportunities for women’s economic advancement. However, the shift to-wards services in developing countries, which of-
ten coincides with the expansion of the informal sector, is generally taking place at lower income levels than in developed countries (ILO, 2012). In many developing countries, more traditional, non-tradable, and low-productivity services with reduced capital accumulation potential account for the increasing share of services in GDP and employment. These services include such jobs as market vendors, restaurant workers, and do-mestic helpers. This may in fact have negative long-term economic and welfare implications. The evidence shows that in countries experienc-ing structural transformation from agriculture to services (bypassing industry) – a characteristic of many least-developed countries in Africa – the rapid growth in services employment is driven by increases in low-productivity and often informal, jobs, leading to a reduction in aggregate labour productivity and thus having an adverse impact on economic performance (UNCTAD, 2014e).
Finally, liberalization of the services sector pre-sents other unique challenges for women that warrant special consideration. The Inter-Agency Network on Women and Gender Equality (IAN-WGE) Task Force on Gender and Trade identified three areas of concern to be considered when pursuing a services trade liberalization pro-gramme: (i) certain vulnerable segments of the population, including women, may be heavier users of essential services and thus more sensi-tive to how liberalization may impact access; (ii) liberalization may have an impact on non-eco-nomic policy objectives related to areas such as health, culture, education, and the environment; and (iii) the balance between long-term objec-tives and short-term adjustment costs may dis-proportionately impact women (IANWGE, 2011).
What are the implications of services liberaliza-tion on gender outcomes in COMESA countries? With services becoming an increasingly impor-tant source of jobs for women in the region, lib-eralization will potentially have an increasing im-pact on the position of women in the economy. It is also evident that while the sector offers new opportunities for women, there may be structur-al factors limiting overall participation, as well as the quality of participation, in services. As with agriculture and manufacturing trade, the effects of services trade on women is not clearly positive or negative, and different segments of popula-tions will be impacted in different ways and to varying degrees.
The remainder of this chapter, therefore, looks into the particular opportunities, challenges, and risks associated with services liberalization in COMESA by focusing on two service industries

Trade and gender linkages: An analysis of COMESA 4
mo
du
le
25
Heterogeneity in female services employment as a per cent of total female employment across COMESA countries, 2015
Figure 7
Source: Calculations by the UNCTAD secretariat based on ILO (2015 a).
Women’s growing participation in the services workforce in COMESA, 1995–2020Figure 6
Source: Calculations by the UNCTAD secretariat based on ILO (2015a).Notes: Data for 2020 is projected (p).
on different ends of the value-added spectrum: (i) services outsourcing enabled by information and communications technology (ICT), and (ii) tourism. Both services are priorities for COMESA and many of its member states because of their potential to contribute to economic growth and development. While the chapter does not at-tempt to canvass all relevant service industries, the focus on ICT and tourism should provide a strong framework for analyzing gender/trade dynamics across other important service indus-tries, such as health, education, energy, commu-nications, and finance.
4.2.1Exportsofskilledservicesenabledbyinfor-mationandcommunicationstechnology
As part of its trade promotion agenda for services, COMESA identified priority sub-sectors on which to initiate negotiations on services liberalization in the region. Most of these sub-sectors relate to high-skill segments such as business, commu-nications, energy, and financial services. Moreo-ver, the Federation of National Associations of Women in Business in Eastern and Southern Africa (FEMCOM), a COMESA institution, prior-
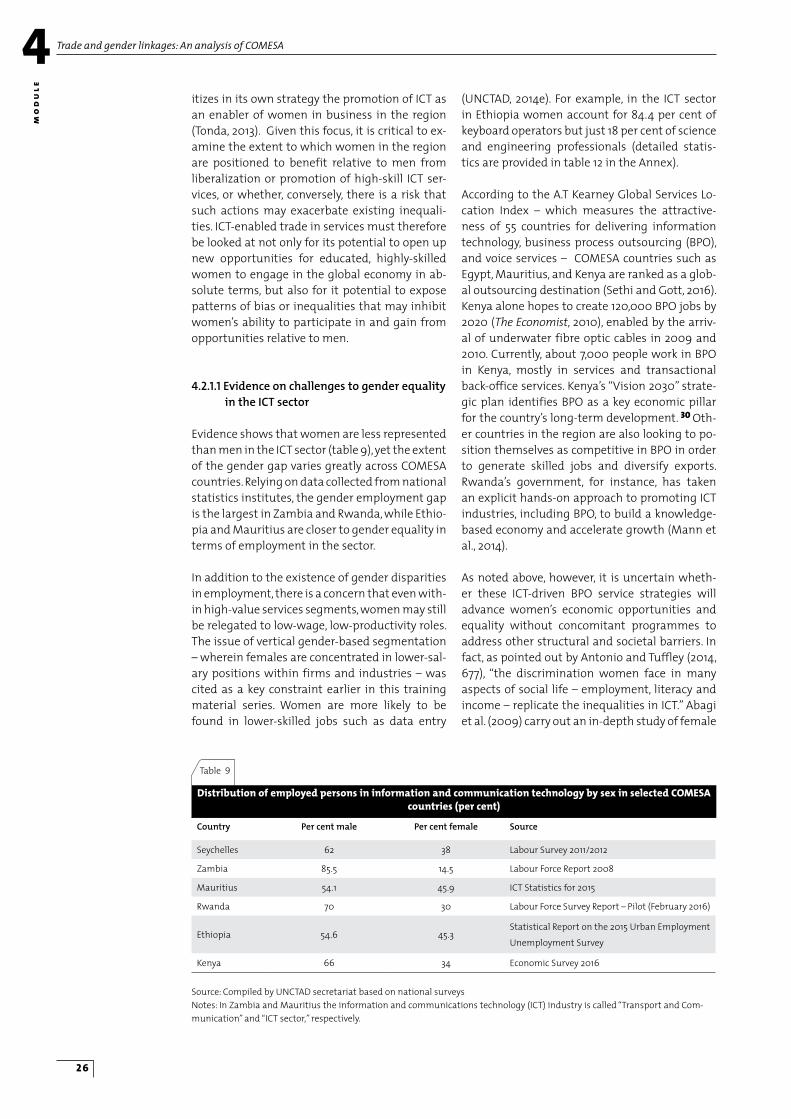
mo
du
leTrade and gender linkages: An analysis of COMESA4
26
itizes in its own strategy the promotion of ICT as an enabler of women in business in the region (Tonda, 2013). Given this focus, it is critical to ex-amine the extent to which women in the region are positioned to benefit relative to men from liberalization or promotion of high-skill ICT ser-vices, or whether, conversely, there is a risk that such actions may exacerbate existing inequali-ties. ICT-enabled trade in services must therefore be looked at not only for its potential to open up new opportunities for educated, highly-skilled women to engage in the global economy in ab-solute terms, but also for it potential to expose patterns of bias or inequalities that may inhibit women’s ability to participate in and gain from opportunities relative to men.
4.2.1.1EvidenceonchallengestogenderequalityintheICTsector
Evidence shows that women are less represented than men in the ICT sector (table 9), yet the extent of the gender gap varies greatly across COMESA countries. Relying on data collected from national statistics institutes, the gender employment gap is the largest in Zambia and Rwanda, while Ethio-pia and Mauritius are closer to gender equality in terms of employment in the sector.
In addition to the existence of gender disparities in employment, there is a concern that even with-in high-value services segments, women may still be relegated to low-wage, low-productivity roles. The issue of vertical gender-based segmentation – wherein females are concentrated in lower-sal-ary positions within firms and industries – was cited as a key constraint earlier in this training material series. Women are more likely to be found in lower-skilled jobs such as data entry
(UNCTAD, 2014e). For example, in the ICT sector in Ethiopia women account for 84.4 per cent of keyboard operators but just 18 per cent of science and engineering professionals (detailed statis-tics are provided in table 12 in the Annex).
According to the A.T Kearney Global Services Lo-cation Index – which measures the attractive-ness of 55 countries for delivering information technology, business process outsourcing (BPO), and voice services – COMESA countries such as Egypt, Mauritius, and Kenya are ranked as a glob-al outsourcing destination (Sethi and Gott, 2016). Kenya alone hopes to create 120,000 BPO jobs by 2020 (The Economist, 2010), enabled by the arriv-al of underwater fibre optic cables in 2009 and 2010. Currently, about 7,000 people work in BPO in Kenya, mostly in services and transactional back-office services. Kenya’s “Vision 2030” strate-gic plan identifies BPO as a key economic pillar for the country’s long-term development. 30 Oth-er countries in the region are also looking to po-sition themselves as competitive in BPO in order to generate skilled jobs and diversify exports. Rwanda’s government, for instance, has taken an explicit hands-on approach to promoting ICT industries, including BPO, to build a knowledge-based economy and accelerate growth (Mann et al., 2014).
As noted above, however, it is uncertain wheth-er these ICT-driven BPO service strategies will advance women’s economic opportunities and equality without concomitant programmes to address other structural and societal barriers. In fact, as pointed out by Antonio and Tuffley (2014, 677), “the discrimination women face in many aspects of social life – employment, literacy and income – replicate the inequalities in ICT.” Abagi et al. (2009) carry out an in-depth study of female
Distribution of employed persons in information and communication technology by sex in selected COMESA countries (per cent)
Table 9
Country Percentmale Percentfemale Source
Seychelles 62 38 Labour Survey 2011/2012
Zambia 85.5 14.5 Labour Force Report 2008
Mauritius 54.1 45.9 ICT Statistics for 2015
Rwanda 70 30 Labour Force Survey Report – Pilot (February 2016)
Ethiopia 54.6 45.3Statistical Report on the 2015 Urban Employment
Unemployment Survey
Kenya 66 34 Economic Survey 2016
Source: Compiled by UNCTAD secretariat based on national surveysNotes: In Zambia and Mauritius the information and communications technology (ICT) industry is called “Transport and Com-munication” and “ICT sector,” respectively.

Trade and gender linkages: An analysis of COMESA 4
mo
du
le
27
Proportion of firms in COMESA countries with at least one woman in the top two management positions
Table 10
Country Number offirms sur-
veyed
Percentageoffirmswithat least onewoman intop two po-
sitions
Numberofexport-ingfirmssurveyed
Percentageofexportingfirmswithatleastonewomanintopposition
Sectorswherewomenareintopposition(numberoffirms)
Burundi 46 13.0 9 11.1 Accountancy (3), Architecture (1), Legal (2)
Comoros 40 25.0 0Accountancy (1), Architecture (4), Engineer-
ing (2), Legal (3)
Congo, DR 60 5.0 20 0.0 Accountancy (2), Engineering (1)
Djibouti 30 10.0 1 100.0 Legal (3)
Egypt 100 5.0 3 0.0 Architecture (5)
Eritrea 40 37.5 3 33.3 Accountancy (3), Engineering (9), Legal (3)
Ethiopia 100 10.0 9 0.0 Accountancy (2), Architecture (2), Legal (6)
Kenya 100 14.0 36 42.9Accountancy (3), Architecture (5), Engineer-
ing (1), Legal (5)
Madagascar 61 42.6 5 40.0Accountancy (10), Architecture (4), Engineer-
ing (3), Legal (9)
Malawi 60 1.7 9 0.0 Accountancy (1)
Mauritius 61 16.4 6 16.7Accountancy (3), Architecture (2), Engineer-
ing (2), Legal (3)
Rwanda 40 25.0 2 50.0 Accountancy (5), Engineering (3), Legal (2)
Seychelles 40 0.0
Sudan 100 15.0 31 16.1Accountancy (4), Architecture (1), Engineer-
ing (3), Legal (7)
Swaziland 40 30.0 5 20.0 Accountancy (7), Engineering (1), Legal (4)
Uganda 100 9.0 17 11.8Accountancy (3), Architecture (1), Engineer-
ing (2), Legal (3)
Zambia 60 31.7 11 45.5 Accountancy (8), Legal (11)
Zimbabwe 41 19.5 7 14.3 Accountancy (3), Architecture (2), Legal (3)
Source: Compiled by UNCTAD secretariat based on national surveysNotes: In Zambia and Mauritius the information and communications technology (ICT) industry is called “Transport and Com-munication” and “ICT sector,” respectively.
professionals in the ICT sector in Kenya and find persisting gender stereotyping and discrimina-tion within the industry, noting that even wom-en with technical ICT skills were often still placed in roles that are typically regarded as more tra-ditionally feminine, such as public relations or marketing.
Coste and Dihel (2013) analyze data on over 500 professional services firms in COMESA countries to shed light on the participation of women in professional services trade in the region. The analysis reveals significant gender imbalances across all professional services and highlighted in particular the comparatively low number of women holding senior management positions
in the services firms (table 10). Furthermore, among those firms that are female-run, the au-thors found lower levels of export participation and performance compared to similar firms in other regions, perhaps in part because these firms also appear more highly constrained by ac-cess to finance and other support services, which the authors note is not a characteristic observed globally. Finally, there is significant variability in the region. Countries like Eritrea, Rwanda, Mada-gascar, and Zambia exhibit higher levels of fe-male management, while in other countries like the Democratic Republic of the Congo, Egypt, and Malawi, female management in professional ser-vices is practically absent.

mo
du
leTrade and gender linkages: An analysis of COMESA4
28
4.2.1.2EducationaldisparitiesasadeterminantofgenderinequalitiesinICTemployment
Irrespective of structural biases in ICT and pro-fessional services employment, participation in high-skill services is often viewed as requiring high levels of education and training. In the ear-liest stages of Kenya’s BPO sector, for instance, recruitment by firms emphasized preference for those who had completed, or were working to-wards completing, a university education (Free, 2015). Even in BPO services occupations in which university education or technical expertise is not a requirement, firms typically require a mini-mum level of digital literacy. If women face dis-proportionate barriers to educational access and digital competency, then their capacity to partici-pate in and benefit from growth in the sector will be severely limited. Indeed, inequality in access to education will then be transmitted to greater economic and professional inequalities as un-skilled workers lose out on higher-paid, higher-value opportunities. As stated by Melhem et al. (2009, 20): “women and girls are poorly placed to benefit from the knowledge society because they have less access to scientific and technical educa-tion specifically and to education in general.”
Evidence suggests that participation rates of women in higher education across the COMESA region are extremely low. Tertiary enrolment across Africa is heavily skewed toward the hu-manities and social sciences, with barely 25 per cent of students opting for science, technol-ogy, engineering, and mathematics disciplines. Among those who do, few are women (World Bank, 2015). In Ethiopia, for example, there are very few women who are professionally active in these fields: data from a census conducted in 2010–2011 by the Ministry of Education on tertiary education in public and private univer-sities shows that women made up only 21 per cent of the graduates in physics, mathematics, informatics, and engineering. Among those who graduated, very few had obtained a master’s or PhD degree. 31 In Egypt, women who graduated during 2012/2013 in industrial technical institu-tions represented 27 per cent of total graduates in these fields. 32 Furthermore, data point to the existence of a positive correlation between the female share of graduates working in the servic-es sector and the percentage of firms in COMESA countries with at least one woman in the top two positions, as demonstrated in figure 8.
Without targeted efforts and policies in the re-gion designed specifically to encourage women’s participation in higher education and promote overall digital literacy, it is unlikely that women
will be able to take advantage of higher-skilled ICT-enabled services at the same level as men. And indeed, the promotion of these service indus-tries may widen gender inequalities as skills gaps between the sexes become more pronounced. Governments, regional bodies, development or-ganizations, and the private sector all have roles to play in encouraging the education and train-ing needed for women to fully participate in ICT-enabled services.
Beyond particular programmes, however, it is crucial that gender issues be fully incorporated into national ICT and services liberalization ini-tiatives in order to overcome the educational divide between men and women. Box 7 presents examples of ICT educational programmes that have been undertaken to date.
4.2.2TourismandgenderinCOMESA
Most women employed in the services sector do not operate in the high-value segment of the sector, but rather in low-skilled service jobs such as vendors at markets, housekeepers, and cooks or wait staff in restaurants and hotels. Trade policies and initiatives in the services sector that focus only on the high-skill segment may fail to address the needs of the millions of low-income women engaged in low-value services. 33 Tourism is a services sub-sector important to the region that provides an illustrative case in the low-skilled services trade and gender dynamics at play in the region.
Furthermore, COMESA and many of its mem-ber countries, such as Zambia and Kenya, have prioritized the promotion of international tour-ism as a source of economic growth and foreign exchange. 34 Indeed, the organization has rec-ognized tourism as a key strategic pillar in the overall development of the region. 35 COMESA member states are endowed with geographic wonders, exotic wildlife, and unique cultural heritage that attract travellers from around the globe. According to estimates from the World Travel and Tourism Council, in 2015 tourism pro-vided a direct contribution of US$74.3 billion to Africa’s GDP and a total of over 21 million jobs, most of which go to unskilled workers (WTTC, 2016). In many parts of the region, tourism pro-vides women with opportunities for direct and indirect employment in a variety of services, from tour guides and travel agents to hotel staff, res-taurant workers, and artisans. For many women, the tourism sector also offers a means to transi-tion from informal work to formal employment (UNCTAD, 2013) and can lead to greater social and economic autonomy and empowerment (Boona-

Trade and gender linkages: An analysis of COMESA 4
mo
du
le
29
Gender-sensitive educational programmes for information and communications technology in AfricaBox 7
1 See Intel’s She Will Connect website at http://www.intel.com/content/www/us/en/technology-in-education/technology-empowerment.html (accessed on 11 November 2016).
• Intel,theglobalmicroprocessorcompany,hasestablisheda“SheWillConnect”women’seducationpro-grammethatcombinesdigitalliteracytraining,anonlinepeernetwork,andgender-specificcontentto support the closingof thegendergap.Theprogrammebeganwithpilots inKenya,Nigeria,andSouthAfrica,andastatedgoaltoreach5millionwomeninAfricasothatthey“havetheopportunitytoacquireorimprovedigitalliteracyskillsandexpandtheirunderstandinganduseoftechnologysothattheycanconnecttohealth,government,andeducationalinformation,economicopportunities,andgenderspecificresources.”1
• ThePartnershipforSkills inAppliedSciences,Engineering,andTechnology (PASET)was launched in2013insub-SaharanAfricawithsupportfromtheWorldBanktobuildscientificandtechnicalcapabil-ityinAfricathroughknowledgegenerationanddissemination;partnershipdevelopment;andfinanc-ing.PASETbringstogetherAfricangovernmentsandtheprivatesectoraswellasnewpartnerswhohavebeeninvestingheavilyinAfrica,includingBrazil,China,India,andtheRepublicofKorea.Theaimistoworktogethertoharmonizeeffortsaimedatbuildinghumancapitalinsub-SaharanAfrica.TheAfricanVirtualUniversity,launchedin1997asaWorldBankprojectandtransferredtoKenyain2002,providessupporttowomenintheservicessector.Withmorethan15yearsofexperienceinAfrica,theuniversityhasestablishedaGenderMainstreaming-ScholarshipFundwiththeaimofupgradingtheinformationandcommunicationstechnology(ICT)skillsofpre-serviceandin-serviceteachers.
• All-Girls ICT Training Camps are a capacity-building/mentoring initiative of the African Centre forWomen,Information,andCommunicationsTechnology.Thecampsoperateduringeveryschoolholidayandareaimedatpromotingscienceandtechnologyasacareerpathforyoungwomeninhighschool.ThecampshelptheparticipantsimprovetheirperformanceinmathematicsandsciencesubjectsandacquireICTskills,includingInternettraining.
Correlation between firms with female managers and female graduates working in the services sectorFigure 8
Source: Calculations by the UNCTAD secretariat based on World Development Indicators database, World Bank (last accessed in April 2016). Notes: The percentage of female graduates by field of study in tertiary education is calculated by dividing the number of female graduates in a given field of education from tertiary education by the total number of graduates in the same field. Data on the percentage of firms with at least one woman in the top two positions refer to table 10. Linear fit refers to the estimation of a sim-ple linear regression where the percentage of firms with at least one woman in a top position is a function of the female share of graduates in services. Confidence intervals correspond to the estimated range of values for the coefficient estimated.
Perc
enta
ge o
f fim
rs w
ith fe
mal
e m
anag
ers

mo
du
leTrade and gender linkages: An analysis of COMESA4
30
baana, 2014). However, though not a comprehen-sive survey of cases in the region, the examples in the following section show that the potential for women to take advantage of opportunities pre-sented in tourism can be constrained by struc-tural or cultural biases that lead to wage gaps, mistreatment, and gender-based segmentation into low-value and higher-risk roles.
4.2.2.1Challengestogenderequalityintourismemployment
Female tourism workers in the COMESA region are often concentrated in lower-skilled jobs such as hotel receptionists, maids, gift shop attend-ants, and waitresses (for the Kenya example, see box 8). In contrast, higher-paid jobs as tour operators and managers of travel agencies are more likely to be occupied by men. For instance, in an assessment of Egypt’s travel and tourism sector, Ragab (2007, 51) finds that “most women are confined to low-level jobs, and they are often relegated to traditional professions or support functions. Women tend to be in occupations with low career development prospects whereas managerial positions are male dominated. As a result, the degree of occupational segregation by gender is quite apparent in the tourism labour market.”
Furthermore, due to domestic responsibilities that compete for women’s time or to women’s education gaps, 36 women are more likely to hold part-time or informal jobs supporting the tour-ism sector, creating greater vulnerability to re-ductions in hours or pay, or outright job loss, dur-ing slow seasons and downturns in the industry. It is in these positions that women are also more vulnerable to poor treatment and working condi-tions and, at times, sexual harassment.
Women, therefore, must often find ways to work with or around existing obstacles in order to real-ize the benefits that tourism can bring. In Muko-no Parish in Southwestern Uganda, for example, Boonabaana (2014) finds that to participate in the area’s burgeoning tourism industry, women have had to overcome myriad gender-related constraints that include burdensome domestic responsibilities and norms that limit women to the domestic space unless permission is granted by a male. Despite ongoing obstacles, however, women are finding increased social and econom-ic agency within their households and communi-ties. Before tourism arrived in the area, women were largely dependent upon men and thus in a state of vulnerability. The author notes that “when men were unwilling to provide or lacked the money to do so, family tension and feuds
often ensured, sometimes culminating into do-mestic violence and separation. With tourism earning opportunities, [however], these tensions have [been] reduced given that women can now fend for themselves” (Boonabaana, 2014, 33).
In addition, tourism is often viewed as a means through which local populations near attractions can access jobs and thus benefit, but analysis suggests that most of the real value generated by tourism accrues not to the local communities where women play a more prominent role, but to larger tour operators and brokers located in capi-tal cities or outside the country. In a case study on Cape Verde, for instance, UNCTAD (2011) finds that gains from tourism are not significant in poorer households, but rather are concentrated in the wealthier segments of the population. The study suggests that the country could achieve more broad-based gains from tourism by promoting cultural and community-based tourism and sug-gests that “women’s participation in tourism ed-ucation and training would allow them to have access to more qualified, stable and better paid positions, including managerial ones” (UNCTAD, 2011, 9). Another strategy, tourism revenue-shar-ing schemes, if designed and executed properly, transmit benefits of tourism back into local com-munities and promote local buy-in for the con-servation and protection of tourism assets (such as wildlife and ecological parks). Rwanda, where the government established training and skills development programmes and set up a system of revenue-sharing with local communities, may provide an example for ensuring the distribu-tion of gains from tourism (UNCTAD, 2014c). The Rwanda Development Board sends 5 per cent of national park entry fees back into the local com-munities to support community development projects. A study by Kamuzinzi et al. (2015) on the effectiveness of Rwanda’s tourism revenue-shar-ing programme around Nyungwe National Park, finds that the programme led to the construction of health centres and schools, improved access to clean water supplies, promoted local business, and encouraged the conservation of the park’s natural resources.
5 Conclusions
This module has applied the analytical frame-work presented in the other three modules of Volume I of this training manual (UNCTAD, 2014b) to the specificities of the member coun-tries of COMESA. In consideration of the fact that the regional group involves countries at different levels of social and economic development, this module has examined the trade and gender nex-

Trade and gender linkages: An analysis of COMESA 4
mo
du
le
31
Case study on gender in the Kenyan tourism industryBox 8
Source: Christian et al. (2013).
InastudyofgenderinthetourismindustryinKenya,Christianetal.(2013)explorethegenderdimensionsofthreeprimarysegmentsofthetourismvaluechain:touroperations,excursionpackages,andaccommoda-tionproviders.Theaimistobetterunderstandhowgenderinequalitiesaffectthesector’scompetitivenessanditspotentialtogenerateapositivedevelopmentimpact.Assummarizedbelow,theauthorsfinddistinctstructuralandcultural/societalforcesconstrainingtheabilityofwomentofullyparticipateinandbenefitfromKenya’sdynamictourismindustry,andtheypresentrecommendations,applicablebeyondtheKenyancontext,toimproveconditionsforwomeninthesector.
Acrossallthreevalue-chainsegments,thereisnotablegender-basedoccupationalsegregationthatconcen-trateswomenintohigher-risk,lower-value,andlower-skilledroles.Overall,two-thirdsofthoseemployedintourismaremen.Touroperationsarepredominantlymale-owned,especially thosewhicharemostprofit-ableandhavethebestaccesstofinancialcapital,exclusivedestinations,andlucrativeforeignclientele. Infact,thestudyfindsthatofthe31touroperationsconsidered“CategoryA”bytheKenyaAssociationofTourOperators,onlytwoarerunbywomen.Specificoccupationsarehighlygendered,withhigher-profilerolesassafariguidesanddriversconsideredmostappropriateformen(atthetimeofthestudy,allKenyaProfessionalSafariGuidesAssociation“gold-certified”guidesweremen).Women,ontheotherhand,werefarmorelikelytobefoundasticketingagents,receptionists,andhospitalityworkers.Womenalsoaremoreconcentratedincasual,part-time,orseasonalpositionsthatarelessflexible,lessstable,andlessprotectedbylabourarrange-mentsandunions.Theauthorsfind,forinstance,thatsexualharassmentprotectionsembeddedinlabourlaws,suchastheEmploymentRelationsActof2007,lackedproperrecourseandenforcementmechanisms.Thereisalsoconcernthatmaternityleaverequirementshavedisincentivisedthehiringofwomen.
Legal,cultural,andsocietalnormsfurtherlimitwomen’sparticipation.Responsibilitiesinthehomeaswellasculturalnormsdiscouragewomen’sworkinmoreremotedestinations,includingsafaricamps.Manysmallertourism-relatedbusinessesarefamily-owned,andthefatherorsonsoccupyhigherroleswhilethewomeninthefamilyareexpectedtoprovidesupport.Womenfromethnic-tribalgroups,suchastheMaasai,oftenlackadequateeducationandare thus limited to rolesasartisansorculturalperformers. Landownershippoliciesthatallowexemptionsforcustomarylawswhichrestrictwomen’saccesstolandtitleswerefoundtodirectlydisadvantagewomen’sabilitytocapitalizeonleasingarrangements,tourismdevelopmentfunds,andconservationfees.
Finally,themarketingofpackagetourstypicallyfavouredmale-dominatedaspectsofthesector.Christianetal.(2013)findthattourismmarketingoftenfeaturedimageryandthemesthatreinforcedracialandgenderstereotypes,appealingtothe“whitehunter”narrativewhiledownplayingareassuchasculturalexperiences,inwhichwomenaremoreparticipatory.
Anumberofrecommendationsemergefromthiscasestudy:• Mainstream gender issues into national tourism policy: Intheireffortstopromoteanddevelopthetour-
ismsector,nationalandregionalgovernmentsshouldbesensitivetoandfullyincorporategenderis-sues. Community-basedand cultural tourism shouldbe featured in strategicplans.Tourismpoliciesshouldexplicitlyseektoprotectwomen’slabourrightsandpromotefemaleparticipationinthesector.
• Promote gender parity through national and international industry associations: Privatesectorandnon-governmentalgroupsshouldplayacriticalroleinthepromotionofgenderequalitythroughgender-sensitivehiringpracticesandcertificationortrainingprogrammesthatexplicitlyincorporategenderissues.
• Target training of women to increase and diversify skills: Effortsshouldbemadetotargetwomenandlo-calcommunitiesfortrainingintourism-relatedskills,particularlytrainingthatwouldfacilitategreaterparticipationbywomeninwhatarenowmale-dominatedoccupationsthataremorehigh-valueandstable.
• Promote and market pro-women activities and commercial activities: Governmentsandindustryshouldfeature theseactivitiesprominentlyandrespectfully inmarketingcampaigns,promotingculturalorcommunitytourism,structuringitinerariestoincludeactivitiesthatpromotewomen’scommercialac-tivities,andsourcingsouvenirsforgiftshopsfromwomen’sartisancollectives.

mo
du
leTrade and gender linkages: An analysis of COMESA4
32
us focusing on common features in agriculture, manufacturing, and services.
Following the approach presented in the core modules, this module has noted that in agricul-ture women can be both a source of competitive advantage and underachievers of competitive advantage. Female farmers are underachievers of competitive advantage because of the multi-ple challenges they face that hinder their produc-tivity. These include the burden of domestic care work, gaps in educational attainment, gender inequality in control over land, scarcity of house-hold farm labour, and limited access to resources and market opportunities. Tackling the obstacles that hold back the productivity of female farm-ers could both enhance gender equality and boost broader economic growth. On the other hand, women can be a source of competitive advantage. On-farm women tend to be over-rep-resented as contributing/unpaid family workers on the household plot. The economic efficiency of this farming system is found in the use of fam-ily labour, which reduces the cost of labour. The underlying gender challenge is how to empower women within this family farming model, mak-ing them more productive, and increasing their voice in decision-making and resource allocation. Off-farm, low women’s wages have been used as a source of competitive advantage in labour-intensive export agriculture. To the extent that cost-reducing or profit-maximizing strategies concentrate on wage and labour costs, gender inequality can be a source of competitive advan-tage and drive growth. However, considerations other than cost are playing an increasing role in shaping competitiveness. In the horticultural sector, for example, the downward pressure on labour costs is balanced by a countervailing mar-ket pressure that stems from the “green” or “fair trade” labelling movement.
Moving to manufacturing, as described in pre-vious modules, the implementation of export-oriented strategies has been correlated with a massive influx of women in the labour-intensive manufacturing sector, a phenomenon known as the feminization of labour. This shift has been explained by the cost-minimizing behaviour of employers confronted with stiff international competition. This module has looked more spe-cifically at women employed in the EPZs in a number of COMESA countries and has reached the conclusion that the impact of EPZs on wom-en’s wages is likely context-specific. In Madagas-car, for example, data show that women working in an EPZ earn a significantly higher wage than women working in the informal sector, but also significantly lower wages compared to women
employed in the public or private formal sec-tors. In the case of Kenya, a survey of 75 firms illustrated that although EPZ firms pay lower wages compared to local firms, the earnings of women and men were not statistically different, contrary to the situation in local firms, thus cor-roborating that the gender wage gap tends to be lower in EPZs. Contrasting results were pre-sented for Mauritius, where the gender pay gap is higher in the EPZ sector than in other sectors. Anecdotal evidence presented in the module re-garding women’s working conditions in the EPZs suggests that the free zones provide less favour-able working conditions and even likely worsen women’s work burden.
This module has also explored the likely conse-quences for women’s labour outcomes of tariff changes due to COMESA countries becoming parties to new trade agreements, namely the EPA and the TFTA. In other words, through an ex-ante assessment, the module assessed the likely impact of new trade measures on gender in the workplace. As expected, the results show that trade liberalization affects workers differently across categories. For example, women involved in production tasks are more negatively affected by trade opening than men. This suggests that more trade may coincide with the growth of male-intensive, export-oriented production ac-tivities at the expense of women, thus contrib-uting to the defeminization of certain sectors. A concomitant explanation offered in the mod-ule is that lower export costs prompt exporting firms to upgrade their technology, thereby reduc-ing the opportunities for production workers. This in turn more negatively affects women, who are particularly vulnerable in the workplace. In the event of adverse effects of trade liberalization on women, the module recommends that trade liberalization be accompanied by specific meas-ures supporting women involved in production activities, as they are disproportionately affected by a reduction in trade barriers.
Finally, in the services sector, the module has looked into the particular opportunities, chal-lenges, and risks associated with services liber-alization in COMESA countries by focusing on two service industries: ICT-enabled services out-sourcing and tourism. Both of these industries have been prioritized by COMESA and many of its member states because of their potential to contribute to economic growth and develop-ment. Despite the opportunities that ICT-ena-bled services outsourcing and tourism can offer to advance women’s economic empowerment and gender equality, the module has shown that vertical gender-based segmentation persists in

Trade and gender linkages: An analysis of COMESA 4
mo
du
le
33
several COMESA countries, with women found in lower-skilled jobs. While in some cases labour market segmentation is the result of gender dis-crimination, in others disparities in education and training between men and women in gen-eral (and more specifically in science, technology, engineering and mathematics disciplines for ICT-
enabled services) are key determinants of gender inequalities in employment. It is thus crucial that gender issues be fully incorporated into national ICT and tourism strategies and in services liber-alization initiatives at the national and regional levels.

mo
du
leTrade and gender linkages: An analysis of COMESA4
34
Exercises and questions for discussion
1. Is agriculture in the COMESA region “female-intensive” in terms of employment? How is female- or male-intensity calculated?
2. Where do women work in agriculture? Why is it difficult to identify the gender-specific effects of trade on rural women? Give examples of on-farm and off-farm activities and of agricultural and non-agricultural sources of income for rural women in COMESA countries.
3. Are there discernible patterns of gender segregation in rural employment? Elaborate with reference to both on-farm activities (gender productivity gap) and off-farm activities (indicators of vulnerability in wage employment). What are the main drivers underlying these patterns?
4. What are the main factors responsible for the gender productivity gap in agriculture? What is meant by women as underachievers of competitive advantage as farmers, small entrepreneurs, and self-employed producers?
5. When and how can gender inequality be used as a source of competitive advantage and what are the coun-terarguments?
6. What are the key gender concerns surrounding the COMESA agricultural strategy?
7. What are the channels through which the implementation of export-oriented policies, such as export pro-cessing zones, affects women and gender inequality?
8. In COMESA, a reduction in import tariffs has a different impact on women than a reduction in export tariffs that COMESA faces in the destination market. Explain this difference.
9. What are the expected consequences for female employment of tariff reductions in destination markets? Please distinguish between the impact on women involved in production and non-production activities.
10. What are the current trends for women’s employment in services in the COMESA region? What are some of the key metrics for understanding and measuring female participation in services?
11. Does increased participation of women in services employment necessarily indicate that further growth in the sector will lead to better outcomes for women in terms of economic empowerment and equality? Why or why not?
12. Are women in COMESA more active participants in high-value or low-value services, and what are the im-plications for women’s empowerment and development more generally?
13. What are the principal impediments to women being able to leverage opportunities in ICT-enabled service sectors to achieve enhanced economic equality?
14. What are the main reasons why a government should integrate gender considerations and gender-specific policies into its tourism promotion or development strategy?
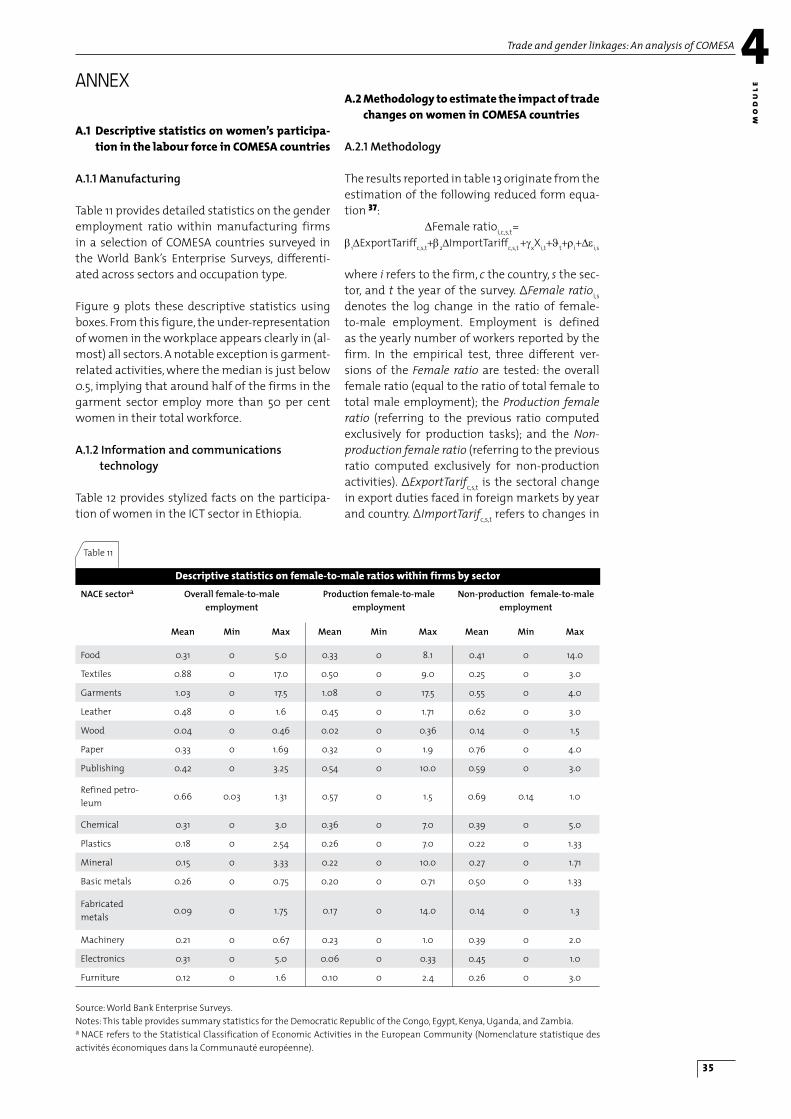
Trade and gender linkages: An analysis of COMESA 4
mo
du
le
35
anneX
Descriptive statistics on female-to-male ratios within firms by sector
Table 11
NACEsectora Overallfemale-to-maleemployment
Productionfemale-to-maleemployment
Non-production female-to-maleemployment
Mean Min Max Mean Min Max Mean Min Max
Food 0.31 0 5.0 0.33 0 8.1 0.41 0 14.0
Textiles 0.88 0 17.0 0.50 0 9.0 0.25 0 3.0
Garments 1.03 0 17.5 1.08 0 17.5 0.55 0 4.0
Leather 0.48 0 1.6 0.45 0 1.71 0.62 0 3.0
Wood 0.04 0 0.46 0.02 0 0.36 0.14 0 1.5
Paper 0.33 0 1.69 0.32 0 1.9 0.76 0 4.0
Publishing 0.42 0 3.25 0.54 0 10.0 0.59 0 3.0
Refined petro-leum
0.66 0.03 1.31 0.57 0 1.5 0.69 0.14 1.0
Chemical 0.31 0 3.0 0.36 0 7.0 0.39 0 5.0
Plastics 0.18 0 2.54 0.26 0 7.0 0.22 0 1.33
Mineral 0.15 0 3.33 0.22 0 10.0 0.27 0 1.71
Basic metals 0.26 0 0.75 0.20 0 0.71 0.50 0 1.33
Fabricated metals
0.09 0 1.75 0.17 0 14.0 0.14 0 1.3
Machinery 0.21 0 0.67 0.23 0 1.0 0.39 0 2.0
Electronics 0.31 0 5.0 0.06 0 0.33 0.45 0 1.0
Furniture 0.12 0 1.6 0.10 0 2.4 0.26 0 3.0
Source: World Bank Enterprise Surveys. Notes: This table provides summary statistics for the Democratic Republic of the Congo, Egypt, Kenya, Uganda, and Zambia. a NACE refers to the Statistical Classification of Economic Activities in the European Community (Nomenclature statistique des activités économiques dans la Communauté européenne).
A.1 Descriptive statistics on women’s participa-tion in the labour force in COMESA countries
A.1.1Manufacturing
Table 11 provides detailed statistics on the gender employment ratio within manufacturing firms in a selection of COMESA countries surveyed in the World Bank’s Enterprise Surveys, differenti-ated across sectors and occupation type.
Figure 9 plots these descriptive statistics using boxes. From this figure, the under-representation of women in the workplace appears clearly in (al-most) all sectors. A notable exception is garment-related activities, where the median is just below 0.5, implying that around half of the firms in the garment sector employ more than 50 per cent women in their total workforce.
A.1.2Informationandcommunications technology
Table 12 provides stylized facts on the participa-tion of women in the ICT sector in Ethiopia.
A.2 Methodology to estimate the impact of trade changes on women in COMESA countries
A.2.1Methodology
The results reported in table 13 originate from the estimation of the following reduced form equa-tion 37:
∆Female ratioi,c,s,t=b1∆ExportTariffc,s,t+b2∆ImportTariffc,s,t +gxXi,t+ϑt+ri+∆ei,s
where i refers to the firm, c the country, s the sec-tor, and t the year of the survey. ∆Female ratioi,s
denotes the log change in the ratio of female-to-male employment. Employment is defined as the yearly number of workers reported by the firm. In the empirical test, three different ver-sions of the Female ratio are tested: the overall female ratio (equal to the ratio of total female to total male employment); the Production female ratio (referring to the previous ratio computed exclusively for production tasks); and the Non-production female ratio (referring to the previous ratio computed exclusively for non-production activities). ∆ExportTarifc,s,t is the sectoral change in export duties faced in foreign markets by year and country. ∆ImportTarifc,s,t refers to changes in
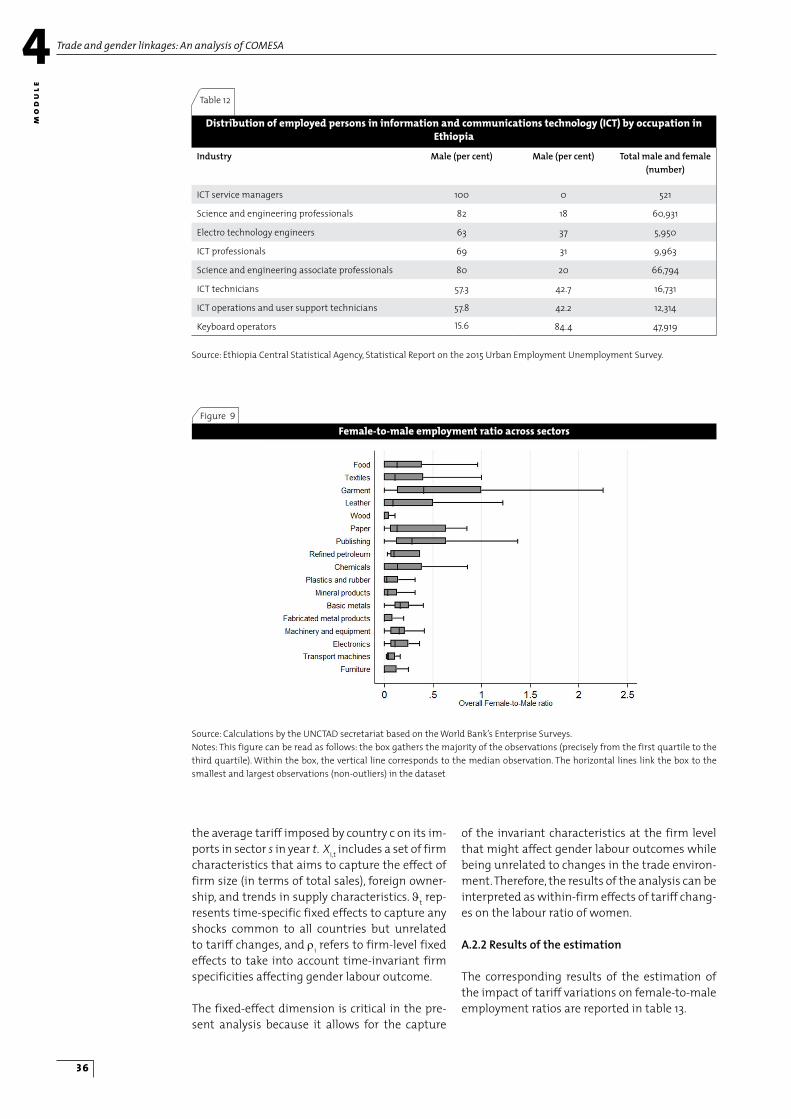
mo
du
leTrade and gender linkages: An analysis of COMESA4
36
Distribution of employed persons in information and communications technology (ICT) by occupation in Ethiopia
Table 12
Industry Male(percent) Male(percent) Totalmaleandfemale(number)
ICT service managers 100 0 521
Science and engineering professionals 82 18 60,931
Electro technology engineers 63 37 5,950
ICT professionals 69 31 9,963
Science and engineering associate professionals 80 20 66,794
ICT technicians 57.3 42.7 16,731
ICT operations and user support technicians 57.8 42.2 12,314
Keyboard operators 15.6 84.4 47,919
Source: Ethiopia Central Statistical Agency, Statistical Report on the 2015 Urban Employment Unemployment Survey.
Female-to-male employment ratio across sectorsFigure 9
Source: Calculations by the UNCTAD secretariat based on the World Bank’s Enterprise Surveys. Notes: This figure can be read as follows: the box gathers the majority of the observations (precisely from the first quartile to the third quartile). Within the box, the vertical line corresponds to the median observation. The horizontal lines link the box to the smallest and largest observations (non-outliers) in the dataset
the average tariff imposed by country c on its im-ports in sector s in year t. Xi,t includes a set of firm characteristics that aims to capture the effect of firm size (in terms of total sales), foreign owner-ship, and trends in supply characteristics. ϑt rep-resents time-specific fixed effects to capture any shocks common to all countries but unrelated to tariff changes, and ri refers to firm-level fixed effects to take into account time-invariant firm specificities affecting gender labour outcome.
The fixed-effect dimension is critical in the pre-sent analysis because it allows for the capture
of the invariant characteristics at the firm level that might affect gender labour outcomes while being unrelated to changes in the trade environ-ment. Therefore, the results of the analysis can be interpreted as within-firm effects of tariff chang-es on the labour ratio of women.
A.2.2Resultsoftheestimation
The corresponding results of the estimation of the impact of tariff variations on female-to-male employment ratios are reported in table 13.

Trade and gender linkages: An analysis of COMESA 4
mo
du
le
37
Estimation of the impact of tariff variations on female-to-male employment ratios
Table 13
Dependentvariable:growthinfemale-malelabourratios
Overall Productiontasks Non-productiontasks)
Sample of firms All
(I)
Exporting
(II)
All
(III)
Exporting
(IV)
All
(V)
Exporting
(VI)
∆ Export Tariff - EU 1.731*** 4.010*** 1.147* 4.982*** 1.738 -3.402***
(0.295) (0.096) (0.479) (0.0731) (1.127) (0.061)
∆ Export Tariff -TFTA 1.711*** 4.027*** 1.138* 5.057*** 1.668 -3.393***
(0.337) (0.107) (0.431) (0.006) (1.115) (0.0695)
∆ Export Tariff - RoW 1.711*** 4.086*** 1.163* 5.150*** 1.659 -3.368***
(0.268) (0.156) (0.523) (0.055) (1.138) (0.089)
∆ Import Tariff 0.0019 0.0859*** 0.0044 0.0157*** -0.0021 0.0052***
(0.0023) (0.0007) (0.0032) (0.00163) (0.0079) (0.0004)
Observations 1,116 302 1,134 311 1,032 290
Firm fixed effects Yes Yes Yes Yes Yes Yes
Year fixed effects Yes Yes Yes Yes Yes Yes
Source: Calculations by the UNCTAD secretariat based on World Bank Enterprise Surveys (WBES) and UNCTAD’s Trade Analysis and Information System (TRAINS) database.Notes: Robust standard errors in parentheses (clustered at the exporter level). The panel gathers firms from the Democratic Re-public of the Congo, Egypt, Kenya, Uganda, and Zambia. ∆ Export Tariff refers to the variation in sectoral tariffs (NACE classification) applied by the destination countries to the exports between the two years of the survey. ∆ Import Tariff refers to the variation in sectoral import tariffs (NACE classification) applied by the surveyed country between the two years of the survey. The overall female-male labour ratio indicates the growth in the female-to-male employment ratio between the two years of the survey. The production female-male labour ratio indicates the growth in the female-to-male employment ratio in production tasks between the two years of the survey. The non-production female-male labour ratio indicates the growth in female-to-male employment ratios in non-production positions (such as managers, administration, sales, etc.) between the two years of the survey. All columns include the following firm-level variables: the size of the firms in terms of employment, a dummy taking the value of one if the firm was more than 10 per cent owned by a foreign investor, and the trend in supply characteristics. EU: European Union; NACE : Statistical Classification of Economic Activities in the European Community (Nomenclature statistique des activités économiques dans la Communauté européenne) ; RoW: rest of world ; TFTA : Tripartite Free Trade Agreement. *** Significant at the 1 per cent level. ** Significant at the 5 per cent level. * Significant at the 10 per cent level.
A.3 Case study in Egypt: Al Azzawi (2014)
A.3.1Context
In the 1990s, Egypt implemented a series of trade reforms aimed at opening its domestic markets to foreign goods. The extent of the trade liberali-zation episode was considerable: average tariff rates were cut from 42 per cent in 1991 to 20 per cent in 2005, while non-tariff barriers were large-ly reduced. Yet, poverty rates and inequality levels surged during the same period, raising questions about how women might have been affected. Al Azzawi (2014) looks at the impact of these trade reforms on gender discrimination. Three main questions are addressed. First, did trade reforms have an impact on the gender wage gap in the manufacturing sector? Second, did the female share in employment, hours of work, or the total number of female workers change in industries that lost protection? Third, what is the estimated magnitude of the impact of tariff reductions and increased trade volume on the gender wage gap
and on female employment in manufacturing industries?
A.3.2Dataandmethodology
Al Azzawi (2014) uses a two-step estimation method to address these questions. First, Mincer earnings equations are estimated to explain the respective wages of men and women. The esti-mation relies on the data provided in two rep-resentative labour force sample surveys imple-mented at the national level in Egypt in 1998 and 2006, respectively, that allow for tracking individ-uals across periods. The difference between the average male and female wages in each industry is then decomposed into a portion due to observ-able characteristics and a residual commonly identified as the unexplained or discrimination component of the gender wage gap.
Second, this residual wage gap is used as the dependent variable in regressions that control for exposure to trade openness as well as other

mo
du
leTrade and gender linkages: An analysis of COMESA4
38
time-varying industry characteristics that have affected the Egyptian economy and are likely to influence the gender pay gap during the period. Exposure to trade openness is approximated us-ing two main measures: the import-weighted average tariff as a trade policy variable, and the trade volume. Tariff data are taken from the World Trade Organization’s tariff profile based on Egyp-tian Customs Authority data. To ensure that tariff rates for categories that are more important in terms of total imports receive a greater weight in the constructed average industry-level tar-iff, a weighted average tariff is computed using imports as the weight. Export and import data are from the World Integrated Trade Solution da-tabase and are used to construct the indices of import penetration and export intensity. Import penetration in a given industry is calculated as the ratio of imports to domestic consumption in that industry. Export intensity is calculated as the ratio of exports to the output in that industry.
The effect of trade reforms on female employ-ment is then investigated using three different measures of female employments: the share of women in full-time employment, the average hours per week of female full-time employees, and the number of female full-time employees.
A.3.3Findings
Relying on wage data, Al Azzawi (2014) provides detailed information on the evolution of the gen-der pay gap during the period. The descriptive part of the study reveals the significant increase in the gender pay gap between 1998 and 2006 in the manufacturing sector. Decomposing this difference into an explained and unexplained portion, the results indicate that in 1998, the dif-ference was mainly due to differences in worker characteristics, while in 2006 the large signifi-cant difference in favour of males was mainly
explained by unobserved factors (discrimina-tion) that accounted for more than 77 per cent of the wage gap. This term quantifies the change in women’s wages when applying the men’s coef-ficients to the women’s characteristics, and indi-cates that women would in fact have seen their wages rise considerably if they had been treated the same way as men.
The results about the impact of trade reforms on the gender wage gap indicate that import penetration is significantly correlated with an in-crease in the industry gender wage gap, suggest-ing that increased competitive pressures force firms to cut costs at the expense of workers with lower bargaining power. The results also show that industries that witnessed a rise in their level of export intensity also saw their gender wage gaps decline over time. To summarize, these re-sults point to the harmful impact of import com-petition on the gender wage gap, while women seem to fare relatively better in those industries that managed to significantly raise their export intensity. Furthermore, the results confirm that the negative effect of trade liberalization on the gender gap comes from a reduction in the num-ber women employed in full-time employment38, implying that lower tariffs and higher imports had a detrimental effect on female employment.Al Azzawi (2014) provides robust evidence that the trade liberalization episode in Egypt has largely had a negative impact on women’s relative wages and employment. Yet, it also shows a positive impact on women involved in the restricted number of firms that managed to increase their export intensity. The decomposition analysis highlights that most of the gap can be explained by the discrimination component, thereby justifying stronger enforcement of existing anti-discrimination legislation as well as a broader social effort to change stereotypes that hinder women’s participation in the labour market.

Trade and gender linkages: An analysis of COMESA 4
mo
du
le
39
references
Abagi O, Sifuna O, and Omamo S (2009). Professional women empowered to succeed in Kenya’s ICT sector. In: African Women & ICTs: Investigating Technology, Gender and Empowerment, Buskens I, and Webb A, eds. Zedd Books. London.
Addis Standard (2015). COMESA at twenty: Of the successes, challenges and promises. 7 April.
Akoth SO (2006). “Made in Kenya”: The implications of export manufacture on women workers on export processing zones. In: Gender in International Agricultural Trade Agreements: A Kenyan Synopsis, Kinyanjui MN, ed. Heinrich Böll Foundation.
Al Azzawi S (2014). Did trade liberalization benefit female workers? Evidence on wage and employment effects from Egypt. IZA Journal of Labour Policy 3(20).
Antonio A, and Tuffley D (2014). The gender digital divide in developing countries. Future Internet 6: 673–87.
Blin M (2008). Export-oriented policies, women’s work burden and human development in Mauritius. Journal of Southern African Studies 34(2): 239–53.
Boonabaana B (2014). Negotiating gender and tourism work: Women’s lived experiences in Uganda. Tourism and Hospitality Research 14: 27–36.
Central Statistical Agency of Ethiopia and World Bank (2015). Ethiopia Socioeconomic Survey (ESS) - 2013/14
Christian M, Gamberoni E and Reis JG (2013). Gender in the tourism industry: The case of Kenya. In: Brenton P, Gamberoni E and Sear C, eds. Women and Trade in Africa: Realizing the Potential. World Bank. Washington, D.C.: 115–128
Cling JP, Razafindrakoto M, and Roubaud F (2009). Export processing zones in Madagascar: The impact of the dismantling of clothing quotas on employment and labour standards. In: Globalization, Wages, and the Quality of Jobs, Robertson R, Brown D, Pierre G and Sanchez-Puerta ML, eds. World Bank, Washington DC.
COMESA (2002). COMESA gender policy. Common Market for Eastern and Southern Africa. Lusaka, Zambia. Available at: http://www.chr.up.ac.za/undp/subregional/docs/comesa2.pdf.
COMESA (2013). International trade statistics bulletin, 2013. Common Market for Eastern and Southern Africa. Lusaka, Zambia.
COMESA (undated). COMESA strategic framework – Mainstreaming gender in agriculture and climate change: 2011 - 2015. Com-mon Market for Eastern and Southern Africa. Lusaka, Zambia.
Committee on World Food Security (2013). Investing in smallholder agriculture for food security. HLPE Report 6. Committee on World Food Security High-Level Panel of Experts on Food Security and Nutrition. Rome.
Coste A and Dihel N (2013). “Services Trade and Gender”, In: Brenton P, Gamberoni E and Sear C, eds. Women and Trade in Africa: Realizing the potential, World Bank, Washington DC.
Daily Monitor (2015). COMESA electronic payment system to ease transactions. 23 September.
Davies R (2000). The impact of globalization on local communities: A case study of the cut-flower industry of Zimbabwe. ILO/SAMAT Discussion Paper no. 13. International Labour Organization. Geneva.
Elson D, and Pearson R (1981). Nimble fingers make cheap workers: An analysis of women’s employment in third world export manufacturing. Feminist Review 7: 87–107.
Engman M, Onodera O, and Pinali E (2007). Export processing zones: Past and future role in trade and development. Organisation for Economic Co-operation and Development. Paris.
FAO (2011a). Gender inequalities in Malawi: An overview. Malawi country profile. Food and Agriculture Organization. Rome.
FAO (2011b). The State of Food and Agriculture 2010–2011: Women in Agriculture: Closing the Gender Gap for Development. Rome: Food and Agriculture Organization.
FAO, IFAD, and ILO (2010). Gender Dimensions of Agricultural and Rural Employment: Differentiated Pathways out of Poverty. Food and Agriculture Organization. Rome.
Free A (2015). ‘Development,’ profiles and prospects: Labour in Kenya’s outsourced call centres. Critical African Studies 7(1): 47–65.
Fukunishi T (2008). Clothing export from sub-Saharan Africa: Impact on poverty and potential for growth. Institute of Developing Economies, Japan External Trade Organization.
Galor O, and Weil D (1996). The gender gap, fertility, and growth. American Economic Review 86(3): 374–87.
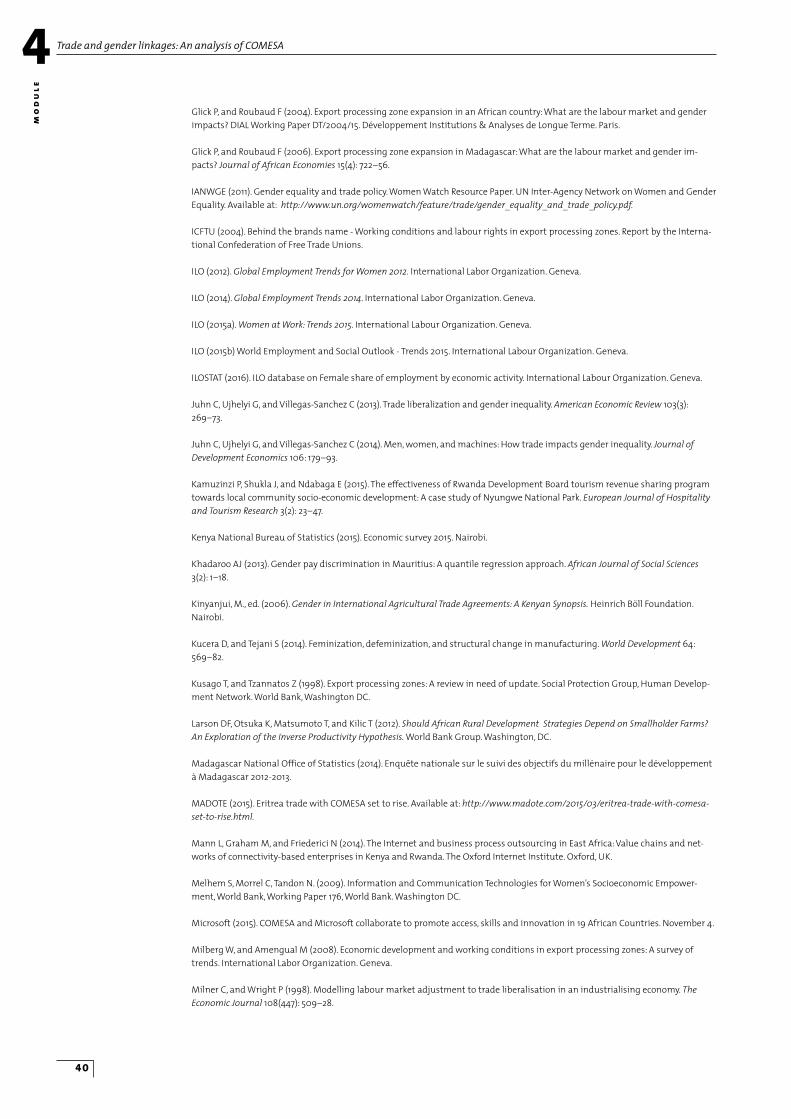
mo
du
leTrade and gender linkages: An analysis of COMESA4
40
Glick P, and Roubaud F (2004). Export processing zone expansion in an African country: What are the labour market and gender impacts? DIAL Working Paper DT/2004/15. Développement Institutions & Analyses de Longue Terme. Paris.
Glick P, and Roubaud F (2006). Export processing zone expansion in Madagascar: What are the labour market and gender im-pacts? Journal of African Economies 15(4): 722–56.
IANWGE (2011). Gender equality and trade policy. Women Watch Resource Paper. UN Inter-Agency Network on Women and Gender Equality. Available at: http://www.un.org/womenwatch/feature/trade/gender_equality_and_trade_policy.pdf.
ICFTU (2004). Behind the brands name - Working conditions and labour rights in export processing zones. Report by the Interna-tional Confederation of Free Trade Unions.
ILO (2012). Global Employment Trends for Women 2012. International Labor Organization. Geneva.
ILO (2014). Global Employment Trends 2014. International Labor Organization. Geneva.
ILO (2015a). Women at Work: Trends 2015. International Labour Organization. Geneva.
ILO (2015b) World Employment and Social Outlook - Trends 2015. International Labour Organization. Geneva.
ILOSTAT (2016). ILO database on Female share of employment by economic activity. International Labour Organization. Geneva.
Juhn C, Ujhelyi G, and Villegas-Sanchez C (2013). Trade liberalization and gender inequality. American Economic Review 103(3): 269–73.
Juhn C, Ujhelyi G, and Villegas-Sanchez C (2014). Men, women, and machines: How trade impacts gender inequality. Journal of Development Economics 106: 179–93.
Kamuzinzi P, Shukla J, and Ndabaga E (2015). The effectiveness of Rwanda Development Board tourism revenue sharing program towards local community socio-economic development: A case study of Nyungwe National Park. European Journal of Hospitality and Tourism Research 3(2): 23–47.
Kenya National Bureau of Statistics (2015). Economic survey 2015. Nairobi.
Khadaroo AJ (2013). Gender pay discrimination in Mauritius: A quantile regression approach. African Journal of Social Sciences 3(2): 1–18.
Kinyanjui, M., ed. (2006). Gender in International Agricultural Trade Agreements: A Kenyan Synopsis. Heinrich Böll Foundation. Nairobi.
Kucera D, and Tejani S (2014). Feminization, defeminization, and structural change in manufacturing. World Development 64: 569–82.
Kusago T, and Tzannatos Z (1998). Export processing zones: A review in need of update. Social Protection Group, Human Develop-ment Network. World Bank, Washington DC.
Larson DF, Otsuka K, Matsumoto T, and Kilic T (2012). Should African Rural Development Strategies Depend on Smallholder Farms? An Exploration of the Inverse Productivity Hypothesis. World Bank Group. Washington, DC.
Madagascar National Office of Statistics (2014). Enquête nationale sur le suivi des objectifs du millénaire pour le développement à Madagascar 2012-2013.
MADOTE (2015). Eritrea trade with COMESA set to rise. Available at: http://www.madote.com/2015/03/eritrea-trade-with-comesa-set-to-rise.html.
Mann L, Graham M, and Friederici N (2014). The Internet and business process outsourcing in East Africa: Value chains and net-works of connectivity-based enterprises in Kenya and Rwanda. The Oxford Internet Institute. Oxford, UK.
Melhem S, Morrel C, Tandon N. (2009). Information and Communication Technologies for Women’s Socioeconomic Empower-ment, World Bank, Working Paper 176, World Bank. Washington DC.
Microsoft (2015). COMESA and Microsoft collaborate to promote access, skills and innovation in 19 African Countries. November 4.
Milberg W, and Amengual M (2008). Economic development and working conditions in export processing zones: A survey of trends. International Labor Organization. Geneva.
Milner C, and Wright P (1998). Modelling labour market adjustment to trade liberalisation in an industrialising economy. The Economic Journal 108(447): 509–28.

Trade and gender linkages: An analysis of COMESA 4
mo
du
le
41
O’Sullivan M, Rao A, Banerjee R, Gulati K, and Vinez M ((2014). Levelling the field: Improving opportunities for women farmers in Africa. World Bank and ONE Campaign. World Bank Group. Washington DC.
Ragab A (2007). Assessment of the trade in tourism and travel-related services in Egypt in relation to the GATS. European Union and the Ministry of Trade and Industry. Available at: http://www.tas.gov.eg/NR/rdonlyres/91D361E8-44F0-45A0-8C19-E9C859A2EF72/2762/TourismStudy2.pdf.
Rikken M (2011). The global competitiveness of the Kenya flower industry. Technical Paper. World Bank Group and the Kenya Flower Council.
SAIIA (2013). An assessment of labour mobility in SADC, COMESA and EAC and prospects for the Tripartite FTA. South African Institute of International Affairs.
Sauré P, and Zoabi H (2014). International trade, the gender wage gap and female labour force participation. Journal of Develop-ment Economics 111: 17–33.
Seguino S (1997). Export-led growth and the persistence of gender inequality in the newly industrialized countries. In: Economic Dimensions of Gender Inequality: A Global Perspective, Rives J and Youseif M, eds. Westport, CT: Greenwood Publishers.
Sethi A, and Gott J (2016). On the eve of disruption. A.T Kearney. Available at: https://www.atkearney.com/docu-ments/10192/7094247/On+the+Eve+of+Disruption.pdf/49fa89fa-7677-4ab8-8854-5003af40fc8e.
SOFA Team, and Doss C (2011). The role of women in agriculture. ESA Working Paper no. 11-02. Food Agriculture Organization. Rome. Available at: http://www.fao.org/docrep/013/am307e/am307e00.pdf.
Standing G (1989). Global feminization through flexible labour. World Development 17(7): 1077–95.
Standing G (1999). Global feminization through flexible labour: A theme revisited. World Development 27(3): 583–602.
Subramanian, MA, and Roy MD (2001). Who can explain the Mauritian miracle: Meade, Romer, Sachs, or Rodrik? IMF Working Paper 01/116. International Monetary Fund. Washington, DC.
Tejani S (2011). The gender dimension of special economic zones. In: Special Economic Zones: Progress, Emerging Challenges, and Future Directions, Farole T and Akinci G, eds. World Bank. Washington DC.
The Economist (2010). The world economy calls. March 25.
Tonda N (2013). Engendering digital migration through ICTs for women in business in micro, small and medium Enterprises. Available at: http://idsa02.pbworks.com/w/file/fetch/73987832/REVISED_FEMCOM_ENGENDERING-DIGITAL-MIGRATION_Nanase_CM_review.pdf.
UNCTAD (2009). Mainstreaming gender in trade policy. Note by the UNCTAD secretariat. Document no. TD/B/C.I/EM.2/2/Rev. 1. United Nations Conference on Trade and Development Virtual Institute. Geneva.
UNCTAD (2011). Who is Benefiting from Trade Liberalization in Cape Verde? A Gender Perspective. United Nations. Geneva.
UNCTAD (2013). Who is Benefiting from Trade Liberalization in Angola? A Gender Perspective. United Nations. Geneva.
UNCTAD (2014a). Looking at Trade Policy through a “Gender Lens.” Summary of Seven Country Case Studies Conducted by UNCTAD. United Nations. Geneva.
UNCTAD (2014b). Virtual Institute Teaching Material on Trade and Gender. Volume 1: Unfolding the Links. United Nations. New York and Geneva.
UNCTAD (2014c). Who is Benefiting from Trade Liberalization in Rwanda? A Gender Perspective. United Nations. Geneva.
UNCTAD (2014d). Teaching Material for the Online Course on Trade and Gender. Volume 2: Empirical Analysis of the Trade and Gen-der Links. United Nations Conference on Trade and Development Virtual Institute. Geneva.
UNCTAD (2014e). The Least Developed Countries Report 2014 - Growth with Structural Transformation: A Post-2015 Agenda. United Nations Conference on Trade and Development. Geneva.
UNCTAD (2015a). The Least Developed Countries Report 2015: Transforming Rural Economies. New York and Geneva: United Nations.
UNCTAD (2015b). Gender and Trade Liberalization in Kenya: The Case of Women Retail Traders. United Nations Conference on Trade and Development Virtual Institute. Geneva.
UNCTAD (2016). Trade as a tool for the economic empowerment of women. Expert Meeting on Trade as a Tool for the Economic Empowerment of Women. Geneva. Note by the UNCTAD secretariat. Document no. TD/B/C.I/EM.8/2. United Nations Conference on Trade and Development. Geneva.

mo
du
leTrade and gender linkages: An analysis of COMESA4
42
UNDP (2015). Human Development Report 1999. Oxford University Press for the United Nations Development Programme. New York.
UNFPA, WFP, Ministry of Women’s Affairs, Bureaus of Women Affairs, and the Regional State Governments of Amhara and Tigray. Undated. Ethiopia: Leave no women behind. Case Studies from the Millennium Development Goals Achievement Fund. United Nations Population Fund. Available at: http://www.unwomen.org/mdgf/downloads/MDG-F_Ethiopia_B.pdf.
UNWTO (2011). Global Report on Women in Tourism 2010. United Nations World Tourism Organization and UN Women. Madrid.
Van Der Ploeg JD (2008). The New Peasantries: Struggle for Autonomy and Sustainability in an Era of Empire and Globalization. Earthscan. Sterling, VA.
Weinberg B (2000). Computer use and the demand for female workers. Industrial and Labour Relations Review 53(2), 290–308.
World Bank (2015). Mozambican woman paves the way for a new generation of African Engineers. December 14. World Bank. Washington, DC. Available at: http://www.worldbank.org/en/news/feature/2015/12/14/mozambican-woman-paves-the-way-for-a-new-generation-of-african-engineers.
World Bank, FAO, and IFAD. (2009). Gender in Agriculture: Sourcebook. World Bank Publications. Washington, DC.
WTTC (2015). Travel and tourism: Economic impact 2015: Mauritius. World Travel and Tourism Council. London.
WTTC (2016). Travel and tourism: Economic impact 2016: Africa. World Travel and Tourism Council. London.
Trade and gender linkages: An analysis of COMESA 4
mo
du
le
43
endnoTes
1 Data refer to the most recent year available during the
2002–2012 period and exclude Mauritius, Seychelles, and
Eritrea.
2 In the case of Libya, integration into the world economy is
mainly due to oil exports.
3 The Gender Parity Index for the gross enrolment ratio in
primary, secondary, and tertiary education is the ratio of
girls to boys enrolled at primary, secondary, and tertiary
levels in public and private schools.
4 COMESA manuals for gender mainstreaming cover the sec-
tors of infrastructure development; investment promotion
and private sector development; information and commu-
nication; gender and environment; health and HIV/AIDS;
peace and conflict resolution; and COMESA institutions. A
regional strategy for mainstreaming gender into agricul-
ture and climate change was in place for the period from
2011–2015.
5 The female intensity of agriculture is calculated here as the
share of female employment in total agricultural employ-
ment.
6 SOFA Team and Doss (2011).
7 Based on the data series on male and female employment,
and male and female employment in agriculture, in ILO
(2015b).
8 For a discussion of the wage gap, see box 5 in Module 1 and
box 11 in Module 2.
9 As discussed, however, women tend to prevail in formal
wage employment in several value chains for high-value
products such as fresh fruit, vegetables, and flowers.
10 In a related vein, there is relatively more diversification
in terms of income sources among rural men than rural
women. In both Malawi and Rwanda, men in rural areas
are more likely than women to be employed in non-agricul-
tural work, including non-agricultural wage employment
and non-farm enterprises (UNCTAD, 2014c; FAO, 2011a). This
reflects imperfections in the functioning of local labour
and credit markets (see section below), which perpetuates
patterns of gender segregation in rural employment.
11 For a review of country legislation, see also the United
States Agency for International Development’s Land Ten-
ure and Property Rights Portal at https://www.land-links.
org/ (accessed on 10 November 2016).
12 Kenya, Ethiopia, and Uganda are competing with each oth-
er on the same export markets, particularly Europe, Rus-
sian Federation, and North America.
13 CAADP, which is an integral part of the New Partnership for
Africa’s Development (NEPAD), is Africa’s policy framework
for agricultural transformation, wealth creation, food secu-
rity and nutrition, economic growth, and prosperity for all.
14 This strategic objective underlies many on-going agri-
cultural sector programmes of the COMESA Secretariat,
including the Agricultural Market Promotion and Re-
gional Integration Project; Irrigation Development in the
COMESA Region Project; Regional Food Security/Food Re-
serve Initiative; Food Security Policy and Vulnerability Re-
duction Programme; Coordinated Agricultural Research
and Technology Interventions; Regional Approach Towards
Biotechnology; Pan African Tsetse and Trypanosomiasis
Eradication Campaign; Livestock Sector Development; Fish-
eries Sector Development; CAADP, which is part of the New
Partnership for Africa’s Development (NEPAD); Crop Crisis
Control (C3) Project; Action Plan for the Environment; and
interventions to mitigate the impact of HIV/AIDS among
smallholder farmers. Other COMESA agricultural market-
ing and regional integration activities linked to its food se-
curity programmes include the Food and Agricultural Mar-
keting Information System, the Regional Agricultural Trade
Expansion Support Project, and the Commodity Exchange
Initiative.
15 Higher crop intensity and a higher-value crop mix are other
aspects of increased productivity.
16 Fostering intra-COMESA trade integration in agriculture
envisages regional trade development corridors linking
food-surplus Northern Mozambique to deficit markets
in Zimbabwe, and intermittently to southern Malawi
and Eastern Zambia; linking food surplus zones in East-
ern Uganda and Northern Tanzania to deficit markets in
Kenya, and linking surplus cassava and maize producing
areas of Northern Zambia to the deficit mining towns in
the Katanga and Kasai provinces in the Democratic Repub-
lic of the Congo.
17 There are important caveats and qualifications, though.
Notably, remote markets will likely remain significantly
segregated and shielded from import competition. Fur-
thermore, cheap imports may benefit women as net con-
sumers, while eroding their margins as producers.
18 This also holds true for export (extra-COMESA) trade. In a
context of over-supply and saturated markets in the flower
sector, the export dynamism of one exporter (e.g., Ethiopia)
may be to the detriment of traditional suppliers (e.g., Ken-
ya), that is, employment expansion in one country is offset
by layoff schemes in the other.
19 See FAO, IFAD, and ILO (2010), FAO (2011b), and World Bank,
FAO, and IFAD (2009).

44
20 The Mincer earnings function is a widely used model in
empirical economics to explain wages as a function of
schooling and experience. It is typically written as follows:
ln y=a+bS+g1 X+g2 X2 ; with y the wage, S the years of school-
ing, and X the years of experience.
21 The surveys used by the authors were limited to the capital
of Antananarivo because the data were available through-
out the years only for this city. However, according to the
author, the corresponding results remain instructive, as
EPZs were found exclusively in the capital, with one excep-
tion (in Antsirabe).
22 For more details on the current state of the negotiations,
see the European Commission’s website on trade at: http://
ec.europa.eu/trade/policy/countries-and-regions/regions/
esa/.
23 For more details: http://trade.ec.europa.eu/doclib/press/in-
dex.cfm?id=1509.
24 Their model builds on a trade model in a monopolistic set-
ting with firm heterogeneity, i.e. firms differ in their pro-
ductivity. In this model, occupations are divided into two
broad categories: blue collar, referring to menial work such
as specialized production workers and general workers,
and white collar, referring to supervisors and managers.
25 The interpretation of the empirical investigation as an ex-
ante impact assessment relies on the assumption that the
behaviour of firms would not change after the signing of
these trade agreements.
26 Note that this classification is different from the usual
distinction between white- and blue-collar occupations.
While the production category likely coincides with the tra-
ditional blue-collar category, the non-production category
is not exclusively made up of white-collar-type activities.
For example, a vendor would also be included in this group.
27 The 20 per cent (13 per cent) is obtained by multiplying the
estimated marginal effect, namely 4.98 per cent (-3.4 per
cent), with the anticipated reduction, i.e. the full removal
of export duties in the EU (currently at 4 per cent).
28 Note that decomposing the effect of import tariffs across
partners does not yield significant differences.
29 Of the COMESA member states, Djibouti and Seychelles are
not represented in the ILO (2015a) data.
30 For more information on Kenya’s Vision 2030 plan, see
http://www.vision2030.go.ke/ (accessed on 11 November
2016).
31 See the Ethiopian Ministry of Education’s Education
Statistics Annual Abstract 2010-2011, available at http://info.
moe.gov.et/emdocs/esaa03.pdf (accessed on 6 November
2016).
32 See the Egypt country report for the 2014 Ministerial Con-
ference on Youth Employment, available at http://www.
adeanet.org/min_conf_youth_skills_employment/sites/
default/files/u24/Egypt%20Country%20Report_0.pdf (ac-
cessed on 6 November 2016).
33 See UNCTAD (2015b), which shows how gender inequalities
and other constraints have severely limited many women
retail traders’ ability to take advantage of increased trade
openness relative to men.
34 See, for instance, the COMESA Sustainable Tourism Devel-
opment Framework, Zambia’s Revised Sixth National De-
velopment Plan, and Kenya’s Vision 2030.
35 See COMESA’s development strategy, including a discussion
of tourism, at http://www.comesa.int/comesa-strategy/
(accessed on 11 November 2016).
36 The United Nations World Tourism Organization identifies
a lack of access to specialized training as an impediment
to women finding formal and professional employment in
tourism (UNWTO, 2011).
37 The empirical estimation is done using the Stata statistical
package. For an introduction to Stata, see Volume 2 of the
training material (UNCTAD, 2014d).
38 This distinction is important because employment for both
males and females may have increased while the share of
female employment could have remained the same, or de-
clined. In that case the negative association between high-
er trade volume or lower tariffs and the share of female
employees might not reflect the actual employment gains
for women as a result of trade liberalization.

