teaching & learning report 2019
TRANSCRIPT

TEACHING & LEARNING REPORT2019

CONTENTS3 Introduction
9 Chapter 1: Pathways for student success
10 Introduction
11 1.1 Academic advising for teaching and learning at UCT
26 1.2 Courses Impeding Graduation Project
37 1.3 Multiliteracies
46 1.4 Academic exclusions: Reflections on changing practice
52 Conclusion
53 Chapter 2: Imperatives for curriculum change
54 Introduction
54 Taking curriculum change forward
62 Conclusion
63 Chapter 3: Quality of teaching and learning
64 Introduction
64 3.1 Lecture recording and class attendance
78 3.2 Recognising excellence in teaching and learning: 2019 Distinguished
Teacher Awards
84 Conclusion
86 Chapter 4: Assessing student performance by key indicators
87 Introduction
88 4.1 Student enrolments and enrolment profiles
100 4.2 Academic staffing and student:staff ratios
107 4.3 Teaching and learning
144 Conclusion
149 Appendix

INTRODUCTION

4
UNIVERSITY OF CAPE TOWN | TEACHING & LEARNING REPORT 2019
The Teaching and Learning Committee (T&L Comm) of Senate has
as one of its primary responsibilities the advancement of teaching
and learning and to reflect on the performance of the University
of Cape Town (UCT) in this core function. The production of the annual
teaching and learning report is part of this committee’s oversight role on
behalf of the Senate. The report must engage the broader UCT community,
that is, academics not in Senate; professional, administrative support
and service (PASS) staff; and students, about the state of teaching and
learning at the university. The chair of the T&L Comm will present the
report to Council and, as such, it may be of interest to UCT alumni.
The 2018 Teaching and Learning
Report marked the start of a more
systematic and institutionally driven
conceptualisation of teaching and
learning and an attempt to develop
a more critical and self-reflective
approach to reporting on teaching
and learning at UCT. Owing to the
COVID-19 pandemic and its impact on teaching and learning, the T&L
Comm decided to reduce the size and coverage of the 2019 report
as many of the contributors became consumed with the lockdown
arrangements and the implementation of emergency remote teaching
for UCT’s students. Similarly, having systematic access to the student
voice during this year was more difficult, given the students’ own stresses.
The pandemic is already having an impact on the conceptualisation and
delivery of teaching and learning, on the understanding of academic
identity and on students’ experiences of the university. In many ways,
it is difficult to write an introduction to the 2019 Teaching and Learning
Report as 2019 seems a very long time ago and we are so much more
concerned with the future than with the past. However, only an analysis
“In many ways, it is difficult to write an introduction to the 2019 Teaching and Learning Report as 2019 seems a very long time ago and we are so much more concerned with the future than with the past.”

5
UNIVERSITY OF CAPE TOWN | TEACHING & LEARNING REPORT 2019
of the university’s performance can illuminate areas for improvement
and help to map the future.
Looking at 2019 from the vantage point of the disruption caused by the
COVID-19 pandemic, there is surprising continuity in the main themes
that were flagged for reflection last year and what we will be looking at
in the 2020 report.
Last year the spotlight fell on eight barriers to the achievement of
excellence in teaching and learning at UCT:
an undefined relationship between teaching and research at the
undergraduate level
siloed approach to curriculum and programme development
understanding students
the interface between the psychosocial and the academic worlds
the achievement gap
connecting access with success throughout the degree
use of data to develop educational interventions
curriculum.
With the exception of the undefined
relationship between teaching and
research at the undergraduate level,
which is still to be tackled, UCT has
made some progress in relation to
all other barriers. The progress is
not so much that the university has
improved its performance against
some indicators, although there have been improvements especially
in success rates, which will be discussed in the relevant sections, but
that certain themes are being progressively embedded in UCT’s agenda
“With the exception of the undefined relationship between teaching and research at the undergraduate level, which is still to be tackled, UCT has made some progress in relation to all other barriers.”

6
UNIVERSITY OF CAPE TOWN | TEACHING & LEARNING REPORT 2019
about teaching and learning. Prime
examples of this are the connection of
access and success and understanding
students, both examined in Chapter 1
of this report. At the same time, UCT is
putting in place the building blocks to
develop the institutionalised technical,
organisational and pedagogic capacity
to use data to develop educational
interventions (see especially section 1.2 in Chapter 1). The university has
reached some basic consensus in terms of curriculum change, including
a rudimentary understanding of curriculum development, and, while this
will always be a contested space, the principles for curriculum review
and the ongoing work on making those principles operational have been
agreed upon (Chapter 2).
Whatever progress UCT has made in the past few years in terms of
conceptual understanding of the interface between the psychosocial
and the academic worlds, this remains an area of concern, especially
as it refers to the impact that structural social inequality has on student
performance. Deeply linked to this is the most intransigent performance
indicator at UCT: the achievement gap between White and Black
students and, in particular, the achievement gap between White and
African students (see Chapter 4).
At the postgraduate level there are two themes highlighted by the data
(Chapter 4) that need to be examined in detail given UCT’s identity
as a research-intensive university: the postgraduate pipeline or the
conversion of undergraduate students into postgraduates, and the time
to completion of master’s degrees and PhDs across all faculties.
The introduction to the 2018 report mentioned seven stretches that UCT
needed to make in order to overcome the barriers to excellence that had
“UCT is putting in place the building blocks to develop the institutionalised technical, organisational and pedagogic capacity to use data to develop educational interventions.”

7
UNIVERSITY OF CAPE TOWN | TEACHING & LEARNING REPORT 2019
been identified. These remain valid and they relate predominantly to the
main themes addressed in this 2019 report: student success, pedagogies
sensitive to students’ needs, developing a capacity for data analytics, and
review of the curriculum. I would like to home in on one of these stretches:
the need to professionalise teaching and learning. This year’s report does
not provide an account of the work done in this area at the institutional
level. However, it shows the kind of work that reflective and committed
academic teachers do with their students through the presentation of the
four winners of the Distinguished Teacher Award 2019 (Chapter 3).
Writing in 2020, it seems more important than ever to acknowledge the
dedication, knowledge, energy and sheer talent UCT academics put into
teaching at both undergraduate and postgraduate levels.
Unlike in the 2018 report, the T&L Comm
did not engage directly with students
or the faculties for their contributions
to this report. Also, there was no time
to conceptualise the report and write
it together as a team as we did last
year. We are thankful to the following
contributors: Alan Cliff, Jane Hendry,
Stephen Marquard, Suellen Shay and the
Courses Impeding Graduation (CIG) Project team, Ermien van Pletzen
and the Academic Advising and Multiliteracies Project teams, Amanda
Petra-Barratt and, last but not least, Anthea Metcalfe for holding it all
together.
This report is organised into four chapters besides this introduction and
the conclusion. Chapter 1 reports on pathways and data analytics for
student success. Chapter 2 reflects on curriculum change. Chapter 3
looks at improving the quality of teaching through a focus on lecture
“Writing in 2020, it seems more important than ever to acknowledge the dedication, knowledge, energy and sheer talent UCT academics put into teaching at both undergraduate and postgraduate levels.”

8
UNIVERSITY OF CAPE TOWN | TEACHING & LEARNING REPORT 2019
recording and the recognition of teaching excellence. Chapter 4 focuses
on student performance through the analysis of quantitative indicators
of success. Finally, the conclusion draws attention to the themes that
require further engagement and decision-making to achieve the teaching
and learning objectives of Vision 2030.
A note on the use of racial categories: For monitoring purposes, it is
necessary to keep on using apartheid racial designations. This report
uses the following “classifications” to refer to South African students
and staff: African, Coloured, Indian and White. “Black” encompasses
African, Coloured and Indian people.
ASSOCIATE PROFESSOR LIS LANGE Deputy Vice-Chancellor: Teaching and Learning Chairperson: Teaching and Learning Committee
September 2020

CHAPTER 1
PATHWAYS FOR STUDENT SUCCESS

10
UNIVERSITY OF CAPE TOWN | TEACHING & LEARNING REPORT 2019
INTRODUCTION
This chapter focuses on student success through the lens of the use
of data to identify problems and design interventions. Although
UCT has a long tradition of using data in teaching and learning at a
descriptive level, data analytics in relation to student performance is a new
initiative. This section showcases two projects designed to understand the
factors that hinder student progress and the identification of interventions
to improve student success. These are the Academic Advising and the
Courses Impeding Graduation (CIG) projects. National and institutional
data have shown that early and continual advice impacts on students’
successful management of their academic programmes. Section 1.1 reports
on the progress of the institutional Academic Advising Project that started
in 2018. Section 1.2 reports on the work of the cross-institutional CIG
Project that interrogates patterns of student performance at the course

11
UNIVERSITY OF CAPE TOWN | TEACHING & LEARNING REPORT 2019
level to implement appropriate interventions. Section 1.3 reports on the
development of a collaborative multiliteracies network to strengthen and
enhance the curriculum, student learning, early professional development
of postgraduate consultants and tutors, and staff capacity at UCT. Section
1.4 focuses on the underside of student success – student failure – by
looking at the process and outcomes of academic exclusions during 2019.
1.1 ACADEMIC ADVISING FOR TEACHING AND LEARNING AT UCT
In 2019 the Academic Advising Project completed its second year of
a three-year funding cycle. The project is an institution-led, national
collaborative initiative funded by the Department of Higher Education
and Training’s (DHET) University Capacity Development Programme
to develop academic advising capacity across a network of South
African universities. As reported in 2018, academic advising at UCT
is part of a multi-pronged teaching and learning strategy to support
student success. It is expected to help students overcome obstacles at
key transition points on their journey into and
through higher education and to contribute
to a transformative institutional culture by
developing, implementing and disseminating
advising practices that foster student
engagement and a sense of belonging, and
that support equity of access and outcomes.
The project, which works in partnership with
UCT’s First Year Experience, is located in the
Academic Development Programme (ADP) of
the Centre for Higher Education Development
(CHED).
“Academic advising at UCT is part of a multi-pronged teaching and learning strategy to support student success. It is expected to help students overcome obstacles at key transition points.”

12
UNIVERSITY OF CAPE TOWN | TEACHING & LEARNING REPORT 2019
The previous report identified prescriptive and developmental advising
as two facets of academic advising. Prescriptive advising refers to
assisting students with academic rules and regulations in constructing
valid curricula, selecting appropriate courses, calculating course credits
and exploring alternative curriculum pathways to a qualification.
Developmental advising focuses on assisting students in exploring
their personal, academic and career goals and in developing skills and
strategies that facilitate academic success and well-being, for instance,
time and stress management.
The student voiceA vital principle of the project is to design and reinforce academic
advising at UCT based on evidence of students’ needs and experience
at the institution. Student focus group data gathered in the faculties of
Science and Health Sciences in 2019 revealed that UCT needs to expand
and strengthen both faculty-specific and institution-wide advising
services. We report on the most pertinent areas that emerged from the
data and the initiatives that were designed in response.
The second annual Epic Job Expo, hosted by UCT’s Careers Service, took place on 7 August 2019 at the Sports Centre.

13
UNIVERSITY OF CAPE TOWN | TEACHING & LEARNING REPORT 2019
Students in the Science faculty advocated for
the inclusion of pre-enrolment information in
the first communications they received from
the university, such as letters of acceptance.
They recommended the inclusion of a glossary
of unfamiliar terms (such as “curriculum”
and “credits”) and information on curriculum
structures and pathways. They argued that
such information would have facilitated
their first academic encounters. This was
particularly important in Science, where there
is a high level of choice in course selection,
and undergraduate degrees are broadly formative and not linked to
profession-specific qualifications as in the Health Sciences, Commerce,
Law, and Engineering & the Built Environment (EBE) faculties. One
student explained the frustration of having to make crucial decisions
under pressure and without enough information and support during the
first couple of days on campus:
“When they tell you about university, they don’t tell you that you’ve
got to choose electives when you get there. They don’t tell you
anything, just like you have got into university ... So when I get here ...
they only give you ... maybe an hour to see those course outlines. It’s
like you’re under pressure, you’re not really sure what you are doing
... They tell you, you have to like have some number of credits, and
you don’t even know what credits are ... and then, actually, you might
end up doing something you’re not intending to do. For instance, I
came here hoping to major in X and Y. But in second year, the courses
actually clashed ... So, I had to change my other major ... and then I
went to Z and that is not what I was expecting to do.”
“Student focus group data gathered in the faculties of Science and Health Sciences in 2019 revealed that UCT needs to expand and strengthen both faculty-specific and institution-wide advising services.”

14
UNIVERSITY OF CAPE TOWN | TEACHING & LEARNING REPORT 2019
Students from both faculties criticised orientation. Some felt it was
“misleading” to suggest that “this is going to be fun”. They would have
preferred a more realistic sense of what is expected of them at university,
especially at an academic level, when compared to high school.
Orientation was also criticised for not catering for “our age group”, and
for giving too much information without prioritising what was most
important for coping with academic studies. Newcomers found that
student orientation was too lecture-based instead of allowing students
to voice their ideas or experiences or connect sufficiently with peers.
Several students found the first months of studying at university
overwhelming. Many achieved good results at school, and the experience
of doing less well or even failing at university deeply unsettled them.
Frequently, they did not know how to adjust their plans, or where to turn
for help:
VC Prof Mamokgethi Phakeng with the orientation leaders at the First-Years’ Braai on 31 January 2019.

15
UNIVERSITY OF CAPE TOWN | TEACHING & LEARNING REPORT 2019
“When one thing goes wrong, it means like my whole plan is just … it’s
more like my foundation is cracked. The whole building’s just going
to come down. So, now I have to start afresh and make a whole new
plan. So for me, it takes like a whole week trying to figure out things
and like, no, actually, when I fail, it really crushes me.”
And this from another student:
“I understand that. I feel like most of your first year is made up of lying
in bed, thinking about your failures, and trying to revise your plan.
Okay, maybe I can’t do this thing anymore. Maybe I should just resort
to something else. But what is easier? I don’t think anything’s easier.
And it’s just, they don’t tell you that you’re going to fail this much.
And maybe they don’t call it failure, they tell you that, okay you might
not do as well, but they don’t tell you the extent to which you will not
do as well.”
Students felt that the possibility of transferring to an extended
curriculum might relieve pressure and offer space and time to engage
better with the transition to university. However, since a transfer
was linked directly to assessment, it felt punitive. It was offered only
to “those people [who] actually got less than 50”, instead of as a
beneficial pathway planned intentionally. In this context, students felt
that the way they became aware of the extended curriculum made
transferring stigmatising. A student said: “I wish they would make
it less of a second choice ... tell more people about it.” Students
reported that they would go to advisors with their minds made up to
transfer, only to be told that their reason was not “valid”. A suggestion
from students was that peer advisors (not only faculty advisors)
should communicate the advantages of transferring to an extended
curriculum at the beginning of the year. One student described the

16
UNIVERSITY OF CAPE TOWN | TEACHING & LEARNING REPORT 2019
difference it made to get advice from a peer advisor instead of only
from a faculty advisor:
“You look at them [faculty advisors] ... and you’re like, ‘You don’t even
know what I’m going through!’ I feel like with a group of students, you
know, because they went through this, I can trust them.”
Students said that lecturers or course convenors were not best placed to
give developmental advice, since there could be a conflict of roles. Course
convenors “can’t be objective” as advisors as they assess students; and
“it’s very difficult also to approach someone [who is] giving you all this

17
UNIVERSITY OF CAPE TOWN | TEACHING & LEARNING REPORT 2019
hard work and expecting you to make it”. An advisor not involved in
their academic studies, for instance, someone based in the faculty office,
was seen as capable of giving more objective, helpful and caring advice.
Students also stressed the importance of getting advice from peers who
had gone through similar experiences, although they cautioned against
inappropriate reliance on peer advising:
“It seems as though now we have to take on the roles of being a
psychologist and we have to talk to our friends and support each
other and it can get tough on us as well because we’re not really
experienced and it’s hard to be objective and not take in all those
emotions that are experienced by someone else. So, it’s like, I wish
they [the university] could just improve their system.”

18
UNIVERSITY OF CAPE TOWN | TEACHING & LEARNING REPORT 2019
Students commented on how important advice and information about
support services were communicated to them. They said that they felt
overwhelmed by the high volumes of email and struggled to keep up.
They said many students did not or could not check their emails regularly.
Students often relied on word of mouth to find out about academic and
other support services on campus, and many did not know about the
available institutional support. Students based on the Health Sciences
campus felt particularly isolated from institutional networks. They
recommended fewer announcements and that critical information be
sent out via WhatsApp groups or posted on social media sites. They
valued interactive WhatsApp groups and sites.
Design of evidence-based academic advising initiatives and building capacityIn 2019 the Academic Advising Project supported several initiatives in
response to the evidence gathered from students. Below we report on
the project activities across the institution and initiatives undertaken with
three faculties: Science, Commerce and Health Sciences. The Academic
Development Programme (ADP) units located in these faculties served
as important hubs for shaping advising practices.
Faculty of ScienceMembers of the Science ADP (SADP) analysed obstacles to student
progression to desirable majors (like genetics and molecular biology),
as well as postgraduate studies in the biological sciences. They
participated in a project analysing the obstacles to progression that
first-year mathematics courses pose for many science students. The aim
in both cases was to design curriculum pathways supportive of student
progression and success in these areas and to strengthen related advising
practices.

19
UNIVERSITY OF CAPE TOWN | TEACHING & LEARNING REPORT 2019
The work started with simplifying the curriculum information and rules
and presenting these in a reader-friendly format that would benefit
both faculty advisors and students. The timetable was also adjusted to
facilitate a choice of curriculum pathways. The team drafted a glossary
of unfamiliar terms and guidelines for giving curriculum advice, as
well as a set of guiding questions that students could draw on when
visiting a faculty advisor. Because of the wide range of course selections
and broadly formative qualifications offered in the Faculty of Science,
students are in particular need of exploring career objectives and
possibilities (lack of direction in career goals and aspirations could lead
to demotivation in their studies).
The Academic Advising Project and the SADP support a partnership
between the Faculty of Science, the UCT Careers Service and the Centre
for Innovation in Learning and Teaching (CILT) in CHED. It involves the

20
UNIVERSITY OF CAPE TOWN | TEACHING & LEARNING REPORT 2019
development of a set of interactive online science Careers Discovery
modules to introduce first-year students to the world of work. It will
explore the professional outcomes of particular disciplines and how
skills gained in a science degree could be transferred to other contexts,
show students the value of being involved in extramural activities, and
assist them in building a CV that showcases their skills. The aim is to
pilot these modules in 2020.
Faculty of CommerceThe Commerce Educational Development Unit (Commerce EDU), in
partnership with the UCT Careers Service, has been a pioneer in putting
together a model of holistic and integrated developmental advising over
the past decade. This work has influenced other faculties. It comprises
two semester-long courses, the first of which is Step Up. This focuses
on students’ transition into higher education, acknowledges their
sociocultural contexts, taps into their agency, builds resilience, explores

21
UNIVERSITY OF CAPE TOWN | TEACHING & LEARNING REPORT 2019
their personal goals and develops a sense of community. The second
course, Careers Discovery, focuses on developing an understanding
of commerce disciplines and their relation to the world of work while
exploring students’ professional and career goals. The Faculty of
Commerce mainstreamed the content of these courses as part of a
credit-bearing course, the Commerce Case Study, which orientates
all first-year students in Commerce to the personal and professional
dimensions of their studies. The Academic Advising Project endorses
these fully integrated developmental courses as a model of curriculated
advising that should be extended to other faculties.

22
UNIVERSITY OF CAPE TOWN | TEACHING & LEARNING REPORT 2019
Faculty of Health SciencesHealth Sciences started the peer advising hub with funding from the
Ikusasa Student Financial Aid Programme (ISFAP) and under the
auspices of the Faculty of Health Sciences Educational Development
Unit (FHS EDU). The hub, called the Student Resource Centre, became
an initiative of the Academic Advising Project in 2019, in partnership
with the ISFAP programme managers. Their professional advising
experience added significant capacity to the project. The Academic
Advising Project now assists with funding, guidelines, materials,
training and a referral protocol. Based in the Groote Schuur Old Main
Building, the Student Resource Centre is a walk-in centre where senior
peer advisors interact informally with junior students. They facilitate
first-year students’ transition and integration into higher education and
offer academic and other forms of support to first- and second-year
students. The centre also runs a pop-up desk in the Anatomy Building
to answer student queries and promote the centre. In recognition of

23
UNIVERSITY OF CAPE TOWN | TEACHING & LEARNING REPORT 2019
the importance of not over-burdening peer advisors with students’
personal and academic problems that they are not equipped to deal
with, the Academic Advising Project team and their partners have
carefully defined the peer advisors’ roles and responsibilities and
provide training and debriefing opportunities. Peer advisors’ primary
roles are offering a first point of contact with the faculty, providing
basic advice and support, and referring students on, connecting them
to information about support structures and services across campus.
The Academic Advising Project has developed a stakeholder map of
student support services to facilitate referral work.
Challenges encountered in 2019 and the way forwardA key challenge during the year under review was to identify and allocate
capacity and suitable expertise to the Academic Advising Project. UCT’s
two ISFAP programme managers joined the project in 2019, bringing
with them valuable expertise in professional advising and experience
of using a student tracking system. The project appointed a part-time
research assistant and youth development practitioner to assist with
gathering and analysing evidence provided by students and to develop
materials for use in pilot initiatives. Two staff members participated in
the national training workshop offered annually at the University of the
Free State.
Another challenging area is developing appropriate technology to make
advising more accessible and efficient across the institution. In 2020 the
Academic Advising Project will investigate the possibility of developing
a central advising portal, a digital helpline staffed by peer advisors, and a
chatbot to communicate important institutional information to students
and to connect them to institution-wide support services.

24
UNIVERSITY OF CAPE TOWN | TEACHING & LEARNING REPORT 2019
Finally, a significant challenge is getting access to streamlined systems
and student performance data as they are currently housed and managed
in different locations. In this respect, the project plans to participate
actively in both the Data Analytics for Student Success (DASS) project
and UCT’s future partnership in the Siyaphumelela network to make
reliable, user-friendly and up-to-date data systematically accessible to
staff and students for advising purposes.
A proposed model for academic advisingThe model of academic advising proposed for UCT based on evidence
gathered so far, and the pilot initiatives described above, is a hybrid,
integrated system of faculty-based and centralised advising services, as
indicated in the diagram below.
Professional advisors
Based in central advising project
(but also assigned to particular faculties)
Peer advisors
Based in faculty hubs,
staffing central helpline
Academic
advisors
Based in faculties

25
UNIVERSITY OF CAPE TOWN | TEACHING & LEARNING REPORT 2019
Three tiers of advisors indicated in the diagram would provide integrated
academic advising services:
1. Faculty-based curriculum advisors who advise students at key points
of the academic year on constructing viable curriculum pathways
(including the extended curricula in the faculties where they are
available) following a set of systematic advising guidelines and the
criteria of the faculty. (This tier of advisors already exists in the faculties,
but their roles and practices vary and students from various faculties
do not get the same level of service.)
2. Faculty and residence-based peer advisors, who facilitate face-to-
face interactions or engage students via tools such as a helpline,
work to build confidence in help-seeking behaviour, resilience and
engagement, and promote engagement through a university-wide
referral system.
3. A team of professional advisors based in the central Academic Advising
Project (and also assigned to particular faculties) to update UCT’s
Academic Advising portal and referral network, develop materials and
guidelines for faculty and peer advisors, track students’ progress on
a range of personal and performance indicators (as currently in use
in ISFAP). They will also engage students in broader developmental
and exploratory activities related to their personal growth, academic
studies and career goals in partnership with CHED’s Careers Service.
These centrally located professional advisors would manage future
advising tools like a helpline and chatbot, and train, supervise and
support the peer advisors.
Advisors at all tiers would form part of an extensive referral network
involving stakeholders like Recruitment, Financial Aid, the Student
Wellness Service, Student Housing, Orientation, etc. Ideally, most of the

26
UNIVERSITY OF CAPE TOWN | TEACHING & LEARNING REPORT 2019
objectives and outcomes of academic advising would be embedded in
the curriculum as credit-bearing core courses or modules in existing
courses. Advisors at all tiers could contribute to the development and
delivery of such courses or modules.
1.2 COURSES IMPEDING GRADUATION PROJECT
Introduction The CIG Project is a research and development initiative of CHED. Its goal
is to address the problem of high failure rates in courses that are obstacles
to student retention and progression. This report lays out the background,
aims, objectives and outcomes of 2019 and the implementation of a
CIG-specific project in the Department of Mathematics and Applied
Mathematics in the Faculty of Science.
Background and rationale There is a significant body of scholarship on student retention1 in higher
education that points to key determinants that influence whether
students successfully pass courses and ultimately graduate or not. They
recognise, on the one hand, the influence of students’ backgrounds
measured through demographic variables such as socio-economic
status, schooling, race and gender, and, on the other hand, there is a
range of variables within the institution: academic, environmental and
social. These models propose a complex interplay between students’
“commitments” (including the resources they bring with them) and
1 Tinto (1975) is the seminal work in this area, but there have been many studies done in South African higher education, including most recently Case, Marshall and McKenna (2018) Going to University.

27
UNIVERSITY OF CAPE TOWN | TEACHING & LEARNING REPORT 2019
institutional conditions that influence the extent to which students
successfully integrate and ultimately succeed in their degrees. CHED has
a long-standing commitment to the quality of teaching and learning with
particular responsibility for addressing the ongoing impact of educational
inequality on student performance at the university. Students’ access
into university, placement onto and progression through appropriate
curricula, as well as the quality of their overall learning experience, is
central to CHED’s mission.
Before we enter into the actual discussion of this project at UCT, it is
important to remember that the issue of access and success has been
a constant focus of South Africa’s higher education policy since 1994.
The point of departure informing the conceptualisation of the issue has
always been the impact that colonialism and apartheid have had in the
development of racialised inequality. The task of the university in relation
to this is to understand how curriculum and pedagogy support or hinder

28
UNIVERSITY OF CAPE TOWN | TEACHING & LEARNING REPORT 2019
the possibility of undoing inequality. In
thinking about CIGs it is important that we
bring together educational, sociological
and political frames that make clear that
improving student success and reducing
the achievement gap are not technical
matters.
For nearly 10 years, UCT’s Institutional Planning Department (IPD) has been
producing data on so-called “high-risk courses” offered by the university, ie
courses with a failure rate of 25% or higher for three consecutive years. These
courses are often also service courses, meaning that they are requirements
for entrance into several different academic programmes, departments
and faculties. As a result, they not only contribute to high failure rates but
also have an overall high impact on programme progression. Hence the
title Courses Impeding Graduation Project.
The analysis of these courses has become increasingly granular, but the
use of the data for addressing the challenges has been slow and uneven
across faculties. Over the years there have been several attempts to
“flag” these courses as an institutional priority, requiring faculty buy-in,
more support and improved resourcing. During 2014 and 2015, CHED
facilitated a process of faculty consultation that surfaced some of the
contextual complexities of solving “high-risk course” challenges. The
high-risk course may not be the only problem or even the cause of the
problem. The broader context of the degree, the pre- and co-requisites,
and issues of workload need to be considered as well.
Recently, in an attempt to address some of these issues, there has been a
shift at UCT to allocate these CIGs to typically younger, enthusiastic and
pedagogically skilled lecturers. This move has resulted in not only more
“During 2014 and 2015, CHED facilitated a process of faculty consultation that surfaced some of the contextual complexities of solving ‘high-risk course’ challenges.”
29
UNIVERSITY OF CAPE TOWN | TEACHING & LEARNING REPORT 2019
dedicated teaching but a range of pedagogical innovations, eg learning
laboratories with whiteboard problem-solving, Saturday workshops and
innovative uses of educational technology, to name a few. However, the
high failure rates have remained stubbornly in place, suggesting that
some of these challenges cannot be addressed only through pedagogical
interventions.
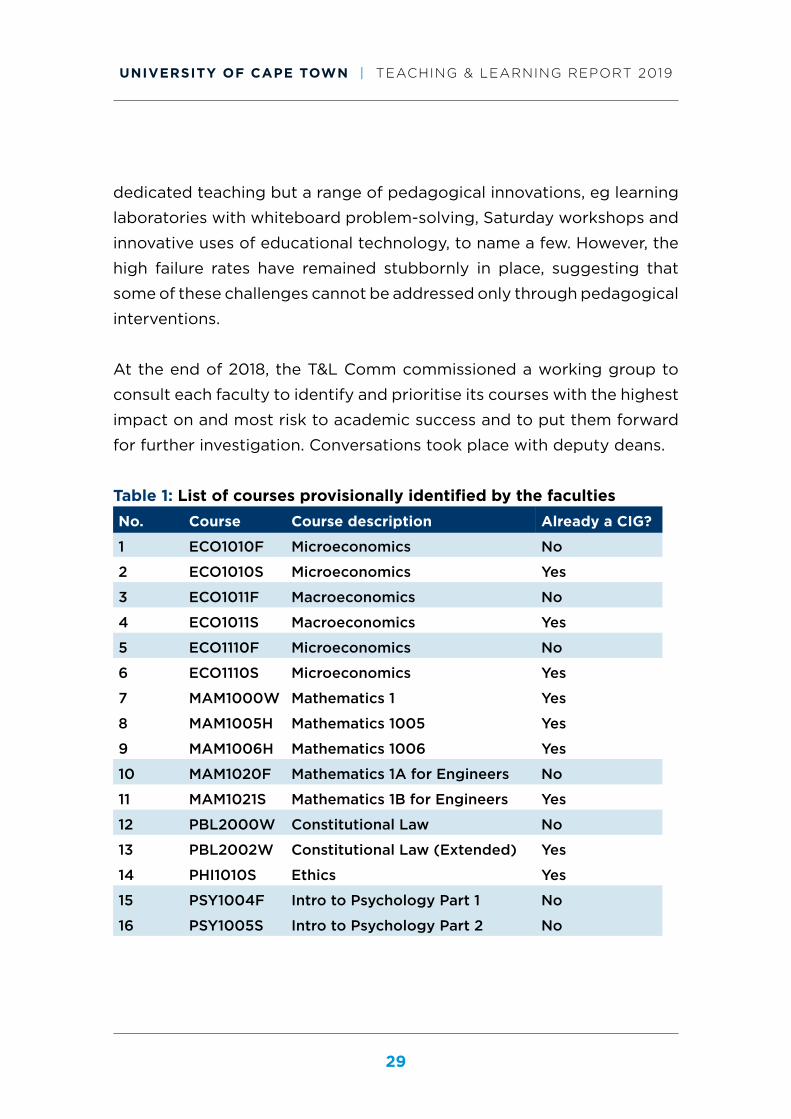
At the end of 2018, the T&L Comm commissioned a working group to
consult each faculty to identify and prioritise its courses with the highest
impact on and most risk to academic success and to put them forward
for further investigation. Conversations took place with deputy deans.
Table 1: List of courses provisionally identified by the facultiesNo. Course Course description Already a CIG?
1 ECO1010F Microeconomics No
2 ECO1010S Microeconomics Yes
3 ECO1011F Macroeconomics No
4 ECO1011S Macroeconomics Yes
5 ECO1110F Microeconomics No
6 ECO1110S Microeconomics Yes
7 MAM1000W Mathematics 1 Yes
8 MAM1005H Mathematics 1005 Yes
9 MAM1006H Mathematics 1006 Yes
10 MAM1020F Mathematics 1A for Engineers No
11 MAM1021S Mathematics 1B for Engineers Yes
12 PBL2000W Constitutional Law No
13 PBL2002W Constitutional Law (Extended) Yes
14 PHI1010S Ethics Yes
15 PSY1004F Intro to Psychology Part 1 No
16 PSY1005S Intro to Psychology Part 2 No

30
UNIVERSITY OF CAPE TOWN | TEACHING & LEARNING REPORT 2019
In 2019 the faculties of Science and Commerce gave firm commitments
to address the challenges posed by these courses. Science selected
courses from the Department of Mathematics and Applied Mathematics:
MAM1000W, MAM1005H and MAM1006H. Commerce chose courses
from the School of Economics: ECO1010F/S, ECO1011F/S and ECO1110F/S.
Each suite included the mainstream course and the extended versions
of the course. Consultations with the remaining faculties are ongoing
and regarded as a priority in 2020.
The terms “mainstream” and “extended” refer to curriculum structures
that have been in place at UCT for decades in all existing faculties. These
were set up in the 1990s to address the performance gap between
highly academically prepared students from historically well-resourced
public and private schooling, and “disadvantaged” students from poorly
resourced public schooling. The performance gap takes on a variety of
forms, depending on the faculty, but essentially requires an extra year of
credit-bearing, hence subsidy-generating curricula. Thus, in each cluster of
CIGs per faculty, there is an analysis of the regular mainstream courses (eg
MAM1000W) and the extended courses (eg MAM1005H and MAM1006H).
Aims and key questionsThe CIG Project aims to address the challenges of high-risk courses that
result in high failure rates, with a particular focus on the experience of
Black students, and a view to reducing the achievement gap between
Black and White students. This is all the more important considering
that UCT attracts some of the top academic talent in the country.2
Despite this, and the fact that the completion rate per cohort is high
2 In 2018 76% of UCT first-time entering undergraduates had an NSC aggregate of B or above (2018 Teaching and Learning Report, p. 136).

31
UNIVERSITY OF CAPE TOWN | TEACHING & LEARNING REPORT 2019
(the 2014 five-year-survival cohort
completion rate is 73%3), some
problems need attention. When
the data is disaggregated, it is
clear that some faculties have more
significant challenges in retaining
and progressing students4, eg the
faculties of Science and EBE, and
that Black students are more at risk
of failing or of passing with comparatively low marks.
The persistent gap between the completion rates of Black students,
compared with those of White students5, constitutes a particular
concern. To compound these challenges, some of the long-standing
interventions to address these performance gaps need to be reviewed
regularly to ensure that they are responsive to the changing needs of
students. Among them is the need to revisit the relationship between
the mainstream and the extended curricula.
Despite many sources of existing institutional data, UCT has not used
this data optimally to understand and address the challenges. Thus, an
additional objective of the CIG Project is to bring different sources of data
to bear on this crucial area of concern. The second aim of the project is,
therefore, to contribute to a data-informed institutional strategy towards
the academic success of students.
3 2018 Teaching and Learning Report, p. 152.4 The 2013 cohort completion rates for Science, EBE and Law were 68%, 65% and 52%
respectively (2017 Teaching and Learning Report, Table 20a).5 The 2014 cohort completion rates for Black and White students were 61% and 85% respectively.
“UCT attracts some of the top academic talent in the country. Despite this, and the fact that the completion rate per cohort is high (the 2014 five-year-survival cohort completion rate is 73%), some problems need attention.”

32
UNIVERSITY OF CAPE TOWN | TEACHING & LEARNING REPORT 2019
The central question is, “For whom is the curriculum working (or not)
and why?” The notion of a curriculum “working” involves a number of
variables that include how the course is contributing to the development
of graduate attributes necessary for the student’s chosen pathway
into the world of work. This project aims to contribute to a richer
conceptualisation of what is meant by “student success” and what its
key indicators are at UCT. For the project in 2019, “working” simply refers
to who is passing (or failing) the selected CIG-investigated course, and
why.
The project uses various sources of data to reflect on the appropriateness
and effectiveness of the curriculum and pedagogy. In other words, the
interest is in who is “at risk”, in order to gain an understanding of what
part of the curriculum and/or the pedagogy is putting students at risk
and what can be done about it.

33
UNIVERSITY OF CAPE TOWN | TEACHING & LEARNING REPORT 2019
The CIG Project sets out to address the following specific questions:
1. What are the variables that offer the strongest indicators of students
who are most likely to be at risk in their performance on selected CIGs?
2. What complementary roles do the National Benchmark Tests (NBT)6
scores have to offer?
3. What do the NBTs reveal about the relative importance of mathematics,
academic literacy and quantitative literacy subdomains to students’
performance on selected CIGs?
4. What is the diagnostic potential of this analysis for assisting academic
staff in anticipating student engagement with course resources and
aligning the curriculum and pedagogy accordingly?
5. What are the variables that offer the strongest indicators of students
who are most likely to be at risk in completing their undergraduate
degree, ie what is the impact of passing or failing the CIGs on
progression towards their degree?
6. What are the students’ perspectives on factors that contribute to their
risk in these courses, ie what do students say about their experience
of failing the CIGs?
7. In what ways does current student engagement on the CIGs
strengthen or weaken the predictability of the “risk profiles” identified
in 2 above? In particular, what does student engagement with
resources of the course (eg textbooks and/or lecture recording) tell
us about students’ potential risk factors?
8. What are the implications of these risk profiles for curriculum review:
decisions about appropriate curricula, mechanisms for placement,
models of extended curriculum provision, and early assessment,
6 National Benchmark Tests are available to any university applicant. They are measures of university preparedness. They assess in three domains: academic literacy, quantitative literacy and mathematics.

34
UNIVERSITY OF CAPE TOWN | TEACHING & LEARNING REPORT 2019
ie what particular interventions are needed to reduce the at-risk
students’ experience in these CIGs?
Methodology The project draws on four sources of data to understand the reasons for
these high failures:
quantitative analysis of historical course performance
qualitative data of students’ experiences in the courses
data on student engagement in the course
formal and informal engagements with academics who convene, teach
or have taught these courses, and engagements with departmental
leadership.
The focus of the project has been to develop a way of dealing with
quantitative data, including statistical analysis, further data analysis
and data visualisation. The first step of the analysis was to produce
a list of high-risk courses for the period 2015 to 2017 and conduct a
statistical analysis consisting of correlations using analysis of variance
of the relationship between a range of variables and CIG performance.
The variables include race, gender, home language, school achievement
scores (as measured by the National Senior Certificate [NSC] overall
aggregate, as well as aggregates for mathematics and English) and
readiness for university (as measured by NBTs for mathematics,
academic literacy and quantitative literacy). These two sets of tests
provide data for tracking student performance retrospectively (how well
learners achieved at school) and prospectively (how prepared learners
are for university entry). For ease of reference, the NSC is referred to as
“school achievement” and the NBTs as “university preparedness”. The
quantitative analysis was completed for all the CIG courses and will be
discussed in each of the course-specific sections.

35
UNIVERSITY OF CAPE TOWN | TEACHING & LEARNING REPORT 2019
Overview of findings In response to the question, “For whom is the curriculum working?”,
ie “Who is not at risk?”, there is a consistent pattern across all the CIGs
irrespective of disciplinary content. There is a significant difference
between those who fail and those who pass on all the selected variables,
namely school achievement, university preparedness and demographic
data. The only exception is gender. Findings disclose that the CIG courses
are working for White, English/Afrikaans home language students who
are high performers on school-leaving and university-preparedness test
scores. The CIGs are “not working” for students who are Black, other
than English/Afrikaans home language speakers, and with lower school-
leaving and university-preparedness test scores. The latter students
registering for these courses are statistically at risk of failure. From
this overall pattern, the project seeks to explore this uniform pattern
The 100UP programme is a three-year enrichment initiative that directly addresses the low numbers of disadvantaged learners from Western Cape townships entering the university.Pictured with some of the 100UP learners are Medeé Rall, the director of the Centre for Extra-Mural Studies (left), student assistant Knowledge Mahbena (second from left), 100UP manager Ferial Parker (third from right) and Shireen Gamieldien (second from right).

36
UNIVERSITY OF CAPE TOWN | TEACHING & LEARNING REPORT 2019
in more depth for each cluster of CIG courses. Further interpretations
and preliminary explanations can be found in the CIG course-specific
sections of this report.
General outcomes for 2019The academic year saw a renewed project-driven approach to addressing
high-risk courses at UCT. The strategy to work directly with each faculty
has created a strong sense of ownership of the challenges associated
with these courses, as well as a high degree of commitment to finding
solutions. Through this undertaking, the CIG Project team, including
the departmental academic staff, have participated in data-informed
decision-making.
The experience and outcomes of the CIG Project have resulted in
proposals for two different sources of additional funding to scale up this

37
UNIVERSITY OF CAPE TOWN | TEACHING & LEARNING REPORT 2019
data analytics work. On the data front, the project has developed and
will continue to refine prototypes for course performance data to assist
curriculum review at UCT. The emerging findings of the project have
been disseminated through some internal presentations.
The way forward and strategies for 2020The CIG Project will continue to consult with the remaining faculties.
Data on the CIGs within the faculties of EBE and Law has been collected.
Co-working with the deputy deans of teaching and learning and staff
of these faculties will commence in 2020. There have been discussions
with the Faculty of Humanities around the challenges associated with
the CIGs in philosophy. The dialogue will continue in 2020. The Faculty
of Health Sciences does not technically have any CIGs. However, a
discussion has begun and will continue around courses that impede
graduation for certain groups of students. The CIG Project will follow
the curriculum review processes that are under way in the Department
of Mathematics and Applied Mathematics and those in the School of
Economics. How these courses address the challenges that comprise a
significant proportion of their students’ experience will be the decisive
measure of the success of the CIG Project.
1.3 MULTILITERACIES
Developing a collaborative multiliteracies network in support of curriculum, student and staff developmentThe Academic Development Programme (ADP) consists of five faculty-
based and two cross-faculty units. Last year’s report showcased the work
of two of the faculty-based units: the Humanities Education Development
Unit (Hum EDU) and the Academic Support Programme for Engineering

38
UNIVERSITY OF CAPE TOWN | TEACHING & LEARNING REPORT 2019
in Cape Town (ASPECT), the ADP unit in EBE. This year’s report focuses
on the collaborative network of pathways that the Numeracy Centre and
the Language Development Group offered in and alongside UCT’s formal
curricula to strengthen and enhance the curriculum, student learning,
early professional development of postgraduate consultants and tutors,
and staff capacity at UCT.
The concept of multiliteraciesBoth units embrace the concept of literacies as multiple and socially
embedded. Literacies are therefore not taught as decontextualised
skills. Instead, opportunities are created in, and in conjunction with,
the curriculum for staff and students to explore academic language
and quantitative literacies as living practices integrated into social
experiences and activities. Both units further acknowledge the multi-
The first of the university's four 12-week Khoekhoegowab language short courses kicked off in June 2019, starting a new chapter in UCT’s history.

39
UNIVERSITY OF CAPE TOWN | TEACHING & LEARNING REPORT 2019
modality of literacies and the critical role that digital and information
literacies play in university-level teaching and learning. In 2019 these
two units together reached approximately 15 000 students through a
network of accredited courses, workshops, online and blended-learning
resources and consultations.
The Numeracy CentreIn 2019 the Numeracy Centre continued to provide alternative access
routes to directions of study that require mathematics or a high level of
quantitative literacy. Several of the Numeracy Centre’s first-year courses
formed part of the extended curricula run by the ADP in partnership
with the faculties of Humanities and Health Sciences. The centre also
offered other important access routes to first-year students who arrive
at university and find that they are blocked from pursuing certain

40
UNIVERSITY OF CAPE TOWN | TEACHING & LEARNING REPORT 2019
desirable majors or are inhibited in their academic progress because
of insufficient proficiency in mathematics or quantitative literacies. The
Numeracy Centre offered two credit-bearing courses that successively
scaffolded access for students who entered the Humanities faculty
without the mathematics prerequisites needed to major in psychology.
Likewise, a mathematics conversion course created access routes to
economics and the biological sciences. The Numeracy Centre further
supported students in Law and the Health Sciences, running courses
and workshops that facilitated access to learning materials encountered
in other parts of the curriculum.
The Numeracy Centre’s materials and
activities were firmly embedded in
relevant socio-economic and disciplinary
contexts, eg the financial and social
situation of students during the Fees
Must Fall period or the health situation of
children and youth in South Africa. Much
of the teaching and learning took place
in computer laboratories, where many
students for the first time learnt to use a
computer and received a firm grounding
in the affordances of Excel software. The
Numeracy Centre also enhanced student performance in later years of
study, mainly by embedding interactive computer-based tutorials in the
disciplines (reaching 2 300 students), helping to enrich the curriculum
significantly at all years of study. These tutorials covered a wide range of
competencies, such as developing students’ three-dimensional awareness
in human biology, enhancing their understanding of statistical concepts
in senior psychology and commerce courses, or building their data
representation skills in psychology.

41
UNIVERSITY OF CAPE TOWN | TEACHING & LEARNING REPORT 2019
The Language Development GroupThe Language Development Group (LDG) contributed to a network of
pathways, focusing on key transition points in students’ educational
journeys: from school to first year and throughout their undergraduate
studies, from undergraduate to honours, master’s and PhD studies, or
from any of these to the workplace, and in the opposite direction, from
the workplace back into university-level studies. In establishing this
network, the unit collaborated with disciplinary experts in the faculties,
educational technology experts in CILT, data experts in the Centre for
Educational Testing for Access and Placement (CETAP), UCT Libraries
and UCT Careers Service.
At first-year level, the digitally mediated course Writing in the Humanities
introduced students to the disciplinary discourses of the faculty, built
digital literacies and formed part of the faculty’s extended curricula. A
further course supported the multiliteracies development of students in
the performing arts. (These students often enter university with strong
competency and interest in performance and frequently get tripped up
by the requirements of their academic courses.) This year saw the launch
of a blended first-year course housed in African Studies called Writing
Across Borders. The course aims to facilitate students’ transition into the
higher levels of study in the Humanities curricula by allowing them to
“practise” disciplinary discourses at an advanced level and conduct their
own research, culminating in a research report.
Apart from credit-bearing courses, the LDG offered a wide range of
academic literacies workshops reaching 1 224 undergraduate and
postgraduate students across many different departments and in all of
UCT’s faculties. These workshops frequently involved close collaboration
and continued partnerships with disciplinary experts and resulted in
curriculum planning, materials development, collaborative teaching,

42
UNIVERSITY OF CAPE TOWN | TEACHING & LEARNING REPORT 2019
tutor support and writing circle facilitation. The LDG work extended
into the Writing Centre based on upper campus (and a satellite at the
Graduate School of Business) and the Health Sciences Writing Lab based
in the Groote Schuur Old Main Building. Additionally, the unit supported
the Law Writing Centre by providing consultant training. Together the
Writing Centre and Writing Lab offered individual consultations to 1 215
undergraduate and postgraduate students and conducted 127 workshops
attended by more than 10 000 students. Thirty-seven staff members
availed themselves of these workshops, while another 31 staff members
attended workshops arranged explicitly for staff.
Moving beyond UCT, the LDG’s massive open online course (MOOC)
Writing Your World, reached over 6 000 participants on the Coursera
platform. Learning analytics revealed that participants used the MOOC
The Writing Centre team packs up ahead of their move to their new home in the main library’s Vincent Kolbe Knowledge Commons.

UNIVERSITY OF CAPE TOWN | TEACHING & LEARNING REPORT 2019
in multiple and strategic ways: School or university students, for instance,
selected areas in which they wanted to develop; educators used parts of
the course as a set of resources in their own teaching; and professionals
used the course as a professional development opportunity.
The LDG continued to expand its suite of postgraduate writing courses
and resources, as existing offerings were refined and extended in
partnership with other areas of the university and other institutions.
Pathways design involved assembling a variety of writing courses and
resources in ways that enabled students to develop their own writing
routes as they negotiate postgraduate studies. These writing spaces
were configured as a growing network of diverse writing courses and
resources forming multiple writing pathways for postgraduate students,
as captured in the image below:
Orientation workshopsThe Language Development Group, UCT will be facilitating
a workshop for UCT students starting postgraduate studies.
writing your world
This is a gateway course aimed at anyone
exploring their options to study at university.
www.coursera.org/learn/writing-your-world/home/welcome
navigating
research writing
The main focus is to understand and
articulate your research in an exploratory
written product of your choice.
Contact: [email protected]
journeys in research writing A five-week, online course for all postgraduate students, and
is designed as a generic resource to support students’ research writing.
Contact: [email protected] or [email protected]
research writing in the sciencesResearch Writing in the Sciences will give you the guided opportunity
to practice writing in forms other than the thesis, specifically journal
articles, abstracts and popular science writing.
Contact: [email protected]
research writing companionAn online portal that accompanies you on your research journey.
Helping you to hone your researcher voice over time.
Register here: www.researchcompanion.co.za.
writing centresTalk to a writing consultant: The Writing Centre
on Upper Campus: www.writingcentre.uct.ac.za.
The Faculty of Health Sciences Writing Lab:
www.writingcentre.uct.ac.za/about/healthsciences
postgraduate research writing spacesJoin our open writing spaces to give you the time and
space to focus on your writing nee ds and requirements
and receive advice and feedback from a writing facilitator
and other researchers. For more information email
Sean Samson:
writing circles
Join Writing Circles: writing spaces where
students come together from across
disciplines to share ideas, talk through
problems and receive support from peers.
Email: [email protected]
postgraduate studies
Workshops, seminars and open online courses for UCT
postgraduate students. Go to:
www.students.uct.ac.za/students/prospective/postgraduate-studies

44
UNIVERSITY OF CAPE TOWN | TEACHING & LEARNING REPORT 2019
Monitoring and evaluation of this network of resources revealed that
these spaces and pathways enabled postgraduates to participate across
multiple writing development opportunities and to determine their own
developmental aims.
The LDG contributed to staff development by participating in the
Emerging Researcher Programme and by mentoring CHED staff in
their journey to developing strong researcher identities. The unit also
participated in a group supervision project to foster a more collaborative
approach to supervision and knowledge production.
The way forward for the cross-faculty units In future, greater collaboration between the two cross-faculty units is
envisaged. The units already share key aims, objectives, a conceptual
framework and several practices that would facilitate the expansion of
existing multiliteracies networks and the design of new pathways.
In conclusion, there are a few areas for the two units to develop together.
Both units annually train a sizeable cohort of postgraduate tutors and
writing centre consultants. The training and guided practice that tutors
and consultants undertake help mould future academics who cultivate
an educational ethos and disposition towards embedding academic
literacies in the disciplines and authentic social contexts. While the units
at the moment conduct all training separately, opportunities could be
created to bring these two cohorts together, at least for some of the
time, for joint early professional development and induction into the
theory and practice of integrated multiliteracies education. Every year
several of these postgraduates transition into the academic workplace.
Such joint training would be an early investment in strengthening the
multiliteracies capacity of future academics.

45
UNIVERSITY OF CAPE TOWN | TEACHING & LEARNING REPORT 2019
Conducting a few training sessions together would allow for the
expansion of the services of the writing centres to include trained
consultants to advise students on improving their digital literacies
skills, use of quantitative software, representation of visual data and
incorporation of quantitative data into academic writing.
Greater collaboration between the units and joint postgraduate
training opportunities would also make it possible to adjust existing
and co-design new online, blended and face-to-face courses, modules,
workshops and learning materials aimed at enriching the curriculum
and developing multiliteracies competency among students and
teaching staff.
46
UNIVERSITY OF CAPE TOWN | TEACHING & LEARNING REPORT 2019
The image of a network of writing pathways currently used by the LDG
to capture their multiple services to postgraduates could offer a useful
tool for the two units to co-design a collaborative and comprehensive
multiliteracies network extending throughout the undergraduate
curriculum and into postgraduate and staff development opportunities.
1.4 ACADEMIC EXCLUSIONS: REFLECTIONS ON CHANGING PRACTICE
Last year we focused on the limitations of the policies that regulate
deferred examinations and academic exclusions. The 2019 sittings of
the faculty-based readmission appeal committees (RAC) in relation
to student performance during 2018 were particularly difficult as they
took place under considerable student pressure. The sittings of these
committees and of the Senate Committee of RAC chairs in 2020 in
relation to the 2019 academic year had their own problems but worked
better than in previous years.
Over the past five years, academic exclusions and deferred examinations
have become contested processes. Members of the committees who
deal with these processes have been under enormous pressure from
students, student activists and management.
Starting in 2018, the faculty-based RACs, as well as the Committee of RAC
chairs, have been reflecting about the process of academic exclusions,
its limitations and the improvements that could be introduced in the
short- and medium-term. In parallel, during 2019 there was considerable
work done with the Students’ Representative Council (SRC) in discussing
academic matters. This included an engagement with the new (2020)
SRC on academic exclusions and deferred examinations as part of their

47
UNIVERSITY OF CAPE TOWN | TEACHING & LEARNING REPORT 2019
induction. This was one of the recommendations made by the chairperson
of the Senate Committee of RAC chairs last year.
During the actual period of RAC sittings, the UCT executive met
regularly with the SRC to deal with issues of academic and financial
exclusions with a view to troubleshooting. The chairperson of the RAC
chairs committee reported that engagement with the SRC this cycle
was robust but constructive. Having an open and ongoing channel of
communication with the SRC enabled this engagement. By and large,
there was high commitment from the SRC to this process, and members
understood their roles to be in the best interests of the students, but
not at all costs. Ongoing engagement with SRC members as to their
roles on RACs needs to be continued. Most faculties reported positive
engagement by student representatives. There is still much work to be
done in this area but considerable progress has been made in the past
two years.
UCT’s Students’ Representative Council 2019/20 with VC Prof Mamokgethi Phakeng.

48
UNIVERSITY OF CAPE TOWN | TEACHING & LEARNING REPORT 2019
Regular meetings of RAC chairs helped the process and assisted in
building a community of practice around RAC processes, challenges
and deadlines. Conversation among chairs – as far as possible, given
the differences across faculties – also assisted with RAC processes and
shared practices.
At the end of 2019, the Faculty of Science put forward a proposal for
faculty examinations committees not to exclude students in their first
year of study and students who fail for the first time. Instead of being
excluded, these students should be put in some form of probation
with sufficient guidance and support. The proposal was presented to
the Senate Executive Committee, which advised waiting until this year,
2020, to open this conversation. This notwithstanding all faculties having
discussed the proposal to which they gave varying degrees of support.
Interestingly, the statistical information about the process of academic
exclusions for the 2019 academic year shows that on average 23% fewer
students were excluded in 2020 than in 2019. This meant that all faculty
RACs had to deal with fewer appeals. At the same time, students allowed
to continue under different codes were on average 79% of the appeals,
with 20% remaining RENN (academically not eligible to continue) this
year. In all faculties, there has been an increase in the number of RENN
students and a decrease in the number of continuations.
Equally important is the fact that out of a total of 89 RAC reviews
requested, around 90% were upheld by the vice-chancellor’s appointee.
Decisions were overturned in three cases. Tables 2 and 3 present the
detailed outcomes of the RAC process.

49
UNIVERSITY OF CAPE TOWN | TEACHING & LEARNING REPORT 2019
Table 2: Total students with RENN status given option to appeal 2019 2020 % CHANGE
COM 287 195 -32,1%
EBE 318 222 -30,2%
FHS 61 42 -31,1%
HUM 247 234 -5,3%
LAW 115 91 -20,9%
SCI 144 111 -22,9%
TOTAL 1172 895 -23,6%
Table 3: Summary and comparison of readmission appeal committee decisions: 2019–2020
TOTAL APPEALS RAC* REMAIN RENN
2019 2020
% CHANGE 2019 2020
% CHANGE 2019 2020
% CHANGE
COM 225 101 -55% 205 94 -54% 20 7 -65%
100% 100% 91.1% 93.1% 8.9% 6.9%
EBE 222 133 -40% 209 96 -54% 13 37 185%
100% 100% 94.1% 72.2% 5.9% 27.8%
FHS 38 28 -26% 30 20 -33% 8 8 0%
100% 100% 78.9% 71.4% 21.1% 28.6%
HUM 137 94 -31% 125 72 -42% 12 22 83%
100% 100% 91.2% 76.6% 8.8% 23.4%
LAW 73 54 -26% 56 40 -29% 17 14 -18%
100% 100% 76.7% 74.1% 23.3% 25.9%
SCI 136 83 -39% 90 70 -22% 46 13 -72%
100% 100% 66.2% 84.3% 33.8% 15.7%
TOTAL 831 493 -41% 715 392 -45% 116 101 -13%
100% 100% 86.0% 79.5% 14.0% 20.5%

50
UNIVERSITY OF CAPE TOWN | TEACHING & LEARNING REPORT 2019
Notes on Table 3:1. 2019 figures are final totals as reported by the Senate Readmisson
Review Committee (SRRC).
2. 2020 figures show the status quo at 7 February 2020, as reported by
individual RACs. Any decisions made subsequent to this date are not
reflected.
3. Appeals submitted late and not condoned by the chair of the SRRC do
not appear here and are presented in tables 3A and 3B, which follow.
4. *RAC includes the following: RACC (concession to continue), RACB
(concession to continue after semester-one probation), RACF
(concession to change programme within faculty), RACL (concession
to return after leave of absence), RACO (concession to return after
prescribed break), RACP (status pending RACP decision) and RACT
(concession to transfer to another faculty).
5. Data for reviews of RAC decisions are shown in tables 5A and 5B
which follow.
Table 4A: Overview of motivations for acceptance of late appeals: January 2020
SRRC condoned 65
SRRC declined 49
Pending decision (with SRRC) 28
TOTAL 142
Table 4B: Faculty detail of late appeals Condoned Declined Pending Total
COM 12 8 24 44
EBE 15 13 2 30
FHS 4 3 1 8
HUM 12 8 0 20
LAW 14 4 0 18
SCI 8 13 1 22
TOTAL 65 49 28 142

51
UNIVERSITY OF CAPE TOWN | TEACHING & LEARNING REPORT 2019
Table 5A: RAC review requests: January 2020RAC decision upheld 84
RAC decision overturned 3
Pending decision (with reviewer) 1
incorrect form submitted 1
TOTAL 89
Table 5B: Detail of RAC review requests by faculty: January 2020COM 14
EBE 26
FHS 5
HUM 20
LAW 9
SCI 15
Total 89
Looking at the appeals, it is clear that there are still too many students who
do not take responsibility for themselves in checking their examination
results and, where necessary, applying to RACs in time. Submissions of
late appeals were generally well handled, but there are still too many
students who provide weak supporting evidence for why their late appeal
should be accepted. The handling of late appeals becomes particularly
challenging when students submit motivations to various institutional
stakeholders, ie they circumvent due process.
There has been considerable improvement in the processing and
outcomes by academic exclusions committees. While there is growing
consensus about the need to review UCT’s approach to assessment and
all the processes that derive from it, such as deferred examinations and
academic exclusions, this will take a considerable amount of research,
debate and consultation. In the meantime, there are several areas that
can be improved in the short- to medium-term:

52
UNIVERSITY OF CAPE TOWN | TEACHING & LEARNING REPORT 2019
In relation to the students themselves, greater information and education
need to go into making students more responsible for their actions
or lack thereof, for example in submitting late applications. In the
medium- and long-term, the launch and implementation of processes
tracking students’ lack of engagement with their studies will go some
way to identifying “at-risk” students earlier in the academic year and
supporting them in taking greater responsibility for their own progress.
Training of students’ representatives in RACs, as well as a code of
conduct for these representatives, developed jointly by students and
UCT’s management, will also contribute to improving further the work
done in the RACs.
In relation to the manner in which the process of appeals and reviews is
handled, it is important that UCT finds ways of countering the confusion
and disempowerment of faculties and committees that take place when
the same case is submitted to several offices simultaneously.
The proposal made by the Faculty of Science in 2019 will be resubmitted
for further consideration by all faculties and eventually by Senate in
2020.
CONCLUSIONStudent success is the result of the combination of support systems that
guide students, such as advising, monitoring systems that look at student
performance in order to provide timeous feedback, data analytics that
support the understanding of student performance and the design of
appropriate interventions, and the capacity to change the curriculum.
2019 has been a good year in making progress in all these areas. However,
there is still work to be done for these projects to be embedded in the
faculties as a normal part of the way UCT approaches teaching and learning.

CHAPTER 2
IMPERATIVES FOR CURRICULUM CHANGE

54
UNIVERSITY OF CAPE TOWN | TEACHING & LEARNING REPORT 2019
INTRODUCTION
In 2019 the T&L Comm of Senate took the conversation about reviewing
undergraduate curriculum change forward by bringing together the
2018 Curriculum Change Framework (CCF) recommendations and
the comments to the framework provided by staff and students who
participated in an open consultation on the document. This exercise
helped develop a set of principles and guidelines to support curriculum
review at the faculty level. Taking Curriculum Change Forward is the
document submitted to Senate for approval during 2019. This section of
the 2019 Teaching and Learning Report is largely based on this document.
TAKING CURRICULUM CHANGE FORWARD The CCF was released for comment in
September 2018 with a view to collating all
responses in a document to be discussed in
Senate during 2019. Comments were directly
requested from faculties, while academics,
students and interested parties submitted
individual comments to a dedicated website.
Nineteen responses were submitted to the
call for comments. The following faculties
submitted responses to the request from the Deputy Vice-Chancellor
for Teaching and Learning: CHED, EBE, Health Sciences, Law and
Science. Eleven academics, including emeritus professors, submitted
their views, as did three students. Faculty responses were developed
through internal discussion and faculty-based consultative processes.
Thus, the engagement with the CCF was greater than the number of
unique responses might suggest.

55
UNIVERSITY OF CAPE TOWN | TEACHING & LEARNING REPORT 2019
The CCF represented the first attempt to systematically engage with
the notion of decolonising the curriculum at UCT. In doing so, the CCF
was productive in prompting discussion within the institution, reflected
in the comments received, around notions of knowledge and power,
knowledge and identity, disciplinarity of knowledge, knowledge experts,
positionality of knowledge producers, student identities, curriculum
change and curriculum design and structure. Taking Curriculum Change
Forward attempts to take this broad framing for decolonising the
curriculum and translate this into a set of principles for taking curriculum
change forward and reimagining curricula at UCT that are socially just
and inclusive.
Taking Curriculum Change Forward was focused on undergraduate
programmes and understood the curriculum to include the selection and
organisation of knowledge content, the pedagogic relationship between
teacher and student, and teaching and learning activities. Below are
the principles approved by the Senate for an institutional review of the
curriculum, which is informed by a broad framing for decolonising the
curriculum that will move us closer to reimagining curricula at UCT that
are socially just and inclusive.
The curriculum is not only about knowledge in a single courseCurriculum is defined as the purposeful selection and organisation
of knowledge in terms of sequencing, pacing and assessment at any
given level in a specific field of study. In this sense, it is also about
broader teaching and learning matters, such as structure, coordination,
articulation, progression, duration, load, outcomes (what a graduate
would be able to do, be, know and learn in future), modes of delivery,
funding, space, regulatory environments and, most importantly, student

56
UNIVERSITY OF CAPE TOWN | TEACHING & LEARNING REPORT 2019
learning and engagement. All of the above implies that curriculum review
and change cannot only happen at the level of one module/course for
which a course convenor is responsible. Put differently, the curriculum
is a collective matter in which academics are involved not only as
disciplinary experts but also as part of a university-wide educational
effort to produce graduates who are not only globally competitive but
also distinctively African. Questions to reflect on include: To what extent
do undergraduate students engage with challenges of social justice,
inequality, poverty, social and economic exclusions? This highlights the
need to focus on the role of programme coordination within and across
faculties. What matters is that the curriculum that students are exposed
to throughout their degree not only inducts them into specialised
knowledge but engages them in both the epistemic and social relations
of knowledge in their fields.
The curriculum takes as its point of departure the graduate outcomes UCT agrees uponCurriculum review at the programme level has to reflect on the following
questions: Who are UCT graduates? What do they know and do that
make them both distinguishable from and comparable with graduates

57
UNIVERSITY OF CAPE TOWN | TEACHING & LEARNING REPORT 2019
from other universities in South Africa and abroad? What are the
knowledge, competencies, values and skills that UCT students acquire
through their UCT experience and how are these translated into the
specific professional and formative degrees offered at the university? To
what extent do we require graduates to have engaged with challenges
of social justice, inequality, poverty, social and economic exclusions and
historical marginalisation of people, through their programmes of study.
What underpins the experience of a graduate from one of the premier
universities in Africa? In this regard, it is essential to remind ourselves
that a curriculum review should bear in mind all UCT students – local and
international, Black and White – in all fields of study.
The curriculum has to engage with the research-intensive character of UCTThe review of the undergraduate curriculum needs to take into account
the current definition, history and aspirations of the university, and the

58
UNIVERSITY OF CAPE TOWN | TEACHING & LEARNING REPORT 2019
higher education system(s) within which the university is located and
operates. Whether in formative or professional degrees, curriculum
review has to make explicit what it means to learn and teach at an
undergraduate level at a research-intensive university. How are research
and research skills introduced at the undergraduate level at UCT?
The curriculum has to be conversant with the historical relationship between knowledge and power in different fields of studyThroughout history, knowledge has advanced through contestation and
critique and/or by additive evolution. Contestation and denunciation
about the link between power and knowledge (and the potential of
education to be reproductive or disruptive) have taken place in all
civilisations, from Asia to Europe, throughout the ages. Universities (in
UCT has been changed forever as a direct result of student protests, starting with the Rhodes Must Fall movement and then with the Fees Must Fall and End Outsourcing movements.

59
UNIVERSITY OF CAPE TOWN | TEACHING & LEARNING REPORT 2019
whichever form they existed historically inside and outside the West)
have been the predominant site of these controversies. Curricular
reform and curriculum contestation have a long history in Europe, North
America, Latin America and Africa, as has the debate about the purpose
and organisation of the university and its disciplines. Curricula at UCT
have been shaped by some of these debates, hence any review of the
current curriculum has to be critically self-reflective about the historical
relationship between knowledge and power in all fields of study.
This history of contestation between knowledge and power has two
main implications for a review of the curriculum at the institutional level.
First, a review of the curriculum has to acknowledge the critical tradition
of both the institution and discipline that has informed the curriculum.
Second, the questions asked – What knowledge? Whose knowledge?
What/who gets privileged? Whose interests dominate? – should inform
the exploration of the history and relationship between knowledge and
power in different fields of study and inform critical engagement with

60
UNIVERSITY OF CAPE TOWN | TEACHING & LEARNING REPORT 2019
the current curriculum. Such a review should be critically self-reflective
of which texts and voices are privileged and which are silenced or
marginalised in the curriculum.
The curriculum implies a pedagogy and a theory of learningIn as much as the curriculum is directly designed with a view to learning,
a review of the curriculum cannot happen without an equally deep
review of how learning takes place, who the learner is, what it means
to know, and what the outcomes of learning are expected to be. This
has three main implications for a review of the curriculum. First, it is
necessary to acknowledge that teaching cannot be a common-sense
activity performed by those who know a discipline. Teaching requires
the acquisition of specific knowledge as well as pedagogic skills to aid
learning. Second, the curriculum cannot be reviewed without reviewing
the relationship between teacher and student, ie reviewing how
interactions take place in teaching and learning spaces. Third, curriculum
review has to include an appraisal of activities and tasks designed for
students to learn and a consideration of different modalities of assessing
their learning.
The curriculum has to introduce students to the language and grammar of different fields of studyThe university is a curator, producer and disseminator of specialised
knowledge. This knowledge is organised in disciplines and fields of study
which follow different logics or grammars in both their development
and transmission. Students come to the university with a variety of
experiences and acquired knowledge that needs to be harnessed
towards their induction into specialised knowledge. It is through the

61
UNIVERSITY OF CAPE TOWN | TEACHING & LEARNING REPORT 2019
The statue of Cecil John Rhodes was removed from its plinth on upper campus on 9 April 2015 following months of student protests.
acquisition of specialised knowledge that it becomes possible to explore
the opening up of boundaries between disciplines and different fields of
study. A transparent, democratic, pedagogic relationship recognises the
role of the academic in inducting the student into specialised knowledge,
values academic expertise, acknowledges students’ lived experiences
and is open to interdisciplinary enquiry.
The curriculum has to acknowledge personal and institutional privilegeThe 2015–2017 student protests amplified Black students’ unfulfilled
need to be recognised, valued and welcomed for who they are at UCT as
opposed to being assimilated into an existing, often alienating, culture. In
responding to this need, academics, especially White academics, had to

62
UNIVERSITY OF CAPE TOWN | TEACHING & LEARNING REPORT 2019
and did engage critically with their personal and institutional privilege.
This is an ongoing process that needs to be reflected in all teaching and
learning spaces.
CONCLUSIONTaking Curriculum Change Forward made clear that the unit of analysis for
a comprehensive curricular review has to be the academic programme.
Further discussions made clear that academics would like to see more
explicit guidelines that help them give effect to the principles set out in
this document in undertaking curricular reviews. As this work proceeded,
UCT, together with the rest of the country, went into lockdown due to the
COVID-19 pandemic. The changes in teaching and learning introduced
by the pandemic, as well as further discussion in the T&L Comm, have
been helpful in identifying blind spots in thinking about curricular review
and reimagining curricula at UCT that are socially just and inclusive.
As has been mentioned in discussions at committee, faculty and Senate
level, for a process of curricular review to be effective, it will also be
necessary to balance curriculum reviews in the faculties with centralised
initiatives, such as reviews of credit loads, accreditation changes, quality
assurance, timetabling, classroom allocations, enrolment planning and
general policy reviews. All of these efforts should be seen as necessary
processes on a path towards renewal and decolonisation of the curriculum
and institutional culture at UCT.
CHAPTER 3
QUALITY OF TEACHING AND
LEARNING

64
UNIVERSITY OF CAPE TOWN | TEACHING & LEARNING REPORT 2019
INTRODUCTION
This chapter focuses on two aspects of the quality of teaching
at UCT: technical support in lecture recording and teaching
excellence through the showcasing of the Distinguished Teacher
Awards adjudicated in 2019.
3.1 LECTURE RECORDING AND CLASS ATTENDANCE
Lecture recording supports student learning through the automatic
recording and publishing of lectures to Vula course sites for participating
courses. To enable this, medium and large centrally bookable venues
have been equipped with recording equipment, and the Opencast system
is used to schedule, process and distribute the recorded lectures. The
lecture recording service is led by CILT, with significant implementation
and operational support provided by Information and Communication
Technology Services (ICTS).
Pho
to IC
TS
.
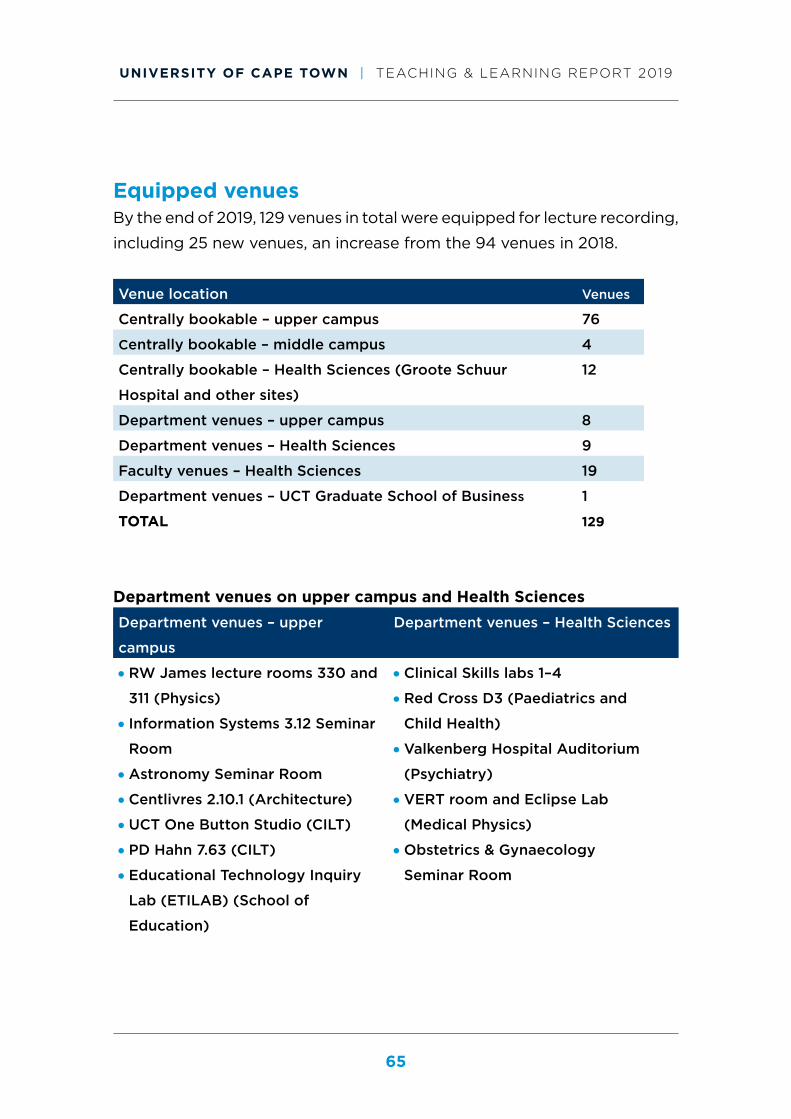
65
UNIVERSITY OF CAPE TOWN | TEACHING & LEARNING REPORT 2019
Equipped venuesBy the end of 2019, 129 venues in total were equipped for lecture recording,
including 25 new venues, an increase from the 94 venues in 2018.
Venue location Venues
Centrally bookable – upper campus 76
Centrally bookable – middle campus 4
Centrally bookable – Health Sciences (Groote Schuur
Hospital and other sites)
12
Department venues – upper campus 8
Department venues – Health Sciences 9
Faculty venues – Health Sciences 19
Department venues – UCT Graduate School of Business 1
TOTAL 129
Department venues on upper campus and Health SciencesDepartment venues – upper
campus
Department venues – Health Sciences
RW James lecture rooms 330 and
311 (Physics)
Information Systems 3.12 Seminar
Room
Astronomy Seminar Room
Centlivres 2.10.1 (Architecture)
UCT One Button Studio (CILT)
PD Hahn 7.63 (CILT)
Educational Technology Inquiry
Lab (ETILAB) (School of
Education)
Clinical Skills labs 1–4
Red Cross D3 (Paediatrics and
Child Health)
Valkenberg Hospital Auditorium
(Psychiatry)
VERT room and Eclipse Lab
(Medical Physics)
Obstetrics & Gynaecology
Seminar Room

66
UNIVERSITY OF CAPE TOWN | TEACHING & LEARNING REPORT 2019
New department- and faculty-owned venues continued to be equipped
on request, funded by the venue owners. Several departments or faculties
requested assessments of venues in 2019, and these are in varying stages
of progress:
Venue Department/Faculty Status
Information Systems
Seminar Room
Information Systems Installed, complete
Eclipse Lab Medical Physics Installed, complete
Faculty of Health Sciences
EDU Computer Lab
Faculty of Health
Sciences EDU
Installed, complete
Duncan Elliot Seminar Room Physics Installed, complete
RW James Lecture Room 330 Physics Installed, complete
Groote Schuur Hospital New J
Block Lecture Theatre
Faculty of Health
Sciences
In progress
GSB Lecture Theatre
upgrades
GSB LT3 (pilot) complete
Moot Court Faculty of Law In progress
Smit Pentow Marine Room Faculty of Law In progress
School of Education Building
auditoriums (x3)
School of Education In progress
Criminology Seminar Room Faculty of Law In progress
School of Economics Seminar
Room
School of Economics Department chose
not to pursue
Application development and storageIn December 2019 Opencast was updated to version 8. There were also
21 minor updates and workflow improvements throughout the year.
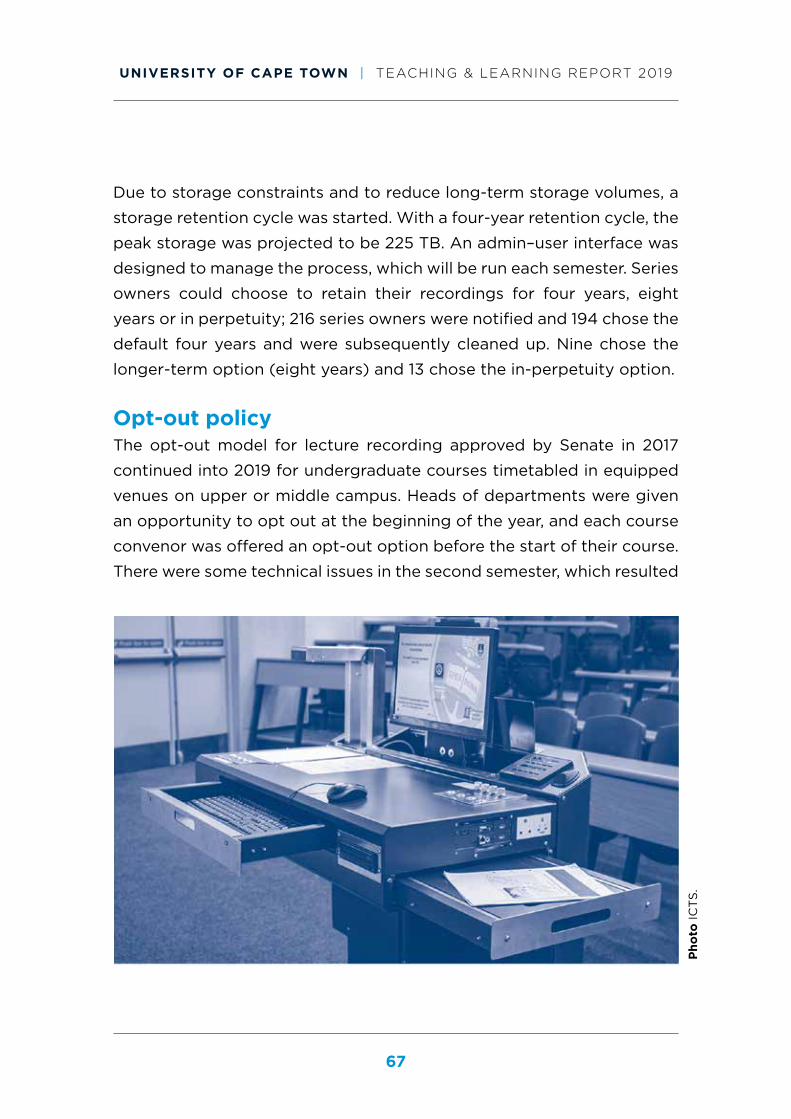
67
UNIVERSITY OF CAPE TOWN | TEACHING & LEARNING REPORT 2019
Due to storage constraints and to reduce long-term storage volumes, a
storage retention cycle was started. With a four-year retention cycle, the
peak storage was projected to be 225 TB. An admin–user interface was
designed to manage the process, which will be run each semester. Series
owners could choose to retain their recordings for four years, eight
years or in perpetuity; 216 series owners were notified and 194 chose the
default four years and were subsequently cleaned up. Nine chose the
longer-term option (eight years) and 13 chose the in-perpetuity option.
Opt-out policyThe opt-out model for lecture recording approved by Senate in 2017
continued into 2019 for undergraduate courses timetabled in equipped
venues on upper or middle campus. Heads of departments were given
an opportunity to opt out at the beginning of the year, and each course
convenor was offered an opt-out option before the start of their course.
There were some technical issues in the second semester, which resulted
Pho
to IC
TS
.

68
UNIVERSITY OF CAPE TOWN | TEACHING & LEARNING REPORT 2019
in some courses being scheduled late. The effective opt-out rate in mid-
2019 was 40% (122 out of 310 courses chose not to be recorded). This
was similar to the 2018 opt-out rate, which was 122 out of 299 courses.
Since 2018 scheduled recordings per week increased, with an overall 5%
increase from Semester 1 to Semester 2 in 2019. There was an average of
876 recordings per week in Semester 1 (maximum of 720 recordings in
2018) and 919 recordings per week for Semester 2 (845 recordings in 2018).
Captions pilotIn 2019 there was further development of the captions project for
lecture recording. Nibity, an application programming interface, was
designed for importing human transcriptions from WayWithWords.
This allowed for captions provided from a third-party vendor to be
Assoc Prof Kate le Roux, from CHED’s ADP Language Development Group, speaking at the “Theories and research approaches on language and communication in multilingual mathematics classrooms” symposium in July 2019.
Prof Jeff Murugan, who teaches the third-year MAM3040W mathematics course, participated in the captions project pilot.

69
UNIVERSITY OF CAPE TOWN | TEACHING & LEARNING REPORT 2019
overlaid on the Opencast player. Captions are also made available as
interactive transcripts as one of the options on the player, and caption
files were provided as a download for offline viewing. In the second
half of the year, the pilot involved a third-year mathematics course
(MAM3040W taught by Professor Jeff Murugan) with captions for 21
lecture recordings. The research was done in collaboration with CHED
ADP Language Development lecturer Associate Professor Kate le Roux.
The research focused on how students used a range of resources in the
course, including captions, and the teaching and learning value that
video captions provided.
Recording volumes and success rates2019 recording volumes remained similar to 2018 semester volumes. The
number of published recordings increased from 16 356 in 2018 to 17 420
in 2019 (6.5% year-on-year growth), with a recording reliability rate of
97.6% in the first semester and 99.6% in the second semester.
Figure 1: Lecture recording volumes by semester: 2014–2019
Num
ber
of
reco
rdin
gs
10 000
9000
8000
7000
6000
5000
4000
3000
2000
1000
02014Sem 1
2014Sem 2
2015Sem 1
2015Sem 2
2016Sem 1
2016Sem 2
2017Sem 1
2017Sem 2
2018Sem 1
2018Sem 2
2019Sem 1
2019Sem 2
Published
Failed

70
UNIVERSITY OF CAPE TOWN | TEACHING & LEARNING REPORT 2019
Table 1: Lecture recording statistics by semester: 2015–2019
Many recordings (175 issues, over 60%) were affected by load-shedding
in the first semester of 2019. Of the 289 recording failures across the
year, approximately 88% were from capture agent issues (including
load-shedding), 6% from power or network issues, 3% from venue audio
equipment issues (for example no microphone used, or microphone
batteries flat), 2% from server issues, and 1% were camera issues.
2015 2016 2017 2018 2019
Sem 1 Sem 2 Sem 1 Sem 2 Sem 1 Sem 2 Sem 1 Sem 2 Sem 1 Sem 2
Venues
used
41 46 52 64 75 79 82 95 102 105
Lecture
series
91 97 159 165 226 249 266 319 337 409
Total
scheduled
2 936 3 172 4 854 3 565 6 954 7 930 8 633 10 997 10 511 11 032
Failed 56 47 62 67 181 55 40 61 248 41
Published 2 456 2 737 4 101 3 096 5 726 6 370 7 533 8 823 8 620 8 800
Success
rate
98.1% 98.5% 98.7% 98.1% 97.4% 99.3% 99.5% 99.4% 97.6% 99.6%

71
UNIVERSITY OF CAPE TOWN | TEACHING & LEARNING REPORT 2019
Publication timeAll recordings are reviewed before publication for consent and trimmed
so that space at the start and end of recordings is removed. Most students
want recordings to be available as soon as possible after the lecture, so
publication time is a key metric. For the second semester of 2019, 88% of
recordings were published within 24 hours (2018: 95%), and 64% within
eight hours (2018: 70%).
Student usageStudent usage continues to increase gradually. The total number of users
accessing lecture recordings over the year increased by 1.8% from 16 345
in 2018 to 16 632 in 2019.
Figure 2: Recording publication time by week, July–October 2019
Per
cent
age
of
reco
rdin
gs
pub
lishe
d 100%
90%
80%
70%
60%
50%
40%
30%
20%
10%
0%
1 2 3 4 5 6 7 8 9 10 11 12 13 14
Week in Semester 2
Published within 8 hours (%) Target publication Published within 24 hours (%)

72
UNIVERSITY OF CAPE TOWN | TEACHING & LEARNING REPORT 2019
The number of active users in a week increased to a peak of 7 352 (2018:
7 049), with a daily peak of 2 973 users (2018: 2 961). The peak number
of different recordings accessed in a day during 2019 was 2 833 (2018:
2 900).
Staffing and sustainabilityLecture recording is supported by the following teams:
CILT Learning Technologies: service owner (including budgeting and
planning), new series creation and scheduling, end-user support,
system design, software and hardware research and development
ICTS Enterprise Infrastructure Services: back-end support for lecture
recording production systems, capture agent software installation and
updates, classroom information database design, and live-streaming
infrastructure

73
UNIVERSITY OF CAPE TOWN | TEACHING & LEARNING REPORT 2019
ICTS Classroom Support Services Helpdesk: processing recordings
(verifying consent and trimming), incident management for equipment
availability in venues
ICTS Classroom Support Services Onsite: new venue installations,
equipment maintenance in venues.
Although staffing levels are sufficient for the current recording volumes,
there is work under way to automate some manual processes further.
Project communicationTeam members presented UCT’s experiences and open source deve-
lopment work at the Opencast Conference in Zürich, Switzerland (January
2019), and an introduction to Opencast workshop was presented for the
Apereo Africa conference (April 2019). The CILT Digital Media Unit also
provided a short introduction to the One Button Studio, and on-campus
tours for the Apereo Africa conference guests.
The UCT ICTS Helpdesk Pho
to IC
TS
.

74
UNIVERSITY OF CAPE TOWN | TEACHING & LEARNING REPORT 2019
Information regarding the use of lecture recording was provided for
the annual teaching and learning reports in 2018 and 2019. UCT’s 2019
Teaching and Learning Conference presented a few sessions on lecture
recording usage, including: “How and why do students use lecture
recordings?” by Vera Frith and Pam Lloyd. A highlight on the CILT events
programme was the presentation from the University of Manchester
titled: “Opting out to enhance student experience”. There was also a
well-attended CILT event titled “Lecture recording: The good, the bad
and the unexpected” by Claire Blackman.
CILT’s One Button Studio is an automated digital media facility for creating educational videos.

75
UNIVERSITY OF CAPE TOWN | TEACHING & LEARNING REPORT 2019
Innovations and additional uses of OpencastOpencast is a flexible video management system which can be used for
applications beyond classroom-based lecture recording. The Learning
Technologies team continued with the following services:
supporting the One Button Studio (run by the CILT Digital Media Unit),
which enables self-service recording and editing of short instructional
videos
supporting four classrooms in the Clinical Skills Lab in Health Sciences
to enable recording of student assessments as well as instructional
videos in a simulated clinical setting.
Associate Professor James “Jimmy” Winfield, from the College of Accounting, presenting at the 2019 Teaching and Learning Conference.

76
UNIVERSITY OF CAPE TOWN | TEACHING & LEARNING REPORT 2019
The department continues to implement, develop and improve the
following open-source projects:
LectureSight is an open-source, real-time camera tracking system,
further developed over the past four years by UCT and the University
of Manchester.
Track4K is a presenter-tracking system for post-processing 4K videos,
developed as a computer science honours project, released as an open-
source project and used in production by UCT and the University of
Cologne.
An audio analysis system using machine learning classification was
developed as a UCT computer science master’s project and implemented
at UCT to automatically trim selected lecture videos, removing dead
time at the start and end.

77
UNIVERSITY OF CAPE TOWN | TEACHING & LEARNING REPORT 2019
Goals for 2020For 2020 some of the work already being done will go on, like continuing
with the development of automated captions, while these new projects
will be initiated:
upgrading to the next version of Opencast between the middle and
end of 2020
expansion of automated video trimming to reduce manual workload
automation of the lecture recording statistics report
redesign of the lecture recording Learning Tools Interoperability
interface in Vula
implementation of the retention cycle each semester
development of self-service workflows to optimise and reduce staff
workload.
CILT’s Associate Professor Janice McMillan facilitating a session at the 2019 Teaching and Learning Conference.

78
UNIVERSITY OF CAPE TOWN | TEACHING & LEARNING REPORT 2019
3.2 RECOGNISING EXCELLENCE IN TEACHING AND LEARNING: 2019 DISTINGUISHED TEACHER AWARDS
The Distinguished Teacher Award (DTA) is an institutional accolade
that recognises outstanding teaching at UCT and acknowledges the
recipient’s contribution to the promotion of teaching and learning
excellence at the institution.
Every year, the DTA Committee undertakes the task of choosing
awardees from a large pool of eligible teachers whose portfolios,
submitted in support of their nominations, attest to the distinctiveness
of their teaching. The committee engages in a semester-long process
of considering each teaching portfolio and examining the evidence for
excellence in teaching over several years.
They focus on the nominees’:
teaching philosophy and pedagogical approach in the context of the
teaching and learning challenges in South African higher education
contribution to curriculum renewal and transformation in teaching and
learning
innovation in teaching and learning
impact on students beyond formal teaching time
impact on the teaching and learning approaches of their colleagues
understanding and practice of inclusivity in their teaching
reflective teaching practices.
In addition, nominees may also provide evidence of:
their scholarship of teaching and learning – including any relevant
publications, conference attendance and research projects
how they design their learning materials to be accessible to differently
abled students.

79
UNIVERSITY OF CAPE TOWN | TEACHING & LEARNING REPORT 2019
2019 DTA recipients Professor Andrew Argent, Paediatrics and Child Health
The committee noted that Professor Argent,
medical director of the Paediatric Intensive Care
Unit at the Red Cross War Memorial Children’s
Hospital, has demonstrated a long-lasting impact
on students and colleagues over a lengthy
career. He has been instrumental in establishing
paediatric critical care as a recognised subspecialty in South Africa.
Professor Argent is regarded as a world expert in paediatric critical
care. His presence is felt through practice, research, teaching and
training. He is renowned as a clinician for reaching both undergraduate
and postgraduate students and a range of health professions, has an
impressive publication record, is a sought-after supervisor and has
invested in training his students to become trainers themselves. His
curriculum innovations include introducing advanced courses in critical
care and life support to South Africa and developing the Simulation
Laboratory based at the Red Cross War Memorial Children’s Hospital.
He is described as making every interaction a learning experience and
challenging the boundaries and hierarchies of the health professions by
adopting a multidisciplinary approach to training in including nurses
and the allied health professionals with his teaching of registrars. He
never misses an opportunity to broaden the minds of colleagues, both
junior and senior, and past students describe his audience as hungry
participants. He considers ward rounds as an opportunity for teaching,
and his passion for sharing knowledge knows no bounds. At the same
time, he shows his students that he is also learning from them.

80
UNIVERSITY OF CAPE TOWN | TEACHING & LEARNING REPORT 2019
The committee was impressed by his care, humility, respect and
generosity, as well as his ability to transform the way his students perceive
the paediatric patient beyond the health conditions they present.
Read the article and watch the video on UCT News.
Dr Tessa Dowling, African Languages and LiteratureDr Tessa Dowling is consistently described as
an exceptional teacher who takes a student-
centred approach and demonstrates an
awareness of the why and how of her teaching.
She articulates clear teaching goals regarding
first- and second-language speakers of isiXhosa
– of which one is to learn a language and
communicate. The other is for students to read, write, publish and edit
in the language. Dr Dowling positions herself as a language researcher
who eagerly welcomes student contributions and participation and
empowers students to deepen their mastery of the language.
Students describe her as a person who creates a learning space that is
compassionate and collaborative. A consistent thread in the testimony to
her teaching is her humility and humanity. She demonstrates openness
and a desire for students to succeed, which has translated into a range
of teaching methodologies and activities inside and outside of the
classroom, including field trips where students are immersed in the
Xhosa community.
Underpinning her teaching philosophy is her desire to cultivate in students
a recognition of the humanity of the language. She has incorporated a

81
UNIVERSITY OF CAPE TOWN | TEACHING & LEARNING REPORT 2019
range of linguistic styles into her course materials, including social media
posts, pop songs and memes. Her senior students engage with recordings
of isiXhosa radio interviews, news reports and phone-in programmes – all
of which have contributed to student success in, and their use of, isiXhosa
as well as feelings of awe, curiosity and respect for the language.
Dr Dowling’s teaching demonstrates an impact on colleagues and both
undergraduate and postgraduate students. The committee commended
her for transforming the way that students experience the language and
the collaborative manner in which she engages students in academic
activity, including co-authoring with students, empowering them to
develop into successful postgraduates and scholars in the language,
and having an impact on students beyond teaching, especially where
students continue to practice isiXhosa once they have left her classroom.
Read the article and watch the video on UCT News.
Associate Professor Amrita Pande, SociologyAssociate Professor Amrita Pande is a sought-
after supervisor in sociology. She demonstrates
excellence in undergraduate, postgraduate
and large-class teaching, often exceeding
teaching load requirements. Her unyielding
pursuit of providing access and resources to all
students speaks to her practices of inclusivity
and the importance and value with which she
treats all students. She manages to balance this pastoral role while still
rigorously engaging students in their studies and supporting them in
their autonomy while conscientising them to the political and social
context of their work.

82
UNIVERSITY OF CAPE TOWN | TEACHING & LEARNING REPORT 2019
Her going above and beyond to support
students to meet their academic goals,
and even mentoring them beyond
graduation, is a common thread of
her portfolio, as is her humanity and
openness, with students highlighting
her genuine concern for their welfare
and developmental trajectories.
Associate Professor Pande is described as a highly skilled teacher who
combines theory and practice in ways that bridge the gap between
academia, activism and lived reality. While she strives for excellence in
teaching, she is also an active researcher in the broad area of gender, race
and reproduction. She provides leadership on administrative matters in
the faculty. Her impact has been felt as the co-head of the Department
of Sociology – she has initiated a departmental review of curriculum
and pedagogy and is leading an undergraduate advisory committee and
tutor support committee.
She has redesigned curricula in the department to be more relevant to the
South African and global-south context and is renowned for imparting
complex material in accessible ways. The committee was impressed by
the range of pedagogical strategies that she uses to make content come
alive, including theatre of the oppressed and participatory workshops in
large classes to foster critical thinking and analytical skills. The testimony
to how she is received by students is clear – students attest that her
lecturing has been some of the best experienced at UCT.
Read the article and watch the video on UCT News.
“Associate Professor Pande is described as a highly skilled teacher who combines theory and practice in ways that bridge the gap between academia, activism and lived reality.”

83
UNIVERSITY OF CAPE TOWN | TEACHING & LEARNING REPORT 2019
Associate Professor Romy Parker, Anaesthesia and Perioperative MedicineA common thread in the testimony of Associate
Professor Romy Parker’s teaching is that
of empowerment, which is what underpins
her teaching philosophy. She believes that
as an educator she facilitates the process of
students becoming their future selves, and
that education should be transformative for
the learner, the teacher and society, while in the health sciences it should
be transformative for the patient receiving care.
Associate Professor Parker is renowned for having bridged the gap
between the allied health professions and medicine through her
approaches to teaching students about pain management, aligning her
teaching to the burden of disease to prepare students effectively for
the local context. Her curriculum work has strengthened the reputation
of the Bachelor of Science in Physiotherapy at UCT and impacted on
the Bachelor of Medicine and Bachelor of Surgery. She has driven the
development of the Postgraduate Diploma in Interdisciplinary Pain
Management, which makes use of information and communication
technology to train a range of health professionals. She has worked to
challenge traditional roles and hierarchies in the pursuit of improving
healthcare services, transcending biomedical approaches to pain and
transforming the way a crucial part of medicine is perceived.
Testimony to her teaching commends her for acknowledging the
different learning styles of students. She is a person-centred clinician
who cultivates an inclusive teaching environment by providing her
students with a variety of teaching and learning styles and a variety of
learning materials to make her lessons more interesting, entertaining and

84
UNIVERSITY OF CAPE TOWN | TEACHING & LEARNING REPORT 2019
thought-provoking. She structures lessons as interactive discussions,
encouraging critical thinking and reflection, which is well received
by students. While she has moved to anaesthesia and perioperative
medicine, she is still actively sought out by physiotherapy students for
mentoring and guidance.
Her colleagues attest to her unique achievements. She establishes
harmonious relationships with patients, students, teachers and other
health professionals. She is also responsible for UCT’s first experimental
pain laboratory, has established a broad base of local and international
collaborations, and has enhanced patient care and the development of
research skills of a wide range of healthcare practitioners.
Read the article and watch the video on UCT News.
CONCLUSIONUCT has been making important progress in developing technical
infrastructure and expertise to support teaching and learning. The work of
lecture recording, transcription and captioning plays an important role in
providing access for students with different learning needs. Contrary to the
notion that class attendance decreases when there are recordings of the
lectures, lecture recording supports rather than replaces class attendance.
Nobody could predict in 2019 that the expertise gathered over the years
in this area was going to serve UCT especially well in the context of the
introduction of emergency remote learning during 2020. This will be one
of the focus areas in next year’s teaching and learning report.
The allocation of the Distinguished Teacher Awards was done under
lockdown. In a context of uncertainty, the analysis of the portfolios
submitted to the committee was reassuring in more ways than one. In
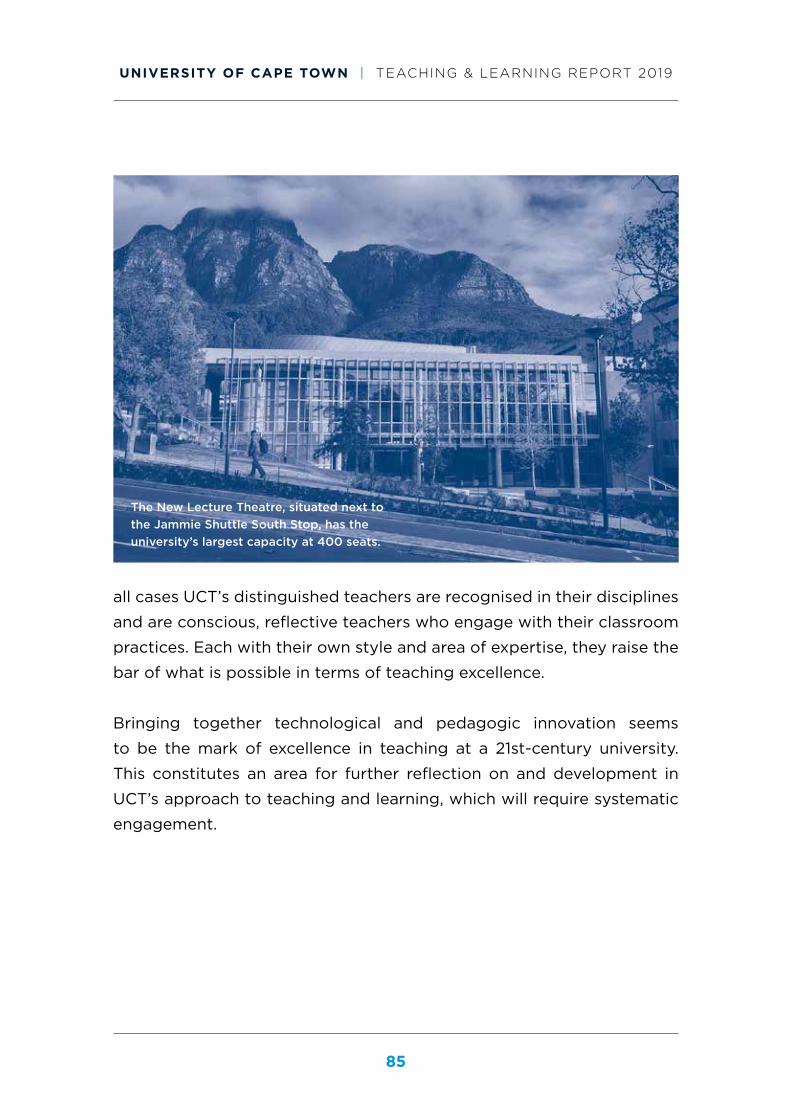
85
UNIVERSITY OF CAPE TOWN | TEACHING & LEARNING REPORT 2019
all cases UCT’s distinguished teachers are recognised in their disciplines
and are conscious, reflective teachers who engage with their classroom
practices. Each with their own style and area of expertise, they raise the
bar of what is possible in terms of teaching excellence.
Bringing together technological and pedagogic innovation seems
to be the mark of excellence in teaching at a 21st-century university.
This constitutes an area for further reflection on and development in
UCT’s approach to teaching and learning, which will require systematic
engagement.
The New Lecture Theatre, situated next to the Jammie Shuttle South Stop, has the university’s largest capacity at 400 seats.

CHAPTER 4
ASSESSING STUDENT PERFORMANCE BY KEY INDICATORS

87
UNIVERSITY OF CAPE TOWN | TEACHING & LEARNING REPORT 2019
INTRODUCTION
This chapter examines student and staff headcounts and profiles as
well as student academic performance from 2015 to 2019. In the
report, each section begins with a note identifying the relevant
table contained in the appendix. Unless otherwise stated, comparisons
are year-on-year, referring to 2019 in comparison with 2018. Exceptions
are the sections dealing with undergraduate course performance
(specifically performance on level 1000 courses) and first-time entering
cohort analyses. Both sections have comparisons with the 2009 year,
the first intake following the first writing of the NSC, a year in which
admissions decisions were premised on inflated mathematics scores,
which led to high levels of failure at the course level and low cohort
completion, especially in the faculties of Science and EBE. The report
tracks the recovery of undergraduate student course performance from
2010 onwards and also the improved cohort completion in the 2011–2014
first-time entering undergraduate (FU) cohorts.

88
UNIVERSITY OF CAPE TOWN | TEACHING & LEARNING REPORT 2019
This chapter has three sections. The first section focuses on enrolments
and enrolment profiles of students within the 2019 year and how this
compares with the growth experienced since 2015. The second section
analyses academic staff composition and changing staff:student ratios.
The third section speaks to teaching and learning in terms of graduate
success, and undergraduate and postgraduate student performance.
4.1 STUDENT ENROLMENTS AND ENROLMENT PROFILES
(Tables 1 to 7 and 12 in the appendix)
In 2019 a total of 28 641 students (17 320 undergraduates and 11 321
postgraduates) enrolled at UCT. This represented an almost negligible
0.4% decrease on the 2018 figure. At the undergraduate level, the
enrolment dropped from 17 494 in 2018 to 17 320 in 2019, with decreased
enrolments in three faculties (Commerce, EBE and Health Sciences).
As indicated in Figure 1, at the undergraduate level the average annual
growth rate between 2015 and 2019 was -0.6%. This decrease in
undergraduate enrolments was partly due to the drop in the numbers of
international students in the Semester Study Abroad (SSA) programme
(possibly as a consequence of the student protests between 2015 and
2017, the water crisis of 2018 and generally bad publicity about the state
of the country) but is also the result of the discontinuation of several
programmes on the university’s Programme and Qualification Mix and
an under-enrolment at the new undergraduate level in EBE in particular.
In 2016 the Commerce faculty introduced two advanced diplomas and
one online postgraduate diploma programme, which created a positive
spike in enrolment. It was decided to discontinue these programmes
in 2017 as it was felt that they were unsustainable. Also, the Advanced
Certificate in Education programmes offered by the Humanities faculty

89
UNIVERSITY OF CAPE TOWN | TEACHING & LEARNING REPORT 2019
are in the final stages of being phased out, giving rise to a steady drop
in enrolments at the undergraduate diploma/certificate level.
Between 2018 and 2019, postgraduate enrolments (including postgraduate
diploma and honours levels) increased in three of the six faculties and the
Graduate School of Business, with decreases in enrolments in Commerce,
EBE and Health Sciences. Overall, between 2015 and 2019, the postgraduate
enrolment grew at a rate of 2.9% per annum, peaking at 11 321 in 2019.
The postgraduate fraction of the total enrolment increased from 36.3%
in 2015 to 39.5% in 2019. This is bringing UCT closer to its target of 40%
postgraduate enrolments.

90
UNIVERSITY OF CAPE TOWN | TEACHING & LEARNING REPORT 2019
Figure 1: Changes in headcount enrolments: 2015–2019
35 000
30 000
25 000
20 000
15 000
10 000
5 000
0
2015 2016 2017 2018 2019
UG PG Total
As shown in figures 2, 3 and 4 below, enrolment growth was uneven
across the faculties, with Commerce, Law and the GSB experiencing
net decreases between 2015 and 2019, mainly as a result of programme
discontinuation in the case of Commerce. There were, however, marked
increases in the enrolments in the faculties of Health Sciences, EBE and
Science. The Faculty of Commerce shed 1 197 enrolments between 2016
and 2019 (1 135 of these at the undergraduate level), due to the phasing
out of the two advanced diploma programmes and online offerings, as
well as under-enrolment at the FU level in 2017 and 2018, and to a lesser
extent in 2019. Humanities remained the largest faculty in 2019 with 7 327
students (26% of the institutional total) enrolled in their programmes,
5 197 at the undergraduate level and 2 130 at the postgraduate level.

91
UNIVERSITY OF CAPE TOWN | TEACHING & LEARNING REPORT 2019
Table 2 in the appendix reflects
an undergraduate enrolment of 0
for the GSB across the 2015–2019
period, and this is in comparison
with a figure of 148 for 2014. This
change reflects the GSB’s decision
to phase out the Associate in
Management programmes.
Law was the only other faculty to
show a small decrease in its overall
enrolment between 2015 and 2019
(83 fewer students in 2019, most of whom were postgraduate diploma
enrolments).
“The Faculty of Commerce shed 1 191 enrolments between 2016 and 2019 (1 137 of these at the undergraduate level), due to the phasing out of the two advanced diploma programmes and online offerings, as well as under-enrolment at the FU level in 2017 and 2018, and to a lesser extent in 2019.”

92
UNIVERSITY OF CAPE TOWN | TEACHING & LEARNING REPORT 2019
6 000
5 000
4 000
3 000
2 000
1 000
0
Commerce GSB EBE Health Sciences
Humanities Law Science
2015 2016 2017 2018 2019
Figure 2: Undergraduate enrolments by faculty: 2015–2019
3 000
2 500
2 000
1 500
1 000
500
0
Commerce GSB EBE Health Sciences
Humanities Law Science
2015 2016 2017 2018 2019
Figure 3: Postgraduate enrolments by faculty: 2015–2019

93
UNIVERSITY OF CAPE TOWN | TEACHING & LEARNING REPORT 2019
The proportional headcount enrolment in UCT’s science, engineering and
technology (SET) faculties (EBE, Health Sciences and Science) reached
a level of 44.1% of the total enrolment in 2019. At the same time, the
proportional enrolment within the business/management area dropped
to 25.9% in 2019 (from a peak of 29.2% in 2016) while the proportional
enrolment in the broad humanities faculties (including Law) increased
slightly to 30% of the total enrolment in 2019.
Looking at the demographic profile of UCT’s students, it is essential
to note the new and growing sociocultural phenomenon taking place
at UCT, reflecting some students’ refusal to declare their race on their
registration forms. The non-declaration of race, as shown in Figure 5, has
had an increasingly adverse impact on UCT’s ability to assess its progress
towards its demographic enrolment targets in recent years. Self-declared
9 000
8 000
7 000
6 000
5 000
4 000
3 000
2 000
1 000
0
Commerce GSB EBE Health Sciences
Humanities Law Science
2015 2016 2017 2018 2019
Figure 4: Total enrolments by faculty: 2015–2019

94
UNIVERSITY OF CAPE TOWN | TEACHING & LEARNING REPORT 2019
South African (SA) African, Coloured and Indian students together
made up 43.8% (44.4% in 2014) of the total 2018 enrolment. During the
2014 to 2019 period, the proportional enrolment of self-declared White
SA students dropped from 29% to 20% of the total enrolment. In 2019,
5 665 SA students (20% of the total enrolment) chose not to self-declare
their race: Specifically, 23.1% of all SA undergraduates and 19.8% of all
SA postgraduates registered in 2019 chose not to declare their race.
While this practice has a substantial impact on the university’s ability to
report accurately and to access the government subsidy that supports
increasing numbers of African and Coloured students, it is believed that
this choice to not declare points to a much broader societal discussion
about identity and self-declaration that needs to be addressed.
Table 5 in the appendix shows that in 2015 White undergraduate
enrolments exceeded African undergraduate enrolments by 231 and
that by 2019 the situation had reversed with African undergraduates
outnumbering Whites by 1 934. Between 2017 and 2019 African students
The Fees Must Fall and End Outsourcing protests marked a new era in higher education, particularly in terms of addressing access to education.

95
UNIVERSITY OF CAPE TOWN | TEACHING & LEARNING REPORT 2019
made up the largest proportions of the undergraduate enrolment (29%
in 2017, increasing to 30% of the 2019 total). Coloured and Indian
undergraduate enrolments together decreased very slightly from 3 868
in 2015 to 3 462 in 2019, having peaked at 4 117 in 2016. Self-declared
African, Coloured and Indian enrolments made up 50% of the total
undergraduate enrolment in 2019, dropping slightly from a peak of
51.6% in 2017. The proportion of international undergraduates dropped
markedly between 2015 and 2019 from 15% to 9% of the undergraduate
total. Data gathered as part of the annual “no show” survey has shown
that the social action of 2015–2017 played a substantial role in applicants
deciding not to enrol at UCT in 2018.
The 2019 FU intake (4 080) was somewhat larger than that in 2018
(3 761) and was somewhat in excess of the Council approved FU target
of 3 945. Of the 2019 FUs, 34% were found to have achieved an NSC
6 000
5 000
4 000
3 000
2 000
1 000
0African Coloured Indian White Unknown International
2015 2016 2017 2018 2019
Figure 5: Undergraduate enrolments by race: 2015–2019

96
UNIVERSITY OF CAPE TOWN | TEACHING & LEARNING REPORT 2019
aggregate of 80% or more (down from 38% in 2017 and 2018, see Table
7 in the appendix). A further 38% (also 38% in 2018) had achieved an
NSC aggregate of 70–79% while 20% (15% in 2018) had achieved an NSC
aggregate below 70%. The proportion of the intake with NSC aggregates
below 70% has increased steadily from 13% in 2015 to the current level.
We will come back to this point when we deal with student performance.
FUs with unknown matric aggregates (8% of the 2018 total) are mostly
those who completed their schooling outside South Africa.
Looking at the qualification profile of undergraduate enrolments over the
past five years (see Table 12 in the appendix), it is clear that enrolments
in undergraduate diplomas and certificates dropped markedly to 325 in
2019, down from 770 in 2015 and 819 in 2016. As mentioned above, this
was mainly due to the decreased intake in the two advanced diplomas
in Commerce: enrolments at this level in Commerce dropped from 429
in 2015 to just eight in 2019. Enrolments in three-year bachelor’s degrees
and professional first bachelor’s degrees each made up 29% of the total
2019 enrolment. Enrolments in bachelor’s degrees grew at an annual
rate of 0.8% per annum between 2015 and 2019, with 16 350 (16 394 in
2018) students enrolled at this level in 2019.
At the postgraduate level, as seen in Figure
6, the proportion of White enrolments
dropped from 30.6% of the total in 2015 to
21.5% in 2019. Over the same period, the
proportion of African, Coloured and Indian
postgraduates increased by just less than
four percentage points to 34.8% of the
total, while the proportion of international
postgraduates increased from 22.7% in
2015 to 23.8% in 2019, with the majority of
“Enrolments in bachelor’s degrees grew at an annualrate of 0.8% per annum between 2015 and 2019, with 16 350 (16 394 in2018) students enrolled at this level in 2019.”

97
UNIVERSITY OF CAPE TOWN | TEACHING & LEARNING REPORT 2019
these students (17% of the total postgraduate enrolment) being from
the rest of Africa. The proportion of SA postgraduates with undeclared
race increased from 15.8% in 2015 to 24.8% of the 2019 postgraduate
enrolment. This is almost a quarter of the postgraduate enrolments, which
suggests that further investigation might be necessary to understand
both students’ reasons not to declare their race and the implications that
this trend has for UCT’s ability to track its progress or the transformation
of its postgraduate cohorts.
3 500
3 000
2 500
2 000
1 500
1 000
500
0African Coloured Indian White Unknown International
2015 2016 2017 2018 2019
Figure 6: Postgraduate enrolments by race: 2015–2019
Table 12 in the appendix shows a marked decrease in occasional
enrolments between 2016 and 2017, down by 518 enrolments to 975 in
2017, with a further decrease to 945 occasional enrolments in 2018. In
2019 the occasional enrolment dropped further to 804 (3% of the total

98
UNIVERSITY OF CAPE TOWN | TEACHING & LEARNING REPORT 2019
enrolment). This trend was due to a dramatic decrease in enrolments in
the SSA programme in 2017, persisting into 2018 and 2019; the Faculty
of Humanities was most affected by this decrease. Over the 2015–2019
period, however, postgraduate enrolments grew at a rate of 5% per
annum, while undergraduate enrolments decreased progressively from
a peak of 18 413 in 2016 to 17 320 in 2019. As a result of waning interest,
enrolments at the postgraduate diploma level dropped back to 1 592
in 2017 (from 1 896 in 2015 and 1 808 in 2016), increasing somewhat to
1 665 in 2018 and 1 726 in 2019 due to a marked increase in enrolments
in the GSB (see Figure 7).

99
UNIVERSITY OF CAPE TOWN | TEACHING & LEARNING REPORT 2019
Honours enrolments increased at a rate of 3.5% per annum between
2015 and 2019 and made up a stable 5% of the total enrolment across
the period. Master’s enrolments increased at a rate of 4.4% per annum
over the five years, with the master’s fraction of the total enrolment
thus increasing from 17% in 2015 to 20% in 2018 and 2019. However, the
master’s enrolment decreased slightly between 2018 and 2019 (from 5 721
to 5 641). Doctoral enrolments increased by 6.5% per annum between
2015 and 2019 to 2 245 or 8% of the total 2019 enrolment. In 2019 master’s
plus doctoral enrolments totalled 7 886 or 27.5% of the total enrolment as
compared with 6 487 (23% of the total) in 2015. The overall postgraduate
fraction of the enrolment grew from 35% in 2015 to 39% in 2019. The
growth in master’s and especially doctoral enrolments raises the issue
of supervisor overload. It is hoped that the National Review of Doctoral
Degrees conducted by the Council on Higher Education will illuminate
some of these issues once the panel site visit has taken place in 2020.
Figure 7: Growth in postgraduate enrolments by qualification type: 2015–2019
7 000
6 000
5 000
4 000
3 000
2 000
1 000
0
2015 2016 2017 2018 2019
PG Dips Honours Master’s Doctors

100
UNIVERSITY OF CAPE TOWN | TEACHING & LEARNING REPORT 2019
4.2 ACADEMIC STAFFING AND STUDENT:STAFF RATIOS
(Tables 8 to 11 in the appendix)
(Permanent and T3 staff in the teaching ranks only, including joint medical
staff on the UCT payroll)
As seen in Figure 8, differential growth
in student enrolments and academic
staffing across the faculties gave rise to
dissimilar weighted full-time equivalent
(FTE) enrolments per academic staff
member across the institution. In 2019
there were 1 063 (997 in 2018) permanent,
full-time teaching staff spread across the six faculties, the GSB and CHED.
UCT’s permanent (and formerly T3) academic staffing complement
grew by 1.6% per annum between 2015 and 2019. The rate of growth in
academic staffing slightly exceeded that of student headcounts (0.7%
per annum over the same period).
Because growth in headcounts took place mainly at the postgraduate
level, weighted FTE enrolments increased by 1.8% per annum between
2015 and 2019, and the ratio of weighted FTE enrolled students to
academic staff remained relatively level at 31.3 in 2015 and 31.5 in 2019.
Between 2015 and 2018, there were significant increases in the ratios of
weighted FTE students to full-time academic staff in the GSB (up from
55.3 to 71.3), the Faculty of Health Sciences (up from 27.8 to 32.5) and
the Faculty of Humanities (up from 29.3 to 32.9). In the case of the GSB,
this was as a result of rapidly increasing weighted FTE enrolments in
the period from 2014 to 2018, while the academic staffing complement
declined somewhat. In the case of Health Sciences, although there was a
In 2019 there were 1 063 (997 in 2018) permanent, full-time teaching staff spread across the six faculties, the GSB and CHED.

101
UNIVERSITY OF CAPE TOWN | TEACHING & LEARNING REPORT 2019
small academic staff increase (0.7% per annum between 2015 and 2018),
weighted FTE enrolled student numbers increased much more rapidly
(at a rate of 6.1% per annum), hence the increased student:staff ratio.
Marked increases in academic staffing in both the GSB and the Faculty
of Health Sciences in 2019 resulted in substantial decreases in the
student:staff ratios (down to 49.0 and 25.8 respectively). Weighted FTE
enrolments in Humanities increased at a rate of 1.9% per annum between
2015 and 2018, while the academic staffing total dropped slightly, giving
rise to an increase in the student:staff ratio (up from 29.3 in 2015 to 32.9
in 2018); in 2019 this ratio dropped slightly to 31.6 due to a substantial
net increase in academic staff (up from 225 to 244). In the Faculty of
Commerce, academic staff numbers increased at a more rapid rate (4.2%
per annum) than weighted FTE enrolments (0.9% per annum) between
2015 and 2019, resulting in a marked decrease in the faculty’s student:
staff ratio (down from 56.9 in 2015 to 49.9 in 2019).
Commerce GSB EBE Health Sciences
Humanities Law Science All faculties
56,0
49,9
55,3
49,0
31,733,6
29,7
25,8
29,331,6
38,8
34,5
26,129,6
31,6 31,5
2015 2019
Figure 8: Weighted FTE enrolments per academic staff member: 2015 and 2019

102
UNIVERSITY OF CAPE TOWN | TEACHING & LEARNING REPORT 2019
Table 9 in the appendix shows the highest formal qualifications held by
academic staff in the teaching ranks, by year and by faculty. A critical
indicator is the proportion of academic staff holding a doctoral degree,
and it is therefore concerning to note that this proportion has dropped,
from 71% in 2015 down to 63% in 2019. At the same time, the proportion
holding master’s degrees increased from 24% in 2015 and 2016 to 28%
in 2019, while the proportion with a highest qualification below the
master’s level increased from 5% in 2015 to 8% of all academic staff in
2019. The proportions of staff holding doctoral degrees varied widely
by faculty: In 2019, at the lower end, 46% of Commerce and 44% of Law
academic staff held doctoral degrees, while at the upper end 89% of
academics in the Faculty of Science and 78% of those in the GSB were
doctoral graduates. A particularly large proportion of the academic staff
in the Faculty of Law (51%) held a master’s degree as their highest formal
qualification while a substantial proportion of Commerce academic staff
(16%) held a qualification below the honours level.
Senior lecturers made up the largest proportion of the academic staff
in 2019 (29%), followed by lecturers (28%, up from 23% in 2018). While
there was a net gain of 59 staff ranked at the lecturer level between
2014 and 2016, this was largely reversed by a decrease of 57 lecturers
between 2016 and 2018. In 2019, however, there was a net increase of 69
staff at the lecturer level; this provides a probable explanation for the
substantial increase noted in staff with qualifications below the doctoral
level. There also was a drop in the
number of professors between 2017
and 2018 (down from 234 to 221),
and a further decrease down to 206
professors in 2019. While increases
in the number of academic staff at
senior lecturer level and below speaks
“Senior lecturers made up the largest proportion of the academic staff in 2019 (29%), followed by lecturers (28%, up from 23% in 2018).”

103
UNIVERSITY OF CAPE TOWN | TEACHING & LEARNING REPORT 2019
of the development of a pipeline for academic succession, the loss of a
high number of professors without replacement sends warning signals
about a possible juniorisation of the academic staff, which in turn might
have implications for postgraduate supervision and contributions to the
broader research enterprise. This is further compounded by the decrease
in the number of staff holding doctoral qualifications. This is an area that
requires closer monitoring, especially in light of the analysis provided
below about the age of UCT’s academic staff.
Table 11B in the appendix shows the distribution of academic staff by
age group in five-year bands up to age 55+. In 2019 the 55+ group was
the largest (28% of all staff), followed by the 45–49 year age group
(17%) and the 50–54 and 40–44 year groups at 15% and 14% of the total
respectively. Only 25% of the 2019 academic staff were younger than 40
years old.

104
UNIVERSITY OF CAPE TOWN | TEACHING & LEARNING REPORT 2019
Figure 9 summarises the race and gender composition of academic
staff in four age-group bands (<45 years, 45–49 years, 50–54 years
and 55+ years) in 2019, distinguishing between South African staff and
international staff. The staff in the 55+ years group represent the so-
called “ageing professoriate”, who will be retiring in the next 10 years.
Of the 298 staff in this age group in 2019, more than half (161 total, 76
males and 85 females) were White. White staff (40 female and 31 male)
also made up just over half of the 163 staff in the 50 to 54 years age
group, and 48% of the 186 staff in the 45 to 49 years age group in 2019.
As the staff in the <45 years age group are those who will be advancing
through the ranks, essentially replacing those retiring in the next 10 to 20
years, it is concerning to note that in 2019 28% of the 416 staff younger
than 45 years were White and that less than a third of the staff in this
age group (22%) were African.
UCT still has fundamental work to do to change the profile of its academic
staff to give credence to the declared institutional commitment to
transformation. Nevertheless, as can be seen in Figure 10, there has
been important progress made in the employment of African academics
in the past five years. At the same time, there has been a drop in the
participation of White people in the UCT academic workforce since 2014.
Broadly speaking, White staff made up 42% of the 2019 academic staff
complement, in comparison with only 13% African, 15% Coloured and
8% Indian academic staff members. The proportion of international
academic staff is 20% of the total in 2019.
Figure 10 (Table 11B in the appendix), which depicts the distribution of
academic staff by race (extracted from the Higher Education Management
Information System [HEMIS], separating South Africans by race and

105
UNIVERSITY OF CAPE TOWN | TEACHING & LEARNING REPORT 2019
Fig
ure
9: A
cad
emic
sta
ff b
y ra
ce, a
ge
and
gen
der
A
fric
an
Co
lour
edIn
dia
nW
hite
Inte
rnat
iona
lU
nkno
wn
Tota
l
Ag
eFe
mal
eM
ale
Fem
ale
Mal
eFe
mal
eM
ale
Fem
ale
Mal
eFe
mal
eM
ale
Fem
ale
Mal
e
<45
42
504
332
2616
734
535
501
34
16
10
.1%
12.0%
10.3%
7.7%
6.3%
3.8%
17.5%
10.8%
8.4%
12.0%
0.2%
0.7%
100.0%
45–
49
513
1613
39
42
47
1420
22
186
2.7%
7.0%
8.6%
7.0%
1.6%
4.8%
22.6%
25.3%
7.5%
10.8%
1.1%
1.1%
100.0%
50–5
44
1112
115
24
935
1518
1
163
2.5%
6.7%
7.4%
6.7%
3.1%
1.2%
30.1%
21.5%
9.2%
11.0%
0.0%
0.6%
100.0%
55+
413
1618
814
8576
124
72
429
9
1.3%
4.3%
5.4%
6.0%
2.7%
4.7%
28.4%
25.4%
4.0%
15.7%
0.7%
1.3%
100.0%
Tota
l55
8787
744
24
124
920
376
135
59
1063
5.2%
8.2%
8.2%
7.0%
4.0%
3.9%
23.4%
19.1%
7.1%
12.7%
0.5%
0.8%
100.0%

106
UNIVERSITY OF CAPE TOWN | TEACHING & LEARNING REPORT 2019
including all internationals within a single category), shows a considerable
increase (85 staff) in African staff between 2015 and 2019. Over the same
period, UCT gained 58 Coloured staff and 16 Indian staff but shed some
57 international staff. An examination of the countries of origin of the 211
international staff in 2019 shows that 47 (23% of all international academics)
were from countries in Africa and 162 (77%) were from countries outside
Africa (two staff members did not declare their country of origin). The
number of White academics dropped from 489 in 2015 to 451 in 2019, or
by 8%. As a result, the proportion of White academic staff dropped from
49% of all academics in 2014 to 42% in 2019.
African Coloured Indian White Unknown International
2015 2019
Figure 10: Full-time academic staff by race: 2015 and 2019
57
142
103
161
6783
489
451
268
211
12 15
In terms of gender, Table 11C in the appendix shows that the proportion
of female academic staff increased to 48% of the total by the end of 2019
(from 43% in 2015). The proportions of female academics were higher
than those of male academics in the following faculties: Health Sciences

107
UNIVERSITY OF CAPE TOWN | TEACHING & LEARNING REPORT 2019
(65% female), Law (64% female) and CHED (61% female). Conversely,
male academics dominated in Commerce (59%), the GSB (67%), EBE
(67%) and Science (68%).
4.3 TEACHING AND LEARNING (Tables 13 to 26 in the appendix)
Graduates and success ratesThe 2019 HEMIS return to the DHET indicates that 7 495 (7 379 in 2018)
students completed a degree or diploma in 2019 (see Figure 11). The 2019
graduates included 1 302 master’s graduates (down from 1 381 in 2018)
and 261 doctoral graduates (up from 195 in 2018); an increase in doctoral
graduates was apparent in all faculties other than Science and Law. The
largest numbers of 2019 doctoral graduates were from the faculties of
Health Sciences and Science (69 and 52 respectively). At the master’s
level, the largest numbers of graduates were Health Sciences, EBE and
Commerce students (265, 202 and 194 respectively).

108
UNIVERSITY OF CAPE TOWN | TEACHING & LEARNING REPORT 2019
Three-year bachelor’s graduates made up the largest group in 2019
(1 936 graduates, 26% of all graduates). The proportion of professional
first bachelor’s graduates dropped slightly from 22% of the total to 20%
of the total in 2019. The numbers of graduates at the undergraduate
diploma level decreased in 2019, reflecting the relatively smaller
enrolments in this qualification type. Graduations at the postgraduate
diploma level had dropped from a peak of just under 1 135 in 2016 to
944 in 2017 as enrolments at this level waned; however, some recovery
in both enrolments and graduations (up to 1 726 enrolments and 1 175
graduates respectively) continued in 2019.
2 500
2 000
1 500
1 000
500
0
UG Dips & certs
3-year Bach
Prof 1st Bach
PG Dips
Honours
Master’s
Doctors
2015 2016 2017 2018 2019
Figure 11: Changes in graduates by qualification type: 2015–2019

109
UNIVERSITY OF CAPE TOWN | TEACHING & LEARNING REPORT 2019
Table 14 in the appendix shows a concerning decrease in the so-called
graduation rate (calculated as graduates as a fraction of enrolments) in
certain qualification types across the 2015 to 2019 period. For example,
the graduation rate at the three-year bachelor’s level dropped to 23.7% in
2019 from 24% in 2015; the master’s level graduation rate dropped from
25.4% in 2015 to 23.1% in 2019; and the doctoral level graduation rate
dropped from 12.8% in 2015 to 11.6% in 2019. While growth in enrolments
may be a causal factor in the apparent decline (inflating the denominator
in the calculation), the graduation rates at the master’s and doctoral
levels in particular are markedly lower than the National Plan for Higher
Education benchmark graduation rates reflected in Table 14, and this
may indicate a need for further investigation.

110
UNIVERSITY OF CAPE TOWN | TEACHING & LEARNING REPORT 2019
The Table 15 series in the appendix shows the class of pass (measured as
the cumulative career grade point average [GPA]) among all bachelor’s
graduates by faculty, race and gender for the period 2015 to 2019.
Although there was some variation across the five years reported on
here, it appears that the proportions of graduates achieving in the first-
class and upper-second-class bands (10% and 16% of all bachelor’s
graduates respectively) did not change between 2015 and 2019. While
there was an overall slight decrease in the proportion graduating in
the lower-second-class band (down from 47% in 2015 to 45% in 2019),
this was balanced by slight (one percentage point) increases in those
achieving third-class passes (up to 25%) and those whose GPA was less
than 50% (up to 4% of all bachelor’s graduates).
The class of pass differed quite markedly between faculties, with 47% of
Health Sciences students achieving first- or upper-second-class passes,
while 27% of Science and EBE students, 23% of Humanities students and
21% of Commerce graduates achieved GPAs in this band. By contrast, only
13% of Law graduates have GPAs of 70% and higher. GPAs in the lower-
second-class range made up the largest proportion of the graduates
in all faculties other than Health Sciences. Around 30% of Commerce,
Science and Law graduates had GPAs in the third-class band; in Health
Sciences the equivalent proportion was 11% in 2019, in comparison with
7% in 2015.

111
UNIVERSITY OF CAPE TOWN | TEACHING & LEARNING REPORT 2019
Table 15 in the appendix shows that there were also marked differences
in performance profiles of bachelor’s graduates in the different
population groups: By 2019 11% of African graduates, 19% of Coloured
graduates, 29% of Indian graduates and 43% of White graduates had
achieved upper-second or first-class passes. Conversely, 35% of African
graduates, 30% of Coloured graduates, 28% of Indian graduates and
15% of White graduates had GPAs in the third-class band. The largest
proportions of graduates across all race groups were located in the
lower-second-class band: In 2019 40% of all White and Indian bachelor’s
graduates, 49% of Coloured graduates and 45% of African graduates
had passed their degrees in the 60–69% GPA band.
Despite the changes seen in the class of pass among African graduates
between the 2015 and 2019 graduation years, the profiles of the 2019
African and White graduates differed markedly with:
3% of African graduates in comparison with 19% of White graduates
achieving first-class passes
8% of African graduates and 24% of White graduates achieving upper-
second-class passes
45% of African graduates and 40% of White graduates achieving
second-class passes
35% of African graduates and 15% of White graduates achieving third-
class passes
8% of African graduates and 1% of White graduates completing with
cumulative GPAs of less than 50%.
These differentials have a substantial possible impact on the conversion
of graduates to postgraduate study (discussed below) but also suggest
that there is still work to be done to close the performance gap between
African and White students. It should be noted that a fraction of all
bachelor’s graduates with undeclared race increased from 5.1% of the
total in 2015 to 7.9% of the total in 2019.

112
UNIVERSITY OF CAPE TOWN | TEACHING & LEARNING REPORT 2019
Figure 12: Comparison of class of pass among African and White graduates: 2015–2019
The Table 16 series in the appendix shows the rates of conversion of
bachelor’s graduates into postgraduate study. Three-year bachelor’s
graduates who entered at least an honours degree in the year following
graduation, and professional first bachelor’s graduates who similarly
entered at least a master’s programme, have been considered to
have converted to postgraduate study. In general terms, the rate of
conversion among three-year bachelor’s graduates was seen to increase
progressively between 2013 and 2016 (although there were pronounced
differences across the faculties and the various population groups).
However, the 2017 conversion rate slipped back by two percentage points
(from 40% in 2016 to 38% in 2017) and the 2018 and 2019 conversion
rates dropped by a further percentage point to 37%. Conversely, the
conversion rate for professional first bachelor’s graduates increased
from 10% in 2015 to 14% in 2019. It should be noted that professional first
bachelor’s graduates in the Health Sciences overwhelmingly transition
100%
90%
80%
70%
60%
50%
40%
30%
20%
10%
0%
2015 Graduates
2016 Graduates
2017 Graduates
2018 Graduates
2019 Graduates
African White African White African White African White African White
Fall
Third Class
Second
Upper Second
First Class

113
UNIVERSITY OF CAPE TOWN | TEACHING & LEARNING REPORT 2019
into community service following graduation (this must be completed
before these graduates are able to practice their professions), hence
the negligible rate of conversion into postgraduate studies. There were
however marked increases in the conversion rates among professional
first bachelor’s graduates in Commerce (up from 7% to 15%), Humanities
(up from 6% to 25%) and Law (up from 16% to 29%) between 2015 and
2019.
The highest rates of conversion among three-year bachelor’s graduates
took place among Science (peaking at 68% in 2015) and EBE graduates
(peaking at 57% in 2016). It is of interest to note the steady increase
in conversion rates among three-year Commerce and Humanities
graduates between 2015 and 2017, while the conversion rates in EBE
and Science fluctuated quite markedly from year to year. The conversion
rates among three-year bachelor’s graduates in all faculties other than
Commerce improved by one to two percentage points between 2018
and 2019; in the case of Commerce, the conversion rate dropped by four
percentage points to 24% in 2019.

114
UNIVERSITY OF CAPE TOWN | TEACHING & LEARNING REPORT 2019
The table set also shows a steady increase in the conversion rate among
African three-year bachelor’s graduates between 2015 and 2017 (up
from 30% in 2015 to 37% in 2017), followed by a marked decline to 31%
and 32% in 2018 and 2019. The conversion rates among Coloured and
Indian graduates dropped from 35% in 2018 to 31% in 2019, while the
conversion rate among White three-year bachelor’s graduates peaked at
47% in 2019. Given the support provided, especially for Black students
wanting to pursue honours degrees, these results are disappointing
and require further investigation to identify the obstacles preventing
students from continuing to study at postgraduate level. The conversion
rate among international three-year bachelor’s graduates also dropped
markedly between 2017 and 2018 (by eight percentage points to 36%),
increasing by one percentage point to 37% in 2019.
Figure 13: Conversion of three-year bachelor’s graduates to postgraduate study by race: 2015–2019
50%
45%
40%
35%
30%
25%
20%
15%
10%
5%
0%
All
African
Coloured
Indian
White
International
2015 2016 2017 2018 2019

115
UNIVERSITY OF CAPE TOWN | TEACHING & LEARNING REPORT 2019
The conversion rate among female graduates increased steadily to a level
of 38% in 2016 and in 2017, dropping to 36% in 2018 and 35% in 2019.
However, the 2019 conversion rates among female Commerce and EBE
graduates dropped to 22% in both cases (from 31% and 30% respectively in
2017). Among male three-year bachelor’s graduates, the conversion rate
peaked at 42% in 2016, dropping to 39% in 2017 and 2018, and increasing
slightly to 40% in 2019. Particularly large proportions of the male three-
year bachelor’s graduates in Science (60%) and EBE (59%) converted to
honours studies in 2019. The rate of conversion to honours studies in the
EBE three-year bachelor’s programmes is particularly important as the
completion of relevant honours programmes is essential for professional
practice in architecture, construction studies and property studies.
Figure 14: Conversion of three-year bachelor’s graduates to postgraduate study by gender: 2015–2019
44%
42%
40%
38%
36%
34%
32%
30%
All
Female
Male
2015 2016 2017 2018 2019

116
UNIVERSITY OF CAPE TOWN | TEACHING & LEARNING REPORT 2019
In terms of the conversion of professional first bachelor’s graduates into
postgraduate study, the rate is far lower than that among three-year
bachelor’s graduates, fluctuating at around 9–10% between 2015 and
2018, but increasing to 14% in 2019. The conversion rate among White
graduates also fluctuated between 9% and 10% over the 2015 to 2018
period, increasing to 14% in 2019. The conversion of African professional
first bachelor’s graduates into postgraduate study increased from 8%
in 2015 to 13% in 2019. Similarly, the conversion rates among Coloured
and Indian professional first bachelor’s graduates increased to 12%
and 13% respectively in 2019. The conversion rate among international
professional bachelor’s graduates was much higher than among local
students, peaking at 27% in 2017, but dropping by three percentage
points to 24% in 2019.
Figure 15: Conversion of professional first bachelor’s graduates to postgraduate study by race: 2015–2019
30%
25%
20%
15%
10%
5%
0%
All
African
Coloured
Indian
White
International
2015 2016 2017 2018 2019

117
UNIVERSITY OF CAPE TOWN | TEACHING & LEARNING REPORT 2019
It is also noteworthy that until 2017 the conversion rate among female
graduates was consistently lower than that among male professional
first bachelor’s graduates. In 2018, however, the female conversion rate
increased by three percentage points to 11%, while the male conversion
rate dropped by one percentage point, also to 11%. The conversion rate
among male graduates increased to 16% in 2019, while that among
female graduates remained level at 11%.
Figure 16: Conversion of professional first bachelor’s graduates to postgraduate study by gender: 2015–2019
18%
16%
14%
12%
10%
8%
6%
4%
2%
0%
All
Female
Male
2015 2016 2017 2018 2019

118
UNIVERSITY OF CAPE TOWN | TEACHING & LEARNING REPORT 2019
Success ratesLooking at course performance at the undergraduate level, the overall
success rate in 2019 increased somewhat to 85.1%, from 84% in 2018
(85% in 2017, 87.8% in 2016 and 88.4% in 2015).
The Table 17 series in the appendix shows that the overall 1000-level course
success rate dropped from 86% in 2015 to 83% in 2016 and 2017, 81% in 2018,
and rising again to 83% in 2019. Table 17A shows that there were marked
improvements in 1000-level course success rates in EBE (up by eight
percentage points to 87%) and Law (up by four percentage points to 85%)
and smaller increases in Commerce and Science (up by two percentage
each to 88% and 77% respectively). The 1000-level success rates remained
unchanged at 95% in Health Sciences and 84% in Humanities.
Table 17B shows an improvement in 1000-level course success within the
Business/Commerce Classification of Education Subject Matter (CESM)
group (up from 85% in 2018 to 87% in 2019) and the Science/Technology
The Fees Must Fall movement was a period of student and worker action that hadn’t been seen since the first democratic election in 1994. The protests achieved what many thought was impossible.

119
UNIVERSITY OF CAPE TOWN | TEACHING & LEARNING REPORT 2019
CESM group (up from 78% in 2018 to 81% in 2019). The success rate
within courses in the Broad Humanities, however, remained level at 84%.
Table 17C shows that almost all groups reflected small (one to two
percentage point) increases in 1000-level success rates between 2018 and
2019. In the case of Indian students, there was a larger, five percentage
point improvement. The difference in success rates at the 1000-level
between White (at the upper extreme) and African students (at the lower
extreme) widened from 12 percentage points in 2015 to 15 percentage
points in 2019. It is entirely possible that the overall lower performance
during 2016 to 2018 reflected the challenging environment arising from
the 2015–2017 student protests, including the closing of the university for
sustained periods and the interruption of lectures during the protests.
Figure 17: 1000-Level course success rates by race: 2008–2019
95%
90%
85%
80%
75%
70%
65%
African
Coloured
Indian
White
International
2008 2009 2010 2011 2012 2013 2014 2015 2016 2017 2018 2019

120
UNIVERSITY OF CAPE TOWN | TEACHING & LEARNING REPORT 2019
The analysis of the 1000-level course success rates after 2009, as well as
the academic standing code analysis described below, suggest that the
performance of the 2009 FU cohort was an aberration following the first
writing of the first NSC exams, and that performance within subsequent
cohorts is likely to be more in line with that among cohorts entering
prior to 2009.
The overall success rate in 2000-level courses dropped by three
percentage points between 2016 and 2017 (to 84%) and remained level
at 84% in 2018 and 2019. While in most cases 2000-level success rates
in 2019 were either the same as in 2018 or changed by one percentage
point, in EBE the success rate at this level increased by four percentage
points to 86%. The changes in 2000-level success rates by CESM
group between 2018 and 2019 were negligible, with only the SET group
reflecting a one percentage point improvement (see Table 17b). Table
17C shows that the 2000-level success rates among African students
remained level at 76% in 2019 but increased by two percentage points
among White students (up to 94%) and three percentage points among
Indian students (up to 87%). All of the other SA population groups and
international students reflected a one percentage point decrease in
2000-level success rates between 2018 and 2019. Because of differential
shifts in 2000-level success rates by race, the White:African 2000-level
performance differential increased from 14 percentage points in 2015 to
18 percentage points in 2019.
The Table 17 series in the appendix shows that the success rate at the
3000-level remained level, overall, between 2018 and 2019. There was,
however, a three percentage point improvement in relation to SET courses
(up to 92%) and a one percentage point decrease in the success rate in
Business/Management courses (down to 86%). In terms of performance
by race, at the lower end the 2019 3000-level success rate among Black

121
UNIVERSITY OF CAPE TOWN | TEACHING & LEARNING REPORT 2019
students improved by two percentage points to 83% in 2019, while at
the upper end the success rate among White students increased by
two percentage points to 95%. The Faculty of Law experienced a large
decrease in the success rates at the 3000-level between 2017 and 2018
(down by nine percentage points to 77%) and a further decrease to 76%
in 2019. At the upper end, looking at 3000-level performance by faculty,
the success rate in Health Sciences courses remained level at 96%.
All groups showed small increases in 3000-level course performance
between 2018 and 2019, while the success rate among international
students remained level at 90%. Differential fluctuations in the success
rates in 3000-level courses resulted in the African:White performance
gap increasing from 10 percentage points in 2015 to 14 percentage points
in 2016 but dropping again to 12 percentage points in 2019.
Foundation studentsTables 18A and B in the appendix show trends in the success rates
among foundation students by UCT course level, faculty and CESM
group. Of critical concern is the performance of these students in 2000-
and 3000-level courses which form part of the mainstream curriculum,
following the structured support offered in the first year. It is therefore
of interest to note that in all of the years shown here the performance of
foundation students in 1000- and 2000-level courses was very similar.
In 2017, however, there was an overall four percentage point differential
between performance in 1000-level courses (77% pass rate on average)
and 2000-level courses (pass rate of 73% on average). The difference
between 1000- and 2000-level success rates in 2019 was visible across all
faculties and was particularly pronounced in Law (where the 2000-level
success rate was 12 percentage points lower than the 1000-level success
rate) and in Health Sciences where this differential was 11 percentage
points. Looking at the data in terms of CESM group (see Table 18B), the

122
UNIVERSITY OF CAPE TOWN | TEACHING & LEARNING REPORT 2019
2000-level course success rates among foundation students were three
percentage points lower (at 73%) in the Business/Commerce group; five
percentage points lower in the broad Humanities (at 77% in 2019), but
two percentage points higher in the Science/Technology group (at 71%).
It is, however, of concern that the 1000-level course success rate among
foundation students has decreased progressively over the past five years,
from 79% in 2015 down to 75% in 2018 and 2019. At the 2000-level, the
success rate among foundation students also dropped from 79% in 2015
to 74% in 2018 and 2019.

123
UNIVERSITY OF CAPE TOWN | TEACHING & LEARNING REPORT 2019
Undergraduate academic progress code analysis (Table 19 in the appendix)
Between 2015 and 2019 the fraction of “successful” undergraduates (ie
those who had completed a degree/diploma or at least met minimum
readmission requirements – in which case a CONT academic standing code
is awarded) dropped from 89% to 86% (87–89% of all undergraduates
were “successful” where the measure of success is the achievement of
a QUAL/INQF or CONT academic standing code). In 2019 14% of all
undergraduates failed to meet minimum readmission requirements for
readmission, ie they required faculty or Senate permission to re-register,
or were refused readmission on academic grounds. Of these students,
most (9% of all undergraduates) were granted concessions to continue
with their studies. Students who receive concessions to continue with
their studies effectively repeat the year, which prolongs the time to degree
among those who ultimately graduate. The final proportion excluded on
academic grounds remained level at 3% of all undergraduates between
2017 and 2019.
Four of the faculties (Commerce, EBE,
Humanities and Law) awarded concessions to
continue to at least 10% of their undergraduate
students at the end of 2019. The Faculty of
Science awarded concessions to continue
studying to 6% of its undergraduates in 2019
(up from 4% in 2015). In the Faculty of Health
Sciences, the proportion of undergraduates
receiving concessions to continue increased
to 3% in 2019, having remained level at 1%
between 2015 and 2017.
“Four of the faculties (Commerce, EBE, Humanities and Law) awarded concessions to continue to at least 10% of their undergraduate students at the end of 2019.”

124
UNIVERSITY OF CAPE TOWN | TEACHING & LEARNING REPORT 2019
While 12% of all undergraduate students failed to meet minimum
readmission requirements in 2019, the proportion failing to do so of:
African undergraduates was 19% (17% in 2015)
Coloured undergraduates was 14% (12% in 2015)
Indian undergraduates was 11% (12% in 2015)
White undergraduates was 6% (5% in 2015)
international undergraduates was 14% (10% in 2015).
It is of interest to note that among Indian and White undergraduates
there was a progressive increase in the proportion of students qualifying
over the 2015–2019 period: In the case of Indian students, this proportion
rose from 17% in 2015 to 27% in 2019, while in the case of White students
the proportion increased from 27% in 2015 to 32% in 2019. This change
may be the result of decreasing numbers of Indian and White students
entering the university, giving rise to relatively more senior cohorts of
Indian and White students and thus larger proportions of graduates.
Five-year first-time entering undergraduate cohort analysis (Tables 20 and 21 in the appendix)
The Table 20 series in the appendix tracks
the progress of the 2011 to 2015 FU cohorts.
These overall entry cohorts showed a marked
consistency in relation to completion rates
among the 2011 to 2014 cohorts (72–73%),
but the completion rate among the 2015
cohort dropped to 70%. The proportion
of each cohort still busy with their studies
increased by one percentage point to 9%
of the 2015 FU cohort, while the proportion

125
UNIVERSITY OF CAPE TOWN | TEACHING & LEARNING REPORT 2019
dropping out in good academic standing remained level at 10%. Ten
percent of the 2015 FU cohort (in comparison with 9% of the equivalent
2014 FU cohort) were excluded on academic grounds.
Analyses of the five-year longitudinal progress of FUs within the 2015
entry cohorts showed that 70% had completed a degree/diploma by
the end of 2019, while 9% of the 2015 entrants were still busy with their
undergraduate studies after five years. The potential completion rate
within the 2015 cohort was therefore 79% in comparison with 80% among
both the 2011 and 2012 cohorts and 81% of the 2013 and 2014 cohorts. By
the end of 2019, 10% of the 2015 FU entrants shown here had dropped
out in good academic standing, and a further 10% had been excluded on
academic grounds, bringing the total attrition rate (academic exclusion
plus drop-out in good academic standing) to 20% of the cohort. This
represents a marked improvement in comparison with the 2009 FU
cohort (not shown in the Table 20 series) among whom 20% had been
academically excluded, and a further 9% had dropped out without
completing a degree/diploma within five years of beginning their
studies; the total attrition within the 2009 cohort was therefore 29% of
all entrants.
The relatively lower completion rate within
the 2009 FU cohort resulted mainly from
an increase in the proportion of students
excluded on academic grounds (up by three
percentage points to 20% in comparison with
the 2008 cohort). It should also be noted
that the 2009 intake included large numbers
of writers of the first NSC in 2008, where
unexpectedly strong performances in subjects
such as mathematics may have adversely
“Analyses of the five-year longitudinal progress of FUs within the 2015 entry cohorts showed that 70% had completed a degree/diploma by the end of 2019, while 9% of the 2015 entrants were still busy with their undergraduate studies after five years.”

126
UNIVERSITY OF CAPE TOWN | TEACHING & LEARNING REPORT 2019
impacted on admissions decisions in the Science and EBE faculties in
particular. Particularly high rates of cumulative academic exclusion were
apparent within the 2009 EBE and Science FU cohorts: 30% and 33%
respectively. The academic exclusion rates in these two faculties have
dropped markedly, with 13% of the 2015 Science FU cohort and only 10%
of the equivalent EBE cohort being excluded on academic grounds. In
the case of EBE, a large proportion of the 2015 FU intake (18%) were still
busy with their undergraduate studies after five years of study. In the case
of the Faculty of Law, there was a marked decrease in the completion
127
UNIVERSITY OF CAPE TOWN | TEACHING & LEARNING REPORT 2019
rate within the 2015 FU cohort (down to 49%, in comparison with 52%
of the 2013 cohort and 69% of the 2014 cohort); 17% of the 2015 Law FU
cohort were still busy with their studies at the end of 2019, but 10% had
dropped out in good academic standing and a further 25% had been
academically excluded; the overall attrition rate within the 2015 Law FU
cohort was 35% by the end of 2019.
Of particular interest is the impact of the new approach to the Extended
Degree Programme (EDP) in Science (introduced in 2013) on cohort
performance in that faculty. Prior to 2013 these students were admitted
directly into the General Entry Programme for Science, but as from 2013
all students have been admitted into the mainstream (SB001). All students
are then required to write a set of formal class tests at midterm of the
first semester (mid-March). Based on the marks achieved in these tests,
assessed together with the results of the school-leaving examinations
and the NBTs, selected students are then advised to convert to the four-
year EDP – the SB016. The EDP is structured such that students entering
the programme receive additional academic and general support in
order to improve their chances of graduating in minimum time. Table
20A shows that the completion rate for Science FUs had dropped to
63% and 65% of the 2011 and 2012 FU cohorts respectively, with 24% and
20% of these cohorts being refused readmission on academic grounds.
Encouragingly, 68% of the first cohort of the new EDP (the 2013 cohort)
had completed their studies after
five years of study, while 70% of the
second EDP cohort and 72% of the
2015 cohort had graduated within five
years. It is noteworthy that the rates
of academic exclusion among these
three cohorts (14% in both 2013 and
2014 and 13% in 2015) were markedly
“The EDP is structured such that students entering the programme receive additional academic and general support in order to improve their chances of graduating in minimum time.”

128
UNIVERSITY OF CAPE TOWN | TEACHING & LEARNING REPORT 2019
lower than those during the GEPS approach. However, it appears that
although there was no marked change in the incidence of drop-out in
good academic standing, there has been an increase in the proportion
of students still busy with their studies after five years (10% of the 2013
cohort, 8% of the 2014 cohort and 7% of the 2015 cohort in comparison
with 4–5% of the 2011 and 2012 cohorts). The potential completion
rate among the 2015 FU cohort, after five years of study, was 79%, in
comparison with only 68% within the 2011 FU cohort and 69% among
the equivalent 2012 cohort.
Figure 18: Academic progress of FU cohorts: 2009–2015
100%
90%
80%
70%
60%
50%
40%
30%
20%
10%
0%
Excluded on academic
grounds
Dropped out in good
academic standing
Still busy with UG
studies
Completed UG studies
2009 intake
2010 intake
2011 intake
2012 intake
2013 intake
2014 intake
2015 intake

129
UNIVERSITY OF CAPE TOWN | TEACHING & LEARNING REPORT 2019
Cohort completion rates across the 2009 to 2015 FU intakes varied widely
in relation to entry faculty and race. The gap between completion rates
among White and African students was markedly larger within the 2009
cohort than in prior years: 79% of the White FU cohort, in comparison
with 48% of the African FU intake, had completed a qualification by the
end of 2013. Looking at the 2015 cohort, the completion rate among
White students dropped by three percentage points to 82% and by two
percentage points to 59% among African students (up from 57% within
the 2010 to 2012 entry cohorts). A particularly large proportion of the
2015 African cohort (14%) was, however, still busy with undergraduate
studies at the end of 2019, bringing the potential completion rate within
the cohort up to 73% (in comparison with 60% within the equivalent 2009
FU cohort). The relatively large proportion of African students still busy
with undergraduate studies after five years (which has been consistent at

130
UNIVERSITY OF CAPE TOWN | TEACHING & LEARNING REPORT 2019
13–14% of each recent entry cohort) relates to a large extent to the frequency
of enrolment on extended programmes, where the minimum time to
degree is a year longer than in the mainstream. The potential completion
rates among Coloured, Indian and White 2015 entrants were 81%, 82% and
86% respectively. It is of concern that the completion rates among the
Indian and White 2015 cohorts both dropped, by three percentage points
in the case of White students to 82%, and by 10 percentage points of the
Indian cohort to 65% (largely due to a seven percentage point increase in
Indian students still busy with their studies).
100%
90%
80%
70%
60%
50%
40%
30%
20%
10%
0%
Excluded on academic
grounds
Dropped out in good
academic standing
Still busy with UG
studies
Completed UG studies
2009 intake
2010 intake
2011 intake
2012 intake
2013 intake
2014 intake
2015 intake
Afr
ican
Whi
te
Afr
ican
Whi
te
Afr
ican
Whi
te
Afr
ican
Whi
te
Afr
ican
Whi
te
Afr
ican
Whi
te
Afr
ican
Whi
teFigure 19: Comparison of academic progress of successive African
and White FU cohorts: 2009–2015

131
UNIVERSITY OF CAPE TOWN | TEACHING & LEARNING REPORT 2019
While 70% of all 2015 first-time undergraduate students in this analysis
had completed their studies within five years of initial registration, the
proportion doing so of:
African undergraduates was 59% (in comparison with 48% of the 2009
cohort)
Coloured undergraduates was 71% (in comparison with 58% of the
2009 cohort)
Indian undergraduates was 65% (in comparison with 60% of the 2009
cohort)
White undergraduates was 82% (in comparison with 79% of the 2009
cohort).
Looking at the 2009–2015 FU cohorts, attrition rates have decreased
across all race groups, but the most marked improvement (18 percentage
points) is apparent among African entrants. Attrition rates within the
2015 FU cohort were as follows:
20% of all entrants (in comparison with 29% of the 2009 cohort)
27% among African entrants (in comparison with 41% of the 2009
cohort)
18% among Coloured entrants (in comparison with 33% of the 2009
cohort)
17% among Indian entrants (in comparison with 29% of the 2009 cohort)
15% among White entrants (in comparison with 17% of the 2009 cohort).
Table 21 in the appendix shows that in addition to the high attrition rate
among African students in the mainstream, the rate of attrition in the
extended degree programmes remained problematic – particularly in the
faculties of EBE and Science (31% and 29% of the 2015 entering cohorts
respectively). There has, however, been some improvement in recent
intakes within the Faculty of Science, where the academic exclusion
rates dropped from 49% among the 2010 and 2011 cohorts to 27% of

132
UNIVERSITY OF CAPE TOWN | TEACHING & LEARNING REPORT 2019
the 2014 and 2015 cohorts. Similarly, within the EBE faculty, the rate of
academic exclusion dropped from a peak of 34% among the 2011 cohort,
to 24% among the 2015 cohort. In the Faculty of Humanities, however, the
academic exclusion rate increased from 19% among the 2011 cohort to
22% of the 2015 cohort, peaking at 24% in respect of the 2012 FU cohort.
Within the Faculty of Law, the intake into the Extended Curriculum
Programme (ECP) increased numerically from just five students in 2011
to 19 students in 2015. The completion rate within the 2015 Law cohort
(16%) was the lowest of the five entry cohorts summarised here, with
an attrition rate of 48% (37% exclusions plus 11% drop-outs in good
academic standing) by the end of 2019. With 37% of the entrants still
busy after five years of study, the potential completion rate within the
2015 Law ECP cohort was just 53%.
It is concerning that the overall completion rate within the 2015 EDPs
(54%) was three percentage points lower than that within the equivalent
2014 cohort. Overall potential completion within the extended
programmes (73%) was equal to that within the African mainstream,
although the proportion of students still busy with their studies (19%)
was markedly higher than that within the Black mainstream (14%). The
completion rates within the extended programmes tended to vary
quite markedly from year to year, and also by programme. However, the
completion rates among the 2015 EDP cohorts were as follows:
60% within the BCom (66% in 2014)
68% within the BBusSc (64% in 2014)
39% within the BSc(Eng) (59% in 2014)
16% within the LLB (33% in 2014)
52% within the BSc (49% in 2014)
53% within the BA and BSocSc (the same as in 2014).

133
UNIVERSITY OF CAPE TOWN | TEACHING & LEARNING REPORT 2019
Overall attrition in the EDPs dropped slightly to 28% among the 2015 cohort,
from a peak of 31% among the 2011 and 2012 cohorts. By way of comparison,
the level of attrition within the 2009 foundation cohort was 43%.
The Table 22 series in the appendix summarises the years to completion
among graduates of the 2011 to 2015 entry cohorts in five large faculties
(excluding Health Sciences). Table 22A shows that a relatively steady
proportion of the five entry cohorts examined here (32–36%) completed
their studies in three years. The proportion of graduates completing in
four years increased by five percentage points between 2011 and 2015
(up from 41% of the 2011 cohort to 46% of the equivalent 2015 cohort).
Looking at graduates within the three-year programmes (BA, BCom, BSc
and BSocSc), there were marked variations by programme: 74% of the
2015 BA graduates, 51% of the BCom graduates, 57% of the BSc graduates
and 51% of the BSocSc graduates had completed their studies within the
minimum three-year period. The proportions of graduates completing
four-year programmes within the minimum time were, however, very
similar: 69% of the 2015 BBusSc graduates, 70% of the LLB graduates
and 70% of the BSc(Eng) graduates had completed in four years.
There were marked differences in time to degree among graduates by
race, however:
26% of all 2015 African graduates had completed in three years (up
from 19% of the 2011 cohort graduates) and a further 43% (up from 41%
of the 2009 graduates) had completed in four years.
30% of all 2015 Coloured graduates had completed in three years (up
from 15% of the 2011 cohort graduates) and a further 47% (up from 38%
of the 2011 cohort graduates) had completed in four years.
24% of all 2015 Indian graduates had completed in three years (the
same as within the 2011 cohort graduates) and a further 47% (up from
45% of the 2011 cohort) had completed in four years.

134
UNIVERSITY OF CAPE TOWN | TEACHING & LEARNING REPORT 2019
43% of all 2015 White graduates had completed in three years and a
further 46% had completed in four years. The proportions of graduates
within the three- and four-year periods among White students fluctuated
to a far lesser extent than those among the other population groups.
Figure 20 compares time to degree among African and White FU
entrants into three-year bachelor’s programmes in 2011 and 2015, with a
view to looking at possible differential completion rates by race. There
are indeed marked differentials in the proportions of African and White
students completing their studies in three years in all four programmes
and within both entry cohorts. The differential was most pronounced in
the Bachelor of Social Science (BSocSc) where 31% of Africans students
in comparison with 80% of White graduates in the 2015 cohort had
completed within three years, and the Bachelor of Science where 28%
of Africans entrants in comparison with 70% of White 2015 entrants
graduated within three years. Although the differentials relate to some
extent to the substantial numbers of African students who enter extended
programmes, the substantial proportions of African students who take
five years or more to complete a three-year programme suggest that
there are other factors at play: Looking at the 2011 African entrants, 21%
of BA graduates, 28% of BSocSc graduates, 30% of BCom graduates and
36% of BSc graduates took at least five years to complete their studies.
Looking at the graduates of the 2015 FU cohort, some improvement
was apparent with 10% of African BA graduates, 22% of African BCom
graduates, 26% of African BSocSc graduates and 32% of African BSc
graduates taking at least five years to complete.

UNIVERSITY OF CAPE TOWN | TEACHING & LEARNING REPORT 2019
Figure 20
Humanities: BA
Graduated in 2011 FU
African
2011 FU
White
2015 FU
African
2015 FU
White3 years 41% 73% 52% 86%
4 years 36% 19% 38% 10%
5 years 15% 7% 10% 4%
6 years 6% 1% 0% 0%
Commerce: BCom
Graduated in 2011 FU
African
2011 FU
White
2015 FU
African
2015 FU
White3 years 32% 43% 39% 66%
4 years 38% 48% 38% 25%
5 years 21% 8% 22% 9%
6 years 9% 0% 0% 0%
Science: BSc
Graduated in 2011 FU
African
2011 FU
White
2015 FU
African
2015 FU
White3 years 21% 63% 28% 70%
4 years 44% 31% 40% 25%
5 years 27% 6% 32% 5%
6 years 9% 0% 0% 0%
Humanities: BSocSc
Graduated in 2011 FU
African
2011 FU
White
2015 FU
African
2015 FU
White3 years 44% 69% 31% 80%
4 years 28% 21% 44% 16%
5 years 23% 10% 26% 4%
6 years 5% 1% 0% 0%

136
UNIVERSITY OF CAPE TOWN | TEACHING & LEARNING REPORT 2019
Similar differentials are apparent in Figure 21 below, which compares
time to degree among African and White 2011 and 2015 FU entrants into
four-year programmes. Here too, the proportions of African students
completing their BBusSc and BSc(Eng) studies within four years are
markedly lower than the equivalent proportions of White students.
While the 2015 cohort has only been tracked for five years, the 2011
cohorts showed that substantial proportions of Black students (38% of
the BBusSc intake, 40% of the LLB graduates and 56% of the BSc (Eng)
intake) took five or six years to complete their four-year degrees.

137
UNIVERSITY OF CAPE TOWN | TEACHING & LEARNING REPORT 2019
Figure 21
Commerce: BBusSc
Graduated in 2011 FU
African
2011 FU
White
2015 FU
African
2015 FU
White3 years 0% 3% 11% 8%
4 years 55% 78% 51% 78%
5 years 37% 18% 38% 14%
6 years 9% 1% 0% 0%
Engineering: BSc(Eng)
Graduated in 2011 FU
African
2011 FU
White
2015 FU
African
2015 FU
White3 years 1% 2% 0% 1%
4 years 32% 75% 43% 75%
5 years 39% 19% 56% 24%
6 years 28% 5% 0% 0%
Law: LLB
Graduated in 2011 FU
African
2011 FU
White
2015 FU
African
2015 FU
White3 years 0% 13% 0% 0%
4 years 67% 75% 60% 100%
5 years 33% 13% 40% 0%
6 years 0% 0% 0% 0%

138
UNIVERSITY OF CAPE TOWN | TEACHING & LEARNING REPORT 2019
Postgraduate (master’s and doctoral) cohort analysis (Tables 23 and 24 in the appendix)
Table 23 in the appendix shows the cohort retention of the 2011 to 2015
new intakes of master’s students, each tracked for four years. The overall
completion rate among these master’s cohorts ranged between 64% (of
the 2011 and 2014 intakes) and 75% (of the 2012 intake) at the upper
end. Of the 2015 intake, 9% was still registered at the master’s level
after four years, and the potential completion rate within this cohort
was thus 74%, which is five percentage points higher than that within
the 2011 cohort (69%). Around 3% of each cohort had upgraded to
doctoral study during the four-year tracking period; upgrades were most
common in the faculties of Health Sciences (where up to 9% of an entry
cohort upgraded) and Science (where up to 15% of a cohort upgraded
to doctoral study). The proportion of the intake still registered after four
years of study increased within more cohorts: 5% of the 2011 intake in
comparison with 9% of the 2013, 2014 and 2015 cohorts were still busy
with their master’s studies after four years. The proportion dropping out
in good academic standing ranged between 19% and 21% of each cohort.
Master’s level cohort completion rates varied widely by faculty as well
as by intake year. Completion rates were consistently highest among
GSB students where between 87% and 81% (of the 2011 and 2013 cohorts
respectively) had graduated within four years of commencing their studies.
Completion rates among the 2015 entering cohorts were as follows:
61% of the Commerce cohort (the same as within the 2014 intake) had
graduated within four years.
54% of the EBE cohort (in comparison with 55% of the 2014 intake) had
graduated within four years.
52% of the Health Sciences intake (in comparison with 44% of the 2014
intake) had graduated within four years.

139
UNIVERSITY OF CAPE TOWN | TEACHING & LEARNING REPORT 2019
66% of the Humanities cohort (in comparison with 63% of the 2014
intake) had graduated within four years.
66% of the Science cohort (in comparison with 67% of the 2014 intake)
had graduated within four years.
The 2011 to 2015 new intakes of doctoral students were each tracked for
five years. Table 24 in the appendix shows the status of the intake of each
cohort, per faculty, as at the end of five years of study. The table shows
that the overall completion rate among new doctoral intakes peaked at
51% (of the 2013 intake), but then dropped markedly to only 36% with
respect to the 2014 cohort and 31% of the 2015 cohort. Between 28% and
38% of each cohort was still registered at the end of five years, bringing

140
UNIVERSITY OF CAPE TOWN | TEACHING & LEARNING REPORT 2019
the potential cohort completion rates to between 69% (within the 2015
cohort) and 80% (within the 2011 cohort). Attrition rates within the
doctoral cohorts (including those who dropped out in good academic
standing as well as the small number excluded academically) varied
between 19% (of the 2011 cohort) and 30% (of the 2015 entry cohort).
Retention and completion patterns at the doctoral level varied widely
across the faculties and entry years, but the decrease in the completion
rate and increased attrition rate within the overall 2014 doctoral cohort,
and the further increase within the 2015 cohort, is of concern. Table
24 shows that there was a substantial decrease in the 2014 cohort
completion rate, and a further decrease in the 2015 cohort completion
rate, in comparison with that within the 2013 intake, across all faculties,
while the attrition rate had increased across the board.
Looking at the 2015 cohort, the following patterns are apparent:
24% of the Commerce intake had graduated and a further 35% were still
registered after four years, bringing the potential completion rate to 59%.
29% of the EBE intake had graduated and a further 40% were still
registered, bringing the potential completion rate to 69%.
29% of the Health Sciences intake had graduated and a further 42%
were still registered, bringing the potential completion rate to 71%.
27% of the Humanities intake had graduated and 36% were still
registered, bringing the potential completion rate to 63%.
30% of the Law intake had graduated and a further 43% were still
registered, bringing the potential completion rate to 73%.
47% of the Science intake had graduated and a further 31% were still
registered, bringing the potential completion rate to 78%.
The rates of academic exclusion and transfer to other programmes were
small to negligible among the doctoral cohorts summarised here.

141
UNIVERSITY OF CAPE TOWN | TEACHING & LEARNING REPORT 2019
Time to degree Table 25 in the appendix shows the numbers of postgraduate diploma
and honours graduates by faculty for the years 2015 to 2019, and the
average time to degree for these qualifications in each of the faculties
and overall. The average time to completion for postgraduate diplomas
fluctuated between from 1.3 years and 1.4 years over the period. In 2019
the average time to completion for postgraduate diplomas ranged from
1.1 years in Law (where these qualifications are largely full-time and done
over one year) to 1.6 years in the GSB and Health Sciences, where part-
time study over two years is common.
The overall average time to completion for honours graduates remained
level at 1.2 years across the 2015 to 2019 period. The markedly higher
time to degree among Commerce honours graduates (1.3 to 1.4 years)

142
UNIVERSITY OF CAPE TOWN | TEACHING & LEARNING REPORT 2019
results from the part-time honours offerings in Financial Analysis and
Portfolio Management, which has both January and June intakes, and in
Information Systems.
Table 26 in the appendix shows a marked decrease in the number of doctoral
graduates between 2017 and 2018 (down from 277 in 2017 by 30% to 195
in 2018). Decreases in the numbers of doctoral graduates were apparent
in all faculties, but the most marked drops were in EBE (down 52% to 16
graduates), Commerce (down 33% to 29 graduates) and Humanities (down
26% to 35 graduates). The situation improved in 2019 with the doctoral
graduate total rising to 261; increases in doctoral graduate numbers were
evident in all faculties other than Science and Law.

143
UNIVERSITY OF CAPE TOWN | TEACHING & LEARNING REPORT 2019
It is clear, however, that the time to degree among doctoral graduates
increased for the third consecutive year: up from 4.8 years in 2016, to
5.0 years in 2017, 5.3 years in 2018 and to 5.7 years in 2019. In two of the
faculties, EBE and Humanities, the average time to degree among 2019
doctoral graduates was greater than six years (6.1 years).
Table 26 also reflects a marked decrease in master’s graduates between
2018 and 2019 (down from 1 381, which represented a peak in master’s
graduate numbers, to 1 302). Decreases in master’s graduate numbers
were apparent in all faculties other than Commerce and Science, which
experienced proportional increases of 26% and 46% respectively
between 2018 and 2019. The GSB master’s graduate total dropped
by 36 percentage points to 151 in 2019. However, the average time to
completion among master’s graduates remained level at 3.0 in 2019.

CONCLUSION

145
UNIVERSITY OF CAPE TOWN | TEACHING & LEARNING REPORT 2019
The 2019 Teaching and Learning Report
focused on three themes: student
success and the role of advising and
data analytics in supporting this;
curriculum change; and teaching and
learning practices through the use of
technology and the showcasing of
good practices. When we look at these
themes from the harsher perspective
of UCT’s actual performance in relation to key indicators, there are some
important reflections to make.
In relation to undergraduate degrees, it is important to note that the
overall success rate in 2019 increased to 85.1%, from 84% in 2018, and
that UCT continues to be among the top performers nationally on this
score. The success rate in 1000-level courses rose to 83% from 81%
in 2018, while the performances at 2000- and 3000-level courses
remained stable at 84% and 89% respectively. As indicated in the report,
some faculties have done exceptionally well in both the overall success
rate and the success rate per course level. This is good news, even if we
are still not at our best performance (88.4% overall success rate in 2015).
Despite the improvement in the overall success rate, we continue to
be concerned about the metrics that indicate an achievement gap
between White and Black students, especially between White and
African students. The persistence of these gaps suggests that we have
not yet understood sufficiently what drives these differences and what
can be done to tackle them effectively. The Academic Advising Project
and the CIG Project seem to have come to similar conclusions: We need
to look at the organisation of the curriculum and the curriculum itself.
This includes teaching and learning practices, academic support and
“In relation to undergraduate degrees, it is important to note that the overall success rate in 2019 increased to 85.1%, from 84% in 2018, and that UCT continues to be among the top performers nationally on this score.”

146
UNIVERSITY OF CAPE TOWN | TEACHING & LEARNING REPORT 2019
monitoring systems, academic policies, as well as a range of student
support services, such as the Student Wellness Service.
In the past five years, the proportion of students admitted to UCT
with below 70% aggregate in the NSC examination has increased
to 20% of the FU. It will be necessary to determine whether there
is a relationship between the achievement gap and these figures,
and, even more importantly, to understand how these students are
supported once admitted at UCT and
what their trajectory is in relation to
graduation. The recent creation of the
Data Analytics for Student Success
project, together with the successful
bidding for UCT’s participation in
the Kresge Foundation Siyaphumelela
Programme on student success, are
important steps on the way to tackling
these issues effectively.
In the area of postgraduate education,
it is worth noting that UCT has almost reached its target of 40%
postgraduate enrolments. This is a positive trend that needs to be
sustained, while giving due consideration to the staff:student ratio in the
different degrees.
In general terms, the rate of conversion among three-year bachelor’s
graduates was seen to increase progressively between 2013 and 2016
(although there were pronounced differences across the faculties and
the various population groups), but the 2017 conversion rate slipped
back by two percentage points (from 40% in 2016 to 38% in 2017) and the
2018 and 2019 conversion rates dropped by a further percentage point
“In the area of postgraduate education, it is worth noting that UCT has almost reached its target of 40% postgraduate enrolments. This is a positive trend that needs to be sustained, while giving due consideration to the staff:student ratio in the different degrees.”

147
UNIVERSITY OF CAPE TOWN | TEACHING & LEARNING REPORT 2019
to 37%. Conversely, the conversion
rate for professional first bachelor’s
graduates increased from 10% in 2015
to 14% in 2019.
We have also seen a steady increase
in the conversion rate among African
three-year bachelor’s graduates between 2015 and 2017 (up from 30%
in 2015 to 37% in 2017), followed by a marked decline to 31–32% in 2018
and 2019. The conversion rates among Coloured and Indian graduates
dropped from 35% in 2018 to 31% in 2019, while the conversion rate
among White three-year bachelor’s graduates peaked at 47% in 2019.
Given the support provided, especially for Black students wanting to
pursue honours degrees, these results are disappointing and require
further investigation to identify the obstacles preventing students from
continuing to study at postgraduate level.
One persistent problem in the area of postgraduate education is the
time to completion at master’s and especially at the doctoral level. The
average time to completion among master’s graduates remained level
at 3.0 years in 2019. The time to degree among doctoral graduates
increased for the third consecutive year: up from 4.8 years in 2016 to
5.0 years in 2017, 5.3 years in 2018 and 5.7 years in 2019. In two of the
faculties, EBE and Humanities, the average time to degree among 2019
doctoral graduates was greater than six years (6.1 years). While these
figures are not outside what happens at other comparable South African
universities, it is necessary to understand the obstacles impeding
students graduating in a maximum of four years, since this has important
implications for supervisory capacity and state subsidy.
“Interventions, when put in place, take time to yield fruit, but in order to decide on interventions it is necessary to understand the problems we are dealing with.”

148
UNIVERSITY OF CAPE TOWN | TEACHING & LEARNING REPORT 2019
As can be seen, the problems we face do not change from year to year.
Interventions, when put in place, take time to yield fruit, but in order to
decide on interventions it is necessary to understand the problems we
are dealing with. During 2019 we have made progress in sourcing skills
and funds, and putting in place organisational arrangements to help us
tackle these problems systematically. The next three years will show
whether and to what extent we have been successful.

149
UNIVERSITY OF CAPE TOWN | TEACHING & LEARNING REPORT 2019
APPENDIXTOTAL, UNDUPLICATED STUDENT ENROLMENTS: 2015–2019 Table 1 Total undergraduate plus postgraduate headcount student enrolments: 2015–2019
Faculty 2015 2016 2017 2018 2019 Average annual change
Commerce 7295 7751 7144 6777 6554 -2,6%
26% 27% 25% 24% 23%
GSB 915 790 812 850 867 -1,3%
3% 3% 3% 3% 3%
EBE 4413 4673 4866 4939 4801 2,1%
16% 16% 17% 17% 17%
Health Sciences
4236 4572 4815 4940 4820 3,3%
15% 16% 17% 17% 17%
Humanities 7021 7158 6829 7110 7327 1,1%
25% 24% 24% 25% 26%
Law 1359 1462 1405 1265 1276 -1,6%
5% 5% 5% 4% 4%
Science 2570 2826 2853 2863 2996 3,9%
9% 10% 10% 10% 10%
TOTAL 27809 29232 28724 28744 28641 0,7%
100% 100% 100% 100% 100%
Percentages should be read down each column. Notes: 1. In a headcount total, students are counted as units even if they are part-time students taking less than a full-time
curriculum.2. The 2015–2019 headcount totals shown were extracted from the HEMIS Sub 3 student tables for each year. Unique,
unduplicated headcounts were extracted using the derived headcount enrolment data element 589. 3. A faculty’s headcount total is the total of students enrolled for the various degrees, diplomas and certificates.

150
UNIVERSITY OF CAPE TOWN | TEACHING & LEARNING REPORT 2019
Table 2 Undergraduate student enrolments: 2015–2019
Faculty 2015 2016 2017 2018 2019 Average annual change
Commerce 5308 5438 5037 4516 4303 -5,1%
30% 30% 28% 26% 25%
GSB 0 0 0 0 0
0% 0% 0% 0% 0%
EBE 2997 3191 3275 3321 3293 2,4%
17% 17% 18% 19% 19%
Health Sciences 2110 2208 2318 2259 2149 0,5%
12% 12% 13% 13% 12%
Humanities 5134 5171 4898 5048 5197 0,3%
29% 28% 27% 29% 30%
Law 696 717 688 660 669 -1,0%
4% 4% 4% 4% 4%
Science 1478 1688 1656 1690 1709 3,7%
8% 9% 9% 10% 10%
TOTAL 17723 18413 17872 17494 17 320 -0,6%
100% 100% 100% 100% 100%
Percentages should be read down each column.
Table 3 Postgraduate student enrolments: 2015–2019
Faculty 2015 2016 2017 2018 2019 Average annual change
Commerce 1987 2313 2107 2261 2251 3,2%
20% 21% 19% 20% 20%
GSB 915 790 812 850 867 -1,3%
9% 7% 7% 8% 8%
EBE 1416 1482 1591 1618 1508 1,6%
14% 14% 15% 14% 13%
Health Sciences 2126 2364 2497 2681 2671 5,9%
21% 22% 23% 24% 24%
Humanities 1887 1987 1931 2062 2130 3,1%
19% 18% 18% 18% 19%
Law 663 745 717 605 607 -2,2%
7% 7% 7% 5% 5%
Science 1092 1138 1197 1173 1287 4,2%
11% 11% 11% 10% 11%
TOTAL 10086 10819 10852 11250 11321 2,9%
100% 100% 100% 100% 100%
Percentages should be read down each column.
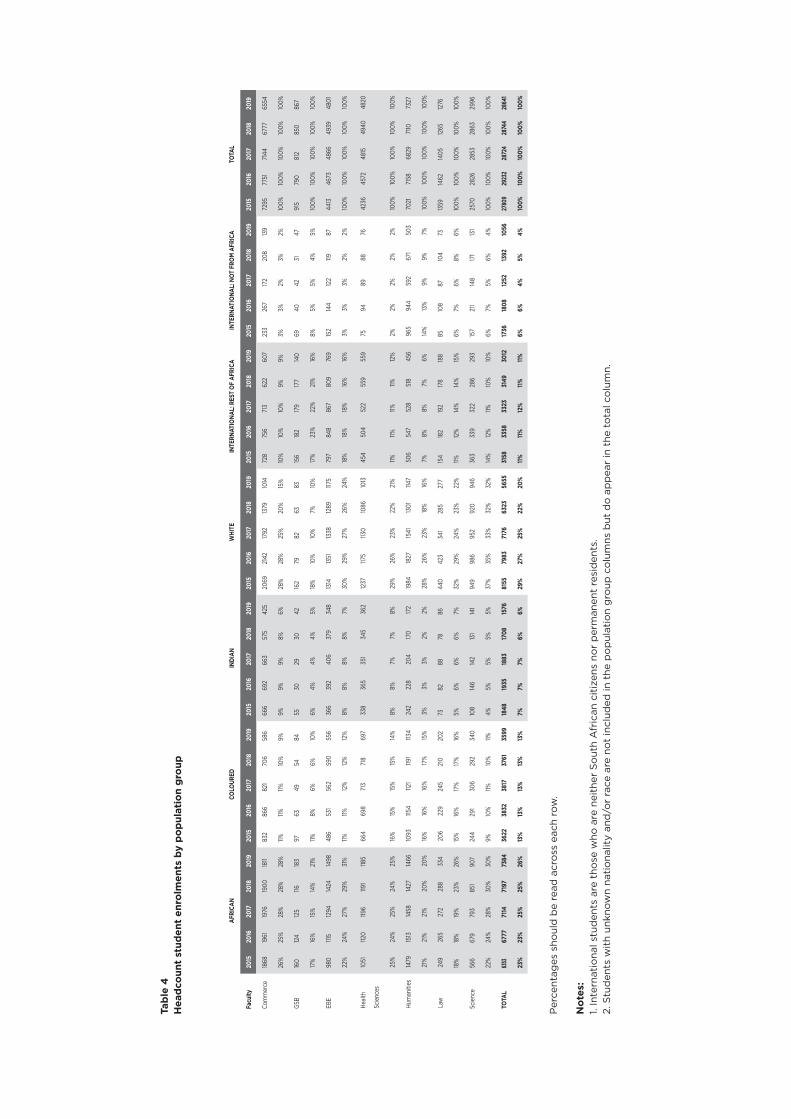
Tab
le 4
Hea
dco
unt
stud
ent
enro
lmen
ts b
y p
opul
atio
n g
roup
Facu
lty20
1520
1620
1720
1820
1920
1520
1620
1720
1820
1920
1520
1620
1720
1820
1920
1520
1620
1720
1820
1920
1520
1620
1720
1820
1920
1520
1620
1720
1820
1920
1520
1620
1720
1820
19
Com
mer
ce18
6819
6119
7619
0018
1183
286
682
170
658
666
669
266
357
542
520
6921
4217
9213
7910
1472
875
671
362
260
723
326
717
220
813
972
9577
5171
4467
7765
54
26%
25%
28%
28%
28%
11%11%
11%10
%9%
9%9%
9%8%
6%28
%28
%25
%20
%15
%10
%10
%10
%9%
9%3%
3%2%
3%2%
100%
100%
100%
100%
100%
GSB
160
124
125
11618
397
6349
5484
5530
2930
4216
279
8263
8315
618
217
917
714
069
4042
3147
915
790
812
850
867
17%
16%
15%
14%
21%
11%8%
6%6%
10%
6%4%
4%4%
5%18
%10
%10
%7%
10%
17%
23%
22%
21%
16%
8%5%
5%4%
5%10
0%10
0%10
0%10
0%10
0%
EBE
980
1115
1294
1424
1498
486
531
562
590
556
366
392
406
379
348
1314
1351
1338
1289
1175
797
848
867
809
769
152
144
122
11987
4413
4673
4866
4939
4801
22%
24%
27%
29%
31%
11%11%
12%
12%
12%
8%8%
8%8%
7%30
%29
%27
%26
%24
%18
%18
%18
%16
%16
%3%
3%3%
2%2%
100%
100%
100%
100%
100%
Heal
th
Scie
nces
1051
1120
1196
1191
1185
664
698
713
718
697
338
365
351
345
362
1237
1175
1130
1086
1013
454
504
522
559
559
7594
8988
7642
3645
7248
1549
4048
20
25%
24%
25%
24%
25%
16%
15%
15%
15%
14%
8%8%
7%7%
8%29
%26
%23
%22
%21
%11%
11%11%
11%12
%2%
2%2%
2%2%
100%
100%
100%
100%
100%
Hum
aniti
es14
7915
1314
5814
2714
6610
93115
4112
1119
1113
424
222
820
417
017
219
8418
2715
4113
01114
750
654
752
851
845
696
594
459
267
150
370
2171
5868
2971
1073
27
21%
21%
21%
20%
20%
16%
16%
16%
17%
15%
3%3%
3%2%
2%28
%26
%23
%18
%16
%7%
8%8%
7%6%
14%
13%
9%9%
7%10
0%10
0%10
0%10
0%10
0%
Law
249
265
272
288
334
206
229
245
210
202
7382
8878
8644
042
334
128
527
715
418
219
217
818
885
108
8710
473
1359
1462
1405
1265
1276
18%
18%
19%
23%
26%
15%
16%
17%
17%
16%
5%6%
6%6%
7%32
%29
%24
%23
%22
%11%
12%
14%
14%
15%
6%7%
6%8%
6%10
0%10
0%10
0%10
0%10
0%
Scie
nce
566
679
793
851
907
244
291
306
292
340
108
146
142
131
141
949
986
952
920
946
363
339
322
286
293
157
211
148
171
131
2570
2826
2853
2863
2996
22%
24%
28%
30%
30%
9%10
%11%
10%
11%4%
5%5%
5%5%
37%
35%
33%
32%
32%
14%
12%
11%10
%10
%6%
7%5%
6%4%
100%
100%
100%
100%
100%
TOTA
L63
5367
7771
1471
9773
8436
2238
3238
1737
6135
9918
4819
3518
8317
0815
7681
5579
8371
7663
2356
5531
5833
5833
2331
4930
1217
3618
0812
5213
9210
5627
809
2923
228
724
2874
428
641
23%
23%
25%
25%
26%
13%
13%
13%
13%
13%
7%7%
7%6%
6%29
%27
%25
%22
%20
%11%
11%12
%11%
11%6%
6%4%
5%4%
100%
100%
100%
100%
100%
Per
cent
ages
sho
uld
be
read
acr
oss
eac
h ro
w.
Not
es:
1. In
tern
atio
nal s
tud
ents
are
tho
se w
ho a
re n
eith
er S
out
h A
fric
an c
itiz
ens
nor
per
man
ent
resi
den
ts.
2. S
tud
ents
wit
h un
know
n na
tio
nalit
y an
d/o
r ra
ce a
re n
ot
incl
uded
in t
he p
op
ulat
ion
gro
up c
olu
mns
but
do
ap
pea
r in
the
to
tal c
olu
mn.
AFRI
CAN
COLO
URED
INDI
ANW
HITE
INTE
RNAT
IONA
L: R
EST
OF
AFRI
CAIN
TERN
ATIO
NAL:
NOT
FRO
M A
FRIC
ATO
TAL

Tab
le 5
Und
erg
rad
uate
stu
den
t en
rolm
ents
by
pop
ulat
ion
gro
up
Facu
lty20
1520
1620
1720
1820
1920
1520
1620
1720
1820
1920
1520
1620
1720
1820
1920
1520
1620
1720
1820
1920
1520
1620
1720
1820
1920
1520
1620
1720
1820
1920
1520
1620
1720
1820
19
Com
mer
ce14
6814
4914
5613
4612
5662
263
460
347
935
453
955
852
442
529
314
9015
3313
1290
357
341
543
839
630
728
518
416
5116
123
9453
0854
3850
3745
1643
03
28%
27%
29%
30%
29%
12%
12%
12%
11%8%
10%
10%
10%
9%7%
28%
28%
26%
20%
13%
8%8%
8%7%
7%3%
3%2%
3%2%
100%
100%
100%
100%
100%
GSB
00
00
00
00
00
00
00
00
00
00
00
00
00
00
00
00
00
0
0%0%
0%0%
0%0%
0%0%
0%0%
0%0%
0%0%
0%0%
0%0%
0%0%
0%0%
0%0%
0%0%
0%0%
0%0%
0%0%
0%0%
0%
EBE
755
822
900
1010
1102
332
363
398
422
407
290
316
334
299
265
895
905
879
855
818
486
528
521
472
443
9178
6964
4229
9731
9132
7533
2132
93
25%
26%
27%
30%
33%
11%11%
12%
13%
12%
10%
10%
10%
9%8%
30%
28%
27%
26%
25%
16%
17%
16%
14%
13%
3%2%
2%2%
1%10
0%10
0%10
0%10
0%10
0%
Heal
th
Scie
nces
812
850
896
883
835
466
498
508
497
463
189
206
193
196
199
550
528
537
514
458
3025
1918
131
10
021
1022
0823
1822
5921
49
38%
38%
39%
39%
39%
22%
23%
22%
22%
22%
9%9%
8%9%
9%26
%24
%23
%23
%21
%1%
1%1%
1%1%
0%0%
0%0%
0%10
0%10
0%10
0%10
0%10
0%
Hum
aniti
es12
3312
28115
410
9710
8487
390
386
792
487
916
815
713
210
410
713
28117
710
1982
070
429
931
029
827
020
680
977
342
950
035
151
3451
7148
9850
4851
97
24%
24%
24%
22%
21%
17%
17%
18%
18%
17%
3%3%
3%2%
2%26
%23
%21
%16
%14
%6%
6%6%
5%4%
16%
15%
9%10
%7%
100%
100%
100%
100%
100%
Law
161
174
178
193
209
11213
515
114
713
053
5252
5762
270
247
212
177
163
4648
4641
5330
2116
1511
696
717
688
660
669
23%
24%
26%
29%
31%
16%
19%
22%
22%
19%
8%7%
8%9%
9%39
%34
%31
%27
%24
%7%
7%7%
6%8%
4%3%
2%2%
2%10
0%10
0%10
0%10
0%10
0%
Scie
nce
411
502
570
642
670
163
200
214
200
227
6195
9684
7653
858
453
751
350
613
910
485
7377
75119
6393
5614
7816
8816
5616
9017
09
28%
30%
34%
38%
39%
11%12
%13
%12
%13
%4%
6%6%
5%4%
36%
35%
32%
30%
30%
9%6%
5%4%
5%5%
7%4%
6%3%
100%
100%
100%
100%
100%
TOTA
L48
4050
2551
5451
7151
5625
6827
3327
4126
6924
6013
0013
8413
31116
510
0250
7149
7444
9637
8232
2214
1514
5313
65118
110
77119
0115
769
379
555
417
723
1841
317
872
17494
1732
0
27%
27%
29%
30%
30%
14%
15%
15%
15%
14%
7%8%
7%7%
6%29
%27
%25
%22
%19
%8%
8%8%
7%6%
7%6%
4%5%
3%10
0%10
0%10
0%10
0%10
0%
Per
cent
ages
sho
uld
be
read
acr
oss
eac
h ro
w.
No
te: S
tud
ents
wit
h un
know
n na
tio
nalit
y an
d/o
r ra
ce a
re n
ot
incl
uded
in t
he p
op
ulat
ion
gro
up c
olu
mns
but
do
ap
pea
r in
the
to
tal c
olu
mn.
AFRI
CAN
COLO
URED
INDI
ANW
HITE
INTE
RNAT
IONA
L: R
EST
OF
AFRI
CAIN
TERN
ATIO
NAL:
NOT
FRO
M A
FRIC
ATO
TAL

Tab
le 6
Post
gra
dua
te s
tud
ent
enro
lmen
ts b
y p
opul
atio
n g
roup
Facu
lty20
1520
1620
1720
1820
1920
1520
1620
1720
1820
1920
1520
1620
1720
1820
1920
1520
1620
1720
1820
1920
1520
1620
1720
1820
1920
1520
1620
1720
1820
1920
1520
1620
1720
1820
19
Com
mer
ce40
051
252
055
455
521
023
221
822
723
212
713
413
915
013
257
960
948
047
644
131
331
831
731
532
249
102
5685
4319
8723
1321
0722
6122
51
20%
22%
25%
25%
25%
11%10
%10
%10
%10
%6%
6%7%
7%6%
29%
26%
23%
21%
20%
16%
14%
15%
14%
14%
2%4%
3%4%
2%10
0%10
0%10
0%10
0%10
0%
GSB
160
124
125
11618
397
6349
5484
5530
2930
4216
279
8263
8315
618
217
917
714
069
4042
3147
915
790
812
850
867
17%
16%
15%
14%
21%
11%8%
6%6%
10%
6%4%
4%4%
5%18
%10
%10
%7%
10%
17%
23%
22%
21%
16%
8%5%
5%4%
5%10
0%10
0%10
0%10
0%10
0%
EBE
225
293
394
414
396
154
168
164
168
149
7676
7280
8341
944
645
943
435
731
132
034
633
732
661
6653
5543
1416
1482
1591
1618
1508
16%
20%
25%
26%
26%
11%11%
10%
10%
10%
5%5%
5%5%
6%30
%30
%29
%27
%24
%22
%22
%22
%21
%22
%4%
4%3%
3%3%
100%
100%
100%
100%
100%
Heal
th
Scie
nces
239
270
300
308
350
198
200
205
221
234
149
159
158
149
163
687
647
593
572
555
424
479
503
541
546
7493
8988
7621
2623
6424
9726
8126
71
11%11%
12%
11%13
%9%
8%8%
8%9%
7%7%
6%6%
6%32
%27
%24
%21
%21
%20
%20
%20
%20
%20
%3%
4%4%
3%3%
100%
100%
100%
100%
100%
Hum
aniti
es24
628
530
433
038
222
025
125
426
725
574
7172
6665
656
650
522
481
443
207
237
230
248
250
156
171
163
171
148
1887
1987
1931
2062
2130
13%
14%
16%
16%
18%
12%
13%
13%
13%
12%
4%4%
4%3%
3%35
%33
%27
%23
%21
%11%
12%
12%
12%
12%
8%9%
8%8%
7%10
0%10
0%10
0%10
0%10
0%
Law
8891
9495
125
9494
9463
7220
3036
2124
170
176
129
108
11410
813
414
613
713
555
8771
8963
663
745
717
605
607
13%
12%
13%
16%
21%
14%
13%
13%
10%
12%
3%4%
5%3%
4%26
%24
%18
%18
%19
%16
%18
%20
%23
%22
%8%
12%
10%
15%
10%
100%
100%
100%
100%
100%
Scie
nce
155
177
223
209
237
8191
9292
11347
5146
4765
411
402
415
407
440
224
235
237
213
216
8292
8578
7510
92113
8119
7117
312
87
14%
16%
19%
18%
18%
7%8%
8%8%
9%4%
4%4%
4%5%
38%
35%
35%
35%
34%
21%
21%
20%
18%
17%
8%8%
7%7%
6%10
0%10
0%10
0%10
0%10
0%
TOTA
L15
1317
5219
6020
2622
2810
5410
9910
7610
9211
3954
855
155
254
357
430
8430
0926
8025
4124
3317
4319
0519
5819
6819
3554
665
155
959
749
510
086
1081
910
852
11250
11321
15%
16%
18%
18%
20%
10%
10%
10%
10%
10%
5%5%
5%5%
5%31
%28
%25
%23
%21
%17
%18
%18
%17
%17
%5%
6%5%
5%4%
100%
100%
100%
100%
100%
Per
cent
ages
sho
uld
be
read
acr
oss
eac
h ro
w.
N
ote:
Stu
den
ts w
ith
unkn
own
nati
ona
lity
and
/or
race
are
no
t in
clud
ed in
the
po
pul
atio
n g
roup
co
lum
ns b
ut d
o a
pp
ear
in t
he t
ota
l co
lum
n.
AFRI
CAN
COLO
URED
INDI
ANW
HITE
INTE
RNAT
IONA
L: R
EST
OF
AFRI
CAIN
TERN
ATIO
NAL:
NOT
FRO
M A
FRIC
ATO
TAL

154
UNIVERSITY OF CAPE TOWN | TEACHING & LEARNING REPORT 2019
“A” AGGREGATE “B” AGGREGATE “C” AGGREGATE “D” AGGREGATE
Faculty 2015 2016 2017 2018 2019 2015 2016 2017 2018 2019 2015 2016 2017 2018 2019 2015 2016 2017 2018 2019
Commerce 45% 47% 47% 46% 41% 40% 42% 42% 44% 49% 4% 0% 0% 0% 4% 0% 0% 0% 0% 0%
EBE 45% 41% 47% 44% 45% 28% 32% 31% 35% 33% 4% 8% 6% 6% 8% 1% 0% 0% 1% 2%
Health
Sciences
55% 57% 56% 70% 64% 27% 30% 29% 21% 27% 15% 8% 12% 5% 8% 0% 0% 0% 0% 0%
Humanities 17% 15% 16% 15% 12% 33% 36% 36% 36% 36% 27% 33% 33% 37% 39% 1% 0% 2% 2% 3%
Law 31% 34% 29% 16% 52% 53% 58% 58% 63% 24% 0% 0% 0% 2% 6% 0% 0% 0% 0% 0%
Science 50% 46% 43% 46% 52% 39% 42% 44% 42% 37% 1% 6% 5% 3% 2% 0% 0% 0% 0% 0%
TOTAL 1570 1588 1513 1414 1395 1451 1592 1510 1429 1555 485 536 529 512 717 29 5 24 31 64
38% 37% 38% 38% 34% 35% 37% 37% 38% 38% 12% 13% 13% 14% 18% 1% 0% 1% 1% 2%
Table 7NSC/SC aggregate equivalents of all first-time entering undergraduates
Faculty 2015 2016 2017 2018 2019 2015 2016 2017 2018 2019 2015 2016 2017 2018 2019
Commerce 0% 0% 0% 0% 0% 11% 11% 11% 9% 6% 1320 1068 1068 1007 1045
EBE 0% 0% 0% 0% 0% 22% 19% 16% 14% 12% 676 734 734 736 597
Health
Sciences
0% 1% 0% 0% 0% 3% 5% 3% 4% 1% 427 434 434 333 358
Humanities 1% 2% 1% 1% 1% 21% 13% 13% 9% 9% 1237 1239 1239 1193 1514
Law 0% 0% 0% 0% 0% 16% 8% 13% 19% 19% 74 79 79 63 54
Science 0% 0% 0% 0% 0% 10% 6% 7% 8% 9% 427 479 479 429 512
TOTAL 14 35 13 9 18 612 508 444 366 331 4161 4264 4033 3761 4080
0% 1% 0% 0% 0% 15% 12% 11% 10% 8% 100% 100% 100% 100% 100%
Percentages should be read across each row. Notes: 1. The calculation of aggregate equivalents of NSC writers is as follows:
NSC Raw points
Aggregate equivalent
>=480 A
420 - 479 B
360 - 419 C
300 - 359 D
299 and < E 2. Most of those with aggregates shown as “not known” are foreign students. 3. The data is extracted from PeopleSoft early in the academic year.
“E” AGGREGATE NOT KNOWN TOTAL

155
UNIVERSITY OF CAPE TOWN | TEACHING & LEARNING REPORT 2019
Faculty 2015 2016 2017 2018 2019 2015 2016 2017 2018 2019
CHED 64 63 61 59 57 6% 6% 6% 6% 5%
Commerce 123 122 127 139 140 12% 12% 13% 14% 13%
GSB 22 24 23 20 27 2% 2% 2% 2% 3%
EBE 126 132 133 128 123 13% 13% 13% 13% 12%
Health Sciences 188 194 189 192 237 19% 19% 19% 19% 22%
Humanities 239 234 228 225 244 24% 23% 23% 23% 23%
Law 54 56 57 55 59 5% 6% 6% 6% 6%
Science 182 180 186 179 176 18% 18% 19% 18% 17%
TOTAL 998 1005 1004 997 1063 100% 100% 100% 100% 100%
Percentages should be read down each column. Notes: 1. The different academic staff rankings have not been graded in these calculations: all full-time posts have been given a unit
value of 1. 2. Vacant posts have not been included in these calculations. 3. All permanent staff and T3 staff in the teaching ranks have been included in these figures. 4. Both GOB- and non-GOB-funded staff have been included. 5. Joint medical staff on provincial conditions of service have not been included in these tables. 6. The data is based on full-time instruction/research staff reflected in the annual HEMIS submissions.
Table 8B Full-time equivalent student to full-time academic staff ratios: 2015–2019
Faculty 2015 2016 2017 2018 2019 2015 2016 2017 2018 2019 2015 2016 2017 2018 2019
Commerce 7001 7510 7410 7193 6981 123 122 127 139 140 56,9 61,6 58,3 51,8 49,9
GSB 1216 1372 1289 1427 1323 22 24 23 20 27 55,3 57,2 56,0 71,3 49,0
EBE 4022 3862 3921 4235 4133 126 132 133 128 123 31,9 29,3 29,5 33,1 33,6
Health Sciences
5222 5616 6035 6232 6113 188 194 189 192 237 27,8 28,9 31,9 32,5 25,8
Humanities 7001 7278 7167 7408 7717 239 234 228 225 244 29,3 31,1 31,4 32,9 31,6
Law 2054 2277 2214 2015 2037 54 56 57 55 59 38,0 40,7 38,8 36,6 34,5
Science 4724 5397 5408 5147 5215 182 180 186 179 176 26,0 30,0 29,1 28,8 29,6
TOTAL 31240 33311 33443 33657 33521 998 1005 1004 997 1063 31,3 33,1 33,3 33,8 31,5
Note: CHED has been excluded from the detail of this table because it does not enrol students. The full-time academic staff are nevertheless included in the total line.
Table 8AFull-time academic staff in each faculty: 2015–2019
FULL-TIME ACADEMIC STAFF % OF TOTAL FULL-TIME ACADEMIC STAFF
WT. FTE ENROLLED STUDENTS FULL-TIME ACADEMIC STAFF RATIO FTE ENR STUDENTS TO FT ACADEMIC STAFF

156
UNIVERSITY OF CAPE TOWN | TEACHING & LEARNING REPORT 2019
Table 9Academic staff by highest formal qualification
Faculty 2015 2016 2017 2018 2019 2015 2016 2017 2018 2019 2015 2016 2017 2018 2019
CHED 55% 56% 56% 56% 51% 38% 38% 38% 37% 42% 6% 5% 5% 5% 5%
Commerce 52% 48% 47% 45% 46% 33% 33% 34% 33% 33% 7% 8% 7% 6% 5%
GSB 86% 83% 87% 90% 78% 9% 13% 9% 5% 19% 5% 4% 4% 5% 4%
EBE 68% 66% 65% 67% 63% 27% 30% 29% 27% 29% 2% 2% 2% 2% 2%
Health Sciences
68% 69% 70% 66% 56% 26% 25% 24% 25% 31% 0% 1% 1% 2% 5%
Humanities 76% 76% 74% 72% 66% 21% 21% 22% 24% 27% 1% 1% 2% 2% 3%
Law 52% 50% 51% 47% 44% 44% 46% 47% 51% 51% 2% 2% 2% 2% 2%
Science 93% 92% 90% 90% 89% 6% 7% 9% 9% 9% 1% 1% 1% 1% 1%
TOTAL 710 705 698 674 669 235 244 247 250 297 20 21 23 26 37
71% 70% 70% 68% 63% 24% 24% 25% 25% 28% 2% 3% 2% 3% 3%
Faculty 2015 2016 2017 2018 2019 2015 2016 2017 2018 2019 2015 2016 2017 2018 2019
CHED 2% 2% 2% 2% 2% 0% 0% 0% 0% 0% 64 63 61 59 57
Commerce 8% 11% 12% 16% 16% 0% 0% 0% 0% 0% 123 119 127 139 140
GSB 0% 0% 0% 0% 0% 0% 0% 0% 0% 0% 22 24 23 20 27
EBE 3% 3% 3% 3% 5% 0% 0% 0% 0% 0% 126 145 133 128 123
Health Sciences
6% 4% 4% 5% 6% 0% 2% 2% 2% 2% 188 188 189 192 237
Humanities 2% 1% 1% 2% 3% 0% 1% 1% 1% 0% 239 239 228 225 244
Law 2% 2% 0% 0% 3% 0% 0% 0% 0% 0% 54 55 57 55 59
Science 1% 1% 1% 1% 1% 0% 0% 0% 0% 0% 182 182 186 179 176
TOTAL 33 30 31 41 55 0 5 5 6 5 998 1005 1004 997 1063
3% 3% 3% 4% 5% 0% 0% 0% 1% 0% 100% 100% 100% 100% 100%
Percentages should be read across each row.
DOCTORS MASTER’S HONOURS
BELOW HONOURS UNKNOWN TOTAL

157
UNIVERSITY OF CAPE TOWN | TEACHING & LEARNING REPORT 2019
Table 10Academic staff by rank
Faculty 2015 2016 2017 2018 2019 2015 2016 2017 2018 2019 2015 2016 2017 2018 2019
CHED 0% 0% 0% 2% 2% 17% 16% 18% 17% 14% 36% 35% 48% 47% 44%
Commerce 14% 12% 19% 14% 16% 27% 25% 26% 24% 22% 33% 33% 26% 26% 24%
GSB 27% 21% 17% 15% 19% 23% 21% 30% 40% 37% 45% 38% 30% 20% 26%
EBE 21% 22% 25% 24% 21% 25% 23% 24% 27% 25% 37% 36% 34% 36% 36%
Health Sciences
29% 27% 37% 37% 27% 20% 20% 18% 18% 16% 29% 28% 31% 29% 33%
Humanities 16% 18% 17% 16% 14% 24% 24% 29% 32% 28% 30% 29% 31% 29% 26%
Law 33% 32% 39% 31% 24% 13% 13% 19% 25% 25% 24% 25% 25% 18% 24%
Science 23% 20% 24% 23% 22% 24% 23% 25% 26% 23% 25% 24% 28% 27% 27%
TOTAL 202 197 234 221 206 226 218 239 254 241 306 301 309 294 312
20% 20% 23% 22% 19% 23% 22% 24% 25% 23% 31% 30% 31% 29% 29%
Faculty 2015 2016 2017 2018 2019 2015 2016 2017 2018 2019 2015 2016 2017 2018 2019
CHED 47% 49% 34% 34% 40% 0% 0% 0% 0% 0% 64 63 61 59 57
Commerce 25% 29% 29% 35% 37% 1% 2% 0% 0% 1% 123 122 127 139 140
GSB 5% 21% 22% 25% 19% 0% 0% 0% 0% 0% 22 24 23 20 27
EBE 17% 19% 17% 13% 16% 0% 0% 0% 0% 2% 126 132 133 128 123
Health Sciences
22% 24% 14% 15% 23% 0% 1% 1% 1% 1% 188 194 189 192 237
Humanities 29% 29% 24% 22% 31% 0% 0% 0% 0% 1% 239 234 228 225 244
Law 30% 30% 18% 25% 27% 0% 0% 0% 0% 0% 54 56 57 55 59
Science 27% 31% 24% 23% 27% 1% 2% 0% 0% 1% 182 180 186 179 176
TOTAL 261 283 221 226 295 3 6 1 2 9 998 1005 1004 997 1063
26% 28% 22% 23% 28% 1% 1% 0% 0% 1% 100% 100% 100% 100% 100%
Percentages should be read across each row.
PROFESSOR ASSOCIATE PROFESSOR SENIOR LECTURER
LECTURER ASSISTANT/JUNIOR LECTURER TOTAL

158
UNIVERSITY OF CAPE TOWN | TEACHING & LEARNING REPORT 2019
<35 YEARS 35–39 YEARS 40–44 YEARS 45–49 YEARS
Table 11AAcademic staff by age group
Faculty 2015 2016 2017 2018 2019 2015 2016 2017 2018 2019 2015 2016 2017 2018 2019 2015 2016 2017 2018 2019
CHED 11% 8% 8% 10% 2% 8% 10% 15% 10% 19% 17% 19% 10% 14% 16% 19% 16% 18% 17% 11%
Commerce 20% 24% 24% 27% 26% 19% 14% 19% 21% 18% 19% 17% 12% 10% 14% 15% 15% 16% 16% 16%
GSB 5% 17% 13% 10% 7% 14% 4% 4% 15% 15% 27% 29% 13% 10% 7% 14% 17% 30% 25% 33%
EBE 9% 9% 8% 8% 9% 12% 13% 12% 15% 15% 17% 15% 16% 13% 11% 25% 26% 26% 20% 18%
Health
Sciences
4% 5% 6% 7% 9% 9% 11% 11% 11% 10% 18% 15% 13% 11% 15% 14% 16% 15% 19% 19%
Humanities 8% 7% 7% 9% 8% 8% 9% 11% 9% 13% 15% 12% 13% 14% 12% 18% 20% 19% 20% 17%
Law 26% 25% 21% 27% 22% 17% 14% 14% 15% 20% 13% 13% 11% 9% 10% 17% 20% 19% 18% 19%
Science 11% 9% 11% 8% 10% 16% 17% 15% 14% 11% 18% 15% 14% 16% 19% 13% 17% 16% 20% 18%
TOTAL 104 106 110 119 122 119 123 130 131 146 172 151 130 126 148 169 185 185 188 186
10% 11% 11% 12% 11% 12% 12% 13% 13% 14% 17% 15% 13% 13% 14% 17% 18% 18% 19% 17%
50–54 YEARS 55+ YEARS UNKNOWN TOTAL
Faculty 2015 2016 2017 2018 2019 2015 2016 2017 2018 2019 2015 2016 2017 2018 2019 2015 2016 2017 2018 2019
CHED 16% 13% 11% 14% 18% 31% 35% 38% 36% 35% 0% 0% 0% 0% 0% 64 63 61 59 57
Commerce 8% 11% 11% 11% 11% 20% 20% 19% 15% 16% 1% 0% 0% 0% 0% 123 122 127 139 140
GSB 18% 17% 22% 20% 11% 23% 17% 17% 20% 26% 0% 0% 0% 0% 0% 22 24 23 20 27
EBE 13% 17% 14% 20% 22% 23% 20% 25% 26% 25% 1% 0% 0% 0% 0% 126 132 133 128 123
Health
Sciences
23% 20% 19% 14% 16% 32% 33% 37% 38% 31% 2% 0% 0% 0% 0% 188 194 189 192 237
Humanities 14% 14% 17% 16% 18% 37% 38% 34% 32% 33% 2% 0% 0% 0% 0% 239 234 228 225 244
Law 9% 9% 12% 9% 10% 19% 20% 23% 22% 19% 0% 0% 0% 0% 0% 54 56 57 55 59
Science 13% 13% 11% 9% 12% 30% 29% 33% 33% 30% 1% 0% 0% 0% 0% 182 180 186 179 176
TOTAL 147 147 144 137 163 287 293 305 296 298 13 0 0 0 0 998 1005 1004 997 1063
15% 15% 14% 14% 15% 29% 29% 30% 30% 28% 1% 0% 0% 0% 0% 100% 100% 100% 100% 100%
Percentages should be read across each row.

159
UNIVERSITY OF CAPE TOWN | TEACHING & LEARNING REPORT 2019
AFRICAN COLOURED INDIAN WHITE
Table 11BAcademic staff by race
Faculty 2015 2016 2017 2018 2019 2015 2016 2017 2018 2019 2015 2016 2017 2018 2019 2015 2016 2017 2018 2019
CHED 6% 6% 7% 12% 12% 13% 13% 11% 14% 14% 6% 6% 8% 10% 12% 58% 56% 57% 54% 49%
Commerce 3% 6% 7% 14% 14% 8% 9% 11% 14% 15% 7% 7% 6% 9% 11% 56% 53% 50% 45% 43%
GSB 14% 17% 22% 35% 33% 14% 13% 13% 15% 11% 9% 8% 9% 10% 7% 32% 29% 22% 15% 30%
EBE 3% 5% 5% 10% 11% 7% 7% 8% 7% 9% 3% 5% 4% 4% 3% 48% 46% 47% 46% 46%
Health
Sciences
7% 8% 10% 11% 10% 15% 18% 17% 18% 23% 11% 11% 9% 10% 7% 51% 47% 47% 48% 47%
Humanities 10% 11% 14% 18% 20% 10% 12% 13% 14% 15% 5% 5% 7% 7% 7% 43% 42% 38% 35% 35%
Law 4% 7% 7% 13% 14% 13% 13% 12% 15% 15% 13% 13% 12% 13% 14% 61% 59% 58% 51% 51%
Science 3% 4% 5% 8% 7% 7% 7% 7% 8% 10% 5% 6% 8% 8% 8% 46% 44% 44% 42% 41%
TOTAL 57 74 87 131 142 103 111 115 128 161 67 72 73 80 83 489 471 455 431 451
6% 7% 9% 13% 13% 10% 11% 11% 13% 15% 7% 7% 7% 8% 8% 49% 47% 45% 43% 42%
INTERNATIONAL UNKNOWN TOTAL
Faculty 2015 2016 2017 2018 2019 2015 2016 2017 2018 2019 2015 2016 2017 2018 2019
CHED 17% 19% 16% 10% 12% 17% 0% 0% 0% 0% 64 63 61 59 57
Commerce 25% 24% 24% 15% 16% 25% 2% 2% 2% 1% 123 122 127 139 140
GSB 32% 33% 35% 25% 19% 32% 0% 0% 0% 0% 22 24 23 20 27
EBE 37% 36% 36% 32% 29% 37% 1% 1% 1% 2% 126 132 133 128 123
Health
Sciences
14% 14% 14% 11% 11% 14% 2% 3% 2% 1% 188 194 189 192 237
Humanities 30% 28% 27% 24% 22% 30% 2% 2% 3% 2% 239 234 228 225 244
Law 9% 9% 11% 9% 7% 9% 0% 0% 0% 0% 54 56 57 55 59
Science 38% 37% 35% 33% 32% 38% 2% 2% 1% 1% 182 180 186 179 176
TOTAL 268 262 256 212 211 12 15 18 15 15 998 1005 1004 997 1063
27% 26% 26% 21% 20% 1% 1% 2% 2% 1% 100% 100% 100% 100% 100%
Percentages should be read across each row.
MALE FEMALE TOTAL
Faculty 2015 2016 2017 2018 2019 2015 2016 2017 2018 2019 2015 2016 2017 2018 2019
CHED 41% 37% 36% 37% 39% 59% 63% 64% 63% 61% 64 63 61 59 57
Commerce 67% 68% 66% 61% 59% 33% 32% 34% 39% 41% 123 122 127 139 140
GSB 70% 68% 70% 70% 67% 30% 32% 30% 30% 33% 22 24 23 20 27
EBE 72% 73% 68% 68% 67% 28% 27% 32% 32% 33% 126 132 133 128 123
Health
Sciences
41% 42% 42% 40% 35% 59% 58% 58% 60% 65% 188 194 189 192 237
Humanities 56% 55% 53% 52% 50% 44% 45% 47% 48% 50% 239 234 228 225 244
Law 32% 36% 39% 42% 36% 68% 64% 61% 58% 64% 54 56 57 55 59
Science 71% 71% 71% 71% 68% 29% 29% 29% 29% 32% 182 180 186 179 176
TOTAL 549 570 566 553 550 406 418 438 444 513 998 1005 1004 997 1063
57% 58% 56% 55% 52% 43% 42% 44% 45% 48% 100% 100% 100% 100% 100%
Percentages should be read across each row.
Table 11CAcademic staff by gender

Tab
le 1
2H
ead
coun
t st
uden
t en
rolm
ents
by
form
al q
ualifi
cati
on
Facu
lty20
1520
1620
1720
1820
1920
1520
1620
1720
1820
1920
1520
1620
1720
1820
1920
1520
1620
1720
1820
1920
1520
1620
1720
1820
19
Com
mer
ce19
322
413
416
313
04
2953
930
64
08
2097
210
821
1420
6720
44
260
826
43
250
623
03
214
89
4793
878
576
374
2
3%3%
2%2%
2%6
%7%
4%
1%0
%29
%27
%30
%31
%31
%36
%34
%35
%34
%33
%13
%12
%11
%11
%11
%
GSB
46
016
04
00
00
00
00
00
00
00
00
276
229
187
260
246
5%0
%2%
0%
5%0
%0
%0
%0
%0
%0
%0
%0
%0
%0
%0
%0
%0
%0
%0
%30
%29
%23
%31
%29
%
EBE
96
816
56
533
00
052
659
46
03
611
635
240
925
5226
3626
7326
344
038
1617
13
2%2%
1%1%
1%0
%0
%0
%0
%0
%12
%13
%12
%12
%13
%55
%55
%54
%54
%55
%1%
1%0
%0
%0
%
Heal
th
Scie
nces
6177
7677
7923
45
5339
50
44
220
9321
66
224
521
8320
7227
531
035
138
94
06
1%2%
2%2%
2%0
%1%
1%1%
1%0
%0
%0
%0
%0
%4
9%
47%
47%
44
%4
3%6
%7%
7%8%
8%
Hum
aniti
es81
080
04
3152
04
3734
125
722
726
327
831
7234
45
3578
3620
384
584
470
469
36
816
60
309
250
212
210
289
12%
11%
6%
7%6
%5%
4%
3%4
%4
%4
5%4
8%52
%51
%52
%12
%10
%10
%10
%9
%4
%3%
3%3%
4%
Law
190
170
163
1516
00
00
00
00
66
669
76
696
476
60
49
43
41
2630
14%
12%
12%
1%1%
0%
0%
0%
0%
0%
0%
0%
0%
0%
0%
49
%4
8%4
8%51
%52
%4
%3%
3%2%
2%
Scie
nce
8714
19
010
569
00
00
014
03
156
615
9216
05
1650
00
00
00
3%5%
3%4
%2%
0%
0%
0%
0%
0%
55%
55%
56%
56%
55%
0%
0%
0%
0%
0%
0%
0%
0%
0%
0%
TOTA
L14
8314
9397
594
580
477
081
957
835
632
572
03
7713
7891
790
781
7686
2087
6287
49
8487
8174
1896
180
815
9216
6517
26
5%5%
3%3%
3%3%
3%2%
1%1%
26%
26%
27%
28%
29%
31%
30%
30%
30%
29%
7%6%
6%6%
6%
Per
cent
ages
sho
uld
be
read
acr
oss
eac
h ro
w.
No
te: S
tud
ents
wit
h un
know
n na
tio
nalit
y an
d/o
r ra
ce a
re n
ot
incl
uded
in t
he p
op
ulat
ion
gro
up c
olu
mns
but
do
ap
pea
r in
the
to
tal c
olu
mn.
OC
CA
SIO
NA
L ST
UD
ENTS
UN
DER
GR
AD
UA
TE D
IPLO
MA
S
AN
D C
ERTI
FICA
TES
THR
EE-Y
EAR
BA
CH
ELO
R’S
DEG
REE
SPR
OFE
SSIO
NA
L B
AC
HEL
OR
’S D
EGR
EES
POST
GR
AD
UA
TE D
IPLO
MA
S

161
UNIVERSITY OF CAPE TOWN | TEACHING & LEARNING REPORT 2019
Tab
le 1
2H
ead
-cou
nt s
tud
ent
enro
lmen
ts b
y fo
rmal
qua
lifica
tion
Facu
lty20
1520
1620
1720
1820
1920
1520
1620
1720
1820
1920
1520
1620
1720
1820
1920
1520
1620
1720
1820
19
Com
mer
ce4
09
479
46
051
454
04
1654
654
36
236
2824
127
429
630
431
472
95
7751
714
467
776
554
6%
6%
6%
8%8%
6%
7%8%
9%
10%
3%4
%4
%4
%5%
100
%10
0%
100
%10
0%
100
%
GSB
00
00
054
856
16
09
590
581
00
00
09
1579
081
285
086
7
0%
0%
0%
0%
0%
60
%71
%75
%69
%67
%0
%0
%0
%0
%0
%10
0%
100
%10
0%
100
%10
0%
EBE
137
164
216
177
180
956
967
1039
110
39
90
249
277
291
293
316
44
134
673
486
64
939
480
1
3%4
%4
%4
%4
%22
%21
%21
%22
%21
%6
%6
%6
%6
%7%
100
%10
0%
100
%10
0%
100
%
Heal
th
Scie
nces
109
120
115
114
106
1270
1378
1423
1526
1482
423
49
855
659
463
44
236
457
24
815
49
40
482
0
3%3%
2%2%
2%30
%30
%30
%31
%31
%10
%11
%12
%12
%13
%10
0%
100
%10
0%
100
%10
0%
Hum
aniti
es50
34
99
512
539
511
697
812
795
879
90
234
539
138
139
84
05
7021
7158
682
971
1073
27
7%7%
7%8%
7%10
%11
%12
%12
%12
%5%
5%6
%6
%6
%10
0%
100
%10
0%
100
%10
0%
Law
00
00
360
434
393
422
40
39
411
813
915
516
713
5914
62
140
512
65
1276
0%
0%
0%
0%
0%
26%
30%
28%
33%
32%
7%8%
10%
12%
13%
100
%10
0%
100
%10
0%
100
%
Scie
nce
192
212
216
185
213
49
44
9253
657
86
5539
44
154
1939
04
09
2570
2826
2853
2863
299
6
7%8%
8%6
%7%
19%
17%
19%
20%
22%
15%
15%
15%
14%
14%
100
%10
0%
100
%10
0%
100
%
TOTA
L13
5014
7415
1915
2915
5047
4151
9053
3857
2156
4117
46
1973
2082
2134
224
527
809
2923
228
724
2874
428
641
5%5%
5%5%
5%17
%18
%19
%20
%20
%6%
7%7%
7%8%
100
%10
0%
100
%10
0%
100
%
Per
cent
ages
sho
uld
be
read
acr
oss
eac
h ro
w.
HO
NO
UR
SM
AST
ER’S
DO
CTO
RS
TOTA
L

162
UNIVERSITY OF CAPE TOWN | TEACHING & LEARNING REPORT 2019
UNDERGRADUATE DIPLOMAS THREE-YEAR BACHELOR'S DEGREESPROFESSIONAL BACHELOR'S
DEGREES POSTGRADUATE DIPLOMAS
Table 13Total degrees and diplomas awarded
Faculty 2015 2016 2017 2018 2019 2015 2016 2017 2018 2019 2015 2016 2017 2018 2019 2015 2016 2017 2018 2019
Commerce 269 335 256 17 4 503 574 551 543 584 416 417 478 495 371 549 572 447 486 518
13% 14% 12% 1% 0% 24% 25% 25% 27% 29% 20% 18% 22% 24% 19% 26% 25% 20% 24% 26%
GSB 0 0 0 0 0 0 0 0 0 0 0 0 0 0 0 141 148 109 138 166
0% 0% 0% 0% 0% 0% 0% 0% 0% 0% 0% 0% 0% 0% 0% 37% 40% 29% 37% 53%
EBE 0 0 0 0 138 134 127 149 175 436 446 417 410 431 6 6 5 4 14
0% 0% 0% 0% 0% 15% 15% 14% 16% 18% 46% 49% 45% 43% 43% 1% 1% 1% 0% 0%
Health
Sciences
0 20 48 31 2 2 3 1 335 330 364 409 402 168 194 188 224 229
0% 2% 0% 4% 3% 0% 0% 0% 0% 0% 39% 35% 42% 37% 37% 20% 21% 21% 20% 21%
Humanities 96 129 61 86 92 764 747 794 798 820 204 140 148 162 132 239 195 182 162 236
5% 7% 3% 5% 5% 40% 40% 45% 43% 43% 11% 8% 8% 9% 7% 12% 11% 10% 9% 12%
Law 0 0 0 0 0 0 0 0 0 0 169 196 174 151 171 8 20 13 12 12
0% 0% 0% 0% 0% 0% 0% 0% 0% 0% 54% 43% 48% 42% 49% 3% 4% 4% 3% 3%
Science 0 0 0 0 0 322 335 328 349 356 0 0 0 0 0 0 0 0 0 0
0% 0% 0% 0% 0% 45% 45% 44% 50% 46% 0% 0% 0% 0% 0% 0% 0% 0% 0% 0%
TOTAL 365 484 317 151 127 1729 1790 1802 1842 1936 1560 1529 1581 1627 1507 1111 1135 944 1026 1175
5% 6% 4% 2% 2% 24% 24% 25% 25% 26% 22% 20% 22% 22% 20% 15% 15% 13% 14% 16%
HONOURS MASTER’S DOCTORS TOTAL
Faculty 2015 2016 2017 2018 2019 2015 2016 2017 2018 2019 2015 2016 2017 2018 2019 2015 2016 2017 2018 2019
Commerce 248 270 292 325 311 96 142 120 144 182 26 18 43 29 35 2102 2328 2187 2039 2005
12% 12% 13% 16% 0% 5% 6% 5% 7% 9% 1% 1% 2% 1% 2% 100% 100% 100% 100% 100%
GSB 0 0 0 0 236 224 267 239 151 0 0 0 0 0 382 372 376 377 317
0% 0% 0% 0% 0% 62% 60% 71% 63% 47% 0% 0% 0% 0% 0% 100% 100% 100% 100% 100%
EBE 104 127 155 123 145 231 170 190 245 202 25 35 33 16 50 940 918 927 947 1017
11% 14% 17% 13% 14% 25% 19% 20% 26% 20% 3% 4% 4% 2% 5% 100% 100% 100% 100% 100%
Health
Sciences
93 98 94 101 101 203 239 166 267 265 59 63 61 47 69 860 944 875 1099 1098
11% 10% 11% 9% 9% 24% 25% 19% 24% 23% 7% 7% 7% 4% 6% 100% 100% 100% 100% 100%
Humanities 426 412 416 438 434 163 190 104 185 173 38 36 47 35 47 1930 1849 1752 1866 1934
22% 22% 24% 23% 23% 8% 10% 6% 10% 8% 2% 2% 3% 2% 2% 100% 100% 100% 100% 100%
Law 0 0 0 0 0 120 224 155 184 158 17 12 20 11 8 314 452 362 358 349
0% 0% 0% 0% 0% 38% 50% 43% 51% 45% 5% 3% 6% 3% 2% 100% 100% 100% 100% 100%
Science 181 201 206 170 196 153 143 137 117 171 58 69 73 57 52 714 748 744 693 775
25% 27% 28% 25% 25% 21% 19% 18% 17% 22% 8% 9% 10% 8% 7% 100% 100% 100% 100% 100%
TOTAL 1052 1108 1163 1157 1187 1202 1332 1139 1381 1302 223 233 277 195 261 7242 7611 7223 7379 7495
15% 15% 16% 16% 16% 17% 18% 16% 19% 17% 3% 3% 4% 3% 4% 100% 100% 100% 100% 100%
Percentages should be read across each row.

163
UNIVERSITY OF CAPE TOWN | TEACHING & LEARNING REPORT 2019
UNDERGRADUATE DIPLOMASTHREE-YEAR BACHELOR'S
DEGREES
NPHE BENCHMARK GRAD RATE: 25%
PROFESSIONAL BACHELOR'S DEGREES
NPHE BENCHMARK GRAD RATE: 20%
POSTGRADUATE DIPLOMAS
NPHE BENCHMARK GRAD RATE: 60%
Table 14Graduation rates by formal qualification type
Faculty 2015 2016 2017 2018 2019 2015 2016 2017 2018 2019 2015 2016 2017 2018 2019 2015 2016 2017 2018 2019
Commerce 62,7% 62,2% 83,7% 42,5% 50,0% 24,0% 27,2% 26,1% 26,3% 28,6% 16,0% 15,8% 19,1% 21,5% 17,3% 58,0% 61,0% 56,9% 63,7% 69,8%
GSB 51,1% 64,6% 58,3% 53,1% 67,5%
EBE 26,2% 22,6% 21,1% 24,4% 27,6% 18,1% 17,5% 15,8% 15,3% 16,4% 15,0% 15,8% 31,3% 23,5% 107,7%
Health
Sciences
87,0% 0,0% 90,6% 79,5% 40,0% 50,0% 75,0% 50,0% 16,0% 15,2% 16,2% 18,7% 19,4% 61,1% 62,6% 53,6% 57,6% 56,4%
Humanities 28,2% 50,2% 26,9% 32,7% 33,1% 24,1% 21,7% 22,2% 22,0% 21,3% 24,2% 19,9% 21,4% 23,8% 20,0% 77,3% 78,0% 85,8% 77,1% 81,7%
Law 25,4% 28,1% 26,0% 23,3% 25,9% 16,3% 46,5% 31,7% 46,2% 40,0%
Science 23,0% 21,4% 20,6% 21,7% 21,6%
TOTAL 47,4% 59,1% 54,8% 42,4% 39,1% 24,0% 23,2% 22,8% 23,3% 23,7% 18,1% 17,5% 18,1% 19,2% 18,4% 58,6% 62,8% 59,3% 61,6% 68,1%
HONOURS
NPHE BENCHMARK GRAD RATE: 60%
MASTER’S
NPHE BENCHMARK GRAD RATE: 33%
DOCTORS
NPHE BENCHMARK GRAD RATE: 20%
TOTAL
DHET BENCHMARK FOR UCT: 26%
Faculty 2015 2016 2017 2018 2019 2015 2016 2017 2018 2019 2015 2016 2017 2018 2019 2015 2016 2017 2018 2019
Commerce 60,6% 56,4% 63,5% 63,2% 57,6% 23,1% 26,0% 22,1% 23,1% 29,0% 10,8% 6,6% 14,5% 9,5% 11,1% 28,8% 30,0% 30,6% 30,1% 30,6%
GSB 43,1% 39,9% 43,8% 40,5% 26,0% 41,7% 47,1% 46,3% 44,4% 36,6%
EBE 75,9% 77,4% 71,8% 69,5% 80,6% 24,2% 17,6% 18,3% 22,2% 20,4% 10,0% 12,6% 11,3% 5,5% 15,8% 21,3% 19,6% 19,1% 19,2% 21,2%
Health
Sciences
85,3% 81,7% 81,7% 88,6% 95,3% 16,0% 17,3% 11,7% 17,5% 17,9% 13,9% 12,7% 11,0% 7,9% 10,9% 20,3% 20,6% 18,2% 22,2% 22,8%
Humanities 84,7% 82,6% 81,3% 81,3% 84,9% 23,4% 23,4% 13,1% 21,0% 19,2% 11,0% 9,2% 12,3% 8,8% 11,6% 27,5% 25,8% 25,7% 26,2% 26,4%
Law 33,3% 51,6% 39,4% 43,6% 39,2% 18,1% 10,2% 14,4% 7,1% 4,8% 23,1% 30,9% 25,8% 28,3% 27,4%
Science 94,3% 94,8% 95,4% 91,9% 92,0% 31,0% 29,1% 25,6% 20,2% 26,1% 14,7% 16,6% 17,4% 14,6% 12,7% 27,8% 26,5% 26,1% 24,2% 25,9%
TOTAL 77,9% 75,2% 76,6% 75,7% 76,6% 25,4% 25,7% 21,3% 24,1% 23,1% 12,8% 11,8% 13,3% 9,1% 11,6% 26,0% 26,0% 25,1% 25,7% 26,2%
Note: NPHE = National Plan for Higher Education

Tab
le 1
5AC
lass
of
pas
s of
all
bac
helo
r’s
gra
dua
tes
by g
rad
uati
on y
ear
Facu
lty20
1520
1620
1720
1820
1920
1520
1620
1720
1820
1920
1520
1620
1720
1820
1920
1520
1620
1720
1820
1920
1520
1620
1720
1820
1920
1520
1620
1720
1820
19
Com
mer
ce69
8513
110
067
11913
313
715
712
944
742
348
547
241
225
429
624
227
427
931
5535
4041
920
992
1030
1043
928
8%9%
13%
10%
7%13
%13
%13
%15
%14
%49
%43
%47
%45
%44
%28
%30
%23
%26
%30
%3%
6%3%
4%4%
100%
100%
100%
100%
100%
EBE
8565
6773
7177
8482
8790
255
297
265
245
278
149
127
122
145
143
77
69
1257
358
054
255
959
4
15%
11%12
%13
%12
%13
%14
%15
%16
%15
%45
%51
%49
%44
%47
%26
%22
%23
%26
%24
%1%
1%1%
2%2%
100%
100%
100%
100%
100%
Heal
th
Scie
nces
3942
6072
7710
078
102
104
11417
518
917
721
516
524
3227
1845
22
338
341
366
411
403
12%
12%
16%
18%
19%
30%
23%
28%
25%
28%
52%
55%
48%
52%
41%
7%9%
7%4%
11%0%
0%0%
0%0%
100%
100%
100%
100%
100%
Hum
aniti
es63
7094
6966
151
157
167
143
153
446
429
433
477
445
260
209
201
219
235
4527
4550
4696
589
294
095
894
5
7%8%
10%
7%7%
16%
18%
18%
15%
16%
46%
48%
46%
50%
47%
27%
23%
21%
23%
25%
5%3%
5%5%
5%10
0%10
0%10
0%10
0%10
0%
Law
11
11
35
56
2322
2020
337
1814
2016
11
3243
4047
56
3%0%
0%2%
2%3%
7%13
%11%
11%72
%51
%50
%43
%59
%22
%42
%35
%43
%29
%0%
0%3%
2%0%
100%
100%
100%
100%
100%
Scie
nce
4662
4655
5256
4165
4143
131
125
139
134
132
7695
6710
5114
1112
1114
1432
033
532
834
935
5
14%
19%
14%
16%
15%
18%
12%
20%
12%
12%
41%
37%
42%
38%
37%
24%
28%
20%
30%
32%
3%4%
3%4%
4%10
0%10
0%10
0%10
0%10
0%
TOTA
L NO.
303
324
398
370
334
504
496
558
537
535
1477
1485
1519
1563
1465
770
777
673
781
832
9410
198
116
115
3148
3183
3246
3367
3281
TOTA
L ROW
%10
%10
%12
%11
%10
%16
%16
%17
%16
%16
%47
%47
%47
%46
%45
%24
%24
%21
%23
%25
%3%
3%3%
3%4%
100%
100%
100%
100%
100%
Per
cent
ages
sho
uld
be
read
acr
oss
eac
h ro
w.
No
te: T
he d
ata
for
thes
e ta
ble
s re
flec
ts c
umul
ativ
e g
rad
e p
oin
t av
erag
es f
or
firs
t b
ache
lor’
s g
rad
uate
s an
d w
as d
eriv
ed f
rom
Peo
ple
So
ft a
t th
e en
d o
f ea
ch a
cad
emic
yea
r. It
do
es n
ot
incl
ude
stud
ents
who
can
celle
d d
urin
g t
he y
ear.
The
to
tals
sho
uld
no
t b
e ex
pec
ted
to
tal
ly w
ith
tho
se in
Tab
le 1
3, w
hich
are
HE
MIS
der
ived
.
FIR
STU
PPER
SEC
ON
DLO
WER
SEC
ON
DTH
IRD
<50
TOTA
L

Tab
le 1
5BC
lass
of
pas
s of
all
Afr
ican
bac
helo
r’s
gra
dua
tes
by g
rad
uati
on y
ear
Facu
lty20
1520
1620
1720
1820
1920
1520
1620
1720
1820
1920
1520
1620
1720
1820
1920
1520
1620
1720
1820
1920
1520
1620
1720
1820
1920
1520
1620
1720
1820
19
Com
mer
ce4
812
116
2214
2427
2412
399
125
11412
7116
137
102
8710
016
3220
1821
281
290
283
257
278
1%3%
4%4%
2%8%
5%8%
11%9%
44%
34%
44%
44%
46%
41%
47%
36%
34%
36%
6%11%
7%7%
8%10
0%10
0%10
0%10
0%10
0%
EBE
24
53
77
1417
39
5477
5556
7958
4740
5244
33
44
812
414
512
1118
147
2%3%
4%3%
5%6%
10%
14%
3%6%
44%
53%
45%
47%
54%
47%
32%
33%
44%
30%
2%2%
3%3%
5%10
0%10
0%10
0%10
0%10
0%
Heal
th
Scie
nces
22
15
714
2219
2321
8789
102
11282
1420
199
272
2117
133
141
151
139
2%2%
1%3%
5%12
%17
%13
%15
%15
%74
%67
%72
%74
%59
%12
%15
%13
%6%
19%
0%0%
0%1%
1%10
0%10
0%10
0%10
0%10
0%
Hum
aniti
es2
12
612
1418
1117
9187
107
8697
9476
7687
9214
1526
2830
211
194
228
214
242
0%1%
0%1%
2%6%
7%8%
5%7%
43%
45%
47%
40%
40%
45%
39%
33%
41%
38%
7%8%
11%13
%12
%10
0%10
0%10
0%10
0%10
0%
Law
15
115
410
56
811
410
1713
1614
0%0%
0%0%
0%0%
0%0%
6%0%
50%
65%
38%
25%
71%
50%
35%
62%
69%
29%
0%0%
0%0%
0%10
0%10
0%10
0%10
0%10
0%
Scie
nce
21
13
810
64
715
2327
2623
3033
2241
596
76
810
5975
6280
102
0%3%
2%1%
3%14
%13
%10
%5%
7%25
%31
%44
%33
%23
%51
%44
%35
%51
%58
%10
%9%
10%
10%
10%
100%
100%
100%
100%
100%
TOTA
L NO.
818
2022
2963
7484
6978
375
386
421
398
418
317
319
267
287
326
3957
5660
7180
285
484
883
692
2
TOTA
L ROW
%1%
2%2%
3%3%
8%9%
10%
8%8%
47%
45%
50%
48%
45%
40%
37%
31%
34%
35%
5%7%
7%7%
8%10
0%10
0%10
0%10
0%10
0%
Per
cent
ages
sho
uld
be
read
acr
oss
eac
h ro
w.
FIR
STU
PPER
SEC
ON
DLO
WER
SEC
ON
DTH
IRD
<50
TOTA
L

Tab
le 1
5CC
lass
of
pas
s of
all
Col
oure
d b
ache
lor’
s g
rad
uate
s by
gra
dua
tion
yea
r
Facu
lty20
1520
1620
1720
1820
1920
1520
1620
1720
1820
1920
1520
1620
1720
1820
1920
1520
1620
1720
1820
1920
1520
1620
1720
1820
1920
1520
1620
1720
1820
19
Com
mer
ce4
87
84
1016
1420
1350
5660
5445
2850
4252
437
95
52
9913
912
813
910
7
4%6%
5%6%
4%10
%12
%11%
14%
12%
51%
40%
47%
39%
42%
28%
36%
33%
37%
40%
7%6%
4%4%
2%10
0%10
0%10
0%10
0%10
0%
EBE
83
36
65
58
312
3533
3127
3513
1619
2021
11
262
5861
5676
13%
5%5%
11%8%
8%9%
13%
5%16
%56
%57
%51
%48
%46
%21
%28
%31
%36
%28
%2%
2%0%
0%3%
100%
100%
100%
100%
100%
Heal
th
Scie
nces
23
89
69
1119
1832
4154
4054
506
87
513
5876
7486
101
3%4%
11%10
%6%
16%
14%
26%
21%
32%
71%
71%
54%
63%
50%
10%
11%9%
6%13
%0%
0%0%
0%0%
100%
100%
100%
100%
100%
Hum
aniti
es4
43
410
1218
1716
1982
9890
98113
5846
5358
7513
56
124
169
171
169
188
221
2%2%
2%2%
5%7%
11%10
%9%
9%49
%57
%53
%52
%51
%34
%27
%31
%31
%34
%8%
3%4%
6%2%
100%
100%
100%
100%
100%
Law
11
21
36
511
16
34
11
29
1012
13
0%0%
0%0%
8%0%
0%10
%17
%0%
50%
33%
60%
42%
85%
50%
67%
30%
33%
8%0%
0%0%
8%0%
100%
100%
100%
100%
100%
Scie
nce
32
26
44
25
46
1818
1816
2211
1712
1017
31
14
3940
3840
49
8%5%
5%15
%8%
10%
5%13
%10
%12
%46
%45
%47
%40
%45
%28
%43
%32
%25
%35
%8%
3%3%
10%
0%10
0%10
0%10
0%10
0%10
0%
TOTA
L NO.
2120
2333
3140
5264
6382
227
262
245
254
276
117
143
136
149
170
2416
1222
842
949
348
052
156
7
TOTA
L ROW
%5%
4%5%
6%5%
9%11
%13
%12
%14
%53
%53
%51
%49
%49
%27
%29
%28
%29
%30
%6%
3%3%
4%1%
100%
100%
100%
100%
100%
Per
cent
ages
sho
uld
be
read
acr
oss
eac
h ro
w.
FIR
STU
PPER
SEC
ON
DLO
WER
SEC
ON
DTH
IRD
<50
TOTA
L

Tab
le 1
5DC
lass
of
pas
s of
all
Ind
ian
bac
helo
r’s
gra
dua
tes
by g
rad
uati
on y
ear
Facu
lty20
1520
1620
1720
1820
1920
1520
1620
1720
1820
1920
1520
1620
1720
1820
1920
1520
1620
1720
1820
1920
1520
1620
1720
1820
1920
1520
1620
1720
1820
19
Com
mer
ce7
916
810
1113
916
1842
4849
6241
2523
3146
334
55
67
8998
11013
810
9
8%9%
15%
6%9%
12%
13%
8%12
%17
%47
%49
%45
%45
%38
%28
%23
%28
%33
%30
%4%
5%5%
4%6%
100%
100%
100%
100%
100%
EBE
45
55
74
910
66
1426
3324
2513
617
1917
12
3546
6656
55
11%11%
8%9%
13%
11%20
%15
%11%
11%40
%57
%50
%43
%45
%37
%13
%26
%34
%31
%0%
0%2%
4%0%
100%
100%
100%
100%
100%
Heal
th
Scie
nces
36
99
149
1013
128
1420
817
91
21
2738
3039
31
11%16
%30
%23
%45
%33
%26
%43
%31
%26
%52
%53
%27
%44
%29
%4%
5%0%
3%0%
0%0%
0%0%
0%10
0%10
0%10
0%10
0%10
0%
Hum
aniti
es1
21
21
33
45
1828
2515
1713
169
610
22
21
134
5041
2735
0%2%
5%4%
6%3%
6%7%
15%
14%
53%
56%
61%
56%
49%
38%
32%
22%
22%
29%
6%4%
5%4%
3%10
0%10
0%10
0%10
0%10
0%
Law
11
12
31
31
21
27
36
26
8
0%0%
0%0%
0%33
%17
%0%
17%
0%67
%50
%50
%50
%13
%0%
33%
50%
33%
88%
0%0%
0%0%
0%10
0%10
0%10
0%10
0%10
0%
Scie
nce
15
43
44
22
31
28
712
103
82
86
11
1024
1626
21
10%
21%
25%
12%
19%
40%
8%13
%12
%5%
20%
33%
44%
46%
48%
30%
33%
13%
31%
29%
0%4%
6%0%
0%10
0%10
0%10
0%10
0%10
0%
TOTA
L NO.
1526
3626
3730
3837
4238
9213
312
313
310
355
5760
8273
68
99
819
826
226
529
225
9
TOTA
L ROW
%8%
10%
14%
9%14
%15
%15
%14
%14
%15
%46
%51
%46
%46
%40
%28
%22
%23
%28
%28
%3%
3%3%
3%3%
100%
100%
100%
100%
100%
Per
cent
ages
sho
uld
be
read
acr
oss
eac
h ro
w.
FIR
STUP
PER
SECO
NDLO
WER
SEC
ON
DTH
IRD
<50
TOTA
L

Tab
le 1
5EC
lass
of
pas
s of
all
Whi
te b
ache
lor’
s g
rad
uate
s by
gra
dua
tion
yea
r Fa
culty
2015
2016
2017
2018
2019
2015
2016
2017
2018
2019
2015
2016
2017
2018
2019
2015
2016
2017
2018
2019
2015
2016
2017
2018
2019
2015
2016
2017
2018
2019
Com
mer
ce43
5077
6034
6170
7066
5718
015
917
315
013
552
5236
4861
25
24
533
833
635
832
829
2
13%
15%
22%
18%
12%
18%
21%
20%
20%
20%
53%
47%
48%
46%
46%
15%
15%
10%
15%
21%
1%1%
1%1%
2%10
0%10
0%10
0%10
0%10
0%
EBE
5542
3236
4040
3133
4237
8899
101
8277
4128
2220
352
12
224
202
189
182
189
25%
21%
17%
20%
21%
18%
15%
17%
23%
20%
39%
49%
53%
45%
41%
18%
14%
12%
11%19
%0%
1%1%
1%0%
100%
100%
100%
100%
100%
Heal
th
Scie
nces
3024
4045
4361
3141
4842
2523
2226
161
12
3117
7910
312
110
4
26%
30%
39%
37%
41%
52%
39%
40%
40%
40%
21%
29%
21%
21%
15%
1%1%
0%2%
3%0%
0%0%
0%0%
100%
100%
100%
100%
100%
Hum
aniti
es53
5072
5238
106
9799
7667
168
150
139
152
9954
4030
3223
103
43
539
134
034
431
523
2
14%
15%
21%
17%
16%
27%
29%
29%
24%
29%
43%
44%
40%
48%
43%
14%
12%
9%10
%10
%3%
1%1%
1%2%
100%
100%
100%
100%
100%
Law
12
31
612
26
54
12
12
113
610
812
0%0%
0%13
%0%
0%33
%30
%13
%50
%92
%33
%60
%63
%33
%8%
33%
0%13
%17
%0%
0%10
%0%
0%10
0%10
0%10
0%10
0%10
0%
Scie
nce
3344
3037
3127
2045
2521
6855
6664
5916
1924
3224
22
11
146
140
165
159
136
23%
31%
18%
23%
23%
18%
14%
27%
16%
15%
47%
39%
40%
40%
43%
11%14
%15
%20
%18
%1%
1%0%
1%1%
100%
100%
100%
100%
100%
TOTA
L NO.
214
210
251
231
186
295
251
291
258
230
541
488
507
479
390
165
142
112
135
148
1412
810
1112
2911
0311
6911
1396
5
TOTA
L ROW
%17
%19
%21
%21
%19
%24
%23
%25
%23
%24
%44
%44
%43
%43
%40
%13
%13
%10
%12
%15
%1%
1%1%
1%1%
100%
100%
100%
100%
100%
Per
cent
ages
sho
uld
be
read
acr
oss
eac
h ro
w.
FIR
STU
PPER
SEC
ON
DLO
WER
SEC
ON
DTH
IRD
<50
TOTA
L

Tab
le 1
5FC
lass
of
pas
s of
all
Inte
rnat
iona
l bac
helo
r’s
gra
dua
tes
by g
rad
uati
on y
ear
Facu
lty20
1520
1620
1720
1820
1920
1520
1620
1720
1820
1920
1520
1620
1720
1820
1920
1520
1620
1720
1820
1920
1520
1620
1720
1820
1920
1520
1620
1720
1820
19
Com
mer
ce4
512
86
1011
1515
834
3743
5036
2824
2426
242
32
34
7880
9610
278
5%6%
13%
8%8%
13%
14%
16%
15%
10%
44%
46%
45%
49%
46%
36%
30%
25%
25%
31%
3%4%
2%3%
5%10
0%10
0%10
0%10
0%10
0%
EBE
97
1517
1018
1812
3021
5250
3746
5424
2419
3019
11
12
104
100
8312
410
6
9%7%
18%
14%
9%17
%18
%14
%24
%20
%50
%50
%45
%37
%51
%23
%24
%23
%24
%18
%1%
1%0%
1%2%
100%
100%
100%
100%
100%
Heal
th
Scie
nces
61
41
35
72
22
21
11
1210
53
8
0%60
%0%
0%13
%33
%10
%60
%0%
63%
58%
20%
40%
67%
25%
8%10
%0%
33%
0%0%
0%0%
0%0%
100%
100%
100%
100%
100%
Hum
aniti
es3
58
44
518
1514
1148
3648
7544
2824
2021
146
15
65
9084
9612
078
3%6%
8%3%
5%6%
21%
16%
12%
14%
53%
43%
51%
63%
56%
31%
29%
21%
18%
18%
7%1%
4%5%
6%10
0%10
0%10
0%10
0%10
0%
Law
11
32
22
62
21
24
45
38
25%
0%0%
0%0%
0%0%
20%
0%0%
75%
50%
40%
67%
75%
0%50
%40
%33
%25
%0%
0%0%
0%0%
100%
100%
100%
100%
100%
Scie
nce
65
52
57
54
45
1818
128
1112
146
106
13
13
4343
3025
30
14%
12%
17%
8%17
%16
%12
%13
%16
%17
%42
%42
%40
%32
%37
%28
%33
%20
%40
%20
%0%
2%10
%4%
10%
100%
100%
100%
100%
100%
TOTA
L NO.
2328
4031
2644
5350
6350
162
145
144
183
153
9389
7189
659
610
1114
331
321
315
377
308
TOTA
L ROW
%7%
9%13
%8%
8%13
%17
%16
%17
%16
%49
%45
%46
%49
%50
%28
%28
%23
%24
%21
%3%
2%3%
3%5%
100%
100%
100%
100%
100%
Per
cent
ages
sho
uld
be
read
acr
oss
eac
h ro
w.
FIR
STU
PPER
SEC
ON
DLO
WER
SEC
ON
DTH
IRD
<50
TOTA
L

170
UNIVERSITY OF CAPE TOWN | TEACHING & LEARNING REPORT 2019
CONVERSION OF THREE-YEAR
BACHELOR’S GRADUATES
CONVERSION OF PROFESSIONAL
BACHELOR’S GRADUATES
ALL THREE-YEAR
BACHELOR’S GRADUATES
ALL PROFESSIONAL
BACHELOR’S GRADUATES
Table 16AConversion of all bachelor’s graduates to postgraduate study by graduation year
Faculty 2015 2016 2017 2018 2019 2015 2016 2017 2018 2019 2015 2016 2017 2018 2019 2015 2016 2017 2018 2019
Commerce 130 165 170 152 135 30 45 43 51 55 505 574 552 548 557 415 418 478 495 371
26% 29% 31% 28% 24% 7% 11% 9% 10% 15% 100% 100% 100% 100% 100% 100% 100% 100% 100% 100%
EBE 58 77 48 60 72 92 71 74 67 80 137 134 126 148 171 436 446 416 411 423
42% 57% 38% 41% 42% 21% 16% 18% 16% 19% 100% 100% 100% 100% 100% 100% 100% 100% 100% 100%
Health
Sciences
1 2 0 2 3 1 7 1 6 2 3 0 3 1 336 338 366 408 402
67% 0% 1% 0% 2% 0% 1% 100% 100% 100% 100% 100% 100% 100%
Humanities 254 256 280 263 283 9 6 9 25 33 818 753 792 796 813 147 139 148 162 132
31% 34% 35% 33% 35% 6% 4% 6% 15% 25% 100% 100% 100% 100% 100% 100% 100% 100% 100% 100%
Law 5 8 14 17 16 32 43 40 47 56
16% 19% 35% 36% 29% 100% 100% 100% 100% 100%
Science 217 218 191 211 215 320 335 328 349 355
68% 65% 58% 60% 61% 100% 100% 100% 100% 100%
TOTAL 660 718 689 688 705 139 131 147 161 190 1782 1799 1798 1844 1897 1366 1384 1448 1523 1384
TOTAL ROW % 37% 40% 38% 37% 37% 10% 9% 10% 11% 14% 100% 100% 100% 100% 100% 100% 100% 100% 100% 100%
Percentages should be read across each row. Notes: 1. “Converted” three-year bachelor’s graduates are those who enrolled for a UCT honours degree in the year following their
bachelor’s graduation. 2. “Converted” professional first bachelor’s graduates are those who enrolled for a UCT master’s degree in the year following
their bachelor’s graduation.
Faculty 2015 2016 2017 2018 2019 2015 2016 2017 2018 2019 2015 2016 2017 2018 2019 2015 2016 2017 2018 2019
Commerce 51 70 71 44 52 6 5 6 6 5 209 226 209 193 230 72 64 74 64 48
24% 31% 34% 23% 23% 8% 8% 8% 9% 10% 100% 100% 100% 100% 100% 100% 100% 100% 100% 100%
EBE 6 7 1 6 16 16 15 13 12 22 19 21 10 25 34 105 124 111 93 113
32% 33% 10% 24% 47% 15% 12% 12% 13% 19% 100% 100% 100% 100% 100% 100% 100% 100% 100% 100%
Health
Sciences
1 0 0 1 0 1 1 0 1 1 1 0 0 1 1 116 133 141 150 138
100% 100% 0% 1% 1% 0% 1% 1% 100% 100% 100% 100% 100% 100% 100% 100%
Humanities 53 56 72 69 78 3 3 1 4 12 179 173 211 192 210 32 21 17 22 32
30% 32% 34% 36% 37% 9% 14% 6% 18% 38% 100% 100% 100% 100% 100% 100% 100% 100% 100% 100%
Law 0 3 4 7 5 10 17 13 16 14
0% 18% 31% 44% 36% 100% 100% 100% 100% 100%
Science 31 42 36 33 41 59 75 62 80 102
53% 56% 58% 41% 40% 100% 100% 100% 100% 100%
TOTAL 142 175 180 153 187 26 27 24 30 45 467 495 492 491 577 335 359 356 345 345
TOTAL ROW % 30% 35% 37% 31% 32% 8% 8% 7% 9% 13% 100% 100% 100% 100% 100% 100% 100% 100% 100% 100%
Percentages should be read across each row.
Table 16BConversion of African bachelor’s graduates to postgraduate study by graduation year
CONVERSION OF THREE-YEAR
BACHELOR’S GRADUATES
CONVERSION OF PROFESSIONAL
BACHELOR’S GRADUATES
ALL THREE-YEAR
BACHELOR’S GRADUATES
ALL PROFESSIONAL
BACHELOR’S GRADUATES

171
UNIVERSITY OF CAPE TOWN | TEACHING & LEARNING REPORT 2019
CONVERSION OF THREE-YEAR
BACHELOR’S GRADUATES
CONVERSION OF PROFESSIONAL
BACHELOR’S GRADUATES
ALL THREE-YEAR
BACHELOR’S GRADUATES
ALL PROFESSIONAL
BACHELOR’S GRADUATES
Table 16CConversion of Coloured bachelor’s graduates to postgraduate study by graduation year
Faculty 2015 2016 2017 2018 2019 2015 2016 2017 2018 2019 2015 2016 2017 2018 2019 2015 2016 2017 2018 2019
Commerce 10 24 19 29 16 1 4 5 6 5 71 90 80 81 83 28 49 48 58 24
14% 27% 24% 36% 19% 4% 8% 10% 10% 21% 100% 100% 100% 100% 100% 100% 100% 100% 100% 100%
EBE 3 7 4 3 8 13 10 7 5 8 14 18 17 13 26 48 40 44 43 50
21% 39% 24% 23% 31% 27% 25% 16% 12% 16% 100% 100% 100% 100% 100% 100% 100% 100% 100% 100%
Health
Sciences
0 0 0 0 0 0 0 1 0 0 0 0 58 76 74 86 101
0% 0% 1% 0% 0% 100% 100% 100% 100% 100% 100%
Humanities 33 48 39 45 55 1 1 1 3 10 143 150 138 165 194 26 21 31 23 27
23% 32% 28% 27% 28% 4% 5% 3% 13% 37% 100% 100% 100% 100% 100% 100% 100% 100% 100% 100%
Law 1 1 2 5 3 2 9 10 12 13
50% 11% 20% 42% 23% 100% 100% 100% 100% 100%
Science 30 27 17 27 31 39 40 38 40 49
77% 68% 45% 68% 63% 100% 100% 100% 100% 100%
TOTAL 76 106 79 104 110 16 16 16 19 26 267 298 273 299 352 162 195 207 222 215
TOTAL ROW % 28% 36% 29% 35% 31% 10% 8% 8% 9% 12% 100% 100% 100% 100% 100% 100% 100% 100% 100% 100%
Percentages should be read across each row.
Faculty 2015 2016 2017 2018 2019 2015 2016 2017 2018 2019 2015 2016 2017 2018 2019 2015 2016 2017 2018 2019
Commerce 9 10 13 13 13 7 7 3 6 10 31 41 54 67 57 58 57 56 71 52
29% 24% 24% 19% 23% 12% 12% 5% 8% 19% 100% 100% 100% 100% 100% 100% 100% 100% 100% 100%
EBE 0 1 4 4 4 5 4 10 6 6 3 4 9 9 10 32 42 57 47 45
0% 25% 44% 44% 40% 16% 10% 18% 13% 13% 100% 100% 100% 100% 100% 100% 100% 100% 100% 100%
Health
Sciences
0 1 0 0 0 0 0 1 0 0 2 0 1 27 36 30 38 31
0% 0% 3% 0% 0% 100% 100% 100% 100% 100% 100%
Humanities 8 18 12 9 11 0 0 0 0 1 33 45 38 24 33 1 5 3 3 2
24% 40% 32% 38% 33% 0% 0% 0% 0% 50% 100% 100% 100% 100% 100% 100% 100% 100% 100% 100%
Law 0 0 2 3 1 3 6 2 6 8
0% 0% 100% 50% 13% 100% 100% 100% 100% 100%
Science 8 16 10 18 10 10 24 16 26 21
80% 67% 63% 69% 48% 100% 100% 100% 100% 100%
TOTAL 25 46 39 44 38 12 11 16 15 18 77 116 117 127 121 121 146 148 165 138
TOTAL ROW % 32% 40% 33% 35% 31% 10% 8% 11% 9% 13% 100% 100% 100% 100% 100% 100% 100% 100% 100% 100%
Percentages should be read across each row.
Table 16DConversion of Indian bachelor’s graduates to postgraduate study by graduation year
CONVERSION OF THREE-YEAR
BACHELOR’S GRADUATES
CONVERSION OF PROFESSIONAL
BACHELOR’S GRADUATES
ALL THREE-YEAR
BACHELOR’S GRADUATES
ALL PROFESSIONAL
BACHELOR’S GRADUATES

172
UNIVERSITY OF CAPE TOWN | TEACHING & LEARNING REPORT 2019
CONVERSION OF THREE-YEAR
BACHELOR’S GRADUATES
CONVERSION OF PROFESSIONAL
BACHELOR’S GRADUATES
ALL THREE-YEAR
BACHELOR’S GRADUATES
ALL PROFESSIONAL
BACHELOR’S GRADUATES
Table 16EConversion of White bachelor’s graduates to postgraduate study by graduation year
Faculty 2015 2016 2017 2018 2019 2015 2016 2017 2018 2019 2015 2016 2017 2018 2019 2015 2016 2017 2018 2019
Commerce 38 34 32 28 25 13 21 22 24 29 124 135 117 105 96 214 201 241 223 196
31% 25% 27% 27% 26% 6% 10% 9% 11% 15% 100% 100% 100% 100% 100% 100% 100% 100% 100% 100%
EBE 34 41 24 24 30 36 21 23 23 24 68 59 60 51 69 156 143 129 131 120
50% 69% 40% 47% 43% 23% 15% 18% 18% 20% 100% 100% 100% 100% 100% 100% 100% 100% 100% 100%
Health
Sciences
0 1 0 1 0 0 0 5 0 2 116 78 103 120 104
0% 0% 5% 0% 2% 100% 100% 100% 100% 100%
Humanities 125 94 109 84 87 4 0 3 10 5 331 278 281 244 207 60 62 63 71 25
38% 34% 39% 34% 42% 7% 0% 5% 14% 20% 100% 100% 100% 100% 100% 100% 100% 100% 100% 100%
Law 1 2 4 1 5 13 6 10 8 12
8% 33% 40% 13% 42% 100% 100% 100% 100% 100%
Science 103 98 100 105 99 146 140 165 159 136
71% 70% 61% 66% 73% 100% 100% 100% 100% 100%
TOTAL 300 268 265 242 241 54 44 57 58 65 670 613 623 560 508 559 490 546 553 457
TOTAL ROW % 45% 44% 43% 43% 47% 10% 9% 10% 10% 14% 100% 100% 100% 100% 100% 100% 100% 100% 100% 100%
Percentages should be read across each row.
Faculty 2015 2016 2017 2018 2019 2015 2016 2017 2018 2019 2015 2016 2017 2018 2019 2015 2016 2017 2018 2019
Commerce 14 20 25 20 19 3 3 6 4 5 52 65 66 65 58 26 15 30 37 20
27% 31% 38% 31% 33% 12% 20% 20% 11% 25% 100% 100% 100% 100% 100% 100% 100% 100% 100% 100%
EBE 14 17 15 21 12 20 19 20 18 19 26 25 23 42 27 78 75 60 82 79
54% 68% 65% 50% 44% 26% 25% 33% 22% 24% 100% 100% 100% 100% 100% 100% 100% 100% 100% 100%
Health
Sciences
2 0 0 0 3 12 10 5 3 8
17% 0% 0% 0% 38% 100% 100% 100% 100% 100%
Humanities 20 27 32 29 15 1 0 4 7 2 82 74 79 93 65 8 10 17 27 13
24% 36% 41% 31% 23% 13% 0% 24% 26% 15% 100% 100% 100% 100% 100% 100% 100% 100% 100% 100%
Law 3 2 2 0 2 4 4 5 3 8
75% 50% 40% 0% 25% 100% 100% 100% 100% 100%
Science 30 26 16 12 20 43 43 30 25 30
70% 60% 53% 48% 67% 100% 100% 100% 100% 100%
TOTAL 78 90 88 82 66 29 24 32 29 31 203 207 198 225 180 128 114 117 152 128
TOTAL ROW % 38% 43% 44% 36% 37% 23% 21% 27% 19% 24% 100% 100% 100% 100% 100% 100% 100% 100% 100% 100%
Percentages should be read across each row.
Table 16FConversion of international bachelor’s graduates to postgraduate study by graduation year
CONVERSION OF THREE-YEAR
BACHELOR’S GRADUATES
CONVERSION OF PROFESSIONAL
BACHELOR’S GRADUATES
ALL THREE-YEAR
BACHELOR’S GRADUATES
ALL PROFESSIONAL
BACHELOR’S GRADUATES

173
UNIVERSITY OF CAPE TOWN | TEACHING & LEARNING REPORT 2019
CONVERSION OF THREE-YEAR
BACHELOR’S GRADUATES
CONVERSION OF PROFESSIONAL
BACHELOR’S GRADUATES
ALL THREE-YEAR
BACHELOR’S GRADUATES
ALL PROFESSIONAL
BACHELOR’S GRADUATES
Table 16GConversion of female bachelor’s graduates to postgraduate study by graduation year
Faculty 2015 2016 2017 2018 2019 2015 2016 2017 2018 2019 2015 2016 2017 2018 2019 2015 2016 2017 2018 2019
Commerce 74 75 87 71 65 8 12 15 26 19 301 276 278 278 295 182 172 193 193 149
25% 27% 31% 26% 22% 4% 7% 8% 13% 13% 100% 100% 100% 100% 100% 100% 100% 100% 100% 100%
EBE 19 16 16 14 17 26 26 18 20 20 58 41 54 54 78 103 138 99 99 102
33% 39% 30% 26% 22% 25% 19% 18% 20% 20% 100% 100% 100% 100% 100% 100% 100% 100% 100% 100%
Health
Sciences
1 2 0 2 1 1 7 1 5 1 2 0 0 1 252 257 278 278 302
0% 0% 0% 3% 0% 2% 100% 100% 100% 100% 100% 100% 100% 100%
Humanities 187 193 205 193 216 7 5 7 18 23 582 543 569 569 599 112 97 111 111 94
32% 36% 36% 34% 36% 6% 5% 6% 16% 24% 100% 100% 100% 100% 100% 100% 100% 100% 100% 100%
Law 3 5 13 12 9 23 29 34 34 40
13% 17% 38% 35% 23% 100% 100% 100% 100% 100%
Science 113 110 99 100 103 172 171 166 166 168
66% 64% 60% 60% 61% 100% 100% 100% 100% 100%
TOTAL 394 396 407 380 401 45 49 60 77 76 1114 1033 1067 1067 1141 672 693 715 715 687
TOTAL ROW % 35% 38% 38% 36% 35% 7% 7% 8% 11% 11% 100% 100% 100% 100% 100% 100% 100% 100% 100% 100%
Percentages should be read across each row.
Faculty 2015 2016 2017 2018 2019 2015 2016 2017 2018 2019 2015 2016 2017 2018 2019 2015 2016 2017 2018 2019
Commerce 56 90 83 81 70 22 33 28 24 36 204 298 274 279 262 233 245 285 294 222
27% 30% 30% 29% 27% 9% 13% 10% 8% 16% 100% 100% 100% 100% 100% 100% 100% 100% 100% 100%
EBE 39 61 32 46 55 66 45 56 47 60 79 93 72 86 93 333 308 317 285 321
49% 66% 44% 53% 59% 20% 15% 18% 16% 19% 100% 100% 100% 100% 100% 100% 100% 100% 100% 100%
Health
Sciences
0 0 0 0 0 2 0 0 0 1 1 1 0 1 84 81 88 101 100
2% 0% 0% 0% 1% 100% 100% 100% 100% 100% 100% 100% 100%
Humanities 67 63 75 70 64 2 1 2 6 10 234 209 223 225 211 35 41 37 38 38
29% 30% 34% 31% 30% 6% 2% 5% 16% 26% 100% 100% 100% 86% 100% 100% 100% 100% 100% 100%
Law 2 3 1 5 7 9 14 6 14 16
22% 21% 17% 36% 44% 100% 100% 100% 100% 100%
Science 104 108 92 111 112 148 164 162 189 187
70% 66% 57% 59% 60% 100% 100% 100% 100% 100%
TOTAL 266 322 282 308 301 94 82 87 82 114 666 765 731 780 753 694 689 733 732 697
TOTAL ROW % 40% 42% 39% 39% 40% 14% 12% 12% 11% 16% 100% 100% 100% 100% 100% 100% 100% 100% 100% 100%
Percentages should be read across each row.
Table 16HConversion of male bachelor’s graduates to postgraduate study by graduation year
CONVERSION OF THREE-YEAR
BACHELOR’S GRADUATES
CONVERSION OF PROFESSIONAL
BACHELOR’S GRADUATES
ALL THREE-YEAR
BACHELOR’S GRADUATES
ALL PROFESSIONAL
BACHELOR’S GRADUATES

174
UNIVERSITY OF CAPE TOWN | TEACHING & LEARNING REPORT 2019
1000-LEVEL 2000-LEVEL 3000-LEVEL
Registration year 2015 2016 2017 2018 2019 2015 2016 2017 2018 2019 2015 2016 2017 2018 2019
Commerce 85% 83% 82% 86% 88% 88% 90% 84% 86% 85% 89% 91% 89% 87% 86%
EBE 90% 89% 89% 79% 87% 83% 84% 86% 82% 86% 89% 90% 86% 87% 90%
Health Sciences 96% 99% 95% 95% 95% 94% 93% 89% 91% 92% 98% 98% 96% 96% 96%
Humanities 87% 85% 86% 84% 84% 89% 88% 84% 85% 85% 93% 93% 92% 92% 91%
Law 87% 85% 86% 81% 85% 87% 84% 84% 81% 81% 95% 90% 86% 77% 76%
Science 81% 77% 77% 75% 77% 83% 82% 77% 79% 78% 89% 90% 89% 89% 89%
ALL FACULTIES 86% 83% 83% 81% 83% 87% 87% 84% 84% 84% 91% 92% 90% 89% 89%
Notes:1. These success rates are the weighted averages for the undergraduate courses offered by the departments in each faculty,
extracted from successive HEMIS submissions. 2. Courses taken within the GSB have not been included in these calculations.
Table 17ASummary of undergraduate success rates by faculty and by course level
1000-LEVEL 2000-LEVEL 3000-LEVEL
Registration year 2015 2016 2017 2018 2019 2015 2016 2017 2018 2019 2015 2016 2017 2018 2019
Business/Commerce
84% 81% 80% 85% 87% 87% 90% 83% 85% 85% 89% 91% 89% 87% 86%
Science/Technology
84% 81% 80% 85% 87% 87% 90% 83% 85% 85% 89% 91% 89% 87% 86%
Education 87% 84% 83% 87% 90% 90% 82% 95% 88% 88% 72% 97% 96%
Broad Humanities
87% 85% 86% 84% 84% 89% 87% 85% 85% 84% 93% 92% 91% 88% 88%
GRAND TOTAL 86% 83% 83% 81% 83% 87% 87% 84% 84% 84% 91% 92% 90% 89% 89%
Notes:1. The Business/Commerce CESM group includes CESM 04 courses only. 2. The Education CESM group includes CESM 07 courses only. 3. The Science/Technology group includes CESMs 02, 06, 08, 09, 13, 14 and 15. 4. The Broad Humanities CESM group includes courses in all other CESM categories, including CESM 12 (Law).
Table 17BSummary of undergraduate success rates by Classification of Education Subject Matter (CESM) group and by course level
1000-LEVEL 2000-LEVEL 3000-LEVEL
Registration year 2015 2016 2017 2018 2019 2015 2016 2017 2018 2019 2015 2016 2017 2018 2019
African 79% 78% 77% 75% 77% 80% 79% 76% 76% 76% 86% 86% 82% 81% 83%
Coloured 84% 83% 83% 81% 81% 85% 86% 83% 84% 83% 91% 92% 90% 89% 90%
Indian 85% 84% 83% 81% 86% 88% 87% 83% 84% 87% 91% 94% 90% 88% 91%
White 91% 89% 91% 90% 92% 94% 94% 92% 92% 94% 96% 97% 96% 94% 95%
International 87% 85% 84% 84% 85% 89% 89% 86% 87% 86% 91% 91% 89% 90% 90%
ALL STUDENTS 86% 83% 83% 81% 83% 87% 87% 84% 84% 84% 91% 92% 90% 89% 89%
TABLE 17CSummary of undergraduate success rates by population group and by course level

175
UNIVERSITY OF CAPE TOWN | TEACHING & LEARNING REPORT 2019
1000-LEVEL 2000-LEVEL 3000-LEVEL
Registration year 2015 2016 2017 2018 2019 2015 2016 2017 2018 2019 2015 2016 2017 2018 2019
Commerce 85% 81% 76% 72% 77% 81% 82% 71% 73% 75% 78% 85% 78% 78% 72%
EBE 86% 87% 82% 71% 82% 71% 84% 76% 75% 78% 86% 82% 81% 81% 87%
Health Sciences 76% 91% 79% 82% 80% 81% 74% 73% 66% 69% 96% 88% 93% 94%
Humanities 73% 76% 82% 83% 82% 81% 75% 76% 78% 78% 82% 84% 84% 84% 85%
Law 80% 78% 76% 70% 79% 80% 69% 74% 67% 67% 96% 69% 81% 64% 60%
Science 78% 69% 71% 66% 66% 73% 75% 68% 68% 65% 80% 85% 80% 76% 82%
ALL FACULTIES 79% 76% 77% 75% 75% 79% 78% 73% 74% 74% 80% 84% 80% 80% 82%
Table 18ASummary of course success rates among foundation students by faculty and by course level
1000-LEVEL 2000-LEVEL 3000-LEVEL
Registration year 2015 2016 2017 2018 2019 2015 2016 2017 2018 2019 2015 2016 2017 2018 2019
Business/Commerce
84% 80% 75% 70% 76% 80% 82% 69% 70% 73% 78% 85% 78% 78% 72%
Science/Technology
80% 75% 73% 68% 69% 75% 77% 72% 71% 71% 82% 86% 81% 80% 85%
Broad Humanities
74% 76% 82% 82% 82% 81% 75% 77% 77% 77% 85% 82% 84% 82% 84%
GRAND TOTAL 79% 76% 77% 75% 75% 79% 78% 73% 74% 74% 80% 84% 80% 80% 82%
Notes:1. The Business/Commerce CESM group includes CESM 04 courses only. 2. The Science/Technology group includes CESMs 02, 06, 08, 09, 13, 14 and 15. 3. The Broad Humanities CESM group includes courses in all other CESM categories, including CESM 12 (Law).
Table 18BSummary of course success rates among foundation students by Classification of Education Subject Matter (CESM) group and by course level

Tab
le 1
9AA
cad
emic
pro
gre
ss c
odes
of
all u
nder
gra
dua
tes
Facu
lty20
1520
1620
1720
1820
1920
1520
1620
1720
1820
1920
1520
1620
1720
1820
1920
1520
1620
1720
1820
1920
1520
1620
1720
1820
1920
1520
1620
1720
1820
19
Com
mer
ce118
913
2712
8610
6193
033
1133
1729
5326
7826
7244
548
248
046
943
4114
85111
129
11778
9310
376
5851
3753
0449
3344
1342
11
23%
25%
26%
24%
22%
64%
63%
60%
61%
63%
9%9%
10%
11%10
%2%
2%2%
3%3%
2%2%
2%2%
1%10
0%10
0%10
0%10
0%10
0%
EBE
574
580
542
560
594
1995
2099
2113
2142
2184
246
328
365
401
312
6277
8810
112
264
6813
787
5829
4131
5232
4532
9132
70
20%
18%
17%
17%
18%
68%
67%
65%
65%
67%
8%10
%11%
12%
10%
2%2%
3%3%
4%2%
2%4%
3%2%
100%
100%
100%
100%
100%
Heal
th
Scie
nces
338
361
366
460
434
1695
1774
1840
1693
1587
2018
2837
5821
1221
1617
2625
3937
2121
0021
9022
9422
4321
17
16%
16%
16%
21%
21%
81%
81%
80%
75%
75%
1%1%
1%2%
3%1%
1%1%
1%1%
1%1%
2%2%
1%10
0%10
0%10
0%10
0%10
0%
Hum
aniti
es10
6210
2110
0010
4410
3726
9926
8327
3727
7529
2140
047
947
644
455
212
314
514
214
715
081
9214
715
712
543
6544
2045
0245
6747
85
24%
23%
22%
23%
22%
62%
61%
61%
61%
61%
9%11%
11%10
%12
%3%
3%3%
3%3%
2%2%
3%3%
3%10
0%10
0%10
0%10
0%10
0%
Law
170
197
174
152
173
453
410
401
362
367
2267
6890
6816
2412
3442
48
1314
1266
570
666
865
266
2
26%
28%
26%
23%
26%
68%
58%
60%
56%
55%
3%9%
10%
14%
10%
2%3%
2%5%
6%1%
1%2%
2%2%
100%
100%
100%
100%
100%
Scie
nce
320
335
328
349
355
956
1055
1068
1016
1104
5180
103
11791
5672
7310
176
1723
2324
2614
0015
6515
9516
0716
52
23%
21%
21%
22%
21%
68%
67%
67%
63%
67%
4%5%
6%7%
6%4%
5%5%
6%5%
1%1%
1%1%
2%10
0%10
0%10
0%10
0%10
0%
TOTA
L NO.
3653
3821
3696
3626
3523
11109
11338
1111
210
666
1083
511
8414
5415
2015
5815
1539
241
544
752
852
427
030
946
239
530
016
608
1733
717
237
1677
316
697
TOTA
L ROW
%22
%22
%21
%22
%21
%67
%65
%64
%64
%65
%7%
8%9%
9%9%
2%2%
3%3%
3%2%
2%3%
2%2%
100%
100%
100%
100%
100%
Per
cent
ages
sho
uld
be
read
acr
oss
eac
h ro
w.
Not
es:
1. T
he d
ata
for
thes
e ta
ble
s w
as d
eriv
ed f
rom
Peo
ple
So
ft a
t th
e en
d o
f ea
ch a
cad
emic
yea
r. It
do
es n
ot
incl
ude
stud
ents
who
can
celle
d d
urin
g t
he y
ear.
The
to
tals
sho
uld
no
t b
e ex
pec
ted
to
tal
ly w
ith
tho
se in
Tab
le 2
, whi
ch a
re H
EM
IS d
eriv
ed.
2. “
Oth
er”
acad
emic
sta
ndin
g c
od
es in
clud
e ca
ncel
lati
ons
and
dis
cip
linar
y co
des
.
QU
ALI
FIED
STA
ND
AR
D R
EAD
MIS
SIO
NFA
CU
LTY/
SEN
ATE
PER
MIS
SIO
NR
EFU
SED
REA
DM
ISSI
ON
OTH
ERTO
TAL

Tab
le 1
9BA
cad
emic
pro
gre
ss c
odes
of
all A
fric
an u
nder
gra
dua
tes
Facu
lty20
1520
1620
1720
1820
1920
1520
1620
1720
1820
1920
1520
1620
1720
1820
1920
1520
1620
1720
1820
1920
1520
1620
1720
1820
1920
1520
1620
1720
1820
19
Com
mer
ce31
231
532
026
428
087
988
881
876
770
320
619
622
922
418
647
3662
5763
1817
2725
1714
6214
5214
5613
3712
48
21%
22%
22%
20%
22%
60%
61%
56%
57%
56%
14%
13%
16%
17%
15%
3%2%
4%4%
5%1%
1%2%
2%1%
100%
100%
100%
100%
100%
EBE
124
145
121
11814
748
250
054
462
872
510
513
215
618
614
622
2840
5168
2417
4330
2475
782
290
410
13110
3
16%
18%
13%
12%
13%
64%
61%
60%
62%
66%
14%
16%
17%
18%
13%
3%3%
4%5%
6%3%
2%5%
3%2%
100%
100%
100%
100%
100%
Heal
th
Scie
nces
11714
214
116
014
165
367
369
767
162
513
1121
2135
157
99
1011
1516
1413
809
848
884
875
819
14%
17%
16%
18%
17%
81%
79%
79%
77%
76%
2%1%
2%2%
4%2%
1%1%
1%1%
1%2%
2%2%
2%10
0%10
0%10
0%10
0%10
0%
Hum
aniti
es24
122
125
323
826
571
068
459
459
256
218
921
721
118
017
762
7857
4948
2732
3833
3212
2912
32115
310
9210
75
20%
18%
22%
22%
25%
58%
56%
52%
54%
52%
15%
18%
18%
16%
16%
5%6%
5%4%
4%2%
3%3%
3%3%
100%
100%
100%
100%
100%
Law
3134
2729
4010
792
103
105
11210
3739
4228
1013
512
254
24
59
162
178
178
193
209
19%
19%
15%
15%
19%
66%
52%
58%
54%
54%
6%21
%22
%22
%13
%6%
7%3%
6%12
%2%
1%2%
3%4%
100%
100%
100%
100%
100%
Scie
nce
5975
6280
102
278
333
394
385
437
3244
6693
6634
4344
7556
64
49
1640
949
957
064
266
9
14%
15%
11%12
%15
%68
%67
%69
%60
%65
%8%
9%12
%14
%10
%8%
9%8%
12%
8%1%
1%1%
1%2%
100%
100%
100%
100%
100%
TOTA
L NO.
884
932
924
889
975
3109
3170
3150
3148
3164
555
637
722
746
638
190
205
217
253
270
9087
132
116
111
4828
5031
5145
5152
5123
TOTA
L ROW
%18
%19
%18
%17
%19
%64
%63
%61
%61
%62
%11
%13
%14
%14
%12
%4%
4%4%
5%5%
2%2%
3%2%
2%10
0%10
0%10
0%10
0%10
0%
Per
cent
ages
sho
uld
be
read
acr
oss
eac
h ro
w.
Not
e: “
Oth
er”
acad
emic
sta
ndin
g c
od
es in
clud
e ca
ncel
lati
ons
and
dis
cip
linar
y co
des
.
QU
ALI
FIED
STA
ND
AR
D R
EAD
MIS
SIO
NFA
CU
LTY/
SEN
ATE
PER
MIS
SIO
NR
EFU
SED
REA
DM
ISSI
ON
OTH
ERTO
TAL

Tab
le 1
9CA
cad
emic
pro
gre
ss c
odes
of
all C
olou
red
und
erg
rad
uate
s
Facu
lty20
1520
1620
1720
1820
1920
1520
1620
1720
1820
1920
1520
1620
1720
1820
1920
1520
1620
1720
1820
1920
1520
1620
1720
1820
1920
1520
1620
1720
1820
19
Com
mer
ce110
150
143
139
107
405
397
379
267
181
7162
5646
5020
813
2311
1016
87
616
633
599
482
349
18%
24%
24%
29%
31%
66%
63%
63%
55%
52%
12%
10%
9%10
%14
%3%
1%2%
5%3%
2%3%
1%1%
0%10
0%10
0%10
0%10
0%10
0%
EBE
6258
6156
7622
024
326
128
227
135
4549
6342
811
812
147
721
105
332
364
400
423
408
19%
16%
15%
13%
19%
66%
67%
65%
67%
66%
11%12
%12
%15
%10
%2%
3%2%
3%3%
2%2%
5%2%
1%10
0%10
0%10
0%10
0%10
0%
Heal
th
Scie
nces
5877
7486
101
392
409
411
385
339
65
414
154
411
55
53
87
446
549
850
849
746
4
12%
15%
15%
17%
22%
84%
82%
81%
77%
73%
1%1%
1%3%
3%1%
1%2%
1%1%
1%1%
2%1%
1%10
0%10
0%10
0%10
0%10
0%
Hum
aniti
es21
019
517
919
524
653
555
053
558
045
882
11399
9112
629
2829
2721
1313
2325
1586
989
986
591
886
6
24%
22%
21%
21%
28%
62%
61%
62%
63%
53%
9%13
%11%
10%
15%
3%3%
3%3%
2%1%
1%3%
3%2%
100%
100%
100%
100%
100%
Law
1929
2829
2683
9210
683
779
117
2016
14
513
92
44
3112
138
150
149
131
17%
21%
19%
19%
20%
74%
67%
71%
56%
59%
8%8%
5%13
%12
%1%
3%3%
9%7%
0%1%
3%3%
2%10
0%10
0%10
0%10
0%10
0%
Scie
nce
3940
3840
49111
130
146
135
157
513
1412
75
1313
1010
13
33
316
119
921
420
022
6
24%
20%
18%
20%
22%
69%
65%
68%
68%
69%
3%7%
7%6%
3%3%
7%6%
5%4%
1%2%
1%2%
1%10
0%10
0%10
0%10
0%10
0%
TOTA
L NO.
498
549
523
545
605
1746
1821
1838
1732
1483
208
249
229
246
256
6768
7990
7036
4467
5630
2555
2731
2736
2669
2444
TOTA
L ROW
%19
%20
%19
%20
%25
%68
%67
%67
%65
%61
%8%
9%8%
9%10
%3%
2%3%
3%3%
1%2%
2%2%
1%10
0%10
0%10
0%10
0%10
0%
Per
cent
ages
sho
uld
be
read
acr
oss
eac
h ro
w.
Not
e: “
Oth
er”
acad
emic
sta
ndin
g c
od
es in
clud
e ca
ncel
lati
ons
and
dis
cip
linar
y co
des
.
QU
ALI
FIED
STA
ND
AR
D R
EAD
MIS
SIO
NFA
CU
LTY/
SEN
ATE
PER
MIS
SIO
NR
EFU
SED
REA
DM
ISSI
ON
OTH
ERTO
TAL

Tab
le 1
9DA
cad
emic
pro
gre
ss c
odes
of
all I
ndia
n un
der
gra
dua
tes
Facu
lty20
1520
1620
1720
1820
1920
1520
1620
1720
1820
1920
1520
1620
1720
1820
1920
1520
1620
1720
1820
1920
1520
1620
1720
1820
1920
1520
1620
1720
1820
19
Com
mer
ce95
103
120
139
109
370
381
326
230
147
5760
5846
334
99
83
95
95
229
455
852
242
829
4
18%
18%
23%
32%
37%
69%
68%
62%
54%
50%
11%11%
11%11%
11%1%
2%2%
2%1%
2%1%
2%1%
1%10
0%10
0%10
0%10
0%10
0%
EBE
3546
6657
5521
821
521
018
717
129
4245
3724
311
711
86
37
107
265
317
335
302
265
12%
15%
20%
19%
21%
75%
68%
63%
62%
65%
10%
13%
13%
12%
9%1%
3%2%
4%3%
2%1%
2%3%
3%10
0%10
0%10
0%10
0%10
0%
Heal
th
Scie
nces
2738
3040
3215
716
715
915
716
01
11
14
13
22
219
920
619
220
019
9
14%
18%
16%
20%
16%
84%
81%
83%
79%
80%
1%0%
1%1%
2%0%
0%0%
0%1%
2%0%
1%1%
1%10
0%10
0%10
0%10
0%10
0%
Hum
aniti
es35
5041
2835
103
8876
6555
1812
1111
105
22
63
65
34
310
615
713
3114
106
21%
32%
31%
25%
33%
62%
56%
57%
57%
52%
11%8%
8%10
%9%
3%1%
2%5%
3%4%
3%2%
4%3%
100%
100%
100%
100%
100%
Law
1216
1010
1639
3034
3540
15
712
51
12
22
6152
5361
61
23%
31%
19%
16%
26%
74%
58%
64%
57%
66%
2%10
%13
%20
%8%
2%2%
0%3%
0%0%
0%4%
3%0%
100%
100%
100%
100%
100%
Scie
nce
1024
1626
2145
6370
5551
53
52
11
24
21
31
7495
9685
74
16%
25%
17%
31%
28%
74%
66%
73%
65%
69%
8%3%
5%2%
1%2%
2%4%
2%1%
0%3%
1%0%
0%10
0%10
0%10
0%10
0%10
0%
TOTA
L NO.
214
277
283
300
268
932
944
875
729
624
111
123
127
109
7714
2522
2916
2416
2423
1499
913
8513
3111
9099
9
TOTA
L ROW
%17
%20
%21
%25
%27
%72
%68
%66
%61
%62
%9%
9%10
%9%
8%1%
2%2%
2%2%
2%1%
2%2%
1%10
0%10
0%10
0%10
0%10
0%
Per
cent
ages
sho
uld
be
read
acr
oss
eac
h ro
w.
Not
e: “
Oth
er”
acad
emic
sta
ndin
g c
od
es in
clud
e ca
ncel
lati
ons
and
dis
cip
linar
y co
des
.
QU
ALI
FIED
STA
ND
AR
D R
EAD
MIS
SIO
NFA
CU
LTY/
SEN
ATE
PER
MIS
SIO
NR
EFU
SED
REA
DM
ISSI
ON
OTH
ERTO
TAL

Tab
le 1
9EA
cad
emic
pro
gre
ss c
odes
of
all W
hite
und
erg
rad
uate
s
Facu
lty20
1520
1620
1720
1820
1920
1520
1620
1720
1820
1920
1520
1620
1720
1820
1920
1520
1620
1720
1820
1920
1520
1620
1720
1820
1920
1520
1620
1720
1820
19
Com
mer
ce36
736
539
633
029
210
2810
6282
750
924
345
5442
4526
1615
107
626
3230
92
1482
1528
1305
900
569
25%
24%
30%
37%
51%
69%
70%
63%
57%
43%
3%4%
3%5%
5%1%
1%1%
1%1%
2%2%
2%1%
0%10
0%10
0%10
0%10
0%10
0%
EBE
225
202
189
182
189
610
624
610
601
575
3451
3844
3614
614
114
1322
2818
1389
690
587
985
681
7
25%
22%
22%
21%
23%
68%
69%
69%
70%
70%
4%6%
4%5%
4%2%
1%2%
1%0%
1%2%
3%2%
2%10
0%10
0%10
0%10
0%10
0%
Heal
th
Scie
nces
11779
103
122
104
427
444
428
383
352
12
22
11
74
811
455
352
954
151
746
2
21%
15%
19%
24%
23%
77%
84%
79%
74%
76%
0%0%
0%0%
0%0%
0%0%
0%0%
1%1%
1%2%
1%10
0%10
0%10
0%10
0%10
0%
Hum
aniti
es39
634
234
731
623
282
173
758
744
240
354
5041
2933
1210
78
224
1822
2213
1307
1157
1004
817
683
30%
30%
35%
39%
34%
63%
64%
58%
54%
59%
4%4%
4%4%
5%1%
1%1%
1%0%
2%2%
2%3%
2%10
0%10
0%10
0%10
0%10
0%
Law
8698
8969
6717
714
0110
9782
57
97
23
22
41
22
326
524
721
017
916
3
32%
40%
42%
39%
41%
67%
57%
52%
54%
50%
0%2%
3%5%
4%1%
1%1%
1%2%
0%0%
1%1%
2%10
0%10
0%10
0%10
0%10
0%
Scie
nce
146
140
165
159
136
369
405
346
328
345
514
56
88
117
54
49
129
953
257
953
550
750
2
27%
24%
31%
31%
27%
69%
70%
65%
65%
69%
1%2%
1%1%
2%2%
2%1%
1%1%
1%2%
2%2%
2%10
0%10
0%10
0%10
0%10
0%
TOTA
L NO.
1337
1226
1289
1178
1020
3432
3412
2908
2360
2000
138
175
135
133
112
5446
4034
2074
8610
271
4450
3549
4544
7437
7631
96
TOTA
L ROW
%27
%25
%29
%31
%32
%68
%69
%65
%63
%63
%3%
4%3%
4%4%
1%1%
1%1%
1%1%
2%2%
2%1%
100%
100%
100%
100%
100%
Per
cent
ages
sho
uld
be
read
acr
oss
eac
h ro
w.
Not
e: “
Oth
er”
acad
emic
sta
ndin
g c
od
es in
clud
e ca
ncel
lati
ons
and
dis
cip
linar
y co
des
.
QU
ALI
FIED
STA
ND
AR
D R
EAD
MIS
SIO
NFA
CU
LTY/
SEN
ATE
PER
MIS
SIO
NR
EFU
SED
REA
DM
ISSI
ON
OTH
ERTO
TAL

Tab
le 1
9FA
cad
emic
pro
gre
ss c
odes
of
all I
nter
nati
onal
und
erg
rad
uate
s
Facu
lty20
1520
1620
1720
1820
1920
1520
1620
1720
1820
1920
1520
1620
1720
1820
1920
1520
1620
1720
1820
1920
1520
1620
1720
1820
1920
1520
1620
1720
1820
19
Com
mer
ce10
313
213
710
578
315
314
270
239
236
3647
5030
3616
512
1210
610
126
1147
650
848
139
237
1
22%
26%
28%
27%
21%
66%
62%
56%
61%
64%
8%9%
10%
8%10
%3%
1%2%
3%3%
1%2%
2%2%
3%10
0%10
0%10
0%10
0%10
0%
EBE
104
100
8312
410
637
141
340
135
735
935
4865
5248
1013
1812
1812
1332
97
532
587
599
554
538
20%
17%
14%
22%
20%
70%
70%
67%
64%
67%
7%8%
11%9%
9%2%
2%3%
2%3%
2%2%
5%2%
1%10
0%10
0%10
0%10
0%10
0%
Heal
th
Scie
nces
9510
55
825
017
1514
630
56
386
2720
1914
25%
37%
25%
26%
57%
65%
63%
75%
74%
43%
8%0%
0%0%
0%1%
0%0%
0%0%
2%0%
0%0%
0%10
0%10
0%10
0%10
0%10
0%
Hum
aniti
es13
9297
122
7933
257
257
190
162
234
2924
251
78
113
69
157
4939
640
036
227
6
27%
23%
24%
34%
29%
67%
65%
64%
52%
59%
4%9%
7%7%
9%2%
2%2%
3%1%
0%2%
2%4%
3%10
0%10
0%10
0%10
0%10
0%
Law
1214
1310
1820
3433
3033
44
48
14
31
11
132
5451
4963
38%
26%
25%
20%
29%
63%
63%
65%
61%
52%
0%7%
8%8%
13%
0%2%
0%8%
5%0%
2%2%
2%2%
100%
100%
100%
100%
100%
Scie
nce
4343
3025
3010
073
6168
642
38
24
61
34
34
31
22
155
123
103
101
103
28%
35%
29%
25%
29%
65%
59%
59%
67%
62%
1%2%
8%2%
4%4%
1%3%
4%3%
3%2%
1%2%
2%10
0%10
0%10
0%10
0%10
0%
TOTA
L NO.
370
391
365
391
319
1089
1108
1037
898
860
105
136
156
112
121
3827
4143
3728
3355
3328
1630
1695
1654
1477
1365
TOTA
L ROW
%23
%23
%22
%26
%23
%67
%65
%63
%61
%63
%6%
8%9%
8%9%
2%2%
2%3%
3%2%
2%3%
2%2%
100%
100%
100%
100%
100%
Per
cent
ages
sho
uld
be
read
acr
oss
eac
h ro
w.
Not
e: “
Oth
er”
acad
emic
sta
ndin
g c
od
es in
clud
e ca
ncel
lati
ons
and
dis
cip
linar
y co
des
.
QU
ALI
FIED
STA
ND
AR
D R
EAD
MIS
SIO
NFA
CU
LTY/
SEN
ATE
PER
MIS
SIO
NR
EFU
SED
REA
DM
ISSI
ON
OTH
ERTO
TAL

182
UNIVERSITY OF CAPE TOWN | TEACHING & LEARNING REPORT 2019
ARTS – BA COMMERCE ENGINEERING – BSC(ENG) LAW
Table 20AFive-year cohort survival analysis of the 2011, 2012, 2013, 2014 and 2015 intakes of first-time entering undergraduates five years after initial enrolment in five large faculties: All students (SA and International)
Status after five years
2011 intake
2012 intake
2013 intake
2014 intake
2015 intake
2011 intake
2012 intake
2013 intake
2014 intake
2015 intake
2011 intake
2012 intake
2013 intake
2014 intake
2015 intake
2011 intake
2012 intake
2013 intake
2014 intake
2015 intake
407 365 243 305 286 795 873 928 921 938 330 383 346 361 345 25 27 35 42 35
76% 76% 75% 75% 74% 77% 76% 77% 78% 73% 66% 72% 72% 75% 64% 71% 56% 52% 69% 49%
20 16 4 17 18 72 97 88 78 114 46 42 36 36 99 6 6 16 8 12
4% 3% 1% 4% 5% 7% 8% 7% 7% 9% 9% 8% 8% 7% 18% 17% 13% 24% 13% 17%
68 57 49 60 65 68 89 87 100 135 27 45 42 39 43 3 3 10 5 7
13% 12% 15% 15% 17% 7% 8% 7% 8% 10% 5% 8% 9% 8% 8% 9% 6% 15% 8% 10%
39 43 30 27 19 88 94 95 85 99 100 65 54 45 56 1 12 6 6 18
7% 9% 9% 7% 5% 9% 8% 8% 7% 8% 20% 12% 11% 9% 10% 3% 25% 9% 10% 25%
535 481 326 409 388 1029 1153 1198 1184 1286 503 535 478 481 543 35 48 67 61 72
100% 100% 100% 100% 100% 100% 100% 100% 100% 100% 100% 100% 100% 100% 100% 100% 100% 100% 100% 100%
Completed
undergraduate
bachelor’s
degree
(graduated)
Continuing
undergraduate
studies
Dropped out in
good academic
standing
Refused
readmission
on academic
grounds
TOTAL
SCIENCE SOCIAL SCIENCE – BSOCSC TOTAL
Status after five years
2011 intake
2012 intake
2013 intake
2014 intake
2015 intake
2011 intake
2012 intake
2013 intake
2014 intake
2015 intake
2011 intake
2012 intake
2013 intake
2014 intake
2015 intake
269 321 285 290 305 308 365 419 388 378 2282 2282 2219 2233 2287
63% 65% 68% 70% 72% 74% 76% 75% 72% 70% 72% 72% 73% 73% 70%
21 21 44 34 31 13 17 24 27 32 254 254 259 250 306
5% 4% 10% 8% 7% 3% 4% 4% 5% 6% 8% 8% 8% 8% 9%
33 49 34 31 31 50 55 64 68 60 291 291 276 299 341
8% 10% 8% 8% 7% 12% 11% 11% 13% 11% 9% 9% 9% 10% 10%
103 100 58 58 56 43 46 53 53 68 360 360 296 266 316
24% 20% 14% 14% 13% 10% 10% 9% 10% 13% 11% 11% 10% 9% 10%
427 491 421 413 423 416 483 560 536 538 3187 3187 3050 3048 3250
100% 100% 100% 100% 100% 100% 100% 100% 100% 100% 100% 100% 100% 100% 100%
Notes:1. This table is an analysis of the academic progress of the 2011, 2012, 2013, 2014 and 2015 FU cohorts carried out five years after
their initial enrolment at UCT. 2. Students who graduated did not necessarily obtain their degrees in the faculty in which they first enrolled as FU students.3. Students continuing their studies were not necessarily registered in the faculty in which they enrolled as first-time entering
students. 4. Students dropping out in good academic standing are students who left the university without completing a degree, and
whose final undergraduate academic progress codes entitled them to re-register for undergraduate studies at UCT. 5. The Commerce intakes include students enrolling for the three-year BCom and for the four-year BBusSc. 6. The Engineering total is for four-year degrees only. Engineering figures are updated after six years because of the large
numbers of students taking six years to complete their studies. 7. Percentages are to be read down each column. 8. “Other” academic codes not shown individually but included in the total include long leave, expulsions, rustication and
disciplinary codes.
Completed
undergraduate
bachelor’s
degree
(graduated)
Continuing
undergraduate
studies
Dropped out in
good academic
standing
Refused
readmission
on academic
grounds
TOTAL

183
UNIVERSITY OF CAPE TOWN | TEACHING & LEARNING REPORT 2019
ARTS – BA COMMERCE ENGINEERING – BSC(ENG) LAW
Table 20BFive-year cohort survival analysis of the 2011, 2012, 2013, 2014 and 2015 intakes of first-time entering undergraduates five years after initial enrolment in five large faculties: African students
Status after five years
2011 intake
2012 intake
2013 intake
2014 inake
2015 intake
2011 intake
2012 intake
2013 intake
2014 inake
2015 intake
2011 intake
2012 intake
2013 intake
2014 inake
2015 intake
2011 intake
2012 intake
2013 intake
2014 inake
2015 intake
64 43 31 65 48 204 258 249 233 193 81 83 80 81 63 4 9 11 12 10
63% 60% 53% 64% 70% 67% 68% 69% 69% 65% 43% 50% 50% 65% 53% 50% 43% 39% 57% 33%
9 4 4 6 9 30 51 41 37 42 25 16 17 10 29 2 4 9 5 4
9% 6% 7% 6% 13% 10% 13% 11% 11% 14% 13% 50% 30% 8% 25% 25% 19% 32% 24% 13%
10 10 13 17 8 23 32 18 27 29 8 13 14 11 4 1 0 4 1 5
10% 14% 22% 17% 12% 8% 8% 5% 8% 10% 4% 50% 7% 9% 3% 13% 0% 14% 5% 17%
18 15 11 13 4 47 41 51 42 33 74 32 18 22 22 1 8 4 3 11
18% 21% 19% 13% 6% 15% 11% 14% 12% 11% 39% 50% 13% 18% 19% 13% 38% 14% 14% 37%
102 72 59 101 69 305 382 359 339 297 188 144 129 124 118 8 21 28 21 30
100% 100% 100% 100% 100% 100% 100% 100% 100% 100% 100% 50% 100% 100% 100% 100% 100% 100% 100% 100%
Completed
undergraduate
bachelor’s
degree
(graduated)
Continuing
undergraduate
studies
Dropped out in
good academic
standing
Refused
readmission
on academic
grounds
TOTAL
SCIENCE SOCIAL SCIENCE – BSOCSC TOTAL
Status after five years
2011 intake
2012 intake
2013 intake
2014 inake
2015 intake
2011 intake
2012 intake
2013 intake
2014 inake
2015 intake
2011 intake
2012 intake
2013 intake
2014 inake
2015 intake
71 54 44 64 65 41 73 135 121 112 502 502 533 554 491
47% 42% 44% 46% 52% 56% 62% 66% 63% 57% 57% 57% 61% 61% 59%
12 7 20 19 20 6 8 14 16 15 119 119 126 121 119
8% 5% 20% 14% 16% 8% 7% 7% 8% 8% 14% 14% 14% 13% 14%
7 20 10 13 3 7 14 21 22 25 89 89 75 87 74
5% 16% 10% 9% 2% 10% 12% 10% 12% 13% 10% 10% 9% 10% 9%
60 48 27 42 36 18 22 35 32 45 165 165 144 150 151
40% 37% 27% 30% 29% 25% 19% 17% 17% 23% 19% 19% 16% 16% 18%
151 129 101 138 124 73 117 205 191 197 875 875 877 912 835
100% 100% 100% 100% 100% 100% 100% 100% 100% 100% 100% 100% 100% 100% 100%
Completed
undergraduate
bachelor’s
degree
(graduated)
Continuing
undergraduate
studies
Dropped out in
good academic
standing
Refused
readmission
on academic
grounds
TOTAL

184
UNIVERSITY OF CAPE TOWN | TEACHING & LEARNING REPORT 2019
ARTS – BA COMMERCE ENGINEERING – BSC(ENG) LAW
Table 20CFive-year cohort survival analysis of the 2011, 2012, 2013, 2014 and 2015 intakes of first-time entering undergraduates five years after initial enrolment in five large faculties: Coloured students
Status after five years
2011 intake
2012 intake
2013 intake
2014 intake
2015 intake
2011 intake
2012 intake
2013 intake
2014 intake
2015 intake
2011 intake
2012 intake
2013 intake
2014 intake
2015 intake
2011 intake
2012 intake
2013 intake
2014 intake
2015 intake
66 50 37 68 51 84 72 123 115 115 30 37 33 43 35 7 4 7 10 10
73% 71% 62% 74% 69% 76% 67% 76% 75% 74% 63% 70% 70% 68% 58% 78% 50% 50% 67% 63%
4 4 0 3 4 17 14 13 8 14 8 8 5 10 14 2 2 4 0 4
4% 6% 0% 3% 5% 15% 13% 8% 5% 9% 17% 15% 11% 16% 23% 22% 25% 29% 0% 25%
11 5 9 12 11 5 5 11 14 11 3 2 2 3 3 0 1 2 2 0
12% 7% 15% 13% 15% 3% 3% 7% 9% 7% 6% 4% 4% 5% 5% 0% 13% 14% 13% 0%
10 11 14 9 8 3 16 14 16 15 6 6 7 7 8 0 1 1 3 2
11% 16% 23% 10% 11% 3% 15% 9% 10% 10% 13% 11% 15% 11% 13% 0% 13% 7% 20% 13%
91 70 60 92 74 111 107 161 153 155 48 53 47 63 60 9 8 14 15 16
100% 100% 100% 100% 100% 100% 100% 100% 100% 100% 100% 100% 100% 100% 100% 100% 100% 100% 100% 100%
Completed
undergraduate
bachelor’s
degree
(graduated)
Continuing
undergraduate
studies
Dropped out in
good academic
standing
Refused
readmission
on academic
grounds
TOTAL
SCIENCE SOCIAL SCIENCE – BSOCSC TOTAL
Status after five years
2011 intake
2012 intake
2013 intake
2014 intake
2015 intake
2011 intake
2012 intake
2013 intake
2014 intake
2015 intake
2011 intake
2012 intake
2013 intake
2014 intake
2015 intake
28 35 30 37 25 51 52 78 84 75 236 236 302 344 311
62% 59% 70% 82% 74% 64% 70% 74% 67% 77% 65% 65% 70% 71% 71%
3 6 5 2 1 3 3 4 7 7 43 43 35 36 44
7% 10% 12% 4% 3% 4% 4% 4% 6% 7% 12% 12% 8% 7% 10%
2 3 3 2 2 14 9 15 19 8 24 24 43 52 35
4% 5% 7% 4% 6% 18% 12% 14% 15% 8% 7% 7% 10% 11% 8%
12 15 5 4 5 12 10 8 15 7 60 60 49 53 45
27% 25% 12% 9% 15% 15% 14% 8% 12% 7% 17% 17% 11% 11% 10%
45 59 43 45 34 80 74 105 125 97 363 363 429 485 436
100% 100% 100% 100% 100% 100% 100% 100% 100% 100% 100% 100% 100% 100% 100%
Completed
undergraduate
bachelor’s
degree
(graduated)
Continuing
undergraduate
studies
Dropped out in
good academic
standing
Refused
readmission
on academic
grounds
TOTAL

185
UNIVERSITY OF CAPE TOWN | TEACHING & LEARNING REPORT 2019
ARTS – BA COMMERCE ENGINEERING – BSC(ENG) LAW
Table 20DFive-year cohort survival analysis of the 2011, 2012, 2013, 2014 and 2015 intakes of first-time entering undergraduates five years after initial enrolment in five large faculties: Indian students
Status after five years
2011 intake
2012 intake
2013 intake
2014 intake
2015 intake
2011 intake
2012 intake
2013 intake
2014 intake
2015 intake
2011 intake
2012 intake
2013 intake
2014 intake
2015 intake
2011 intake
2012 intake
2013 intake
2014 intake
2015 intake
13 11 10 6 9 82 82 101 130 91 31 29 40 63 42 3 3 5 4 4
65% 73% 100% 50% 69% 71% 72% 75% 76% 71% 69% 73% 68% 79% 54% 100% 75% 83% 57% 44%
2 0 0 2 2 12 11 12 15 16 5 3 2 4 22 0 0 1 2 2
10% 0% 0% 17% 15% 13% 10% 9% 9% 13% 11% 8% 3% 5% 28% 0% 0% 17% 29% 22%
4 1 0 4 1 11 9 16 21 12 3 3 6 6 8 0 0 0 1 1
20% 7% 0% 33% 8% 9% 8% 12% 12% 9% 7% 8% 10% 8% 10% 0% 0% 0% 14% 11%
1 3 0 0 1 11 12 6 6 9 6 5 11 7 6 0 1 0 0 2
5% 20% 0% 0% 8% 9% 11% 4% 3% 7% 13% 13% 19% 9% 8% 0% 25% 0% 0% 22%
20 15 10 12 13 116 114 135 172 128 45 40 59 80 78 3 4 6 7 9
100% 100% 100% 100% 100% 100% 100% 100% 100% 100% 100% 100% 100% 100% 100% 100% 100% 100% 100% 100%
Completed
undergraduate
bachelor’s
degree
(graduated)
Continuing
undergraduate
studies
Dropped out in
good academic
standing
Refused
readmission
on academic
grounds
TOTAL
SCIENCE SOCIAL SCIENCE – BSOCSC TOTAL
Status after five years
2011 intake
2012 intake
2013 intake
2014 intake
2015 intake
2011 intake
2012 intake
2013 intake
2014 intake
2015 intake
2011 intake
2012 intake
2013 intake
2014 intake
2015 intake
16 11 12 20 10 10 14 24 20 11 147 147 189 236 167
64% 55% 75% 91% 83% 77% 88% 75% 77% 73% 70% 70% 73% 75% 65%
1 1 2 0 0 2 0 0 2 1 17 17 21 30 43
4% 5% 13% 0% 0% 15% 0% 0% 8% 7% 8% 8% 8% 10% 17%
4 2 0 1 1 0 2 3 1 2 16 16 25 32 25
16% 10% 0% 5% 8% 0% 13% 9% 4% 13% 8% 8% 10% 10% 10%
4 6 2 1 1 1 0 5 3 0 29 29 24 17 19
16% 30% 13% 5% 8% 8% 0% 16% 12% 0% 14% 14% 9% 5% 7%
25 20 16 22 12 13 16 32 26 15 209 209 259 315 255
100% 100% 100% 100% 100% 100% 100% 100% 100% 100% 100% 100% 100% 100% 100%
Completed
undergraduate
bachelor’s
degree
(graduated)
Continuing
undergraduate
studies
Dropped out in
good academic
standing
Refused
readmission
on academic
grounds
TOTAL

186
UNIVERSITY OF CAPE TOWN | TEACHING & LEARNING REPORT 2019
ARTS – BA COMMERCE ENGINEERING – BSC(ENG) LAW
Table 20EFive-year cohort survival analysis of the 2011, 2012, 2013, 2014 and 2015 intakes of first-time entering undergraduates five years after initial enrolment in five large faculties: White students
Status after five years
2011 intake
2012 intake
2013 intake
2014 intake
2015 intake
2011 intake
2012 intake
2013 intake
2014 intake
2015 intake
2011 intake
2012 intake
2013 intake
2014 intake
2015 intake
2011 intake
2012 intake
2013 intake
2014 intake
2015 intake
203 189 133 119 123 292 331 331 311 328 111 155 124 114 120 8 8 6 10 6
81% 79% 83% 82% 85% 90% 87% 87% 87% 83% 89% 82% 88% 84% 75% 80% 100% 67% 83% 86%
3 5 0 6 0 7 12 10 9 15 3 9 5 8 12 1 0 1 1 0
1% 2% 0% 4% 0% 2% 3% 3% 3% 4% 2% 5% 4% 6% 8% 10% 0% 11% 8% 0%
37 34 24 17 21 14 27 28 27 39 6 16 5 10 20 1 0 2 1 0
15% 14% 15% 12% 14% 4% 7% 7% 8% 10% 5% 9% 4% 7% 13% 10% 0% 22% 8% 0%
8 10 3 3 1 11 11 10 9 13 5 8 7 3 8 0 0 0 1
3% 4% 2% 2% 1% 3% 3% 3% 3% 3% 4% 4% 5% 2% 5% 0% 0% 0% 0% 14%
251 238 160 145 145 324 381 379 356 395 125 188 141 135 160 10 8 9 12 7
100% 100% 100% 100% 100% 100% 100% 100% 100% 100% 100% 100% 100% 100% 100% 100% 100% 100% 100% 100%
Completed
undergraduate
bachelor’s
degree
(graduated)
Continuing
undergraduate
studies
Dropped out in
good academic
standing
Refused
readmission
on academic
grounds
TOTAL
SCIENCE SOCIAL SCIENCE – BSOCSC TOTAL
Status after five years
2011 intake
2012 intake
2013 intake
2014 intake
2015 intake
2011 intake
2012 intake
2013 intake
2014 intake
2015 intake
2011 intake
2012 intake
2013 intake
2014 intake
2015 intake
110 150 121 114 140 142 167 106 102 79 941 981 813 753 796
84% 82% 78% 83% 81% 84% 86% 83% 86% 83% 83% 83% 83% 85% 82%
4 6 12 7 7 0 2 3 2 1 44 46 41 37 35
3% 3% 8% 5% 4% 0% 1% 2% 2% 1% 4% 4% 4% 4% 4%
12 15 13 11 15 22 19 17 15 12 106 109 89 80 107
9% 8% 8% 8% 9% 13% 10% 13% 13% 13% 9% 9% 9% 9% 11%
5 13 9 5 10 5 7 1 0 3 39 47 31 20 36
4% 7% 6% 4% 6% 3% 4% 1% 0% 3% 3% 4% 3% 2% 4%
131 184 155 137 172 170 195 127 119 95 1130 1183 974 890 974
100% 100% 100% 100% 100% 100% 100% 100% 100% 100% 100% 100% 100% 100% 100%
Completed
undergraduate
bachelor’s
degree
(graduated)
Continuing
undergraduate
studies
Dropped out in
good academic
standing
Refused
readmission
on academic
grounds
TOTAL

187
UNIVERSITY OF CAPE TOWN | TEACHING & LEARNING REPORT 2019
COMMERCE – BCOM COMMERCE – BBUSSC ENGINEERING – BSC(ENG) LAW
TABLE 21Five-year cohort survival analysis of the 2011, 2012, 2013, 2014 and 2015 intakes of first-time entering undergraduates five years after initial enrolment in five large faculties: All students in extended programmes
Status after five years
2011 intake
2012 intake
2013 intake
2014 intake
2015 intake
2011 intake
2012 intake
2013 intake
2014 intake
2015 intake
2011 intake
2012 intake
2013 intake
2014 intake
2015 intake
2011 intake
2012 intake
2013 intake
2014 intake
2015 intake
92 74 102 83 80 52 74 93 87 93 13 39 20 49 46 2 6 4 4 3
65% 62% 68% 66% 60% 60% 62% 68% 64% 68% 25% 48% 37% 59% 39% 40% 55% 22% 33% 16%
21 18 21 11 24 12 24 17 23 22 9 9 12 7 36 3 4 8 4 7
15% 15% 14% 9% 18% 14% 20% 12% 17% 16% 17% 11% 22% 8% 31% 60% 36% 44% 33% 37%
14 11 5 14 11 6 9 12 10 5 2 7 7 9 8 0 0 1 2 2
10% 9% 3% 11% 8% 7% 8% 9% 7% 4% 4% 9% 13% 11% 7% 0% 0% 6% 17% 11%
14 16 21 17 18 16 12 15 15 17 18 27 15 18 28 0 1 5 2 7
10% 13% 14% 13% 14% 18% 10% 11% 11% 12% 34% 33% 28% 22% 24% 0% 9% 28% 17% 37%
141 119 149 126 133 87 119 137 135 137 53 82 54 83 118 5 11 18 12 19
100% 100% 100% 100% 100% 100% 100% 100% 100% 100% 100% 100% 100% 100% 100% 100% 100% 100% 100% 100%
Completed
undergraduate
bachelor’s
degree
(graduated)
Continuing
undergraduate
studies
Dropped out in
good academic
standing
Refused
readmission
on academic
grounds
TOTAL
SCIENCE BA + BSOCSC TOTAL
Status after five years
2011 intake
2012 intake
2013 intake
2014 intake
2015 intake
2011 intake
2012 intake
2013 intake
2014 intake
2015 intake
2011 intake
2012 intake
2013 intake
2014 intake
2015 intake
23 30 27 54 31 91 58 105 122 115 267 267 351 399 368
32% 40% 38% 49% 52% 61% 52% 54% 53% 53% 52% 52% 56% 57% 54%
10 7 20 21 12 14 10 18 21 27 90 90 96 87 128
14% 9% 28% 19% 20% 9% 9% 9% 9% 12% 17% 17% 15% 13% 19%
3 7 6 5 1 14 17 31 38 28 51 51 62 78 55
4% 9% 8% 5% 2% 9% 15% 16% 17% 13% 10% 10% 10% 11% 8%
36 31 18 30 16 29 27 42 49 49 110 110 116 131 135
49% 41% 25% 27% 27% 19% 24% 21% 21% 22% 21% 21% 19% 19% 20%
73 75 71 110 60 150 112 196 230 219 518 518 625 696 686
100% 100% 100% 100% 100% 100% 100% 100% 100% 100% 100% 100% 100% 100% 100%
Completed
undergraduate
bachelor’s
degree
(graduated)
Continuing
undergraduate
studies
Dropped out in
good academic
standing
Refused
readmission
on academic
grounds
TOTAL

188
UNIVERSITY OF CAPE TOWN | TEACHING & LEARNING REPORT 2019
ARTS – BA COMMERCE – BCOM COMMERCE – BBUSSC ENGINEERING – BSC(ENG)
Table 22AYears to completion among graduates within the 2011, 2012, 2013, 2014 and 2015 first-time entering undergraduate cohorts after initial enrolment in five large faculties: All students (SA and International)
Years to graduation
2011 intake
2012 intake
2013 intake
2014 intake
2015 intake
2011 intake
2012 intake
2013 intake
2014 intake
2015 intake
2011 intake
2012 intake
2013 intake
2014 intake
2015 intake
2011 intake
2012 intake
2013 intake
2014 intake
2015 intake
3 years 267 230 231 208 211 146 146 157 164 175 19 20 31 25 47 3 2 3 2 4
64% 70% 69% 65% 74% 39% 36% 43% 48% 51% 4% 4% 5% 4% 8% 1% 1% 1% 1% 1%
4 years 99 76 76 75 58 150 156 150 113 113 307 329 352 404 413 187 207 218 204 218
24% 23% 23% 23% 20% 40% 39% 41% 33% 33% 67% 62% 61% 65% 69% 56% 55% 60% 59% 70%
5 years 41 17 22 25 17 56 79 45 57 55 117 149 162 160 135 98 123 105 97 123
10% 5% 7% 8% 6% 15% 20% 12% 17% 16% 25% 28% 28% 26% 23% 30% 32% 29% 28% 39%
6 years 9 6 7 12 0 23 21 14 9 0 18 32 35 36 0 43 47 35 44 0
2% 2% 2% 4% 0% 6% 5% 4% 3% 0% 4% 6% 6% 6% 0% 13% 12% 10% 13% 0%
ALL
GRADUATES
416 329 335 320 286 375 402 366 343 343 461 530 580 625 595 331 379 361 347 313
100% 100% 100% 100% 100% 100% 100% 100% 100% 100% 100% 100% 100% 100% 100% 100% 100% 100% 100% 100%
LAW SCIENCE SOCIAL SCIENCE – BSOCSC TOTAL
Years to graduation
2011 intake
2012 intake
2013 intake
2014 intake
2015 intake
2011 intake
2012 intake
2013 intake
2014 intake
2015 intake
2011 intake
2012 intake
2013 intake
2014 intake
2015 intake
2011 intake
2012 intake
2013 intake
2014 intake
2015 intake
3 years 1 0 5 2 0 133 184 166 155 174 190 227 193 206 209 809 785 785 762 820
3% 0% 12% 4% 0% 48% 55% 54% 51% 57% 60% 61% 55% 53% 51% 34% 35% 33% 32% 36%
4 years 14 15 22 30 23 91 90 92 81 86 78 103 108 124 143 976 1016 1018 1031 1054
48% 50% 51% 63% 70% 33% 27% 30% 27% 28% 25% 28% 31% 32% 35% 41% 46% 43% 43% 46%
5 years 10 12 7 10 13 45 48 27 54 45 40 35 48 46 56 463 412 416 449 444
34% 40% 16% 21% 39% 16% 14% 9% 18% 15% 13% 9% 14% 12% 14% 20% 19% 18% 19% 19%
6 years 4 3 9 6 0 9 10 24 15 0 7 5 11 11 0 124 0 135 133 0
14% 10% 21% 13% 0% 3% 3% 8% 5% 0% 2% 1% 3% 3% 0% 5% 0% 6% 6% 0%
ALL
GRADUATES
29 30 43 48 33 278 332 309 305 305 315 370 348 387 408 2372 2213 2354 2375 2283
100% 100% 100% 100% 100% 100% 100% 100% 100% 100% 100% 100% 100% 100% 100% 100% 100% 100% 100% 100%
Notes:
1. This table is an analysis of the academic progress of the 2011, 2012, 2013, 2014 and 2015 FU cohorts carried out five years after their initial enrolment at UCT.
2. Students who graduated did not necessarily obtain their degrees in the faculty in which they first enrolled as FU students.
3. Students continuing their studies were not necessarily registered in the faculty in which they enrolled as first-time entering students.
4. Students dropping out in good academic standing are students who left the university without completing a degree, and whose final undergraduate academic progress
codes entitled them to re-register for undergraduate studies at UCT.
5. The Commerce intakes include students enrolling for the three-year BCom and for the four-year BBusSc.
6. The Engineering total is for four-year degrees only.
7. Percentages are to be read down each column.
8. “Other” academic codes not shown individually but included in the total include long leave, expulsions, rustication and disciplinary codes.

189
UNIVERSITY OF CAPE TOWN | TEACHING & LEARNING REPORT 2019
ARTS – BA COMMERCE – BCOM COMMERCE – BBUSSC ENGINEERING – BSC(ENG)
Table 22BYears to completion among graduates within the 2011, 2012, 2013, 2014 and 2015 first-time entering undergraduate cohorts after initial enrolment in five large faculties: African students
Years to graduation
2011 intake
2012 intake
2013 intake
2014 intake
2015 intake
2011 intake
2012 intake
2013 intake
2014 intake
2015 intake
2011 intake
2012 intake
2013 intake
2014 intake
2015 intake
2011 intake
2012 intake
2013 intake
2014 intake
2015 intake
3 years 28 19 30 26 25 38 41 45 39 41 0 4 6 3 10 1 0 0 1 0
41% 48% 56% 40% 52% 32% 26% 33% 34% 39% 0% 3% 5% 3% 11% 1% 0% 0% 1% 0%
4 years 26 15 14 28 18 46 66 62 48 40 57 61 62 71 45 26 25 40 36 27
38% 38% 26% 43% 38% 38% 41% 45% 42% 38% 55% 49% 48% 60% 51% 32% 28% 48% 44% 43%
5 years 10 5 8 11 5 25 40 24 28 23 38 49 48 44 34 32 40 30 25 35
15% 13% 15% 17% 10% 21% 25% 17% 24% 22% 37% 39% 38% 37% 38% 39% 45% 36% 31% 56%
6 years 4 1 2 0 0 11 13 7 0 0 9 11 12 0 0 23 24 13 19 0
6% 3% 4% 0% 0% 9% 8% 5% 0% 0% 9% 9% 9% 0% 0% 28% 27% 16% 23% 0%
ALL
GRADUATES
68 40 54 65 48 120 160 138 115 104 104 125 128 118 89 82 89 83 81 63
100% 100% 100% 100% 100% 100% 100% 100% 100% 100% 100% 100% 100% 100% 100% 100% 100% 100% 100% 100%
LAW SCIENCE SOCIAL SCIENCE – BSOCSC TOTAL
Years to graduation
2011 intake
2012 intake
2013 intake
2014 intake
2015 intake
2011 intake
2012 intake
2013 intake
2014 intake
2015 intake
2011 intake
2012 intake
2013 intake
2014 intake
2015 intake
2011 intake
2012 intake
2013 intake
2014 intake
2015 intake
3 years 0 0 0 1 0 16 11 14 14 18 19 30 37 42 35 105 132 132 126 129
0% 0% 0% 8% 0% 21% 19% 25% 22% 28% 44% 39% 31% 35% 31% 19% 25% 22% 23% 26%
4 years 4 3 9 8 6 34 25 22 23 26 12 29 52 55 49 224 261 261 269 211
67% 27% 56% 67% 60% 44% 42% 40% 36% 40% 28% 38% 43% 45% 44% 40% 49% 44% 49% 43%
5 years 2 6 2 3 4 21 18 9 27 21 10 14 24 24 29 172 141 145 159 151
33% 55% 13% 25% 40% 27% 31% 16% 42% 32% 23% 18% 20% 20% 26% 31% 26% 24% 29% 31%
6 years 0 2 5 0 0 7 5 10 0 0 2 4 7 0 0 60 56 56 0 0
0% 18% 31% 0% 0% 9% 8% 18% 0% 0% 5% 5% 6% 0% 0% 11% 10% 9% 0% 0%
ALL
GRADUATES
6 11 16 12 10 78 59 55 64 65 43 77 120 121 112 561 534 594 554 491
100% 100% 100% 100% 100% 100% 100% 100% 100% 100% 100% 100% 100% 100% 100% 100% 100% 100% 100% 100%

190
UNIVERSITY OF CAPE TOWN | TEACHING & LEARNING REPORT 2019
ARTS – BA COMMERCE – BCOM COMMERCE – BBUSSC ENGINEERING – BSC(ENG)
Table 22CYears to completion among graduates within the 2011, 2012, 2013, 2014 and 2015 first-time entering undergraduate cohorts after initial enrolment in five large faculties: Coloured students
Years to graduation
2011 intake
2012 intake
2013 intake
2014 intake
2015 intake
2011 intake
2012 intake
2013 intake
2014 intake
2015 intake
2011 intake
2012 intake
2013 intake
2014 intake
2015 intake
2011 intake
2012 intake
2013 intake
2014 intake
2015 intake
3 years 36 18 30 41 29 23 17 30 27 25 3 1 2 2 2 0 0 0 0 1
52% 35% 48% 60% 57% 35% 44% 46% 47% 51% 8% 2% 3% 4% 3% 0% 0% 0% 0% 3%
4 years 21 24 25 22 18 22 8 23 20 14 19 23 37 33 47 19 17 18 20 19
30% 46% 40% 32% 35% 34% 21% 35% 34% 29% 48% 47% 53% 58% 71% 61% 46% 49% 47% 54%
5 years 11 8 6 5 4 13 11 9 11 10 14 19 25 22 17 16 14 14 18 15
16% 15% 10% 7% 8% 20% 28% 14% 19% 20% 35% 39% 36% 39% 26% 52% 38% 38% 42% 43%
6 years 1 2 2 0 0 7 3 3 0 0 4 6 6 0 0 3 6 5 5 0
1% 4% 3% 0% 0% 11% 8% 5% 0% 0% 10% 12% 9% 0% 0% 10% 16% 14% 12% 0%
ALL
GRADUATES
69 52 63 68 51 65 39 65 58 49 40 49 70 57 66 31 37 37 43 35
100% 100% 100% 100% 100% 100% 100% 100% 100% 100% 100% 100% 100% 100% 100% 100% 100% 100% 100% 100%
LAW SCIENCE SOCIAL SCIENCE – BSOCSC TOTAL
Years to graduation
2011 intake
2012 intake
2013 intake
2014 intake
2015 intake
2011 intake
2012 intake
2013 intake
2014 intake
2015 intake
2011 intake
2012 intake
2013 intake
2014 intake
2015 intake
2011 intake
2012 intake
2013 intake
2014 intake
2015 intake
3 years 0 0 1 0 0 14 18 12 15 11 25 27 30 41 26 81 106 105 126 94
0% 0% 10% 0% 0% 42% 42% 33% 41% 44% 45% 52% 43% 49% 34% 15% 20% 30% 36% 30%
4 years 5 0 2 6 7 9 12 17 15 6 21 22 22 33 35 106 144 144 148 146
56% 0% 20% 60% 78% 27% 28% 47% 41% 24% 38% 42% 32% 39% 46% 38% 44% 41% 42% 47%
5 years 2 4 4 4 2 9 10 3 7 8 8 3 14 10 15 69 75 75 75 71
22% 80% 40% 40% 22% 27% 23% 8% 19% 32% 14% 6% 20% 12% 20% 25% 23% 21% 21% 23%
6 years 2 1 3 0 0 1 3 4 0 0 2 0 3 0 0 21 21 26 0 0
22% 20% 30% 0% 0% 3% 7% 11% 0% 0% 4% 0% 4% 0% 0% 8% 6% 7% 0% 0%
ALL
GRADUATES
9 5 10 10 9 33 43 36 37 25 56 52 69 84 76 277 325 350 349 311
100% 100% 100% 100% 100% 100% 100% 100% 100% 100% 100% 100% 100% 100% 100% 100% 100% 100% 100% 100%

191
UNIVERSITY OF CAPE TOWN | TEACHING & LEARNING REPORT 2019
ARTS – BA COMMERCE – BCOM COMMERCE – BBUSSC ENGINEERING – BSC(ENG)
Table 22DYears to completion among graduates within the 2011, 2012, 2013, 2014 and 2015 first-time entering undergraduate cohorts after initial enrolment in five large faculties: Indian students
Years to graduation
2011 intake
2012 intake
2013 intake
2014 intake
2015 intake
2011 intake
2012 intake
2013 intake
2014 intake
2015 intake
2011 intake
2012 intake
2013 intake
2014 intake
2015 intake
2011 intake
2012 intake
2013 intake
2014 intake
2015 intake
3 years 8 8 6 4 6 11 12 5 12 16 3 2 2 2 4 0 0 0 0 0
57% 80% 50% 67% 67% 41% 48% 33% 43% 47% 5% 3% 2% 2% 7% 0% 0% 0% 0% 0%
4 years 4 2 6 2 2 9 7 8 11 12 37 38 46 44 32 16 13 23 36 25
29% 20% 50% 33% 22% 33% 28% 53% 39% 35% 62% 61% 55% 43% 56% 52% 45% 58% 57% 60%
5 years 1 0 0 0 1 4 5 2 5 6 17 19 29 56 21 12 13 14 21 17
7% 0% 0% 0% 11% 15% 20% 13% 18% 18% 28% 31% 35% 55% 37% 39% 45% 35% 33% 40%
6 years 1 0 0 0 0 3 1 0 0 0 2 3 7 0 0 3 3 3 6 0
7% 0% 0% 0% 0% 11% 4% 0% 0% 0% 3% 5% 8% 0% 0% 10% 10% 8% 10% 0%
ALL
GRADUATES
14 10 12 6 9 27 25 15 28 34 60 62 84 102 57 31 29 40 63 42
100% 100% 100% 100% 100% 100% 100% 100% 100% 100% 100% 100% 100% 100% 100% 100% 100% 100% 100% 100%
LAW SCIENCE SOCIAL SCIENCE – BSOCSC TOTAL
Years to graduation
2011 intake
2012 intake
2013 intake
2014 intake
2015 intake
2011 intake
2012 intake
2013 intake
2014 intake
2015 intake
2011 intake
2012 intake
2013 intake
2014 intake
2015 intake
2011 intake
2012 intake
2013 intake
2014 intake
2015 intake
3 years 0 0 1 2 0 9 6 7 12 6 5 9 12 15 9 37 33 33 45 41
0% 0% 25% 50% 0% 56% 55% 54% 60% 60% 45% 60% 50% 75% 69% 24% 18% 17% 19% 24%
4 years 1 1 3 2 2 4 3 4 4 3 5 5 9 5 4 69 99 99 103 80
33% 33% 75% 50% 40% 25% 27% 31% 20% 30% 45% 33% 38% 25% 31% 45% 55% 52% 43% 47%
5 years 2 2 0 0 3 3 2 1 4 1 0 1 3 0 0 42 49 49 89 49
67% 67% 0% 0% 60% 19% 18% 8% 20% 10% 0% 7% 13% 0% 0% 27% 27% 26% 38% 29%
6 years 0 0 0 0 0 0 0 1 0 0 1 0 0 0 0 7 0 11 0 0
0% 0% 0% 0% 0% 0% 0% 8% 0% 0% 9% 0% 0% 0% 0% 5% 0% 6% 0% 0%
ALL
GRADUATES
3 3 4 4 5 16 11 13 20 10 11 15 24 20 13 155 181 192 237 170
100% 100% 100% 100% 100% 100% 100% 100% 100% 100% 100% 100% 100% 100% 100% 100% 100% 100% 100% 100%

192
UNIVERSITY OF CAPE TOWN | TEACHING & LEARNING REPORT 2019
ARTS – BA COMMERCE – BCOM COMMERCE – BBUSSC ENGINEERING – BSC(ENG)
Table 22EYears to completion among graduates within the 2011, 2012, 2013, 2014 and 2015 first-time entering undergraduate cohorts after initial enrolment in five large faculties: White students
Years to graduation
2011 intake
2012 intake
2013 intake
2014 intake
2015 intake
2011 intake
2012 intake
2013 intake
2014 intake
2015 intake
2011 intake
2012 intake
2013 intake
2014 intake
2015 intake
2011 intake
2012 intake
2013 intake
2014 intake
2015 intake
3 years 150 134 126 98 106 46 48 53 50 50 6 10 12 15 19 2 2 2 1 1
73% 83% 80% 82% 86% 43% 41% 51% 65% 66% 3% 4% 5% 6% 8% 2% 1% 2% 1% 1%
4 years 38 24 23 16 12 51 54 42 19 19 146 163 166 199 197 83 99 84 83 90
19% 15% 15% 13% 10% 48% 47% 41% 25% 25% 78% 72% 72% 85% 78% 75% 68% 64% 73% 75%
5 years 15 2 6 5 5 9 12 6 8 7 33 45 44 20 36 21 36 36 26 29
7% 1% 4% 4% 4% 8% 10% 6% 10% 9% 18% 20% 19% 9% 14% 19% 25% 27% 23% 24%
6 years 2 2 3 0 0 0 2 2 0 0 2 7 7 0 0 5 9 9 4 0
1% 1% 2% 0% 0% 0% 2% 2% 0% 0% 1% 3% 3% 0% 0% 5% 6% 7% 4% 0%
ALL
GRADUATES
205 162 158 119 123 106 116 103 77 76 188 225 229 234 252 111 146 131 114 120
100% 100% 100% 100% 100% 100% 100% 100% 100% 100% 100% 100% 100% 100% 100% 100% 100% 100% 100% 100%
LAW SCIENCE SOCIAL SCIENCE – BSOCSC TOTAL
Years to graduation
2011 intake
2012 intake
2013 intake
2014 intake
2015 intake
2011 intake
2012 intake
2013 intake
2014 intake
2015 intake
2011 intake
2012 intake
2013 intake
2014 intake
2015 intake
2011 intake
2012 intake
2013 intake
2014 intake
2015 intake
3 years 1 0 2 1 0 69 111 88 76 98 98 124 74 74 78 429 356 357 315 352
13% 0% 29% 10% 0% 63% 73% 70% 67% 70% 69% 74% 77% 73% 80% 44% 43% 42% 42% 43%
4 years 6 8 4 8 5 34 31 27 28 35 30 31 19 21 16 410 363 365 364 374
75% 100% 57% 80% 100% 31% 20% 21% 25% 25% 21% 19% 20% 21% 16% 42% 44% 43% 48% 46%
5 years 1 0 0 1 0 7 9 6 10 7 14 12 2 7 4 116 100 100 74 88
13% 0% 0% 10% 0% 6% 6% 5% 9% 5% 10% 7% 2% 7% 4% 12% 12% 12% 10% 11%
6 years 0 0 1 0 0 0 2 5 0 0 1 0 1 0 0 22 0 28 0 0
0% 0% 14% 0% 0% 0% 1% 4% 0% 0% 1% 0% 1% 0% 0% 2% 0% 3% 0% 0%
ALL
GRADUATES
8 8 7 10 5 110 153 126 114 140 143 167 96 102 98 977 819 850 753 814
100% 100% 100% 100% 100% 100% 100% 100% 100% 100% 100% 100% 100% 100% 100% 100% 100% 100% 100% 100%

193
UNIVERSITY OF CAPE TOWN | TEACHING & LEARNING REPORT 2019
ARTS – BA COMMERCE – BCOM COMMERCE – BBUSSC ENGINEERING – BSC(ENG)
Table 22FYears to completion among graduates within the 2011, 2012, 2013, 2014 and 2015 first-time entering undergraduate cohorts after initial enrolment in five large faculties: International students
Years to graduation
2011 intake
2012 intake
2013 intake
2014 intake
2015 intake
2011 intake
2012 intake
2013 intake
2014 intake
2015 intake
2011 intake
2012 intake
2013 intake
2014 intake
2015 intake
2011 intake
2012 intake
2013 intake
2014 intake
2015 intake
3 years 36 27 17 16 12 26 22 17 30 24 4 2 4 1 7 0 0 0 0 0
77% 82% 89% 80% 80% 53% 45% 52% 67% 57% 7% 5% 11% 3% 13% 0% 0% 0% 0% 0%
4 years 10 5 2 2 3 16 18 11 11 16 42 27 21 28 35 38 42 35 31 49
21% 15% 11% 10% 20% 33% 37% 33% 24% 38% 70% 66% 57% 76% 67% 63% 68% 70% 67% 74%
5 years 1 0 0 2 0 5 7 3 4 2 13 8 10 8 10 15 17 10 9 17
2% 0% 0% 10% 0% 10% 14% 9% 9% 5% 22% 20% 27% 22% 25% 27% 20% 20% 26%
6 years 0 1 0 0 0 2 2 2 0 0 1 4 2 0 0 7 3 5 6 0
0% 3% 0% 0% 0% 4% 4% 6% 0% 0% 2% 10% 5% 0% 0% 12% 5% 10% 13% 0%
ALL
GRADUATES
47 33 19 20 15 49 49 33 45 42 60 41 37 37 52 60 62 50 46 66
100% 100% 100% 100% 100% 100% 100% 100% 100% 100% 100% 100% 100% 100% 100% 100% 100% 100% 100% 100%
LAW SCIENCE SOCIAL SCIENCE – BSOCSC TOTAL
Years to graduation
2011 intake
2012 intake
2013 intake
2014 intake
2015 intake
2011 intake
2012 intake
2013 intake
2014 intake
2015 intake
2011 intake
2012 intake
2013 intake
2014 intake
2015 intake
2011 intake
2012 intake
2013 intake
2014 intake
2015 intake
3 years 0 0 1 0 0 20 29 29 25 17 40 27 32 27 35 107 100 100 99 95
0% 0% 20% 0% 0% 59% 66% 53% 68% 71% 70% 63% 74% 66% 60% 39% 44% 41% 44% 36%
4 years 2 3 3 4 2 9 9 15 8 4 9 12 6 12 20 116 93 93 96 129
67% 100% 60% 100% 50% 26% 20% 27% 22% 17% 16% 28% 14% 29% 34% 42% 41% 38% 43% 49%
5 years 1 0 1 0 2 4 6 7 4 3 7 3 5 2 3 41 36 36 28 37
33% 0% 20% 0% 50% 12% 14% 13% 11% 13% 12% 7% 12% 5% 5% 15% 16% 15% 13% 14%
6 years 0 0 0 0 0 1 0 4 0 0 1 1 0 0 0 11 0 13 0 0
0% 0% 0% 0% 0% 3% 0% 7% 0% 0% 2% 2% 0% 0% 0% 4% 0% 5% 0% 0%
ALL
GRADUATES
3 3 5 4 4 34 44 55 37 24 57 43 43 41 58 275 229 242 223 261
100% 100% 100% 100% 100% 100% 100% 100% 100% 100% 100% 100% 100% 100% 100% 100% 100% 100% 100% 100%

194
UNIVERSITY OF CAPE TOWN | TEACHING & LEARNING REPORT 2019
COMMERCE GSB EBE HEALTH SCIENCES
Table 23Four-year survival rate of cohorts 2011, 2012, 2013, 2014 and 2015 intakes of master’s students
2011 intake
2012 intake
2013 intake
2014 intake
2015 intake
2011 intake
2012 intake
2013 intake
2014 intake
2015 intake
2011 intake
2012 intake
2013 intake
2014 intake
2015 intake
2011 intake
2012 intake
2013 intake
2014 intake
2015 intake
Graduated no. 104 84 124 132 139 232 214 209 234 222 205 192 204 212 211 106 116 109 95 129
% 65% 68% 76% 61% 61% 87% 83% 81% 84% 84% 60% 65% 60% 55% 54% 55% 53% 50% 44% 52%
Upgraded no. 1 1 0 6 3 7 10 10 14 12 15 19 17
% 0% 1% 0% 0% 0% 0% 0% 0% 0% 0% 2% 1% 2% 3% 3% 7% 6% 7% 9% 7%
Still busy no. 9 7 4 9 17 7 8 9 4 34 21 51 51 49 26 29 30 37 29
% 6% 6% 2% 4% 7% 0% 3% 3% 3% 2% 10% 7% 15% 13% 13% 14% 13% 14% 17% 12%
Transferred to other
programme no.
1 17 17 1 3 3 2 1 2 2 5 5
% 0% 0% 1% 8% 7% 0% 0% 0% 0% 0% 0% 0% 1% 1% 1% 1% 1% 1% 2% 2%
Dropped out no. 43 27 28 48 49 33 35 38 33 38 90 71 72 95 105 40 55 62 48 61
% 27% 22% 17% 22% 21% 12% 14% 15% 12% 14% 26% 24% 21% 25% 27% 21% 25% 28% 22% 25%
Excluded no. 3 4 6 8 6 3 1 2 1 1 6 7 4 14 11 5 4 1 10 7
% 2% 3% 4% 4% 3% 1% 0% 1% 0% 0% 2% 2% 1% 4% 3% 3% 2% 0% 5% 3%
TOTAL NO. 159 123 163 215 228 268 257 257 277 265 342 294 341 385 388 192 218 219 214 248
% 100% 100% 100% 100% 100% 100% 100% 100% 100% 100% 100% 100% 100% 100% 100% 100% 100% 100% 100% 100%
HUMANITIES LAW SCIENCE TOTAL
2011 intake
2012 intake
2013 intake
2014 intake
2015 intake
2011 intake
2012 intake
2013 intake
2014 intake
2015 intake
2011 intake
2012 intake
2013 intake
2014 intake
2015 intake
2011 intake
2012 intake
2013 intake
2014 intake
2015 intake
Graduated no. 229 167 221 164 221 116 102 102 133 182 116 134 152 128 177 1034 1099 1099 1098 1281
% 75% 67% 72% 63% 66% 71% 72% 67% 72% 80% 61% 70% 72% 67% 66% 64% 75% 67% 64% 65%
Upgraded no. 2 1 6 2 1 1 1 28 19 9 16 19 49 38 32 53 48
% 0% 1% 0% 2% 1% 1% 1% 0% 1% 0% 15% 10% 4% 8% 7% 3% 3% 2% 3% 2%
Still busy no. 10 20 25 26 42 2 6 12 14 10 7 12 16 9 16 88 102 146 155 167
% 3% 8% 8% 10% 12% 1% 4% 8% 8% 4% 4% 6% 8% 5% 6% 5% 7% 9% 9% 9%
Transferred to other
programme no.
1 2 1 1 3 2 3 7 26 29
% 0% 0% 0% 0% 0% 0% 0% 0% 0% 1% 0% 1% 0% 0% 1% 0% 0% 0% 2% 1%
Dropped out no. 63 54 57 61 68 40 32 35 35 30 35 22 25 32 48 344 296 317 352 399
% 21% 22% 18% 23% 20% 24% 23% 23% 19% 13% 19% 11% 12% 17% 18% 21% 20% 19% 20% 20%
Excluded no. 3 5 5 3 4 5 1 4 2 3 3 4 7 6 5 28 26 29 44 37
% 1% 2% 2% 1% 1% 3% 1% 3% 1% 1% 2% 2% 3% 3% 2% 2% 2% 2% 3% 2%
TOTAL NO. 305 248 309 261 337 164 142 153 185 227 189 192 210 191 268 1619 1474 1652 1728 1961
% 100% 100% 100% 100% 100% 100% 100% 100% 100% 100% 100% 100% 100% 100% 100% 100% 100% 100% 100% 100%
Note: MMeds are excluded from the Health Sciences figures. Master's cohorts include coursework, dissertation and professional.

195
UNIVERSITY OF CAPE TOWN | TEACHING & LEARNING REPORT 2019
COMMERCE GSB EBE HEALTH SCIENCES
Table 24Five-year survival of cohorts 2011, 2012, 2013, 2014 and 2015 intakes of doctoral students
2011 intake
2012 intake
2013 intake
2014 intake
2015 intake
2011 intake
2012 intake
2013 intake
2014 intake
2015 intake
2011 intake
2012 intake
2013 intake
2014 intake
2015 intake
2011 intake
2012 intake
2013 intake
2014 intake
2015 intake
Graduated no. 18 11 21 16 17 11 18 32 9 14 48 38 46 36 37
% 40% 26% 39% 22% 24% 23% 35% 52% 18% 29% 53% 48% 48% 43% 29%
Still busy no. 16 18 18 22 25 20 16 17 29 19 32 26 33 26 54
% 36% 42% 33% 30% 35% 43% 31% 28% 58% 40% 36% 33% 34% 31% 42%
Transferred to other
programme no.
1 1 1 2 2 1 2 1 3
% 0% 0% 0% 1% 1% 0% 2% 3% 4% 1% 3% 1% 0% 2%
Dropped out no. 8 12 14 34 28 15 16 10 10 15 9 13 15 21 32
% 18% 28% 26% 47% 39% 32% 31% 16% 20% 31% 10% 16% 16% 25% 25%
Excluded no. 3 2 1 1 1 1 1 2
% 7% 5% 2% 0% 1% 2% 0% 0% 0% 0% 1% 1% 0% 2%
TOTAL NO. 45 43 54 73 72 47 51 61 50 48 90 80 96 83 128
% 100% 100% 100% 100% 100% 100% 100% 100% 100% 100% 100% 100% 100% 100% 100%
HUMANITIES LAW SCIENCE TOTAL
Note: The 2014 cohort drop outs are as at June 2019.
2011 intake
2012 intake
2013 intake
2014 intake
2015 intake
2011 intake
2012 intake
2013 intake
2014 intake
2015 intake
2011 intake
2012 intake
2013 intake
2014 intake
2015 intake
2011 intake
2012 intake
2013 intake
2014 intake
2015 intake
Graduated no. 20 29 33 16 27 10 4 12 8 11 52 49 61 45 38 159 149 205 130 144
% 39% 35% 45% 30% 27% 63% 50% 55% 50% 30% 59% 53% 66% 46% 47% 47% 42% 51% 36% 31%
Still busy no. 19 28 19 28 36 1 2 5 3 16 24 24 20 30 25 112 114 112 138 175
% 37% 33% 26% 52% 36% 6% 25% 23% 19% 43% 27% 26% 22% 24% 31% 33% 32% 28% 38% 38%
Transferred to other
programme no.
3 3 1 1 1 3 7 3 3 7
% 0% 4% 0% 0% 3% 6% 0% 0% 0% 0% 1% 1% 0% 0% 0% 1% 2% 1% 1% 2%
Dropped out no. 12 23 22 10 33 4 2 5 5 10 8 18 11 8 16 56 84 77 88 134
% 24% 27% 30% 19% 33% 25% 25% 23% 31% 27% 9% 20% 12% 30% 20% 17% 23% 19% 25% 29%
Excluded no. 1 1 3 2 7 4 2 0 6
% 0% 1% 0% 0% 1% 0% 0% 0% 0% 0% 3% 0% 0% 0% 2% 2% 1% 1% 0% 1%
TOTAL NO. 51 84 74 54 100 16 8 22 16 37 88 92 92 83 81 337 358 399 359 466
% 100% 100% 100% 100% 100% 100% 100% 100% 100% 100% 100% 100% 100% 100% 100% 100% 100% 100% 100% 100%

YEA
R
Leve
lPo
stgr
adua
te
dipl
oma
Hon
ours
Post
grad
uate
dipl
oma
Hon
ours
Post
grad
uate
dipl
oma
Hon
ours
Post
grad
uate
dipl
oma
Hon
ours
Post
grad
uate
dipl
oma
Hon
ours
Facu
ltyA
ve ti
me
to d
egre
eN
o. o
f gr
adua
tes
Ave
tim
e to
deg
ree
No.
of
grad
uate
sA
ve ti
me
to d
egre
eN
o. o
f gr
adua
tes
Ave
tim
e to
deg
ree
No.
of
grad
uate
sA
ve ti
me
to d
egre
eN
o. o
f gr
adua
tes
Ave
tim
e to
deg
ree
No.
of
grad
uate
sA
ve ti
me
to d
egre
eN
o. o
f gr
adua
tes
Ave
tim
e to
deg
ree
No.
of
grad
uate
sA
ve ti
me
to d
egre
eN
o. o
f gr
adua
tes
Ave
tim
e to
deg
ree
No.
of
grad
uate
s
Com
mer
ce1,1
549
1,324
81,2
572
1,427
01,3
447
1,429
21,3
486
1,332
51,2
518
1,431
1
GSB
2,1
141
1,814
81,5
109
1,413
81,6
166
EBE
3,2
61,2
104
2,2
61,1
127
2,8
51,1
155
2,8
41,3
123
1,714
1,314
5
Hea
lth
Scie
nces
1,216
81,2
931,4
194
1,298
1,318
81,1
941,5
224
1,210
11,6
229
1,210
1
Hum
aniti
es1,2
239
1,242
61,2
195
1,141
21,1
182
1,141
61,1
162
1,143
81,2
236
1,143
4
Law
1,88
2,6
201,4
131,3
121,1
12
Scie
nce
1,018
11,0
201
1,020
61,0
170
1,019
6
TOTA
L1,3
1111
1,210
521,4
1135
1,211
081,3
944
1,211
631,3
1026
1,211
571,4
1175
1,211
87
Tab
le 2
5A
vera
ge
tim
e to
com
ple
tion
(ye
ars)
am
ong
pos
tgra
dua
te d
iplo
ma
and
hon
ours
gra
dua
tes
2015
2016
2017
2018
2019
YEA
R
Leve
l
Facu
ltyA
ve ti
me
to d
egre
eN
o. o
f gr
adua
tes
Ave
tim
e to
deg
ree
No.
of
grad
uate
sA
ve ti
me
to d
egre
eN
o. o
f gr
adua
tes
Ave
tim
e to
deg
ree
No.
of
grad
uate
sA
ve ti
me
to d
egre
eN
o. o
f gr
adua
tes
Ave
tim
e to
deg
ree
No.
of
grad
uate
sA
ve ti
me
to d
egre
eN
o. o
f gr
adua
tes
Ave
tim
e to
deg
ree
No.
of
grad
uate
sA
ve ti
me
to d
egre
eN
o. o
f gr
adua
tes
Ave
tim
e to
deg
ree
No.
of
grad
uate
s
Com
mer
ce1,8
965,
526
2,2
142
5,3
182,
012
05,
443
2,7
144
5,0
292,
518
25,
735
GSB
2,0
236
2,0
224
2,3
267
2,3
239
2,2
151
EBE
2,3
231
5,2
252,
617
05,
335
2,8
190
4,7
333,
124
55,
916
3,2
202
6,1
50
Hea
lth
Scie
nces
3,4
203
4,8
593,
323
94,
763
4,5
166
4,6
614,
426
75,
447
3,9
265
5,4
69
Hum
aniti
es2,
116
35,
638
2,8
190
4,9
362,
710
45,
547
3,4
185
6,0
353,
617
36,
147
Law
1,612
06,
517
1,622
44,
712
1,515
54,
720
2,0
184
3,6
112,
115
85,
08
Scie
nce
2,2
153
4,9
582,
314
34,
569
2,6
137
4,9
732,
711
75,
157
2,8
171
5,4
52
TOTA
L2,
312
025,
222
32,
413
324,
823
32,
611
395,
027
73,
013
815,
319
53,
013
025,
726
1
TAB
LE 2
6A
vera
ge
tim
e to
com
ple
tion
am
ong
mas
ter’
s an
d d
octo
ral g
rad
uate
s
2015
2016
2017
2018
Mas
ter’s
Doc
tora
tes
Mas
ter’s
Doc
tora
tes
Mas
ter’s
Doc
tora
tes
Mas
ter’s
Doc
tora
tes
Mas
ter’s
Doc
tora
tes
2019
