teach yourself basic probability - machine...
TRANSCRIPT
Teach YourselfBasic Probability
Engineering Tripos Part 1AP 4/9
This document is intended as a simple introduction to the subject for thosewho have not met probability theory as part of their previousmaths studies.Probability theory is one of those mathematical topics which is best learntfrom seeing and performing a large number of examples. Each new topiccovered here is illustrated by a number of worked examples. If the materialis new to you, these should be followed carefully and then thecorrespondingbasic exercises attempted. Worked solutions for these exercises are includedin a later section (Appendix A).Further worked solutions are provided in Appendix B (which can also beused as exercises).The final section of the document (Appendix C) is an examples sheet whichshould be prepared for a supervision in the normal manner.Those who have studied probability before may find it sufficient to movestraight to the examples sheet.
N.B. x!, nCr , nPr , meanandsample standard deviationappear as buttons on standard calculators.

Contents
Probability of an Event ...................................................... 1Addition of Probabilities ................................................... 3Multiplication of Probabilities .......................................... 5Conditional Probability ..................................................... 7Independence .................................................................... 8Permutations ..................................................................... 9Combinations .................................................................... 11Mean, Variance and Standard Deviation .......................... 14Sample .............................................................................. 15Discrete Probability Distribution ...................................... 16Continuous Probability Distribution ................................ 17Continuous Normal Probability Distribution ................... 19Appendix A: Solutions to Exercises ................................. 21Appendix B: Further Worked Examples ........................... 24Appendix C: Examples Paper 10 ...................................... 28
Recommended books
’Statistics for Advanced Level’ by Jane Miller,published by C.U.P. (Second Edition 1989)
Probability Theory pp 54 – 76Permutations and Combinations pp 83 – 88
’Mathematics - The Core Course for A-level’ by L. Bostock andS. Chandler,published by Stanley Thornes (Publishers) Ltd. (1981)
Permutations and Combinations Chapter 14
’Modern Engineering Mathematics’ by Glyn Jamespublished by Addison-Wesley (Fourth Edition 2008)
Probability Theory pp 973 – 1035
’Advanced Engineering Mathematics’ by Erwin Kreyszig,published by John Wiley (Eighth Edition 1999)
Probability and Statistics pp 1049 – 1155

Probability of an Event
When tossing an unbiased coin, it is fairly obvious what we mean by ‘the probability of getting headsis 50%’. This is a statement that, if we were to toss a coin a large number of times, then the propor-tion of tosses which result in heads will approach one half. This intuitive notion of probability as therelative frequency of something is a good starting point.
Example 1Toss a coin three times, what is the probability of at least two heads ?
AnswerThere are 8 possible outcomes which, if the coin is unbiased,should all be equally likely:-
H H H
T H H
H T H
T T H
H H T
T H T
H T T
T T T
Two or more heads result from the 4 outcomes which are ringed.
The probability of two or more heads is, therefore:
Probability=48=
12
We solved this problem by first enumerating the set of possible outcomes, known as theSampleSpace, and then by deciding which of these outcomes satisfied the criterion of containing ‘two ormore heads’. A particular subset of outcomes such as ’two or more heads’ is conventionally knownas anevent and denoted A, with the probability of the event A denotedP(A). In this caseP(A) = 0.5or 50%.
Example 2A bag containing lettered Scrabble pieces has the followingletter distribution
A B C D E F G H I J K L M9 2 2 4 12 2 3 2 9 1 1 4 2N O P Q R S T U V W X Y Z6 8 2 1 6 4 6 4 2 2 1 2 1
The first letter is chosen at random from the bag. Find the probability that it is: (i) an E; (ii) inthe first half of the alphabet; (iii) in the second half of the alphabet;(iv) a vowel; (v) a consonant; (vi) the only one of its kind.
AnswerThe total number of pieces in the bag is (by simple addition) 98.
(i) 12 are E’s, givingP(E) =1298
1

(ii) By addition, the total number of pieces with A to M is 53, henceP(1st half)=5398
(iii) If there are 53 pieces corresponding to the first half ofthe alphabet, there must be
98 - 53= 45 corresponding to the second half. HenceP(2nd half)=4598
(iv) Number of vowels= 9 + 12+ 9 + 8 + 4 = 42⇒ P(vowel)= 4298
(v) Number of consonants= 98 - 42= 56⇒ P(consonant)=5698
(v) Letter must be one of J, K, Q, X or Z⇒ P(only one of kind)=598
In general, then, probability is relative frequency:
Possible outcomes= N Number of outcomes for which A happens= n(A)
DefineP(A) =n(A)N
A number of intuitively reasonable properties follow immediately from this definition. The first isthat
0≤ P(A) ≤ 1
and as expected of a measure of how likely an event is to happen:
P(A) = 0 implies Aneverhappens andP(A) = 1 implies Aalwayshappens
In solving example 2, part (ii), we reduced the labour of counting by making use of the fact that aletter was either in the first half of the alphabet or the second. This line of reasoning was used againin part (iv) when deciding that a letter was either a vowel or aconsonant. In formal terms this can bestated as:-
If ’not A’ is denoted byA, the complement of A in the sample space, thenbetween them A and ’not A’ cover all cases
P(A)+P(A) = 1
Now try the following exercises. You should, in general, tryto complete the exercises as they appearin the text, before moving on to the next section. Written solutions for all exercises appear in Ap-pendix A (page 15).
Exercise 1One card is drawn from a standard pack of 52 playing cards. What is the probability of(a) picking a red card (b) picking a king (c) picking a diamond?
2

Exercise 2What is the probability of throwing a total score of 6 with twodice ?
Addition of Probabilities
A further glance at Example 2 indicates that, in deciding on the probability of a vowel, we reasonedthat
vowel= A or E or I or O or U
and thusn(vowels)= n(A)+n(E)+n(I )+n(O)+n(U)P(Vowel)= P(A)+P(E)+P(I )+P(O)+P(U)
so probabilities of different events simply add. Or do they ?
Example 3What is the probability of drawing an ace or a spade from a well-shuffled pack of cards ?
Answer
There are 4 aces soP(ace)=452
. There are 13 spades:P(spade) =1352
.
It follows that the probability of an ace or a spade=4+13
52=
1752
.
This is, in fact, incorrect . The problem is that the ace of spades has been counted twice, onceas an ace and once as a spade.
The correct answer is4+13−1
52=
1652=
413
The FirĆ Great Pitfall
The temptation to add probabilities for different events without checking for double counting is acommon error. A number of pictorial ways of guarding againstmaking this mistake are useful. ’Tree’or ’branching’ diagrams are probably the foremost of these.
Example 4Around 0.8% of men are blue-green colour-blind (the figure isslightly different for women)and roughly 1 in 5 men is left-handed. Assuming these characteristics are inherited indepen-dently, calculate the probability that a man chosen at random will:
(i) be both colour-blind and left-handed(ii) be colour-blind and not left-handed(iii) be colour-blind or left-handed(iv) be neither colour-blind nor left-handed.
3

AnswerThe tree diagram indicates the way the male population is divided. First of all into left-handed(L) and right-handed (R) groups which contain 20% and 80% respectively. The left-handedgroup then divides into colour-blind (CB) and not (CB) comprising 0.8% and 99.2% of theleft-handed group. The right-handed group divides in a similar manner.
99.2%
0.8%
0.8%
99.2%
CB
CB
CB
CB
20%
80%
L
R
A
E
B
D
WholePopulation
C
(i) the percentage of those colour-blind and left-handed are those ending up at A. There are0.008×0.2= 0.0016 of the population in this category. i.e Required probability = 0.0016 .(ii) This is group B.P(B) = 0.008×0.8= 0.0064 .(iii) This is group C plus group B. Required probability= 0.0064+0.2(N.B. there are no individuals in both B & C - all branches of a tree should be exclusive)(iv) This is group D.P(D) = 0.992×0.8= 0.7936 .Note that we could deduce the probability of group E now, as 1−P(A)−P(B)−P(D) .
Since events are sets of outcomes, Venn diagrams are also occasionally useful. This is particularlythe case in deriving general formulae:
BA
A B
If A and B represent two events (i.e. two sets of outcomes), when considering outcomes whichare either in A or in B (or both), that is A∪B, if we add the outcomes in A to those in B, we havecounted those in both (i.e. A∩B ) twice. The general rule for addition of probabilities is:-
4

P(A∪B) = P(A)+P(B)−P(A∩B)
A B
A∪B= ∅ P(A∩B) = 0
Probabilities can safely be added for eventsA and B that cannot both happen, i..e. aremutually exclusive
Exclusive events P(A∪B) = P(A)+P(B)
Exercise 3100 cars are entered for a road-worthiness test which is in two parts, mechanical and electrical.A car passes only if it passes both parts. Half the cars fail the electrical test and 62 pass themechanical. 15 pass the electrical but fail the mechanical test. Find the probability that a carchosen at random
(i) passes overall (ii) fails on one test only(iii) given that it has failed, failed the mechanical test only .
Multiplication of Probabilities
In example 4 above, to calculate the proportion of the male population who were both left handed andcolour-blind (those in group A), we reasoned that 0.2 of the population were left-handed and of thisgroup of left-handers 0.008 were blue-green colour-blind.In terms of probabilities, this translates to:-proportion left-handed and colour-blind= proportion left-handed× proportion colour-blind
⇒ P(L∩CB) = P(L)P(CB)
and, in an identical manner, for those right-handed and colour-blind (in group B)
P(R∩CB) = P(R)P(CB)
It seems clear then that to calculate the probability of two events both happening we simply multiplythe separate probabilities that each happens.
There was, however, a crucial further piece of information used in this reasoning. This was that“these characteristics are inherited independently”. We were thus able to say that the proportionof left-handers who are colour-blind is the same (0.008) as in the total male population (as it alsois for right-handers). If the two genetic traits, handedness and colour-blindness, arenot inheritedindependently, then this reasoning is flawed and we can progress no further without some knowledgeof the dependence.
5

For independent events A and B though we are safe in saying
P(A∩B) = P(A)P(B)
Exercise 4Explain the flaw in this argument and rewrite it as a valid statement.The probability of throw-ing a 6 on a fair die= 1/6. Therefore the probability of throwing at least one six in six tossesof the die is 1/6+ 1/6 + 1/6 + 1/6 + 1/6 + 1/6= 1 so it is a certainty.
The Second Great Pitfall
Multiplying probabilities of events is such an intuitivelynatural, and often correct, thing to do thatit is easy to lose sight of the fact that not all events are independent. This is the second commonestmistake in calculating probabilities.
Example 5Suppose 0.01% of the population have a rare genetic disorder. A test is designed which candetect the condition, if it is present, with 95% probability. The test gives the occasional falsepositive reading amongst people without the disorder, witha probability of 0.05%.
Find the probability that a person has the disorder given that the result of the test is positive.
AnswerLet D = has the disorder (withD representing does not have it) and let R= positive result (sothatR is a negative result). The statistics for the percentage of the population with the disorderimply P(D) = 0.0001 andP(D) = 0.9999. If we use a tree diagram, the population divides asshown. We can then represent the results of the test applied to each group separately by thesecond level of branches.
P(D)=0.0001
0.9999 D
D
0.95
0.05
0.0005
0.9995
F
G
R
R
R
R
WholePopulation
6

The proportion of those with the disorder (D) who test positive has been marked as 0.95,meaning that 0.05 of this group, although having the disorder, do not test positive. Thosefree of the disorder test positive and negative with probability 0.0005 and 1 - 0.0005= 0.9995respectively.If a positive result is obtained, then on the diagram it is in branch F or G. Now, if the wholepopulation were tested, the proportion of tests ending in group F would be 0.0001× 0.95=0.000095 and that in group G 0.9999× 0.0005= 0.00049995 .The required probability, which is the proportion of all those testing positive who actually havethe disorder, is thus
n(F)n(F)+n(G)
=0.95×0.0001
0.95×0.0001+0.0005×0.9999= 0.16
(Despite the relatively high accuracy and small rate of false positives, this test is useless since5 out of every 6 who test positive are, in fact, clear of the disorder.)
Conditional Probability
Example 5 is relatively straightforward once we realise that we have to distinguish between the prob-ability of testing positive amongst those who do and those who do not have the disease. The technicalterm for doing this isconditional probability. This is defined as the “probability of event A given thatevent B isknown to have happened”, denotedP(A|B) and usually abbreviated to the ”probability ofA given B”.In terms of conditional probabilities, the various pieces of information given in example 5 can be writ-ten as follows:P(D) = 0.0001 ;P(R|D) = 0.95 & P(R|D) = 0.0005, and the purpose of the exercise isto find P(D|R).If we label the branching diagram with the various conditional probabilities, with, at each stage, abranch being labelled with the probability of taking that branch, then we obtain
PopulationWhole
R
R
P(R|D)
P(R|D)
P(R|D)
P(R|D)
P(D)
P(D)
R
F
D
D
R
7

The probability of ending up in group F is preciselyP(R∩D) and it is clear from the branching dia-gram that conditional probabilities multiply
P(R∩D) = P(R|D)P(D) i.e. P(R|D) =P(R∩D)
P(D)
A number of valid chains of reasoning also become apparent. For example, from the branching dia-gram it is easy to see that
P(R) = P(R|D)P(D)+P(R|D)P(D)P(R|D)+P(R|D) = 1 etc.
If you see enough examples these rules will begin to seem perfectly natural. For the moment, I wouldnot bother committing them (other than the ones boxed) to memory but would draw a quick sketch ofthe branching diagram where necessary.
Exercise 5Four suppliers provide 10%, 20%, 30% and 40% of the bolts soldby a hardware shop andthe rate of defects in their products are 1%, 1.5%, 2% and 3% respectively. Calculate theprobability of a given defective bolt coming from supplier 1.
Independence
We noted above that probabilities for independent events A and B could be multiplied to find theprobability of both happening. This is not, however, a working definition of independence. A morenatural definition of independence is in terms of conditional probabilities. Two events A and B areindependent if the probability that A happens is not influenced by whether or not B happens,
P(A|B) = P(A|B).
There is, moreover, no need to distinguish either of these conditional probabilities from P(A).
Remember, if A and B are independent then
P(A∩B) = P(A)P(B)
andnot otherwise.
Example 6A biased coin falls with heads showing with probability p. The coin is tossed three times. Findthe probability of obtaining:-
(i) three heads (ii) two heads and one tail.
8

Answer(i) It is reasonable to assume that the tosses are independent and the probability of getting ahead on any one isp. Obtaining a head on the three tosses are three independent events andwe multiply the three probabilities, givingp3.(ii) This can occur asHHT HTH or THH . The probability of throwing tails is 1− p, and so theprobability of throwing each of these combinations isp2(1− p). These three sequences can notoccur together (i.e. they are exclusive) and hence requiredprobability is
3p2(1− p)
Exercise 6
The two eventsA andB haveP(A) = 12 , P(B) =
13
, P(A∪B) =23
.
Are the eventsA andB (i) independent (ii) mutually exclusive ?
Permutations
The calculation of a probability often reduces to working out the number of ways it is possible toproduce a certain event. In earlier examples, e.g. Example 1, this was accomplished by simply listingall the possible outcomes and counting. This is not feasiblewhen the number of outcomes becomeslarge and some other general methods are needed.
Example 7If three cards are dealt, what is the probability that the first is the ace of spades, the second theace of hearts, and the third the ace of clubs?
AnswerOf all the possible deals, only one results in this hand. The required probability is thus
P(this hand)=1
Number of deals
and it only remains for us to calculate the total number of possible deals.To do this, we note that the number of different possibilities for the first card= 52. Foreachchoice of first card, the number of different possibilities for the second= 51 and then, foreachpair of choices for the first two cards, the number of different outcomes for the third= 50.The total number of distinct deals= 52×51×50
and probability of the required deal=1
52×51×50= 7.54×10⁻⁶.
9

It is quite important, I think, to come to grips with this typeof reasoning and it is worth spendingsome time thinking about this example, following through the reasoning making concrete the choiceof deal. Suppose the first card dealt is the 6♦, there are 51 cards left. Suppose the second is the 3♥,there are now 50 cards left and hence 50 possible deals in which the first and second cards are 6♦ and3♥. There is, however, nothing special about the 6♦ and the 3♥ and there will be 50 deals for anyparticular choice of the first two.There are in example 7 the seeds of a general rule.
Example 8n runners enter a cross-country race. If prizes are awarded tothe firstr to finish, in how manyways can the prizes be distributed ?
AnswerNumber of possibilities for the first prize= nFor each winner, the number of choices for second= n−1 etc.Finally, for each set of 1 tor −1’th prize winners there aren− r +1 choices for ther ’th.The total number of ways the prizes can be distributed is thus
n(n−1)(n−2). . . (n− r +1)
This repeated product of integers one smaller than the last occurs regularly in this business and it ismuch more convenient to work infactorial notation. With ”n factorial”, denotedn! , defined as
n! = n(n−1)(n−2). . .3×2×1
the product above can be simplified to
n(n−1)(n−2). . . (n− r +1)= n(n−1)(n−2). . . (n− r +1)(n− r)(n− r −1). . .1(n− r)(n− r −1). . .1
=n!
(n− r)!
i.e. The number of ways of distributing r prizes to n runners isn!
(n− r)!
Exercise 7Write in factorial notation
(i)8×7×65×4×3
(ii)15×164×3×2
(iii)(n−1)n(n+1)
4×3×2
and show that
9×7×5×3×1=9!
244!
10
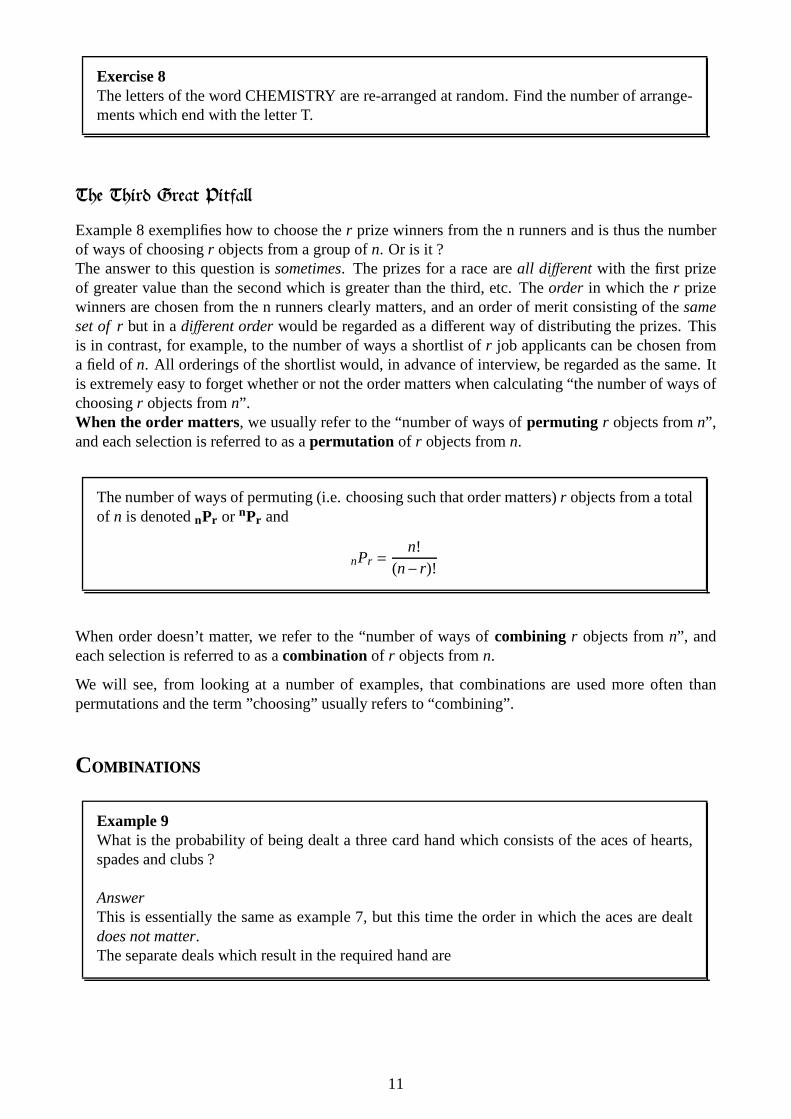
Exercise 8The letters of the word CHEMISTRY are re-arranged at random.Find the number of arrange-ments which end with the letter T.
The Third Great Pitfall
Example 8 exemplifies how to choose ther prize winners from the n runners and is thus the numberof ways of choosingr objects from a group ofn. Or is it ?The answer to this question issometimes. The prizes for a race areall differentwith the first prizeof greater value than the second which is greater than the third, etc. Theorder in which ther prizewinners are chosen from the n runners clearly matters, and anorder of merit consisting of thesameset of rbut in adifferent orderwould be regarded as a different way of distributing the prizes. Thisis in contrast, for example, to the number of ways a shortlistof r job applicants can be chosen froma field ofn. All orderings of the shortlist would, in advance of interview, be regarded as the same. Itis extremely easy to forget whether or not the order matters when calculating “the number of ways ofchoosingr objects fromn”.When the order matters, we usually refer to the “number of ways ofpermuting r objects fromn”,and each selection is referred to as apermutation of r objects fromn.
The number of ways of permuting (i.e. choosing such that order matters)r objects from a totalof n is denotednPr or nPr and
nPr =n!
(n− r)!
When order doesn’t matter, we refer to the “number of ways ofcombining r objects fromn”, andeach selection is referred to as acombination of r objects fromn.
We will see, from looking at a number of examples, that combinations are used more often thanpermutations and the term ”choosing” usually refers to “combining”.
Combinations
Example 9What is the probability of being dealt a three card hand whichconsists of the aces of hearts,spades and clubs ?
AnswerThis is essentially the same as example 7, but this time the order in which the aces are dealtdoes not matter.The separate deals which result in the required hand are
11

HSC HCS SHC SCH CHS CSH
i.e. There are 6 which result in this hand. The probability ofgetting this hand
652×51×50
= 4.52×10⁻⁵.
Rather than listing all the possible deals which lead to the required hand, a more instructive way ofcalculating the number is to note thatNumber of choices for the first ace (from among HSC)= 3For each choice of first ace, number of choices for the second= 2and then 1 for the third
Giving 3×2×1= 3! = 6 ways of ordering the three aces.
(The number of ways of arranging 3 objects amongst themselves in which the order matters is, in fact,3P3. This is consistent with the definition
3P3 =3!
(3−3)!=
3!0!
provided we interpret 0! as 1 (N.B.not 0)
Example 10Find the number of ways of combiningr objects fromn.
AnswerThe easiest way of doing this is to generalise the argument used in example 9.r objects can be arranged amongst themselves (i.e. ordered) in r! ways (there arer choices forthe first ,r −1 for the second, etc)Each separatecombinationof r objects thus corresponds tor! different permutations.Hence the number of different ways of combiningr articles fromn, denotednCr or nCr , isgiven by
nCr =nPr
r!=
n!(n− r)!r!
nCr is also denoted
(
nr
)
.
Returning to example 9, we could have argued that:
Total number of different hands (ignoring the order in which the cards are dealt)=52 C3.
The probability of getting any particular one is thus1
52C3.
12

Example 11What is the probability of being dealt a three card hand consisting of three aces ?
AnswerNumber of ways of selecting three aces (from the four in the pack) =4 C3
Thus probability= 4C3
52C3.
A special, but very common, case of the order of objects not being important (so that it is combina-tions we use rather than permutations) is when objects are identical and it is not possible to distinguish,never mind order, them!
Example 12There are 10 balls in a bag, 6 red and 4 green. If 3 are picked outat random, what is theprobability of 1 red and 2 greens ?
AnswerTotal no of ways of picking 3 balls from 10 (regardless of colour) in which the order doesn’tmatter
= 10C3 =10!7!3!= 120
Outcomes: 3 reds 2 reds, 1 green 1 red, 2 greens 3 greensThe outcome we seek, 1 red and 2 greens, contains any 1 of the 6 reds and any 2 of the 4 greens.The number of ways it can come about is (since order doesn’t matter)
= 6C1+4 C2 =6!
5!1!4!
2!2!= 36
Thus probability=36120=
310
As an exercise, we can check this by calculating the number ofways that the other outcomes cancome about. (The total number, according to our answer, should be 120)
3 reds 6C3 =6!
3!3!= 20
2 reds, 1 green 6C2×4C1 =6!
4!2!4!
3!1!= 60
3 greens 4C3 =4!
3!1!= 4
Total= 36+20+60+4= 120
13

Exercise 9A mother takes her three young sons on a ride on the Severn Valley Railway. They get into anempty compartment with 3 forward-facing and 3 rearward-facing seats.
(i) In how many different ways can they be seated ?(ii) In how many ways will two particular boys be seateddirectly opposite each other ?
Exercise 10Three dice are thrown. Find the probability of obtaining
(i) at least two sixes (ii) no sixes(iii) different scores on all the dice.
Despite the small number of principles in the basic theory ofprobability, comparatively simple-looking problems can involve considerable subtlety in their solution. There is no substitute for expe-rience and practice.
Mean, Variance and Standard Deviation
Imagine a pack of cards with all the jokers and picture cards removed. We are only concerned withthe numerical value of the cards. We have four each of all the numbers from one to ten so the packcontains 40 cards.
The average value, or arithmetic mean, of the numbers on the cards is given by adding them all up anddividing by the total number of cards. Letxi be the number on theith card and letN be the numberof cards.
Arithmetic mean:µ =
∑Ni=1 xi
N=
22040= 5.5
The arithmetic mean is a parameter of the set of numbers on thecards and it is normally referred tousing the symbolµ. It is one measure of thecentral tendencyor middle valueof the numbers on thecards.
Another thing we might want to know is thespreadof the values on the cards. One way to measurethis is to calculate average of the squared differences between each value and the mean. This is calledthe variance.
Variance:σ2 =
∑Ni=1(xi −µ)2
N=
33040= 8.25
The standard deviation is another measure of spread. It is simply the square root of the variance. It isuseful because it has the same dimensions as the original variable (i.e. the numbers on the cards).
Standard Deviation:σ =
√
∑Ni=1(xi −µ)2
N=
√
33040= 2.8723
14

Example 13It can be shown that for any set of data, at least
(
1−1/k2)
× 100% of the data lies withinkstandard deviations of the mean.
For the population of numbers on the cards as described in thesection above, check that thisrule holds fork= 1.2
AnswerFor k = 1.2 we have
(
1−1/k2)
= 0.3056 so we need to check that at least 30.56% of the datalies within 1.2 standard deviations of the mean.
In the previous section we calculated that the meanµ = 5.5 and the standard deviationσ =2.8723. The range within 1.2 standard deviations of the mean istherefore from 2.0533 to8.9467, i.e. the numbers from 3 to 8 inclusive. This accountsfor 24 cards, or 60% of the data.So more than the required 30.56% of the cards lie within 1.2 standard deviations of the mean.
Exercise 11For each of the cases below, either find a set of five numbers that satisfies the required conditionor explain why it cannot be achieved.
(i) Four of the five numbers are below the mean.(ii) The mean is less than the standard deviation.
(iii) The mean is greater than the standard deviation.(iv) The standard deviation is above the variance.
Sample
Until now we have assumed that we can see all the cards at once.Now we are going to change thegame. Imagine that someone else is holding the cards and allowing us to pick one at random, noteits value and then replace it. Using this pick-and-replace process we can view asampleof the cards.This sample can be of any size as the cards are picked at randomand replaced. Let us assume that thesample size isn.
The challenge is to estimate the mean, variance and standarddeviation of the original numbers on thecards based only on what we see in the sample. Here are the formulae that enable us to do this.
Estimate of Mean (based on sample):m=
∑ni=1 xi
n
Estimate of Variance (based on sample):s2 =
∑ni=1(xi −m)2
n−1
Estimate of Standard Deviation (based on sample):s=
√
∑ni=1(xi −m)2
n−1
Notice that the formula for the mean is that same as that used in the previous section to calculate themean of complete data set, however the formula to estimate the standard deviation is different. Thereis ann−1 in the denominator rather than theN we had before. This is because we don’t have thereal mean,µ available so we have to use theestimateof the mean based on the sample, i.e.m. This islikely to be slightly better centred in the sample than the true mean (µ) of all the card values, hencethe sum of the terms of the form (xi −m)2 will be slightly too small. The reduction in the denominator
15

from n to n−1 compensates for this. (Formal derivation of this result isbeyond the scope of the firstyear course.)
There is a convenient formula for calculating the estimate of the standard deviation based on thesample.
s=
√
∑ni=1(xi −m)2
n−1=
√
√
(
∑ni=1 x2
i
)
− 1n
(
∑ni=1 xi
)2
n−1
In the literature,s, the standard deviation of the underlying population estimated from a sample iscalled the“sample standard deviation”.
Example 14Ten cards are selected individually, noted and replaced in the pack (that has no picture cards,as described above). This gives a sample sizen= 10. The values of the cards are:
10 3 4 3 54 1 5 8 5
Estimate the mean and standard deviation of the values in thecomplete pack based on thissample.
Answer
Estimate of Mean:m=
∑ni=1 xi
n=
4810= 4.8
Sample Standard Deviation:s=
√
√
(
∑ni=1 x2
i
)
− 1n
(
∑ni=1 xi
)2
n−1=
√
(290)− 110 (48)2
9= 2.5734
Discrete Probability Distribution
Consider again the pack of cards with all the picture-cards removed. There are 40 cards each with aninteger value in the range from one to ten. If we consider picking a card, noting its value and thenreplacing it in the pack we can compute the probability of picking each of the possible values. This
Probability of value on card
1 2 3 4 5 6 7 8 9 10
0.1
x
Value on the card
P(x)
is a probability distribution. In this case it is adiscretedistribution because the cards can only carrycertain integer values. Notice that the sum of all the histogram bars is 10× 0.1 = 1. There are tenpossible outcomes and they each have a probability of 1/10. This is called auniformdistribution.
16
We can rearrange the formulae for the mean, variance and standard deviation, from the earlier section,to express these parameters in terms of the probability distribution,P(x).
Note that the probability distribution is a property of the population of the numbers on the cards.Knowing the complete probability distribution enables us to calculate the meanµ and the standarddeviationσ exactly. Letx j represent each of thedifferentvalues that are printed on the cards andMequal the number of these different values. In our exampleM = 10.
Arithmetic mean:µ =M∑
j=1
x jP(x j)
Variance:σ2 =
M∑
j=1
(x j −µ)2P(x j)
Standard Deviation:σ =
√
√
√ M∑
j=1
(x j −µ)2P(x j)
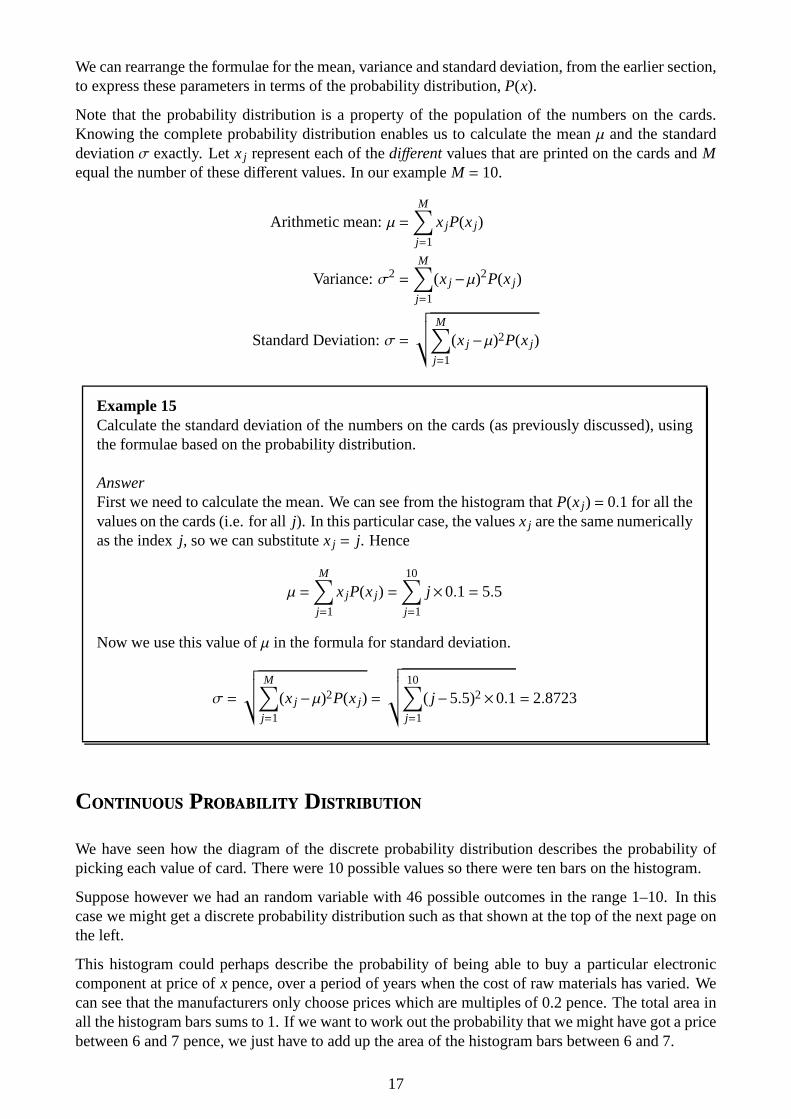
Example 15Calculate the standard deviation of the numbers on the cards(as previously discussed), usingthe formulae based on the probability distribution.
AnswerFirst we need to calculate the mean. We can see from the histogram thatP(x j) = 0.1 for all thevalues on the cards (i.e. for allj). In this particular case, the valuesx j are the same numericallyas the indexj, so we can substitutex j = j. Hence
µ =
M∑
j=1
x jP(x j) =10∑
j=1
j ×0.1= 5.5
Now we use this value ofµ in the formula for standard deviation.
σ =
√
√
√ M∑
j=1
(x j −µ)2P(x j) =
√
√
√
√ 10∑
j=1
( j −5.5)2×0.1= 2.8723
Continuous Probability Distribution
We have seen how the diagram of the discrete probability distribution describes the probability ofpicking each value of card. There were 10 possible values so there were ten bars on the histogram.
Suppose however we had an random variable with 46 possible outcomes in the range 1–10. In thiscase we might get a discrete probability distribution such as that shown at the top of the next page onthe left.
This histogram could perhaps describe the probability of being able to buy a particular electroniccomponent at price ofx pence, over a period of years when the cost of raw materials has varied. Wecan see that the manufacturers only choose prices which are multiples of 0.2 pence. The total area inall the histogram bars sums to 1. If we want to work out the probability that we might have got a pricebetween 6 and 7 pence, we just have to add up the area of the histogram bars between 6 and 7.
17

Probability of value
1 2 3 4 5 6 7 8 9 10
x
Value
P(x)
1 2 3 4 5 6 7 8 9 10
x
Value
Probability density function
f(x)
Suppose that the manufacturers of our electronic componentdid not choose to keep their prices asmultiples of 0.2 pence and were happy to price them at any value. This would result in histogram barsthat were so thin and close together that they would form a continuum. This leads to a continuousprobability distribution. See the diagram above on the right.
Here the total area under the curve must be 1 and the probability of x taking a value in the range from(say) 6 to 7 is given by the integral (i.e. area) between 6 and 7. More generally:
The probability of (a< x< b) =∫ b
af (x)dx
It is also possible to calculate the mean (µ) and standard deviation (σ) of a continuous distributionfrom its probability density function.
µ =
∫ +∞
−∞x f(x)dx σ =
√
∫ +∞
−∞(x−µ)2 f (x)dx
Example 16Consider a machine that makes widgets which aresupposed to be a particular length. Unfortunately,the machine often makes widgets that are slightly toolong; it never makes widgets that are too short. Thegraph on the right shows the probability density func-tion for the number of millimetres that a widget is toolong. 1 2 3 4 5 6 7 8 9 10
x
Value
Probability density function
f(x)
0
0.2
0.0
Calculate the mean and standard deviation of the excess length. What is the probability that awidget is produced with an excess length within one standarddeviation from the mean.
AnswerFor 0≤ x≤ 10 we can see thatf (x) = 0.2−0.02x, hence:
µ =
∫ 10
0x(0.2−0.02x)dx= 3.3333 σ =
√
∫ 10
0(x−10/3)2(0.2−0.02x)dx= 2.3570
So we wish to calculate the probability of an excess length inthe range 3.33−2.36 to 3.33+2.36, which is given by:
P(x within oneσ of µ) =∫ 5.6904
0.97630.2−0.02xdx= 0.6285
18

Continuous Normal Probability Distribution
−4 −3 −2 −1 0 1 2 3 40
0.05
0.1
0.15
0.2
0.25
0.3
0.35
0.4
Value: z
Pro
babi
lity
dens
ity: P
(z)
Gaussian or Normal Probability Distributionwith zero mean and unit standard deviation
The Normal distribution is a sym-metric distribution with two pa-rameters, its meanµ and standarddeviationσ. An example is illus-trated here. It is a continuous dis-tribution and the total area underthe curve is 1. The formula forthis curve is
P(z) =1
√2πσ2
exp
(
−(z−µ)2
2σ2
)
although you do not have to usethis directly very often in the firstyear.
It is difficult to evaluate integrals of the sort we did in Example 16 using the probability densityfunction of the Normal distribution. Tables are therefore available and functions are built into Matlaband Octave to perform these calculations.
In general, if you add together a sufficient number (say 30), of independent random variables thatareidentically distributed, the sum will conform to the Normaldistribution. This is called the “centrallimit theorem”.
Important application: experimental data analysis
Consider a laboratory experiment that results in a single real outputx, each time that we perform it. Intheory, it should produce the same output each time but in practice x varies slightly because of noisein the measurement system.
If we repeat the experimentn times and average the result (x=m=∑n
i=1 xi/n) then this average,x, isitself a single sample from a random distribution. (If we ranthe experiment a furthern times then theaverage of these results would give us a second sample ofx which would not, in general, be the sameas the first.) We can say the following things about the distribution ofx:
• Providedn> 30 it is reasonable to assume thatx is Normally distributed.
• The standard deviation ofx will be a factor of√
n less than the standard deviation of the originalexperimental data. Hence:
Estimate of standard deviation of experimental data=
√
√
(
∑ni=1 x2
i
)
− 1n
(
∑ni=1 xi
)2
n−1
Estimate of standard deviation ofx: s(x) =
√
√
(
∑ni=1 x2
i
)
− 1n
(
∑ni=1 xi
)2
n(n−1)
19

If it is fair to assume that the error in the original experimental data is unbiased, then the standarddeviation ofx gives us useful information about the error it is likely to contain. Lets(x) be our estimateof the standard deviation ofx.
50% of the time,x will lie within 0 .67s(x) of the true value.68% of the time,x will lie within s(x) of the true value.95% of the time,x will lie within 2 s(x) of the true value.99.73% of the time,x will lie within 3 s(x) of the true value.
We can thus use the value ofs(x) to calculate a range within which the true experimental result willlie with a particular probability, for example P(true result in rangex±2s(x)) = 0.95.
Example 17An experiment is performed and a sequence of 30 readings are recorded.
2.8479 2.8613 3.2563 2.8381 2.7526 3.0429 3.4022 3.0051 3.0617 2.81243.3348 3.0250 3.1060 2.8096 3.1708 3.0778 2.7688 3.0079 2.9099 3.02182.9499 2.9620 2.7934 2.9353 3.1533 3.3489 2.7679 3.4755 3.3052 3.0337
The experimental error is believed to be unbiased. Calculate your best estimate of the trueoutcome of the experiment. Estimate the range within which there is a 95% chance that thetrue experimental result will lie.
AnswerOur estimate of the experimental outcome is the mean of thesevaluesx= 3.0279.
Our estimate of the standard deviation of the experimental data is 0.2036, hence our estimateof the standard deviation ofx is given by 0.2036/
√30= 0.0372.
We would expect the true experimental result to have a 95% chance of lying within two stan-dard deviations from the mean, i.e. in the range 2.9536 to 3.1023.
Exercise 12For the data in Example 17, estimate the range within which there is a 50% chance that thetrue experimental result will lie.
The remaining sections of this document are:-
Appendix A Solutions to the exercises in the text
Appendix B Further Worked Examples
Appendix C Questions to be done for supervision (there are nosolutions to these
in this document).
20
Appendix A Solutions to exercises in the text
N.B. x!, nCr andnPr appear as buttons on standard calculators.
1. (a) 26 of the 52 cards are red⇒ P(red)=2652=
12
(b) 4 of the 52 cards are kings⇒ P(king)=452=
113
(c) 13 of the 52 cards are diamonds⇒ P(diamond)=1352=
14
2. Outcomes are best listed as a table:-
1 1 1 2 1 3 1 4 1 5 1 62 1 2 2 2 3 2 4 2 5 2 63 1 3 2 3 3 3 4 3 5 3 64 1 4 2 4 3 4 4 4 5 4 65 1 5 2 5 3 5 4 5 5 5 66 1 6 2 6 3 6 4 6 5 6 6
There are 36 outcomes and 5 ( 5 1, 4 2, 3 3, 2 4, 1 5 ) result in a total of 6. P(total= 6)=536
.
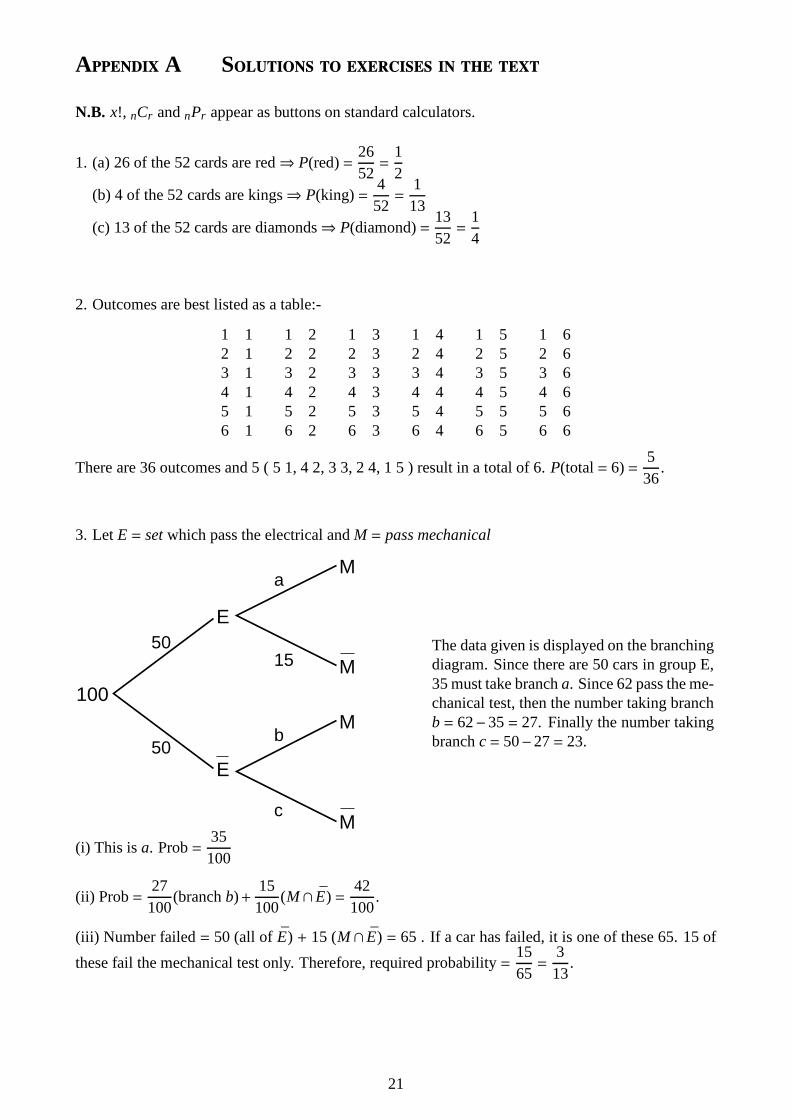
3. LetE = setwhich pass the electrical andM = pass mechanical
M
M
M
M
a
15
b
c
50
50E
E
100
The data given is displayed on the branchingdiagram. Since there are 50 cars in group E,35 must take brancha. Since 62 pass the me-chanical test, then the number taking branchb= 62−35= 27. Finally the number takingbranchc= 50−27= 23.
(i) This is a. Prob=35100
(ii) Prob=27100
(branchb)+15100
(M∩ E) =42100
.
(iii) Number failed= 50 (all of E) + 15 (M∩ E) = 65 . If a car has failed, it is one of these 65. 15 of
these fail the mechanical test only. Therefore, required probability=1565=
313
.
21

4. The events - obtain a six on dien - arenot exclusiveand instances of 6’s occuring on more thanone dice are counted (at least) twice by simply adding the probabilities.Consider the probability of throwing a 6 with the first two dice. Since
P(A∪B) = P(A)+P(B)−P(A∩B)
P(at least one 6)= P(6 on 1st∪ 6 on 2nd)= P(6 on 1st)+ P(6 on 2nd) - P(6 on 1st∩ 6 on 2nd)
=16+
16− 1
616
, etc.
The correct argument is:
P( at least one 6 )= 1 - P(no sixes)
and throwing no six on each of the dice areindependent events(probabilities multiply).
So P(no six on 1)=56⇒ P(no sixes) on 6=
(
56
)6
= 0.335. P(at least one)= 0.665.
5.
0.1
0.2
0.3
0.4
1
2
3
4
0.015
0.01
0.02
0.03
Supply
D
D
D
D
D
D
D
D
The total proportion of the supply of bolts which isdefective is0.1×0.01+0.2×0.015+0.3×0.02+0.3×0.04= 0.022The proportion of total supply which came from supplier 1 andis defective 0.1×0.01= 0.001
P(Supplier 1| defective )=0.0010.022
= 0.045
6. (i) P(A∪B) = P(A)+P(B)−P(A∩B)⇒ P(A∩B) =12+
13− 2
3=
16
P(A)P(B) =12× 1
3=
16
i.e. independent(sinceP(A∩B) = P(A)P(B))
(ii) P(A∩B) , 0⇒ not exclusive
7. (i)8×7×65×4×3
=8×7×6×5× . . .×1
5× . . .×12×1
5× . . .×1=
8!2!5!5!
(ii)15×164×3×2
=16!
14!4!
(iii)(n+1)n(n−1)
4×3×2=
(n+1)!(n−2)!4!
9×7×5×3×1=9×8×7×6× . . .×1
8×6×4×2=
9!
244!
22

8. The letters of CHEMISTRY form 9 distinct letters. If T is the last one, then the first 8 are rear-rangements of CHEMISRY⇒ Number= 8! (8 choices for first, 7 for second, ...)
9. (i) 4 people to be arranged on 6 seats. The order matters, therefore, number=6 P4 = 360 .(ii) 1 brother has 6 choices of seat. The position of the otherone is then fixed.The remaining two members of the family select 2 from 4 (in which the order matters). The numberof ways to do this is4P2 = 12.The total number of ways of seating the family in this manner= 6×12= 72.
10. (i) P(at least 2 sixes)= P(2 sixes)+ P(3 sixes).
P(3 sixes)=
(
16
)3
= 0.0046
P(2 sixes)= no of ways of choosing the dice which isn’t the six× probability it isn’t a six× probability other 2 are sixes
= 3× 56×
(
16
)2
= 0.0694
So P(at least two sixes)= 0.074Aliter:Number of ways of throwing three sixes= 1Number of ways of throwing 2 sixes=
Number of ways of choosing the die which is not 6× Number of choices for a number which isn’t six= 3 × 5
Total Number of Throws= 63. Required Probability=1+3×5
63.
(ii) P(no sixes)=
(
56
)3
= 0.58
(iii) 6 choices for first, 5 for second, 4 for third= 120 (=6 P3 ),
Probability=120
63= 0.56.
11(i) In this case we need four small numbers and a single large number to give a high overall mean.For example: 1, 1, 1, 1, 46 which have a mean of 10.
(ii) The mean can take on any value, large or small, because the numbers can be negative. Thepopulation:−3,−1,0,1,3 has a mean of zero and a standard deviation of 2.
(iii) We can produce a population with a mean greater than thestandard deviation by using theanswer to the previous part and adding 3 to each number. This will result in a mean of 0+3= 3and the same standard deviation as before. The answer is therefore: 0, 2, 3, 4, 6 which hasµ = 3andσ = 2.
(iv) The standard deviation is the square root of the variance and both are always non-negative.To getσ > σ2 we requireσ < 1. A suitable population is therefore:−1,−1,0,1,1 which hasvarianceσ2 = 0.8 and standard deviationσ = 0.8944.
12. For the data in Example 17 the standard deviation of the distribution of x is given bys(x) =
0.0372. For 50% of the time, the true value will be within 0.67s(x) of the meanx= 3.0279. Hence wewant the rangex−0.67s(x) to x+0.67s(x) which works out to be 3.0030 to 3.0528.
23

Appendix B FurtherWorked Examples
The questions in this section can be used as worked examples,in which case you should read throughthem carefully. They can also be used as a set of further exercises, in which case attempt eachquestion, or at least think about how you would go about solving it, before working through thesolution.
N.B. x!, nCr andnPr appear as buttons on standard calculators.
1. A well shuffled pack of 52 playing cards is dealt out to four players, each receiving thirteencards. Show that the probability that a particular player receives the four aces is 0.0026. How manydeals are necessary in order that the probability of a particular player receiving all four aces at leastonce exceeds 0.5 ?Answer
+ 48 others4 aces=52 cards
Player with 4 aces has 9 cards from amongst the other 48.
⇒ P(4 aces)= 48C9
52C13= 0.00264
The probability of not getting the 4 aces in one deal is 1−0.00264= 0.99736Probability of not getting 4 aces in N deals (considered independent)= 0.99736N
Probability of getting 4 aces at least once in N deals= 1−0.99736N
To ensure that this is greater than 0.5, we need
1−0.99736N > 0.5
⇒ N log(0.99736)< log(0.5)⇒ N > 262.2 i.e. N = 263
2. Find how many teams of two pairs (1st and 2nd), each pair consisting of a man and a woman,can be chosen to represent a club at a badminton match, if these pairs are chosen from five men andthree women.
AnswerThe team isM1 W1 : M2 W2 .To select the men, we need to select two from the five availableand theorder matters. This can bedone in5P2 ways. The women can similarly be selected in3P2. If the selection of men and women isindependent, then the total number of ways of selecting the team is
5P2×3 P2 = 20×6= 120
24

3. My parents are celebrating their golden wedding anniversary and we are going to have a bigfamily dinner for them at home. The dining-table will seat only 12, but there are 17 members of thefamily (including us) who live near enough to be invited. Ignoring any restrictions on choice, in howmany ways can I invite 12 members of the family?Of course, I must invite my parents, and my brother and I must be there; in how many ways can I nowinvite 12 ?Two of the 17 are the dreaded Aunty Joyce and her husband Reg. If I invite her, I must invite himalso. Taking this into account, in how many ways can I now invite everyone ?Having finally chosen the 12 who will be present at the dinner,they now have to be seated at the largeround dinner table. I have to be seated nearest to the kitchen. In how many ways can we all sit downto dinner?After much debate we have decided to invite Reg and Joyce. They are such a nuisance that it wouldbe best to sit them down together (but Reg must not be next to me!). In how many ways can the partynow be seated ?
AnswerOrder doesn’t matter. Therefore 12 can be invited in17C12 = 6188.
Four individuals are determined and 8 from the other 13 can come. Number of ways=13 C8 = 1287.
If invite AJ & UR, remaining places filled in11C6 = 462.If don’t invite AJ & UR, remaining places filled in11C8 = 165. Thus total= 462+165= 627
Table is round. I sit nearest to the kitchen. The other 11 can be seated in 11!ways (order mat-ters).Some people would say11!
2 (if mirror image seating plans are counted as the same).
My seat determined, 9 choices for UR, 2 choices for AJ, then 9!ways for the rest. i.e. 18×9!(or 9×9! if mirror images not counted as different).
4. In a game of bridge the pack of 52 cards is shared equally between four players. What is theprobability that a particular player has no picture cards (Jacks, Queens, Kings )?
AnswerThe total number of hands that the player can hold= the number of ways of choosing 13 cards from52 (in which the order does not matter)=52 C13.
Now
52 cards = 40 non-picture cards + 12 Jacks Queens & Kings
If the player has no picture cards then the cards dealt must all be chosen from the group of 40. Thiscan be done in40C13 ways. The probability that a particular player has no picture cards is thus
Number of deals with no picturesNumber of deals
=40C13
52C13=
1.20×10¹⁰
6.35×1011= 0.019
25

5. I have a box of chocolates with 10 different chocolates in it. Of these, there are 6 which Iparticularly like. However, I intend to offer my three friends one chocolate each before I eat the rest.How many different selections of chocolates can I be left with after my friends have chosen ?Show that 36 of these selections leave me with exactly 5 chocolates which I particularly like.How many selections leave me with (i) all 6; (ii) exactly 4; and (iii) exactly 3 of the chocolates whichI particularly like?Assuming that my friends choose at random, what is the most likely outcome and what is the proba-bility of that outcome?
AnswerAfter friends have chosen, there are 7 out of the original 10 left. Order doesn’t matter. Therefore thenumber of selections=10 C7 = 120.
7 = 3 I like + 4 or 4 I like + 3 or 5 I like + 2 or 6 I like + 1
Number of ways of choosing these are
6C3 4C4 or 6C4 4C3 or 6C5 4C2 or 6C6 4C1
20 60 36 4
(i) all six left - 4 ways (ii) four left - 60 ways (iii) three left - 20
Most likely outcome= 4 left andP(4)=60120=
12
.
6 A multiple-choice exam has 10 questions. Each question has3 possible ’answers’ of which only1 is correct. A candidate attempts the exam using pure guesswork. Find the probabilities that thecandidate obtains(i) exactly 2 correct answers, (ii) not more than 2 correct answers.What is the most likely number of correct answers and the probability that the candidate just achievesthis number ?
Answer(i) The 2 correct questions can be chosen from the 10 in10C2 ways.
The probability that these two questions will be answered correctly=
(
13
)2
The probability that the other eight will be incorrect=
(
23
)8
.
The probability of getting these 2 right and the other 8 wrong, therefore,=
(
13
)2(23
)8
assuming the
guesses for the answers are made independently (hence multiply the probabilities). This probabilityis appropriate for each possible selection of two questions(and each selection is an exclusive event,therefore add the probabilities). The required probability is, therefore,
10C2
(
13
)2 (
23
)8
= 45× 19× 256
6561= 0.195
(ii) If not more than 2 are answered correctly, number correct can be 0, 1 or 2. Required probabilityis, by exactly similar reasoning,
10C0
(
23
)10
+10C1
(
13
)1(23
)9
+10C2
(
13
)2 (
23
)8
= 0.017+0.087+0.195= 0.299
26

(iii) Probability of gettingr correct= P(r) =10 Cr
(
13
)r (23
)10−r
This increases with r all the time thatP(r +1)> P(r).
NowP(r +1)
P(r)=
10Cr+1
(
13
)r+1(23
)10−r−1
10Cr
(
13
)r (23
)10−r=
10!(10− r −1)!(r +1)!
r!(10− r)!10!
13
(
23
)−1
=10− rr +1
12.
ThusP(r +1)> P(r) until10− rr +1
12< 1 i.e. 10− r < 2r +2⇒ r > 2.67.
ThusP(2+1)> P(2), butP(3+1)< P(3). r = 3 is thus most likely.
CheckP(3)=10 C3
(
13
)3(23
)7
= 0.26 P(4)=10 C4
(
13
)4 (
23
)6
= 0.23
27

Appendix C
Engineering FIRST YEAR
Part 1A Paper 4: Mathematics
Examples Paper 9 - Probability
(Elementary exercises are marked†, problems of Tripos standard∗ )
N.B. x!, nCr andnPr appear as buttons on standard calculators.
1† Find the number of integers between 1000 and 4000 which can beformed using the digits
1,2,3,4
(i) if each digit may be used only once,
(ii) if each digit may be used more than once.
2† How many odd numbers can be formed from the digits 2,3,4,5,6 and 7 using each digit once
and once only ?
3† The probability that a January night will be icy in Cambridgeis 0.25. On an icy night the
probability of an accident on Castle Hill is 0.04, and 0.01 onnon-icy nights. What is the
probability that
(i) 13th January will be icy and there will be an accident on Castle Hill
(ii) there will be an accident on 13th January.
4 Show that the probability that a point, selected at random along a line of unit length, is closer
to the centre of the line than to either of the ends is12
.
Show that the probability that a point, selected at random inside a circle, is closer to the centre
of the circle than to the circumference is14
.
Points are selected at random inside the circle until a pointis closer to the centre than to the
circumference. What is the probability that
(a) exactly three points are selected
(b) no more than three points are selected ?
How many points need to be selected so that there is a probability of at least 0.85 that at least
one point is closer to the centre than to the circumference ?
5 In Camelot it never rains on Friday, Saturday, Sunday or Monday. The probability that it rains
on a given Tuesday is15
. For each of the remaining two days, Wednesday and Thursday,
the conditional probability that it rains, given that it rained the previous day, isα, and the
conditional probability that it rains, given that it did notrain the previous day, isβ .
(a) Show that the (unconditional) probability of rain on a given Wednesday is15[
α+4β]
, and
find the probability of rain on a given Thursday.
(b) If X is the event that, in a randomly chosen week, it rains on Thursday, Y is the event that it
rains on Tuesday, andY is the event that it does not rain on Tuesday, show that
P(X|Y)−P(X|Y) = (α−β)2.
28
(c) Explain the implications of the caseα = β .
6 For the game of bridge each of 4 players gets 13 cards from a pack of 52. Taking account of the
different ways in which the hands can be distributed amongst the 4players, how many different
deals are there ?
7 Show that the probability of drawing 13 cards at random froma pack of 52 and having no
spades in that hand is 0.0128. Explain why the probability ofhaving at least one suit missing is
approximately 4 times this.
8† Two students have five coins and three coins respectively. They while away their time waiting
for a lecture by tossing them all once. What is the probability that they will both toss the same
number of tails ?
9† In a well-known game you have to decide which your opponent isgoing to choose: ’Paper’,
’Stone’ or ’Scissors’. If you guess entirely at random, whatis the probability that you are right
exactly 5 times out of 15 ?
10 A coin is tossed ten times.(i) What is the probability of it coming down heads 5 times andtails 5
times ?
(ii) Which is the more likely: exactly 7 heads or more than 7 heads ?
Verify your answers by tossing a coin ten times and counting the number of heads. Repeat the
experiment 100000 times and record the frequencies of the various numbers of heads. If you do
not have time for 100000 repetitions, you could alternatively write a Matlab/Octave program to
simulate the experiments.1
11 A certain strain of rabbit produces offspring in equal ratio male to female. One third of the male
offspring and one half of the female offspring are black. In a litter of 5 offspring, what is the
probability that
(i) exactly 2 offspring will be male;
(ii) less than 4 offspring will be female;
In a litter of 4 offspring, what is the probability that there will be exactly 2 male offspring which
are not black ?
12∗ A bag P contains 3 red balls. A second bag Q contains 2 red ballsand 3 black balls.
(a) A bag is chosen at random and one ball is withdrawn. Find the
probability that this ball is red.
This ball remains outside the bag.
(b) A bag is again chosen at random (it is not known whether this is the
same bag as before or not) and one ball is withdrawn. Find the joint
probability that both this ball and the one previously withdrawn are red.
1Hint: code for doing this can be downloaded fromhttp://mi.eng.cam.ac.uk/˜rwp/Maths/eg. The code comesin a file called q10.m. Save this in a folder somewhere, start Matlab/Octave from the same folder (or use the “cd” commandto navigate to that folder), then type “q10” to run the code. Use a text editor to change the number of experiments nearthe top of the file q10.m, then run the code again.
29

(c) If they are both red, what is the probability that bag P wasused on
both occasions ?
13 Consider a special pack of ten cards contains the following values: one ace, two twos, three
threes and four fours.(i) What is the mean value of this population of ten values?
(ii) What is the standard deviation of this population of tenvalues?
(iii) Twelve times I pick a card randomly from this pack, noteits value
and replace it. I get the following values: 3,4,4,2,3,1,3,3,4,4,3,4.
Use this sample to estimate the mean and standard deviation of the
population of values on the cards.
14 An experiment is performed 100 times and separate valuesxi are recorded fori equals 1 to 100.
The researcher reports that∑100
i=1 xi = 25,545.1678 and∑100
i=1 x2i = 6,530,839.6114 Estimate a
range in which you are 99.73% sure that the true experimentalresult lies.
Answers
1 (i) 18 (ii) 192
2 360
3 (i) 0.01 (ii) 0.0175
4 (a)964
(b)3764
7 points
5 (a)β+(α−β)(α+4β)
5
6 5.4×1028
8732
9 0.214
10 (i) 0.246 (ii) 7 heads
11 (i) 0.31 (ii) 0.81 0.30
12 (a)710
(b)1940
(c)1019
13 (i) 3, (ii) 1, (iii) 3.1667, 0.9374
14 253.26 to 257.64.
30