td balanced growth fund - td asset management · june 30, 2017 semi-annual financial report n td...
TRANSCRIPT

TD Balanced Growth Fund
for the period ended June 30, 2017
TD Mutual Funds
Semi-Annual Financial Report
(08/17)532038
June 30, 2017 Semi-Annual Financial Report
nManagement’s Responsibility for Financial Reporting
The accompanying unaudited interim financial report has been prepared by TD Asset Management Inc. (“TDAM”) as manager of the TD MutualFund Trusts, TD Managed Assets Program Portfolios and TD Managed ETF Portfolios (collectively the “Funds” and individually the “Fund”) andapproved by TDAM’s board of directors. The manager is responsible for theintegrity, objectivity and reliability of the data presented. This responsibilityincludes selecting appropriate accounting principles and making judgmentsand estimates consistent with International Financial Reporting Standards(“IFRS”). The manager is also responsible for the development of internalcontrols over the financial reporting process, which are designed toprovide reasonable assurance that relevant and reliable financial informa -tion is produced, and the safeguarding of all assets of the Funds.
The board of directors of TDAM is responsible for reviewing and approvingthe interim financial report and overseeing management’s performance ofits financial reporting responsibilities.
On behalf of TDAM, manager of the Funds.
Bruce Cooper David LambieDirector and Director andChief Executive Officer Chief Financial OfficerAugust 15, 2017 August 15, 2017
nNotice to UnitholdersThe Auditor of the Funds has not reviewed the TD Mutual Fund Trusts in this Financial Report
TDAM, as manager of the Funds, appoints an independent auditor to audit the Funds’ annual financial statements. Applicable securities lawsrequire that if an auditor has not reviewed the Funds’ interim financialreport, this must be disclosed in an accompanying notice.
1
June 30, 2017 Semi-Annual Financial Report
nTD Balanced Growth Fund
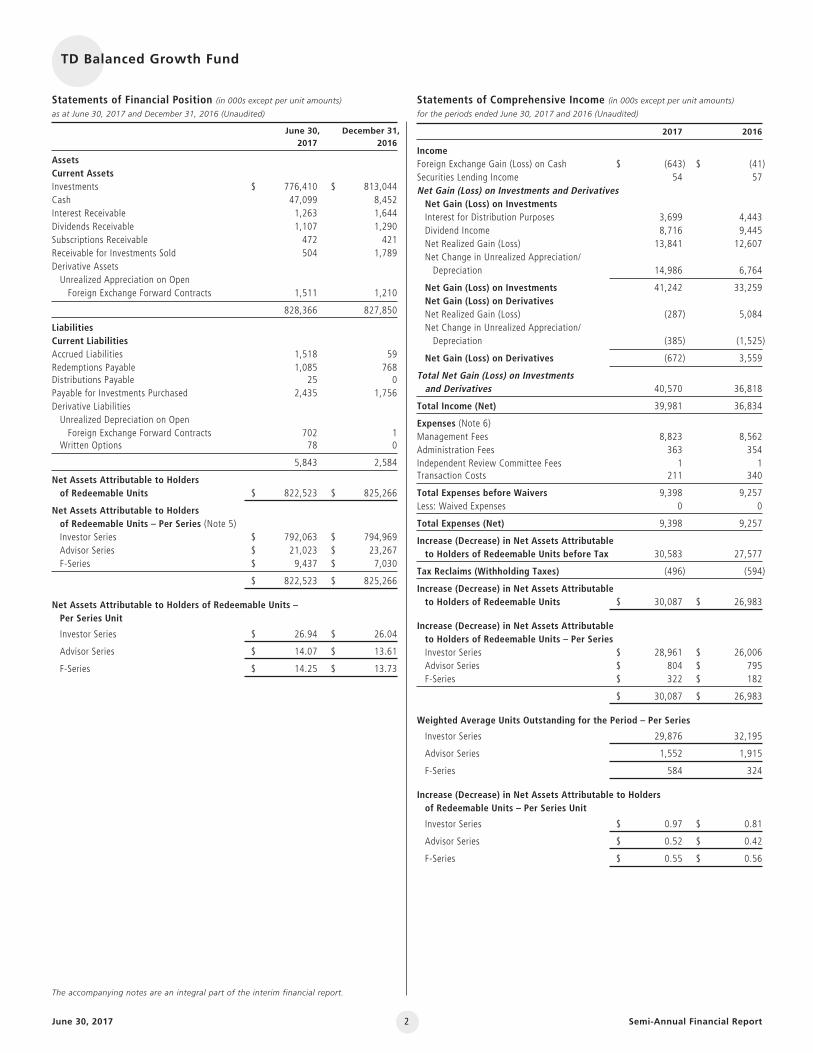
Statements of Financial Position (in 000s except per unit amounts)
as at June 30, 2017 and December 31, 2016 (Unaudited)
June 30, December 31, 2017 2016
AssetsCurrent AssetsInvestments $ 776,410 $ 813,044Cash 47,099 8,452Interest Receivable 1,263 1,644Dividends Receivable 1,107 1,290Subscriptions Receivable 472 421Receivable for Investments Sold 504 1,789Derivative AssetsUnrealized Appreciation on Open Foreign Exchange Forward Contracts 1,511 1,210
828,366 827,850
LiabilitiesCurrent LiabilitiesAccrued Liabilities 1,518 59Redemptions Payable 1,085 768Distributions Payable 25 0Payable for Investments Purchased 2,435 1,756Derivative LiabilitiesUnrealized Depreciation on Open Foreign Exchange Forward Contracts 702 1
Written Options 78 0
5,843 2,584
Net Assets Attributable to Holders of Redeemable Units $ 822,523 $ 825,266
Net Assets Attributable to Holders of Redeemable Units – Per Series (Note 5)Investor Series $ 792,063 $ 794,969Advisor Series $ 21,023 $ 23,267F-Series $ 9,437 $ 7,030
$ 822,523 $ 825,266
Net Assets Attributable to Holders of Redeemable Units – Per Series Unit
Investor Series $ 26.94 $ 26.04
Advisor Series $ 14.07 $ 13.61
F-Series $ 14.25 $ 13.73
Statements of Comprehensive Income (in 000s except per unit amounts)
for the periods ended June 30, 2017 and 2016 (Unaudited)
2017 2016
IncomeForeign Exchange Gain (Loss) on Cash $ (643) $ (41)Securities Lending Income 54 57Net Gain (Loss) on Investments and DerivativesNet Gain (Loss) on InvestmentsInterest for Distribution Purposes 3,699 4,443Dividend Income 8,716 9,445Net Realized Gain (Loss) 13,841 12,607Net Change in Unrealized Appreciation/Depreciation 14,986 6,764
Net Gain (Loss) on Investments 41,242 33,259Net Gain (Loss) on DerivativesNet Realized Gain (Loss) (287) 5,084Net Change in Unrealized Appreciation/Depreciation (385) (1,525)
Net Gain (Loss) on Derivatives (672) 3,559
Total Net Gain (Loss) on Investments and Derivatives 40,570 36,818
Total Income (Net) 39,981 36,834
Expenses (Note 6)Management Fees 8,823 8,562Administration Fees 363 354Independent Review Committee Fees 1 1Transaction Costs 211 340
Total Expenses before Waivers 9,398 9,257Less: Waived Expenses 0 0
Total Expenses (Net) 9,398 9,257
Increase (Decrease) in Net Assets Attributable to Holders of Redeemable Units before Tax 30,583 27,577
Tax Reclaims (Withholding Taxes) (496) (594)
Increase (Decrease) in Net Assets Attributable to Holders of Redeemable Units $ 30,087 $ 26,983
Increase (Decrease) in Net Assets Attributable to Holders of Redeemable Units – Per SeriesInvestor Series $ 28,961 $ 26,006Advisor Series $ 804 $ 795F-Series $ 322 $ 182
$ 30,087 $ 26,983
Weighted Average Units Outstanding for the Period – Per Series
Investor Series 29,876 32,195
Advisor Series 1,552 1,915
F-Series 584 324
Increase (Decrease) in Net Assets Attributable to Holders of Redeemable Units – Per Series Unit
Investor Series $ 0.97 $ 0.81
Advisor Series $ 0.52 $ 0.42
F-Series $ 0.55 $ 0.56
The accompanying notes are an integral part of the interim financial report.
2
June 30, 2017 Semi-Annual Financial Report
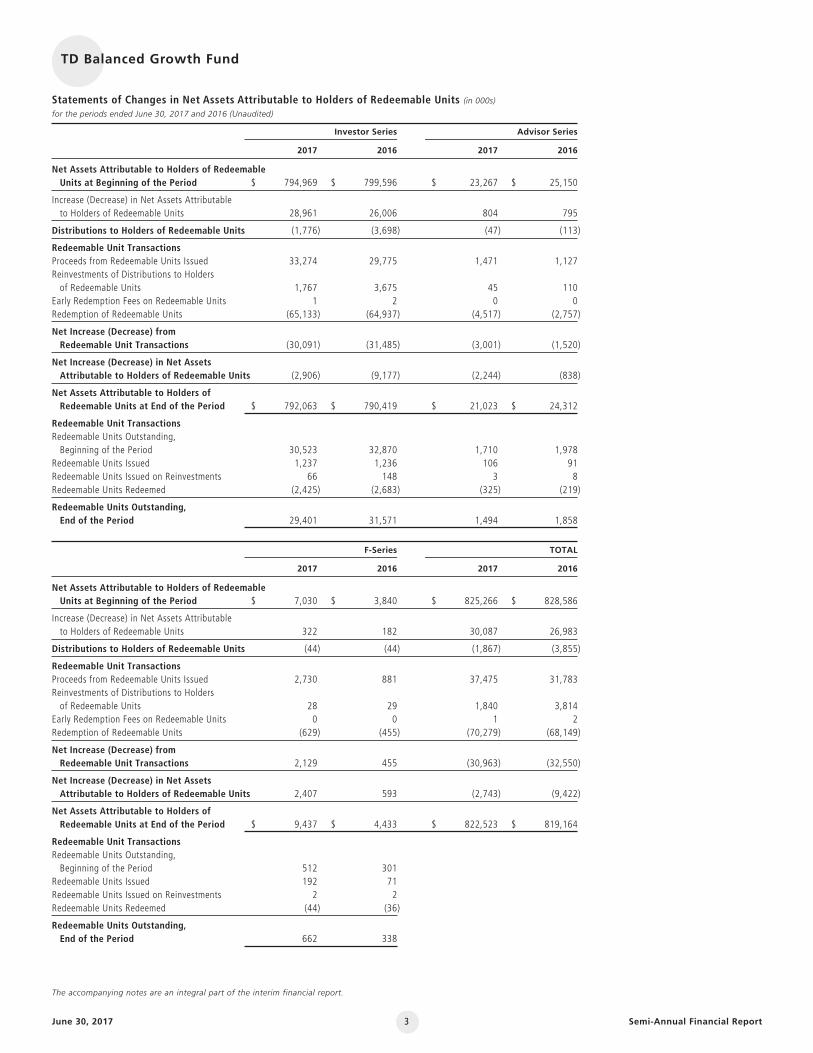
Statements of Changes in Net Assets Attributable to Holders of Redeemable Units (in 000s)for the periods ended June 30, 2017 and 2016 (Unaudited)
Investor Series Advisor Series
2017 2016 2017 2016
Net Assets Attributable to Holders of Redeemable Units at Beginning of the Period $ 794,969 $ 799,596 $ 23,267 $ 25,150
Increase (Decrease) in Net Assets Attributable to Holders of Redeemable Units 28,961 26,006 804 795
Distributions to Holders of Redeemable Units (1,776) (3,698) (47) (113)
Redeemable Unit TransactionsProceeds from Redeemable Units Issued 33,274 29,775 1,471 1,127Reinvestments of Distributions to Holders of Redeemable Units 1,767 3,675 45 110
Early Redemption Fees on Redeemable Units 1 2 0 0Redemption of Redeemable Units (65,133) (64,937) (4,517) (2,757)
Net Increase (Decrease) from Redeemable Unit Transactions (30,091) (31,485) (3,001) (1,520)
Net Increase (Decrease) in Net Assets Attributable to Holders of Redeemable Units (2,906) (9,177) (2,244) (838)
Net Assets Attributable to Holders of Redeemable Units at End of the Period $ 792,063 $ 790,419 $ 21,023 $ 24,312
Redeemable Unit TransactionsRedeemable Units Outstanding, Beginning of the Period 30,523 32,870 1,710 1,978
Redeemable Units Issued 1,237 1,236 106 91Redeemable Units Issued on Reinvestments 66 148 3 8Redeemable Units Redeemed (2,425) (2,683) (325) (219)
Redeemable Units Outstanding, End of the Period 29,401 31,571 1,494 1,858
F-Series TOTAL
2017 2016 2017 2016
Net Assets Attributable to Holders of Redeemable Units at Beginning of the Period $ 7,030 $ 3,840 $ 825,266 $ 828,586
Increase (Decrease) in Net Assets Attributable to Holders of Redeemable Units 322 182 30,087 26,983
Distributions to Holders of Redeemable Units (44) (44) (1,867) (3,855)
Redeemable Unit TransactionsProceeds from Redeemable Units Issued 2,730 881 37,475 31,783Reinvestments of Distributions to Holders of Redeemable Units 28 29 1,840 3,814
Early Redemption Fees on Redeemable Units 0 0 1 2Redemption of Redeemable Units (629) (455) (70,279) (68,149)
Net Increase (Decrease) from Redeemable Unit Transactions 2,129 455 (30,963) (32,550)
Net Increase (Decrease) in Net Assets Attributable to Holders of Redeemable Units 2,407 593 (2,743) (9,422)
Net Assets Attributable to Holders of Redeemable Units at End of the Period $ 9,437 $ 4,433 $ 822,523 $ 819,164
Redeemable Unit TransactionsRedeemable Units Outstanding, Beginning of the Period 512 301
Redeemable Units Issued 192 71Redeemable Units Issued on Reinvestments 2 2Redeemable Units Redeemed (44) (36)
Redeemable Units Outstanding, End of the Period 662 338
nTD Balanced Growth Fund
The accompanying notes are an integral part of the interim financial report.
3
June 30, 2017 Semi-Annual Financial Report
nTD Balanced Growth Fund
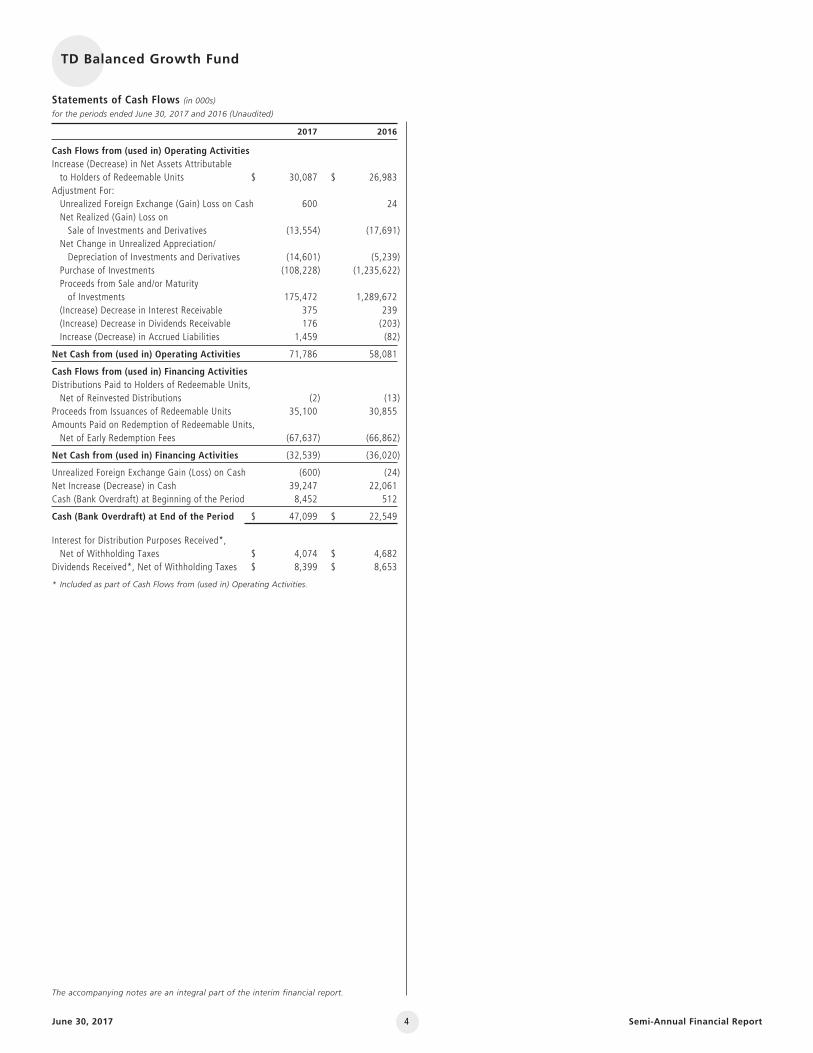
Statements of Cash Flows (in 000s)for the periods ended June 30, 2017 and 2016 (Unaudited)
2017 2016
Cash Flows from (used in) Operating ActivitiesIncrease (Decrease) in Net Assets Attributable to Holders of Redeemable Units $ 30,087 $ 26,983
Adjustment For:Unrealized Foreign Exchange (Gain) Loss on Cash 600 24Net Realized (Gain) Loss on Sale of Investments and Derivatives (13,554) (17,691)
Net Change in Unrealized Appreciation/Depreciation of Investments and Derivatives (14,601) (5,239)
Purchase of Investments (108,228) (1,235,622)Proceeds from Sale and/or Maturity of Investments 175,472 1,289,672
(Increase) Decrease in Interest Receivable 375 239(Increase) Decrease in Dividends Receivable 176 (203)Increase (Decrease) in Accrued Liabilities 1,459 (82)
Net Cash from (used in) Operating Activities 71,786 58,081
Cash Flows from (used in) Financing ActivitiesDistributions Paid to Holders of Redeemable Units, Net of Reinvested Distributions (2) (13)
Proceeds from Issuances of Redeemable Units 35,100 30,855Amounts Paid on Redemption of Redeemable Units, Net of Early Redemption Fees (67,637) (66,862)
Net Cash from (used in) Financing Activities (32,539) (36,020)
Unrealized Foreign Exchange Gain (Loss) on Cash (600) (24)Net Increase (Decrease) in Cash 39,247 22,061Cash (Bank Overdraft) at Beginning of the Period 8,452 512
Cash (Bank Overdraft) at End of the Period $ 47,099 $ 22,549
Interest for Distribution Purposes Received*, Net of Withholding Taxes $ 4,074 $ 4,682
Dividends Received*, Net of Withholding Taxes $ 8,399 $ 8,653
* Included as part of Cash Flows from (used in) Operating Activities.
The accompanying notes are an integral part of the interim financial report.
4

June 30, 2017 Semi-Annual Financial Report
Canadian Equities – 42.0%
ENERGY – 9.3%
300,000 Canadian Natural Resources Limited $ 9,090 $ 11,226 300,000 Enbridge Inc. 12,451 15,498 250,000 Kinder Morgan Canada Ltd. 4,250 3,958 300,000 Pason Systems Inc. 6,166 5,802 300,000 Seven Generations Energy Ltd. 5,630 6,663 215,000 Suncor Energy Inc. 7,052 8,146 260,000 TransCanada Corporation 12,097 16,073 150,000 Vermilion Energy Inc. 6,392 6,171 350,000 Whitecap Resources Inc. 3,430 3,241
66,558 76,778
MATERIALS – 2.9%
65,000 Agnico Eagle Mines Limited 3,239 3,801 60,000 Agrium Inc. 7,866 7,052 250,000 Barrick Gold Corporation 4,671 5,157 50,000 Franco-Nevada Corporation 3,003 4,679 50,000 Methanex Corporation 3,030 2,863
21,809 23,552
INDUSTRIALS – 4.3%
400,000 CAE Inc. 4,481 8,944 160,000 Canadian National Railway Company 6,805 16,835 40,000 Canadian Pacific Railway Limited 7,473 8,346 60,000 Finning International Inc. 1,598 1,525
20,357 35,650
CONSUMER DISCRETIONARY – 2.6%
60,000 Dollarama Inc. 1,630 7,434 100,000 Gildan Activewear Inc. 3,414 3,985 120,000 Restaurant Brands International Inc. 5,692 9,737
10,736 21,156
CONSUMER STAPLES – 1.6%
25,000 Alimentation Couche-Tard Inc., Class B SV 420 1,554 160,000 Loblaw Companies Limited 8,554 11,542
8,974 13,096
FINANCIALS – 15.8%
300,000 The Bank of Nova Scotia 16,341 23,403 300,000 Brookfield Asset Management Inc.,
Class A 6,353 15,267 70,000 Canadian Imperial Bank of Commerce 5,824 7,377 400,000 Fairfax India Holdings Corporation 4,870 8,294 635,000 Manulife Financial Corporation 10,071 15,437 330,000 Royal Bank of Canada 19,506 31,073 450,000 The Toronto-Dominion Bank* 16,257 29,408 1,764 Trisura Group Ltd. 43 38
79,265 130,297
INFORMATION TECHNOLOGY – 1.0%
70,000 Shopify Inc., Class A 4,971 7,882
TELECOMMUNICATION SERVICES – 1.8%
195,000 BCE Inc. 10,999 11,388 75,000 TELUS Corporation 2,234 3,358
13,233 14,746
ROYALTY/INCOME TRUSTS – 1.6%
250,000 Brookfield Infrastructure Partners L.P. 6,302 13,260
INDEX EQUIVALENTS – 1.1%
400,000 iShares S&P/TSX 60 Index ETF 7,810 8,972
Total Canadian Equities 240,015 345,389
U.S. Equities – 14.9%
ENERGY – 0.9%
30,000 EOG Resources Inc. 3,305 3,522 50,000 Schlumberger Ltd. 4,818 4,269
8,123 7,791
MATERIALS – 0.2%
55,000 CF Industries Holdings Inc. 2,233 1,994
INDUSTRIALS – 1.9%
12,000 The Boeing Company 2,178 3,077 15,000 Honeywell International Inc. 1,336 2,593 60,000 Nielsen Holdings PLC 3,586 3,008 15,000 Parker-Hannifin Corporation 2,206 3,109 25,000 Union Pacific Corporation (USD) 3,025 3,531
12,331 15,318
CONSUMER DISCRETIONARY – 1.9%
3,000 Amazon.com Inc. 2,343 3,766 65,000 Comcast Corporation 2,066 3,281 15,000 The Home Depot Inc. 1,718 2,984 35,000 NIKE Inc., Class B 2,458 2,678 20,000 Time Warner Inc. 2,099 2,604
10,684 15,313
CONSUMER STAPLES – 1.1%
32,000 The Coca-Cola Company 1,700 1,861 45,000 Philip Morris International Inc. 4,254 6,854
5,954 8,715
HEALTH CARE – 1.9%
25,000 Amgen Inc. 5,199 5,584 28,000 Celgene Corporation 4,482 4,715 5,000 McKesson Corporation 1,113 1,067 55,000 Merck & Company Inc. 3,369 4,571
14,163 15,937
FINANCIALS – 2.6%
37,000 Ameriprise Financial Inc. 5,339 6,108 100,000 Bank of America Corporation 3,196 3,146 52,000 JPMorgan Chase & Co. 3,521 6,163 100,000 Morgan Stanley 3,601 5,779
15,657 21,196
INFORMATION TECHNOLOGY – 3.9%
4,000 Alphabet Inc., Class A 3,128 4,822 30,000 Apple Inc. 3,839 5,603 40,000 Broadridge Financial Solutions Inc. 1,579 3,919 10,000 International Business Machines
Corporation 2,125 1,995 50,000 Microsoft Corporation 2,629 4,469 85,000 Oracle Corporation 3,686 5,527 40,000 Visa Inc., Class A 2,761 4,865 70,000 Yext Inc. 1,114 1,210
20,861 32,410
REAL ESTATE – 0.5%
7,300 Equinix Inc. 3,536 4,063
Total U.S. Equities 93,542 122,737
$ $
nTD Balanced Growth Fund
Schedule of Investment Portfolio (in 000s except number of Shares
or Units/Par Value/Contracts) as at June 30, 2017 (Unaudited)
No. of Shares or Units/ Par Value/ Contracts Description Cost Fair Value
No. of Shares or Units/ Par Value/ Contracts Description Cost Fair Value
5
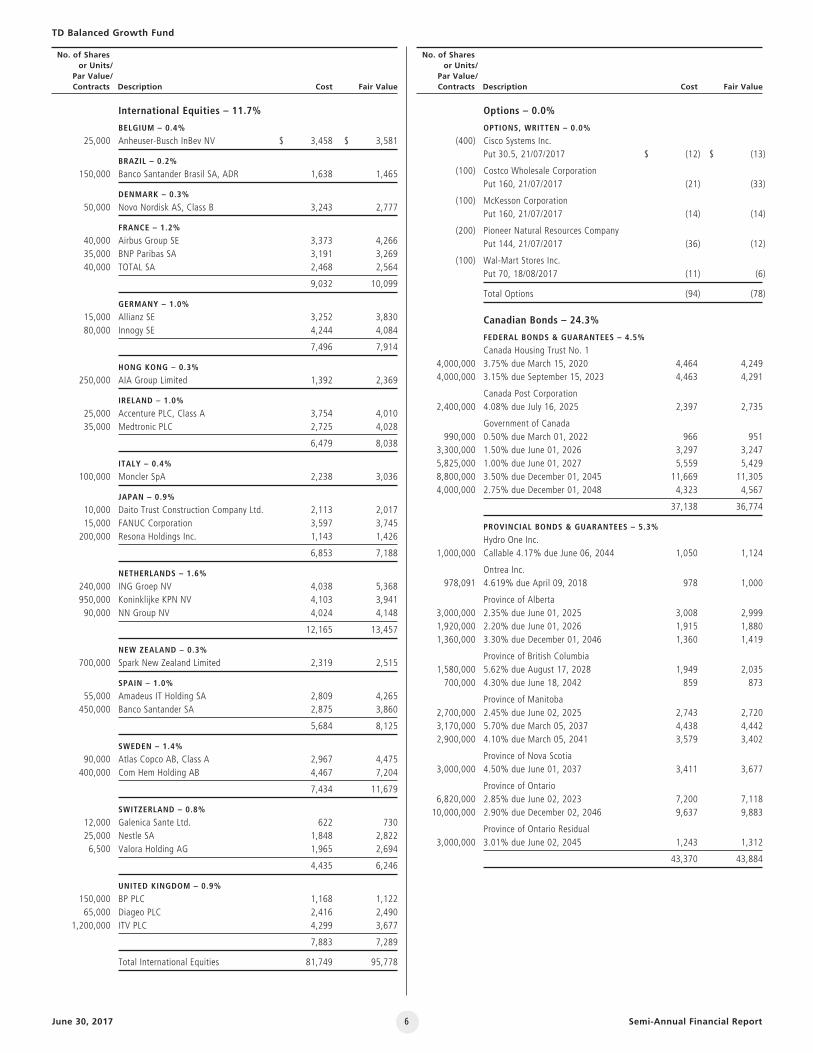
International Equities – 11.7%
BELGIUM – 0.4%
25,000 Anheuser-Busch InBev NV 3,458 3,581
BRAZIL – 0.2%
150,000 Banco Santander Brasil SA, ADR 1,638 1,465
DENMARK – 0.3%
50,000 Novo Nordisk AS, Class B 3,243 2,777
FRANCE – 1.2%
40,000 Airbus Group SE 3,373 4,266 35,000 BNP Paribas SA 3,191 3,269 40,000 TOTAL SA 2,468 2,564
9,032 10,099
GERMANY – 1.0%
15,000 Allianz SE 3,252 3,830 80,000 Innogy SE 4,244 4,084
7,496 7,914
HONG KONG – 0.3%
250,000 AIA Group Limited 1,392 2,369
IRELAND – 1.0%
25,000 Accenture PLC, Class A 3,754 4,010 35,000 Medtronic PLC 2,725 4,028
6,479 8,038
ITALY – 0.4%
100,000 Moncler SpA 2,238 3,036
JAPAN – 0.9%
10,000 Daito Trust Construction Company Ltd. 2,113 2,017 15,000 FANUC Corporation 3,597 3,745 200,000 Resona Holdings Inc. 1,143 1,426
6,853 7,188
NETHERLANDS – 1.6%
240,000 ING Groep NV 4,038 5,368 950,000 Koninklijke KPN NV 4,103 3,941 90,000 NN Group NV 4,024 4,148
12,165 13,457
NEW ZEALAND – 0.3%
700,000 Spark New Zealand Limited 2,319 2,515
SPAIN – 1.0%
55,000 Amadeus IT Holding SA 2,809 4,265 450,000 Banco Santander SA 2,875 3,860
5,684 8,125
SWEDEN – 1.4%
90,000 Atlas Copco AB, Class A 2,967 4,475 400,000 Com Hem Holding AB 4,467 7,204
7,434 11,679
SWITZERLAND – 0.8%
12,000 Galenica Sante Ltd. 622 730 25,000 Nestle SA 1,848 2,822 6,500 Valora Holding AG 1,965 2,694
4,435 6,246
UNITED KINGDOM – 0.9%
150,000 BP PLC 1,168 1,122 65,000 Diageo PLC 2,416 2,490 1,200,000 ITV PLC 4,299 3,677
7,883 7,289
Total International Equities 81,749 95,778
$ $
Options – 0.0%
OPTIONS, WRITTEN – 0.0%
(400) Cisco Systems Inc. Put 30.5, 21/07/2017 (12) (13)
(100) Costco Wholesale Corporation Put 160, 21/07/2017 (21) (33)
(100) McKesson Corporation Put 160, 21/07/2017 (14) (14)
(200) Pioneer Natural Resources Company Put 144, 21/07/2017 (36) (12)
(100) Wal-Mart Stores Inc. Put 70, 18/08/2017 (11) (6)
Total Options (94) (78)
Canadian Bonds – 24.3%
FEDERAL BONDS & GUARANTEES – 4.5%
Canada Housing Trust No. 1 4,000,000 3.75% due March 15, 2020 4,464 4,249 4,000,000 3.15% due September 15, 2023 4,463 4,291
Canada Post Corporation 2,400,000 4.08% due July 16, 2025 2,397 2,735
Government of Canada 990,000 0.50% due March 01, 2022 966 951 3,300,000 1.50% due June 01, 2026 3,297 3,247 5,825,000 1.00% due June 01, 2027 5,559 5,429 8,800,000 3.50% due December 01, 2045 11,669 11,305 4,000,000 2.75% due December 01, 2048 4,323 4,567
37,138 36,774
PROVINCIAL BONDS & GUARANTEES – 5.3%
Hydro One Inc. 1,000,000 Callable 4.17% due June 06, 2044 1,050 1,124
Ontrea Inc. 978,091 4.619% due April 09, 2018 978 1,000
Province of Alberta 3,000,000 2.35% due June 01, 2025 3,008 2,999 1,920,000 2.20% due June 01, 2026 1,915 1,880 1,360,000 3.30% due December 01, 2046 1,360 1,419
Province of British Columbia 1,580,000 5.62% due August 17, 2028 1,949 2,035 700,000 4.30% due June 18, 2042 859 873
Province of Manitoba 2,700,000 2.45% due June 02, 2025 2,743 2,720 3,170,000 5.70% due March 05, 2037 4,438 4,442 2,900,000 4.10% due March 05, 2041 3,579 3,402
Province of Nova Scotia 3,000,000 4.50% due June 01, 2037 3,411 3,677
Province of Ontario 6,820,000 2.85% due June 02, 2023 7,200 7,118 10,000,000 2.90% due December 02, 2046 9,637 9,883
Province of Ontario Residual 3,000,000 3.01% due June 02, 2045 1,243 1,312
43,370 43,884
$ $
June 30, 2017 Semi-Annual Financial Report
No. of Shares or Units/ Par Value/ Contracts Description Cost Fair Value
No. of Shares or Units/ Par Value/ Contracts Description Cost Fair Value
TD Balanced Growth Fund
6
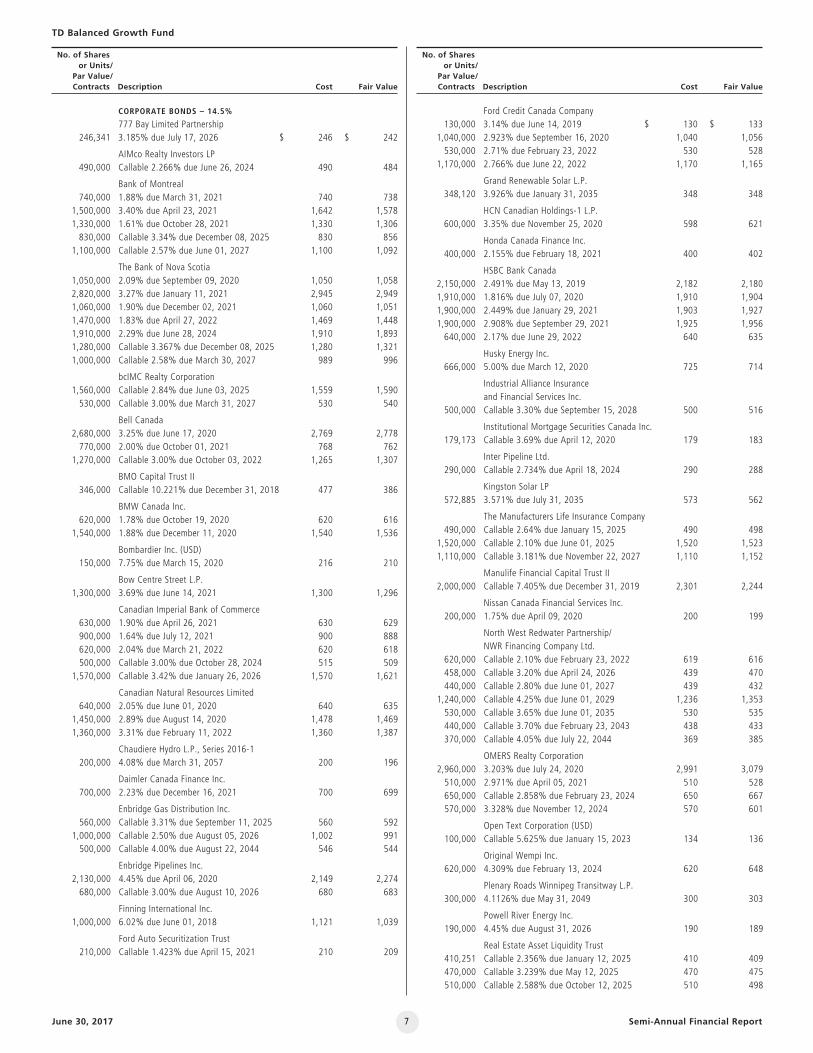
CORPORATE BONDS – 14.5%
777 Bay Limited Partnership 246,341 3.185% due July 17, 2026 246 242
AIMco Realty Investors LP 490,000 Callable 2.266% due June 26, 2024 490 484
Bank of Montreal 740,000 1.88% due March 31, 2021 740 738 1,500,000 3.40% due April 23, 2021 1,642 1,578 1,330,000 1.61% due October 28, 2021 1,330 1,306 830,000 Callable 3.34% due December 08, 2025 830 856 1,100,000 Callable 2.57% due June 01, 2027 1,100 1,092
The Bank of Nova Scotia 1,050,000 2.09% due September 09, 2020 1,050 1,058 2,820,000 3.27% due January 11, 2021 2,945 2,949 1,060,000 1.90% due December 02, 2021 1,060 1,051 1,470,000 1.83% due April 27, 2022 1,469 1,448 1,910,000 2.29% due June 28, 2024 1,910 1,893 1,280,000 Callable 3.367% due December 08, 2025 1,280 1,321 1,000,000 Callable 2.58% due March 30, 2027 989 996
bcIMC Realty Corporation 1,560,000 Callable 2.84% due June 03, 2025 1,559 1,590 530,000 Callable 3.00% due March 31, 2027 530 540
Bell Canada 2,680,000 3.25% due June 17, 2020 2,769 2,778 770,000 2.00% due October 01, 2021 768 762 1,270,000 Callable 3.00% due October 03, 2022 1,265 1,307
BMO Capital Trust II 346,000 Callable 10.221% due December 31, 2018 477 386
BMW Canada Inc. 620,000 1.78% due October 19, 2020 620 616 1,540,000 1.88% due December 11, 2020 1,540 1,536
Bombardier Inc. (USD) 150,000 7.75% due March 15, 2020 216 210
Bow Centre Street L.P. 1,300,000 3.69% due June 14, 2021 1,300 1,296
Canadian Imperial Bank of Commerce 630,000 1.90% due April 26, 2021 630 629 900,000 1.64% due July 12, 2021 900 888 620,000 2.04% due March 21, 2022 620 618 500,000 Callable 3.00% due October 28, 2024 515 509 1,570,000 Callable 3.42% due January 26, 2026 1,570 1,621
Canadian Natural Resources Limited 640,000 2.05% due June 01, 2020 640 635 1,450,000 2.89% due August 14, 2020 1,478 1,469 1,360,000 3.31% due February 11, 2022 1,360 1,387
Chaudiere Hydro L.P., Series 2016-1 200,000 4.08% due March 31, 2057 200 196
Daimler Canada Finance Inc. 700,000 2.23% due December 16, 2021 700 699
Enbridge Gas Distribution Inc. 560,000 Callable 3.31% due September 11, 2025 560 592 1,000,000 Callable 2.50% due August 05, 2026 1,002 991 500,000 Callable 4.00% due August 22, 2044 546 544
Enbridge Pipelines Inc. 2,130,000 4.45% due April 06, 2020 2,149 2,274 680,000 Callable 3.00% due August 10, 2026 680 683
Finning International Inc. 1,000,000 6.02% due June 01, 2018 1,121 1,039
Ford Auto Securitization Trust 210,000 Callable 1.423% due April 15, 2021 210 209
$ $
Ford Credit Canada Company 130,000 3.14% due June 14, 2019 130 133 1,040,000 2.923% due September 16, 2020 1,040 1,056 530,000 2.71% due February 23, 2022 530 528 1,170,000 2.766% due June 22, 2022 1,170 1,165
Grand Renewable Solar L.P. 348,120 3.926% due January 31, 2035 348 348
HCN Canadian Holdings-1 L.P. 600,000 3.35% due November 25, 2020 598 621
Honda Canada Finance Inc. 400,000 2.155% due February 18, 2021 400 402
HSBC Bank Canada 2,150,000 2.491% due May 13, 2019 2,182 2,180 1,910,000 1.816% due July 07, 2020 1,910 1,904 1,900,000 2.449% due January 29, 2021 1,903 1,927 1,900,000 2.908% due September 29, 2021 1,925 1,956 640,000 2.17% due June 29, 2022 640 635
Husky Energy Inc. 666,000 5.00% due March 12, 2020 725 714
Industrial Alliance Insurance and Financial Services Inc.
500,000 Callable 3.30% due September 15, 2028 500 516
Institutional Mortgage Securities Canada Inc. 179,173 Callable 3.69% due April 12, 2020 179 183
Inter Pipeline Ltd. 290,000 Callable 2.734% due April 18, 2024 290 288
Kingston Solar LP 572,885 3.571% due July 31, 2035 573 562
The Manufacturers Life Insurance Company 490,000 Callable 2.64% due January 15, 2025 490 498 1,520,000 Callable 2.10% due June 01, 2025 1,520 1,523 1,110,000 Callable 3.181% due November 22, 2027 1,110 1,152
Manulife Financial Capital Trust II 2,000,000 Callable 7.405% due December 31, 2019 2,301 2,244
Nissan Canada Financial Services Inc. 200,000 1.75% due April 09, 2020 200 199
North West Redwater Partnership/NWR Financing Company Ltd.
620,000 Callable 2.10% due February 23, 2022 619 616 458,000 Callable 3.20% due April 24, 2026 439 470 440,000 Callable 2.80% due June 01, 2027 439 432 1,240,000 Callable 4.25% due June 01, 2029 1,236 1,353 530,000 Callable 3.65% due June 01, 2035 530 535 440,000 Callable 3.70% due February 23, 2043 438 433 370,000 Callable 4.05% due July 22, 2044 369 385
OMERS Realty Corporation 2,960,000 3.203% due July 24, 2020 2,991 3,079 510,000 2.971% due April 05, 2021 510 528 650,000 Callable 2.858% due February 23, 2024 650 667 570,000 3.328% due November 12, 2024 570 601
Open Text Corporation (USD) 100,000 Callable 5.625% due January 15, 2023 134 136
Original Wempi Inc. 620,000 4.309% due February 13, 2024 620 648
Plenary Roads Winnipeg Transitway L.P. 300,000 4.1126% due May 31, 2049 300 303
Powell River Energy Inc. 190,000 4.45% due August 31, 2026 190 189
Real Estate Asset Liquidity Trust 410,251 Callable 2.356% due January 12, 2025 410 409 470,000 Callable 3.239% due May 12, 2025 470 475 510,000 Callable 2.588% due October 12, 2025 510 498
$ $
June 30, 2017 Semi-Annual Financial Report
TD Balanced Growth Fund
No. of Shares or Units/ Par Value/ Contracts Description Cost Fair Value
No. of Shares or Units/ Par Value/ Contracts Description Cost Fair Value
7

Reliant FN L.P. 67,868 4.51% due June 15, 2036 68 69
Resolute Forest Products Inc. (USD) 125,000 Callable 5.875% due May 15, 2023 135 158
RioCan Real Estate Investment Trust 450,000 2.185% due August 26, 2020 450 448 300,000 2.194% due April 09, 2021 300 297 1,200,000 3.716% due December 13, 2021 1,281 1,255 490,000 2.83% due October 03, 2022 490 491
Rogers Communications Inc. 490,000 5.38% due November 04, 2019 537 529 670,000 4.00% due June 06, 2022 667 721
Royal Bank of Canada 2,320,000 2.35% due December 09, 2019 2,354 2,354 1,420,000 2.86% due March 04, 2021 1,420 1,465 1,710,000 2.03% due March 15, 2021 1,709 1,714 930,000 1.583% due September 13, 2021 930 912 870,000 Callable 2.48% due June 04, 2025 870 874 1,320,000 Callable 3.31% due January 20, 2026 1,319 1,359 820,000 Callable 3.45% due September 29, 2026 820 848
Schlegel Villages Inc. 179,337 4.433% due March 31, 2037 179 184
Scotiabank Tier 1 Trust 1,700,000 Callable 7.802% due June 30, 2019 2,048 1,878
Shaw Communications Inc. 1,900,000 5.65% due October 01, 2019 1,976 2,052
Sun Life Capital Trust II 1,600,000 Callable 5.863% due December 31, 2019 1,677 1,735
TD Capital Trust IV* 3,000,000 Callable 6.631% due June 30, 2021 3,365 3,442
TELUS Corporation 2,315,000 Callable 3.20% due April 05, 2021 2,339 2,398
Thomson Reuters Corporation 290,000 Callable 3.309% due November 12, 2021 290 301
The Toronto-Dominion Bank* 1,300,000 1.909% due July 18, 2023 1,301 1,273 2,800,000 3.226% due July 24, 2024 2,856 2,954 2,020,000 Callable 2.692% due June 24, 2025 2,020 2,043 990,000 Callable 4.859% due March 04, 2031 990 1,114
Toyota Credit Canada Inc. 1,010,000 2.48% due November 19, 2019 1,010 1,027
TransCanada PipeLines Limited 340,000 Callable 3.69% due July 19, 2023 361 364 1,370,000 Callable 3.30% due July 17, 2025 1,368 1,431
Union Gas Limited 390,000 Callable 4.20% due June 02, 2044 383 440
Ventas Canada Finance Limited 810,000 3.00% due September 30, 2019 808 827 810,000 Callable 2.55% due March 15, 2023 810 800
Ventas Canada Finance Limited (USD) 810,000 Callable 3.30% due February 01, 2022 810 833
Videotron Ltd. (USD) 2,000 Callable 5.125% due April 15, 2027 3 3
VW Credit Canada Inc. 1,240,000 2.50% due October 01, 2019 1,239 1,253 2,310,000 2.15% due June 24, 2020 2,322 2,309
Wells Fargo Canada Corporation 1,100,000 3.04% due January 29, 2021 1,163 1,139
117,763 118,801
Total Canadian Bonds 198,271 199,459
$ $ Global Bonds – 1.5%
GERMANY – 0.0%
Unitymedia Hessen GmbH & Co. KG/Unitymedia NRW GmbH (USD)
180,000 Callable 5.50% due January 15, 2023 245 243
UNITED STATES – 1.3%
The ADT Corporation (USD) 75,000 6.25% due October 15, 2021 113 106 70,000 3.50% due July 15, 2022 87 88
AECOM (USD) 175,000 Callable 5.75% due October 15, 2022 238 239
Ally Financial Inc. (USD) 225,000 4.125% due March 30, 2020 300 301
ANTM CTL PT Trust, Series A2 (USD) 320,000 4.12% due November 30, 2023 429 412
Ashland Inc. (USD) 150,000 Callable 4.75% due August 15, 2022 198 204
Ball Corporation (USD) 15,000 5.00% due March 15, 2022 22 21
Best Buy Company Inc. (USD) 189,000 Callable 5.50% due March 15, 2021 266 267
Calpine Corporation (USD) 170,000 Callable 5.375% due January 15, 2023 224 216
CCO Holdings LLC/CCO Holdings Capital Corporation (USD)
150,000 Callable 5.125% due May 01, 2023 204 205
CenturyLink Inc. (USD) 155,000 5.625% due April 01, 2020 206 213
CIT Group Inc. (USD) 75,000 5.50% due February 15, 2019 108 102
CNH Industrial Capital LLC (USD) 200,000 3.625% due April 15, 2018 266 262
Constellation Brands Inc. (USD) 225,000 3.875% due November 15, 2019 306 303
Crown Castle International Corp. (USD) 150,000 4.875% due April 15, 2022 209 213
Dana Holding Corporation (USD) 250,000 Callable 5.375% due September 15, 2021 331 334
Diamond 1 Finance Corp/Diamond 2 Finance Corporation (USD)
150,000 Callable 5.875% due June 15, 2021 208 204
DISH DBS Corporation (USD) 50,000 4.25% due April 01, 2018 70 66
First Data Corporation (USD) 170,000 Callable 5.375% due August 15, 2023 236 231
Frontier Communications Corporation (USD) 150,000 Callable 10.50% due September 15, 2022 198 186 45,000 7.625% due April 15, 2024 54 48
GameStop Corp. (USD) 100,000 Callable 6.75% due March 15, 2021 132 135
The Goodyear Tire & Rubber Company (USD) 150,000 Callable 5.125% due November 15, 2023 203 204
HCA Inc. (USD) 350,000 6.50% due February 15, 2020 514 496
The Hertz Corporation (USD) 50,000 Callable 5.875% due October 15, 2020 67 63
$ $
June 30, 2017 Semi-Annual Financial Report
TD Balanced Growth Fund
No. of Shares or Units/ Par Value/ Contracts Description Cost Fair Value
No. of Shares or Units/ Par Value/ Contracts Description Cost Fair Value
8
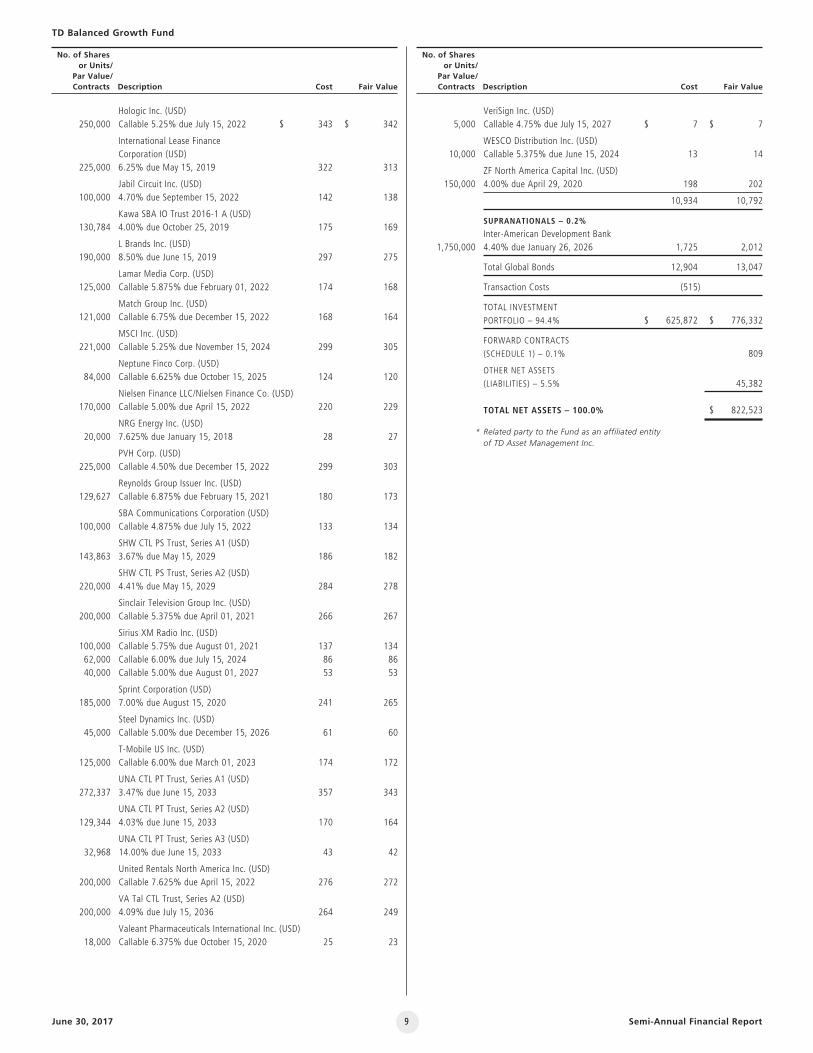
Hologic Inc. (USD) 250,000 Callable 5.25% due July 15, 2022 343 342
International Lease Finance Corporation (USD)
225,000 6.25% due May 15, 2019 322 313
Jabil Circuit Inc. (USD) 100,000 4.70% due September 15, 2022 142 138
Kawa SBA IO Trust 2016-1 A (USD) 130,784 4.00% due October 25, 2019 175 169
L Brands Inc. (USD) 190,000 8.50% due June 15, 2019 297 275
Lamar Media Corp. (USD) 125,000 Callable 5.875% due February 01, 2022 174 168
Match Group Inc. (USD) 121,000 Callable 6.75% due December 15, 2022 168 164
MSCI Inc. (USD) 221,000 Callable 5.25% due November 15, 2024 299 305
Neptune Finco Corp. (USD) 84,000 Callable 6.625% due October 15, 2025 124 120
Nielsen Finance LLC/Nielsen Finance Co. (USD) 170,000 Callable 5.00% due April 15, 2022 220 229
NRG Energy Inc. (USD) 20,000 7.625% due January 15, 2018 28 27
PVH Corp. (USD) 225,000 Callable 4.50% due December 15, 2022 299 303
Reynolds Group Issuer Inc. (USD) 129,627 Callable 6.875% due February 15, 2021 180 173
SBA Communications Corporation (USD) 100,000 Callable 4.875% due July 15, 2022 133 134
SHW CTL PS Trust, Series A1 (USD) 143,863 3.67% due May 15, 2029 186 182
SHW CTL PS Trust, Series A2 (USD) 220,000 4.41% due May 15, 2029 284 278
Sinclair Television Group Inc. (USD) 200,000 Callable 5.375% due April 01, 2021 266 267
Sirius XM Radio Inc. (USD) 100,000 Callable 5.75% due August 01, 2021 137 134 62,000 Callable 6.00% due July 15, 2024 86 86 40,000 Callable 5.00% due August 01, 2027 53 53
Sprint Corporation (USD) 185,000 7.00% due August 15, 2020 241 265
Steel Dynamics Inc. (USD) 45,000 Callable 5.00% due December 15, 2026 61 60
T-Mobile US Inc. (USD) 125,000 Callable 6.00% due March 01, 2023 174 172
UNA CTL PT Trust, Series A1 (USD) 272,337 3.47% due June 15, 2033 357 343
UNA CTL PT Trust, Series A2 (USD) 129,344 4.03% due June 15, 2033 170 164
UNA CTL PT Trust, Series A3 (USD) 32,968 14.00% due June 15, 2033 43 42
United Rentals North America Inc. (USD) 200,000 Callable 7.625% due April 15, 2022 276 272
VA Tal CTL Trust, Series A2 (USD) 200,000 4.09% due July 15, 2036 264 249
Valeant Pharmaceuticals International Inc. (USD) 18,000 Callable 6.375% due October 15, 2020 25 23
$ $
TD Balanced Growth Fund
VeriSign Inc. (USD) 5,000 Callable 4.75% due July 15, 2027 7 7
WESCO Distribution Inc. (USD) 10,000 Callable 5.375% due June 15, 2024 13 14
ZF North America Capital Inc. (USD) 150,000 4.00% due April 29, 2020 198 202
10,934 10,792
SUPRANATIONALS – 0.2%
Inter-American Development Bank 1,750,000 4.40% due January 26, 2026 1,725 2,012
Total Global Bonds 12,904 13,047
Transaction Costs (515)
TOTAL INVESTMENT
PORTFOLIO – 94.4% $ 625,872 $ 776,332
FORWARD CONTRACTS
(SCHEDULE 1) – 0.1% 809
OTHER NET ASSETS (LIABILITIES) – 5.5% 45,382
TOTAL NET ASSETS – 100.0% $ 822,523
* Related party to the Fund as an affiliated entity of TD Asset Management Inc.
$ $
June 30, 2017 Semi-Annual Financial Report
No. of Shares or Units/ Par Value/ Contracts Description Cost Fair Value
No. of Shares or Units/ Par Value/ Contracts Description Cost Fair Value
9
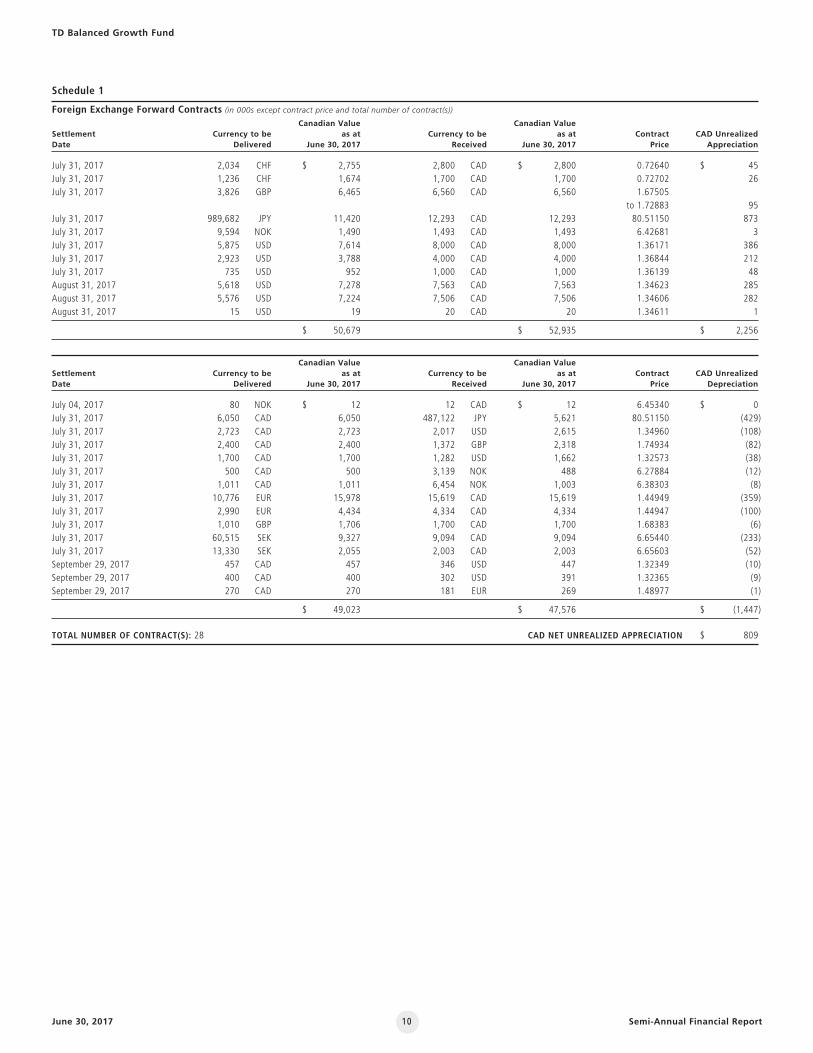
Schedule 1
Foreign Exchange Forward Contracts (in 000s except contract price and total number of contract(s))
Canadian Value Canadian Value Settlement Currency to be as at Currency to be as at Contract CAD Unrealized Date Delivered June 30, 2017 Received June 30, 2017 Price Appreciation
July 31, 2017 2,034 CHF $ 2,755 2,800 CAD $ 2,800 0.72640 $ 45July 31, 2017 1,236 CHF 1,674 1,700 CAD 1,700 0.72702 26July 31, 2017 3,826 GBP 6,465 6,560 CAD 6,560 1.67505 to 1.72883 95July 31, 2017 989,682 JPY 11,420 12,293 CAD 12,293 80.51150 873July 31, 2017 9,594 NOK 1,490 1,493 CAD 1,493 6.42681 3July 31, 2017 5,875 USD 7,614 8,000 CAD 8,000 1.36171 386July 31, 2017 2,923 USD 3,788 4,000 CAD 4,000 1.36844 212July 31, 2017 735 USD 952 1,000 CAD 1,000 1.36139 48August 31, 2017 5,618 USD 7,278 7,563 CAD 7,563 1.34623 285August 31, 2017 5,576 USD 7,224 7,506 CAD 7,506 1.34606 282August 31, 2017 15 USD 19 20 CAD 20 1.34611 1
$ 50,679 $ 52,935 $ 2,256
Canadian Value Canadian Value Settlement Currency to be as at Currency to be as at Contract CAD Unrealized Date Delivered June 30, 2017 Received June 30, 2017 Price Depreciation
July 04, 2017 80 NOK $ 12 12 CAD $ 12 6.45340 $ 0July 31, 2017 6,050 CAD 6,050 487,122 JPY 5,621 80.51150 (429)July 31, 2017 2,723 CAD 2,723 2,017 USD 2,615 1.34960 (108)July 31, 2017 2,400 CAD 2,400 1,372 GBP 2,318 1.74934 (82)July 31, 2017 1,700 CAD 1,700 1,282 USD 1,662 1.32573 (38)July 31, 2017 500 CAD 500 3,139 NOK 488 6.27884 (12)July 31, 2017 1,011 CAD 1,011 6,454 NOK 1,003 6.38303 (8)July 31, 2017 10,776 EUR 15,978 15,619 CAD 15,619 1.44949 (359)July 31, 2017 2,990 EUR 4,434 4,334 CAD 4,334 1.44947 (100)July 31, 2017 1,010 GBP 1,706 1,700 CAD 1,700 1.68383 (6)July 31, 2017 60,515 SEK 9,327 9,094 CAD 9,094 6.65440 (233)July 31, 2017 13,330 SEK 2,055 2,003 CAD 2,003 6.65603 (52)September 29, 2017 457 CAD 457 346 USD 447 1.32349 (10)September 29, 2017 400 CAD 400 302 USD 391 1.32365 (9)September 29, 2017 270 CAD 270 181 EUR 269 1.48977 (1)
$ 49,023 $ 47,576 $ (1,447)
TOTAL NUMBER OF CONTRACT(S): 28 CAD NET UNREALIZED APPRECIATION $ 809
TD Balanced Growth Fund
June 30, 2017 Semi-Annual Financial Report10
June 30, 2017 Semi-Annual Financial Report
Fund-Specific Notes to the Interim Financial Report (Unaudited)
(A) The Fund(I) The Fund start date was September 4, 1987.
(II) TDAM is the manager, portfolio adviser and trustee of the Fund. TDIS is the principal distributor of the Investor Series units of the Fund.
(III) The presentation and functional currency of the Fund is the Canadian dollar.
(IV) The investment objective of the Fund is to seek to provide capital growthand income by investing primarily in equity and fixed income securities ofissuers in Canada. In seeking to achieve this objective, the Fund balances the major asset classes based on relative valuation parameters between such asset classes and focuses on high-quality investments. Common stockinvestments concentrate on those companies which are expected to haveabove-average earnings growth over the course of a market cycle. The Fundmay invest in exchange-traded funds, investment and non-investment gradebonds, debt-like instruments (including investments in loans) and any otherdebt obligations.
(V) Any related party holdings as at June 30, 2017 (December 31, 2016:5.2%), are disclosed in the Schedule of Investment Portfolio.
(B) Management Fees and Administration Fees (Note 6)for the six-month periods ended June 30, 2017 and 2016
(I) MANAGEMENT FEES (%)
Actual• Annual Rate (exclusive of GST and HST)
Series Maximum 2017 2016
Investor Series 2.00 1.93 1.93Advisor Series 2.00 1.93 1.93F-Series 1.00 1.00 1.00
• Includes management fees paid by the Fund and the proportionate management fees, if any, of the underlying funds managed by TDAM held by the Fund. However there is no duplication of management fees.
The amount payable (in 000s) to TDAM as at June 30, 2017 for managementfees is $1,322 (December 31, 2016: $0) which is included in AccruedLiabilities on the Statements of Financial Position.
(II) ADMINISTRATION FEES (%)
Annual Rate (exclusive of GST and HST)
Series 2017 2016
Investor Series 0.08 0.08Advisor Series 0.08 0.08
The amount payable (in 000s) to TDAM as at June 30, 2017 foradministration fees is $54 (December 31, 2016: $54) which is included in Accrued Liabilities on the Statements of Financial Position.
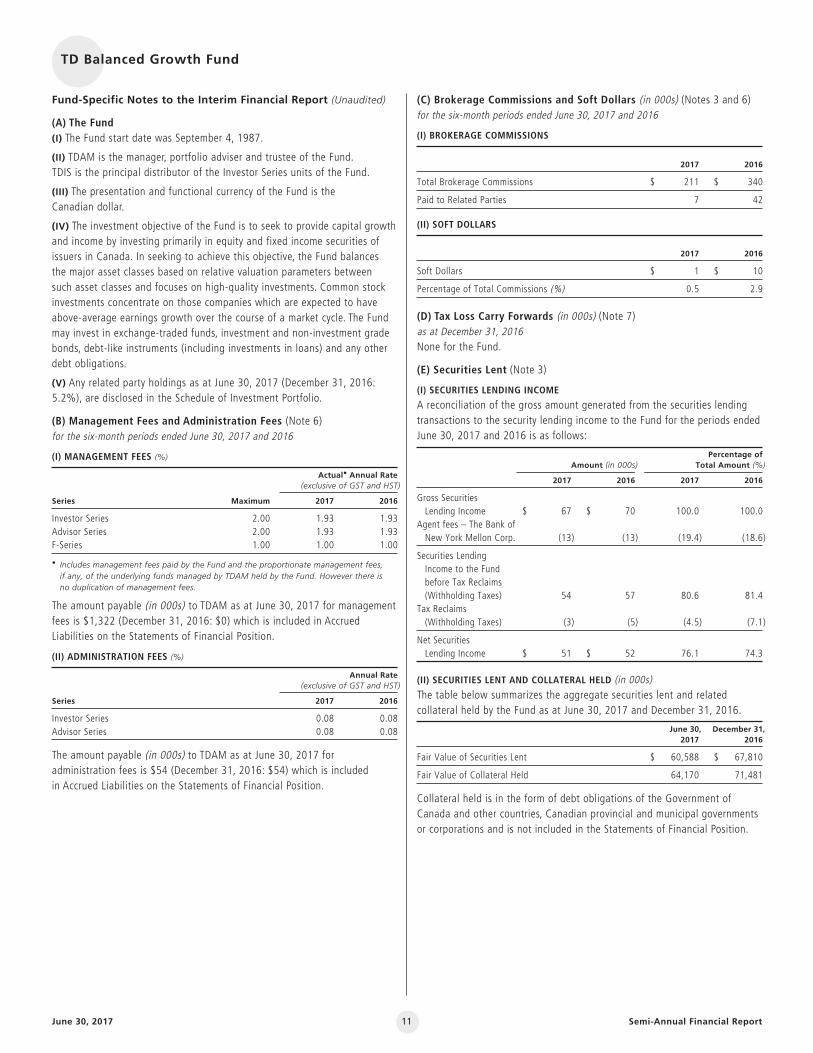
(C) Brokerage Commissions and Soft Dollars (in 000s) (Notes 3 and 6)for the six-month periods ended June 30, 2017 and 2016
(I) BROKERAGE COMMISSIONS
2017 2016
Total Brokerage Commissions $ 211 $ 340
Paid to Related Parties 7 42
(II) SOFT DOLLARS
2017 2016
Soft Dollars $ 1 $ 10
Percentage of Total Commissions (%) 0.5 2.9
(D) Tax Loss Carry Forwards (in 000s) (Note 7)as at December 31, 2016None for the Fund.
(E) Securities Lent (Note 3)
(I) SECURITIES LENDING INCOME
A reconciliation of the gross amount generated from the securities lendingtransactions to the security lending income to the Fund for the periods endedJune 30, 2017 and 2016 is as follows:
Percentage of Amount (in 000s) Total Amount (%)
2017 2016 2017 2016
Gross Securities Lending Income $ 67 $ 70 100.0 100.0
Agent fees – The Bank of New York Mellon Corp. (13) (13) (19.4) (18.6)
Securities Lending Income to the Fund before Tax Reclaims (Withholding Taxes) 54 57 80.6 81.4
Tax Reclaims (Withholding Taxes) (3) (5) (4.5) (7.1)
Net Securities Lending Income $ 51 $ 52 76.1 74.3
(II) SECURITIES LENT AND COLLATERAL HELD (in 000s)The table below summarizes the aggregate securities lent and relatedcollateral held by the Fund as at June 30, 2017 and December 31, 2016.
June 30, December 31, 2017 2016
Fair Value of Securities Lent $ 60,588 $ 67,810
Fair Value of Collateral Held 64,170 71,481
Collateral held is in the form of debt obligations of the Government ofCanada and other countries, Canadian provincial and municipal governmentsor corporations and is not included in the Statements of Financial Position.
nTD Balanced Growth Fund
11
June 30, 2017 Semi-Annual Financial Report
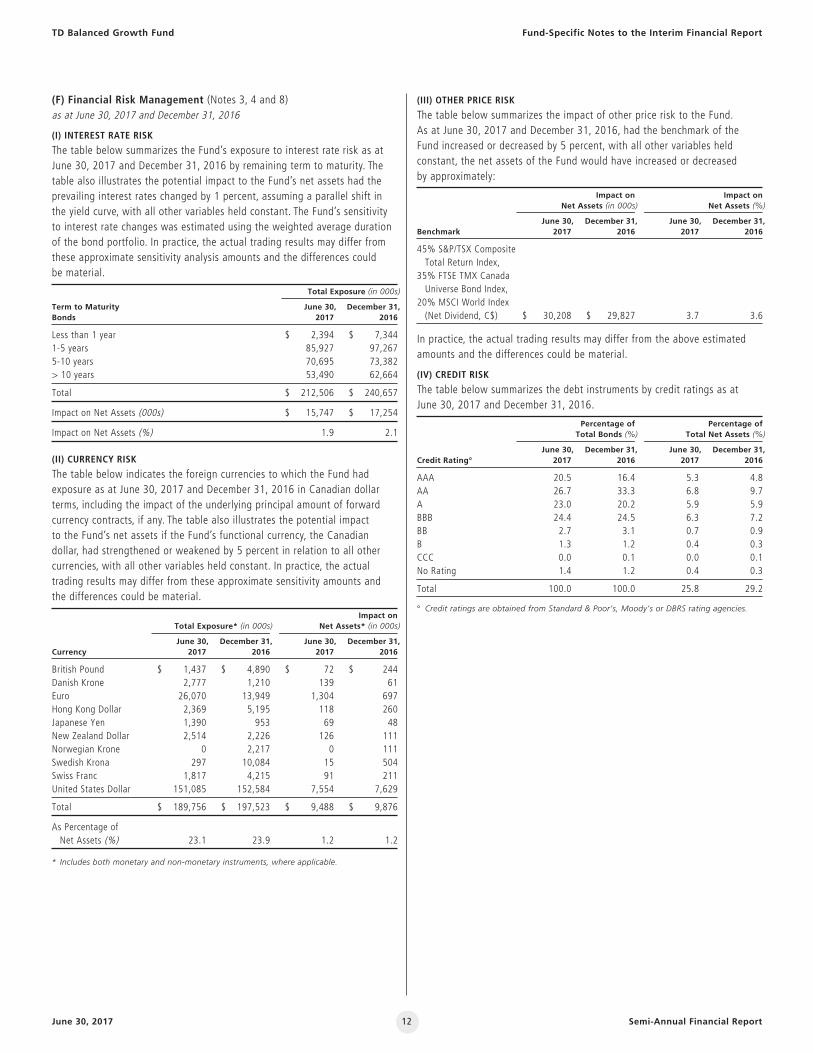
(F) Financial Risk Management (Notes 3, 4 and 8)as at June 30, 2017 and December 31, 2016
(I) INTEREST RATE RISK
The table below summarizes the Fund’s exposure to interest rate risk as atJune 30, 2017 and December 31, 2016 by remaining term to maturity. Thetable also illustrates the potential impact to the Fund’s net assets had theprevailing interest rates changed by 1 percent, assuming a parallel shift in the yield curve, with all other variables held constant. The Fund’s sensitivity to interest rate changes was estimated using the weighted average durationof the bond portfolio. In practice, the actual trading results may differ fromthese approx imate sensitivity analysis amounts and the differences could be material.
Total Exposure (in 000s)
Term to Maturity June 30, December 31,Bonds 2017 2016
Less than 1 year $ 2,394 $ 7,3441-5 years 85,927 97,2675-10 years 70,695 73,382> 10 years 53,490 62,664
Total $ 212,506 $ 240,657
Impact on Net Assets (000s) $ 15,747 $ 17,254
Impact on Net Assets (%) 1.9 2.1
(II) CURRENCY RISK
The table below indicates the foreign currencies to which the Fund hadexposure as at June 30, 2017 and December 31, 2016 in Canadian dollarterms, including the impact of the underlying principal amount of forwardcurrency contracts, if any. The table also illustrates the potential impact to the Fund’s net assets if the Fund’s functional currency, the Canadian dollar, had strengthened or weakened by 5 percent in relation to all othercurrencies, with all other variables held constant. In practice, the actualtrading results may differ from these approximate sensitivity amounts and the differences could be material.
Impact on Total Exposure* (in 000s) Net Assets* (in 000s)
June 30, December 31, June 30, December 31,Currency 2017 2016 2017 2016
British Pound $ 1,437 $ 4,890 $ 72 $ 244Danish Krone 2,777 1,210 139 61Euro 26,070 13,949 1,304 697Hong Kong Dollar 2,369 5,195 118 260Japanese Yen 1,390 953 69 48New Zealand Dollar 2,514 2,226 126 111Norwegian Krone 0 2,217 0 111Swedish Krona 297 10,084 15 504Swiss Franc 1,817 4,215 91 211United States Dollar 151,085 152,584 7,554 7,629
Total $ 189,756 $ 197,523 $ 9,488 $ 9,876
As Percentage of Net Assets (%) 23.1 23.9 1.2 1.2
* Includes both monetary and non-monetary instruments, where applicable.
(III) OTHER PRICE RISK
The table below summarizes the impact of other price risk to the Fund. As at June 30, 2017 and December 31, 2016, had the benchmark of the Fund increased or decreased by 5 percent, with all other variables heldconstant, the net assets of the Fund would have increased or decreased by approximately:
Impact on Impact on Net Assets (in 000s) Net Assets (%)
June 30, December 31, June 30, December 31,Benchmark 2017 2016 2017 2016
45% S&P/TSX Composite Total Return Index,
35% FTSE TMX Canada Universe Bond Index,
20% MSCI World Index (Net Dividend, C$) $ 30,208 $ 29,827 3.7 3.6
In practice, the actual trading results may differ from the above estimatedamounts and the differences could be material.
(IV) CREDIT RISK
The table below summarizes the debt instruments by credit ratings as at June 30, 2017 and December 31, 2016.
Percentage of Percentage of Total Bonds (%) Total Net Assets (%)
June 30, December 31, June 30, December 31,Credit Rating° 2017 2016 2017 2016
AAA 20.5 16.4 5.3 4.8AA 26.7 33.3 6.8 9.7A 23.0 20.2 5.9 5.9BBB 24.4 24.5 6.3 7.2BB 2.7 3.1 0.7 0.9B 1.3 1.2 0.4 0.3CCC 0.0 0.1 0.0 0.1No Rating 1.4 1.2 0.4 0.3
Total 100.0 100.0 25.8 29.2
° Credit ratings are obtained from Standard & Poor’s, Moody’s or DBRS rating agencies.
Fund-Specific Notes to the Interim Financial ReportTD Balanced Growth Fund
12
June 30, 2017 Semi-Annual Financial Report
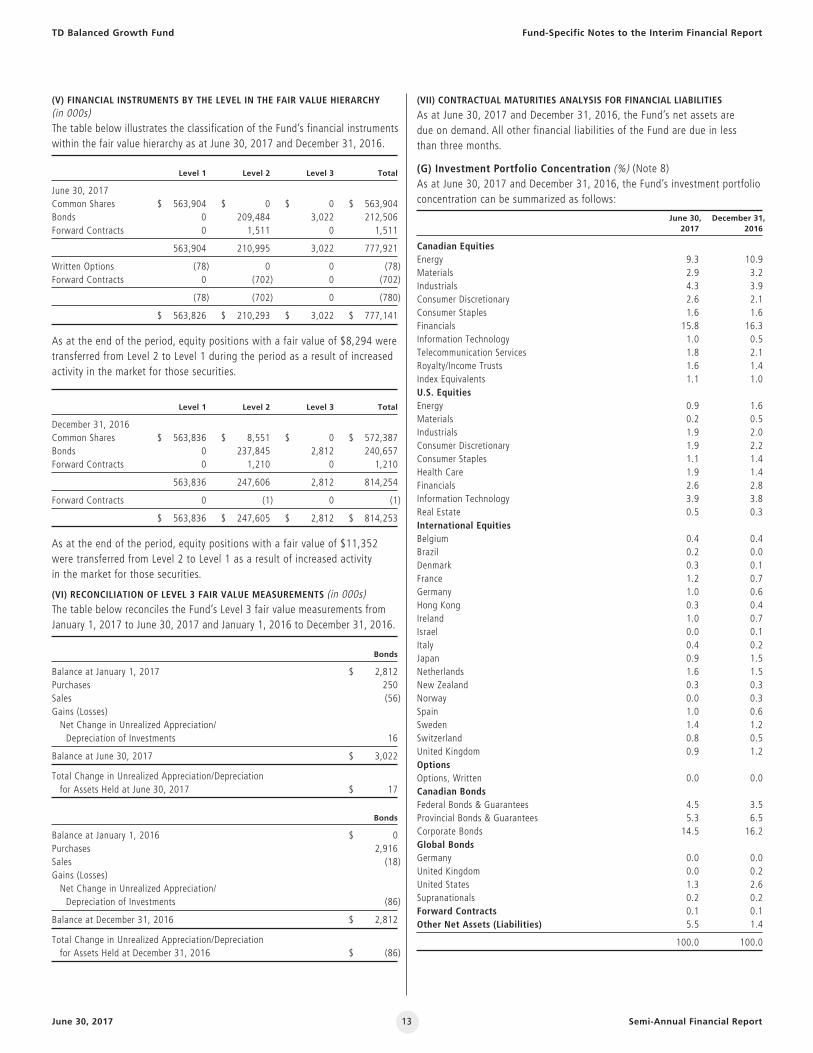
(V) FINANCIAL INSTRUMENTS BY THE LEVEL IN THE FAIR VALUE HIERARCHY (in 000s)The table below illustrates the classification of the Fund’s financial instrumentswithin the fair value hierarchy as at June 30, 2017 and December 31, 2016.
Level 1 Level 2 Level 3 Total
June 30, 2017Common Shares $ 563,904 $ 0 $ 0 $ 563,904Bonds 0 209,484 3,022 212,506Forward Contracts 0 1,511 0 1,511
563,904 210,995 3,022 777,921
Written Options (78) 0 0 (78)Forward Contracts 0 (702) 0 (702)
(78) (702) 0 (780)
$ 563,826 $ 210,293 $ 3,022 $ 777,141
As at the end of the period, equity positions with a fair value of $8,294 weretransferred from Level 2 to Level 1 during the period as a result of increasedactivity in the market for those securities.
Level 1 Level 2 Level 3 Total
December 31, 2016Common Shares $ 563,836 $ 8,551 $ 0 $ 572,387Bonds 0 237,845 2,812 240,657Forward Contracts 0 1,210 0 1,210
563,836 247,606 2,812 814,254
Forward Contracts 0 (1) 0 (1)
$ 563,836 $ 247,605 $ 2,812 $ 814,253
As at the end of the period, equity positions with a fair value of $11,352were transferred from Level 2 to Level 1 as a result of increased activity in the market for those securities.
(VI) RECONCILIATION OF LEVEL 3 FAIR VALUE MEASUREMENTS (in 000s)The table below reconciles the Fund’s Level 3 fair value measurements fromJanuary 1, 2017 to June 30, 2017 and January 1, 2016 to December 31, 2016.
Bonds
Balance at January 1, 2017 $ 2,812Purchases 250Sales (56)Gains (Losses)Net Change in Unrealized Appreciation/Depreciation of Investments 16
Balance at June 30, 2017 $ 3,022
Total Change in Unrealized Appreciation/Depreciationfor Assets Held at June 30, 2017 $ 17
Bonds
Balance at January 1, 2016 $ 0Purchases 2,916Sales (18)Gains (Losses)Net Change in Unrealized Appreciation/Depreciation of Investments (86)
Balance at December 31, 2016 $ 2,812
Total Change in Unrealized Appreciation/Depreciationfor Assets Held at December 31, 2016 $ (86)
(VII) CONTRACTUAL MATURITIES ANALYSIS FOR FINANCIAL LIABILITIES
As at June 30, 2017 and December 31, 2016, the Fund’s net assets are due on demand. All other financial liabilities of the Fund are due in less than three months.
(G) Investment Portfolio Concentration (%) (Note 8)As at June 30, 2017 and December 31, 2016, the Fund’s investment portfolioconcentration can be summarized as follows:
June 30, December 31, 2017 2016
Canadian EquitiesEnergy 9.3 10.9Materials 2.9 3.2Industrials 4.3 3.9Consumer Discretionary 2.6 2.1Consumer Staples 1.6 1.6Financials 15.8 16.3Information Technology 1.0 0.5Telecommunication Services 1.8 2.1Royalty/Income Trusts 1.6 1.4Index Equivalents 1.1 1.0U.S. EquitiesEnergy 0.9 1.6Materials 0.2 0.5Industrials 1.9 2.0Consumer Discretionary 1.9 2.2Consumer Staples 1.1 1.4Health Care 1.9 1.4Financials 2.6 2.8Information Technology 3.9 3.8Real Estate 0.5 0.3International EquitiesBelgium 0.4 0.4Brazil 0.2 0.0Denmark 0.3 0.1France 1.2 0.7Germany 1.0 0.6Hong Kong 0.3 0.4Ireland 1.0 0.7Israel 0.0 0.1Italy 0.4 0.2Japan 0.9 1.5Netherlands 1.6 1.5New Zealand 0.3 0.3Norway 0.0 0.3Spain 1.0 0.6Sweden 1.4 1.2Switzerland 0.8 0.5United Kingdom 0.9 1.2OptionsOptions, Written 0.0 0.0Canadian BondsFederal Bonds & Guarantees 4.5 3.5Provincial Bonds & Guarantees 5.3 6.5Corporate Bonds 14.5 16.2Global BondsGermany 0.0 0.0United Kingdom 0.0 0.2United States 1.3 2.6Supranationals 0.2 0.2Forward Contracts 0.1 0.1Other Net Assets (Liabilities) 5.5 1.4
100.0 100.0
Fund-Specific Notes to the Interim Financial ReportTD Balanced Growth Fund
13
June 30, 2017 Semi-Annual Financial Report
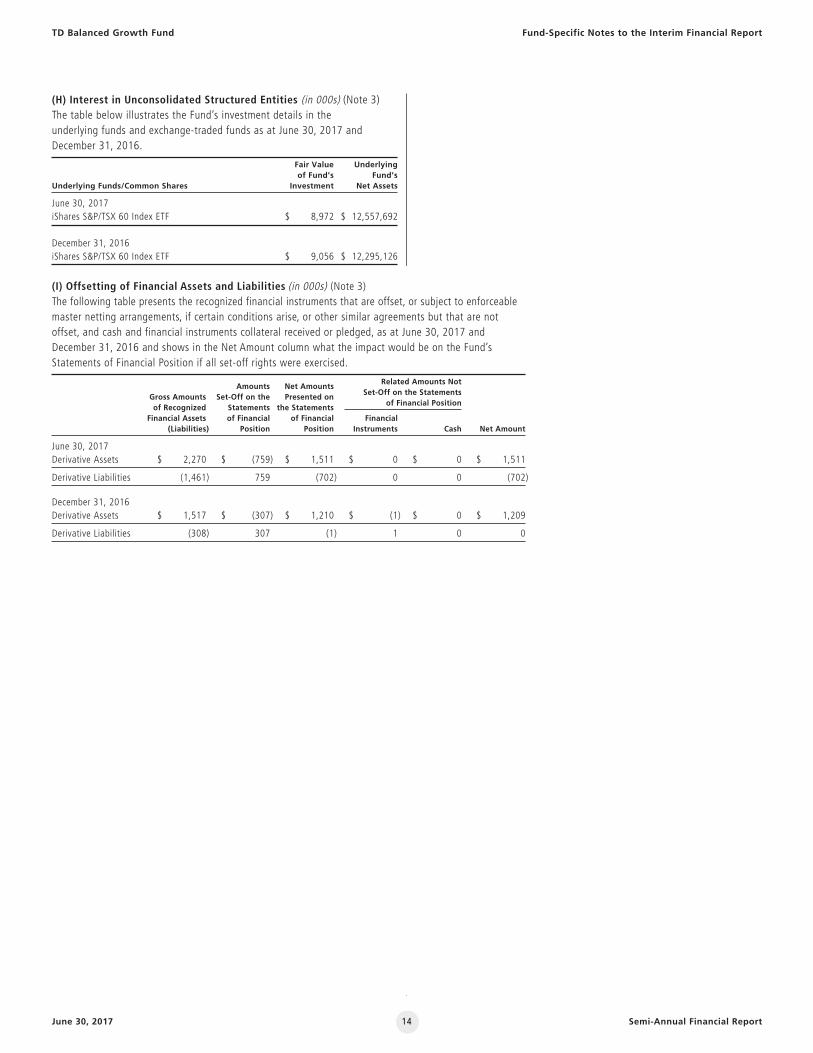
(H) Interest in Unconsolidated Structured Entities (in 000s) (Note 3)The table below illustrates the Fund’s investment details in the underlying funds and exchange-traded funds as at June 30, 2017 andDecember 31, 2016.
Fair Value Underlying of Fund’s Fund’s Underlying Funds/Common Shares Investment Net Assets
June 30, 2017iShares S&P/TSX 60 Index ETF $ 8,972 $ 12,557,692
December 31, 2016iShares S&P/TSX 60 Index ETF $ 9,056 $ 12,295,126
Fund-Specific Notes to the Interim Financial ReportTD Balanced Growth Fund
(I) Offsetting of Financial Assets and Liabilities (in 000s) (Note 3)The following table presents the recognized financial instruments that are offset, or subject to enforceablemaster netting arrangements, if certain conditions arise, or other similar agreements but that are notoffset, and cash and financial instruments collateral received or pledged, as at June 30, 2017 and December 31, 2016 and shows in the Net Amount column what the impact would be on the Fund’sStatements of Financial Position if all set-off rights were exercised.
Amounts Net Amounts Related Amounts Not
Gross Amounts Set-Off on the Presented on Set-Off on the Statements
of Recognized Statements the Statements of Financial Position
Financial Assets of Financial of Financial Financial (Liabilities) Position Position Instruments Cash Net Amount
June 30, 2017Derivative Assets $ 2,270 $ (759) $ 1,511 $ 0 $ 0 $ 1,511
Derivative Liabilities (1,461) 759 (702) 0 0 (702)
December 31, 2016Derivative Assets $ 1,517 $ (307) $ 1,210 $ (1) $ 0 $ 1,209
Derivative Liabilities (308) 307 (1) 1 0 0
14
1. The Fund
The TD Mutual Fund Trusts, TD Managed Assets Program Portfolios andTD Managed ETF Portfolios (collectively, the “Funds” and individually, the “Fund”) are open-end mutual funds established under the laws of Ontario and governed by the Declaration of Trust, as amended fromtime to time.
The TD Managed Assets Program Portfolios invest primarily in units ofother mutual funds and TD Managed ETF Portfolios invest primarily inunits of other exchange-traded funds.
TD Asset Management Inc. (“TDAM”) is the manager, portfolio adviserand trustee of the Funds. TDAM, TDAM USA Inc., TD Investment Services Inc. (“TDIS”), TD Waterhouse Canada Inc. (“TDW”) and EpochInvestment Partners, Inc. (“Epoch”) are wholly-owned subsidiaries of The Toronto-Dominion Bank (“TD”). The registered address of theFunds is P.O. Box 100, 66 Wellington Street West, TD Bank Tower,Toronto-Dominion Centre, Toronto, Ontario M5K 1G8.
The financial year-end for the Funds is December 31. The Statements ofFinancial Position are presented as at June 30, 2017 and December 31,2016. The Statements of Comprehensive Income, Statements of Changes in Net Assets Attributable to Holders of Redeemable Units and Statements of Cash Flows are presented for the periods ended June 30, 2017 and 2016. Where a Fund or series of a Fund wasestablished during either period, the information for the Fund or series is provided from the inception date. A comparative statement has onlybeen presented for any period for which the Fund was in existence as at the reporting date.
The Fund’s start date as indicated in the Interim Fund-Specific Notes to the Financial Report is the date that the Fund commenced operationsor in the case of a new series, the date the series was first offered andnot its inception date.
This financial report was authorized for issue by TDAM on August 15, 2017.
2. Basis of Presentation
This interim financial report has been prepared in compliance withInternational Financial Reporting Standards (“IFRS”) as published by the International Accounting Standards Board (“IASB”), applicable to the preparation of interim financial reports, including InternationalAccounting Standards (“IAS”) 34, “Interim Financial Reporting”. Thisinterim financial report has been prepared under the historical costconvention, as modified by the revaluation of financial assets andfinancial liabilities (including derivative financial instruments) at fairvalue through profit or loss (“FVTPL”).
3. Summary of Significant Accounting Policies
Financial InstrumentsThe Fund recognizes financial instruments at fair value upon initialrecognition, plus transaction costs in the case of financial instrumentsnot measured at FVTPL. Regular way purchases and sales of financialinstruments are recognized at their trade date. The Fund’s non-derivativeinvestments, which are designated at FVTPL, and derivative assets andliabilities, which are classified as held for trading (“HFT”), are measuredat FVTPL.
All other financial assets and liabilities are measured at amortized cost.Under this method, financial assets and liabilities reflect the amountrequired to be received or paid, discounted, when appropriate, at thecontract’s effective interest rate.
The Fund has determined that it meets the definition of an ‘investmententity’ and as a result, it measures subsidiaries, if any, at FVTPL. Aninvestment entity is an entity that: obtains funds from one or moreinvestors for the purpose of providing them with investment manage -ment services; commits to its investors that its business purpose is toinvest funds solely for returns from capital appreciation, investmentincome, or both; and measures and evaluates the performance ofsubstantially all of its investments on a fair value basis. The significantjudgment that the Fund has made in determining that it meets thisdefinition is that fair value is the primary measurement attribute used to measure and evaluate the performance of substantially all of itsinvestments. The Fund’s investments may also include associates andjoint ventures which are designated at FVTPL.
The Fund’s outstanding redeemable units’ entitlements include acontractual obligation to distribute any net income and net realizedcapital gains in cash (at the request of the unitholder) and therefore the ongoing redemption feature is not the Fund’s only contractualobligation. Consequently, the Fund’s outstanding redeemable units areclassified as financial liabilities in accordance with the requirements ofIAS 32, “Financial Instruments: Presentation” (“IAS 32”). The Fund’sobligations for Net Assets Attributable to Holders of Redeemable Unitsare presented at the redemption amount.
The Fund’s accounting policies for measuring the fair value of itsinvestments and derivatives are substantially similar to those used inmeasuring its net asset value (“NAV”) for transactions with unitholders.The NAV is the value of the total assets of a fund less the value of itstotal liabilities determined, on each valuation day, in accordance withPart 14 of National Instrument 81-106, “Investment Fund ContinuousDisclosure”, for the purpose of processing unitholder transactions. Net Assets Attributable to Holders of Redeemable Units, also referred to as net assets, refers to net assets calculated in accordance with IFRS.As at all dates presented, there were no differences between the Fund’sNAV per series unit and net assets per series unit.
nNotes to the Interim Financial Report (Unaudited)
June 30, 2017 Semi-Annual Financial Report15
Fair Value MeasurementFair value is the price that would be received to sell an asset or paid to transfer a liability in an orderly transaction between market partici-pants at the measurement date. The fair value of financial assets and liabilities traded in active markets (such as publicly traded derivativesand marketable securities) are based on quoted market prices at theclose of trading on the reporting date. The Fund uses the last traded market price for both financial assets and financial liabilities where thelast traded price falls within that day’s bid-ask spread. In circumstanceswhere the last traded price is not within the bid-ask spread, TDAM determines the point within the bid-ask spread that is most representa-tive of fair value based on the specific facts and circumstances. TheFund’s policy is to recognize transfers into and out of the fair value hierarchy levels at the end of reporting periods.
The fair value of financial assets and liabilities that are not traded in an active market, including over-the-counter derivatives, is determinedusing valuation techniques. The Fund uses a variety of methods andmakes assumptions that are based on market conditions existing at each reporting date. Valuation techniques include the use of comparablerecent arm’s length transactions, reference to other instruments that are substantially the same, discounted cash flow analysis, option pricingmodels and other techniques commonly used by market participants andwhich make the maximum use of observable inputs.
The valuation methodology for specific types of investments held by theFund is summarized below.
(a) Securities not listed on any recognized public securities exchange are valued based on available quotations from recognized dealers insuch securities, where readily available. If securities held in the Fund,if any, have no available broker-dealer bid/ask quotes, TDAM uses its own pricing model to price the securities. The pricing model willgenerally include the discounted cash flow valuation approach, theidentification of a “uniqueness” premium and the use of such creditand yield analysis comparables as TDAM believes are relevant in thecircumstances. Debt instruments are valued based on mid prices,where readily available.
(b) Short-term debt instruments, repurchase and reverse repurchaseagreements are valued based on quotations received from recognizedinvestment dealers.
(c) Real return bonds are valued based on the available public quotations from recognized dealers. Changes in the inflation factorare reported in Interest for Distribution Purposes on the Statementsof Comprehensive Income.
(d) The Fund may use foreign exchange forward contracts to hedgeagainst or profit from fluctuations in foreign exchange rates. Thesecontracts are valued on each valuation day based on the differencebetween the contract rates and the current forward rates at themeasurement date applied to the contracts’ notional amount. The net change in unrealized appreciation or depreciation and the netrealized gain or loss from closing out contracts are reflected on the Statements of Comprehensive Income as part of Net Gain (Loss)on Derivatives.
(e) The Fund may enter into a forward contract to obtain exposure to aspecific type of investment without actually investing directly in suchinvestment. These contracts are valued based on the differencebetween the contract rate and the current market rate for theunderlying investment, at the measurement date. The unrealized gainor loss and the net realized gain or loss from closing out contractsare reflected on the Statements of Comprehensive Income as part ofNet Gain (Loss) on Derivatives.
(f) The Fund may purchase standardized, exchange-traded futurescontracts. Any outstanding futures contracts as at June 30, 2017are listed in the Schedule of Investment Portfolio. Any differencebetween the value at the close of business on the current valuationday and that of the previous valuation day is settled in cash daily and recorded on the Statements of Comprehensive Income asDerivatives Income (Loss). Any amounts receivable (payable) fromsettlement of futures contracts are reflected on the Statements ofFinancial Position as Futures Margin Receivable (Payable). Short-termdebt instruments as indicated in the Schedule of Investment Portfoliohave been segregated and are held as margin against the futurescontracts purchased by the Fund.
(g) Options contracts that are traded in exchange markets are valued at their closing prices on each valuation day. The premium received or paid on options written or purchased is included in the cost of the options. Any difference between the current value of the contractand the value of the contract originated is recognized as net changein unrealized appreciation/depreciation on derivatives. When optionsare closed or exercised, the difference between the premium and the amount paid or received, or the full amount of the premium if the option expires worthless, is reflected on the Statements ofComprehensive Income as part of Net Gain (Loss) on Derivatives. The cost of a security purchased will be reduced by the premiumreceived on options when a written put option is exercised.
(h) Investments in underlying funds (mutual funds and TD Exchange-Traded Funds) are generally valued at the NAV per series unit of theunderlying funds as reported by the underlying funds’ managers.
(i) The exchange-traded funds (ETFs) are valued based on quoted marketprices at the close of trading on the reporting date.
nNotes to the Interim Financial Report (Unaudited)
Semi-Annual Financial ReportJune 30, 2017 16

Fair Value HierarchyThe Fund classifies its investment into fair value measurements within a hierarchy that prioritizes the inputs to fair value measurement. The fair value hierarchy has the following three levels:
Level 1 Quoted (unadjusted) prices in active markets for identicalassets or liabilities;
Level 2 Inputs other than quoted prices that are observable for the asset or liability either directly (that is, as prices) orindirectly (that is, derived from prices); and
Level 3 Inputs that are not based on observable market data (that is, unobservable inputs).
All fair value measurements are recurring. The carrying values of Cash,Subscriptions Receivable, Interest Receivable, Dividends Receivable,Receivable for Investments Sold, Payable for Investments Purchased,Redemptions Payable, Distributions Payable, Accrued Liabilities and theFund’s obligation for Net Assets Attributable to Holders of RedeemableUnits approximate their fair values due to their short-term nature.
Fair values are classified as Level 1 when the related security or deriva-tive is actively traded and a quoted price is available. If an instrumentclassified as Level 1 subsequently ceases to be actively traded, it is transferred out of Level 1. In such cases, instruments are reclassified into Level 2, unless the measurement of its fair value requires the use ofsignificant unobservable inputs, in which case it is classified as Level 3.
The hierarchy gives the highest priority to unadjusted quoted prices inactive markets for identical assets or liabilities (Level 1) and the lowestpriority to unobservable inputs (Level 3).
The classification within the hierarchy is based on the lowest level inputthat is significant to the fair value measurement. For this purpose, thesignificance of an input is assessed against the fair value measurementin its entirety. If a fair value measurement uses observable inputs thatrequire significant adjustment based on unobservable inputs, thatmeasurement is a Level 3 measurement. Assessing the significance of a particular input to the fair value measurement in its entirety requiresjudgment, considering factors specific to the asset or liability.
The determination of what constitutes ‘observable’ requires significantjudgment. Observable data is considered to be that market data that isreadily available, regularly distributed or updated, reliable and verifiable,not proprietary, and provided by independent sources that are activelyinvolved in the relevant market.
TDAM has a Global Fair Value Committee which oversees theperformance of the fair value measurements included in the financialstatements of the Fund, including any Level 3 measurements. TDAMutilizes a variety of methods (as listed in the Fair Value Measurementsection) in determining the fair value of securities classified as Level 3.The committee also meets quarterly to perform reviews of the valuationsof investments held by the Fund.
The classification of the Fund’s financial instruments within the fair value hierarchy as at June 30, 2017 and December 31, 2016, and anytransfers between levels at end of the period as a result of changes inthe lowest level input that is significant to the fair value measurementare disclosed in the Fund-Specific Notes to the Financial Statements,where applicable.
Interest in Unconsolidated Structured EntitiesA structured entity is an entity that has been designed so that voting or similar rights are not the dominant factor in deciding who controls the entity, such as when any voting rights relate to administrative tasksonly and the relevant activities are directed by means of contractualarrangements. TDAM has determined that all of the underlying funds and ETFs in which the Fund invests are unconsolidated structuredentities. In making this determination, TDAM evaluated the fact thatdecision making about underlying funds’ and ETF’s activities aregenerally not governed by voting or similar rights held by the Fund andother investors in any underlying funds and ETFs.
The Fund may invest in underlying funds and ETFs whose investmentobjectives range from achieving short- to long-term income and capital growth potential. The Fund’s interests in these securities as at June 30, 2017 and December 31, 2016 are included at their fair value on the Statements of Financial Position, which represent the Fund’sexposure in these underlying funds and ETFs. The Fund does not provideand has not committed to provide any additional significant financial orother support to the underlying funds and ETFs. The change in fair valueof each of the underlying funds and ETFs during the reporting periods is included in Net Change in Unrealized Appreciation/Depreciationon the Statements of Comprehensive Income in Net Gain (Loss) onInvestments. Additional information on the Fund’s interest in underlyingfunds and ETFs, where applicable, is provided in the Fund-Specific Notesto the Financial Statements.
TD MUTUAL FUND TRUSTS
The TD Mutual Fund Trusts may also invest in mortgage-related and otherasset-backed securities that directly or indirectly represent a participationin, or are secured by and payable from, mortgage loans on real property.Mortgage-related securities are created from pools of residential orcommercial mortgage loans, including mortgage loans made by savingsand loan institutions, mortgage bankers, commercial banks and others.The debt and equity securities issued by these issuers may includetranches with varying levels of subordination. The Fund may also investin senior notes that have a first lien on assets and have minimumexposure to junior or subordinate tranches. These securities may providea monthly payment which consists of both interest and principalpayments. Other asset-backed securities are created from many types ofassets, including auto loans, credit card receivables, home equity loans,and student loans.
As at June 30, 2017 and December 31, 2016, the fair value of mortgage-related and other asset-backed securities of the Fund, where applicable,is disclosed as part of the Investments on the Statements of FinancialPosition. This amount represents the maximum exposure to losses at that date. The change in fair value of mortgage-related and otherasset-backed securities during the reporting periods are included in theNet Change in Unrealized Appreciation/Depreciation on Statements ofComprehensive Income in Net Gain (Loss) on Investments.
nNotes to the Interim Financial Report (Unaudited)
June 30, 2017 Semi-Annual Financial Report17
Translation of Foreign CurrenciesThe Fund’s functional currency, as disclosed in the Fund-Specific Notes to the Financial Statements, represents the currency that TDAM views tomost faithfully represent the economic effects of the Fund’s underlyingtransactions, events and conditions taking into consideration how unitsare issued or redeemed and how returns are measured. Foreign currencytransactions are translated into the functional currency using theexchange rates prevailing at the dates that transactions occur. Assets and liabilities denominated in a foreign currency are translated into the functional currency using the exchange rate prevailing at themeasurement date. Foreign exchange gains and losses on the sale ofinvestments are included in Net Realized Gain (Loss) on Investments.Unrealized foreign exchange gains and losses on investments held areincluded in Net Change in Unrealized Appreciation/Depreciation onInvestments. Realized and unrealized foreign exchange gains and lossesrelating to cash are presented as Foreign Exchange Gain (Loss) on Cashon the Statements of Comprehensive Income.
Offsetting Financial Assets and LiabilitiesFinancial assets and liabilities are offset and the net amount reported on the Statements of Financial Position where the Fund has a legallyenforceable right to offset the recognized amounts and there is anintention to settle on a net basis or realize the asset and settle theliability simultaneously. In all other situations they are presented on agross basis. In the normal course of business, the Fund may enter intovarious master netting agreements or other similar arrangements that do not meet the criteria for offsetting on the Statements of FinancialPosition but still allow for the related amounts to be set-off in certaincircumstances, such as bankruptcy or the termination of the contracts.Offsetting information, where applicable, is presented in the Fund-Specific Notes to the Financial Statements.
Reverse Repurchase AgreementsThe Fund may enter into reverse repurchase transactions. In a reverserepurchase transaction, the Fund buys a security at one price from a third party and agrees to sell the same security back to the same party at a specified price on an agreed future date and the difference is included as Net Gain (Loss) on Investments on the Statements ofComprehensive Income.
The risk with these types of transactions is that the other party maydefault under the agreement or go bankrupt. These risks are reduced byrequiring the other party to provide collateral to the Fund. The value ofthe collateral has to be at least 102 percent of the market value of thesecurity and the collateral is marked to market on each business day. The type of securities received and related collateral held by the Fund,where applicable, are listed in the Schedule of Investment Portfolio.
CashCash is comprised of deposits with financial institutions. Bank overdrafts are shown under Current Liabilities on the Statements ofFinancial Position.
Receivable for Investments Sold/Payable for Investments PurchasedReceivable for Investments Sold and Payable for Investments Purchasedrepresent trades that have been contracted for but not yet settled ordelivered in the Statements of Financial Position dates.
Impairment of Financial AssetsAt each reporting date, the Fund assesses whether there is objectiveevidence that a financial asset at amortized cost is impaired. If suchevidence exists, the Fund recognizes an impairment loss as the differencebetween the amortized cost of the financial asset and the present valueof the estimated future cash flows, discounted using the instrument’soriginal effective interest rate. Impairment losses on financial assets atamortized cost are reversed in subsequent periods if the amount of theloss decreases and the decrease can be related objectively to an eventoccurring after the impairment was recognized.
Valuation of Series UnitsTDAM generally calculates the NAV for each series of the Fund as at4 p.m. Eastern Time on each day that the Toronto Stock Exchange is openfor trading. However, in some unusual circumstances, the series NAV perunit may be calculated at another time where it is in the best interests of unitholders to do so.
The NAV is calculated, for processing purchase, switch, conversion orredemption orders of series units, for each series of units of the Fund by taking the series’ proportionate share of the Fund’s common assetsless that series’ proportionate share of the Fund’s common liabilities and deducting from this amount all liabilities that relate solely to thatspecific series.
The Net Assets Attributable to Holders of Redeemable Units – Per SeriesUnit is determined by dividing the total Net Assets Attributable to Holdersof Redeemable Units of each series of the Fund by the total number ofunits outstanding of that series at the reporting date.
Income RecognitionInterest for Distribution Purposes as shown on the Statements ofComprehensive Income includes interest income from cash and thecoupon interest on debt instruments accounted for on an accrual basis.Interest Receivable is disclosed on the Statements of Financial Positionbased on the debt instruments’ stated rates of interest. The Fund doesnot amortize premiums paid or discounts received on the purchase ofdebt securities except for zero coupon bonds which are amortized.
Dividend income and distributions from any underlying funds and ETFs,are recognized on the ex-dividend and ex-distribution date respectively.Distributions received from ETFs are recognized and presented in thefinancial statements based on the nature of the underlying componentssuch as interest income, dividend income, capital gains and return of capital.
The TD Mutual Fund Trusts may engage in securities lending pursuant to the terms of an agreement which includes restrictions as set out inCanadian securities legislation. The income earned from securities lend-ing, where applicable, is included in the Statements of ComprehensiveIncome as it is earned. The fair value of the securities loaned and fairvalue of the collateral held is determined daily. The details of securitylending income, aggregate values of securities on loan and related collateral held by the Fund is provided in the Fund-Specific Notes to the Financial Statements, where applicable.
nNotes to the Interim Financial Report (Unaudited)
Semi-Annual Financial ReportJune 30, 2017 18
Investment Transactions and Transaction CostsThe cost of each investment security (excluding transaction costs),realized and unrealized gains and losses from investment transactionsare determined on an average cost basis.
Transaction costs, such as brokerage commissions, incurred by the Fundin the purchase and sale of investments at fair value are recognized inthe Statements of Comprehensive Income in the period incurred.Commissions paid, where applicable, are described in the Fund-SpecificNotes to the Financial Statements. No transaction costs are incurredwhen the Fund invests in underlying funds. However, the underlyingfunds’ investments may be subject to transaction costs.
Allocation of Income and Expenses, Realized and Unrealized Gains (Losses)Expenses (excluding interest charges and portfolio transaction costs) areaccrued daily, separately for each series. Interest charges and portfoliotransaction costs along with income, gains and losses, are allocated toeach series based on their respective Net Assets Attributable to Holdersof Redeemable Units.
Increase (Decrease) in Net assets Attributable to Holders of Redeemable Units – Per Series UnitThe Increase (Decrease) in Net Assets Attributable to Holders ofRedeemable Units – Per Series Unit is calculated by dividing the Increase(Decrease) in Net Assets Attributable to Holders of Redeemable Units of each series by the weighted average units outstanding of that seriesfor the period except Weighted Average Units Outstanding for the Period – Per Series which is calculated from the start date.
Accounting Standards Issued but Not Yet AdoptedThe final version of IFRS 9, “Financial Instruments” (“IFRS 9”) wasissued by the IASB in July 2014 and will replace International AccountingStandards (“IAS”) 39, “Financial Instruments: Recognition andMeasurement” (“IAS 39”). IFRS 9 introduces a model for classificationand measurement, a single, forward-looking ‘expected loss’ impairmentmodel and a substantially reformed approach to hedge accounting. Thenew single, principle based approach for determining the classification of financial assets is driven by cash flow characteristics and the businessmodel in which an asset is held. The new model also results in a singleimpairment model being applied to all financial instruments, which willrequire more timely recognition of expected credit losses. It also includeschanges in respect of own credit risk in measuring liabilities elected tobe measured at fair value, so that gains caused by the deterioration ofan entity’s own credit risk on such liabilities are no longer recognized in profit or loss. IFRS 9 is effective for annual periods beginning on orafter January 1, 2018, however it is available for early adoption. In addition, the own credit changes can be early applied in isolation with-out otherwise changing the accounting for financial instruments. Themanager is in the process of assessing the impact of IFRS 9.
4. Critical Accounting Estimates and Judgments
The preparation of financial statements requires management to usejudgment in applying its accounting policies and to make estimates and assumptions about the future. The following discusses the mostsignificant accounting judgments and estimates that the Fund has madein preparing the financial statements:
Fair Value Measurement of Derivatives and Securities Not Quoted in an Active MarketThe Fund may hold financial instruments that are not quoted in activemarkets, including derivatives. As described in Note 3, the use ofvaluation techniques for financial instruments and derivatives that arenot quoted in an active market requires TDAM to make assumptions that are based on market conditions existing as at the date of financialstatements. Changes in assumptions about these factors could affect thereported fair values of financial instruments. Refer to the Fund-SpecificNotes to the Financial Statements for further information about the fairvalue measurement of the Fund’s financial instruments, where applicable.
Classification and Measurement of Investments and Application of the Fair Value OptionIn classifying and measuring financial instruments held by the Fund,TDAM is required to make significant judgments about whether or not the business of the Fund is to invest on a total return basis for thepurpose of applying the fair value option for financial assets underIAS 39. The most significant judgments made include the determinationthat certain investments are HFT and that the fair value option can beapplied to those which are not.
Investment EntityIn determining whether the Fund is an investment entity, TDAM may berequired to make significant judgments about whether the Fund has thetypical characteristics of an investment entity. The Fund may hold onlyone investment, an underlying fund (or have only one investor or haveinvestors that are its related parties), however, consistent with theinvestment entity definition, the Fund primarily obtains funds from oneor more investors for the purpose of providing investment managementservices, commits to its investors that the business purpose is to investthe funds solely for returns from capital appreciation, investment incomeor both, and measures and evaluates the performance of its investmentson a fair value basis.
nNotes to the Interim Financial Report (Unaudited)
June 30, 2017 Semi-Annual Financial Report19
5. Redeemable Units
TD Mutual Fund TrustsEach Fund is authorized to issue an unlimited number of units of multiple series that rank equally and are available for sale under a single simplified prospectus. In addition, the Fund is also authorized to issue unlimited number of units of multiple series to be sold under a confidential offering memorandum or other separate simplifiedprospectus. The various series that may be offered by the Fund are as described below.
Investor Series: Offered on a no-load basis to investors.
H-Series: Offered on a no-load basis to investors who wish to receivea regular monthly cash flow from the Fund. Monthly distributions may consist of net income, net realized capitalgains and/or a return of capital.
Premium Series: Offered on a no-load basis to large investors and others who make the required minimum investment, as determinedby TDAM from time to time.
K-Series: Offered on a no-load basis to large investors and others who make the required minimum investment, as determinedby TDAM from time to time, and who wish to receive a regular monthly cash flow from the Fund. Monthly distribu-tions may consist of net income, net realized capital gains,and/or a return of capital.
e-Series: Offered on a no-load basis to investors who want to complete their transactions electronically.
D-Series: Offered on a no-load basis to investors who want to complete their transactions through TD Direct Investing, a division of TDW, or other discount brokers.
Advisor Series: Offered to investors who seek investment advice and wantthe option of transacting on a front-end load, back-end load, low-load or low-load-2 basis.
T-Series: Offered to investors who seek investment advice; want theoption of transacting on a front-end load, back-end load,low-load or low-load-2 basis; and who wish to receive a regular monthly cash flow from the Fund. Monthly distribu-tions may consist of net income, net realized capital gainsand/or a return of capital.
F-Series: Offered to investors, through fee-based financial advisors or dealer-sponsored “wrap accounts”, and others who pay an annual fee to their dealer instead of transactionalsales charges.
S-Series: Offered to investors who wish to receive a regular monthlycash flow from the Fund, through fee-based financialadvisors or dealer-sponsored “wrap accounts”. This seriesmay also be offered to other investors who pay an annualfee to their dealer instead of transactional sales charges.Monthly distributions may consist of net income, net realizedcapital gains, and/or a return of capital.
Premium Offered to large investors, through fee-based financial F-Series: advisors or dealer-sponsored “wrap accounts”, and others
who pay an annual fee to their dealer instead of trans -actional sales charges. For this series, investors must makethe required minimum investment, as determined by TDAMfrom time to time.
PS Series: Offered to large investors who wish to receive a regularmonthly cash flow from the Fund, through fee-based financial advisors or dealer-sponsored “wrap accounts”, and others who pay an annual fee to their dealer instead of transactional sales charges. For this services, investorsmust make the required minimum investment, as determinedby TDAM from time to time. Monthly distributions may consist of net income, net realized capital gains, and/ areturn of capital.
W-Series: Offered to investors, through certain wealth managementbusinesses of TD Bank Group, including certain divisions of TDW, or other dealers authorized by TDAM, who pay an annual fee to their dealer instead of transactional sales charges.
Private Series: Offered on a no-load basis to large investors who make therequired minimum investment as determined by TDAM, andhave entered into a Private Series agreement with TDAM.
Institutional Offered on a no-load basis to large investors, such as Series: group savings plans and others who make the required
minimum investment, as determined by TDAM from time to time.
Q-Series: Offered on a no-load basis to large investors such as groupsavings plans and others who wish to receive a regularmonthly cash flow from the Fund, and who make therequired minimum investment, as determined by TDAM fromtime to time. Monthly distributions may consist of netincome, net realized capital gains and/or a return of capital.
C-Series Offered on a no-load basis to large investors who make the required minimum investment as determined by TDAMand have entered into a C-Series agreement with TDAM.
O-Series: Offered on a no-load basis to large investors who make the required minimum investment as determined by TDAM,and have entered into an O-Series agreement with TDAM.
Units of the Fund are redeemable at the option of the unitholder inaccordance with the provisions of the Declaration of Trust. Units of the Fund are issued or redeemed on a daily basis at the NAV per seriesunit next determined after the purchase, switch, conversion order orredemption request, respectively, is received by TDAM. Purchases andredemptions include units exchanged from one series to another serieswithin a Fund in the Statements of Changes in Net Assets Attributable to Holders of Redeemable Units. However, switches between serieswithin a Fund are excluded from Proceeds from Issuances of RedeemableUnits and Amounts Paid on Redeemable Units, Net of Redemption Fees in the Statements of Cash Flows.
nNotes to the Interim Financial Report (Unaudited)
Semi-Annual Financial ReportJune 30, 2017 20
TD Managed Assets Program Portfolios
Each Fund is authorized to issue an unlimited number of units of multiple series that rank equally and are available for sale under a single simplified prospectus. The various series that may be offered by the Fund are as described below.
Investor Series: Offered on a no-load basis to investors.
H-Series: Offered on a no-load basis to investors who wish to receivea regular monthly cash flow from the Fund. Monthly distributions may consist of net income, net realized capitalgains and/or a return of capital.
Premium Series: Offered on a no-load basis to large investors and others who make the required minimum investment, as determinedby TDAM from time to time.
K-Series: Offered on a no-load basis to large investors and others who make the required minimum investment, as determinedby TDAM from time to time, and who wish to receive a regular monthly cash flow from the Fund. Monthly distribu-tions may consist of net income, net realized capital gains,and/or a return of capital.
e-Series: Offered on a no-load basis to investors who want to com-plete their transactions electronically.
Advisor Series: Offered to investors who seek investment advice and wantthe option of transacting on a front-end load, back-end load,low-load or low-load-2 basis.
T-Series: Offered to investors who seek investment advice; want theoption of transacting on a front-end load, back-end load,low-load or low-load-2 basis; and who wish to receive a regular monthly cash flow from the Fund. Monthly distribu-tions may consist of net income, net realized capital gainsand/or a return of capital.
F-Series: Offered to investors, through fee-based financial advisors or dealer-sponsored “wrap accounts”, and others who pay an annual fee to their dealer instead of transactionalsales charges.
S-Series: Offered to investors who wish to receive a regular monthlycash flow from the Fund, through fee-based financialadvisors or dealer-sponsored “wrap accounts”. This seriesmay also be offered to other investors who pay an annualfee to their dealer instead of transactional sales charges.Monthly distributions may consist of net income, net realizedcapital gains, and/or a return of capital.
TD Managed ETF Portfolios
Each Fund is authorized to issue an unlimited number of units of multiple series that rank equally and are available for sale under a single simplified prospectus. The Funds offer D-Series units only.
D-Series: Offered on a no-load basis to investors who want tocomplete their transactions through TD Direct Investing, a division of TDW, or other discount brokers.
For TD Mutual Fund Trusts, TD Managed Assets Program Portfolios andTD Managed ETF Portfolios, each individual series of units is sold underdiffering purchase options and may have higher or lower managementfees based on their specific attributes, as summarized above, reflectingthe extent of the investment advice provided. The management fee rates for the Fund and its various series are provided in the Interim Fund-Specific Notes to the Financial Report.
6. Related Party Transactions
Management Fees
TD MUTUAL FUND TRUSTS
In consideration for the provision of management, distribution and port-folio management services and oversight of any portfolio sub-advisoryservices provided to the Fund, TDAM receives an annual management fee in respect of certain series of the Fund. The management fee is calculated and accrued on a daily basis for each series based on the NAVof that series of the Fund and paid monthly to TDAM. Where a Fundinvests in any underlying funds, there may be fees and expenses payableby the underlying funds in addition to those paid by the Fund. However,there is no duplication of management fees.
No management fees are charged with respect to Private Series andO-Series units. Instead, unitholders in Private Series and O-Series unitsmay be charged a fee directly by TDAM.
The maximum management fee is the maximum fee that can be charged to each series of units of the Fund according to the simplifiedprospectus. TDAM may charge a management fee that is less than themanagement fee TDAM is otherwise entitled to charge each series ofunits of the Fund. The actual management fee is the annualized fee thatwas charged to each series of the Fund for the reporting periods. TDAMmay charge the maximum management fee without notice to unitholders.Actual and maximum management fees for each series of the Fund areprovided in the Interim Fund-Specific Notes to the Financial Report.
TD MANAGED ASSETS PROGRAM PORTFOLIOS
In consideration for the provision of management, distribution andportfolio management services to the Fund, each series of the Fund pays TDAM a management fee. The management fee is a variable feedependent upon the amount of all other fees and expenses, includingapplicable goods and services tax (“GST”) and harmonized sales tax(“HST”). GST and HST are paid or payable by the Fund based on theprovince or territory of residence of the unitholders in each series of the Fund. Where a Fund invests in any underlying funds, there are feesand expenses payable by the underlying funds in addition to those paidby the Fund. However, there is no duplication of management fees.
The maximum management fee is the amount that would be necessary to reach the cap, when combined with all expenses of the Fund and itsshare of the underlying funds’ expenses. Actual management fees foreach series of the Fund are provided in the Interim Fund-Specific Notesto the Financial Report.
The management fee is calculated and accrued on a daily basis for each series based on the NAV of that series of the Fund and paidmonthly to TDAM.
nNotes to the Interim Financial Report (Unaudited)
June 30, 2017 Semi-Annual Financial Report21
TD MANAGED ETF PORTFOLIOS
In consideration of the management, distribution and portfolio manage-ment services and investment advice provided to the Fund, D-Series ofthe Fund pays TDAM a management fee. The management fee, plus applicable taxes, is calculated and accrued daily and paid monthly toTDAM. TDAM may waive all or a portion of the management fee TDAM is otherwise entitled to charge the Fund. Any waivers of managementfees may be suspended or terminated at any time without notice tounitholders. Detailed information on the management fees of the Fundare provided in the Fund-Specific Notes to the Interim-Financial Report.
The Fund Management Fee is the annualized fee that was charged to the Fund directly for the reporting period.
Where the Fund invests in other mutual funds managed by TDAM, thereare fees and expenses payable by the other funds in addition to thosepaid by the Fund. However, there is no duplication of management feespaid to TDAM or its affiliates.
Administration Fees
TD MUTUAL FUND TRUSTS
In consideration for paying certain operating expenses, TDAM is paid an annual administration fee with respect to certain series of the Fund.The administration fee includes recordkeeping and communication costs,custodial costs, certain legal fees, audit fees, regulatory filing fees andbank charges. The administration fee is calculated and accrued on a dailybasis for each series based on the NAV of the applicable series of theFund and paid monthly to TDAM. Annual administration fees for eachseries of the Fund, where applicable, are provided in the Interim Fund-Specific Notes to the Financial Report.
The administration fee is payable in respect of Investor Series, H-Series,K-Series, D-Series, Advisor Series and T-Series of the Fund, as applicable,other than the money market funds, TD Ultra Short Term Bond Fund,TD Short Term Bond Fund, TD Canadian Bond Fund, the index funds, theTarget Return Funds and Advisor Series units of TD U.S. Equity Portfolio.The administration fee is also payable in respect of Premium Series of the Fund, as applicable, other than TD U.S. Money Market Fund, TD ShortTerm Bond Fund, TD Canadian Bond Fund, TD Income AdvantagePortfolio, TD Canadian Core Plus Bond Fund, TD Corporate Bond PlusFund and the Target Return Funds.
No administration fee is charged with respect to other series of the Fund according to the simplified prospectus.
TD MANAGED ETF PORTFOLIOS
In consideration for paying certain operating expenses, TDAM is paid an annual administration fee with respect to D-Series of the Fund. Theadministration fee includes recordkeeping and communication costs,custodial costs, certain legal fees, audit fees, regulatory filing fees andbank charges. The administration fee is calculated and accrued on a dailybasis for each series based on the NAV of the applicable series of theFund and paid monthly to TDAM. Annual administration fees for eachseries of the Fund, where applicable, are provided in the Interim Fund-Specific Notes to the Financial Report.
Operating Expenses
Fund’s Independent Review Committee (“IRC”)
TDAM is responsible for management of the Fund’s investment portfolio,including the making of decisions relating to the investment of theFund’s assets.
TDAM has established an IRC in respect of the Fund and the underlyingfunds managed by TDAM. The IRC acts as an impartial and independentcommittee to review and provide recommendations or, if appropriate,approvals respecting any transactions in which TDAM may have a conflictof interest.
The IRC has approved standing instructions to permit the Fund and/or underlying funds managed by TDAM to enter into the followingsecurities transactions:
(a) trades in securities of TD or any affiliate or associate thereof;(b) investments in the securities of an issuer where TD Securities Inc.,
TDW, or any other affiliate of TDAM (a “Related Dealer”) acted as an underwriter during the distribution of such securities and the 60-day period following the completion of the distribution of the underwritten securities;
(c) purchases or sales of securities of an issuer from or to anotherinvestment fund or discretionary managed account managed byTDAM; and
(d) purchases of securities from or sales of securities to a Related Dealer,where it acted as principal.
Investments in securities of TD, interests in underlying funds managed byTDAM, or investments in any affiliates that were held by the Fund at theend of the reporting period are disclosed in the Schedule of InvestmentPortfolio and/or the Interim Fund-Specific Notes to the Financial Report.
The compensation and relevant expenses of IRC members were allocated among the investment funds managed by TDAM and disclosedon the Statements of Comprehensive Income as Independent ReviewCommittee Fees.
TD MANAGED ASSETS PROGRAM PORTFOLIOSAND TD MANAGED ETF PORTFOLIOS
All operating expenses of the Fund (including for services provided byTDAM or its affiliates) are paid for by TDAM, including costs of theFund’s IRC; recordkeeping and communication costs; custodial, legal,audit and filing fees; bank charges; borrowing costs; and all taxes.
While securities legislation requires the Fund to pay its proportionateshare of all reasonable costs and expenses associated with the IRC fromits assets, TDAM will reimburse the Fund for such costs and expenses.
nNotes to the Interim Financial Report (Unaudited)
Semi-Annual Financial ReportJune 30, 2017 22
Other Operating Expenses
TD MUTUAL FUND TRUSTS
Except in respect of Private Series of the Fund and Advisor Series ofTD U.S. Equity Portfolio, TDAM pays all of the operating expenses for theFund (including services provided by TDAM or affiliates of TDAM), otherthan expenses associated with taxes of all kinds to which a Fund is ormight be subject; borrowing; IRC and other costs relating to compliancewith any new governmental and regulatory requirements. Any new typesof governmental and regulatory expenses are disclosed as “Other TrustFund Costs” on the Statements of Comprehensive Income.
TDAM pays the operating expenses with respect to O-Series units of the Fund.
TDAM, at its discretion, may waive or absorb a portion of the operatingexpenses otherwise payable by the Fund. These waivers or absorptionsmay be terminated at any time without notice. The amount of expenseswaived or absorbed is disclosed in the Statements of ComprehensiveIncome as Waived Expenses, where applicable.
Brokerage Commissions and Soft Dollars
TD MUTUAL FUND TRUSTS
Brokerage commissions (including other transaction costs) paid onsecurities transactions and amounts paid to related parties of TD for brokerage services provided to the Fund for the periods ended June 30, where applicable, are disclosed in the Interim Fund-SpecificNotes to the Financial Report.
Client brokerage commissions are used as payment for order executionservices or research services. The portfolio advisers or TDAM may selectbrokers including its affiliates, who charge a commission in excess ofthat charged by other brokers (“soft dollars”) if they determine in goodfaith that the commission is reasonable in relation to the order executionand research services utilized.
For debt instruments traded in the over the counter markets where client brokerage commissions are not charged, soft dollars or clientbrokerage commissions are not generated. For equities or other securities where client brokerage commissions are charged, the softdollar portion of the amount paid or payable for goods and servicesother than order execution for the Fund is not generally ascertainable.Any ascertainable soft dollar value received as a percentage of totalbrokerage commissions paid under the soft dollar arrangement enteredinto by the portfolio advisers or TDAM, where applicable, is disclosed in the Interim Fund-Specific Notes to the Financial Report.
TD MANAGED ASSETS PROGRAM PORTFOLIOSAND TD MANAGED ETF PORTFOLIOS
The Fund did not incur any brokerage commissions during the periodsended June 30, 2017 and 2016 to execute transactions in the underlying funds and debt instruments, and accordingly did not receiveany investment or research services from brokers in exchange forcommissions paid by the Fund.
Certain of the underlying funds have incurred brokerage commissions, a portion of which may have been received by the underlying funds’investment advisers in the form of investment or research services (“softdollars”). Such amounts for each of the underlying funds are disclosed inthe underlying funds’ financial statements, where ascertainable.
7. Taxation
The Fund qualifies or intends to qualify as mutual fund trust under theIncome Tax Act (Canada), unless otherwise disclosed in the Fund-Specificnotes to the Interim Financial Report. All or substantially all of the netinvestment income and sufficient amounts of net capital gains realized in any period are distributed to unitholders such that no income tax ispayable by the Fund. As a result, the Fund has determined that it is insubstance not taxable and therefore does not record income taxes in the Statements of Comprehensive Income nor does it recognize anydeferred tax assets or liabilities in the Statements of Financial Position.The Fund’s capital and/or non-capital losses, where applicable, areprovided in the Interim Fund-Specific Notes to the Financial Report.Capital losses have no expiry. Non-Capital losses can be carried forwardfor up to twenty years.
The Fund currently incurs withholding taxes imposed by certain countries on investment income and capital gains. Such income andgains are recorded on a gross basis and the related withholding taxesare reported as Tax Reclaims (Withholding Taxes) on the Statements of Comprehensive Income.
8. Financial Risk Management
Financial Risk FactorsThe Fund is exposed to a variety of financial risks: market risk (includinginterest rate risk, currency risk, and other price risk), credit risk, liquidity risk and concentration risk. All investments present a risk of loss of capital.
TDAM seeks to reduce financial risks by employing and overseeingprofessional and experienced portfolio advisers that regularly monitorthe Fund’s positions, market events and diversify investment portfolioswithin the constraints of the Fund’s investment objectives, investmentstrategies and applicable TDAM policies and procedures (collectivelyreferred to as “Investment Restrictions”).
If the Fund invests in underlying funds, TDAM seeks to reduce financialrisks by diversifying investments across the three main asset classes:money market investments for safety, bonds for income and equityinvestments for growth, where applicable. Since different types of invest-ments tend to move independently from one another, positive perform-ance in one asset class can help offset negative performance in another,thereby reducing volatility and overall risk in the long-term.
The Fund is managed in accordance with its Investment Restrictions.
(a) Market Risk(i) Interest Rate Risk
Interest rate risk arises from the possibility that changes in interest rates will affect the future cash flows or the fair values of interest-bearing investments.
The Fund’s exposure to interest rate risk is concentrated in itsinvestments in debt instruments (such as bonds, debentures andmortgages) and interest rate derivative instruments, if any. Short-terminvestments, currencies and other assets and liabilities are short-term in nature and/or non-interest bearing and not subject to significantamounts of risk due to fluctuations in the prevailing levels of marketinterest rates.
nNotes to the Interim Financial Report (Unaudited)
June 30, 2017 Semi-Annual Financial Report23
If the Fund invests in underlying funds, it is exposed to indirect interestrate risk to the extent of the interest-bearing financial instruments held by the underlying funds. The Fund’s exposure to interest rate risk,where significant, is disclosed in the Interim Fund-Specific Notes to theFinancial Report.
(ii) Currency Risk
The Fund may hold assets denominated in currencies other than itsfunctional currency. The Fund is therefore exposed to currency risk, asthe value of the securities denominated in other currencies will fluctuatedue to changes in the foreign exchange rates of those currencies inrelation to the Fund’s functional currency. Where the Fund invests in anyunderlying funds, it is exposed to indirect currency risk in the event thatthe underlying funds invest in financial instruments that are denominatedin a currency other than the underlying funds’ functional currency.
The Fund may also enter into foreign exchange forward contracts forhedging purposes to reduce its foreign currency exposure or to establishexposure to foreign currencies.
The Fund’s exposure to currency risk, where significant, is disclosed inthe Interim Fund-Specific Notes to the Financial Report.
(iii) Other Price Risk
Other price risk is the risk that securities will fluctuate in value becauseof changes in market prices (other than those arising from interest rate risk or currency risk). TDAM seeks to reduce this risk through itsInvestment Restrictions.
In determining the Fund’s impact from exposure to other price risk, ahistorical beta may be used when applicable. Historical beta, a measureof the sensitivity of the Fund’s returns to market returns, is generallyderived from comparing 36 months of returns between the benchmarkand the Fund. As such, beta inherently includes effects previouslyreflected in the interest rate and currency risk disclosures. Historical betamay not be representative of future beta.
Where the Fund invests in a single underlying fund, it is exposed toindirect other price risk in the event that the underlying fund invests in equity securities that trade on a market. Where the Fund invests inseveral underlying funds, the exposure to other price risk includes allinvestments in underlying funds. The Fund’s direct exposure or indirectexposure, where applicable, is disclosed in the Fund-Specific Notes to the Interim Financial Report.
For the TD Mutual Fund Trusts, except for written options and equitiessold short, the maximum risk resulting from financial instruments is thefair value of the financial instruments as presented on the Statements of Financial Position. Possible losses from written options and equitiessold short can be unlimited.
(b) Credit RiskCredit risk is the risk that one party to a financial instrument will cause a financial loss to the other party by failing to discharge an obligation.Where applicable, the Fund’s main credit risk concentration is in debtinstruments and derivative instruments it holds. The Fund’s exposure tocredit risk is the risk that an issuer of investments or a counterparty toderivative instruments will be unable to pay amounts in full when due.All transactions in listed securities are settled or paid for upon deliveryusing approved brokers. The risk of default with a broker is consideredminimal, as delivery of securities sold is only made once the broker hasreceived payment. Payment is made on a purchase once the securitieshave been received by the broker. The trade will fail if either party fails to meet its obligation.
The Fund may also be exposed indirectly to credit risk if it invests inunderlying funds in the event that the underlying funds invest in debtinstruments and derivatives. Where applicable, detailed information isdisclosed in the Interim Fund-Specific Notes to the Financial Report.
The Fund and the underlying funds only buy and hold short-term noteswith a minimum R1- Low credit rating by DBRS or an equivalent ratingfrom another recognized credit rating agency. The credit risk from the use of counterparties for foreign exchange forward contracts is, whereapplicable, minimized by:
(i) using counterparties with a minimum credit rating of A by Standard & Poor’s (“S&P”) or an equivalent rating from anotherrecognized credit rating agency;
(ii) limiting the term of the foreign exchange forward contracts to a maximum of 365 days; and,
(iii) limiting the mark-to-market exposure to any one counterparty to 10 percent of the portfolio value.
The Fund’s investments in short term and/or debt instruments, by ratingscategories, where applicable, are disclosed in the Interim Fund-SpecificNotes to the Financial Report.
The TD Mutual Fund Trusts may also engage in securities lendingtransactions with counterparties that have a minimum credit rating of A by S&P or an equivalent rating from another credit agency. The value of cash or securities held as collateral by the Fund in connection withthese transactions is at least 102 percent of the fair value of thesecurities loaned. The collateral and loaned securities are marked tomarket on each business day. Information about the fair values ofsecurities lent and collateral held by the Fund, where applicable, isdisclosed in the Interim Fund-Specific Notes to the Financial Report.
In the TD Managed Assets Program Portfolios and TD Managed ETFPortfolios, where applicable, the portfolio adviser reviews the Fund’scredit positions as part of the investment management process.
nNotes to the Interim Financial Report (Unaudited)
Semi-Annual Financial ReportJune 30, 2017 24

(c) Liquidity RiskLiquidity risk is defined as the risk that a fund may not be able to settleor meet its obligations on time or at a reasonable price. The Fund’sexposure to this risk is concentrated in the daily cash redemptions ofredeemable units. The Fund primarily invests in securities that are tradedin active markets and can be readily disposed. In addition, the Fundretains sufficient cash and cash equivalents to maintain liquidity, and has the ability to borrow up to 5 percent of its NAV for the purpose offunding redemptions.
The contractual maturities analysis for the Fund’s financial liabilities,where applicable, is disclosed in the Interim Fund-Specific Notes to theFinancial Report.
(d) Concentration RiskConcentration risk arises as a result of the concentration of exposureswithin the same category, whether it is geographical location, producttype or industry sector. The Fund’s concentration risk is disclosed in theInterim Fund-Specific Notes to the Financial Report.
9. Capital Risk Management
Units issued and outstanding represent the capital of the Fund. The Funddoes not have any specific capital requirements on the subscription andredemption of units, other than certain minimum subscription require -ments. Changes in the Fund’s capital during the periods are reflected on the Statements of Changes in Net Assets Attributable to Holders of Redeemable Units. TDAM is responsible for managing the capital ofthe Fund in accordance with the Fund’s investment objectives and formanaging liquidity in order to meet redemption requests.
If applicable, the most recent financial statements of the underlyingfunds managed by TDAM are available, without charge, by writing to:
TD Asset Management Inc.P.O. Box 10066 Wellington Street WestTD Bank TowerToronto-Dominion CentreToronto, OntarioM5K 1G8
nNotes to the Interim Financial Report (Unaudited)
June 30, 2017 Semi-Annual Financial Report
Currency codes used throughout the report:
Currency Code Description
AUD Australian DollarBRL Brazilian RealCAD/C$ Canadian DollarCHF Swiss FrancDKK Danish KroneEUR EuroGBP British PoundHKD Hong Kong DollarILS Israeli ShekelJPY Japanese YenKRW South Korean WonMXN Mexican PesoMYR Malaysian RinggitNOK Norwegian KroneNZD New Zealand DollarSEK Swedish KronaSGD Singapore DollarTHB Thai BahtUSD United States Dollar ZAR South African Rand
25
June 30, 2017 Semi-Annual Financial Report
For Funds with references to FTSE TMX Canada indices:FTSE TMX Global Debt Capital Markets Inc © 2017 “FTSE®” is a trade mark of FTSE International Ltd and is used under licence. “TMX” is a trade mark of TSX Inc. and is used under licence. All rights in the FTSE TMX Global Debt Capital Markets Inc’s indices and/or FTSE TMX Global Debt Capital Markets Inc’s ratings vest in FTSE TMX Global Debt Capital Markets Inc and/or its licensors.Neither FTSE TMX Global Debt Capital Markets Inc nor its licensors accept any liability for any errors or omissions in such indices and/or ratings or underlying data. No further distribution of FTSE TMX Global Debt Capital Markets Inc’s data is permitted without FTSE TMX Global Debt Capital Markets Inc’s express written consent.
TD Mutual Funds, TD Pools and the TD Managed Assets Program portfolios are managed by TD Asset Management Inc., a wholly-ownedsubsidiary of The Toronto-Dominion Bank and are available through authorized dealers.
Epoch Investment Partners, Inc. (“Epoch”) is a wholly-owned subsidiary of The Toronto-Dominion Bank and an affiliate of TD AssetManagement. TD Asset Management operates in Canada through TD Asset Management, Inc. and in the U.S. through TDAM USA Inc.
All trademarks are the property of their respective owners.
® The TD logo and other trade-marks are the property of The Toronto-Dominion Bank.
26