tcrp synthesis 15 - transportation research boardonlinepubs.trb.org/onlinepubs/tcrp/tsyn15.pdf ·...
TRANSCRIPT

T R A N S I T C O O P E R A T I V E R E S E A R C H P R O G R A M
SPONSORED BY
The Federal Transit Administration
System-Specific SpareRail Vehicle Ratios
A Synthesis of Transit Practice
Transportation Research BoardNational Research Council
TCRP Synthesis 15

TCRP OVERSIGHT AND PROJECTSELECTION COMMITTEE
CHAIRMANROD J. DIRIDONInternational Institute for SurfaceTransportation Policy Study
MEMBERSSHARON D. BANKSAC TransitLEE BARNESBarwood, IncGERALD L. BLAIRIndiana County Transit AuthorityMICHAEL BOLTONCapital MetroSHIRLEY A. DELIBERONew Jersey Transit CorporationSANDRA DRAGGOOCATALOUIS J. GAMBACCINISEPTADELON HAMPTONDelon Hampton & AssociatesRICHARD R. KELLYPort Authority Trans-Hudson CorpALAN F. KIEPPERNew York City Transit AuthorityEDWARD N. KRAVITZThe Flxible CorporationPAUL LARROUSSEMadison Metro Transit SystemROBERT G. LINGWOODBC TransitGORDON J. LINTONFTAWILLIAM W. MILLARPort Authority of Allegheny CountyMIKE MOBEYIsabella County Transportation CommDON S. MONROEPierce TransitPATRICIA S. NETTLESHIPThe Nettleship Group, IncROBERT E. PAASWELLThe City College of New YorkJAMES P. REICHERTReichert Management ServicesLAWRENCE G. REUTERWMATAMICHAEL S. TOWNESPeninsula Transportation Dist CommFRANK J. WILSONNew Jersey DOTEDWARD WYTKINDAFL-CIO
EX OFFICIO MEMBERSJACK R. GILSTRAPAPTARODNEY E. SLATERFHWAFRANCIS B. FRANCOISAASHTOROBERT E. SKINNER, JRTRB
TDC EXECUTIVE DIRECTORFRANK J. CIHAKAPTA
SECRETARYROBERT J. REILLYTRB
TRANSPORTATION RESEARCH BOARD EXECUTIVE COMMITTEE 1995
OFFICERS
Chair: LILLIAN C. BORRONE, Director, Port Department, The Port Authority of New York and New JerseyVice Chair: JAMES W. VAN LOBEN SELS, Director, California Department of TransportationExecutive Director: ROBERT E. SKINNER, JR., Transportation Research Board, National Research Council
MEMBERS
EDWARD H. ARNOLD, Chairman & President, Arnold Industries, IncSHARON D. BANKS, General Manager, Alameda-Contra Costa Transit District, Oakland, CaliforniaBRIAN J. L. BERRY, Lloyd Viel Berkner Regental Professor & Chair, Bruton Center for DevelopmentStudies, University of Texas at DallasDWIGHT M. BOWER, Director, Idaho Transportation DepartmentJOHN E. BREEN, The Nasser I. Al-Rashid Chair in Civil Engineering, The University of Texas at AustinWILLIAM F. BUNDY, Director, Rhode Island Department of TransportationDAVID BURWELL, President, Rails-to-Trails ConservancyA. RAY CHAMBERLAIN, Vice President, Freight Policy, American Trucking Associations, Inc (Past Chair,1993)RAY W. CLOUGH, Nishkian Professor of Structural Engineering, Emeritus, University of California,BerkeleyJAMES C. DELONG, Director of Aviation, Denver International AirportJAMES N. DENN, Commissioner, Minnesota Department of TransportationDENNIS J. FITZGERALD, Executive Director, Capital District Transportation AuthorityJAMES A. HAGEN, Chairman & CEO, CONRAILDELON HAMPTON, Chairman & CEO, Delon Hampton & AssociatesLESTER A. HOEL, Hamilton Professor, University of Virginia, Department of Civil EngineeringDON C. KELLY, Secretary, Kentucky Transportation CabinetROBERT KOCHANOWSKI, Executive Director, Southwestern Pennsylvania Regional Planning CommissionJAMES L. LAMMIE, President & CEO, Parsons Brinckerhoff IncCHARLES P. O'LEARY, JR., Commissioner, New Hampshire Department of TransportationJUDE W. P. PATIN, Secretary, Louisiana Department of Transportation and DevelopmentCRAIG E. PHILIP, President, Ingram Barge CompanyDARREL RENSINK, Director, Iowa Department of TransportationJOSEPH M. SUSSMAN, JR East Professor and Professor of Civil and Environmental Engineering, MIT(Past Chair, 1994)MARTIN WACHS, Director, Institute of Transportation Studies, Department of Urban Planning, Universityof California, Los AngelesDAVID N. WORMLEY, Dean of Engineering, Pennsylvania State UniversityHOWARD YERUSALIM, Vice President, KCI Technologies, Inc.
MIKE ACOTT, President, National Asphalt Pavement Association (ex officio)ROY A. ALLEN, Vice President, Research and Test Department, Association of American Railroads (exofficio)ANDREW H. CARD, JR, President & CEO, American Automobile Manufacturers Association (ex officio)THOMAS J. DONOHUE, President and CEO, American Trucking Associations, Inc (ex officio)FRANCIS B. FRANCOIS, Executive Director, American Association of State Highway and TransportationOfficials (ex officio)JACK R. GILSTRAP, Executive Vice President, American Public Transit Association (ex officio)ALBERT J. HERBERGER, Maritime Administrator, U.S. Department of Transportation (ex officio)DAVID R. HINSON, Federal Aviation Administrator, U.S. Department of Transportation (ex officio)T. R. LAKSHMANAN, Director, Bureau of Transportation Statistics, U.S. Department of Transportation (exofficio)GORDON J. LINTON, Federal Transit Administrator, U.S. Department of Transportation (ex officio)RICARDO MARTINEZ, Administrator, National Highway Traffic Safety Administration (ex officio)JOLENE M. MOLITORIS, Federal Railroad Administrator, U.S. Department of Transportation (ex officio)DHARMENDRAK K. (DAVE) SHARMA, Administrator, Research & Special Programs Administration, U.S.Department of Transportation (ex officio)RODNEY E. SLATER, Federal Highway Administrator, U.S. Department of Transportation (ex officio)ARTHUR E. WILLIAMS, Chief of Engineers and Commander, U.S. Army Corps of Engineers (ex officio)
TRANSIT COOPERATIVE RESEARCH PROGRAM
Transportation Research Board Executive Committee Subcommittee for TCRPLILLIAN C. BORRONE, Port Authority of New York and New Jersey (Chair)SHARON D. BANKS, AC TransitLESTER A. HOEL, University of VirginiaGORDON J. LINTON, US. Department of TransportationROBERT E. SKINNER, JR, Transportation Research BoardJOSEPH M. SUSSMAN, Massachusetts Institute of TechnologyJAMES W. VAN LOBEN SELS, California Department of Transportation
T R A N S I T C O O P E R A T I V E R E S E A R C H P R O G R A M
Synthesis of Transit Practice 15
System-Specific Spare RailVehicle Ratios
JUDITH T. PIERCELos Angeles, California
TOPIC PANEL
ANDREW BATA, New York City Transit AuthorityRICHARD C. BERK, Port Authority Transit Corporation
JAMES A. BROWN, GO Transit (Retired)WILLIAM E. CALLIER, Metropolitan Atlanta Rapid Transit Authority
MITCHELL CAMPBELL, San Diego Trolley, Inc.GEORGE I. IZUMI, Federal Transit Administration
LEMUEL PROCTOR, Washington Metropolitan Area Transit AuthorityJAMES R. REINKNECHT, New Jersey Transit Corporation
PETER L. SHAW, Transportation Research BoardJ. WILLIAM VIGRASS, Hill International, Inc.
Transportation Research BoardNational Research Council
Research Sponsored by the Federal Transit Administration inCooperation with the Transit Development Corporation
NATIONAL ACADEMY PRESSWashington, D.C. 1995

TRANSIT COOPERATIVE RESEARCH PROGRAM
The nation's growth and the need to meet mobility,environmental, and energy objectives place demands on publictransit systems Current systems, some of which are old and in needof upgrading, must expand service area, increase service frequency,and improve efficiency to serve these demands. Research isnecessary to solve operating problems, to adapt appropriate newtechnologies from other industries, and to introduce innovations intothe transit industry. The Transit Cooperative Research Program(TCRP) serves as one of the principal means by which the transitindustry can develop innovative near-term solutions to meet demandsplaced on it
The need for TCRP was originally identified in TRB SpecialReport 213--Research for Public Transit New Directions, publishedin 1987 and based on a study sponsored by the Federal TransitAdministration (FTA). A report by the American Public TransitAssociation (APTA), Transportation 2000, also recognized the needfor local, problem-solving research. TCRP, modeled after thelongstanding and successful National Cooperative Highway ResearchProgram, undertakes research and other technical activities inresponse to the needs of transit service providers The scope of viceconfiguration, equipment, facilities, operations, human resources,maintenance, policy, and administrative practices
TCRP was established under FTA sponsorship in July 1992.Proposed by the U S Department of Transportation, TCRP wasauthorized as part of the Intermodal Surface TransportationEfficiency Act of 1991 (ISTEA) On May 13, 1992, a memorandumagreement outlining TCRP operating procedures was executed by thethree cooperating organizations: FTA, the National Academy ofSciences. acting through the Transportation Research Board (TRB),and the Transit Development Corporation, Inc (TDC), a nonprofiteducational and research organization established by APTA TDC isresponsible for forming the independent governing board, designatedas the TCRP Oversight and Project Selection (TOPS) Committee.
Research problem statements for TCRP are solicitedperiodically but may be submitted to TRB by anyone at anytime. It isthe responsibility of the TOPS Committee to formulate the tesearchprogram by identifying the highest priority projects. As part of theevaluation, the TOPS Committee defines funding levels and expectedproducts.
Once selected, each project is assigned to an expert panel,appointed by the Transportation Research Board The panels prepareproject statements (requests for proposals), select contractors, andprovide technical guidance and counsel throughout the life of theproject. The process for developing research problem statements andselecting research agencies has been used by TRB in managingcooperative research programs since 1962. As in other TRBactivities, TCRP project panels serve voluntarily withoutcompensation.
Because research cannot have the desired impact if productsfail to reach the intended audience, special emphasis is placed ondisseminating TCRP results to the intended end-users of the research.transit agencies, service providers, and suppliers TRB provides aseries of research reports, syntheses of transit practice, and othersupporting material developed by TCRP research. APTA willarrange for workshops, training aids, field visits, and other activitiesto ensure that results are implemented by urban and rural transitindustry practitioners
The TCRP provides a forum where transit agencies cancooperatively address common operational problems. TCRP resultssupport and complement other ongoing transit research and trainingprograms.
TCRP SYNTHESIS 15
Project SA-3ISSN 1073-4880ISBN 0-309-05869-4Library of Congress Catalog Card No 95-62270
Price $13.00
NOTICE
The project that is the subject of this report was a part of the TransitCooperative Research Program conducted by the TransportationResearch Board with the approval of the Governing Board of theNational Research Council Such approval reflects the GoverningBoard's judgment that the project concerned is appropriate withrespect to both the purposes and resources of the National ResearchCouncil
The members of the technical advisory panel selected tomonitor this project and to review this report were chosen forrecognized scholarly competence and with due consideration for thebalance of disciplines appropriate to the project The opinions andconclusions expressed or implied are those of the research agencythat performed the research, and while they have been accepted asappropriate by the technical panel, they are not necessarily those ofthe Transportation Research Board, the Transit DevelopmentCorporation. the National Research Council, or the Federal TransitAdministration of the U S Department of Transportation
Each report is reviewed and accepted for publication by thetechnical panel according to procedures established and monitored bythe Transportation Research Board Executive Committee and theGoverning Board of the National Research Council
Special Notice
The Transportation Research Board, the Transit DevelopmentCorporation, the National Research Council, and the Federal TransitAdministration (sponsor of the Transit Cooperative ResearchProgram) do not endorse products or manufacturers Trade ormanufacturers' names appear herein solely because they areconsidered essential to the clarity and completeness of the projectreport
Published reports of the
TRANSIT COOPERATIVE RESEARCH PROGRAM
are available from:
Transportation Research BoardNational Research Council2101 Constitution Avenue, N.W. Washington, D.C. 20418
Printed in the United States of America
PREFACE
FOREWORD
A vast storehouse of information exists on many subjects of concern to the transitindustry. This information has resulted from research and from the successfulapplication of solutions to problems by individuals or organizations. There is acontinuing need to provide a systematic means for compiling this information andmaking it available to the entire transit community in a usable format. The TransitCooperative Research Program includes a synthesis series designed to search for andsynthesize useful knowledge from all available sources and to prepare documentedreports on current practices in subject areas of concern to the transit industry.
This synthesis series reports on various practices, making specificrecommendations where appropriate but without the detailed directions usually foundin handbooks or design manuals. Nonetheless, these documents can serve similarpurposes, for each is a compendium of the best knowledge available on those measuresfound to be successful in resolving specific problems. The extent to which these reportsare useful will be tempered by the user's knowledge and experience in the particularproblem area.
This synthesis will be of interest to transit agency general managers; rail planning,operations, maintenance, and policy personnel; and Federal Transit Administrationstaff, transportation consultants and engineers; and vehicle manufacturers. Thissynthesis addreses the system-specific variables that directly impact fleet size, and thespare ratios that are maintained by individual transit agencies. From the informationobtained, it appears that most rail transit agencies closely monitor the spare vehiclesthey maintain to maximize efficiency and thereby reduce operating costs.
Administrators, engineers, and researchers are continually faced with highwayproblems on which much information exists, either in the form of reports or in terms ofundocumented experience and practice. Unfortunately, this information often isscattered and unevaluated and, as a consequence, in seeking solutions, full informationon what has been learned about a problem frequently is not assembled. Costly researchfindings may go unused, valuable experience may be overlooked, and fullconsideration may not be given to available practices for solving or alleviating theproblem. In an effort to correct this situation, the Transit Cooperative ResearchProgram (TCRP) Synthesis Project, carried out by the Transportation Research Boardas the research agency, has the objective of reporting on common transit issues andproblems, and synthesizing available information. The synthesis reports from thisendeavor constitute a TCRP publication series in which various forms of relevantinformation are assembled into single, concise documents pertaining to specificproblems or sets of closely related problems.
This report of the Transportation Research Board describes operatingenvironments at 21 selected rail transit agencies of various sizes in key geographicallocations in North America. It contains survey information about operating practices,impediments, and strategies used to appropriately size fleets within each agency'soperating context.

To develop this synthesis in a comprehensive manner and to ensure inclusion of significant knowledge, theBoard analyzed available information assembled from numerous sources, including a large number of publictransportation agencies. A topic panel of experts in the subject area was established to guide the research inorganizing and evaluating the collected data, and to review the final synthesis report.
This synthesis is an immediately useful document that records practices that were acceptable within thelimitations of the knowledge available at the time of its preparation. As the processes of advancement continue, newknowledge can be expected to be added to that now at hand.

CONTENTS
1 SUMMARY
4 CHAPTER ONE INTRODUCTIONBackground, 4Study Objectives and Methodology, 4Spare Ratio Issues, 4
12 CHAPTER TWO SPARE RATIO METHODOLOGYBackground,Formula,Selected Practices,Individualized Issues,
15 CHAPTER THREE SYSTEM-SPECIFIC VARIABLESHeavy Rail Systems,Specific Problems of Older Heavy Rail Systems,Canadian Heavy Rail Systems,Light Rail Systems,Commuter Rail Systems,
32 CHAPTER FOUR SIZING THE FLEETImpediments,Strategies,Discussion,
34 CHAPTER FIVE CONCLUSIONSCritical Variables,Conclusions of FTA Study,Discussion,
37 GLOSSARY
39 APPENDIX AQUESTIONNAIRE
43 APPENDIX B UMTA CIRCULAR C 9030.1A

TCRP COMMITTEE FOR PROJECT J-7
CHAIRJACK REILLYCapital District Transit Authority
MEMBERSGERALD BLAIRCapital District Transit AuthorityKENNETH J. DUEKERCenter for Urban StudiesALAN J. GIBBSNational Transit InstituteHENRY HIDECole Sherman & Associates, LtdMAXINE MARSHALLATE/Ryder ManagementFRANK T. MARTINMetro-Dade Transit AgencyPATRICIA McLAUGHLINLos Angeles County Metropolitan Transportation
AuthorityBEVERLY G. WARDCenter for Urban Transportation Research
TRB LIAISONPETER L. SHAWTransportation Research Board
COOPERATIVE RESEARCH PROGRAMS STAFFROBERT J. REILLY, Director, Cooperative Research ProgramsSTEPHEN J. ANDRLE, Manager, TCRPGWEN CHISHOLM SMITH, Project Manager, TCRP
TCRP SYNTHESIS STAFFSTEPHEN R. GODWIN, Director for Studies and Information ServicesSALLY D. LIFF, Manager, Synthesis StudiesDONNA L. VLASAK, Senior Program OfficerLINDA S. MASON, EditorREBECCA B. HEATON, Assistant Editor
ACKNOWLEDGMENTS
Judith T. Pierce, Los Angeles, California, wasresponsible for collection of the data and preparation ofthe report.
Valuable assistance in the preparation of thissynthesis was provided by the Topic Panel, consistingof Andrew Bata, Senior Director, Service Planning,New York City Transit Authority; Richard C. Berk,Director of Equipment Maintenance, LindenwoldMaintenance Facility, Port Authority TransitCorporation; James A. Brown, Executive Director,Operations, GO Transit, Toronto, Ontario (retired);William E. Callier, Director, Rail Transportation,Metropolitan Atlanta Rapid Transit Authority; MitchellCampbell, Superintendent of Maintenance, San DiegoTrolley, Inc.; George I. Izumi, Senior Engineer,Federal Transit Administration; Lemuel Proctor,General Superintendent, Rail Car Maintenance,Washington Metropolitan Area Transit
Authority; James R. Reinknecht, Deputy GeneralManager, Equipment, New Jersey Transit Corporation;Peter L. Shaw, Public Transportation Specialist,Transportation Research Board; and J. WilliamVigrass, Project Director, Hill International, Inc.,Willingboro, New Jersey
The Principal Investigators responsible for theconduct of the synthesis were Sally D. Liff, manager,Synthesis Studies, and Donna L. Vlasak, SeniorProgram Officer. This synthesis was edited by Linda S.Mason, assisted by Rebecca B. Heaton.
Valuable assistance to the Topic Panel and toSynthesis staff was provided by Gwen ChisholmSmith, Senior Program Officer, Transit CooperativeResearch Program.
Information on current practice was provided bymany transit agencies. Their cooperation and assistancewere most helpful.

SYSTEM-SPECIFICSPARE RAIL VEHICLE RATIOS
SUMMARY Throughout the transit industry today, rail transit officials are exploring ways toimprove fleet management, increase the quality of service, reduce operating costs, andsurvive diminishing capital and operating funds. Simultaneously, state and federalfunding agencies are closely monitoring rail systems to ensure that agencies areoperating in a cost-effective manner. A special area of focus is the number of sparevehicles rail transit systems maintain in their total active fleets. Excess spare vehiclescan impact cost and compromise fleet quality. A key to good fleet management ismaintaining "just enough" railcars to meet service requirements, with adequate sparesto sustain a good maintenance program and to provide for moderate shifts in serviceneeds.
Many factors influence the number of spare vehicles a given agency chooses toown and operate at any particular time. This synthesis explores these variables, andfindings are based on a survey of 21 heavy rail, light rail, and commuter rail systemsin the United States and Canada. The survey results revealed wide variances not onlyin the actual spare ratios reported by the transit agencies, but also in themethodologies used to calculate the ratio.
Issues that directly impact fleet size and the spare ratios maintained by individualrail systems are addressed in this synthesis. Results from the study for this synthesisdemonstrate that most rail agencies already closely monitor the number of sparevehicles they maintain to maximize efficiency and thereby reduce operating costs. InMay 1994, the Federal Transit Administration (FTA) released its own National RailSpare Ratio Study, which acknowledges some of the unique factors that determine thenumber of spare vehicles at rail properties. The FTA report confirmed that rapidtransit and commuter rail systems generally have lowered their spare ratios over thepast 7 years.
Nonetheless, there is a national dialog underway regarding improved fleetmanagement with constrained spare ratios. Also being deliberated is whether aspecific uniform numerical spare ratio would be a useful target for operating andoversight officials. Currently, there is no specific FTA guideline for a spare ratio forrail fleets because FTA recognizes that rail transit operations tend to be highlyindividualized. Even officials of rail systems with lean fleets report that any guideline,regardless of its authority, may impair their efforts to furnish quality service. Railtransit systems face a number of key issues that uniquely affect their spare ratio.Perhaps the most significant is the loss of ridership, which has reduced peak vehiclerequirements. Systems in older urban environments have been particularly affected bychanging demographics and lost ridership. With idle vehicles, the spare ratio for thesefleets has risen. Excess vehicles are not readily disposed of nor can they be transferredregularly to other properties. Differences in physical and operating environmentsusually lead to

customized and noninterchangeable rail rolling stock. Newer systems face different but equally significant problems.In retrospect, many of these systems purchased larger fleets than were required at opening to accommodateprojections of ridership growth.
Rail transit officials identified the following specific factors as having a major influence on the number of sparevehicles they must maintain to properly manage their fleets:
Factors that tend to raise the spare ratio include the following:
• Aging fleets with high maintenance downtime• Gap trains used in service but not included in peak vehicle requirement• Difficulties in disposing of surplus cars• Cost of retiring cars that have not reached the end of their useful life• Concerns that fleet reductions will compromise quality service objectives• Concerns that downsizing will impair ability to meet unexpected future demand• Hopes that current ridership declines will turn out to be temporary• Heavy overhaul and rebuild programs that take vehicles out of service• Difficulties in providing passenger amenities that take vehicles out of service for extended periods of time• Extensive use of vehicles in married pairs and multiple-unit consists.
Factors that tend to reduce the spare ratio include the following:
• Quality maintenance programs that lead to high vehicle availability• Ability to temporarily remove excess cars from total active fleet for short periods• Capability to move cars between lines in same system• Maintenance labor agreements conducive to quality improvements• Quality maintenance employees• A "lean" fleet management philosophy• Ability to lend/borrow or buy/sell vehicles from other agencies• Limited or costly storage space, particularly in city centers• Ability to procure "standard" cars that are interchangeable within a system and with other systems• Recognition that inactive cars often lead to maintenance problems• Ability to combine with other agencies in joint railcar procurements• Effective use of "options to buy" procurement strategies.
How each agency responds to any one or a combination of these factors determines both its spare ratio and themethodology used to calculate the spare ratio.
The study for this synthesis revealed that the formula used to calculate the spare ratio varies among rail systems.The differences in the manner in which the ratio is calculated are significant. Particular situations described in thissynthesis illustrate that the spare ratio used by a rail transit system is directly tied to the needs of the agency. In eachof the systems profiled, staff have developed systems that work for their agencies, providing sufficient vehicles toaccomplish their objectives for quality service. The responding agencies agreed that general standards should bedeveloped to define the spare ratio and its components, and that the process should take into account the complexand individualized issues facing rail systems.
The challenge for the transit industry today is to achieve a realistic and efficient spare ratio within the context ofdemanding operational requirements; quality service

standards; pre-existing rail fleets and routes; anticipated near-term ridership levels; demands of maintenance,overhaul, and rebuild programs; extended procurement cycles; and difficult disposal procedures. The surveyfindings for this synthesis show that spare ratios and operational and service factors related to spare ratios requirecareful thought before a consensus can be reached regarding definitions, methodology, and specific spare ratiotargets. The objective is to manage fleet size in a way that reduces life-cycle costs without diminishing servicestandards. This synthesis is the first step in addressing the complex issues raised by the use of spare ratios in fleetmanagement. There is a need to call attention to many concerns raised by the survey respondents. From the manydiscussions with respondents, it is apparent that transit professionals are eager for more information on how tomanage better with less. This synthesis may shed some early light on the subject of railcar spare ratios and help toinitiate a discussion within and among transit agencies and between operating and funding agencies.

4
CHAPTER ONE
INTRODUCTION
BACKGROUND
Today, rail transit agencies are struggling to provide adequatedaily service, to increase ridership, to manage aging fleets with fewerresources, and to control operating costs. With tightening transitbudgets, efficient fleet operation is of critical importance. A keycontributor to efficiency is an appropriate fleet size without excessspare vehicles.
In May 1994, the Federal Transit Administration (FTA)published the National Rail Spare Ratio Study, which examined thespare ratio levels of commuter and heavy rail transit systemsnationally for the 1985-1991 period. Based on data from the Section15 Annual Report, the study found that between 1986 and 1991,heavy rail agencies nationally lowered their operating spare ratiosfrom 45.6 to the 30 percent level. Commuter rail transit systemsranged from 18 to 34 percent. Overall, the larger heavy andcommuter rail agencies are operating at lower spare ratio levelsnationally. The smaller agencies are also lowering their spare ratiolevels over a 7-year period. While encouraging transit agencies tofurther adjust fleet sizes to permit more efficient maintenance andmanagement, FTA recognizes that there are sometimes valid reasonsfor high spare ratios at individual agencies. The factors cited in theFTA report, and supported in the responses to this survey, factorssuch as poor maintenance performance, overage fleets, use of gaptrains for emergency service, untimely disposal of nonactive railcars,and extended procurement cycles, often led to elevated spare ratios.
The importance of fleet size and the proper spare ratio hasbecome the subject of much debate in the industry and amongfunding agencies that are examining this critical question. Thecurrent FTA regulations do not recommend or require any specificspare ratio for rail systems. Rail transit maintenance officialsgenerally concur that a single standard spare ratio for all rail systemsis inappropriate because of the numerous unique factors discussedbelow. They are concerned that a fleet reduction program to achievea standard spare ratio, without proper flexibility, could affect federalfunding for vehicle replacement and rehabilitation programs, andcould undercut their efforts to achieve service improvements andincrease ridership. In the interim, it is vitally important that railtransit professionals monitor spare ratios to ensure that they aremaintaining and managing their fleets in the most cost-effectivemanner.
SYNTHESIS OBJECTIVES AND METHODOLOGY
The purpose of this synthesis is to identify and document thespecific operating, service, and other factors that affect rail systemspare ratios; to highlight those practices and programs in place atspecific agencies that increase fleet efficiency and decrease spareratios; and to identify the needs of fleet management in resolving theissues raised in this study.
North American transit agencies of various sizes with differentoperating characteristics were selected to report on their
individual environments. Twenty-one rail agencies in keygeographical areas responded to a questionnaire circulated for thisstudy. Follow-up telephone calls and site visits were made to clarifyissues and to identify specific variables that influenced the individualagencies' spare ratios. Seventeen of the agencies are located withinthe United States and four are in Canada. Information was reportedon 25 different mode examples, 14 rapid transit, 6 light rail, and 5commuter rail systems.
Table 1 identifies the responding agencies and providesrelevant information such as fleet size, age, and characteristics;ridership statistics; reported spare ratios; and maintenanceperformance and practices. All agency-specific data used in thissynthesis, including the reported spare ratios, were provided by therespondents for 1993 and 1994 unless otherwise indicated. Thesurvey responses revealed a significant variance in spare ratios andhow they were calculated. Some respondents included gap trains intheir calculation of peak vehicle requirement (PVR) and someexcluded railcars scheduled for programmed maintenance activities.No attempt was made to reconcile the spare ratios reported, nor is acomparative analysis of the spare ratios of the agencies included inthis discussion. The reported spare ratios are included to illustrate thedifferences in calculation and interpretation rather than as a truerepresentation of the actual spare ratios or as comparable spare ratioscalculated according to a consistent formula.
SPARE RATIO ISSUES
Ridership
Responding agencies reported several conditions that requirevehicles in excess of the agencies' PVR. Sometimes, the excessvehicles are directly tied to declining ridership, which the agenciesfully expect to regain. In these cases, the agencies believe theyshould maintain the current fleet size to accommodate the anticipatedincrease. A number of agencies reported that the excess vehicles arerequired to fund planned expansions in the near future either withnew lines or new services to meet revived or changed ridershippatterns. In these circumstances, decreasing the fleet size may notmake sense given the lead time involved in purchasing new vehicles.All of the transit agencies have initiatives designed to increaseridership and anticipate a boost from the Clean Air Act Amendmentssuch as the Employer Trip Reduction Program and otherinducements to taking mass transit. Transit agencies recognize thatridership fluctuations are dynamic and sometimes capricious and thatlong-term decisions should not be made solely on today's ridershipnumbers. New or additional vehicles cannot be bought or leasedquickly in response to sudden ridership increases. Transit systemsmust be ready to meet the needs of new customers, lest thesediscretionary riders seek alternative means of transportation.

5
TABLE 1
SPARE VEHICLE RATIOSSystem Fleet Characteristics Reported Spare Maintenance Procedures
RatioHeavy Rail Rapid Transit SystemsMTA New York Size/Consist: 5,806/10 Division A = 6% Gap in PVR: 50City Transit (MTA Annual unlinked passenger Division B = 8% Inspection cycles: every 66 daysNYCT) trips: 1,373.0 mill Excludes cars for (9,000 to 11,000 mi)Elevated and sub- PVR: 4,948 scheduled mainte- Component overhaul cycles: Airbrake valves-4way; Fleet ave. age: 20.1 yr nance yr, Trucks, HVAC, Brake valves-6 yr,23 lines Married: 70% Air compressor, battery sets-7 yr
Single: 25% Out/running repairs: 3%Consist: 5% 5-car Out/all repairs: 8%Integrated lines: No Amenities policy: No service if car is defective
Chicago Transit Size/Consist: 1,190/7 Annual 20.4% (Adds 20% Gap in PVR: 78Authority (CTA) unlinked passenger trips: for scheduled main- Inspection cycles: 90 days or 6,000 mi;Elevated and 118.0 mill tenance in spare midlife-12 yr, truck & component-6 yr,Subway; 7 lines PVR: 944 ratio calculation) life exten-25 yr;
Fleet ave. age: 10.8 yr Out/running repairs: 7.3%Married Out/all reasons: 18%Integrated: All lines Amenities policy: cars held for no heat, no a/c
Washington Size/Consist: 764/6 Annual 20% (adds 20% for Gap in PVR: 48 (4 used for revenueMetropolitan Area unlinked passenger trips: scheduled collection only)Transit Authority 149.5 mill maintenance) Inspection cycles: 5,000 mi, 30,000 and(WMATA) PVR: 588 60,000 mi;Elevated and Fleet ave. age: 10.5 yr Out/running repairs: 7.8%Subway; 5 lines Married Out/all reasons: 15.5%
Integrated: All lines Amenities policy: cars held for no lights, no a/c,
San Francisco Bay Size/Consist: 575/9 Annual 20% PVR includes Gap in PVR: 40Area Rapid Transit unlinked passenger trips: Fairlande float yard Inspection cycles: 550-600 hours;(BART) At Grade, 78.3 mil PVR: 453 plan to contract major overhaul;Elevated, and Fleet ave. age: 16 yr Single Out/running repairs: 7.8%Subway; 4 lines Integrated: 147 cars fully Amenities policy:cars held for cleanliness,
offensive graffiti, a/c
Massachusettes Bay Size/Consist: 386 Red Line: 29% Gap in PVR: 3 Red Line trainsTransportation Red Line: 196/5; Orange Line: 18% Inspection cycles:Authority (MBTA) Orange Line: 120/6; Blue Line: 25% Red Line: 7,500 miSubway, 3 lines Blue Line: 70/4 Orange Line: 8,500 mi
Annual unlinked passenger Blue Line: 8,500 mitrips: 109.8 mil Major overhaul: NoPVR: 310 Out/running repairs: Red-34%, Orange-14%,(Red: 152, Orange: 102, Blue-10%Blue:56) Out/all reasons: 10%Fleet ave. age: Amenities policy: cars held for a/c, heat,
Red:18-21 yr cleanlinessOrange: 14 yrBlue:16 yr
MarriedIntegrated: No

6
TABLE 1
SPARE VEHICLE RATIOS (Continued)System Fleet Characteristics Reported Spare Maintenance Procedures
RatioHeavy Rail Rapid Transit Systems
Southeastern Size/Consist: 342 Blue Line: 29% Gap in PVR: NoPennsylvania Blue: 217/6 Orange Line: Inspection cycles:Transportation Orange: 125/5 10.6% Blue Line: 15, 45, & 180 daysAuthority (SEPTA) Annual unlinked passenger Orange Line: 14 days & 3 mosElevated and trips: Major Overhauls:Subway, System Blue Line: 54.7 mil Blue Line: No1+1 only Orange Line: 37.8 mil Orange Line: 5 yr; major component
PVR: 10 yr & midlifeBlue Line: 168 Out/running repairs:Orange Line: 113 Blue Line: 9
Fleet ave. age: Orange Line: 0Blue Line: 34 yr Out/all reasons:Orange Line: 13 yr Blue Line: 74
Married: Blue Orange Line: 11Single: Orange Amenities policy: cars held for a/c, heat,Integrated: No cleanliness, graffiti
Port Authority Size/Consist: 342/7.5 13% Gap in PVR: 15Trans Hudson Annual unlinked passenger Inspection cycles: 90 daysCorporation (PATH) trips: 60.1 mil PVR: 297 Major overhaul:Subway, New York, Fleet ave. age: 20.8 yr Door: 5-7 yrNew York, 4 lines Single A/C: 5-7 yr
Integrated: lead & trailer cars Truck: 7-8 yrMotor: 300,000 miGear: 8 yr
Out/running repairs: 4%Out/all reasons: 14%Amenities policy: cars held for cleanliness,
a/c, & safety defects
Metropolitan Size/Consist: 240/7 37% Gap in PVR: 0Atlanta Rapid Annual unlinked passenger Inspection cycles: 60 daysTransit Authority trips: 65.5 mil PVR: 158 Major overhaul: midlife components,(MARTA) Fleet ave. age: 11.5 yr removed & replaced off-propertySubway, elevated, Married: 220 Out/running repairs: 8%at grade; 2 lines Integrated: Yes Out/all reasons: 35%
Amenities policy: cars held for a/c & heat
Metro-Dade Size/Consist: 136/6 78.9% Gap in PVR: 0(Florida) Transit Annual unlinked Inspection cycles: 45, 90,Authority passenger trips: 13.7 mil 180 days annualElevated, 1 line PVR: 76 Major overhaul: Pending
Fleet ave. age: 10 yr Out/running repairs: 16Married Out/all reasons: 42Integrated: Yes Amenities policy: cars held for cleanliness,
a/c, graffiti, torn seats

7
TABLE 1
SPARE VEHICLE RATIOS (Continued)System Fleet Characteristics Reported Spare
RatioMaintenance Procedures
Heavy Rail Rapid Transit SystemsPort AuthorityTransit Corp.(PATCO),Lindenwold,New Jersey1 line
Size/Consist: 121/6Annual unlinked passengertrips: 11.2 mil PVR: 102Fleet ave. age: 20.4 yrMarried: 79% semi-PermanentIntegrated: Yes
15.7% Gap in PVR: 0 (6 cars for relay trainnot in PVR)Inspection cycles: monthly $15,000 mi,Airbrake: 48 moMajor overhaul: midlife (15-25 yr)Out/running repairs: 1%Out/all reasons: 10%Amenities policy: cars held for allPassenger amenities
Greater ClevelandRegional TransitAuthority (GCRTA)Elevated exceptAt airport, 2 lines
Size/Consist: 60/2-3Annual unlinked passengertrips: 40 mil PVR: 30Fleet ave. age: 11 yrSingleIntegrated: Yes
41% Gap in PVR: 0Inspection cycles: Minor: 3,000 mi;Major: 5,000 miMajor overhauls: 0Out/running repairs: 5Out/all reasons: 17Amenities policy: cars held for cleanliness,torn seats, a/c & heat
Toronto TransitCommission (TTC)Inspection cycles:Standard every 15,000mi;Subway,Some at grade;2 lines
Size/Consist: 622/2-3Annual unlinked passengertrips: 260.2 millionPVR: 492Fleet ave. age: 4-32 yrMarriedIntegrated: No
15% (Excludesscheduledmaintenance inPVR)
Gap in PVR: YesSafety every 28 daysMajor overhaul: Specific component rebuildOut/running repair: 2.6%Out/all reasons: 11.6%Amenities policy: If extras available, cars heldFor cleanliness, a/c, heat, pass. assist. strips
Montreal UrbanCommunity TransitCorporation(Montreal Subway)4 lines
Size/Consist: 759/9Annual unlinked passengerTrips: 356.2 millionPVR: 565Fleet ave. age: 21.4 yrMarried: 3 cars permanentPairsIntegrated: Yes
34% Gap in PVR: YesInspect. cycles: Safety at 9000 kmMajor overhaul: completed 39 cars,Bodywork onlyOut/running repairs: 6%Out/all reasons: 17.3 %Amenities policy: No
British ColumbiaRapid Transit Co.(BC Transit)1 line
Size/Consist: 130/4Annual unlinked passengertrips: 35.7 mil PVR: 116Fleet ave. age: 7.3 yrMarriedIntegrated: Yes
11% Gap in PVR: 3%Inspect. cycles: Safety-15,000 km & 30,000 kn;Major-120,000 kmMajor overhauls: truck-7 yr; coupler-7yr;Brakes-7 yr; motors-3/4 yr (LIM)Out/running repairs: off-peak onlyOut/all reasons: 6 Amenities policy: cars held forvandalism;ride quality; truck or wheel noise

8
TABLE 1
SPARE VEHICLE RATIOS (Continued)System Fleet Characteristics Reported Spare
RatioMaintenance Procedures
Light Rail Rapid Transit SystemsMassachusetts BayTransportationAuthority(MBTA)
Size/Consist: 180/2Annual unlinked passengertrips: 60.0 mil PVR: 141Fleet ave. age: 12.6 yrSingleIntegrated: No
31% Gap in PVR: 3.5% am; 5.7% pmInspection cycles: Boeing-3,000 mi;Type 7- 5,000 miMajor Overhauls: NoOut/running repairs: 9.4 %Out/all reasons: 13.9 %Amenities policy: cars held for a/c, heat,Cleanliness, graffiti
San FranciscoMunicipal Railway(MUNI)street level, 6 lines
Size/Consist: 126/2Annual unlinked passengertrips: 40,000PVR: 101Fleet ave.age: 14 yrSingleIntegrated: No
NA Gap in PVR: 0Inspection cycles: weekly, every 6,000 mi;Signals at 6,000 miMajor overhauls: NoOut/running repairs: 10.3%Out/all reasons: 15.1%Amenities policy: none
San Diego Trolley,Inc.DedicatedRight-of-way,2 lines
Size/Consist: 71/3Annual unlinked passengertrips: 16.0PVR: 56Fleet ave. age: 4-13 yrSingleIntegrated: Yes
16.9% Gap in PVR: 0Inspection cycles: weekly, monthly, 3 months,AnnuallyMajor overhauls: 3 yrOut/running repairs: 7%Out/all reasons: 15%Amenities policy: NA
Port Authority ofAllegheny County(PA Transit)4 lines
Size/Consist: 59/1Annual linked passengertrips: 9.0 milPVR: 43Fleet ave. age: 9 yrSingleIntegrated: Yes
28% Gap in PVR: 7%Inspection cycles: Routine-5,000 mi;Lubrication-15,000 mi; Routine-30,000 miMajor overhauls: LRV-6yr;PCC-2 yrOut/running repairs: 3.4%Out/all reasons: 18.6 %Amenities policy: cars held for heat, ventilation
Greater ClevelandRegional TransitAuthority (GCRT)1 line
Size/Consist: 48/2Annual linked passengertrips: 2.7 milPVR: 24Fleet ave. age: 13 yrSingleIntegrated: No
27% Gap in PVR: No, extra cars in bad weatherInspection cycles: Minor-3,000 mi;major-5,000 miMajor overhauls: every 4 yrOut/running repairs: 5Out/all reasons: 17Amenities policy: cars held for cleanliness,torn seats, a/c, heat
Toronto TransitCommission (TTC)1 line LRV
Size/Consist: 267 LRV/1 TrolleyAnnual unlinked passengertrips: 70 mil/ 6 mil (trolley)PRV: 183Fleet ave. age: 5-43 yrSingleIntegrated: No
12% Gap in PVR: YesInspection cycles: 5,400 miMajor overhaul: Wheels, trucks - 4 yr;compressor, air dryer - 2 yrOut/running repairs: 0%Out/all reasons: 5%Amenities policy: cars held for cleanliness,torn seats, a/c, heat

9
TABLE 1
SPARE VEHICLE RATIOS (Continued)System Fleet Characteristics Reported Spare
RatioMaintenance Procedures
Commuter SystemsLong IslandRail Road(LIRR) 6 lines
Size/Consist: MU-932;DHC-177; Bi-Level-10;Parlor-12; Loc-51; PU-14total= 1,196Annual unlinked passengertrips: 92.4 milPVR: MU/E-818; DHC-134;Loc,PP- 52 total =1,004Fleet ave. age: MU-27 yr;DHC-35 yr; Loc-18 yr;PU-42Married: MU & Bi-levelsIntegrated: MU-Yes;DHC & Loc; PU & PP
12.2%(Varies by subset)
Gap in PVR: NoInspection cycles: 2B-daily; 45-day PL;92 day 91; 2 air brakeMajor overhaul: MU component life cycle2,4,6,8,10,12 yrs;Loc 6 yrOut/running repairs: 5% MUOut/all reasons: 12.2%; 18.6% dieselsAmenities policy: cars held for a/c, heat
METRA(Chicago) 6 lines
Size/Consist: Loc-130;DHC-686; MU-165total = 981/8Annual unlinked passengertrips: 72.6 milPVR: Loc-123; DHC-662;MU-145 Out/all reasons: 2.7%Fleet ave. age:Loc-11.3 yr;DHC-28 yr; MU-21 yrSingleIntegrated: MU do notintegrate w/ DHC
3.5% Gap in PVR: NoInspection cycles: Daily, 45 day, 92 day,184 annualMajor overhaul: Loc-10 yr;Cars-15 yrOut/running repairs: 0Amenities policy: cars held for a/c
New Jersey TransitCorporation(NJ Transit)13 lines
Size/Consist: Loc-80,DHC-389,MU-300 total = 769/2Annual unlinked passengertrips: 44.4 mil (excludesMetro North contractedservice)PVR: 582Fleet ave. age: Loc-15.4 yr,DHC-14.8 yr, MU-16.6 yrMarried: 135 MUIntegrated: No
19.9% (excludeslong-term out-of-service)
Gap in PVR: NoInspection cycles: FRA-45, 60, & 90 days;NNT-180 days; FRA-brake on MMEMajor overhauls:Loc-4 yr, Major-8 yr, LocRemaining-16-20 yrOut/running repairs: 4% MU/DHCOut/all reasons: 17%Amenities policy: cars held for cleanliness,Nonfunctional toilets
SoutheasternPennsylvaniaTransportationAuthority(SEPTA) 7 lines
Size/Consist: Loc-7, MU-304, PP-35 total = 346/3Annual unlinked passengertrips: 20.3 milPVR: 265Fleet ave. age: 20.2 yrMarried: 92 MU pairsIntegrated: Yes
21% Gap in PVR: 3.4%Inspection cycles: 60 & 736 days Major overhauls:Silverlines-5 yrOut/running repairs: 8.6%Out/all reasons: 22.5%Amenities policy: cars held for a/c, heat,extremely dirty, graffiti

10
TABLE 1
SPARE VEHICLE RATIOS (Continued)System Fleet Characteristics Reported Spare
RatioMaintenance Procedures
Commuter SystemsGO Transit(Toronto)
Size/Consist: 306/10Annual unlinked passengerPVR: 278 inc. 13 for serviceFleet ave. age: Loc-4 yr,DHC-9 yrSingleIntegrated: Yes
10.8% Gap in PVR: 1 spare train (10 cars)Inspection cycles: Loc-10 days, DHC7 lines trips:25.3 mil daily & bi-weeklyMajor Overhauls: 5 yrOut/running repairs: 2.9%Out/all reasons: 10.8%Amenities policy: cars held for a/c, heat,rough ride
DHC = diesel haul coachMU = multiple unit (electric) NA = not availablePP = push/pullPU = power unitPVR = peak vehicle requirement
Fleet Cost
Transit professionals at responding agencies acknowledged thatmaintaining excess vehicle inventory can be very costly because ofthe labor and materials costs associated with fleet maintenance andstorage, and can also affect the quality of fleet maintenance, therebydecreasing overall fleet reliability. However, survey respondentswere equally concerned about the problems of running with too leana fleet and the potential disruption of service. Without sufficientspares, unexpected events, bad weather, or unanticipatedmaintenance problems can greatly affect service delivery.
Maintenance Issues
Survey respondents asserted that storing vehicles in limitedyard space may also be impractical. Space often comes at a premium,particularly in urban centers. Further, downsizing maintenance staffmay not be feasible or productive given the limited flexibility to alterwork rules because of collective bargaining agreements. Unless theagency can properly maintain the vehicles and reduce labor costs,warehousing vehicles is of little or no economic value. Storedvehicles still must be maintained to ensure the viability or usabilityof the cars. Careful consideration must be given to the conditionsunder which vehicles will be stored.
Procurement Cycles
Because of the long lead time required to procure new railcars(generally 3 to 5 years from design specification to arrival of therailcar(s) on the property), many agencies want to purchase morecars than are needed immediately. In addition, to
prepare for possible increases in ridership, or unexpectedly highridership on new systems, there is a financial advantage to buyinglarge quantities. For most agencies, there is no ability to borrow carsfrom other agencies or even to move vehicles within a single agencydue to the high customization of individual rail lines.
Age of Fleet
Fleet age may have a major and dramatic impact on the spareratio, especially if the fleet has not had a mid-life overhaul. Deferredmaintenance, coupled with the absence of a major overhaul program,can lead to more frequent breakdowns and in-service failures,requiring more spares.
Intra-Agency Incompatibility
Some transit systems were built over several decades withdifferent operating physical environments within the system,precluding the interchange of railcars on different lines. When anagency cannot operate different types of equipment on other lines, adifferent number of spare vehicles is required for each subset, whichincreases the overall need for spare vehicles.
Married Pairs
If the system uses married pairs, the number of vehiclesrequired may increase because when one car fails, the otherunaffected car is often pulled from service as well. Although manycommuter rail systems uncouple married pairs at the end of the line,few rapid transit systems will do this while the train is in service.

11
Maintenance ProgramsOverhaul
Major overhaul and manufacturing programs are beneficial inextending the useful life of rail vehicles and improving vehicleavailability in the short term. However, they add to the spare vehiclerequirement. Transit systems must have sufficient replacementvehicles for cars in repair and out of service for extended periods oftime. This holds true also for an aggressive inspection program. Themore frequently cars are removed from service for inspections andscheduled maintenance, the higher the number of replacementvehicles that must be on hand. However, several rapid transit systemsdo uncouple pairs from trains at the end of a rush hour to reduce thelength of a train. Port Authority Transit Corporation (PATCO) andChicago Transit Authority (CTA) adjust train lengths before andafter each rush hour.
New versus Old Component Parts
Scheduling heavy maintenance and rehabilitation depends tosome extent on the availability of spare parts, which presents somedifficulties, given the customized nature of the equipment, foreignmarkets, and the difficulty in adapting new parts to older vehicles.This factor can extend the time a vehicle is out of service.
Overhaul versus Remanufacturing
Several agencies now overhaul component parts on a timedschedule, replacing motors, wheels, transmissions, or othercomponents on an as-needed basis or in accord with themanufacturers' recommendations to increase vehicle availability.Remanufacturing railcars includes structured restoration, takesextended time, and is often done off-property. Both overhaul andzremanufacturing programs require substantial spare vehicles.
Physical Operating Environment Including Weather Conditions
Severe winter weather affects both the reliability of service andthe wear and tear on equipment, particularly for elevated or at-gradesystems. Very cold air can cause rails to split. Elevated systems canlose brake shoes or sustain damage to motors and wheels due to snowand ice. Systems that run atgrade, operating in highway medians, aresubject to road salt and other snow-removal pollutants.
Passenger Amenities
As the transit industry tries to be more responsive to commuterneeds and attract new riders, quality of service delivery has become acritical issue. Quality control programs are a key to customer-focusedinitiatives. Most agencies have responded with stringent programs,requiring the removal from commuter service of dirty cars and thosewithout operable toilets or functioning heating and cooling systems.Passengers, particularly those who are not transit dependent, willleave mass transit if minimal quality service is not provided.Standards for such characteristics as sitting versus standing space,lighting, and space between seats must be adequate to make sure thatrail transit remains competitive with other forms of transportation.Officials from responding agencies asserted the importance of theseprograms, despite their impact on spare ratio.
Generally, many transit personnel believe that there should be astandardized reporting procedure and a formula for determining thespare ratios at each unique transit agency. Because of system-specificvariables, each agency has special concerns regarding fleetmanagement and provision of timely and quality service.Establishing realistic spare ratios would help agencies to improvefleet management and to maintain quality service in today's highlyvisible transit market.
12
CHAPTER TWO
SPARE RATIO METHODOLOGY
BACKGROUND
This chapter reviews the wide variations in methodology thateach surveyed agency employs in calculating the spare ratio. Whereappropriate, it also provides a rationale for the use of atypicalcalculations.
The data presented in this and the following chapters weresubmitted by the respondents for calendar year 1993 and, in someinstances, for early 1994. However, the basic assumptions and issuesraised by the participants remain key concerns and are still open fordiscussion and common understanding.
The spare ratios presented next were supplied by respondingagencies and are presented to frame the discussion on spare ratioissues raised by the participants during follow-up interviews. Thespare ratios presented in most cases are not comparable. To fullyillustrate the specific conditions and factors influencing the need forspare vehicles at each agency, substantial information on fleet size,peak vehicle requirement (PVR), and the various components used incalculating the spare ratio has been provided in this discussion and inTable 1 (see Chapter 1).
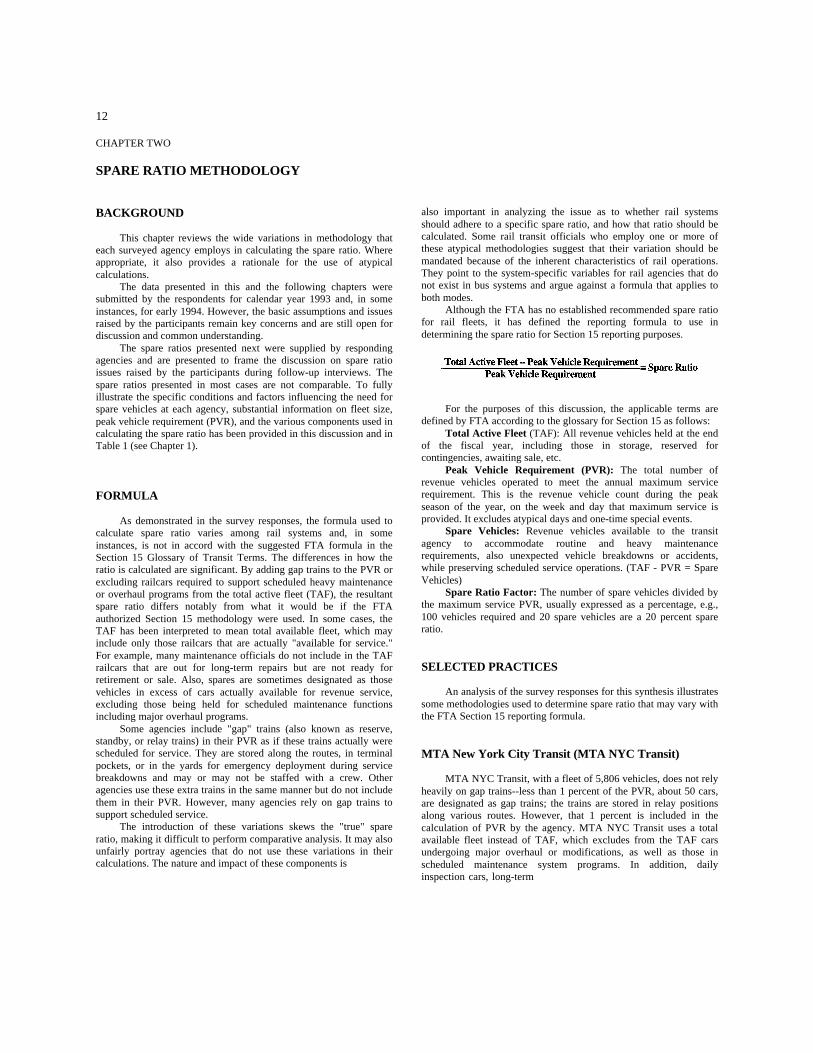
FORMULA
As demonstrated in the survey responses, the formula used tocalculate spare ratio varies among rail systems and, in someinstances, is not in accord with the suggested FTA formula in theSection 15 Glossary of Transit Terms. The differences in how theratio is calculated are significant. By adding gap trains to the PVR orexcluding railcars required to support scheduled heavy maintenanceor overhaul programs from the total active fleet (TAF), the resultantspare ratio differs notably from what it would be if the FTAauthorized Section 15 methodology were used. In some cases, theTAF has been interpreted to mean total available fleet, which mayinclude only those railcars that are actually "available for service."For example, many maintenance officials do not include in the TAFrailcars that are out for long-term repairs but are not ready forretirement or sale. Also, spares are sometimes designated as thosevehicles in excess of cars actually available for revenue service,excluding those being held for scheduled maintenance functionsincluding major overhaul programs.
Some agencies include "gap" trains (also known as reserve,standby, or relay trains) in their PVR as if these trains actually werescheduled for service. They are stored along the routes, in terminalpockets, or in the yards for emergency deployment during servicebreakdowns and may or may not be staffed with a crew. Otheragencies use these extra trains in the same manner but do not includethem in their PVR. However, many agencies rely on gap trains tosupport scheduled service.
The introduction of these variations skews the "true" spareratio, making it difficult to perform comparative analysis. It may alsounfairly portray agencies that do not use these variations in theircalculations. The nature and impact of these components is
also important in analyzing the issue as to whether rail systemsshould adhere to a specific spare ratio, and how that ratio should becalculated. Some rail transit officials who employ one or more ofthese atypical methodologies suggest that their variation should bemandated because of the inherent characteristics of rail operations.They point to the system-specific variables for rail agencies that donot exist in bus systems and argue against a formula that applies toboth modes.
Although the FTA has no established recommended spare ratiofor rail fleets, it has defined the reporting formula to use indetermining the spare ratio for Section 15 reporting purposes.
For the purposes of this discussion, the applicable terms aredefined by FTA according to the glossary for Section 15 as follows:
Total Active Fleet (TAF): All revenue vehicles held at the endof the fiscal year, including those in storage, reserved forcontingencies, awaiting sale, etc.
Peak Vehicle Requirement (PVR): The total number ofrevenue vehicles operated to meet the annual maximum servicerequirement. This is the revenue vehicle count during the peakseason of the year, on the week and day that maximum service isprovided. It excludes atypical days and one-time special events.
Spare Vehicles: Revenue vehicles available to the transitagency to accommodate routine and heavy maintenancerequirements, also unexpected vehicle breakdowns or accidents,while preserving scheduled service operations. (TAF - PVR = SpareVehicles)
Spare Ratio Factor: The number of spare vehicles divided bythe maximum service PVR, usually expressed as a percentage, e.g.,100 vehicles required and 20 spare vehicles are a 20 percent spareratio.
SELECTED PRACTICES
An analysis of the survey responses for this synthesis illustratessome methodologies used to determine spare ratio that may vary withthe FTA Section 15 reporting formula.
MTA New York City Transit (MTA NYC Transit)
MTA NYC Transit, with a fleet of 5,806 vehicles, does not relyheavily on gap trains--less than 1 percent of the PVR, about 50 cars,are designated as gap trains; the trains are stored in relay positionsalong various routes. However, that 1 percent is included in thecalculation of PVR by the agency. MTA NYC Transit uses a totalavailable fleet instead of TAF, which excludes from the TAF carsundergoing major overhaul or modifications, as well as those inscheduled maintenance system programs. In addition, dailyinspection cars, long-term

13
holds, and cars pending scrap are deducted from the TAF.Running repairs account for approximately 3 percent of the out-
of-service vehicles. The spare ratio is calculated as a percentage ofthe total available fleet. Thus, the spare ratio reported by MTA NYCTransit of 6 percent for division A and 8 percent for division B issignificantly different than it would be using the Section 15 FTAreporting formula. Nevertheless, an MTA NYC Transit maintenancefacility official asserted that this is the proper way to calculate thespare ratio because the cars are unavailable for revenue service dueto planned maintenance activities.
The reported MTA NYC Transit methodology is as follows:1. The total number of cars in the fleet minus unavailable
cars equals available fleet.2. The total required cars for revenue service are subtracted
from the available cars.3. The difference between required cars and available fleet
divided by the available fleet is the spare factor.This methodology lowers the spare ratio and permits agency
staff to ensure that there will be vehicles available for maintenancewhen necessary.
MTA NYC Transit develops two spare ratios rather than one,because its fleet is divided between two divisions and the cars are nottransferable between them. Nevertheless, the reported spare ratios forboth divisions are low.
Chicago Transit Authority (CTA)
CTA determines its spare ratio by subtracting the PVR plusterminal spares (gap trains) plus vehicles set aside for scheduledmaintenance from the TAF and divides that number by the PVR plusterminal spares (gap trains) plus vehicles set aside for scheduledmaintenance. This formula is expressed as follows:
For example, using 1993 fleet size and PVR statistics, CTAreported a TAF of 1,190 vehicles with a PVR of 866 cars. CTAmaintenance officials then add 44 out-of-service vehicles forpreventive maintenance and an additional 78 cars (approximately 11gap trains, one full consist per route per maintenance location) forgap trains, which constitute roughly 8 percent of the PVR, plus thecars included as scheduled maintenance replacements. This raisespeak requirement to 944 cars. Thus, the spare ratio is reducedsignificantly when the gap and other railcars are included in the PVRand not counted as excess vehicles.
The gap trains are stored in the yard and in terminal sparepockets to expeditiously replace cars removed from service. CTAmaintenance officials advocate the inclusion of gap trains in the PVRbecause they operate these trains 70 percent of the time. Ridership isheavy and CTA relies on gap trains to minimize inconvenience topassengers, particularly during harsh Chicago winters. There is astrong incentive at CTA to avoid extended delays in service.
New Jersey Transit Corporation (NJ Transit)
NJ Transit uses a slight variation on the standard method forcalculating its spare ratio. NJ Transit has a major overhaul programin place, but when determining its spare ratio, does not deduct thevehicles being overhauled from the total fleet, only those vehiclesawaiting long-term repairs (accidents and major repairs) that are outof service for longer than 30 days. These vehicles are subtracted fromthe TAF to arrive at the total available fleet. NJ Transit sets aside aspecific number of vehicles for "shop work," including majoroverhaul. The balance are considered spare vehicles. On average the"shop target" approximates 20 percent of the total available vehicles.
Washington Metropolitan Area Transit Authority(WMATA)
WMATA also uses a different methodology in calculating itsspare ratio. The agency reports only 706 vehicles available for dailyrevenue operations against a TAF of 764 cars. Fifty-four cars arestored and used to replace cars undergoing an extensive mid-lifeoverhaul program. The PVR of 588 cars (1993) also includes 54 cars(about 9 percent of the PVR) as gap or relay trains that WMATAregularly uses to augment service.
WMATA staff believe that it is appropriate to exclude thestored vehicles and those being rebuilt because they are not availablefor service and the overhaul program is an extensive and ongoingprogram with an anticipated completion date of 2002. Approximately280 mid-life overhauls will be done over the next two years and thebalance will be done at 70 per year until the year 2002. WMATAstated that a steady flow of vehicles is needed to support itsambitious overhaul program.
San Francisco Bay Area Rapid Transit District (BART)
BART excludes from the TAF vehicles out of service due toserious accidents, although it anticipates eventually repairing thosevehicles for service. In determining its PVR, BART includes cars forscheduled service, plus 10 cars for each of its four yards (40 cars),and extra trains for moving cars in the yards.
Port Authority Trans-Hudson Corporation (PATH), NewYork, New York
PATH, operative between northern New Jersey and Manhattan,includes 15 gap trains in its PVR. These trains are operating 50percent of the time each week. In calculating the spare ratio, PATHofficials do not exclude cars for scheduled maintenance as do someother agencies. Only a small number of PATH's vehicles undergoscheduled maintenance: three cars are out of service for overhaul onan average day. Given the inclusion of gap trains and the low numberof vehicles out of service for maintenance, PATH officials calculatea reasonably low spare ratio.

14
Port Authority Transit Corporation (PATCO),Lindenwold, New Jersey
PATCO reported that it runs with a very tight fleet. AlthoughPATCO uses extra trains to support service on average 35 to 45times per week, it does not include them in the peak PVR.PATCO'S maintenance practices seem similar to PATH's. It shouldbe noted that on an average day, PATCO has only 13 vehicles outof service for scheduled and unscheduled maintenance activities.
Toronto Transit Commission (TTC)
While Canadian agencies do not prepare Section 15 reportsand are not guided by FTA record-keeping definitions, TTCprovides a good example of an agency that has made a significanteffort toward managing its fleet while meeting its goals. TTC hasdeveloped an agency philosophy regarding the spare ratio for itsrail fleet. For its subway system, TTC indicated that it deducts thePVR from the TAF and allocates 15 percent of the remainder forscheduled maintenance. The 15 percent represents the agency'sbest estimate of the number of vehicles required for budgetedscheduled maintenance, defined as running repairs, inspections,and special project work such as major repairs. The remainingvehicles are considered surplus rather than spare vehicles, and areused to replace vehicles out
of service due to unanticipated major work circumstances, such asaccidents and/or fleetwide defects. TTC indicates that, althoughthese cars are a part of the TAF, they are used only in emergenciesas discussed above. Although there is a plan to retire some of theseextra vehicles, the agency plans to hold on to some toaccommodate special projects.
INDIVIDUALIZED ISSUES
The particular situations described above illustrate the manyinstances in which the spare ratio methodology is directly tied tothe needs of the agency. In each of the rail systems profiled,officials have developed systems that work for their agencies,providing sufficient vehicles to accomplish their overhaul andinspection requirements, while providing adequate protection toensure quality service. Responding agencies agreed that althoughgeneral standards should be developed to define the ratio and itscomponents, the process should take into account the complex andindividualized issues facing rail systems. Most respondents pointedout the differences in rail and bus service and contended thatsimilar approaches to spare ratio cannot be applied equitably. Themajor difference is that trains consist of multi-units (this demandsmore available cars and more vehicle support than buses), whichcan be replaced and/or substituted on a one-for-one basis.

15
CHAPTER THREE
SYSTEM-SPECIFIC VARIABLES
This section provides a general discussion of thosesystemspecific variables that affect spare ratios at the 21 agenciesdiscussed in this synthesis. The systems are categorized by type(heavy rail, light rail, and commuter rail). Each of these systemsoffers a different perspective on the problems facing rail agencies indeveloping overall fleet plans. For example, Metropolitan AtlantaTransit Authority (MARTA) and Metro-Dade (Florida) TransitAuthority are new systems that have never achieved the ridershipprojections predicted when the systems were built. Based on itsproposed system size and patronage projections, each agencyplanned larger systems than are currently in place, and purchasedvehicles to support the larger systems, given the long lead timebetween purchase and vehicle delivery. Although future expansionsare anticipated, the delays in building out the systems have beensignificant and have resulted in spare ratios higher than desired.Conversely, Chicago Transit Authority (CTA) typifies some of theproblems facing urban centers with aging infrastructure and largepassenger loads, but declining ridership.
As is more thoroughly discussed in the agency profiles, somecommon issues exist among systems, although variances in degree dooccur. Given their dynamic operating environments, most of therespondents stated that they require flexibility in managing sparevehicle fleets. Many operating officials stated that they need extravehicles, especially if the system runs an older fleet, must handlesevere weather conditions, or has a major overhaul program thattakes cars out of service for extended periods of time. Further, withthe advent of customer service programs that mandate trains beremoved from service to maintain quality, operating with inadequatespares can cause frequent disruptions in service. The pressure to"make service" without adequate spare cars may defer neededmaintenance, thus causing an undesirable long-term effect on thefleet.
Rail transit officials at the participating agencies stated that anyspare ratio formula must take into account the impact of married cars,and in some cases triple sets (as in the Montreal system), which cansignificantly impact car availability. With its program using 5-carconsists, MTA NYC Transit provides valuable information on thecost effectiveness of multiple integrated car consists. Althoughcommuter rail agencies and other systems such as BC Transit canand do uncouple married cars at terminal points, few rapid transitagencies can do so in peak service--with tight headways and heavypassenger loads there just is not enough time. Only a few agencieswill uncouple cars for reasons other than a major repair. Semi-permanently married cars cannot run without a mate.
There is a correlation between the number of running repairs asystem has during the peak period and the spare ratio, and this issueis discussed. However, the respondents use different standards indefining ordinary maintenance, scheduled maintenance, and runningrepairs, which makes comparisons and conclusions difficult.
HEAVY RAIL SYSTEMS
The heavy rail systems studied vary in the number of sparevehicles retained to support the peak vehicle requirement (PVR). Therespondents urged caution and flexibility regarding the methodologyand application of spare ratio calculations. They all indicated thatbecause the operational issues for each property are different, a spareratio that allows for individualized operating conditions is the mostrealistic and effective. Further, they believe that bus industryexperience should not be used as a model because the rail operatingenvironment is fundamentally different. They note that when a busfails, only one vehicle is removed from service and passengers caneither wait for the next bus or seek alternative forms oftransportation. However, when one railcar fails, the entire train, insome cases up to 10 cars, must be removed to facilitate the flow ofrail traffic backed up behind the disabled train.
The following is a discussion of the major, system-specificvariables that affect the number of spare vehicles required to operateservice at each surveyed site.
MTA New York City Transit (MTA NYC Transit)
Fleet Characteristics
MTA NYC Transit operates a fleet of 5,806 vehicles, with anoverall average age of 20.1 years, and requires 4,948 vehicles, in theaggregate, to meet daily service on all lines. Of the 4,948 peakvehicles, less than 1 percent (50 cars) are designated gap trains.
In addition, the agency operates two divisions with twodifferent fleets that cannot be interchanged between divisions. Recentdata indicate that subdivision "A" has a fleet of 2,563 cars with a 6percent spare ratio and subdivision "B" has 3,243 cars with an 8percent spare ratio. Seventy percent of the overall fleet is in marriedpairs, 25 percent are single cars, and the remaining are 5- and 3-carunits. All of the single cars are less than 7 years of age.
Operating Environment
MTA NYC Transit's operating environment makes a large fleetdifficult to manage because the fleet operates in the city, and storagespace is a key factor in limiting the number of excess spares.Officials indicate that too many cars may impact the quality of themaintenance they provide. A significant portion of the systemoperates as an elevated system and therefore experiences weather-related maintenance issues. In the winter, snow and ice poseproblems, requiring not only functioning heating systems, but alsopossible maintenance problems with motors and doors. New Yorksummers are hot and air conditioning systems must be maintained inpeak working order. Because old fleets require more maintenance,MTA NYC Transit has implemented a preventive maintenanceprogram to maximize efficiency and vehicle availability.
16
Finally, labor issues at MTA NYC Transit impact productivity.
Maintenance Practices
MTA NYC Transit officials believe that they have hadadequate spare vehicles to provide quality service while maintainingcost control. In part, they attribute their success to the reduction ofrunning repairs in recent years to an estimated 3 percent of the out-of-service vehicles. Agency officials indicate that they purposefullyreduced the fleet over the last 5 years and have worked diligently tomanage with a very tight fleet. With the introduction of scheduledmaintenance and mid-life component overhaul programs, improvedcapital investment in the barns, and the acquisition of new cars, MTANYC Transit has been able to reduce the number of out-of-servicevehicles and limit the number of spare vehicles. In addition, theagency has increased shop productivity by increasing the number ofmaintenance managers; this, in turn, has reduced the pressure on theoperating budget.
MTA NYC Transit has implemented a time-sensitive scheduledmaintenance program for component overhauls, which is designed toincrease vehicle availability while extending the life of the vehicle.This has also contributed to the reduction in the number of runningrepairs.
Conclusions
MTA NYC Transit believes that managing with a lean fleetcreates an environment in which good fleet planning and strongmaintenance programs can flourish. MTA NYC Transit sets anexample for other properties seeking to improve operation throughimproved maintenance practices.
Chicago Transit Authority (CTA)
Fleet Characteristics
In 1994, CTA operated a total fleet of 1,190 cars with anaverage age of 10.8 years, of which 866 were required for regularscheduled peak service. An additional 78 cars were included in thePVR as gap trains (8.3 percent of PVR), increasing the PVR to 944cars. CTA reported its spare factor at 20.4 percent. Although CTAhas purchased cars recently, the percentage of cars older than 25years is approximately 13 percent. The entire fleet is in married 2-carconsists. All cars can be used on any CTA lines.
Operating Environment
Officials at CTA state that their experience has shown that theycannot consistently meet schedule requirements with a 20 percentspare ratio calculated as defined by the FTA for the Section 15reporting formula. The agency cites the following operational factorsas primary reasons for the current number
of spare vehicles: customer service initiatives, weather conditions,decrease in patronage, married cars, and CTA's strong preventivemaintenance program. The CTA system is elevated or at-grade with asmall section underground in downtown Chicago. This factorrequires more spare vehicles because of the severe weatherconditions in winters.
CTA has a strong corporate philosophy to limit service delaysand to provide cars without graffiti and with functioning heating andair conditioning systems. Implementing these service initiativesrequires ready, timely substitution of vehicles. Since most of thesystem is elevated, gap trains are heavily used to avoid delays thatforce passengers to wait in the cold for service. Each of CTA's sevenroutes is provided a full spare consist. Stored along the routes interminal spare pockets or in the yards, these gap trains are used 70percent of the time. Moreover, each of the lines has its owndesignated number of spares for regular maintenance and cleaning.The heavy reliance on gap trains provides a strong argument thatthese extra trains should be included in the scheduled service.
Another determinant of spare vehicle fleet is ridership levels,which have decreased in recent years. The Green Line has beentemporarily out of service because of a major construction project.When it re-opens, however, officials anticipate a return of ridershipto former levels, or even an increase in ridership. Over the last 2years, CTA purchased 256 cars from Morrison Knudson. In light ofthe recent downturn in ridership, however, agency officials believethat they acted prudently when they did not exercise an option topurchase still more cars. This will allow them time to assess whetherthe agency needs additional cars.
Maintenance Practices
Essentially, the CTA fleet is much improved in recent years. Inan effort to increase vehicle reliability, the agency has decentralizedits maintenance operation to the carhouse connected to the line andhas discouraged transfers between routes. The agency asserts thatwhile this arrangement may require more cars, in the long run itimproves maintenance because the carhouse crews "own" theequipment and are more qualified technically in making repairs onthe fleet. The seven routes are served by 12 running maintenanceshops, so that some routes have access to and are served by morethan one maintenance facility.
The information provided indicates that on average, CTA has218 cars (18.3 percent of total fleet) out of service daily forinspections, heavy maintenance, running repairs, and the majoroverhaul program (which alone requires 12 vehicles). Provided thatfunding is available, mid-life overhauls on those cars purchased in1981 will begin soon. Because of the married cars, one failurerequires the removal of both cars from service, which has affectedcar availability.
CTA's challenging physical operating environment causes moremaintenance than at other systems. Parts of the transit system are at-grade and are ballasted in the median of an expressway. Therefore,the vehicles must contend with debris, salt, and snow on the right-of-way. Chicago's severe weather

17
conditions cause major maintenance issues on the elevated system aswell. During heavy snowstorms, for example, door and tractionmotor problems increase the need for spare vehicles.
Conclusions
CTA has a well-managed fleet and is very aware of the issuesfacing its system. Without adequate spares, it would be unable tomeet the challenges caused by the weather and its older fleet.
Washington Metropolitan Area Transit Authority(WMATA)
Fleet Characteristics
In spite of severe demands on its aging fleet, WMATA iscommitted to operating with a 20 percent spare ratio. With 764 railvehicles averaging more than 10 years old, WMATA relies heavilyon gap trains in daily service. The entire fleet consists of marriedpairs. WMATA does not count in its TAF the 50 stored vehicles thatare used to fund its ongoing overhaul program or the four vehiclesused for revenue collection purposes. WMATA plans to overhaul 70cars a year and the 50 cars are used to support that program.WMATA officials indicate that the methodology used is correctbecause without these extra cars, they would not be able to makeservice.
Operating Environment
Operating in the nation's capital, an urban environment withlines traveling to surrounding suburban communities, WMATA has amajor demand for quality transit service in the area. With heavyridership, WMATA relies on its gap trains. WMATA staff are guidedby the motto, "We don't miss trips." To maintain correct headways,reliance on gap trains has become routine; they are used daily.Finally, WMATA, like many other transit systems, does not allowcars in service that have no lights, torn seats, nonfunctioning heatingor air conditioning systems, or that are dirty--all of whichnecessitates the use of gap trains to prevent short service.
Maintenance Practices
WMATA believes that its number of spare vehicles isappropriate for other reasons as well. The entire fleet is marriedpairs. On average, 118 cars (17 percent of the TAF) are out of serviceduring the daily peak period. Eight percent are attributable to runningrepairs, primarily because of the older vehicles.
With its overhaul program of vehicles out of service forextensive overhaul periods as well as for frequent scheduledinspections, the agency's service levels would be significantlyaffected if spare vehicles were restricted.
Conclusions
WMATA believes that there should be a standardized reportingprocedure and a formula for determining the spare ratios at eachsystem. WMATA officials urge that the treatment of spares involvedin major overhaul programs should be different from spares used forday-to-day repairs only. Because of its location and heavy touristtraffic, WMATA has special concerns that timely and quality servicebe provided. Establishing realistic spare ratios helps WMATAmaintain quality service in this highly visible transit operation.
San Francisco Bay Area Rapid Transit District (BART)
Fleet Characteristics
BART has 590 single car vehicles in its TAF. For the purposeof determining its spare ratio, however, only 575 vehicles arecounted: one test car and 14 serious accident cars are deducted.BART requires 453 cars to meet peak scheduled service, whichincludes four relay or gap trains of 10-car consists--roughly one foreach yard. The gap trains are used on average 51.3 times weekly.Peak service also includes seven cars that serve as "instant failurefloaters." BART operates an aging fleet with about 74 percent (440cars) between 18 and 22 years old. The majority of the BART fleet isnot compatible and BART management claims this also has animpact on the spare ratio. The fleet consists of three types of cars--type A lead/trail cars, type B mid-consist cars, and type C fullyintegrated (147 cars). Current restructuring of the BART service planand the planned extensions may increase flexibility and permit moresubstitutions for out-of-service cars. Some type A cars may beconverted to type B, which will also increase fleet utilization anddecrease the need for additional vehicles.
Operating Environment
BART's high spare vehicle requirements are attributable to anumber of factors: an aging fleet without an ongoing overhaulprogram; assignment of specific cars to specific shops (captive fleet)with no allowance for substitution; incompatibility of cars; a strongcustomer-driven program requiring enough cars in excellentcondition to serve transit needs at all times; and finally, thelikelihood that more cars will be needed to fund expansions in thenear future. BART operates as an elevated, at-grade, andunderground system in a moderate climate without the threats anddisadvantages of severe weather.
Maintenance Practices
In spring 1994, BART did not have a major overhaul program,although historically, it had overhauled components on an as-neededbasis. Currently, the agency is preparing for a major vehiclerehabilitation program for its more than 20-year-

18
old cars. BART reports that it performs inspections on the A/B(lead/trail) cars every 550 hours or 16,115 miles, and on the C carsmid-consist every 600 hours or 17,580 miles. It reports an average ofmore than 101 cars (17.5 percent of the TAF) out of service duringpeak service daily, of which 45 are out for running repairs.
In 1990, BART set up the Captive Fleet Program, whichdivided the total fleet among the four maintenance shops to improvevehicle performance and reduce in-service breakdowns. All repairson the assigned cars are performed at the shop to which the cars areassigned; these cars are run in the same train, with no mixture of thefleet between shops. Segregating the fleet in this manner hasincreased the number of spare vehicles required, and supportsBART's decision to assign one spare train for each yard.
As part of its customer service initiative, BART removes trainsfrom service when they have offensive graffiti, severely soiledinteriors, torn seats (upholstered), or nonworking air conditioningsystems, depending on weather conditions. This program alsocontributes to an increased reliance on spares.
Conclusions
BART's nonintegrated cars make it difficult to survive with alean fleet, which consists of lead/trail cars and mid-consist cars thatcannot be integrated. BART is currently expanding its routes, whichwill increase its vehicle requirements in the near future.
BART, a 20-year old system, experienced significant growth toreach its current size. Even now, new routes are being added that willrequire more vehicles if BART maintains its current operatingstructure. Further, with the implementation of a mid-life overhaul,even more spares will be required. Adjustments for new growth andmajor programs must be a part of the overall discussion in evaluatingspare ratio issues. Finally, with the opening of planned extensions inthe near future, additional vehicles will be required. At the very least,these system-specific factors seem to argue in favor of the inclusionof on-line spares as a part of the PVR.
SPECIFIC PROBLEMS OF OLDER HEAVY RAILSYSTEMS
While operating an old fleet is not a guarantee that more sparevehicles will be required, many systems have experienced significantproblems because of aging fleets; these fleets require moremaintenance attention because of difficulties in obtaining parts and,particularly, if the cars were not welldesigned initially. The followingdiscussions of the Massachusetts Bay Transportation Authority(MBTA) and the Southeastern Pennsylvania TransportationAuthority (SEPTA)--Blue Line provide some insight into theproblems with aging fleets and the resulting impact on the number ofspare vehicles required.
Massachusetts Bay Transportation Authority (MBTA)
Fleet Characteristics
MBTA, located in the Boston metropolitan area, operates 386railcars over three routes, in the city and into the surroundingsuburban community. MBTA officials report that the Red and BlueLines operate with a more than 20 percent spare factor. In late 1994,the Red Line operated 196 cars of 1958/1968 vintage with a PVR of152 vehicles, including approximately three gap trains when therewere available cars. The agency indicated that it is currently takingdelivery of new cars and will be scrapping the oldest cars on the RedLine shortly thereafter. MBTA anticipates a total operating fleet of218 Red Line cars of which 174 will be required for peak service,leaving 44 cars as spares. The Blue Line has 70, 16-year-old cars andthe Orange Line, a relatively new line built largely to replace the oldelevated Orange Line structure, has 120 14-year-old cars. None ofthe cars on these three lines can be interchanged with each otherbecause of different loading gauges, requiring different equipment.
Operating Environment
MBTA officials report three major factors that drive the needfor spare vehicles: the large number of old cars on the Red Line (thiswill change with the acquisition of new cars); labor unrest,particularly in the maintenance back shops where heavy maintenanceis done, which results in a lack of productivity adversely affectingmaintenance activities; and the severe winter weather.
Agency officials indicated that they do not put out sufficientRed Line cars to consistently make the actual scheduled servicebecause of maintenance problems. Gap trains, when available, arerequired to support service. With the new Red Line cars, MBTAexpects improved vehicle reliability, which should reduce the needfor spare railcars on this line.
Labor issues related to MBTA's current attempts to increaseprivatization to reduce operating costs have led to labor tension,particularly in the back shops.
Finally, weather conditions in Boston are severe, with areported 97 inches of snow in 1993. Since all of the rail lines operateabove ground, snow and icy conditions significantly impact vehicleavailability and cause delays. While the Blue Line operates with areported 25 percent spare ratio, related in part to the decrease in PVRover the last 4 years, the Orange Line maintains an 18 percent spareratio.
Maintenance Practices
On average, more than 20 percent of the Red Line fleet is out ofservice during peak service, a substantial number for running repairs.MBTA says that although it performs inspections

19
more frequently on Red Line cars (at 7,500 miles), this has had alimited impact on the number of running repairs due to the age of thecars. Performance on the Blue and Orange Lines is better, withapproximately 12 percent of each fleet out of service for runningrepairs. Inspections are completed at 8,500 miles for these two lines.While there is no overhaul program in place now, new specificationsare being developed for the Blue and Orange Lines.
Conclusions
MBTA is a complicated system with three different lines thatcannot be integrated, problematic weather conditions that generatemore work, and labor/management relationships that are of someconcern. All of these factors contribute to an increased reliance onspare vehicles to maintain adequate service levels. Without thereliance on gap trains to support the Red Line, serious serviceshortfalls would greatly affect service. With the arrival of the newRed Line cars, MBTA officials were confident that operatingperformance would improve.
Southeastern Pennsylvania Transportation Authority(SEPTA)--The Blue Line
Fleet Characteristics
SEPTA operates two heavy rail lines: the Orange and the BlueLines, but the fleets are not interchangeable because of differenttypes of equipment and environment. SEPTA's Blue Line operates on5-ft, 2 1/4-in. wide gauge track, with cars about 9-ft wide by 55-ftlong. SEPTA's Orange Line operates on standard gauge track (4 ft 81/2 in.) and uses cars 10-ft wide by 67-ft, 6-in. long. The cars aretherefore not interchangeable. Each line has its own fleet and its ownmaintenance shop. The Orange Line is discussed later in this report.SEPTA's Blue Line cars have had reliability problems since theiracquisition in 1960. Their age has accentuated their unreliability. The35-year-old Blue Line cars are scheduled to be replaced in 1996 withthe acquisition of a new fleet of 110 married pairs (220 cars). Eighty-five percent of the fleet is married pairs. SEPTA indicated that thecurrent TAF for the Blue Line is 217 cars, which has been reviseddownward from the original 270 cars initially purchased. Fourteencars have been removed pending scrap. The current PVR is 168 cars,providing a spare ratio of 29 percent.
Operating Environment
The Blue Line is SEPTA's most heavily used rapid transit line;it operates largely as an elevated system with portions running as asubway in the central city area. At this time, the Blue Line needsmore spare vehicles to consistently meet service requirements.Because most of the cars are married pairs, when cars are removedfrom service for maintenance or
inspections, both cars must be pulled, further reducing caravailability. In the past, the Blue Line relied heavily on gap trains,but because of maintenance problems it has not had cars available forstand-by trains. However, when extra cars ever are available, stand-by trains are provided as required.
With a large portion of the system elevated, weather conditionshave a profound impact on service. As an example, during the winterof 1994, the Blue Line encountered frozen lines and failed tractionmotors, which resulted in long service delays. Finally, SEPTA'scorporate policy does not permit operation of trains that are dirty orhave nonfunctioning heating and fan systems (cars are not equippedwith air conditioning). This policy, combined with the fleet'smaintenance, repairs, and external operating problems, often limitscar availability, even with a 29 percent spare ratio.
Maintenance Practices
Despite frequent inspections and a major overhaul program inthe 1980s, at the time of the survey, about 34 percent of the availablecars are held from service during peak service each day. Safetyinspections are a part of the preventive maintenance program, but,because of the fleet's age, it is difficult to make service whenunexpected events arise.
Conclusions
SEPTA officials anticipate that the new cars for the Blue Linewill be available within the next couple of years. When these cars arereceived, the agency anticipates an initial ridership surge, which willrequire an increase in its peak requirement from 168 to 192 cars,including the use of two gap trains, decreasing its spare ratio to 14.5percent. With the new ridership initiatives being implemented incoming years, SEPTA expects to exercise an option to purchase morevehicles to keep up with the ridership growth. Given the difficultiesthat other transit agencies are now facing as a result of vehicle over-purchases, SEPTA management indicates that it will use due cautionbefore exercising its purchase options.
Port Authority Trans-Hudson Corporation (PATH), NewYork, New York
Fleet Characteristics
PATH operates 342 single cars of an average age of 20.8 yearscarrying 75,641 weekday passengers between northern New Jerseyand Manhattan. The TAF and the PVR of 297 vehicles (including 15gap cars) have remained stable over the last 5 years. These vehiclesare in operation 50 percent of the time each week. PATH reports itsspare ratio as 13 percent, including cars scheduled for maintenance.All lead/trailer cars in its fleet are compatible. Of the 342 carsreported, all but 96 are 22 years old or older. The majority of thevehicles were remanufactured between 1984 and 1987.

20
Operating Environment
PATH is a small interstate heavy rail system operating betweenHoboken, Newark, and Jersey City, New Jersey and lower andmidtown Manhattan in New York City. Aside from NJ Transit,PATH is the only rail system serving passengers traveling intoManhattan from New Jersey for work, and is heavily used because itis convenient. PATH travels far into Manhattan, up to 33rd Street inmidtown, and is a very popular service because passengers cantransfer to other lines in the MTA NYC Transit system. Four routescover approximately 21.1 miles, and each train has seven to eightcars each. PATH officials report that they do not experienceproblems with weather related maintenance issues as theirs is almostentirely a subway system.
Maintenance Practices
PATH is a well-run system with a very high vehicle availabilitydespite its older fleet. The fleet is subject to inspections every 90days, which include trucks/converters, doors, propulsion system,batteries, car body, air conditioning system, radio and PA system,lighting, and air systems. In addition, PATH has implemented anoverhaul cycle for components that includes doors every 5 to 7 years,air conditioning every 5 to 7 years, trucks every 7 to 8 years, tractionmotors every 300,000 miles, and gear boxes every 8 years. Onlythree cars are out of service for overhaul on an average day. Theentire fleet was remanufactured a decade ago. As a result of itsintense inspection and overhaul program, PATH only experiencesfrom 7 to 14 cars out of service daily due to running repairs at thistime, a significant decrease since 1989 when the number of dailyrunning repairs was 57.
Conclusion
Given the inclusion of gap trains and the low number ofvehicles out of service for maintenance, PATH officials calculate alow 13 percent spare ratio.
Metropolitan Atlanta Rapid Transit Authority (MARTA)
Fleet Characteristics
MARTA has 240 10-year old vehicles in operation of which158 railcars are currently required for peak service on two lines. Withits vehicle purchase in 1985-86, MARTA made a policy decision toexercise all options on the existing vehicle purchase, significantlyincreasing its spare ratio to 37 percent. At the time, MARTA wasconsidering an extension and it was more cost effective to buyadditional cars at that time. Now that the 7.1-mile extension on thenorth line is about to open in 1996, PVR will increase to 200vehicles, decreasing the spare ratio to 20 percent. With yet another2.3-mile extension expected in the year 2000, MARTA anticipates
purchasing more cars to accommodate the planned increase inridership.
Operating Environment
MARTA also indicated other operational concerns that shouldbe considered when reviewing the need for spare vehicles. Theagency's vehicles, officials claimed, have complicated electronicssystems that have reduced vehicle reliability. Further, MARTA justimplemented a mid-life overhaul program for 14-year-old cars,which will have a significant impact on the number of cars out ofservice and the need for spare vehicles. All cars will be overhauled atoutside facilities. Because of these maintenance issues and newcustomer service initiatives mandating the removal of cars fromservice for nonsafety-related passenger amenities, MARTAmaintains that it has too few excess vehicles to ensure that it canmeet service requirements.
Maintenance Practices
Despite a strong preventive maintenance program inspectingrailcars every 60 days, MARTA officials are experiencingmaintenance problems with the electronic components in the railcarsystems. An average 8 percent of the vehicles are out of service forrunning repairs daily and another 30 to 40 for heavy maintenance.Maintenance personnel anticipate implementing a major overhaulprogram to assist in addressing these issues.
Conclusions
MARTA's experience is similar to other properties withunrealized system growth plans and ridership projections. However,with the opening of the new extension, 10 years later, MARTA willbe able to operate with a reduced spare fleet.
Metro-Dade (Florida) Transit Agency (Metro-Dade)
Fleet Characteristics
Metro-Dade owns 136 rail vehicles (68 married pairs) of anaverage age of 10 years, purchased in 1984 when the system openedand which operate on one elevated line 21.5 miles long. The currentpeak vehicle requirement is 76 cars.
Operating Environment
Metro-Dade was built to cover 21 miles with an average dailyridership of 200,000. The rail fleet was purchased to accommodate a1970s ridership projection. It was based on assumptions that werereasonable at the time, i.e., increase in

21
the price of gas, employment growth, low parking rates, and a stableparking supply, but as seems to be common in the industry, theridership projections have not been achieved. Metro-Dade had leasedfour vehicles to Los Angeles (since returned) to test on its system,but there are no plans to sell or otherwise reduce the fleet because ofanticipated ridership increases associated with expansions to becompleted in the future. In addition, every 90 days, 8 to 10 marriedpairs are put into inactive storage. The agency does not want to rotatethe entire spare fleet in and out of storage because it does not haveadequate storage space and must use almost all cars for specialoccasions. For example, 120 cars are required every New Year's Dayfor the Orange Bowl parade.
In the near future, Metro-Dade plans extensions, which willincrease the PVR to 102 vehicles, reducing the spare factorsubstantially. When the extensions open, a significant ridershipincrease is expected.
Maintenance Practices
Metro-Dade uses a time-based inspection cycle, bringing carsin every 45 and 180 days for preventive maintenance inspections. Onaverage, 20 cars are held out of service for running repairs duringpeak service. In 1995, Metro-Dade will implement its first majoroverhaul program for its 10-year-old fleet.
Conclusion
Metro-Dade's experience seems to be another common industryexample where both special event needs require almost all vehiclesand of unrealized growth projections, which officials fully expect torealize when current planned expansions are completed andsignificant ridership increases are achieved.
Port Authority Transit Corporation (PATCO),Lindenwold, New Jersey (With SEPTA--Orange Line)
Fleet Characteristics
Because of their similarities, these two agencies are beingexamined together. The SEPTA Broad Street Orange Line operates125 13-year-old Kawasaki single cars from its Fern Rock terminusover 11 miles of track into South Philadelphia. With a 1993 PVR of113 vehicles, it is a heavily used subway line, carrying 26 millionpeople annually. PATCO carries 11.2 million people annually on afleet of 121 20-year-old cars, operated in 6-car consists, of which 102cars are required for peak scheduled service. A majority of the carsare married pairs and cannot be disconnected in service. The SEPTABroad Street cars are all single units, while PATCO's fleet is 21percent single cars and 79 percent married pairs.
Operating Environment
SEPTA's Broad Street Orange Line and the PATCO systemboth manage with few excess spare vehicles. SEPTA's Broad Streetreported a 10 percent spare ratio and PATCO a 15 percent spareratio. The Broad Street Orange Line is a heavily used subway linerunning from the northern part of the city of Philadelphia throughCenter City to South Philadelphia. PATCO, largely a suburban line,operates with morning and evening peak load lines--from southernNew Jersey also into Center City, Philadelphia. These two lines,roughly the same size and operating in adjacent territories, havesimilar characteristics: each operates quality service with fairly lowspare ratios and each rarely misses service.
Maintenance Practices
The reason that these fleets perform as well as they do isbecause of their strong preventive maintenance programs.
SEPTA Broad Street Orange Line--The maintenancephilosophy at the Orange Line shop centers on preventivemaintenance. The 13-year old cars have undergone intense scheduledmaintenance from the time they arrived on the property.Documentation of procedures and materials was available from theday of delivery, and the shop has had consistently good engineeringsupport all along. A plan for a formal light overhaul program wasbegun only 3 years after the cars were actually on the property. Themaintenance staff documented maintenance requirements over a 2-year period and then developed a 5-year "light overhaul program"that included a visual inspection of all parts; changes were made asrequired. Motors were cleaned out, new wheels were put on trainsthat needed them, rubber mounts were changed, heavy service wasdone on the traction motors and drive units, and cosmeticimprovements were made, such as repairing light fixtures and seats ifneeded. The cars are now halfway through a standard mid-lifeoverhaul program.
In response to the survey, Broad Street personnel indicated thatthey hold only 11 cars out of service during peak period, and noneare held for running repairs. The shop also maintains an aggressiveinspection schedule; cars are inspected every 14 days, 3 months, 2years, and 5 years, when they undergo the unit mini-overhauldiscussed above. SEPTA's policy not to run cars with nonfunctioningair conditioning, heating, or PA systems is not a problem becausethese systems are maintained routinely on this line. The maintenancestaff tracks and documents all failures so that repeat failures areidentified early and can be resolved quickly.
Port Authority Transit Corporation (PATCO)--Although it hasa different maintenance philosophy, PATCO also manages itsoperation with limited spares. PATCO does not include gap trains inits PVR, but it does use an extra train when available to assure on-time departure. If a train cannot continue in service because ofdeficient passenger amenities or failure of a safety-sensitive system,that train is removed from service.

22
Only 13 cars are held out of service on an average day, of which twoare held out for running repairs. Of its 121-car fleet, 75 of the carsare 25 years old and the balance are 13 years old.
The agency believes that performance reliability is largely afunction of car design. A major defect can adversely impact long-term performance. At PATCO, the oldest cars were built in the 1960sand were of the first generation to have automatic train operation andcontrol. These sophisticated cars have provided a high level ofperformance over the years. Problems encountered with theelectrical/mechanical devices have been virtually eliminated with anoverhaul program in which cars are rewired to accommodate some ofthe upgrades that were standard with the 1980 fleet.
The agency commented that, despite this sophistication, thecars are relatively easy to maintain, but require skilledtroubleshooters since on-board diagnostics are not employed. Tofacilitate proper maintenance, given the heavy use of the fleet duringthe peak periods, trains are reduced to two-car consists during thebase, so that the fleet does not accumulate excessive mileagerequiring more frequent inspections. The location of the maintenancefacility at a terminal has played an important part in quicklyreturning cars to service.
Although PATCO officials acknowledge that they are able tomanage with a tight fleet, they caution against too lean a spare factor,citing experience in the late 1970s before the additional 46 cars wereacquired. At that time, a great deal of maintenance was deferred.Shop facilities and maintenance manpower were under-used.Ultimately, this "make service at all costs" attitude contributed tomore problems than necessary. Each system must assess its ownneeds and unique characteristics in arriving at an appropriate andcost-efficient spare factor.
Conclusions
Both of these systems have been nurtured to operate efficientlywith low spare ratios. SEPTA's Broad Street Orange Line railcars arevery simple mechanically and have been well maintained. PATCOhas implemented a maintenance program to ensure that its railcarsperform well. Despite fiscal restraints, these systems illustrate howcreative agency staff can develop programmatic strategies to managetheir fleets well and control costs.
Greater Cleveland Regional Transit Authority (GCRTA)
Fleet Characteristics
With a total fleet of 60 heavy rail vehicles that are 11 years old,Cleveland requires only 30 vehicles to meet current peak service.These cars operate in two- or three-car consists. The system operatesabove ground except at the underground airport station. Forty of thecars are single unit, single end, and independent, and are normallyoperated as 20 coupled pairs. The balance of the fleet is individualcars. Both types can be
and are coupled in any order. GCRTA has no married pairs.
Operating Environment
Although ridership has remained steady over the last 5 years,GCRTA has undergone a major ridership decline during the previousdecade when businesses vacated the city. Most of the ridership is onthe heavy rail line and GCRTA officials do not quote a spare ratiobecause of the many excess vehicles they have. However, the agencyreports that throughout the year it does provide service for specialevents at the ballpark, allowing it to use these vehicles and recoupsome costs. Indeed, without the ability to add substantially moretrains, GCRTA would not be able to serve the special event ridership.To attract additional daily riders, GCRTA has a passenger amenitiesprogram requiring that trains be held from service for cleanliness,graffiti, torn seats, air conditioning, and heat.
Maintenance Practices
GCRTA reports 17 cars out of service daily, of which five arerunning repairs and some of these are attributable to the light railsystem. Inspections are performed at 5,000 miles and GCRTAofficials report that they do not have an overhaul program for theheavy rail vehicles at this time.
Conclusion
GCRTA officials believe that uniform definitions and formulasfor the calculation of spare ratios would provide a data base againstwhich each agency could compare and evaluate itself.
CANADIAN HEAVY RAIL SYSTEMS
Montreal Urban Community Transit Corporation
Fleet Characteristics
The Montreal system is a rapid transit line with a fleet of 759vehicles permanently married consisting of three-car consists ingroups of three, six, and nine cars and a reported PVR of 565 carsoperating on four routes. Approximately 55 percent of the fleet is 17years of age and the remaining cars are 27 years of age. Inresponding to the survey, Montreal did not provide a spare ratio.Although the data indicate that Montreal has many spare vehicles, areview of the agency's operating environment suggests that theagency has little cushion to make service due to heavy maintenancerequirements. Like other transit agencies, Montreal sets aside extra"reserve" trains on two of the lines to augment peak service. Stored atthe end of the lines, these two trains are not counted in the peakservice requirement.
The three-car units are not separated except in extraordinary

23
circumstances as the cars share major component systems. Althoughthe cars can technically run on all lines, there are some commercialconstraints. For example, Montreal has a special project in place onone line to install Telecite, special equipment for public advertising.Due to this special signage, Montreal does not run the older railcarson that line.
Operating Environment
Montreal's system serves both commuters and a large touristpopulation; this leads to ridership fluctuations. Every attempt is madeto complete maintenance on all three cars of a consistsimultaneously. However, this is not always possible. When one carfails, the entire three-car group must be removed from service. Giventhis significant maintenance issue, the current spare vehicles do notprovide an adequate cushion for the operation.
Maintenance Practices
Agency staff report that they can run with few spare vehicles inpart because of their well-developed maintenance practices. All carsare inspected every 9000 km (approximately 6,000 mi). Other thanthe body overhaul discussed above, Montreal does not have amechanical mid-life overhaul program, although major heavymaintenance repairs are performed regularly. Montreal officialsreported that in 1993, on average, they held 147 cars from serviceduring daily peak service as follows:
Inspections 33Heavy Maintenance 12Running Repairs 48Vehicle Overhaul (body work only) 39Quality Control 15
Although the major body overhaul program is now complete,the agency reports that the program took more than 2 years tocomplete during which time each car was out of service for morethan 10 weeks. However, as soon as the program was completed, theagency increased service on one of its lines, further increasing theneed for vehicles.
Montreal has two classes of cars: the first class consists of 336cars, which are 27 years old and dedicated to one line. These cars aremaintained at one facility, the Beaugrand shop. Montreal officialsbelieve that this helps their maintenance program because allpersonnel assigned to the shop are highly conversant with andtechnically qualified on that particular fleet. The second class of carsis maintained at the Youville shop.
Conclusion
The Montreal experience illustrates the impact of operatingmulti-car units on daily vehicle availability. These three-car
units have adversely affected this system's ability to operate withlimited spares. Even if a defect is limited to only one car, the impacton the overall fleet is significant. Despite its enhanced maintenanceprogram, Montreal requires a large number of vehicles to support itsoperation.
Toronto Transit Commission (TTC)
Fleet Characteristics
TTC responded for its Rapid Transit division, subway, and lightrail or street car lines. The rapid transit line is the newest line anduses intermediate capacity cars with a linear induction motor systemsimilar to BC Transit in Vancouver; these cars cannot be integratedwith the other systems. For the purposes of discussion, theinformation provided in this section will be limited to the subwaysystem to illustrate how TTC quantifies and allocates its vehicles.
TTC operates a fleet of 622 married pair subway vehicles. Theagency reported that it does not uncouple these cars unless majorrepairs are required. The TAF has varied little in recent years, but thePVR has declined significantly since the 1989 high of 775 vehicles.In 1993, 492 vehicles were required for peak service, of which twopercent were gap trains. TTC reports that the 622 subway vehiclesrange in age from 4 to 32 years of age, and that the agency's spareratio is 15 percent.
Operating Environment
Although the data show that the TTC has 130 spare vehicles (a26 percent spare ratio if calculated using the FTA formula), TTCofficials indicate that this is not really the case. TTC states that itoperates with a 15 percent spare ratio. Maintenance staff estimatethat 93 cars are used to replace cars in budgeted and scheduledmaintenance, as well as those in running repairs. The balance,designated as "surplus" cars, are scheduled to be retired. Thesesurplus cars are also used to support unanticipated major work, suchas major accidents and fleetwide defects. The agency contends thatthese older cars should not be regarded as typical spare vehiclesbecause they are not put in service except in extraordinarycircumstances. For example, some of these cars are now being usedto support a program installing a door warning system for thevisually impaired.
External conditions are an important factor in TTC's operatingprogram. Like other northern systems, Toronto experiences harshweather conditions, aggravated by the fact that its cars must operateat-grade as well as underground, and most cars are stored outside. Inaddition, there are several grades and curvatures on the lines thatcreate substantial wear and tear on the cars.
Maintenance Practices
In spite of the adverse conditions, TTC is able to maintain a

24
relatively low spare ratio; the vehicle maintenance spare ratio iscalculated by the agency, based on previous experience, on a recentlyadopted maintenance philosophy, and on an "opportunisticmaintenance" program currently being put into practice.Opportunistic maintenance entails remanufacturing and changingcomponents before failure occurs. While TTC still maintains arigorous inspection program (every 15,000 miles) and carries outspecial project work, it is trying to limit running repairs and in-service failures. During peak service, the agency reports an averageof 18 cars out of service for maintenance and an average of 50 to 60running repairs daily for the fleet.
TTC has abandoned its mid-life overhaul program. Withimplementation of the new component replace/repair program, thesystem is experiencing increased vehicle availability as well asextended vehicle life. TTC is in the process of establishing life cyclesfor various components through data accumulated from maintenanceexperience. Various components such as air brakes, powerconnectors, air conditioning systems and compressors, controlequipment, and motors will be taken out and remanufactured. Whena car is brought in for inspection or other any reason, all other itemsare inspected and repaired if necessary. TTC has moved from a"look, see, and repair" philosophy to "change all units before theyfail." These new maintenance procedures have an added benefit ofincreasing productivity as well.
While TTC officials report that they will remove trains fromservice for nonsafety related passenger amenities, they will do soonly if substitute cars are available. They indicated that their numberone commitment is to service and that passenger amenities do notwarrant interrupting service.
Conclusions
TTC operates a well-run fleet without reliance on excessivespare vehicles. Although the number of spare vehicles appears to besignificant, it actually represents good fleet planning especially if theagency does not rely on the old vehicles. A specific number of carsfor maintenance seems to be a good idea if the system does not usethe stored vehicles to supplement routine or light maintenance.
British Columbia Rapid Transit Co. (BC Transit)
Fleet Characteristics
Established in 1986, BC Transit, a subsidiary of the BritishColumbia Transport Co., describes itself as an advanced light rapidtransit system. BC Transit operates both underground and as anelevated system. With a fleet of 130 fully automated vehicles with anaverage age of 7.3 years, the fleet operates without an on-board crew.The entire operation is managed from a control center housed at thecentral facility located midline, which also contains officeheadquarters and the maintenance shop and yard. BC Transit reportsthat in 1993, it required 116 cars for peak service (including one gaptrain),
but scheduled service increased to 120 cars with the opening of anexpansion in April 1994. Although 20 additional cars are on order,the system presently operates with only 10 spare cars. However, theagency reports that it makes service 99.6 percent of the time.
Operating Environment
Several key factors allow this system to operate as it does withsuch a limited spare ratio. First, it is a very young system with state-of-the-art equipment and the weather is mild year-round. Most of thecars are only 8 years old, with the last 16 being purchased just 3years ago. In addition to these clear advantages, BC Transit has astrong maintenance program. BC Transit does not face some of theproblems noted for other systems. Although the agency operatesfour-car trains consisting of two married pairs, cars can be uncoupledfrom the control center in a matter of minutes. And although cars inservice are seldom uncoupled, this operating ability gives the agencya significant advantage when unserviceable cars need to be removed.
Maintenance Practices
Only six cars are held from service for daily inspections. Every10,000 miles, heavy maintenance is performed on the cars. Allrunning repairs are performed off-peak and are completed prior to thenext peak period. Although the fleet is very young, the maintenancepersonnel report that they perform overhauls on the majorsubsystems every 7 years, and replace brakes every year and motorsevery 3 to 4 years.
Conclusions
BC Transit operates with a very lean spare ratio. The agencydemonstrates the quality of service that can be provided when all thecircumstances are working in a system's favor.
LIGHT RAIL SYSTEMS
Light rail vehicle (LRV) systems experience different problemsfrom heavy rail and commuter systems. Most must contend withstreet traffic, pedestrians, traffic signals, and cars causing accidentsby coming too close to the trains. Yet they have been a part of theAmerican scenery over the last century. Because of the need toconserve capital dollars, many agencies are revitalizing older lightrail systems while others are building light rail systems instead ofmore expensive subway operations.
Weather and street conditions, such as potholes and sinkingstreets, may impact service operations as with other at-grade systems.The following profiles illustrate the system-specific variables thatimpact light rail systems generally.

25
Massachusetts Bay Transportation Authority (MBTA)
Fleet Characteristics
MBTA operates a 32.4-mile light rail line as an integral part ofits rail operating system in the metropolitan Boston area with 180light rail single cars of an average age of 12.6 years. MBTA officialsindicate that they operate two types of cars that cannot be integrated.This LRV system operates two-car consists in peak service and onSaturdays due to heavy riding. Of the 180 cars in the TAF, only 141cars are required for peak service, which has increased in recentyears because of heavy ridership. Management also reports that ituses gap trains to support service, with 3.5 percent of the PVR usedin the morning and 5.7 percent of the PVR (a total of eight railcars)used in the afternoon. The agency reports a 31 percent spare ratio.
Operating Environment
The four lines constituting the light rail system operate on thestreet, at grade crossings, and on a dedicated right-of-way. Only oneline operates solely on a dedicated right-of-way; two lines operate atgrade crossings with some automobile integration at the terminals;and the remaining lines operate down the middle of the street. Thoselines operating in the street or at grade crossings must stop for trafficsignals to allow traffic to pass and as a result, incur delays whentraffic is heavy.
Like other northeastern cities, Boston has major problems withits severe winter weather, which can occasionally impact service.Management acknowledges that it operates with a high spare ratio,but indicates that it requires many spare vehicles because the nearly20-year old Boeing fleet has high maintenance needs and alsobecause the street operation of its fleet generates maintenance due tominor accidents with automobiles. Ridership on the light rail systemhas increased recently on lines that serve civic and fine artsinstitutions, Fenway Park, and various universities and hospitals.
Maintenance Practices
MBTA management officials report that operating a fleet inwhich more than one-half of the vehicles are 20 years old requiresextensive maintenance. While the agency plans to retire portions ofthe fleet in 1999 with the acquisition of 100 low-floor vehicles, itmust support these old vehicles to ensure availability of service untilthen. On average, MBTA reported 17 cars (9.4 percent of the TAF)out of service daily for running repairs. Roadcalls also impact vehicleavailability--the agency reports a 2,622-mile mean distance betweenfailures, which is a significant improvement over the last 5 yearswhen that figure was reported to be 1,574 miles. Inspections areperformed every 3,000 miles on the fleet and every 5,000 miles onthe remaining cars. Currently, there is no overhaul program in placebut the agency reports that it is seeking authorization to overhaulspecific cars.
Conclusions
The light rail system is an integral part of the Bostonmultimodal system. Management indicates that the spare ratio mustaccommodate the fluctuations in ridership that this systemencounters.
San Francisco Municipal Railway (MUNI)
Fleet Characteristics
MUNI operates 14-year-old Boeing Vertol single car LRVs,generally in two-car consists, within the City of San Francisco. Ofthe 126 vehicles, 101 are required for peak vehicle service. The TAFand PVR have remained relatively constant over the last 5 years. Theagency did not provide a spare ratio and indicated that for the last 18months, it has had difficulty in meeting peak demand due to poorperformance and current maintenance practices. A small fleet of newcars is being acquired, which should reduce MUNI's dependency onthe Boeing LRVs.
Operating Environment
This light rail system operates over the hilly terrain of SanFrancisco and carries both commuters and tourists. Even with mildweather, MUNI officials report that they cannot meet servicerequirements. The hills of San Francisco generate a great deal ofmaintenance work for the fleet.
Maintenance Practices
On average, 19 railcars are out of service daily, of which 13 arefor running repairs, three for parts not available, and one for vehicleoverhaul. Maintenance personnel inspect vehicles every 7 days and,therefore, every 6,000 miles; cab signals are inspected every 6,000miles. Nonetheless, vehicle reliability continues to be inadequate,generating excessive roadcalls.
Conclusions
San Francisco has many maintenance problems related to itsLRVs in operation. However, MUNI officials stated that a commonspare ratio for light rail transit systems might be appropriate,provided that it is based on peak demand and overall fleetmaintainability and reliability.
San Diego Trolley, Inc.
Fleet Characteristics
San Diego Trolley, Inc., located in Southern California,operates a fleet of 71 light railcars, ranging in age from 4 to 13

26
years, while 56 are required for peak service. All the vehicles aresingle units made by SIEMENS Duewag and are generally run inthree-car consists. The agency reported a 16.9 percent spare ratio anddoes not include gap trains in the PVR. However, maintenancepersonnel indicate that three cars are kept available for spares.
Operating Environment
A small system, San Diego Trolley reports that its ridership hasdecreased over the last 18 months, continuing a pattern of declineover the past 5 years, primarily as a result of the loss of employmentthat has plagued Southern California in recent years. But, unlikeother systems, the agency reports heavy Sunday riding, which isrelated to tourist ridership on the southern line that travels to Mexico.
San Diego anticipates opening three new extensions before theend of the decade. The current TAF is 71 cars, and the agency begantaking delivery of an additional 30 cars in 1995 and will add 22 morecars to support these expansions, later.
Management acknowledges that there will be extra cars untilthe expansions are opened and is considering rotating the fleet in andout of storage to reduce its spare ratio. Cars are held from service fornonfunctioning air conditioning systems, but this policy does notimpact the number of spare vehicles required.
Maintenance Practices
With a relatively young fleet and mild weather, the expectationis that the system would be well run. San Diego maintenanceofficials stated that they permit 11 railcars out of service formaintenance issues daily. Of the 11, five are out for running repairs,two for heavy maintenance, and two for overhaul. Currently, thisagency went to time-based inspection cycles and regularly inspectsvehicles 7 days a week, on a frequent basis (i.e., daily to monthly). Inaddition, San Diego reports an overhaul program every 3 years wheredefective components are replaced.
Conclusions
San Diego believes that a 16.9 percent spare ratio is satisfactoryfor its system but acknowledges that other transit agencies mayrequire more spares. Management believes that more analysis of theissues would be desirable.
Port Authority of Allegheny County (PA Transit)
Fleet Characteristics
PA Transit operates 59 single cars in a three-line light railsystem in Pittsburgh, Pennsylvania over 29.3 miles. Originally, PATransit operated a fourth line, which has been
closed for rehabilitation, and retired the cars from on-line service,reducing the fleet from 71 to 59 vehicles. Four of the 59 cars are 47years old and the remaining 55 are 9 years old. When the line isreopened in 1997, new vehicles will be procured. Peak servicerequires 43 railcars; three gap trains are included in the PVR. Theagency reports a 28 percent spare ratio, which it has determined bytallying those vehicles it requires for special needs. PA Transitofficials indicate that the agency allows 8.4 percent of its vehicles foroverhaul, 6.7 percent for maintenance inspection, and counts theremaining 12 percent as spares.
Operating Environment
Pittsburgh is a large urban center that relies on the light railsystem to transport workers to the central business area. PA Transitoperates in severe weather and therefore experiences weather relatedproblems with its fleet. In addition, PA Transit reports majormaintenance problems with the fleet. A design problem with thegearbox and propulsion system has led to a high percentage ofvehicles being held from service and now requires a fleetwidemodification. Until all modifications are completed, all availablespares are needed to support service.
Conclusions
PA Transit illustrates some of the issues that arise withfluctuations in the PVR and its impact on the need for spare vehicles.PA Transit retired part of the fleet because a line was closed forrehabilitation, nevertheless, it was unable to reduce its fleet sizesubstantially because of service defects with its younger fleet. Tooperate without a sufficient cushion was not prudent because a highpercentage of the vehicles were out of service regularly for apassenger amenity program that checked cars for heat and airconditioning. Coupled with often severe weather conditions in thePittsburgh area, fewer spare cars may well have affected the ability tomake service regularly.
Management agrees there is a need to address the maintenanceissue, but because of the overall car design (gearbox) problem, acomplete reconstruction may not be possible. Thus, a flexible spareratio may always be required to ensure high quality service.
Greater Cleveland Regional Transit Authority (GCRTA)
Fleet Characteristics
GCRTA operates a light rail line, covering 26.7 miles with 48double-ended light rail vehicles that are 14 years old. During peakservice, Cleveland uses two-car consists, which are reduced to onlyone car in nonpeak hours. The trolley system has a dedicated right-of-way, but must stop at crossings for automobiles. Of the 48 cars inthe TAF, only 24 are required for peak service.

27
Operating Environment
GCRTA officials indicate that this light rail system hasexperienced significant ridership reductions over the last 15 years. In1980, when the original vehicles were purchased, Shaker Heights, thecommunity in which this system operates, required Cleveland topurchase 4,000 seats, equivalent to 48 cars. However, over the lastdecade, with the relocation of major businesses to the suburbs, theridership has significantly declined. In 1993, the PVR of 24 LRVcars had further decreased from a high of 30 vehicles in 1991. Inaddition, a planned extension was significantly delayed, but it is nowscheduled to open in July 1996. This extension will require anadditional 6 to 8 cars for scheduled service.
GCRTA's LRV system operates on a dedicated right-of-way, allabove ground. Like other LRV systems in the north, GCRTA doesexperience severe weather that impacts service to allow for snow andice removal and to repair its catenary. GCRTA staff also indicate thatthey need the spare vehicles to support high peaks associated withspecial events at the ball field, which require additional vehiclesabout 100 days per year. The agency must use all available cars toprovide for the heavy ridership to those special events. Because ofthis unique requirement, it does not warehouse vehicles, but usesthem on a regular basis. GCRTA also reports that the corporatepolicy requires removal of cars from service for nonsafety relatedpassenger amenity defects.
Maintenance Practices
GCRTA reports some maintenance problems that affect thenumber of cars required to manage its fleet. The agency is currentlyexperiencing problems with the LRV Chopper ventilation system andis undergoing a fleet retrofit for the gearbox. These issues havecontributed to increased roadcalls and maintenance requirements, asreflected in the mean distance between failures rate of 1,533.7 miles.GCRTA maintenance personnel report a strong preventivemaintenance program with minor inspections completed every 30days/3,000 miles and a major inspection completed every 35days/5,000 miles. In addition, the light rail vehicles are currentlyundergoing an overhaul, which is done every 4 years.
Conclusions
GCRTA's experience illustrates how changing economic anddemographic conditions can radically affect vehicle requirements. Inthis case, the vehicles were purchased in response to a definitiveneed. The need was reduced when the entire business and economicclimate changed, which resulted in excess vehicles. However,GCRTA has found an alternative use for the vehicles with theextensive use of the fleet to support special events at the ball field;this has offset some of the operating costs incurred through managingan excess spare vehicle fleet.
Toronto Transit Commission (TTC)
Fleet Characteristics
Included in its integrated bus/rail operations, TTC also operatesa 125.4-mile light rail system in the greater Toronto area. Thissystem consists of 267 light rail vehicles (street cars) operated asindividual cars throughout the streets of Toronto. Of the 267 LRVs,183 are required for peak service. The TTC management teamreports that the spare ratio for its fleet is 12 percent. However, 15percent of the vehicles are set aside for scheduled maintenance andare not counted as spares.
Operating Environment
Toronto has mild summers and severe winters with snow andice on the streets, which increases maintenance requirements. Streetcars are usually full and stop at every corner. The agency states thatthe spare ratio is influenced by its policy not to send out dirtyvehicles, or those that have torn seats and nonworking airconditioning or heating systems.
Maintenance Practices
Despite the age of the fleet and Toronto's weather, TTC's LRVshave a good performance record. TTC officials do not report anyvehicles held from service during peak service. The inspection cycleis frequent with routine and safety inspections performed every 5,400miles. The overhaul program requires rehabilitation of majorcomponents, such as wheels, trucks, traction motors, and electronicassemblies every 4 years. Compressors and air dryers are overhauledevery 2 years. Finally, all LRV car bodies are overhauled and paintedevery 10 years.
Conclusion
TTC management believes that uniform definitions andformulas for the calculation of spare ratios would provide a data baseagainst which each agency could compare and evaluate its operation.
COMMUTER RAIL SYSTEMS
There is a growing reliance on commuter rail services in theUnited States as riders look for alternative means of getting to workin the central business district. These systems have primarily grownout of old private railway networks, which were assumed bymunicipalities when these companies began to fail.
Commuter rail passengers are different from those served bythe heavy rail and light rail systems nationwide. These passengersdemand quality, on-time service, and a seat, and will

28
return to automobile travel if they are unsatisfied. Thus, commuterrail operators are highly motivated to provide safe, ontime, and high-quality service. The operating environment is different from othertypes of service largely because the service is peak-oriented, goinginto the business district in the morning and returning in the evening.As a result, commuter systems have more time during the day toperform maintenance activities and to improve the aesthetics of thevehicle.
Maintenance requirements may be different depending on thetype of vehicles used. Diesel locomotives and coaches require lessmaintenance than the electric self-propelled LRV and multiple-unit(MU) trains. The need for spare vehicles is significantly less than forheavy and light rail systems. Indeed, the spare ratios for thesesystems support this view.
MTA Long Island Rail Road (MTA LIRR)
Fleet Characteristics
MTA LIRR, the nation's largest commuter rail service, operates11 lines with a fleet of 932 MU electric cars, 177 diesel haul coaches,51 locomotives, and 14 power units. In addition, MTA LIRR recentlypurchased 10 bi-level diesel hauled coaches, which can be operatedon the third rail. The spare ratio is calculated separately for each fleetsubset.
The MU electric cars, which provide most of the service, can beintegrated with each other, but obviously not with the dieselpush/pull coaches.
MTA LIRR reports that it does not use gap or extra trains atany time because they simply do not have available cars. The agencyreports a 12.2 percent spare ratio. For example, MTA LIRR has 932MU electric coaches and requires 818 coaches to meet scheduledservice. Using the FTA Section 15 recordkeeping definition, thespare ratio would be calculated at 13.9 percent. The spare ratio wouldbe substantially higher for the locomotives and the 39-year-old dieselhaul coaches, but they serve only a minor part of peak service.
Operating Environment
The key issue for MTA LIRR is the physical operatingenvironment. The agency cannot run diesels into New York City, buton certain lines, only diesels can be run, so those coaches must beconcentrated in specific areas. Because most of MTA LIRR'sweekday service goes into New York City, the diesels cannot be usedto augment the MU fleet. Since much of the system is at grade,weather conditions adversely affect performance as well. Finally,with such a low spare factor, MTA LIRR states that it is sometimesforced to run short consists; however, it does not miss service.
According to its response to the questionnaire, MTA LIRR isbarely able to handle the service demands with the limited number ofspare MU electric vehicles. It runs every vehicle and, despitecorporate policy requiring otherwise, sometimes does not pull carsfrom service immediately if the air conditioning or heating does notwork, but will wait until the train reaches the end of the line.
Maintenance Practices
MTA LIRR has a strong preventive maintenance (PM) programwith regular inspections on a short cycle and a life-cycle overhaulprogram at 2, 4, 6, 8, 10, and 12 years. This aggressive PM programlimits in-service breakdowns. The information provided indicatesthat on average, there are 48 MU cars out of service for runningrepairs daily--roughly 5 percent of the total fleet. There is currentlyno major overhaul program for diesel coaches because of plans topurchase new equipment.
Conclusions
Commuter rail services typically operate with fewer sparevehicles than rapid transit systems, but report many of the sameproblems in managing with limited spare vehicles. Despite manychallenges, MTA LIRR operates with a lean fleet. Because of its size,MTA LIRR has a higher peak-to-base ratio than other properties, butstill has available time between peaks to perform routine repairs.
METRA (Chicago)
Fleet Characteristics
METRA, a Chicago commuter rail service, operates a lean fleetmaintaining a reported spare ratio of 3.5 percent. The total fleet andPVR reported for 1993 are as follows:
Total Fleet PVRLocomotiveCoachesMU Electric
130686165
123662145
The bi-level coaches range in age from 14 to 44 years of age,the MU electric cars between 14 and 23 years, and the locomotivesare under 20 years old, with 30 under 2 years of age. METRAofficials state that the agency does not use gap or extra trains duringpeak service. The maintenance officials indicated they run everythingthey can and experience few, if any, in-service breakdowns. Only 25cars are held from service during peak period for all reasons--including one car for running repairs and 15 for inspection and majoroverhaul.
Operating Environment
METRA officials acknowledge the difficulties of operatingunder such tight restraints but indicate that they have no choice.Corporate policy is to provide every passenger with a seat andbecause they lack sufficient equipment to meet ridership demands,they must ensure that all available equipment is not only ready forservice but will stay in service.
Although severe weather is a major problem for METRA andcan have a devastating impact on service, the agency has

29
managed to control the impact through innovative and diligentmaintenance practices. The agency lost many traction motorsbecause of the snow during the winter of 1993-1994. After somedelays, the problem was managed by converting some of the MUelectric coaches to trailer cars, running them without propulsion.
Maintenance Practices
One factor that helps METRA is that the entire fleet iscomposed of single cars, which helps to limit the number of cars outof service. Agency staff report that all they need do is uncouple asingle car and the rest of the consist remains in service. The staff alsocite strong maintenance procedures and practices as the foundation oftheir success. Inspections are performed daily, every 45 days,quarterly, semi-annually, annually, and biennially. METRA officialsdo not hold cars out of service for lack of parts because they maintaina sufficient inventory of proper components so that cars can be putback into service quickly. For example, METRA keeps 68 sparetraction motors available for 165 coaches. Therefore, if any METRAcar loses a motor during the day, a new motor can and will beinstalled by the close of the day. The balance of the consist canremain in service.
In addition, METRA has made great strides in eliminatingsome maintenance issues, that plague other properties throughimproved maintenance practices. As an example, it has virtuallyeliminated problems with air brakes. Problems are identified duringdaily inspections, and repairs are made quickly.
Although severe weather can impact service, METRA'sextensive pre-weather (winter/summer) program, which includeseverything from seal to proper motor maintenance, helps the agencyto operate despite weather conditions. As a result, during the summerof 1993, more than 230 trains ran with virtually no equipmentfailures. The agency stated that on a bad day, it would have no morethan two breakdowns. The in-house major overhaul program alsoplays a significant role in maintaining the fleet. All locomotives areoverhauled every 10 years and the coaches every 15 years. Theobjective of the overhaul program is not only to extend the life of thevehicle but also to reduce the maintenance required to run the fleet inthe interim.
Finally, METRA has a strong maintenance staff with excellentexperience in electrical components and in performing overhauls.The hourly personnel are equally well trained; they must have ajourneyman card before they are hired. Specific vehicles are ownedby a particular location so that the staff has the opportunity to knowthe vehicle well and become highly experienced in maintaining it.Despite high fleet age, METRA is able to keep its fleet running withfew problems.
Conclusions
METRA's positive program could provide an example for otheragencies that are looking for strategies to improve fleet performance.METRA's accomplishments underscore the
view that rail systems can operate well with a lean spare ratio,provided there is a strong maintenance program at the foundation anda highly motivated corporate team.
New Jersey Transit Corporation (NJ Transit)
Fleet Characteristics
NJ Transit reports a total active fleet of 715 cars, whichconsists of 415 coaches and 300 MU electric vehicles against a PVRof 582 vehicles, plus 80 locomotives. NJ Transit reports a spare ratioof 20 percent. Cars out of service in excess of 30 days are excludedfrom this count.
Operational Environment
NJ Transit operates the state's Commuter Rail Network with598 daily trains, with 161 stations in 137 communities statewide.
The rail system's 12 lines are grouped into three divisions:Hoboken Division (which includes lines operating to and fromHoboken Terminal on the Morris & Essex, Main/Bergen, PascackValley, and Boonton Lines); Newark Division (which includes theNortheast Corridor, North Jersey Coast and Raritan Valley Linesoperating from Newark Penn Station, Hoboken Terminal, and NewYork Penn Station); and the Atlantic City Rail Line (which operatesbetween the seaside resort, Philadelphia, and points in between). NJTransit also runs service to and from points in New York on thePascack Valley and Port Jervis Lines under contract with theMetropolitan Transportation Authority.
The operational environment is limited due to the fact thatpush-pull coaches and electric MU cars cannot be intermingled anddiesel locomotive service is restricted from operating into New YorkPenn Station. Also, 65 percent of the peak runs make two trips,which increases the possibility of in-service failures despite extensivepreventive maintenance and overhaul programs.
Maintenance Practices
The policy of NJ Transit is to attain the highest possible railvehicle availability, at the least possible cost, while maintaining safeand reliable rail equipment. To ensure maximum use of each vehicleduring its useful life, NJ Transit has designed daily and periodicinspection procedures to ensure continued high performance. Theseprocedures are a combination of all pertinent Federal RailroadAdministration (FRA) regulations, original equipment manufacturer'srecommendations, and experience.
NJ Transit practices preventive maintenance on all vehicles todecrease the number of unscheduled repairs. When repairs arerequired, they are categorized as either:
• Running Repairs: Can be performed without removing thevehicle from service-less than 30 minutes without special

30
tools and equipment.• Light Repairs: Must be performed in a facility, but can be
accomplished within service needs between a.m. and p.m. rush.• Heavy Repairs: Keep a vehicle out of service for 24 hours
or longer and require special equipment, such as a crane or droptable.
All repairs are made in accordance with NJ Transit Rail'sstandard maintenance procedures. NJ Transit holds cars out ofservice for non-safety related repairs, such as air conditioning andcleaning, and is mandated to hold cars from service for toilet repairs.
There are many demands on the spare fleet because of theextensive vehicle overhaul program in place. On average, NJ Transitholds 125 cars out of service daily, with 34 allocated for preventivemaintenance and overhaul programs. Running repairs are low at 33cars per day, constituting under 5 percent of the total available fleet.
NJ Transit has reduced the overall age of its fleet and increasedits reliability. Finally, NJ Transit states that because of its high-speedoperation on the Northeast Corridor, more maintenance is requiredon rail car wheels because of fatigue and high temperature problems.The electric MU cars are semi-permanent married pairs, and as aresult, if one car breaks down, the entire married pair is removedfrom service.
Conclusions
The number of spare vehicles required by NJ Transit'scommuter rail operation is influenced by several factors. NJ Transithas to provide quality equipment for premium service. It cannotafford to underestimate its need for spare vehicles and thus,compromise its ability to meet high service standards.
Southeastern Pennsylvania Transportation Authority(SEPTA)
Fleet Characteristics
SEPTA's regional system operates seven lines within the five-county area surrounding Philadelphia, with a fleet of 346 railcars,including 7 locomotives, 304 MU electric cars, and 35 push/pullcoaches. The average age of the MU cars is 20 years. Managementreports that it uses gap trains, which constitute 3.4 percent of thePVR (265 cars) for the MU fleet. SEPTA officials report a 21 percentspare ratio.
Operating Environment
SEPTA's regional rail system has experienced a significantdrop in ridership over the last 5 years. Most recently, the ridershipsignificantly decreased during a major construction project,Railworks. Now, ridership is expected to return to preconstruc-
tion levels. Moreover, there are many service restoration andexpansion projects planned for the immediate future. It is anticipatedthat ridership will continue to rise in the coming years and there willbe a concomitant decrease in the spare ratio.
Currently, there are excess railcars at this agency. But SEPTAofficials report that, as a result of the ridership initiatives and plannedservice expansions, more cars will be required for peak service,decreasing the spare ratio to a forecasted 17 percent. Thus, it wouldnot make sense to decrease the present fleet size pending thisupswing in ridership. There are many capital-funded plans designedto attract riders to mass transit: new stations, more parking at variousstations, improved local service, and the institution of express serviceon other lines. Further, beginning in 1995, the PennsylvaniaDepartment of Transportation is scheduled to reconstruct I-95 fromthe New Jersey state line to the Delaware state line over a 10-yearperiod. Drivers are being strongly encouraged to turn to mass transitas a remedy to increased congestion.
Maintenance Practices
SEPTA reports that it has a number of maintenance issues as aresult of its aging fleet. It reports 20 to 40 cars out of service forrunning repairs out of a total of 339 cars. Despite relatively frequentinspections, a repair program of 60 days, and a major 5-year overhaulcycle, this agency continues to experience problems with out-of-service vehicles, which may also relate to its aggressive passengeramenities program. The current excess spare vehicles assist theagency in guaranteeing service delivery.
Conclusions
Ridership is likely to increase on SEPTA's Commuter Servicewith a corresponding increase in peak vehicle requirements and adecrease in the spare ratio. The number of vehicles needed has beencalculated at 29 cars. In the interim, it is practical to hold onto to anyexcess vehicles and to retain the trained maintenance personnel toensure that when the new riders arrive they will find a safe, reliable,and clean transit fleet waiting for them.
GO Transit (Toronto)
Fleet Characteristics
GO Transit in Toronto, a small commuter rail system, operatesseven lines with 306 coaches with an average age of 9 years, and 49locomotives, with an average age of 4 years. The PVR is 278coaches, which includes one 10-car consist as a gap train and 36locomotives. The number of spare vehicles (10 percent) is extremelylean, yet this system continues to make service despite severeweather problems. The agency indicates that its on-time performanceis between 95 and 97 percent.
31
Operational Environment
Like other northeastern Canadian properties, severe weatherconditions significantly impact service. But with its welldesigned andeffective inspection and heavy maintenance programs, GO Transitcontinuously provides quality service with a reliable fleet. There areother beneficial operating characteristics. First, the system does notoperate with married pairs; all its cars are singles, eliminatingconcerns about coupling and uncoupling cars. If there is a need toremove a car, the train consist can run with one less car. Second, themaintenance officials also indicate that the coaches are well designedand require limited maintenance activity. Finally, compared to othertransit properties, the fleet is relatively young: all but 80 of the carsare less than 12 years old and all the locomotives are less than 6years old.
GO transit recently leased 25 cars to LACMTA Metrolink, anew commuter rail line in Los Angeles. In doing so, GO Transitdecreased its spare fleet significantly. In addition, it permittedMetrolink, a new commuter rail system, to increase its servicegradually without resorting to large costly purchases, which wouldhave been required without GO Transit's assistance. When the carsare returned, GO Transit will use them to support its increasedvehicle needs due to expanding service.
Maintenance Practices
GO Transit officials report that an excellent inspection and
repair program allows them to operate with few spare vehicles. Every2 weeks an entire train, including the locomotive, is brought into theshop for a preventive maintenance inspection. The train is kepttogether; it is taken apart only when major repair work requiringmore than 1 day to complete is necessary. The gap train is used toreplace this train while it is out of service. On one shift, a dedicatedteam of 9 to 12 maintenance personnel work on the train and repaireverything they find. The maintenance facility is set up to handle thiskind of inspection with an underdeck long enough to fit the entiretrain over it, as well as side decks for floor-level entry. By repairingall items in this way, GO Transit has reduced the number of runningrepairs and in-service breakdowns to one or two per week.
GO Transit also has a major overhaul program that brings in allthe coaches every 6 to 8 years to upgrade seats, carpeting, and othercosmetic items, and every 3 years the coach is brought in forinspection and replacement of major subsystems.
Conclusions
GO Transit officials indicated that their current low spare ratiois quite adequate. They also indicated that keeping a large number ofvehicles on-site would only be essential if they were to implement anaggressive car rebuild program or use more gap trains in service.Given this agency's intensive maintenance program, which hassignificantly improved the quality of its fleet, excess vehicles are notrequired.

32
CHAPTER FOUR
SIZING THE FLEET
IMPEDIMENTS
"Right sizing" a rail fleet is a major concern and challenge forthe transit industry today. There are problems in disposing of excessvehicles with the uncertainties of critical planning in purchasingvehicles for future use, and the long lead time required to procurenew vehicles. With rapidly changing service levels, resulting fromdownward ridership trends and, at newer agencies, the failure tocomplete planned extensions or to open new routes, it is difficult foran agency to have the right number of vehicles at any given moment.In addition to the long-term challenges, the number of cars requiredfor peak service also fluctuates from year to year, month to month,and day to day.
Survey results show that maintaining a fleet plan with justenough rail cars requires careful long-term planning and thewillingness to operate with a lean fleet until appropriate adjustmentscan be made. However, managing a lean fleet requires an aggressive,well-conceived maintenance plan to ensure that vehicles are properlymaintained throughout their useful life. Ineffective or inadequatemaintenance practices will undermine the best efforts to operate withas few spares as possible.
There are many factors that influence an agency's ability to"right size" its fleets:
• The cost of disposing of rail cars within their useful life,particularly those that have been rehabilitated with federal dollars,
• The inability to warehouse excess vehicles because of alack of storage space,
• The limitations of labor agreements that curtail theflexibility to reassign bargaining unit employees when "downsizing,"
• The limited opportunities to buy vehicles in smallquantities at reasonable cost,
• The long lead times from design to delivery that lead topurchasing more rail cars than immediately needed,
• The limited ability to lend or borrow vehicles both amongand within agencies because of the customization of rail fleets, and
• Fluctuations in service requirements that make it difficultto reconcile vehicle needs over the short term, and as a result ofstructural changes in ridership, also over the long term.
STRATEGIES
Despite the challenges to correctly sizing a fleet, somestrategies identified in this synthesis could assist transit agencies todevelop:
• Good patronage estimates--Critical analyses of long-termfleet requirements allow agencies to better plan vehicle needs.Agencies might consider delaying or eliminating the large vehiclepurchases that are dependent on speculative events anticipated tooccur in the future.
• Options to purchase--Most agencies today negotiateoptions to purchase additional vehicles on new railcar purchases.Based on analyses of ridership trends and fleet utilization, the agencycan carefully consider whether to exercise the option. Because manyvehicle purchases extend over a 4- or 5-year period, there is adequatetime to reassess needs before exercising the option. For example,CTA is concluding a vehicle purchase and has elected not to exercisean option to purchase an additional 218 vehicles because its ridershipprojections do not indicate a need for further expansion of service atthis time.
• Vehicle standardization--Use of a simple, standardizedrailcar design increases the ability to buy from and sell to otheragencies, to exchange with other agencies, and to shift within asingle agency.
• Joint specifications--Cooperative buying between two ormore transit systems, particularly new starts requiring smallervolumes of railcars, permits agencies to buy in small quantities whileachieving savings with large quantity purchases.
• Warehousing--While warehousing excess vehicles is anunattractive alternative for many officials, it is a viable alternativeand an opportunity to improve fleet performance by limitingmaintenance resources to active service vehicles.
• Storage--Short-term storage by rotating vehicles out ofactive service is effective and is a more acceptable alternative thanlong-term warehousing. Metro-Dade employs this method to handlethe excess vehicles on its property.
• Disposal--When new railcars arrive, timely disposal ofrailcars exceeding their useful life, before the agency becomesaccustomed to operating with a large fleet, is essential to good fleetmanagement.
• Fleet size limits--Survey responses show that agenciesoperate with the fleet they have and develop creative strategies toensure that they meet service requirements, overcoming anyimpediments. SEPTA Orange line and METRA are primaryexamples of how to manage with very lean fleets when no otheroptions exist. At both of these systems strong maintenance programsare in place to ensure vehicle reliability.
• Retirement--Rail cars beyond their useful life should bedisposed of as a part of an overall plan to reduce the fleet. Improvedprocedures for scrapping or retiring vehicles should be used.
DISCUSSION
The survey responses disclosed that systems with low spareratios have the most reliable fleets and the lowest share of inservicefailures. For example, MTA NYC Transit, SEPTA (Orange Line),TTC, and the METRA commuter rail systems operate with very fewspare vehicles, yet the reliability of their fleets is very high, asmeasured by the number of vehicles out of service for runningrepairs during peak service. Each of these agencies has strongpreventive maintenance programs with short inspection cycles.

33
With the exception of METRA, the maintenance officials ofthese systems state that they deliberately attempt to operate with fewspares so that they can focus their efforts on a minimum number ofcars. METRA states that the agency needs every vehicle because itsridership demands are such that it does not have the luxury of excessdowntime for any vehicle. As its staff explain, MTA NYC Transitdeliberately "runs tight," because increasing its fleet size would betoo costly, given its large system and lack of adequate space toaccommodate more vehicles in its yards. Thus, MTA NYC Transithas little choice but to ensure that the vehicles it does have forservice are highly reliable and available.
There is a fine line between having too many and not enoughcars to meet peak service requirements and to ensure
good maintenance. Careful attention to this issue is required toensure that the maintenance staff does not become too preoccupiedwith daily operating conditions, as this also can compromise the fleetover the long term. For example, PATCO stated that when its fleetwas inadequate to meet increased service demands in the 1970s, theagency was unable to begin the overhaul work that is necessary tomaximize the vehicles' service life. This had an adverse effect onreliability. After new cars had been acquired to take the pressure offthe older fleet, PATCO took the time to rehabilitate the older cars toa high degree of readiness. Careful analysis of equipment andmaintenance needs as well as use is critical for optimum performanceand a well-managed fleet.

34
CHAPTER FIVE
CONCLUSIONS
As recorded in the synthesis survey results, many maintenanceofficials are eager for innovation in fleet planning as they look forways to cut costs, improve fleet reliability, and decrease fleet size.They do not invite spare ratio regulations nor do they agree aboutestablishing a uniform spare ratio for all rail systems. Professionalsin the rail transit field hold the view that rail transit equipment,maintenance practices, and operating environments do not lendthemselves to a single, optimal spare ratio target. The followingsection summarizes critical variables that affect fleet planning anddetermine a rail transit agency's spare ratio factor.
CRITICAL VARIABLES
The survey of 21 rail transit systems in the United States andCanada demonstrated that not only were there wide variances in thespare ratios reported, but there were divergences among thecomponents of the calculation and the methodologies used todetermine the spare ratio. It became apparent early in the analysisthat a meaningful comparison among rail systems was impossiblewithout standard definitions and methodologies. Nevertheless,participating agencies provided helpful information and commentsregarding spare ratio, which are summarized and listed next.
Critical variables that tend to raise the spare ratio or keepagencies from disposing of excess vehicles:
• Aging fleets with high maintenance downtime,• Gap trains used in service but not included in the peak
vehicle requirement (PVR),• Difficulties in disposing of surplus cars,• Cost of retiring cars that have not reached the end of their
useful life,• Concerns that fleet reductions may compromise quality
service objectives,• Concerns that downsizing may impair ability to meet
unexpected future demand,• Hopes that current ridership declines will turn out to be
temporary,• Heavy overhaul and rebuild programs that take vehicles
out of service for extended periods,• Difficulties in providing passenger amenities that take
vehicles out of service,• Large infrequent vehicle purchases coupled with concerns
of underestimating future needs, and• Extensive use of vehicles in married pairs and multiple-
unit consists.
Critical variables that tend to reduce the spare ratio:
• Quality maintenance programs that lead to high vehicleavailability,
• Ability to temporarily remove excess cars from the totalactive
fleet (TAF) for short periods,• Capability of moving cars among lines in same system,• Maintenance labor agreements conducive to quality
improvements,• Quality maintenance employees,• A "lean" fleet management philosophy,• Ability to lend/borrow or buy/sell vehicles from other
agencies,• Limited or costly storage space, particularly in city
centers,• Ability to procure "standard" cars that are interchangeable
within a system and with other systems,• Recognition that inactive cars often lead to maintenance
problems,• Ability to combine with other agencies in joint railcar
procurement, and• Effective use of "options to buy" procurement strategies.
CONCLUSIONS OF FTA STUDY
Although based on different data, the conclusions of the FTANational Rail Spare Ratio Study add context to the conclusions ofthis synthesis.
Overall, the larger heavy rail systems have operated at lowermean spare ratios over a 7-year span. Heavy rail transit systems witha TAF of more than 500 operated at a 7-year mean of 30 percent,systems with a TAF of 200 to 499 ranged from 26 to 33 percentbetween the 1985 and 1991 report years, and the smaller heavy railtransit systems operated at a 7-year mean of 70.3 percent. It isimportant to understand that heavy rail systems are veryindividualized in the problems they encounter. Many trains aretailored for the specific agencies making the acquisition.Additionally, heavy rail transit agencies often do not operate thesame type of heavy rail vehicle throughout all lines providingservice. For example, in visiting a few of the rail systems nationally,it is not uncommon to have one agency with several types of heavyrail trains that will operate on only one line within that system. Thus,if unscheduled maintenance occurs, that agency could encountermany delays in service, as well as be burdened with excess spares.Therefore, while a 30 or 40 percent spare ratio may appear high forcertain agencies, it is actually a reasonable number when thecomplexities of the various heavy rail systems are considered.
This FTA study concludes that commuter rail systemsnationally have achieved lower spare ratios than other forms of railtransit and, as is true for the heavy rail systems, the largest agencieshave the lowest spare ratios. Average spare ratios of the largercommuter rail transit systems, with a TAF of more than 350, haveremained fairly constant--under 19 percent between 1985 and 1991.The commuter rail transit systems operating a 100 to 350 TAFaverage spare ratio fluctuated yearly, with the exception of adecrease from 20.5 percent in 1989 to 11.6 percent in the 1991 reportyear. The very

35
small commuter rail transit systems operating a TAF under 99 haveoperated at a 7-year mean spare ratio of 57.1 percent. It is importantto note that most commuter rail transit systems do not require thelevel of maintenance that heavy rail systems do on a regular basis.Additionally, most commuter rail transit systems operate only onelocomotive, which pulls the additional vehicles. Many commuter railagencies' vehicles are not tailored to fit only one system. Thus, theacquisition of railcars by other similar agencies is an option ifridership decreases.
Overall, the rail systems in the United States and Canada haveeither begun to lower their spare ratio levels or have fluctuated atvery low spare ratios annually. Currently, 85 percent of thecommuter rail systems nationally are operating at a spare ratio lessthan 25 percent and 58 percent of the heavy rail systems nationallyoperated at 30 percent or less spare ratio.
The National Spare Ratio Study concludes that it would bedifficult to assess one spare ratio threshold for heavy rail andcommuter rail transit systems. Additionally, it is important to notethat a national move toward producing heavy railcars that are usableon more than one system is vital. This guidance could begin withnew systems nationally, and continue with agencies requestingadditional acquisitions or extending existing service.
DISCUSSION
This synthesis has underscored the need for more attention tothe role of spare ratios in transit fleet management. There are manyfactors that must be analyzed in the context of the rail operatingenvironment, some of which are discussed below. They are presentedas initial discussion points for the national dialogue that is needed tofurther the search for a consensus among rail transit personnelthroughout the industry.
Married Cars
The fact that many rail agencies use married car consists isimportant in discussing the need for spare vehicles, as this factor hasa major impact on car availability. The spare ratios of systems thatuse these frequently inseparable consists must recognize that a failureof one vehicle often means failure of the total consist, especiallyduring peak service. Transit systems such as BART, which operatecars with special lead, center, or trail functions, find that they have anadded level of complication.
Compatibility
Systems such as SEPTA, MBTA, and MTA NYC Transit haveseparate fleets that are individualized by lines, each requiring its ownspares. Rail systems with such nontransferable cars within their fleetsneed more cars than systems with fully integrated fleets.
Gap Trains
To avoid service disruption, most systems keep train consistsalong their routes or in the yards for instant replacement. The use ofthese gap trains has become an essential component of regular railtransit service for WMATA, PATH, CTA, and MTA NYC Transit.Although the cars are not used every day, it is appropriate to includethem within the definition of peak vehicle requirements. They areused frequently and their availability is the key factor in theiragency's ability to meet daily service needs.
Defining Long-Term Needs
Many agencies are reluctant to dispose of excess vehiclesbecause they anticipate increased ridership for a number of reasons,including:
• Economic growth and/or population shifts to the servicearea,
• Reverse commuting,• Clean Air Act requirements for transit use such as the
Employee Trip Reduction Program, and• Customer service incentives.More work is required to "right size" fleets in the context of
these uncertain and fluctuating ridership trends. Two systems, Metro-Dade and MARTA, deserve special attention because their high spareratios are caused primarily by an overestimation of ridership at thetime the vehicles were initially purchased for the system,notwithstanding cost savings realized in bulk vehicle purchases andthe challenge of long lead time currently required to procure newvehicles.
Customization
Rail transit agencies have a hard time disposing of excessvehicles. Railcars are frequently customized for individual systems tofit tunnels, overpasses, and special operating conditions, such astrack gauges, grades, curves, and stations. For example, CTA hasshorter cars to accommodate sharp turns on its elevated system.Other agencies with different but equally specific requirements mightnot want to purchase these kinds of cars. Most railcars are not readilysaleable or transferable.
Aging Fleets
While operating an old fleet is not a guarantee that more sparevehicles well be required, many systems have experienced significantproblems because of aging fleets. They require more maintenanceattention, particularly if the cars were not well-designed initially, andcan be difficult to obtain parts for. The experience of MBTA andSEPTA's Blue Line provide some insight into the problems of agingfleets and the resulting impact on the number of spare vehiclesrequired.
36
Labor Agreement Issues
Many labor agreements include the conditions under which anagency may decrease the maintenance work force when work is notavailable. Thus, a transit agency may not be able to realize allpotential savings associated with downsizing its fleet.
Good Maintenance Practices
Good maintenance practices, especially a strong preventivemaintenance program, will always lengthen vehicle life, and increasedaily fleet reliability. When vehicles have received regular, high-quality maintenance over the long term, the fleet builds up a historyand experience of good performance. Frequent inspections areespecially effective.
TTC and MTA NYC Transit have effective maintenanceprograms that are based on component life cycles. Although somemid-life overhaul programs may not affect day-to-day reliability,these programs are working in New York and Toronto. Perhaps it isbecause these vehicles had been overhauled in the past. Theeffectiveness of these component overhaul programs should beclosely examined within the rail maintenance community. Optimumtime and/or mileage inspection cycles should be determined to yieldthe greatest benefits for the industry and the most effectivepreventive maintenance practices should be identified to increase thelife
of the vehicle, its daily reliability and availability, thus controllingfleet size and minimizing spare ratios.
Conclusion
The transit industry today is faced with the task of trying toachieve a realistic and efficient spare ratio within the context ofoperational requirements, existing rail fleets and routes, anticipatednear-term needs, the requirements of standard maintenanceprograms, and the difficulty in quickly acquiring additional cars orquickly disposing of excess vehicles. The survey findings show thatspare ratios and related operational and service factors require carefulthought before any industry consensus can be reached on definitions,methodologies, and spare ratio levels.
The challenge is to manage fleet size to reduce life-cycle costwithout diminishing service standards. This synthesis is only a firststep in addressing the complex issues raised by the use of spare ratiosin fleet management. There is a need to call attention to many of theconcerns raised by respondents. From the many discussions withsurvey respondents, it is apparent that transit professionals are eagerfor more information on how to manage better and more costeffectively. Thus, this document will be useful if it sheds some earlylight on the subject of railcar spare ratios and begins a discussionwithin and among transit agencies and a dialogue between operatingand funding agencies.

37
GLOSSARY
Average Fleet Age--The cumulative years active revenue vehiclesare in service divided by the sum of all active revenue vehicles.
Commuter Rail--Short-haul rail passenger service operating inmetropolitan and suburban areas, whether within or across thegeographical boundaries of a state, usually characterized by reducedfare, multiple ride and commutation tickets and by morning andevening peak-period operations. This term does not include Light orRapid Rail (Heavy Rail) transportation.
Consist--Number of cars connected to make up a single Light,Heavy, or Commuter Rail unit. For example, a three-car consistcould be three inseparable (married) cars, or three easily separablecars.
Coupled Pair--Two single unit single-end cars (cab at the "B" end)that are coupled at the "R" end to provide a doubleend pair.
Gap Trains (Contingency, Standby, Relay, or Reserve Trains)--Train set(s) stored along the transit route in terminal pockets or in theyards for in-service emergency replacement for trains removed fromservice for breakdowns. These trains may or may not be staffed forimmediate service. Some systems include the Gap Trains in theirdefinition of Peak Vehicle Requirements, particularly when they areneeded frequently.
Heavy Rail--Transit service using rail cars with motive capability,driven by electric power usually drawn from a third rail, configuredfor passenger traffic and usually operated on exclusive rights-of-way.Uses generally longer trains and consists of longer station spacingthan Light Rail. Formerly Rail Rapid Transit.
Integration--Capability of transit vehicles from one route or line tobe used with other trains or operated on other routes or lines;capability of individual cars in a train to connect or operate atdifferent positions on the train.
Light Rail--A fixed-guideway mode of urban transportation usingpredominantly reserved but not necessarily grade-separated rights-of-way. It uses primarily electrically propelled rail vehicles, operatedsingly or in trains. A raised platform is not necessarily required forpassenger access. (In generic usage, light rail refers to very modernand more sophisticated developments of these older forms of publictransportation.)
Linked Passenger Trips--A linked trip is a trip from origin todestination on the transit system. Even if a passenger must makeseveral transfers during a journey, the trip is counted as one linkedtrip on the system. A passenger who rides three vehicles to work, forexample, takes one linked trip on the system, but three UnlinkedPassenger Trips because the passenger rode on three differentvehicles.
Locomotive--A self-propelled vehicle, usually electric or diesel, thatpulls or pushes rail cars along railroad tracks.
Long-term Hold--A revenue vehicle which is held out of serviceover a substantial period (usually more than three days), forextensive maintenance or repair. This does not include vehiclesawaiting disposal--it is anticipated that the vehicle will eventually beput into revenue service.
Make Service--Industry language or "term-of-art" meaning toprovide sufficient vehicles to meet peak vehicle requirements.
Married-pair Cars--Married-pair cars are semi-permanently orpermanently coupled cars, which may share some systems and sub-systems. Each married pair has all of the equipment required forindependent married pair operation with an engineer's operatingstation at the B-end of each vehicle.
1. Uncouple a married pair from a train to reduce the length of the train from, say, 8 cars to 6 or 4 cars.
2. Disconnect one car of a married pair from its mate (in a shop).
Mean Distance Between Failures--The average mileage that atransit vehicle or train travels between mechanical failures (definedin FTA Section 15, Form 402) that remove it from service.
MU Car (Push/pull Car)--A self-propelled vehicle, electric ordiesel, which can move independently either alone or jointed withother similar vehicles on railroad tracks.
Overhaul--Extensive restoration of revenue vehicles includingreplacement of mechanical components and refurbishment ofvehicle's interior and exterior as necessary. Usually occurs near thescheduled mid-life of the vehicle.
Peak Vehicle Requirement (PVR) (Vehicles Operated inMaximum Service)--The number of revenue vehicles operated tomeet the annual maximum service requirement. This is the revenuevehicle count during the peak season of the year, on the week andday that maximum service is provided. It excludes atypical days andone-time special events.
Rehabilitation--Rebuilding of revenue vehicles to originalspecifications of the manufacturer. This may include some newcomponents but has less emphasis on structural restoration thanwould be the case in a remanufacturing operation, focusing insteadon mechanical systems and vehicle interiors.
Remanufacture--Structural restoration of revenue vehicles inaddition to installation of new or rebuilt major components to extendservice life.
Replacement--Replacement of revenue vehicles that have reachedthe end of a minimum normal service life.

38
Running Repairs--Mechanical and other types of ordinary repairs torevenue vehicles that can be accomplished in the shop to which therail car is assigned.
Single Cars--Vehicles that have all equipment necessary forindependent operation with an engineer's operating station at eachend of the vehicle.
Spare Ratio--The number of spare vehicles divided by the vehiclesrequired for annual maximum service. Usually expressed as apercentage, e.g., 100 vehicles required and 20 spare vehicles is a 20percent ratio.
Spare Vehicles--Revenue vehicles available to the transit agency toaccommodate routine and heavy maintenance
requirements as well as unexpected vehicle breakdowns or accidentswhile preserving scheduled service operations.
Total Active Fleet (TAF)--All revenue vehicles held at the end ofthe fiscal year, including those in storage, emergency contingency,awaiting sale, etc.
Total Available Fleet--All revenue vehicles available for service,generally excludes long-term holds and sometimes vehicles held outof service for scheduled service.
Unlinked Passenger Trips--The number of passengers who boardpublic transportation revenue vehicles. A passenger is counted eachtime he/she boards a vehicle even though he/she may be on the samejourney from origin to destination.

39
APPENDIX A
Questionnaire
+ October 31, 1993
QUESTIONNAIRETRANSIT COOPERATIVE RESEARCH PROGRAM, TOPIC-3A-2
SYSTEM-SPECIFIC SPARE RATIO-RAIL______________________________________________________________________________________________________________________________________________________________________________
Organization:_______________________________________________________________
Address:_______________________________________________________________
______________________________________________________________
Individual Filling out Questionnaire:
Name:_____________________________________________________________
Title:______________________________________________________________
Department:________________________________________________________
Telephone:_________________________________________________________
______________________________________________________________________________________________________________________________________________________________________________
1. What kind of rail transit service do you provide?*
Commuter rail: �
Rapid Transit: �Subway: �Elevated: �Light Rail: �
(Do not include buses. Use separate questionnaire for each type of service, if your system providesboth rapid and commuter rail services.)
2. What is the total number of employees working in your Agency?
_____________________________________________________
1
3. Please describe your rail operations as indicated below:
REVENUE MILES REVENUE HOURS
Commuter Rail: ________________ ________________
Rapid Transit: ________________ ________________Subway: ________________ ________________Elevated: ________________ ________________Light Rail: ________________ ________________
Total for system: ________________ ________________
4. What is the annual number of unlinked passenger trips for your rail system?
Commuter rail:__________________________________________________________Rapid Transit:___________________________________________________________
Subway:________________________________________________________Elevated:_______________________________________________________Light Rail:______________________________________________________
5. How many rail lines do you operate? Indicate each line and length of line.
Line Length of Line # of Station_____________ _____________ ________________________ _____________ ________________________ _____________ ________________________ _____________ ________________________ _____________ ________________________ _____________ ________________________ _____________ ________________________ _____________ ___________
6. How many vehicles do you have in your total active fleet(TAF)? Total Active Fleet is defined as allrevenue vehicles held at the end of the fiscal year, including those held out of service for long termmaintenance, vehicle overhauls, emergency contingency, spares or otherwise held out of service. Donot include vehicles that are scrapped or are awaiting sale.____________________________________________
7. Has your fleet size remained the same for the last five years?
Yes: �No: �
2

40
APPENDIX A (Continued)
If no, indicate the following:
Have you replaced any cars?:_______________________Year of new car acquisition:_______________________Number of cars acquired:___________________________Number of cars retired:___________________________Year of retirement:_______________________________
8. Please fill in the following information describing your fleet.
Vehicle Model* Number Age Consist*
_____________ ______ ___ _______________________ ______ ___ _______________________ ______ ___ _______________________ ______ ___ _______________________ ______ ___ _______________________ ______ ___ _______________________ ______ ___ __________
(* indicate whether this class of car can be integrated with others.** indicate whether single or married cars)
9. a) What is the average train length by line during your peakservice?__________________________________________
b) What is the average train length for the system during your peak service?_____________________________________________
10. What is your peak operating time?
Morning: �Afternoon: �Weekday: �Weekend: �
11. What are your peak service requirements?
Year Total Vehicles Number of Vehicles Requiredfor Peak Scheduled Service
1993 ___________ ___________________________1992 ___________ ___________________________1991 ___________ ___________________________1990 ___________ ___________________________1989 ___________ ___________________________
3
12. How do you calculate your peak service requirements? Please explain._________________________________________________________
____________________________________________________________________________________________________________
_________________________________________________________
13. Do you include extra trains in your peak vehicle requirement? Extra trains are defined as trains whichare set aside to support service but exceed the actual number of trains required for scheduled service,and are sometimes referred to as relay or gap trains.
Yes: �No: �
14. If you answered yes to question 13, indicate what percentage of your peak vehicle requirement areextra trains as defined in question 13?__________________________
15. If you answered no to question 13, do you set aside extra trains, as defined above, that you do notactually need for service?
Yes: �No: �
16. How many times per week do you use the extra trams to cover out of servicetrains?_______________________________________________________
17. Where do you store your extra trains?
In the yard?________________Along the route?____________Other?______________________
18. What is your current spare ratio?________________________
19. How did you arrive at that number? Explain methodology used._________________________________________________________________________________________________________________________________________________________________________________________________________________________________________________________________________________________________________________________________________________________________________________________________
20. State the average number of cars held out of service during peak service for the following
4

41
APPENDIX A (Continued)
reasons: (If the car is part of a consist, count as two cars held out of service.)Inspections______________________Heavy Maintenance________________Vendor/Contract work_______________Running Repairs_____________________Parts not Available__________________Vehicle Overhaul____________________Other_____________________________
21. How frequently must you perform inspections?
Type of Inspection Time Mileage_______________ _____ ________________________ _____ ________________________ _____ ________________________ _____ ________________________ _____ _________
22. What time of day and on what days of the week are inspections done?_______________________________________________________________________________________________________________________________
23. Do you have a vehicle overhaul program?
Yes �No �
24. If yes, what is the overhaul cycle for your rail vehicles by subset?
Type of Vehicle Overhaul Cycle_____________ ___________________________ ___________________________ ___________________________ ___________________________ _____________
25. What is the average number of daily repairs for the fleet?
1993_________________1992_________________1991_________________1990_________________1989_________________
5
26. What has been your average yearly mean distance between failure?1993____________________1992____________________1991____________________1990____________________1989____________________
27. In calculating your mean distance between failure, what constitutes afailure?______________________________
(Please attach a copy of your specifications.)
28. When you substitute trains for in service failures, does that count as a failure in calculating your meandistance betweenfailure?_____________________________
29. If you run married pairs, does a breakdown of one car count as one failure or two?
30. Is it the policy of your agency to hold trains out of service for non-safety relatedpassenger amenities, such as cleanliness, torn seats, air conditioning/heat etc.? If yes, please indicate
those items for which you will hold trains out of service.________________________________________________________________
31. In what way does this policy affect the number of spare cars/trains that you haveavailable?_____________________________________________________________
32. What is your operating costs per mile?___________________
33. Please indicate you annual VEHICLE MAINTENANCE EXPENSE (VME).Vehicle maintenance expenses are defined as total operating expenses associated with the inspection,maintenance, and repair of vehicles, such as mechanic wages and fringe benefits, maintenancesupplies, repair parts, outside and/or contract maintenance, and repair work.. On the labor side,include the salaries and fringe benefits of all employess except management, stoclroom personel, andadministrative and support personnel.________________________________________________________________________________________________________________________________________________________________________________________________________________________________________________________________________________________________________________________________________
34. What is the ratio of mechanics to vehicles?_____________
35. What is the ratio of vehicles to mechanics?____________
6

42
APPENDIX A (Continued)
36. How many car shops do you have and where are they located in relationship to the lines?
Car Shop Location_____________ __________________________ __________________________ __________________________ _____________
37. Do you have to dead head. back to the car shops when trains leave service?_________
38. If yes, how many lines do you deadhead back to the car shop?___________________________________________________________
39. Do you believe that a 20% spare ratio is feasible for your system?
Yes �No �
40. If no, please explain why not.________________________________________________________________________________________________________________________________________________________________________________________________________________________________________________________________________________
41. Do you believe there should be a standard spare ratio for rail transit vehicles?
Yes �No �
42. Please explain your reasons for either a yes or no answer.______________________________________________________________________________________________________________________________________________________________________________________________________________________________________________________________
43. Are there specific problems with your car fleet that would cause it to deviate froma standard spare ratio?__________________________________________________________________________________________________________________________________________________________________________________________________________________________________________________________________________________________
7

43
APPENDIX B
UMTA Circular C 9030.1A
UMTA C 9030.1A9-18-87
(2) Rail Requirements
(a) Replacement. Any rail vehicle proposed for replacement must be at least 25 years old. While 25 yearsis the minimum replacement life for Federal capital funding purposes, grantees may continue tospecify longer service life requirements in their procurement documents. For purposes of Section 9 railvehicle replacement projects, the age of the vehicle to be replaced is its age at the time the proposednew vehicles are introduced into service.
(b) Rebuilding. Rebuilding must be more cost effective than the purchase of equivalent new rolling stock.Thus, the cost of rebuilding should normally not exceed the yearly amortized value (straight linemethod) of a new vehicle multiplied by the number of years of useful life to be added to the vehiclethrough rebuilding. The service life of the vehicle must be extended by at least 40 percent of theoriginal service life. Rolling stock to be rebuilt must have reached the end of its minimum normalservice life. Routine maintenance and repair costs are not eligible capital expenses.
(c) Spare Ratio. Because rail transit operations tend to be highly individualized, no specific guideline isbeing suggested for a spare ratio for rail transit operations. Nevertheless, rail transit operators shouldbe aware that their spare ratios will be examined during the TIP/AE and triennial review.
(d) Rail Rolling Stock Overhaul. Overhaul of rail rolling stock is considered to be the one-time rebuild orreplacement of major subsystems on revenue producing rail cars and locomotives commonly referredto as midlife overhaul. To be eligible for UMTA assistance, the rolling stock to be overhauled musthave an accumulated service life of at least 12 years.

THE TRANSPORTATION RESEARCH BOARD is a unit of the National Research Council, which serves the NationalAcademy of Sciences and the National Academy of Engineering It evolved in 1974 from the Highway Research Board, whichwas established in 1920. The TRB incorporates all former HRB activities and also performs additional functions under a broaderscope involving all modes of transportation and the interactions of transportation with society. The Board's purpose is tostimulate research concerning the nature and performance of transportation systems, to disseminate information that the researchproduces, and to encourage the application of appropriate research findings. The Board's program is carried out by more than 270committees, task forces, and panels composed of more than 3,300 administrators, engineers, social scientists, attorneys,educators, and others concerned with transportation; they serve without compensation. The program is supported by statetransportation and highway departments, the modal administrations of the U.S. Department of Transportation, the Association ofAmerican Railroads, the National Highway Traffic Safety Administration, and other organizations and individuals interested inthe development of transportation.
The National Academy of Sciences is a private, nonprofit, self-perpetuating society of distinguished scholars engaged inscientific and engineering research, dedicated to the furtherance of science and technology and to their use for the generalwelfare. Upon the authority of the charter granted to it by the Congress in 1863, the Academy has a mandate that requires it toadvise the federal government on scientific and technical matters. Dr Bruce Alberts is president of the National Academy ofSciences.
The National Academy of Engineering was established in 1964, under the charter of the National Academy of Sciences, as aparallel organization of outstanding engineers It is autonomous in its administration and in the selection of its members, sharingwith the National Academy of Sciences the responsibility for advising the federal government. The National Academy ofEngineering also sponsors engineering programs aimed at meeting national needs, encourages education and research, andrecognizes the superior achievements of engineers. Dr. Robert M.White is president of the National Academy of Engineering.
The Institute of Medicine was established in 1970 by the National Academy of Sciences to secure the services of eminentmembers of appropriate professions in the examination of policy matters pertaining to the health of the public. The Institute actsunder the responsibility given to the National Academy of Sciences by its congressional charter to be an adviser to the federalgovernment and, upon its own initiative, to identify issues of medical care, research, and education. Dr. KennethI. Shine is president of the Institute of Medicine.
The National Research Council was organized by the National Academy of Sciences in 1916 to associate the broadcommunity of science and technology with the Academy's purposes of furthering knowledge and advising the federalgovernment. Functioning in accordance with general policies determined by the Academy, the Council has become the principaloperating agency of both the National Academy of Sciences and the National Academy of Engineering in providing services tothe government, the public, and the scientific and engineering communities The Council is administered jointly by bothAcademies and the Institute of Medicine. Dr. Bruce Alberts and Dr. Robert M. White are chairman and vice chairman,respectively, of the National Research Council.