tcns clothing company ltd.€¦ · it sold products through 541 ebos, 1,623 lfs stores and 1,428...
TRANSCRIPT

June 28, 2019
TCNS Clothing Company Ltd. Initiating Coverage
Restyling India’s ethnic-wear landscape

June 28, 2019 Before reading this report, you must refer to the disclaimer on the last page. Page 1 of 26
TCNS Clothing Ltd. Absolute: ADD
Relative: Overweight
Initiating Note Regular Coverage 8% ATR in 18 Months
Restyling India’s ethnic-wear landscape – Initiate with ADD Textiles
© 2019 Equirus All rights reserved
Rating Information
Price (Rs) 781
Target Price (Rs) 872
Target Date 31st Dec'20
Target Set On 27th Jun'19
Implied yrs of growth (DCF) 20
Fair Value (DCF) 790
Fair Value (DDM) 26
Ind Benchmark SPBSMIP
Model Portfolio Position NA
Stock Information
Market Cap (Rs Mn) 47,893
Free Float (%) 38.37 %
52 Wk H/L (Rs) 870/515
Avg Daily Volume (1yr) 1,26,003
Avg Daily Value (Rs Mn) 91
Equity Cap (Rs Mn) 123
Face Value (Rs) 2
Bloomberg Code TCNSBR IN
Ownership Recent 3M 12M
Promoters 32.4 % 0.0 % -
DII 4.6 % 0.3 % -
FII 16.4 % 0.2 % -
Public 46.6 % -0.5 % -
Price % 1M 3M 12M
Absolute 5.0 % -4.8 % -
Vs Industry 6.7 % -2.7 % -
ABFRL 0.9 % -3.9 % 54.4 %
Trent 18.9 % 21.2 % 48.4 %
Consolidated Quarterly EPS forecast
Rs/Share 1Q 2Q 3Q 4Q
EPS (19A) 3.2 6.4 5.7 5.1
EPS (20E) 4.4 6.0 5.2 4.8
TCNS Clothing (TCNS), India’s leading women’s ethnic wear player has emerged as a key
beneficiary from a shift in preference from unbranded to branded apparels. Its leadership
in a growing branded ethnic wear market stems from USPs like (1) a differentiated brand
portfolio (W, Aurelia & Wishful) across price points, (2) an extensive store network with a
robust supply chain, and (3) an institutionalized and feedback-oriented design process.
TCNS is set to deliver a ~17% revenue CAGR over FY19-FY22E; with better operating
efficiencies driving an ~18% adj. EBITDA CAGR in this period. However, current softness in
demand and muted airport store revenues could hurt near-term performance. We are mid-
to-long-term positive on TCNS and its ability to outpace peers and gain market share.
Initiate with ADD at a TP of Rs 872 set at 35x Dec’20 TTM EPS of Rs 25.
Differentiated portfolio, rapid store network expansion to drive ~17% revenue
CAGR over FY19-FY22E: Over the years, TCNS has developed a differentiated brand
portfolio (W, Aurelia & Wishful) with offerings across price points, leading to a strong
brand recall. A rapidly expanding store network with 23%/30%/18% CAGR in EBO/LFS/
MBO store counts over the last 4 years has strengthened the company’s foothold in
the women’s branded ethnic wear market. We feel that a combination of factors
including (1) A unique product portfolio, (2) strong revenue growth from existing
stores, and (3) addition of 70-75 EBO stores per annum would drive a 17% revenue
CAGR over FY19-FY22E. This along with better operating efficiencies from scale
benefits would lead to an ~18% adj. EBITDA CAGR over this period.
Innovative & institutionalized design process = finger on consumer pulse: TCNS has
developed a highly innovate and feedback-oriented design process that helps it come
up with latest designs post filtration at both the company and dealer-distributor level
(at trade shows organized by TCNS bi-annually). This filtration significantly reduces
chances of design failure, thus ensures high acceptance levels for the company’s brands.
Strict WC control, strong FCF generation to continue: Despite continuous store
additions, TCNS has maintained a strict control on WC requirements; this along with
high profitability has helped generate strong cash flows for the company. With limited
capex requirements (Rs 450mn-500mn per annum) for the next 2-3 years, TCNS should
generate a FCFF of ~Rs 2bn over the next three years. Limited capex and largely stable
WC turns should improve adj. core ROIC by ~160bps to ~26% over FY19-FY22E.
Initiate with ADD, Dec’20 TP of Rs 870: At CMP of Rs 781, TCNS trades at 38x/33x
FY20E/FY21E EPS, which we feel is expensive when compared to peers and given the
near-term uncertainties. Initiate with ADD and a TP of Rs 872 set at 35x Dec’20 TTM EPS
of Rs 25.
Consolidated Financials
Rs. Mn YE Mar FY19A FY20E FY21E FY22E
Sales 11,480 13,369 15,675 18,427
EBITDA 1,768 2,193 2,614 3,162
Depreciation 222 293 382 475
Interest Expense 5 7 7 7
Other Income 75 120 141 166
Reported PAT 1,314 1,318 1,549 1,864
Recurring PAT 1,314 1,318 1,549 1,864
Total Equity 6,186 7,511 9,021 10,827
Gross Debt 0 0 0 0
Cash 1,608 1,937 2,651 3,602
Rs. Mn YE Mar FY19A FY20E FY21E FY22E
Earnings 20.3 20.4 24.0 28.9
Book Value 101 116 140 168
Dividends 0.0 0.0 0.5 0.8
FCFF 8.5 4.7 11.3 15.3
P/E (x) 38.4 38.3 32.6 27.1
P/B (x) 7.7 6.7 5.6 4.7
EV/EBITDA (x) 26.3 21.0 17.4 14.1
ROE (%) 25 % 19 % 19 % 19 %
Core ROIC (%) 30 % 25 % 25 % 26 %
EBITDA Margin (%) 15 % 16 % 17 % 17 %
Net Margin (%) 11 % 10 % 10 % 10 %

TCNS Clothing Ltd. Absolute – ADD Relative – Overweight 8% ATR in 18 Months
June 28, 2019 Page 2 of 24
Company Snapshot
How we differ from Consensus
- Equirus Consensus % Diff Comment
EPS FY20E 20.4 20.0 2 % In-line with consensus
FY21E 24.0 23.9 0 %
Sales FY20E 13,369 13,334 0 %
FY21E 15,675 15,685 0 %
PAT FY20E 1,318 1,286 3 %
FY21E 1,549 1,555 0 %
Our Key Investment arguments:
• Differentiated brand portfolio across price points, huge store network & robust supply
chain are key USPs for a leader in the organized women’s ethnic wear market.
• Highly penetrated store network and continuous stores additions to drive a ~17%
revenue CAGR over FY19-FY22E. This along with rise in operating efficiencies on scale
benefits will lead to ~18% adj. EBITDA CAGR over this period.
• Innovative and institutionalized design process helps in coming up with highly
acceptable designs.
• Strict control over WC and strong FCFF generation would improve return ratios.
Key Assumptions:
Particulars (In Rs Mn) FY19 FY20E FY21E FY22E
W Revenues 6,888 8,093 9,550 11,297
Aurelia Revenues 3,903 4,449 5,117 5,900
Wishful Revenues 689 827 1,008 1,230
Capex 217 450 420 420
NWC Days 103 108 108 109
Risk to Our View
Continued demand slowdown, design failure for many seasons in a row, longer breakeven
time of new stores.
Key Triggers
• Robust demand growth; increase in share of organized ethnic wear & faster break-even
of new stores.
Sensitivity to Key Variables % Change % Impact on EPS
Revenue 1 % 1 %
EBITDA 1 % 1 %
- - -
DCF Valuations & Assumptions
Rf Beta Ke Term. Growth Debt/IC in Term. Yr
7.5 % 1.2 14.7 % 2.5 % 0.0 %
- FY20E FY21E FY22-24E FY25-29E FY30-39E
Sales Growth 16 % 17 % 11 % 14 % 16 %
NOPAT Margin 9 % 9 % 10 % 11 % 12 %
IC Turnover 2.42 2.47 2.65 2.73 2.87
RoIC 24.8 % 24.6 % 29.0 % 31.7 % 37.3 %
Years of strong growth 1 2 5 10 20
Valuation as on date (Rs) 160 171 239 330 642
Valuation as of Mar'20 197 211 294 406 790
Based on DCF, assuming 20 years of 16% CAGR and 37% average ROIC, we derive our current
fair value of Rs 642 and a 31st Dec’20 fair value of Rs 790.
Company Description:
TCNS is one of the India’s leading manufacturers that designs, manufactures, markets and
retails a wide portfolio of women’s branded apparels across multiple brands. As on Mar’19,
it sold products through 541 EBOs, 1,623 LFS stores and 1,428 MBO stores located in 31
states and UTs in India. It also sold its products through 6 EBO stores in Nepal, Mauritius
and Sri Lanka.
Comparable valuation Mkt Cap
Rs. Mn.
Price
Target
Target
Date
EPS P/E BPS P/B RoE Div Yield
Company Reco. CMP FY19A FY20E FY21E FY19A FY20E FY21E FY19A FY20E FY19A FY20E FY21E FY19A FY20E
TCNS Clothing ADD 781 47,893 872 31st Dec'20 20.3 20.4 24.0 38.4 38.3 32.6 100.9 6.7 25 % 19 % 19 % 0.0 % 0.0 %
ABFRL NR 213 1,64,717 NR NR 4.2 3.4 5.0 51.3 62.7 42.3 18.5 9.9 25 % 17 % 21 % 0.0 % 0.0 %
Trent NR 445 1,48,014 NR NR 2.9 5.5 6.9 156.1 80.7 64.6 49.5 8.0 6 % 12 % 14 % 0.2 % 0.4 %

TCNS Clothing Ltd. Absolute – ADD Relative – Overweight 8% ATR in 18 Months
June 28, 2019 Page 3 of 24
Favorable industry dynamics = Huge market opportunities
India’s women’s apparel industry witnessing robust growth
India’s total apparel market was pegged at US$ 51bn in FY17, of which women’s apparel
contributed ~37% or US$ 19bn. Rising digitization and urbanization, supported by increasing
brand consciousness and greater purchasing power will lead to above-GDP growth for
apparel consumption. India’s women apparel market is expected to touch US$ 42bn by FY25,
growing at a healthy 10.3% CAGR driven by (a) an increase in number of working women,
(b) a shift towards aspiration rather than need-based buying, and (c) emergence of many
home-grown national brands with unique design innovations that appeal to Indian
sensibilities.
Exhibit 1: Women’s apparel market to continue to grow at ~10.3% CAGR (FY20E-25E)
Source: Technopak Analysis, TCNS RHP, Equirus Securities
Of the total women’s apparel market, Indian apparels account for 71% of the market and is
dominated by a few national brands along with many regional players. The disproportionate
size of Indian wear for women is attributable to its distinct positioning vis-à-vis that of men
in India.
Particulars For Women For Men
Indian & Ethnic wear Daily wear incl. occasions wear utility
Largely restricted to occasion wear viz. weddings & festivals
Western Wear Occasionally however ratio growing rapidly
Daily wear except for occasions
For Indian women, Indian and ethnic fashion is a mainstream daily-wear use requirement
(in addition to strong occasion-wear utility); for men, it is largely restricted to occasion-
wear alone. viz weddings and festivals.
Exhibit 2: Indian wear accounts for ~71% or US$ 13.5bn of women’s apparel market
Source: Technopak Analysis, TCNS RHP, Equirus Securities
Exhibit 3: Of US$ 13.5bn women’s Indian wear market, ethnic wear has a 48% share
Source: Technopak Analysis, TCNS RHP, Equirus Securities
12.1
19.3
25.7
41.9
0
5
10
15
20
25
30
35
40
45
FY12 FY17 FY20E FY25E
Indian Women's apparel market (In US $ bn) 71%
15%
3%
3%
3%
3%
2%
Indian Wear
Innerwear
Winterwear
Sleepwear
Tops/Shirts/T-Shirts
Denim/Trousers/Skirts
Others
48%45%
7%
Ethnic wear
Sarees
Blouse Petticot

TCNS Clothing Ltd. Absolute – ADD Relative – Overweight 8% ATR in 18 Months
June 28, 2019 Page 4 of 24
Women’s ethnic apparel market in India stood at US$ 6.5bn as of FY17 and is expected to
grow at 14% CAGR to reach US$ 9.5bn by FY20E-end. Factors such as rising disposable
incomes, better design, quality and fit assurance, growing aspiration levels and increasing
acceptance of ethnic wear as work wear are triggering a shift from traditional apparel
(sarees) to ethnic wear (salwar kameez, kurtas).
Rise of organized and branded ethnic wear players
Until a decade ago, ethnic wear ― largely constituting sarees and their clothing accessories
― was looked at as old-age wear that was catered to by neighborhood tailors. However, an
influx of new entrants that sell a fusion of modern and traditional wear has altered mindsets
and attracted the younger generation towards ethnic wear. This shift was further boosted
by (a) a rising share of organized and branded players in the segment, and (b) an aspiration
to be associated with brands that provide features of design, fit, comfort and convenience.
Exhibit 4: At 29% CAGR, organized retail is set to grow at 3x unorganized retail growth
Source: TCNS RHP, Equirus Securities. Figures in chart are average nos. of range provided.
As of FY17, the share of organized retail in women’s ethnic apparel stood at 20%; however,
with changing consumer preferences fueled by a large-scale presence of organized players,
this should touch 33% by FY20-end. Thus, with a growth rate of 29.4% over FY17-FY20E,
organized retail would grow ~3x that of unorganized retail in this period.
Exhibit 5: Branded ethnic wear to grow at 31% CAGR with a ~35% market share in 2020
Source: TCNS RHP, Equirus Securities.
High growth in organized retail in ethnic women’s wear will also be reflected in high growth
of branded women’s ethnic apparels. Branded ethnic wear, at US$ 1.5bn with a 23% market
share in FY17, is expected to grow at a 31% CAGR (to US$ 3.4bn in FY20) with women’s
ethnic wear constituting a 35% share. Though the ethnic wear market is dominated by
unbranded women’s wear, a large part of it is moving towards branded apparels on account
of the following:
- Increase in variety that meets the tastes and preferences of various age groups
- Standardization of designs available in many sizes and fits
- Wide range available at various price points
Institutionalization of the design process, use of unique fabrics as well as modern
production processes are the key growth drivers of women’s wear brands. Growth of the
branded and organized ethnic apparel segment will be driven by significant investments by
industry leaders in building capabilities around design and sourcing coupled with strong
demand dynamics of the category.
Women’s ethnic wear market can be segregated into four distinct phases (Exhibit 6). It is
noteworthy that the proportion of branded wear in organized retail has been steadily
increasing.
7%9%
13.5%
20%
33%
Pre 2000 2001-2007 2008-15 2015-2017 FY20E
Share of Organized retail in women's apparel market
56.1
1.5
3.4
0
2
4
6
8
10
2017 2020
Unbranded Branded

TCNS Clothing Ltd. Absolute – ADD Relative – Overweight 8% ATR in 18 Months
June 28, 2019 Page 5 of 24
Exhibit 6: Rising share of organized retail in every phase of evolution
Pre-2000 2001-2007 2008-2015 2015-Present
Dominance of Unorganized Players
Initiation of Organized Retail
Growth of Organized Retail Emergence of Industry Leaders
Organized Retail Share: 5%-8% Organized Retail Share: 8%-10% Organized Retail Share: 12%-15% Organized Retail Share: 20%
1. Local boutiques serve captive customers
2. Daily apparel needs served through customized
tailoring or limited functional ready to apparel
offering
3. Readymade offering limited to occasion
apparel
4. Retail footprint of organized retailers
(Fabindia, Biba) restricted to EBOs in few cities
and clusters
5. Ethnic apparel private label of Westside
1. BIBA and Fab India expand retail
footprints
2. W opens its first EBO
3. Westside expands its retail footprints
1. Retail brands scale up penetration of EBOs in metros
and mini-metros
2. Emergence of regional brands
3. Growth of LFS formats as an important organized retail
channel for women’s ethnic apparel both as private
labels and as destination for retail brands
4. Launch of sub-brands or retail store segmentation by
ethnic apparel retail brands to cater to different needs.
5. Initiation and growth of e-commerce
1. Retail brands expand beyond metros
and mini-metros to other urban
clusters
2. Online retail starts gaining traction as
a complimentary retail channel
3. Emergence of industry leaders on
product differentiation, designs and
positioning
Domestic players clearly dominate branded apparel ethnic wear market
Overall size of India’s ethnic fashion market is neither big enough not broad enough (in
terms of appeal outside India) for the global supply chain of western apparel to align itself
on raw materials, sourcing and merchandising for ethnic apparel. Raw materials and
sourcing for Indian ethnic fashion is a mix of artisanal skills, machines, handlooms and
power looms. This poses a challenge for the scale of global fashion brands. Additionally,
the global design response that interprets trends into products for global brands requires
interpretation of Indian ethos, fabric and colors into products; this becomes difficult for
global players to respond to in light of international presence and unique design philosophy
of India and other foreign countries.
Therefore, ethnic apparel in India is a domestic-focused opportunity and one which provides
home-grown players with a natural and sustainable advantage to seize. This advantage is
reflected in the structure of the ethnic apparel category that comprises home grown
entities only.

TCNS Clothing Ltd. Absolute – ADD Relative – Overweight 8% ATR in 18 Months
June 28, 2019 Page 6 of 24
Exhibit 7: Competitive landscape in women’s ethnic apparel retailing in India
National Players Regional Player Private Label Local Players
Ethnic Lifestyle & Fashion Retailers
Ethnic Apparel led Retail Brands Ethnic Apparel led
Retail Brands In-store apparel brands of Multi-
brand retailers Neighbourhood stores/Boutique
shops
Example FabIndia, Anokhi W, Aurelia, BIBA, Global Desi Kiara, Ibadat, Harra Rangmanch, Akriti, Morpankh, Navras
-
Share of women's ethnic apparel in total business
40-60% ~90% ~95% < 90% 100%
Sales Breakup by channel EBO: 100%
EBO: 40-50% LFS: 30-40% MBO: 5-10%
Online: 5-10%
EBO: 70-80% LFS: 10-20%
LFS: 100% Within store: 100%
Retail Presence PAN India, strong presence in
Tier 2 & below towns PAN India, strong presence in Tier
2 & below towns Region focused PAN India presence Limited to a city/cluster
Price point ~Rs 1000-5,000 ~Rs 800-5,000 ~Rs 1,000-2,500 ~Rs 700-1,500 ~Rs 500-1,200
Design Focus Specific prints & designs Strong design philosophy catering
to PAN India taste Regional designs &
prints Wide range of designs with high
focus on core products Limited for ready to wear but premium for made to order
Source: Technopak, TCNS RHP, Equirus Securities
Depending on the scale of operations and product offerings, India’s ethnic wear segment
can be divided into three broad categories:
National brands: These can be further classified into two types of retailers:
- Ethnic lifestyle-led fashion retailers: Small retailers that have grown big to national
levels and sell multiple categories on ethnic fashion ethos like women’s apparel, men’s
apparel, home furnishing (FabIndia, Anokhi).
- Ethnic apparel-led retail brands: Women’s ethnic apparel comprises ~90% of the sales
mix. Strengths include product design differentiation, pan-India reach, store network of
owned & franchisee stores (Biba, W, Aurelia, Global Desi).
Regional brands: These retailers try to imitate national brands on EBO formats and product
offerings. While they have an advantage of being closer to regional tastes of their
consumers, their product designing abilities or retail reach restrict them to expand beyond
their region (Mebaaz, Harra, Prafull, Ibadat, Kiara).
Private labels: Private labels are the in-store ethnic apparel brands of large format stores
(LFS). Leading LFS stores have created in-store label brands and sell them exclusively along
with other national or regional brands and thus carry an image of quality equivalent to
other brands. These private label brands are attractively priced in comparison to
national/regional brands and thus generate interest from a larger audience. Stop of
Shoppers Stop, Melange of Lifestyle, Rangmanch, Akriti and Trisha of Pantaloons, Morpankh,
Navras and Ateesha of Central are leading private label brands in women’s ethnic apparel
space.
Exhibit 8: Fab India & BIBA ― Pioneers of branded women’s ethnic retailing in India
Brand Year of Inception Focus Area
W 2002 All-India
Aurelia 2009 All-India
Wishful 2006 All-India
BIBA 1988 North, South, West
Global Desi 2007 North & West
Fab India 1960 All-India
Soch 2005 South
Source: TCNS RHP, Equirus Securities

TCNS Clothing Ltd. Absolute – ADD Relative – Overweight 8% ATR in 18 Months
June 28, 2019 Page 7 of 24
Investment Rationale
Differentiated brand portfolio across price points ― a key USP
In India’s women ethnic wear market, a number of players offer products to specific apparel
categories like western wear, occasion wear, office wear and daily wear, or cater to specific
price points and thus restrict themselves to a limited group of target customers.
Few national players like TCNS have differentiated themselves from other players through
a multi-brand platform strategy by offering products across price points and catering to
various customer segments. A diversified brand portfolio (W, Aurelia and Wishful) helps
TCNS to cater to customer needs with its extensive product range and thus increase brand
loyalty.
TCNS is India’s leading women’s branded apparel company that designs, manufactures and
retails a wide portfolio of women’s branded apparel across multiple brands. Its product
portfolio includes top-wear, bottom-wear, drapes, combination sets and accessories that
cater to a wide variety of wardrobe requirements of Indian women, including daily wear,
casual wear, office wear and occasion wear.
Backed by the strong understanding of Indian women’s needs and aspirations, TCNS has a
track record of developing home-grown brands over the years that cater to the needs of
ethnic wear with a blend of western sensibilities as well. Brands of TCNS include:
W is a premium fusion wear brand that is a blend of Indian and
western fashion sensibilities with emphasis on distinctive design
and styling and is targeted primarily at the modern Indian
women’s work and casual wear requirements.
Aurelia is a contemporary ethnic wear brand targeted at women
looking for great design, fit, and quality for casual and work wear
requirements.
Wishful is a premium occasion wear brand, with elegant designs
catering to women’s apparel requirements for evening wear and
occasions such as weddings, events and festivals.

TCNS Clothing Ltd. Absolute – ADD Relative – Overweight 8% ATR in 18 Months
June 28, 2019 Page 8 of 24
W ― Plugging the gap between Indian and western wear
W is the first and the most successful brand for the company that bridged the gap between
Indian wear and western wear apparels. There existed a large set of consumers wanting to
rise above traditional sarees, blouses and conventional dresses but did not want to switch
entirely to western wear. This need for the fusion of both Indian and western sensibilities
was well identified and catered to along with innovative fusion prints and fabric; this in
turn led to the success of the brand W for the company. Majority of the top-wear under this
brand sells at maximum retail prices ranging from Rs 1,299 to Rs 1,899. W currently is the
largest brand for TCNS and contributes ~60% of revenues. Revenues from this brand have
seen phenomenal growth of ~30% CAGR over FY16-FY19 driven by rising brand loyalty and
increased penetration in both newer and existing markets.
Exhibit 9: W revenues have grown at a robust 30% CAGR over FY16-19 (In Rs Bn)
Source: Company, Equirus Securities.
Aurelia ― Focusing on quality & fit; price point lower than W
Aurelia, almost a similar brand to W, is a contemporary ethnic wear brand specially targeted
to women looking for a great fit, quality and design for casual and workwear requirements.
The focus here is more towards fit and quality vs. innovative design and styling for W. The
price point of Aurelia is also lower than W, at Rs 799 to Rs 1,499 and at Rs 1,999 to Rs 4,499
for combination sets. Both these features segregate target customers of W and Aurelia.
Aurelia has also seen robust growth of 35% CAGR over FY16-FY19 with ~34% contribution to
revenues.
Exhibit 10: Aurelia revenues have grown at phenomenal 35% CAGR over FY16-19 (In
Rs Bn)
Source: Company, Equirus Securities.
Wishful ― Premium occasion wear brand
Wishful is a premium occasion-wear brand with elegant designs catering to women’s apparel
requirements for evening wear and occasions such as weddings, events and festivals. Under
Wishful, the company also sells a higher-end premium range brand, Wishlist, that is made
up from premium clothing and has high-quality work and embellishments. While Wishful
products are sold in the range of Rs 2,999 to Rs 4,999, Wishlist products range between
Rs 12,000 – Rs 29,000. With ~6% revenue contribution in FY19, TCNS has not been able to
scale up Wishful revenues over the last three years mainly due to manufacturing constraints
and supply chain issues.
Exhibit 11: Wishful, due to manufacturing & supply constraints, grew at just 4% CAGR
over FY16-19 (In Rs Bn)
Source: Company, Equirus Securities.
3.2
4.3
5.7
6.9
0
2
4
6
8
FY16 FY17 FY18 FY19
1.6
2.2
3.4
3.9
0.0
1.0
2.0
3.0
4.0
5.0
FY16 FY17 FY18 FY19
0.60.6
0.9
0.7
0.0
0.2
0.4
0.6
0.8
1.0
FY16 FY17 FY18 FY19

TCNS Clothing Ltd. Absolute – ADD Relative – Overweight 8% ATR in 18 Months
June 28, 2019 Page 9 of 24
Exhibit 12: TCNS has a different brand at different price points
Brand Price Point Style Offerings Peers
W Rs 1,299-1,899 Premium fusion wear brand
Top wear, bottom wear, drapes
Global Desi, BIBA, STOP, etc.
Aurelia
Rs 799-1499, combination sets from Rs 1,999-4,499
Contemporary Ethnic wear
Top wear, bottom wear, drapes, combination sets
Soch, Melange, Rangmanch, etc.
Wishful Rs 2,999-4,999 Premium occasion wear brand
Top wear, bottom wear, drapes
Fbb, Miraaya, SPAR, Prafful, etc.
Wishlist (sub-brand of Wishful)
Rs 12,000 – 29,000
High premium occasion wear
Combination sets of Top wear, bottom wear and drape sold together
Designer boutique & fashion houses
Source: Company, Equirus Securities
Multi-channel retail network with pan-India presence lends competitive edge
In the branded and organized women’s ethnic wear market, Exclusive Brand Outlets (EBO)
and Large format stores (LFS) are the leading retail channels preferred by majority of
national and regional brands. While EBOs are the building blocks that provide brand value
proposition to customers, LFS ensures higher reach of the brand across cities in an
affordable manner. Not surprisingly, most players have ~70-90% of presence through
these routes.
Exhibit 13: EBO & LFS is the most preferred channel for most national players
Source: Technopak, TCNS RHP, Equirus Securities.
Over the years, TCNS has successfully set up a wide-scale multi-channel retail network
spread across India by investing heavily in establishing processes, teams and technology and
infrastructure. As of 31st Mar’19, the company sold its products through 3,598 points of sale
comprising EBOs, LFS and MBOs located across 108 cities in 31 states and UTs in India. TCNS
enters into lease agreements with property owners or into franchises agreements with third
parties for its franchise-owned EBO stores; at present, ~60% of its EBO stores are franchise-
owned stores. In addition, the company has a small international presence with 3 EBO stores
in Sri Lanka, 2 EBO stores in Mauritius and 1 EBO store in Nepal with ~0.5% contribution to
revenues.
Exhibit 14: TCNS has a wide-spread distribution network with a pan India presence
Source: TCNS RHP, Equirus Securities
EBOs41%
LFS47%
MBOs6% Online
6%EBO: 49
LFS: 238
EBO: 50
LFS: 184
EBO: 54
LFS: 68
EBO: 38
LFS: 138EBO: 29
LFS: 39
EBO: 30
LFS: 99
EBO: 21
LFS: 151
EBO: 25
LFS: 113
EBO: 17
LFS: 26
EBO: 19
LFS: 77
EBO: 20
LFS: 49
EBO: 12
LFS: 25
EBO: 11
LFS: 22
EBO: 9
LFS: 30
EBO: 10
LFS: 17
EBO: 10
LFS: 23
EBO: 6
LFS: 54
EBO: 11
LFS: 32
EBO: 7
LFS: 44
EBO: 6
LFS: 10
EBO: 5
LFS: 3
EBO: 5
LFS: 12
EBO: 5
EBO: 3
EBO: 2
LFS: 3
EBO: 1
LFS: 2
EBO: 1
LFS: 1
EBO: 2
LFS: 3
EBO: 2
LFS: 4
EBO: 2
LFS: 1
EBO: 3
LFS: 1

TCNS Clothing Ltd. Absolute – ADD Relative – Overweight 8% ATR in 18 Months
June 28, 2019 Page 10 of 24
TCNS (W & Aurelia combined) has the highest number of stores than any other brands in
the country. Also, it is well spread across the country, unlike other players like Fab India,
BIBA, AND, Global Desi and others which are concentrated and region focused. The top
eight cities, viz. Delhi/NCR, Greater Mumbai, Kolkata, Chennai, Bangalore, Hyderabad,
Ahmedabad and Pune have the highest penetration levels as majority of the consumption
happens in these cities. Apart from these cities, TCNS is also increasing its penetration in
tier 2, 3 and 4 cities because of its high growth potential and a preference shift towards
branded apparels.
Exhibit 15: TCNS (W, Aurelia) has highest number of stores than any other Indian player
Source: Technopak, TCNS RHP, Equirus Securities. *FY19 end numbers
Exhibit 16: Fairly wide presence in all Indian regions
Source: Company, TCNS RHP, Equirus Securities
Expansion in new markets, rising share in existing markets to drive revenue growth
A key driver of the strong 47% revenue CAGR over the last five years for TCNS has been the
rapid expansion of its stores in both new and existing markets. The company had opened
its first EBO in New Delhi in 2002. Since then, it has added its store count at a significant
rate; in the last four years ending FY19, TCNS has more than doubled its store count for
both W and Aurelia brands from a total of 235 stores in FY15 to 541 stores in FY19.
Simultaneously, it has also entered many new markets by EBO and LFS routes to cater to
the unmet demand of smaller towns and cities.
Exhibit 17: Robust store expansion in last four years
Store Counts FY15 FY16 FY17 FY18 FY19 CAGR (FY15-19)
W
EBO 166 202 233 281 321 18%
LFS 302 426 535 717 - -
International Outlets 2 2 5 5 5 26%
Aurelia
EBO 69 103 148 183 215 33%
LFS 263 368 456 752 - -
International Outlets 0 0 1 1 1 -
Wishful
EBO 0 0 0 1 5 -
Total
EBO 235 305 381 465 541 23%
LFS 565 794 991 1,469 1,623 28%
International Outlets 2 2 6 6 6 32%
Multi Brand Outlets 748 960 1,109 1,522 1,428 18%
Source: Company, Equirus Securities.
While the company has a decent presence in most parts of the country, there are many
small pockets or cities in tier 2, 3 and 4 states which are seeing a massive shift towards
branded women’s ethnic wear; this is a major area where the company expects its future
growth to come from. Additionally, there are many areas with very high growth potential
but are served with either few stores or smaller-sized stores and as a result are not able to
realize their full potential. In such areas, the company plans to increase its presence either
through addition of new stores or upgrading stores to bigger sizes with high product
varieties.
321
215
256
141123
276
98
28
0
50
100
150
200
250
300
350
W* Aurelia* BIBA Global Desi AND FabIndia Soch Anokhi
No. of EBO stores
North40%
South25%
East15%
West20%
W
North30%
South35%
East15%
West20%
Aurelia

TCNS Clothing Ltd. Absolute – ADD Relative – Overweight 8% ATR in 18 Months
June 28, 2019 Page 11 of 24
Innovative & institutionalized product design process = Finger on consumer pulse
An inherent threat to any company related to the fashion industry is its inability to respond
to rapidly changing consumer preferences. With a keen focus on design aesthetics and
expertise in identifying a trend, TCNS has been able to align to consumer preferences and
introduce new brands at regular time intervals and managed to scale them successfully.
Trade shows help keep tab on changing consumer preferences
TCNS organizes its own trade shows twice a year, showcasing new offerings for all brands
in the upcoming season. These trade shows are attended by more than 400 channel partners
including distributors, EBO store owners, LFS store managers and MBO stores owners. In
contrast to other trade shows that are organized primarily to secure orders, TCNS’s trade
shows intend to gather feedback on designs, quality, material and fit, and thus accordingly
make changes to its offerings for the new season.
Brainstorming of designs, subsequent screening lead to most preferred designs
A design team of 40-45 members (separate teams of ~12-13 members for Aurelia & ~27-30
members for W/Wishful) starts working around two months prior to the trade week in
bringing out new designs inspired by new stories/events across the world in the fashion
industry. Extensive discussions are carried out on every design story among the team, which
includes members from the design, production, sales and marketing teams, and valuable
inputs are incorporated into the designs. Before these designs are displayed in the trade
show, based on the feedback from the previous season, ~20% of internal dropping happens.
For the rest of the designs, 30-40% of fabric ordering is done and production is started. Rest
of the fabric ordering and production is done on considering feedback from the channel
partners in the trade show.
During the trade show, extensive feedbacks are collected on various designs from the channel
partners & modifications are carried out based on it. Based on the feedback and ratings, the
company finalizes the quantity and season for the product rollout. Such feedback-oriented
design process differentiates TCNS from peers & helps them come up with designs with high
acceptance levels. The final products are then rolled out in phases according to seasons like
monsoon (Jun-Aug), festive (Sep-Oct), winter (Nov-Dec) and summer (Mar-April).
Robust supply chain network provides strong back-end support
TCNS uses raw materials like printed fabrics, unprocessed fabrics and trim materials, which
are sourced from ~181 suppliers across India. It does not enter into long-term sourcing
agreements with supplies, rather issues purchase orders in line with sourcing needs. Based
on the supplier’s production capacity and quantities supplied in the previous season, the
company places orders for the upcoming season. TCNS also assists suppliers in developing
infrastructure and increasing productivity. To maintain standards at each step of sourcing
and the production cycle, it has implemented several quality-control mechanisms, and
regularly conducts inspections of fabrics sourced from suppliers, while supervising the
manufacturing plants. The company’s supply-chain strength is demonstrated from the fact
that it has not faced any attrition in its top-10 suppliers in the last decade.
Constantly refreshed product offerings provide a sense of novelty
It remains the company’s constant endeavor to refresh its product offerings through
innovative designs and optimizing the fit and sizing while adhering to higher quality and
latest trends. On an average, TCNS refreshes product offerings at an average interval of
2-3 weeks, which provides a sense of novelty every time a customer visits a store. Over a
year, the company launches ~2,000 products in various sizes, product materials and designs;
these tend to be widely acceptable as a lot of work is carried out in bringing a new design
including the R&D analysis to emphasize the fit and comfort of its products.
Capital efficient business model, low payback period ensures higher returns
Renting retail outlets & job work manufacturing limit upfront capex requirements
TCNS enters into lease or franchisee agreements for putting up new EBO stores and thus
cuts down on its upfront capex requirements on acquiring a real estate, building the
property and other installation expenses. As of 31st Mar’19, ~40% of its total 541 EBO stores
was on franchisee basis. This business model is also scalable as the company can expand its
geographical reach without locking capital and impacting the existing business and
cashflows. It also helps TCNS minimize losses and costs incurred at the time of shutting
down the non-performing outlets.
Additionally, TCNS completely outsources its production to third-party job workers with
whom it enters into contractual agreements on regular intervals and books the capacity in
advance. This helps the company increase its production capacity as required without
incurring additional capex. To ensure good quality, TCNS conducts regular supervision at
facilities of job workers through supervisors that are either stationed at such facilities or
visit these facilities for inspection at regular intervals.
Store-level breakeven achieved in 18-24 months of operations
Our rough calculation suggests a store-level EBITDA margin of ~28%. On an average,
depending upon the size & area of the store, it is expected to break even anywhere between
18-24 months; this is upon taking into consideration the ramp-up of revenues from the
store.
TCNS Clothing Ltd. Absolute – ADD Relative – Overweight 8% ATR in 18 Months
June 28, 2019 Page 12 of 24
Exhibit 18: Rough calculation suggests an average EBO store breaks even at 18-24
months from start of operations
Particulars Comments
Capex per store
Store Area (sq. ft) 1,000
Capex per sq. ft 3,000 Includes furniture & fixtures
Fixed Assets (Rs mn) 3.0
Inventory Requirement (Rs mn) 3.2 ~4 months inventory stocked
Total upfront capex needed (Rs mn) 6.2
Store level EBITDA
Revenues from EBO stores (FY19;
(Rs mn)) 5,625
EBO store count 503 Avg. store count of FY18 & FY19
Revenue per store (Rs mn) 11.2
Gross Profit (Rs mn) 7.4 Assumed company level gross margins
Rental Expenses (Rs mn) 2.2 Assumed total rental exp as % of EBO
sales for FY19
Employee & other expenses (Rs mn) 2.0 Assumed employee & other exp at 18% of
sales
EBITDA per store (Rs mn) 3.2
EBITDA margin 28%
Estimated Payback period 1.5 -2 years
Source: Company, Equirus Securities.
Like for other players in the industry, MBOs are the most profitable channel for TCNS while
LFS the least profitable. MBOs lead to outright sale to a channel partner without any
investments in capex or inventory; in contrast, LFS ― because of its contractual agreements
of revenue sharing and carrying of inventory on the company’s books ― has the least
margins.
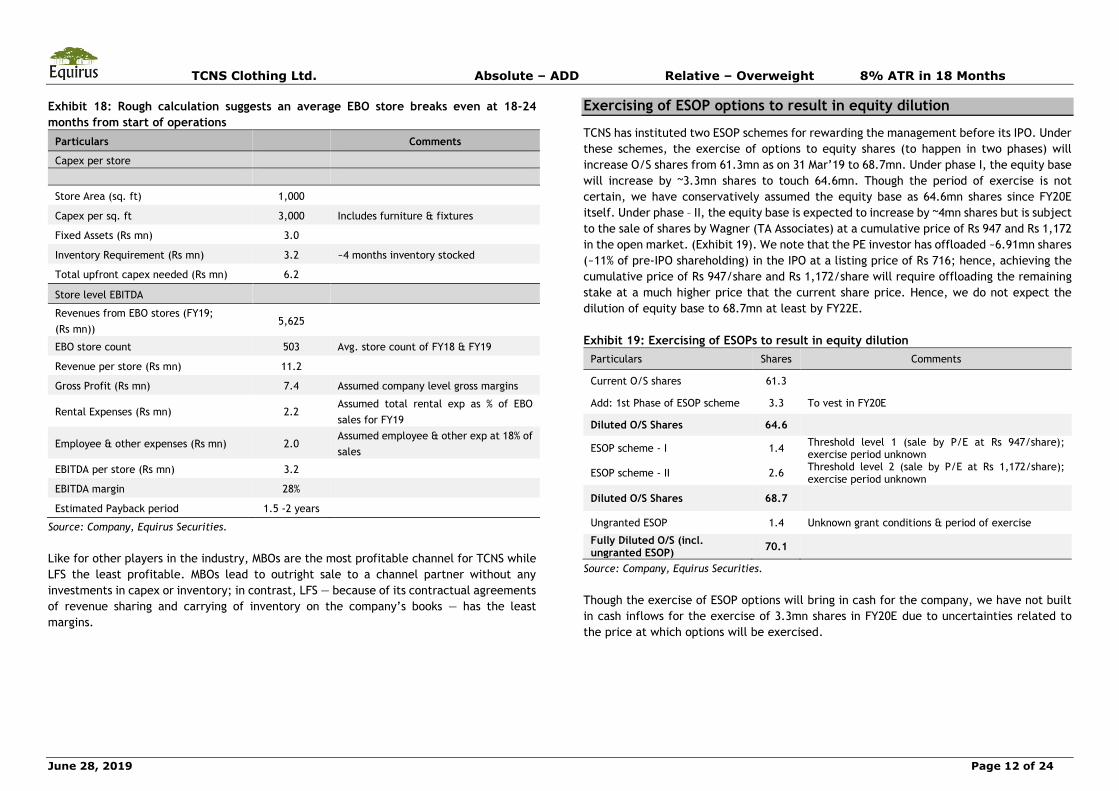
Exercising of ESOP options to result in equity dilution
TCNS has instituted two ESOP schemes for rewarding the management before its IPO. Under
these schemes, the exercise of options to equity shares (to happen in two phases) will
increase O/S shares from 61.3mn as on 31 Mar’19 to 68.7mn. Under phase I, the equity base
will increase by ~3.3mn shares to touch 64.6mn. Though the period of exercise is not
certain, we have conservatively assumed the equity base as 64.6mn shares since FY20E
itself. Under phase – II, the equity base is expected to increase by ~4mn shares but is subject
to the sale of shares by Wagner (TA Associates) at a cumulative price of Rs 947 and Rs 1,172
in the open market. (Exhibit 19). We note that the PE investor has offloaded ~6.91mn shares
(~11% of pre-IPO shareholding) in the IPO at a listing price of Rs 716; hence, achieving the
cumulative price of Rs 947/share and Rs 1,172/share will require offloading the remaining
stake at a much higher price that the current share price. Hence, we do not expect the
dilution of equity base to 68.7mn at least by FY22E.
Exhibit 19: Exercising of ESOPs to result in equity dilution
Particulars Shares Comments
Current O/S shares 61.3
Add: 1st Phase of ESOP scheme 3.3 To vest in FY20E
Diluted O/S Shares 64.6
ESOP scheme - I 1.4 Threshold level 1 (sale by P/E at Rs 947/share); exercise period unknown
ESOP scheme - II 2.6 Threshold level 2 (sale by P/E at Rs 1,172/share); exercise period unknown
Diluted O/S Shares 68.7
Ungranted ESOP 1.4 Unknown grant conditions & period of exercise
Fully Diluted O/S (incl. ungranted ESOP)
70.1
Source: Company, Equirus Securities.
Though the exercise of ESOP options will bring in cash for the company, we have not built
in cash inflows for the exercise of 3.3mn shares in FY20E due to uncertainties related to
the price at which options will be exercised.

TCNS Clothing Ltd. Absolute – ADD Relative – Overweight 8% ATR in 18 Months
June 28, 2019 Page 13 of 24
Financial Profile
Expansion of physical & online presence to drive 17% rev. CAGR over FY19-22E
TCNS has been astute in focusing on markets where demand for its products has been
picking up and was quick to add stores here much before competition. It has more-than-
doubled its EBO store count in the last five years to 541 stores at FY19-end. Going ahead,
we build in 70-75 store additions each over next 2-3 years in tier 2,3 & 4 cities which will
drive the future revenue growth. Additionally, backed by the experience of operating stores
in Nepal, Sri Lanka and Mauritius, the company plans to enhance its international presence
to other Asian countries which are largely similar to Indian markets. However, these
currently form a very small portion of revenues and adding stores in foreign countries would
not add meaningfully to the topline.
Exhibit 20: EBO store additions to continue at same pace as in the past
Source: Company, Equirus Securities
Online medium ― A platform to reach undiscovered places
Apart from its brick & mortar presence, TCNS sells products through online retailers like
Myntra, Jabong and Amazon and also through its own websites wforwoman.com and
shopforaurelia.com. There is a massive surge seen in demand for branded women’s ethnic
wear products in smaller cities and towns which is catered to through online channels.
Presence on the online platform helps the company identify demand trends of a particular
region, thus providing key inputs for opening a new store in a specific region. Online
revenues for TCNS have grown at a robust ~70% CAGR over FY16-FY19, albeit off a low base,
and contributed ~14% of its overall revenues in FY19 (FY16: ~7%). We expect strong growth
in online revenues to continue ahead as well given the rising preferences of online shopping
and an enhanced consumer base that online channels provide to the company.
Blocks falling in place for Wishful
TCNS has seen strong growth in its W and Aurelia brand revenues over the last 5 years;
however, it could not scale up in its Wishful brand due to lack of quality suppliers which
can manufacture complex products like Wishful. The company has recently tied up with 3-
4 manufacturing units that match the required skillset and manufacturing capabilities
required to produce Wishful garments. With supply constraints resolved, we expect Wishful
revenues to pick up as management plans to increase the brand’s presence in its W stores.
TCNS opened four new Wishful stores in FY19, taking the total to 5 stores. The shop-in-shop
concept within W stores is working better than exclusive Wishful stores; hence, the
company is not likely to open exclusive Wishful stores going ahead.
Complementary product line extension ― a new growth driver
TCNS has recently added jewelry as a category extension to its product offerings. These
include finger rings, earrings & necklaces with a price range of Rs 300 to Rs 2,000. It has
also added footwear on pilot basis in some stores. These complementary products being a
very small part of revenues cannot be a significant growth diver for total revenues but can
surely provide some boost to overall revenue growth.
New brands acquisition ― Looking for inorganic growth
Apart from organic growth coming from scaling up existing brands, the company is also
actively looking for inorganic growth opportunities in the form of new brand acquisitions or
acquiring a new business. The company’s target is to acquire business that has high
customer traction; but lacks in terms of either management bandwidth or financial strength
or inefficiencies in managing the scale and thus are not able to ramp up. Such businesses
have the potential of ramping up quickly and thus match the value proposition of the
company’s existing brands. While the potential business necessarily needs to be a women’s
wear segment, it could be in the category of western wear, footwear, or even women
undergarments.
Overall revenues to 17% CAGR over FY19-22E
TCNS saw some slowdown in FY19 revenues due to the following: (1) 1H was impacted by a
high base of H1FY18 (pre-GST sales) and ERP implementation. (2) 2H was hit by a sharp dip
in its sales of airport stores due to Jet Airways crisis (N.B.: Airport stores contribute ~10%
of EBO revenues) and a reduction in EOSS period which somewhat impacted sales.
305 381 465 541 616 686 756
7076
84
76 75 7070
0
10
20
30
40
50
60
70
80
90
0
100
200
300
400
500
600
700
800
FY16 FY17 FY18 FY19 FY20E FY21E FY22E
EBO stores LHS Store Additions - RHS

TCNS Clothing Ltd. Absolute – ADD Relative – Overweight 8% ATR in 18 Months
June 28, 2019 Page 14 of 24
Going ahead, we expect revenues to be impacted in near term due to prevailing demand
sluggishness & muted recovery of airport store revenues. However, these issues seem to be
temporary & are expected to be resolved soon. We expect overall revenues to grow at a
17% CAGR over FY19-FY22E driven by (1) rising revenues from existing stores, (2) addition
of 70-75 stores each year over the next two years, (3) continued robust growth in online
revenues, (4) resolution of supply constraints for Wishful products leading to strong growth
in the brand’s revenues, and (5) additional revenue stream coming from complementary
products. At a brand level, we expect W/Aurelia/Wishful revenues to grow at 18%/15%/21%
CAGR over FY19-FY22E.
Exhibit 21: Brand-wise revenue growth estimates
Particulars (In Rs Mn) FY18 FY19 FY20E FY21E FY22E CAGR (19-22E)
W Revenues 5,748 6,888 8,093 9,550 11,297 18%
Growth YoY 34% 20% 18% 18% 18%
Aurelia Revenues 3,358 3,903 4,449 5,117 5,900 15%
Growth YoY 55% 16% 14% 15% 15%
Wishful Revenues 865 689 827 1,008 1,230 21%
Growth YoY 54% -20% 20% 22% 22%
Source: Company, Equirus Securities
Exhibit 22: Overall revenues to grow at 17% CAGR over FY19-22E
Source: Company, Equirus Securities
Rise in operational efficiencies to drive 18% adj. EBITDA CAGR over FY19-
FY22E
In the past, TCNS’s gross margins have remained very volatile driven by GST-related
changes, implementation of Ind-AS 115 and reclassification of some line items. Gross
margins expanded ~480bps over FY15-FY17 to reach ~81% driven by effective sourcing,
better terms for job work and scale benefits coming in. However, in FY18, implementation
of GST ― that taxed apparels below MRP of Rs 1,000 at 5% and above MRP of Rs 1,000 at
12% ― led to a major reshuffling in apparel prices, resulting in some gross margin
contraction. Additionally, in FY19, some costs like fabrication charges, product
development charges and consumption of packaging materials were moved from other
expenses to COGS, leading to stabilization of gross margins at 66%.
Going ahead, we expect flattish gross margins over FY19-22E as benefits of shifting of
production out of the NCR region (currently ~10% manufacturing has shifted out of NCR);
will take some time to accrue.
Exhibit 23: Modest gross margin expansion ahead as gains from shifting production
out of NCR will take time to accrue
Source: Company, Equirus Securities
4.9 7.0 10.0 11.5 13.4 15.7 18.4
61%
44%42%
15% 16%17% 18%
0%
10%
20%
30%
40%
50%
60%
70%
0
2
4
6
8
10
12
14
16
18
20
FY16 FY17 FY18 FY19 FY20E FY21E FY22E
Revenues (In Rs Bn) Growth YoY
3.8 5.7 6.5 7.6 8.8 10.4 12.2
78.6% 81.1%
65.7% 66.0% 66.1% 66.2% 66.2%
0%
10%
20%
30%
40%
50%
60%
70%
80%
90%
0
2
4
6
8
10
12
14
FY16 FY17 FY18 FY19 FY20E FY21E FY22E
Gross Profit (In Rs Bn) Gross Margin

TCNS Clothing Ltd. Absolute – ADD Relative – Overweight 8% ATR in 18 Months
June 28, 2019 Page 15 of 24
Lower discounting, better operating efficiencies largely drive EBITDA growth
Reduction in EOSS: TCNS is making constant efforts to reduce its EOSS period and increase
the share of full-price sales as heavy discounts offered in EOSS hurt its margins. For the
monsoon season in FY19, it reduced its EOSS period by one week; this did hurt its sales
somewhat but was beneficial to its margins. Going ahead, it plans to reduce the EOSS period
by a week for both seasons, which will aid margins to some extent.
Rise in operating efficiencies: TCNS has added ~160 EBO stores and ~632 LFS stores in last
two years, which are expected to achieve higher operating efficiencies with rising footfalls
and increasing sales. Additionally, several new stores to be added in the near future will be
in tier 2,3, 4 cities that will have lower rent and other fixed costs, resulting in faster
breakeven and higher profitability.
In the past, due to ESOP expenses, employee costs have remained very volatile. A major
part of ESOP-related expenses have been incurred in the past, and hence such expenses are
unlikely to significantly hurt margins in the future. Adjusted for ESOP expenses, EBITDA has
grown at a 31% CAGR over FY16-FY19. We expect adj. EBITDA/reported EBITDA to grow at
18%/21% CAGR over FY19-FY22E mainly driven by a rise in operating efficiencies.
Exhibit 24: ESOP expenses have hit profitability in the past; less impact to be felt in
future
Source: Company, Equirus Securities
Exhibit 25: Adj. EBITDA to grow at ~18% CAGR with ~60bps EBITDAM expansion over
FY19-22E
Source: Company, Equirus Securities
Strong cashflow generation to continue
Despite continuous store addition in the past, TCNS has consistently generated positive
operating cashflows mainly due to improving profitability and a strict control over working
capital. Except for FY17, where higher tax payment on account of share-based payments
resulted in lower OCF generation, the company’s operating cashflows have continuously
seen an uptrend, in line with revenue growth. Going ahead, with normalization of the tax
rate at ~35% (as tax benefits of ESOP were largely taken in FY19), capex pegged at
~Rs 450-500mn each for next 3 years, and limited growth in WC requirements, we expect
strong OCF generation of Rs 0.9bn/1.2bn in FY20E/FY21E. With nil debt on books, FCF
generation too will remain stronger at Rs 0.3/0.7bn in FY20E/FY21E.
898
737
215165
100 9050
0
100
200
300
400
500
600
700
800
900
1,000
FY16 FY17 FY18 FY19 FY20E FY21E FY22E
ESOP Expenses (In Rs Mn)
0.9 1.5 1.8 1.9 2.3 2.7 3.2
17.7%
21.4%
17.7%16.8% 17.2%
17.3%17.4%
0%
5%
10%
15%
20%
25%
0.0
0.5
1.0
1.5
2.0
2.5
3.0
3.5
FY16 FY17 FY18 FY19 FY20E FY21E FY22E
Adj. EBITDA (In Rs Bn) EBITDAM

TCNS Clothing Ltd. Absolute – ADD Relative – Overweight 8% ATR in 18 Months
June 28, 2019 Page 16 of 24
Exhibit 26: Limited capex & strict control on WC will lead to strong cashflow generation
Source: Company, Equirus Securities
Increase in equity base, high cash balance to drag ROE; core ROIC to say strong at ~26%
Apart from a marginal increase in the equity base (due to increase in equity base from
61.3mn shares to 64.6mn on exercise of ESOP options), ROE will be impacted by high
cashflow generation and no plans of declaring dividend as TCNS is looking for inorganic
growth opportunities (some brand/business acquisition). We expect ROE to normalize from
25% in FY19 to 20% in FY20 & FY21 each while adj. core ROIC is expected to remain strong
at ~26% over next 3 years.
Exhibit 27: ROE/Adj. core ROIC to normalize to 20%/26% in FY20 & FY21 resp.
Source: Company, Equirus Securities
Working capital days to increase marginally
TCNS has very strict control over its working capital ― a key concern for most peers in the
fashion industry. There was a marginal increase in WC days in FY19 due to (1) some rise in
its RM inventory on account of shifting of production out of NCR and (2) a decline in payable
days as early payment was made to creditors to gain some extra benefits. We have built in
some increase in WC days going ahead owing to (a) the current liquidity crunch in the
market and (b) a marginal increase in receivable days with some leeway given to
distributors to boost sales. Though the increase would be temporary, we expect WC days
to rise from 103 in FY19 to ~108 in FY20E-21E each.
Exhibit 28: Marginal increase in NWC days
Source: Company, Equirus Securities
344251
413
906 894
1,248
1,505
154
-13
142
521
302
732
989
-200
0
200
400
600
800
1,000
1,200
1,400
1,600
FY16 FY17 FY18 FY19 FY20E FY21E FY22E
OCF (In Rs Mn) FCF (In Rs Mn)
10%
28%25%
20% 20% 20%
10%
29%
25% 26% 26%28%
0%
5%
10%
15%
20%
25%
30%
35%
FY17 FY18 FY19 FY20E FY21E FY22E
ROE Core ROIC
1.7 2.6 3.2 4.0 4.7 5.6
9096
103108 108 109
0
20
40
60
80
100
120
0
1
2
3
4
5
6
FY17 FY18 FY19 FY20E FY21E FY22E
NWC (in Rs Bn) NWC days - RHS

TCNS Clothing Ltd. Absolute – ADD Relative – Overweight 8% ATR in 18 Months
June 28, 2019 Page 17 of 24
Forecast & key assumptions
• Overall revenues to grow at 17% CAGR over FY19-FY22E.
• W/Aurelia/Wishful revenues expected to grow at 18%/15%/21% CAGR over FY19-FY22E.
• We expect 75 EBO stores addition in FY20E and 70 stores in FY21E. Capex would be in
the range of Rs 420-450mn per annum over next 3 years.
• Gross margins are expected to see remain flattish while adj. EBITDA margin, on account
of operational efficiencies, is expected to grow by ~60bps over FY19-FY22E to reach
17.4% in FY22E.
Exhibit 29: Key Assumptions
Particulars (In Rs Mn) FY19 FY20E FY21E FY22E
W Revenues 6,888 8,093 9,550 11,297
Aurelia Revenues 3,903 4,449 5,117 5,900
Wishful Revenues 689 827 1,008 1,230
Capex 217 450 420 420
NWC Days 103 108 108 109
Source: Company, Equirus Securities
Investment risk & concerns
Inability to anticipate & respond to change in fashion trends & consumer preferences:
TCNS has a strong track record of bringing innovative designs across its brands in an ever-
changing fashion market, leading to high acceptance levels. However, any failure to
anticipate or respond to such changing customer preferences and design new products can
hurt revenues & margins.
Concentration of job work manufacturing units: TCNS outsources its entire manufacturing
to third party job work manufacturing units. Despite shifting ~10% of manufacturing out of
the NCR region in FY19, ~90% of manufacturing is still carried out in the region. Any
political, economic or natural unrest in the NCR region can disrupt manufacturing and thus
adversely hit revenues and margins.
Delay in stores expansion & sales pickup: A major part of future revenue growth will come
from store expansion in tier 2,3, 4 cities and a subsequent pick up in sales from these stores.
Any delay in expansion of retail outlets and corresponding pickup in sales from newer and
existing outlets can negatively affect TCNS’s revenue growth.
Corporate Governance
Key highlights on corporate governance based on TCNS’s RHP:
• Company accounts are audited by M/s. Deloitte Haskins & Sells, CA. The reports and
findings of the Internal Auditor and the internal control system are periodically
reviewed.
• TCNS is a professionally managed company. Onkar Singh Pasricha and Arvinder Singh
Pasricha are promoters of the company, with more than 20 years of experience in the
apparel industry.
• Anant Daga, the MD, has been associated with TCNS for more than seven years, and
prior to that worked with Reebok India. TCNS’ other senior leadership team comprising
nine heads of department have an average of 15 years of experience in the apparel
and clothing industry.
• The Board of Directors has an optimum combination of Executive, Non-Executive and
Independent Directors, including women directors. The Board comprises one whole-
time directors (MD), one Non-Executive Director and three Independent Directors.
Except for the non-executive Director, all other directors (including MD) are liable to
retire by rotation.
• TCNS has not paid any dividend till date as, with the accumulated cash, it plans to
acquire a new brand or a business in the women’s wear industry. Also, it continues to
expand its presence by adding 70-75 stores per annum in new areas/geographies. All
these will utilize existing cash with the company & might even necessitate TCNS to
take on some debt.
• Related Party Transactions: The company has entered into related party transactions
with TCNS Ltd., a group company which is into the business of providing job work
activities for production of women’s ethnic wear apparels, lease of EBO stores & sale
and purchase of goods. The following table elaborates the payments made by the
company to TCNS Ltd. from FY15 to FY18 for fabrication services provided.
Exhibit 30: Fabrication charges paid by TCNS to group company
Particulars (In Rs Mn) FY15 FY16 FY17 FY18
Fabrication costs paid to group co. 284 331 379 393
as % of total fabrication costs 50% 39% 30% 26%
as % of total expenses 20% 6.6% 5.8% 5.6%
Trade Payables to TCNS Ltd. 30 25 70 80
as % of total trade payables 4% 2% 6% 7%
Source: TCNS RHP, Equirus Securities

TCNS Clothing Ltd. Absolute – ADD Relative – Overweight 8% ATR in 18 Months
June 28, 2019 Page 18 of 24
Peer Analysis
No listed peer in women’s ethnic wear space; BIBA, Fab India, Global Desi ―
the closest unlisted peers
TCNS is the only listed player in the women’s ethnic wear apparel market. Its closest peers would be BIBA, Fab India and Global Desi.
Revenue growth for TCNS has been the highest amongst its peers over FY16-FY18. TCNS,
BIBA and Global Desi (HAD) generated almost similar revenues in FY16; however, over the
next two years, TCNS’s revenues grew at staggering rate of 43% CAGR while BIBA/Global
Desi grew at 13%/8%. Fab India, which was almost double the size of TCNS in revenues in
FY16, grew at 8% CAGR; TCNS with a robust 43% CAGR almost reached the size of Fab India
in FY18.
Return ratios for TCNS have been higher than its peers driven by strict control on working
capital and lower invested capital than peers.
Exhibit 31: TCNS has superior financials amongst its peers
Particulars (In Rs Mn) TCNS Clothing BIBA Fab India Global Desi
Comments FY16 FY17 FY18 FY19 FY16 FY17 FY18 FY16 FY17 FY18 FY16 FY17 FY18
Revenue 4,854 7,009 9,971 11,480 4,278 4,573 5,435 9,105 10,277 10,576 4,139 4,521 4,819 For the period of FY16-18, TCNS had the highest growth amongst peers Growth (%) 61% 44% 42% 15% 13% 7% 19% 20% 13% 3% 29% 9% 7%
EBITDA 860 1,499 1,769 1,933 1,059 492 983 1,637 1,754 1,812 631 532 427
EBITDA Margin (%) 18% 21% 18% 17% 25% 11% 18% 18% 17% 17% 15% 12% 9% TCNS' EBITDA margins in-line with peers
PAT -415 158 981 1,314 608 206 478 931 901 1,181 315 236 126
PAT Margin (%) - 2% 10% 11% 14% 4% 9% 10% 9% 11% 8% 5% 3%
CFO 344 251 413 906 418 -325 -106 837 1,259 1,363 326 87 229 CFO & CFO/EBITDA (%) highest for FabIndia. TCNS has a scope of improvement in reducing its WC days. CFO/EBITDA (%) 40% 17% 23% 47% 40% NA NA 51% 72% 75% 52% 16% 54%
Receivable Days 48 52 57 57 19 21 23 3 2 4 15 17 24
Payable Days 64 57 42 37 20 35 25 12 9 12 28 41 40
Inventory Days 103 101 82 87 140 185 187 100 95 92 75 107 96
Cash Conversion Cycle 88 96 98 108 139 171 185 91 88 84 63 83 79 Cash conversion cycle largely in-line with peers
Total Debt 382 88 2 0 7 465 929 337 922 544 87 328 317
Cash & Cash Equivalents 103 132 512 1,608 126 21 61 136 137 166 376 456 471
Net D/E 0.6 0.0 -0.1 -0.3 0.0 0.2 0.3 0.1 0.1 0.1 -0.1 0.0 -0.1
ROE (%) -52% 10% 28% 25% 28% 8% 17% 25% 18% 19% 14% 9% 5% Despite high cash, ROE ratio highest for TCNS
ROIC (%) -26% 8% 27% 24% 28% 8% 15% 23% 17% 18% 13% 9% 5% ROIC ratio highest for TCNS
Source: MCA, Equirus Securities

TCNS Clothing Ltd. Absolute – ADD Relative – Overweight 8% ATR in 18 Months
June 28, 2019 Page 19 of 24
Valuations
We like TCNS because of (1) its leadership position in branded women’s ethnic wear market,
(2) strong and highly penetrated retail network with a pan-India presence, (3) robust supply
chain network (4) debt-free balance sheet, (5) highly-controlled working capital, and (6)
superior return ratios.
At CMP of Rs 781, the stock trades at 38x/33x P/E of FY20E/21E. When compared with the
closest listed industry peers, on an EV/EBITDA basis (as P/E ratio will be distorted due to
different capital structure and number of O/S shares of peer companies), TCNS trades at
an EV/EBITDA of 21x/17.4x for FY20E/FY21E, which is much higher than the median industry
EV/EBITDA of 14x/11x for Indian peers & 9.5x/9x for global peers for FY20E/21E.
We believe that the stock is expensive in light of a few concerns related to the overall
sluggish demand, liquidity crunch in the market and a slowdown in airport sales (~10% of
revenues) with Jet Airways shutting shop. However, acquisition of a brand/business with a
strong growth potential and subsequent scale up in line with its existing brands remains an
upside risk to our estimates.
We initiate coverage on the stock with ADD with a PT of Rs 872 and value it at 35x P/E to
Dec’20 TTM EPS of Rs 25.
Some of the P/E deals in the sector in the past
Attracted by the women’s apparel industry growth, TCNS Ltd. & other industry players have
seen some private equity investors infusing funds in the past. The following table shows
some of such P/E deals in TCNS & other industry players:
Date Target Trans. Type
Buyer Seller Deal Value
($ Mn)
18-10-2011 TCNS Clothing P/E Matrix Partners India LLC - 12
09-07-2013 TCNS Clothing P/E Matrix Partners India LLC - 4.9
08-08-2016 TCNS Clothing P/E TA Associates Advisory Pvt Ltd.
Matrix Partners India LLC
139.1
04-09-2013 Biba Apparels Pvt. Ltd.
P/E Warburg Pincus India Pvt. Ltd., Faering Capital India Evolving Fund
Future Consumer Ent. Investment Arm
51.1
01-04-2014 Ritu Kumar P/E Everstone Cap. Ritu Kumar 16.6
01-09-2015 Creative Lifestyle Pvt. Ltd.
P/E Aditya Birla P/E Sunrise Fund
- 5.3
Source: VCCEdge, Equirus Securities
Exhibit 32: Relative valuation of TCNS with other closest listed Indian & global peers
Company Unit Price (Rs.) M Cap (Bn) Sales CAGR
EBITDA Margin (%) EPS CAGR Net D/E P/E EV/EBITDA ROE ROIC
Indian Peers (FY19-21E) FY19 FY20E FY21E (FY19-21E) FY19 FY19 FY20E FY21E FY19 FY20E FY21E FY19 FY20E FY21E FY19
Page Ind. INR 20,470 2,28 10.0% 21.6% 21.8% 22.1% 11.6% 0.0 58.0 49.8 41.7 37.1 32.1 27.2 49% 51% 50% 43%
ABFRL INR 205 158 8.9% 6.8% 7.8% 8.6% 6.7% 0.8 49.3 56.8 60.3 30.6 23.4 18.8 25% 17% 21% 15%
Arvind fashions INR 689 40 17.2% 6.2% 7.1% 7.7% 144.8% 0.7 242 43.5 31.0 16.9 13.3 10.3 2% 8% 10% 13%
Future Lifestyle INR 445 86 24.8% 9.2% 9.2% 7.9% 16.0% 0.4 45.8 39.6 29.4 17.7 14.4 9.9 11% 12% 14% 11%
Shoppers Stop INR 475 42 7.8% 6.9% 7.6% 8.1% 33.9% 0.0 64.3 33.3 26.8 16.9 13.5 11.0 7% 12% 13% 6%
Kewal Kiran INR 1,150 14 4.7% 22.4% 23.1% 23.7% 6.2% -0.1 17.7 16.2 14.7 12.2 11.1 10.0 19% 20% 21% 14%
Median 9.5% 8.0% 8.5% 8.3% 13.8% 0.2 53.6 41.6 30.2 17.3 13.9 10.6 15% 15% 17% 14%
Global Peers
H&M SEK 147 2,43 3.9% 12.0% 11.9% 12.1% 2.5% 0.1 19.3 19.6 18.3 10.0 9.5 9.0 20% 22% 24% 16%
Inditex EUR 25 77 4.4% 20.7% 27.3% 27.4% 9.2% 0.0 22.8 20.5 19.1 13.3 9.3 8.6 27% 25% 26% 21%
Median 4.2% 16.3% 19.6% 19.8% 5.8% 0.1 21.0 20.1 18.7 11.7 9.4 8.8 23% 24% 25% 18%
TCNS Clothing 782 49 17.2% 15.4% 16.4% 16.7% 8.6% 0.0 38.4 38.3 32.6 26.3 21.0 17.4 25% 19% 19% 30%
Source: Bloomberg consensus figures, Equirus Securities

TCNS Clothing Ltd. Absolute – ADD Relative – Overweight 8% ATR in 18 Months
June 28, 2019 Page 20 of 24
Exhibit 33:TTM P/E vs. 1 year forward EPS Growth
Exhibit 34:TTM EV/EBITDA vs. 1 year forward EBITDA Growth
Source: Equirus Securities
Exhibit 35:TTM P/B vs. 2 year forward RoE
Source: Equirus Securities
Key Management profile
Onkar Singh Pasricha, aged 68 years, is the Chairman, executive Director and one of the
Promoters of our Company. He holds a bachelor’s degree in technology in electrical
engineering from Indian Institute of Technology, Delhi. He has been on our Board since
December 3, 1997 and was last re-appointed on January 5, 2018. He has more than 40 years
of experience in the apparel industry.
Anant Kumar Daga, aged 42 years, is the Managing Director of our Company. He holds a
bachelor’s degree in commerce from the University of Calcutta and a post-graduate diploma
in management from Indian Institute of Management, Ahmedabad. He joined our Company
as a Chief Executive Officer with effect from March 16, 2010 and has been on the Board
since September 7, 2016. Prior to joining our Company, Anant Kumar Daga has worked with
Reebok, India as director (sales) and with ICICI bank. He also features in the Economic
Times’ 40 under 40 list of India’s hottest business leaders for 2017 and has been awarded
the “Brand Professional of the Year Award” at the CMAI Apex Awards 2017.
26x
34x
30x
38x
42x
7%
8%
9%
10%
400
500
600
700
800
900
1,000
1,100
Jul-
18
Sep-1
8
Nov-
18
Jan-1
9
Mar
-19
May
-19
Jul-
19
Sep-1
9
Nov-
19
Jan-2
0
Mar
-20
May
-20
Jul-
20
Sep-2
0
Nov-
20
EPS Growth
20%
22%
24%
26%
28%
30%
20,000
30,000
40,000
50,000
60,000
70,000
80,000
Aug-
18
Oct
-18
Dec
-18
Feb
-19
Apr-
19
Jun-1
9
Aug-
19
Oct
-19
Dec
-19
Feb
-20
Apr-
20
Jun-2
0
Aug-
20
Oct
-20
Dec
-20
24x
18x
21x
27x
30xEBITDAGrowth
0%
5%
10%
15%
20%
25%
30%
400
600
800
1,000
1,200
1,400
Aug-
18
Oct
-18
Dec
-18
Feb
-19
Apr-
19
Jun-1
9
Aug-
19
Oct
-19
Dec
-19
Feb
-20
Apr-
20
Jun-2
0
Aug-
20
Oct
-20
Dec
-20
RoE
6x
7x
8x
10x
9x

TCNS Clothing Ltd. Absolute – ADD Relative – Overweight 8% ATR in 18 Months
June 28, 2019 Page 21 of 24
Consolidated Quarterly Earnings Forecast and Key Drivers Rs in Mn 1Q19A 2Q19A 3Q19A 4Q19A 1Q20E 2Q20E 3Q20E 4Q20E 1Q21E 2Q21E 3Q21E 4Q21E FY19A FY20E FY21E FY22E
Revenue 2,366 3,205 3,002 2,907 3,142 3,543 3,449 3,235 3,840 4,154 4,013 3,668 11,480 13,369 15,675 18,427 Raw Material 757 1,098 946 1,099 1,052 1,205 1,155 1,120 1,279 1,421 1,344 1,254 3,899 4,532 5,298 6,214
Employee Cost 339 374 379 346 389 393 415 373 441 459 456 459 1,438 1,571 1,814 2,068
Other Expenditure 979 1,163 1,170 1,062 1,219 1,306 1,323 1,226 1,472 1,480 1,487 1,510 4,374 5,074 5,949 6,984 EBITDA 292 570 507 400 481 639 556 517 648 795 725 445 1,768 2,193 2,614 3,162 Depreciation 51 53 55 63 73 73 73 73 96 96 96 96 222 293 382 475 EBIT 241 517 452 336 408 565 483 444 553 699 630 350 1,546 1,900 2,232 2,687 Interest 1 1 0 3 2 2 2 2 2 2 2 2 5 7 7 7 Other Income 18 19 21 16 28 32 31 29 35 37 36 33 75 120 141 166 PBT 259 536 472 350 434 595 512 471 586 735 664 381 1,616 2,013 2,366 2,846 Tax 54 123 102 23 150 205 177 163 202 254 229 131 302 694 816 982 PAT bef. MI & Assoc. 205 412 371 327 284 390 335 309 384 481 435 249 1,314 1,318 1,549 1,864 Minority Interest 0 0 0 0 0 0 0 0 0 0 0 0 0 0 0 0 Profit from Assoc. 0 0 0 0 0 0 0 0 0 0 0 0 0 0 0 0 Recurring PAT 205 412 371 327 284 390 335 309 384 481 435 249 1,314 1,318 1,549 1,864 Extraordinaries 0 0 0 0 0 0 0 0 0 0 0 0 0 0 0 0 Reported PAT 205 412 371 327 284 390 335 309 384 481 435 249 1,314 1,318 1,549 1,864
EPS (Rs) 3.17 6.38 5.74 5.06 4.40 6.04 5.19 4.78 5.94 7.45 6.74 3.86 20.35 20.41 23.99 28.86
Key Drivers
W revenues - - - - - - - - - - - - 6,888 8,093 9,550 11,297 Aurelia Revenues - - - - - - - - - - - - 3,903 4,449 5,117 5,900 Wishful revenues - - - - - - - - - - - - 689 827 1,008 1,230 - - - - - - - - - - - - - - - - - - - - - - - - - - - - - - - - - -
- - - - - - - - - - - - - - - - -
Sequential Growth (%)
Revenue -8 % 35 % -6 % -3 % 8 % 13 % -3 % -6 % 19 % 8 % -3 % -9 % - - - - Raw Material -24 % 45 % -14 % 16 % -4 % 14 % -4 % -3 % 14 % 11 % -5 % -7 % - - - - EBITDA -10 % 95 % -11 % -21 % 20 % 33 % -13 % -7 % 25 % 23 % -9 % -39 % - - - - EBIT -12 % 115 % -13 % -26 % 21 % 39 % -15 % -8 % 25 % 27 % -10 % -44 % - - - - Recurring PAT -17 % 102 % -10 % -12 % -13 % 37 % -14 % -8 % 24 % 26 % -10 % -43 % - - - -
EPS -23 % 102 % -10 % -12 % -13 % 37 % -14 % -8 % 24 % 26 % -10 % -43 % - - - -
Yearly Growth (%)
Revenue 4 % 20 % 22 % 13 % 33 % 11 % 15 % 11 % 22 % 17 % 16 % 13 % 15 % 16 % 17 % 18 % EBITDA -28 % 35 % 26 % 24 % 65 % 12 % 10 % 29 % 35 % 25 % 30 % -14 % 14 % 24 % 19 % 21 % EBIT -35 % 35 % 25 % 24 % 69 % 9 % 7 % 32 % 36 % 24 % 30 % -21 % 11 % 23 % 17 % 20 % Recurring PAT 1 % 82 % 36 % 32 % 39 % -5 % -10 % -6 % 35 % 23 % 30 % -19 % 44 % 0 % 18 % 20 %
EPS -18 % 64 % 35 % 24 % 39 % -5 % -10 % -6 % 35 % 23 % 30 % -19 % 34 % 0 % 18 % 20 %
Margin (%)
EBITDA 12 % 18 % 17 % 14 % 15 % 18 % 16 % 16 % 17 % 19 % 18 % 12 % 15 % 16 % 17 % 17 % EBIT 10 % 16 % 15 % 12 % 13 % 16 % 14 % 14 % 14 % 17 % 16 % 10 % 13 % 14 % 14 % 15 % PBT 11 % 17 % 16 % 12 % 14 % 17 % 15 % 15 % 15 % 18 % 17 % 10 % 14 % 15 % 15 % 15 %
PAT 9 % 13 % 12 % 11 % 9 % 11 % 10 % 10 % 10 % 12 % 11 % 7 % 11 % 10 % 10 % 10 %

TCNS Clothing Ltd. Absolute – ADD Relative – Overweight 8% ATR in 18 Months
June 28, 2019 Page 22 of 24
Consolidated Financials
P&L (Rs Mn) FY19A FY20E FY21E FY22E Balance Sheet (Rs Mn) FY19A FY20E FY21E FY22E Cash Flow (Rs Mn) FY19A FY20E FY21E FY22E
Revenue 11,480 13,369 15,675 18,427 Equity Capital 123 129 129 129 PBT 1,616 2,013 2,366 2,846
Op. Expenditure 9,711 11,176 13,061 15,266 Reserve 6,063 7,381 8,892 10,698 Depreciation 222 293 382 475
EBITDA 1,768 2,193 2,614 3,162 Networth 6,186 7,511 9,021 10,827 Others 0 0 0 0
Depreciation 222 293 382 475 Long Term Debt 0 0 0 0 Taxes Paid 302 694 816 982
EBIT 1,546 1,900 2,232 2,687 Def Tax Liability 144 169 194 219 Change in WC (630) (717) (684) (834)
Interest Expense 5 7 7 7 Minority Interest 0 0 0 0 Operating C/F 906 894 1,248 1,505
Other Income 75 120 141 166 Account Payables 1,150 1,392 1,632 1,918 Capex (273) (547) (470) (470)
PBT 1,616 2,013 2,366 2,846 Other Curr Liabi 379 418 490 558 Change in Invest (116) (50) (50) (50)
Tax 302 694 816 982 Total Liabilities & Equity 7,859 9,489 11,337 13,523 Others 0 0 0 0
PAT bef. MI & Assoc. 1,314 1,318 1,549 1,864 Net Fixed Assets 592 749 787 732 Investing C/F (389) (597) (520) (520)
Minority Interest 0 0 0 0 Capital WIP 3 50 50 50 Change in Debt (2) 0 0 0
Profit from Assoc. 0 0 0 0 Others 877 977 1,077 1,177 Change in Equity 557 7 0 0
Recurring PAT 1,314 1,318 1,549 1,864 Inventory 2,741 3,296 3,865 4,544 Others 25 25 (14) (33)
Extraordinaires 0 0 0 0 Account Receivables 1,807 2,198 2,577 3,029 Financing C/F 580 32 (14) (33)
Reported PAT 1,314 1,318 1,549 1,864 Other Current Assets 230 282 331 389 Net change in cash 1,097 329 714 952
FDEPS (Rs) 20.3 20.4 24.0 28.9 Cash 1,608 1,937 2,651 3,602 RoE (%) 25 % 19 % 19 % 19 %
DPS (Rs) 0.0 0.0 0.5 0.8 Total Assets 7,859 9,489 11,337 13,523 RoIC (%) 24 % 19 % 18 % 18 %
CEPS (Rs) 25.1 25.0 29.9 36.2 Non-cash Working Capital 3,249 3,967 4,651 5,485 Core RoIC (%) 30 % 25 % 25 % 26 %
FCFPS (Rs) 8.5 4.7 11.3 15.3 Cash Conv Cycle 103.3 108.3 108.3 108.6 Div Payout (%) 0 % 0 % 3 % 3 %
BVPS (Rs) 100.9 116.3 139.7 167.6 WC Turnover 3.5 3.4 3.4 3.4 P/E 38.4 38.3 32.6 27.1
EBITDAM (%) 15 % 16 % 17 % 17 % FA Turnover 19.3 16.7 18.7 23.6 P/B 7.7 6.7 5.6 4.7
PATM (%) 11 % 10 % 10 % 10 % Net D/E (0.3) (0.3) (0.3) (0.3) P/FCFF 91.8 167.2 68.9 51.0
Tax Rate (%) 19 % 35 % 35 % 35 % Revenue/Capital
Employed 2.1 1.9 1.9 1.8 EV/EBITDA 26.3 21.0 17.4 14.1
Sales Growth (%) 15 % 16 % 17 % 18 % Capital Employed/Equity 1.0 1.0 1.0 1.0 EV/Sales 4.0 3.5 2.9 2.4
FDEPS Growth (%) 34 % 0 % 18 % 20 % Dividend Yield (%) 0.0 % 0.0 % 0.1 % 0.1 %
TTM P/E vs. 2 yr forward EPS growth
TTM EV/EBITDA vs. 2 yr forward EBITDA growth
TTM P/B vs. 2 yr forward RoE
26x
34x
30x
38x
42x
7%
8%
9%
10%
400
500
600
700
800
900
1,000
1,100
Aug-
18
Oct
-18
Dec
-18
Feb-
19
Apr-
19
Jun-
19
Aug-
19
Oct
-19
Dec
-19
Feb-
20
Apr-
20
Jun-
20
Aug-
20
Oct
-20
Dec
-20
EPS Growth
20%
22%
24%
26%
28%
30%
20,000
30,000
40,000
50,000
60,000
70,000
80,000
Aug-
18
Oct
-18
Dec
-18
Feb
-19
Apr-
19
Jun-1
9
Aug-
19
Oct
-19
Dec
-19
Feb
-20
Apr-
20
Jun-2
0
Aug-
20
Oct
-20
Dec
-20
24x
18x
21x
27x
30xEBITDAGrowth
0%
5%
10%
15%
20%
25%
30%
400
600
800
1,000
1,200
1,400
Aug-
18
Oct
-18
Dec
-18
Feb-
19
Apr-
19
Jun-
19
Aug-
19
Oct
-19
Dec
-19
Feb-
20
Apr-
20
Jun-
20
Aug-
20
Oct
-20
Dec
-20
RoE
6x
7x
8x
10x
9x

TCNS Clothing Ltd. Absolute – ADD Relative – Overweight 8% ATR in 18 Months
June 28, 2019 Page 23 of 24
Historical Consolidated Financials P&L (Rs Mn) FY16A FY17A FY18A FY19A Balance Sheet (Rs Mn) FY16A FY17A FY18A FY19A Cash Flow (Rs Mn) FY16A FY17A FY18A FY19A
Revenue 4,854 7,009 9,971 11,480 Equity Capital 92 111 113 123 PBT (136) 624 1,448 1,616
Op. Expenditure 4,893 6,246 8,416 9,711 Reserve 392 2,708 4,202 6,063 Depreciation 89 134 167 222
EBITDA (39) 763 1,554 1,768 Networth 483 2,819 4,315 6,186 Others 929 767 221 0
Depreciation 89 134 167 222 Long Term Debt 382 88 2 0 Taxes Paid 325 628 452 302
EBIT (128) 629 1,388 1,546 Def Tax Liability 73 81 119 144 Change in WC (212) (646) (971) (630)
Interest Expense 29 25 7 5 Minority Interest 0 0 0 0 Operating C/F 344 251 413 906
Other Income 21 19 67 75 Account Payables 846 1,093 1,144 1,150 Capex (271) (242) (285) (273)
PBT (136) 624 1,448 1,616 Other Curr Liabi 1,303 176 389 379 Change in Invest (18) (40) (3) (116)
Tax 279 466 467 302 Total Liabilities & Equity 3,088 4,258 5,969 7,859 Others 9 12 12 0
PAT bef. MI & Assoc. (415) 158 981 1,314 Net Fixed Assets 393 469 519 592 Investing C/F (280) (270) (276) (389)
Minority Interest 0 0 0 0 Capital WIP 2 33 81 3 Change in Debt (16) (294) 157 (2)
Profit from Assoc. 0 0 0 0 Others 471 630 706 877 Change in Equity 0 0 0 557
Recurring PAT (415) 158 981 1,314 Inventory 1,371 1,940 2,239 2,741 Others (30) 306 53 25
Extraordinaires 0 0 0 0 Account Receivables 642 997 1,571 1,807 Financing C/F (46) 12 210 580
Reported PAT (415) 158 981 1,314 Other Current Assets 106 56 342 230 Net change in cash 18 (7) 347 1,097
EPS (Rs) (6.4) 2.4 15.2 20.3 Cash 103 132 512 1,608 RoE (%) -52 % 10 % 28 % 25 %
DPS (Rs) 0.0 0.0 0.0 0.0 Total Assets 3,088 4,258 5,969 7,859 RoIC (%) -26 % 8 % 27 % 24 %
CEPS (Rs) (3.6) 2.6 20.4 25.1 Non-cash Working Capital (31) 1,724 2,619 3,249 Core RoIC (%) -38 % 10 % 29 % 30 %
FCFPS (Rs) 1.7 (0.1) 2.5 8.5 Cash Conv Cycle (2.3) 89.8 95.9 103.3 Div Payout (%) 0 % 0 % 0 % 0 %
BVPS (Rs) 5.3 25.3 76.5 100.9 WC Turnover (158.8) 4.1 3.8 3.5 P/E (121.6) 319.3 51.4 38.4
EBITDAM (%) -1 % 11 % 16 % 15 % FA Turnover 12.3 14.0 16.6 19.3 P/B 148.3 30.8 10.2 7.7
PATM (%) -9 % 2 % 10 % 11 % Net D/E 0.6 0.0 (0.1) (0.3) P/FCFF 465.1 (6,831.0) 310.3 91.8
Tax Rate (%) -204 % 75 % 32 % 19 % Revenue/Capital Employed 3.9 3.6 2.7 2.1 EV/EBITDA (1,245.6) 62.9 30.6 26.3
Sales growth (%) 61 % 44 % 42 % 15 % Capital Employed/Equity 1.6 1.2 1.0 1.0 EV/Sales 10.0 6.8 4.8 4.0
FDEPS growth (%) -258 % -138 % 521 % 34 % Dividend Yield (%) 0.0 % 0.0 % 0.0 % 0.0 %

TCNS Clothing Ltd. Absolute – ADD Relative – Overweight 8% ATR in 18 Months
June 28, 2019 Page 24 of 24
Rating & Coverage Definitions: Absolute Rating • LONG: Over the investment horizon, ATR >= Ke for companies with Free Float market cap >Rs 5 billion and ATR >= 20% for rest of the companies • ADD: ATR >= 5% but less than Ke over investment horizon • REDUCE: ATR >= negative 10% but <5% over investment horizon • SHORT: ATR < negative 10% over investment horizon Relative Rating • OVERWEIGHT: Likely to outperform the benchmark by at least 5% over investment horizon • BENCHMARK: likely to perform in line with the benchmark • UNDERWEIGHT: likely to under-perform the benchmark by at least 5% over investment horizon Investment Horizon Investment Horizon is set at a minimum 3 months to maximum 18 months with target date falling on last day of a calendar quarter. Lite vs. Regular Coverage vs. Spot Coverage We aim to keep our rating and estimates updated at least once a quarter for Regular Coverage stocks. Generally, we would have access to the company and we would maintain detailed financial model for Regular coverage companies. We intend to publish updates on Lite coverage stocks only an opportunistic basis and subject to our ability to contact the management. Our rating and estimates for Lite coverage stocks may not be current. Spot coverage is meant for one-off coverage of a specific company and in such cases, earnings forecast and target price are optional. Spot coverage is meant to stimulate discussion rather than provide a research opinion.
Registered Office:
Equirus Securities Private Limited
Unit No. 1201, 12th Floor, C Wing, Marathon Futurex,
N M Joshi Marg, Lower Parel,
Mumbai-400013.
Tel. No: +91 – (0)22 – 4332 0600
Fax No: +91- (0)22 – 4332 0601
Corporate Office:
3rd floor, House No. 9,
Magnet Corporate Park, Near Zydus Hospital, B/H Intas Sola Bridge,
S.G. Highway Ahmedabad-380054
Gujarat
Tel. No: +91 (0)79 - 6190 9550
Fax No: +91 (0)79 – 6190 9560
© 2019 Equirus Securities Private Limited. All rights reserved. For Private Circulation only. This report or any portion hereof may not
be reprinted, sold or redistributed without the written consent of Equirus Securities Private Limited