tax year 2022 - | otr
TRANSCRIPT
TAX YEAR 2022
PERTINENT DATA BOOK FOR THE
DISTRICT OF COLUMBIA
OFFICE OF TAX AND REVENUE REAL PROPERTY TAX ADMINISTRATION

Pages
Office 1-2 Hotel 3
Apartment 4-5 Retail 6 Maps 7-8
Methodology 9-12
Table of ContentsPertinent Data Book
Tax Year 2022
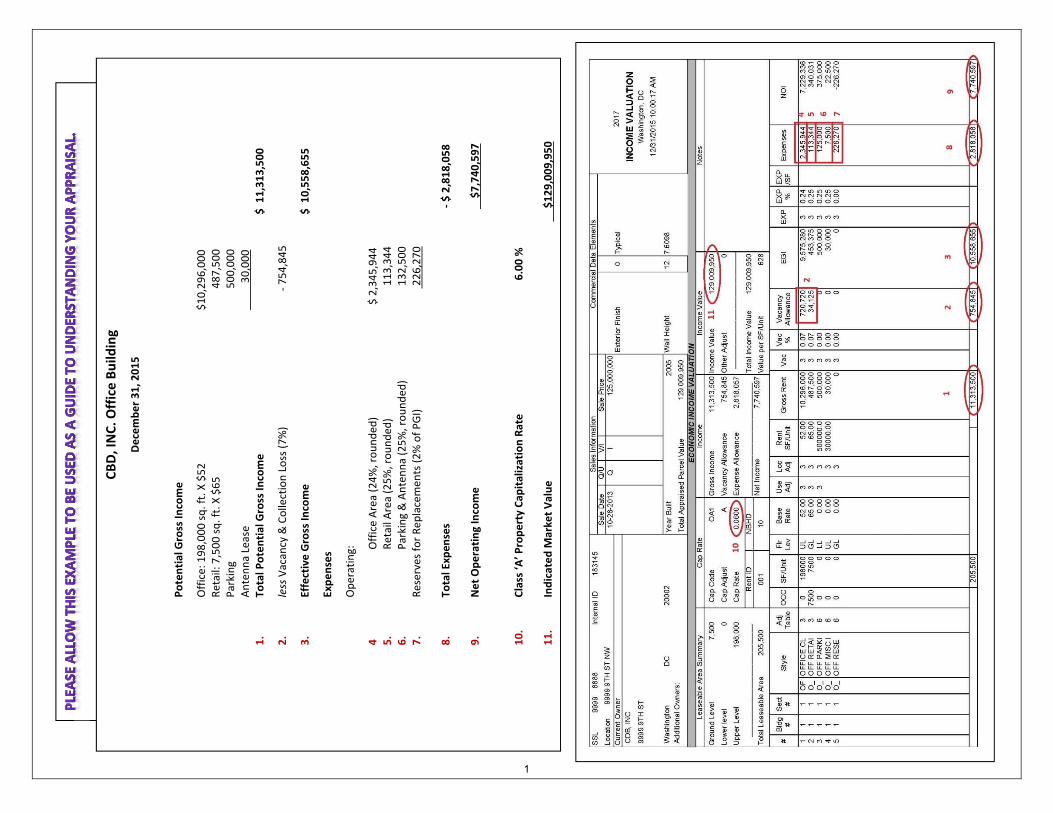
CBD, INC. O
ffice Build
ing
December 31, 2015
Potential Gross In
come
Office: 198,000 sq. ft. X $52
$10,296,000
Retail: 7,500 sq. ft. X $65
487,500
Parking
500,000
Antenna Lease
30,000
1.
Total Potential Gross In
come
$ 11,313,500
2.
less Vacancy & Collection Loss (7%)
‐ 754,845
3.
Effective Gross In
come
$ 10,558,655
Expenses
Operating:
4Office Area (24%, rounded
)$ 2,345,944
5.
Retail Area (25%, rounded
) 113,344
6.
Parking & Antenna (25%, rounded
) 132,500
7.
Reserves for Replacemen
ts (2% of PGI)
226,270
8.
Total Expen
ses
‐ $ 2,818,058
9.
Net Operating Income
$7,740,597
10.
Class ‘A
’ Property Cap
italization Rate
6.00 %
11.
Indicated M
arket Value
$129,009,950
1

CAPITOL HILL
CENTRAL BUSINESS DISTRICT GEORGETOWN NORTHEAST OLD CITY #2 SOUTHEAST SOUTHWEST UPTOWN EAST UPTOWN WEST
11.0% 12.5% 11.0% 11.0% 11.0% 11.0% 11.0% 11.0% 11.0%23.0% 23.0% 23.0% 23.0% 23.0% 23.0% 23.0% 23.0% 23.0%26.0% 26.0% 26.0% 26.0% 26.0% 26.0% 26.0% 26.0% 26.0%34.0% 34.0% 34.0% 34.0% 34.0% 34.0% 34.0% 34.0% 34.0%37.0% 37.0% 37.0% 37.0% 37.0% 37.0% 37.0% 37.0% 37.0%29.0% 29.0% 29.0% 29.0% 29.0% 29.0% 29.0% 29.0% 29.0%
Code Description1 OFF1 OFFICE TROPHY 68.00 71.00 66.00 64.00 71.00 64.00 68.00 64.00 66.002 OFF2 OFFICE CLASS A 49.00 56.00 50.00 46.00 56.00 46.00 49.00 46.00 50.003 OFF3 OFFICE CLASS B 46.00 48.00 42.00 32.00 48.00 32.00 46.00 32.00 42.004 OFF4 OFFICE CLASS C 43.00 40.00 40.00 29.00 40.00 29.00 43.00 29.00 40.005 OFFC OFFICE CONDO 46.00 48.00 42.00 32.00 48.00 32.00 46.00 32.00 42.006 O_BO OFF BSMT OFFICE 23.00 23.00 23.00 23.00 23.00 23.00 23.00 23.00 23.007 O_BR OFF BSMT RETAIL 26.00 26.00 26.00 26.00 26.00 26.00 26.00 26.00 26.008 O_R1 OFF RETAIL_FF 52.00 59.00 39.00 39.00 52.00 39.00 56.00 39.00 39.009 O_R2 OFF RETAIL_UP 33.00 33.00 33.00 33.00 33.00 33.00 33.00 33.00 33.00
10 O_RA OFF RES_APT 30.00 30.00 30.00 30.00 30.00 30.00 30.00 30.00 30.00
Cap Rate Table
Cap Code Description Rate Cap Rating Description AdjustmentOA0 OFFICE TROPHY 0.051 O0 VERY POOR 1.06OA1 OFFICE A 0.062 O1 POOR 1.04OB0 OFFICE B 0.067 O2 FAIR 1.02OC0 OFFICE C 0.079 O3 AVERAGE 1.00
O4 GOOD 0.98O5 EXCELLENT 0.96A AVERAGE 1.00
Rent, Vacancy, and Expense Adjustment Tables
Trophy/Class ARating Description Location Use Vacancy Expense
1 POOR 0.90 0.90 1.50 1.202 FAIR 0.95 0.95 1.25 1.103 AVERAGE 1.00 1.00 1.00 1.004 GOOD 1.10 1.10 0.75 0.905 EXCELLENT 1.20 1.20 0.50 0.80A AVERAGE 1.00 1.00 1.00 1.00
Class B/Class C/OtherRating Description Location Use Vacancy Expense
1 POOR 0.80 0.80 1.50 1.202 FAIR 0.90 0.90 1.25 1.103 AVERAGE 1.00 1.00 1.00 1.004 GOOD 1.10 1.10 0.75 0.905 EXCELLENT 1.20 1.20 0.50 0.80A AVERAGE 1.00 1.00 1.00 1.00
Tax Year 2022Office Building Rates and Ratios
Expense Ratio (All Others)Annual Rent
Vacancy RatioExpense Ratio (Trophy)
Expense Ratio (Class A)Expense Ratio (Class B)Expense Ratio (Class C)
2

Base Management Fee 3.00% Replacement Cost New of FF&E per RoomIncentive Management Fee 1.00%Franchise Royalty Fee 4.00% Ultra Luxury 60,000$ Replacement for Reserves (Real Property) 2.00% Luxury 45,000$ Replacement for Reserves (Personal Property) 4.00% Full Service 30,000$
aka‐Return of FF&E Invested Capital Select Service $ 17,000‐25,000Personal Property Tax Rate 3.40% Limited Service $ 15,000‐25,000
Economy and Motel 10,000$
Cap Rate Real Property Cap Rate Personal Property
Ultra Luxury 6.80% Ultra Luxury 6.95%Luxury 7.25% Luxury 7.40%Full Service 7.45% Full Service 7.60%Select Service 8.10% Select Service 8.25%Limited Service 8.15% Limited Service 8.30%Economy and Motel 8.15% Economy and Motel 8.30%
Tax Year 2022Washington, DC Hotel PropertiesBase Rates for Reassessment
3
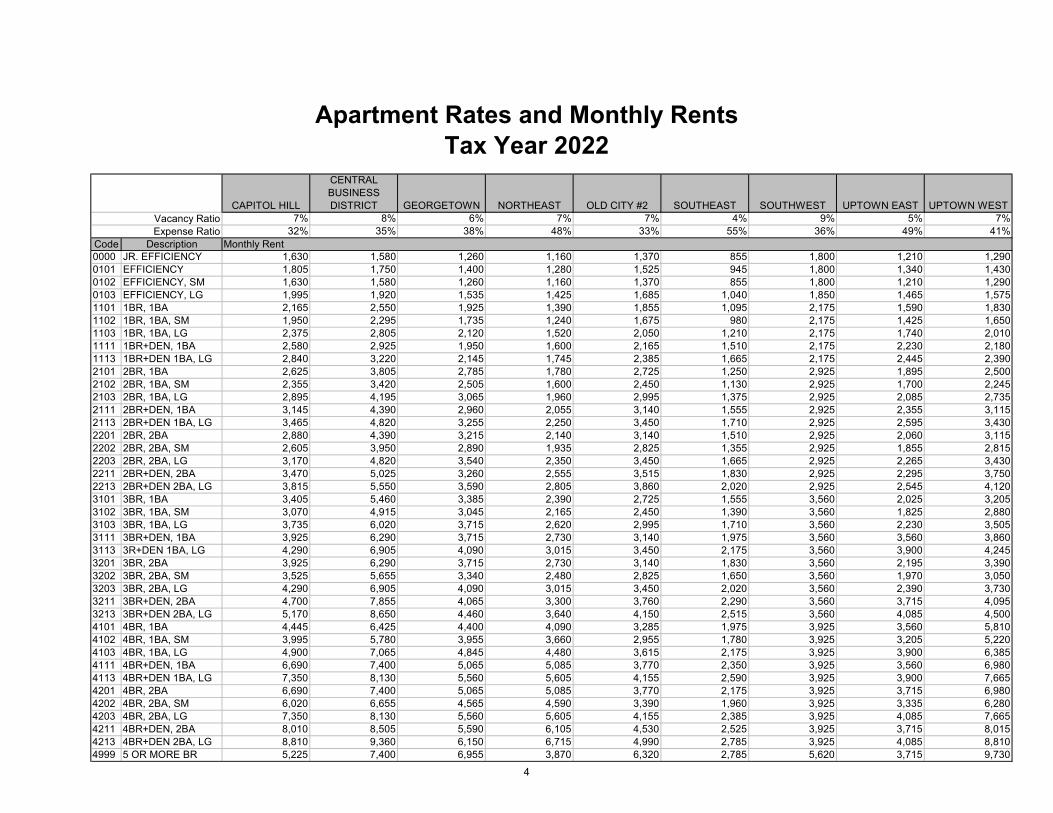
CAPITOL HILL
CENTRAL BUSINESS DISTRICT GEORGETOWN NORTHEAST OLD CITY #2 SOUTHEAST SOUTHWEST UPTOWN EAST UPTOWN WEST
7% 8% 6% 7% 7% 4% 9% 5% 7%32% 35% 38% 48% 33% 55% 36% 49% 41%
Code Description0000 JR. EFFICIENCY 1,630 1,580 1,260 1,160 1,370 855 1,800 1,210 1,2900101 EFFICIENCY 1,805 1,750 1,400 1,280 1,525 945 1,800 1,340 1,4300102 EFFICIENCY, SM 1,630 1,580 1,260 1,160 1,370 855 1,800 1,210 1,2900103 EFFICIENCY, LG 1,995 1,920 1,535 1,425 1,685 1,040 1,850 1,465 1,5751101 1BR, 1BA 2,165 2,550 1,925 1,390 1,855 1,095 2,175 1,590 1,8301102 1BR, 1BA, SM 1,950 2,295 1,735 1,240 1,675 980 2,175 1,425 1,6501103 1BR, 1BA, LG 2,375 2,805 2,120 1,520 2,050 1,210 2,175 1,740 2,0101111 1BR+DEN, 1BA 2,580 2,925 1,950 1,600 2,165 1,510 2,175 2,230 2,1801113 1BR+DEN 1BA, LG 2,840 3,220 2,145 1,745 2,385 1,665 2,175 2,445 2,3902101 2BR, 1BA 2,625 3,805 2,785 1,780 2,725 1,250 2,925 1,895 2,5002102 2BR, 1BA, SM 2,355 3,420 2,505 1,600 2,450 1,130 2,925 1,700 2,2452103 2BR, 1BA, LG 2,895 4,195 3,065 1,960 2,995 1,375 2,925 2,085 2,7352111 2BR+DEN, 1BA 3,145 4,390 2,960 2,055 3,140 1,555 2,925 2,355 3,1152113 2BR+DEN 1BA, LG 3,465 4,820 3,255 2,250 3,450 1,710 2,925 2,595 3,4302201 2BR, 2BA 2,880 4,390 3,215 2,140 3,140 1,510 2,925 2,060 3,1152202 2BR, 2BA, SM 2,605 3,950 2,890 1,935 2,825 1,355 2,925 1,855 2,8152203 2BR, 2BA, LG 3,170 4,820 3,540 2,350 3,450 1,665 2,925 2,265 3,4302211 2BR+DEN, 2BA 3,470 5,025 3,260 2,555 3,515 1,830 2,925 2,295 3,7502213 2BR+DEN 2BA, LG 3,815 5,550 3,590 2,805 3,860 2,020 2,925 2,545 4,1203101 3BR, 1BA 3,405 5,460 3,385 2,390 2,725 1,555 3,560 2,025 3,2053102 3BR, 1BA, SM 3,070 4,915 3,045 2,165 2,450 1,390 3,560 1,825 2,8803103 3BR, 1BA, LG 3,735 6,020 3,715 2,620 2,995 1,710 3,560 2,230 3,5053111 3BR+DEN, 1BA 3,925 6,290 3,715 2,730 3,140 1,975 3,560 3,560 3,8603113 3R+DEN 1BA, LG 4,290 6,905 4,090 3,015 3,450 2,175 3,560 3,900 4,2453201 3BR, 2BA 3,925 6,290 3,715 2,730 3,140 1,830 3,560 2,195 3,3903202 3BR, 2BA, SM 3,525 5,655 3,340 2,480 2,825 1,650 3,560 1,970 3,0503203 3BR, 2BA, LG 4,290 6,905 4,090 3,015 3,450 2,020 3,560 2,390 3,7303211 3BR+DEN, 2BA 4,700 7,855 4,065 3,300 3,760 2,290 3,560 3,715 4,0953213 3BR+DEN 2BA, LG 5,170 8,650 4,460 3,640 4,150 2,515 3,560 4,085 4,5004101 4BR, 1BA 4,445 6,425 4,400 4,090 3,285 1,975 3,925 3,560 5,8104102 4BR, 1BA, SM 3,995 5,780 3,955 3,660 2,955 1,780 3,925 3,205 5,2204103 4BR, 1BA, LG 4,900 7,065 4,845 4,480 3,615 2,175 3,925 3,900 6,3854111 4BR+DEN, 1BA 6,690 7,400 5,065 5,085 3,770 2,350 3,925 3,560 6,9804113 4BR+DEN 1BA, LG 7,350 8,130 5,560 5,605 4,155 2,590 3,925 3,900 7,6654201 4BR, 2BA 6,690 7,400 5,065 5,085 3,770 2,175 3,925 3,715 6,9804202 4BR, 2BA, SM 6,020 6,655 4,565 4,590 3,390 1,960 3,925 3,335 6,2804203 4BR, 2BA, LG 7,350 8,130 5,560 5,605 4,155 2,385 3,925 4,085 7,6654211 4BR+DEN, 2BA 8,010 8,505 5,590 6,105 4,530 2,525 3,925 3,715 8,0154213 4BR+DEN 2BA, LG 8,810 9,360 6,150 6,715 4,990 2,785 3,925 4,085 8,8104999 5 OR MORE BR 5,225 7,400 6,955 3,870 6,320 2,785 5,620 3,715 9,730
Vacancy RatioExpense Ratio
Monthly Rent
Apartment Rates and Monthly RentsTax Year 2022
4

Capitalization Rate Table Capitalization Rate Adjustment Table
Cap Code Description Rate Cap Rating Description AdjustmentA1A APT AREA 1 CLASS A 0.049 0 VERY POOR 1.3A1B APT AREA 1 CLASS B 0.059 1 POOR 1.2A1C APT AREA 1 CLASS C 0.061 2 FAIR 1.1A2A APT AREA 2 CLASS A 0.049 3 AVERAGE 1A2B APT AREA 2 CLASS B 0.061 4 GOOD 0.9A2C APT AREA 2 CLASS C 0.063 5 EXCELLENT 0.8A3A APT AREA 3 CLASS A 0.056 A AVERAGE 1A3B APT AREA 3 CLASS B 0.063A3C APT AREA 3 CLASS C 0.068
Rent, Vacancy, and Expense Adjustment Tables
Rating Description Location Use Vacancy Expense1 POOR 0.80 0.80 2.00 1.252 FAIR 0.90 0.90 1.50 1.103 AVERAGE 1.00 1.00 1.00 1.004 GOOD 1.10 1.10 0.50 0.905 EXCELLENT 1.25 1.25 0.25 0.75A AVERAGE 1.00 1.00 1.00 1.00S NON-MARKET 0.90 0.90 0.25 1.25
Tax Year 2022Apartment Capitalization Rates and Adjustment Tables
5

CAPITOL HILL
CENTRAL BUSINESS DISTRICT GEORGETOWN NORTHEAST OLD CITY #2 SOUTHEAST SOUTHWEST UPTOWN EAST UPTOWN WEST
8.0% 8.0% 8.0% 8.0% 8.0% 8.0% 8.0% 8.0% 8.0%5.5% 5.5% 5.5% 5.5% 5.5% 5.5% 5.5% 5.5% 5.5%
Code Description1 RET1 RT SM < 10K SF 33.85 70.60 22.40 42.40 20.20 70.60 27.65 43.452 RET2 RT MED < 20K SF 30.45 63.65 20.00 38.20 18.25 63.65 23.20 39.103 RET3 RT LRG < 50K SF 26.95 56.45 17.85 33.95 16.30 56.45 20.55 34.754 RET4 RT XLG > 50K SF 23.65 49.45 15.60 29.70 14.05 49.45 18.05 30.355 RET1 RT MKT AREA 1 44.456 RET2 RT MKT AREA 2 56.457 RET3 RT MKT AREA3 SM 96.908 RET4 RT MKT AREA3 LG 35.309 RET5 RT 1ST/UPPR FLR 26.95 56.45 48.50 17.85 33.95 16.30 56.45 26.15 34.75
10 RETB RT BANK/FINANCE 33.85 70.60 56.45 22.40 47.35 20.20 70.60 33.15 46.2011 RETR RT RESTAURANT 33.15 69.15 49.40 21.95 46.40 19.75 69.15 32.50 45.2512 RTLL RT LOWER LEVEL 16.50 25.20 29.10 15.05 25.20 15.05 25.20 16.50 25.2013 RTUA RT UPPR FLR APT 24.65 41.30 30.25 15.05 30.25 15.05 40.35 24.65 20.2014 RTUO RT UPPR FLR OFF 24.65 41.30 30.25 15.05 30.25 15.05 40.35 24.65 20.2015 RTUR RT UPPR FLR RET 24.65 41.30 38.40 15.05 30.25 15.05 40.35 24.65 20.20
Capitalization Rate Table Capitalization Rate Adjustment Table
Cap Code Rate Cap Rating Description AdjustmentRE1 0.065 0 VERY POOR 1.30RE2 0.070 1 POOR 1.20RE3 0.067 2 FAIR 1.10RE4 0.067 3 AVERAGE 1.00
4 GOOD 0.905 EXCELLENT 0.80A AVERAGE 1.00
Rent, Vacancy, and Expense Adjustment Tables
Rating Description Location Use Vacancy Expense1 POOR 0.80 0.80 1.50 1.202 FAIR 0.90 0.90 1.25 1.103 AVERAGE 1.00 1.00 1.00 1.004 GOOD 1.10 1.10 0.75 0.905 EXCELLENT 1.20 1.20 0.50 0.80A AVERAGE 1.00 1.00 1.00 1.00
Vacancy RatioExpense Ratio
Annual Rent
Retail Rates and RentsTax Year 2022
DescriptionSTANDARD RETAILSHOPPING CTR/MALLDEPT STORE/SUPERMKTRESTAURANT
6

7
39
60
18
5
16
611
68
72
22
28
43
1
40
56
6310
15
42
9
2
21
25
4
50
65
46
3
69
32
13
52
4947
41
20
48
38
67
3666
37
33
12
30
1929
14 17
5434
35
8
2671
61
31
73
24
44
53
27
51
64
62
74
5570
23
3Distr
ict of
Colu
mbia
Asse
ssme
nt Ne
ighbo
rhoo
ds
Offic
e of T
ax an
d Rev
enue
Real
Prop
erty A
sses
smen
t Divis
ionGe
ograp
hic In
forma
tion S
ystem
s
±
Asse
ssme
nt N
eighb
orho
ods
1, Am
erica
n Univ
ersity
10, C
entra
l11
, Che
vy C
hase
12, C
hillum
13, C
levela
nd Pa
rk14
, Colo
nial V
illage
15, C
olumb
ia He
ights
16, C
ongre
ss H
eights
17, C
restw
ood
18, D
eanw
ood
19, E
cking
ton2,
Anac
ostia
20, F
oggy
Bott
om21
, Fore
st Hi
lls22
, Fort
Dup
ont P
ark23
, Fox
hall
24, G
arfiel
d25
, Geo
rgetow
n26
, Glov
er Pa
rk27
, Haw
thorne
28, H
illcres
t29
, Kalo
rama
3, Ba
rry Fa
rms
30, K
ent
31, L
edroi
t Park
32, L
ily P
onds
33, M
arsha
ll Heig
hts34
, Mas
sach
usett
s Av
enue
Heig
hts35
, Mich
igan P
ark36
, Mt. P
leasa
nt37
, Nort
h Clev
eland
Park
38, O
bserv
atory
Circle
39, O
ld Ci
ty 1
4, Be
rkley
40, O
ld Ci
ty 2
41, P
alisa
des
42, P
etwort
h43
, Ran
dle H
eights
44, N
oMa
46, S
outhw
est W
aterfr
ont
47, R
iggs P
ark48
, She
pherd
Park
49, 1
6th S
treet
Heigh
ts5,
Bren
twoo
d50
, Spri
ng Va
lley
51, T
akom
a Park
52, T
rinida
d53
, Wak
efield
54, W
esley
Heig
hts55
, Woo
dley
56, W
oodri
dge
6, Br
ightw
ood
60, R
ock C
reek P
ark61
, Nati
onal
Zoolo
gical
Park
62, R
ock C
reek P
ark63
, DC
Stad
ium Ar
ea64
, Ana
costi
a Park
65, N
ation
al Ar
boret
um66
, Fort
Linc
oln67
, St. E
lizabe
th's H
ospit
al68
, Boll
ing Ai
r Forc
e Bas
e69
, DC
Villag
e7,
Broo
kland
70, F
ort D
rive
71, G
lover
- Arch
bold
Parkw
ay72
, Mall
/Eas
t Poto
mac P
ark73
, Was
hingto
n Nav
y Yard
74, F
t. McN
air8,
Burle
ith9,
Capit
ol Hi
ll
7

Cap R
ateAr
ea: 2
Cap R
ateAr
ea: 1
Cap R
ateAr
ea: 3
Sout
heas
t
Upto
wn W
est
North
east
Upto
wn E
ast
Capi
tol H
ill
Old
City
#2 Sout
hwes
t
Geor
geto
wn
Cent
ral B
usin
ess D
istric
t
7
39
60
5
18
6
16
11
68
72
22
28
43
1
40
56
63
15
9
42
2
4
21
25
50
65
3
46
69
32
13
52
4947
41
20
48
10a
38
67
3666
37
33
12
30
1929
14 17
54
10b
34
35
8
51
2671
61
31
6473
24
44
53
27
74
55
62
70
23
3
RPAD
Ren
t Curv
e Sub
Marke
ts an
d Cap
Rate
Area
s1,
Centr
al Bu
sines
s Dist
rict
1, Ge
orgeto
wn1,
Old C
ity #2
1, Up
town W
est
2, Ca
pitol
Hill
2, No
rthea
st
2, So
uthwe
st2,
Uptow
n Eas
t3,
South
east
40
0.51
0.25
Miles
DC O
ffice o
f Tax
and R
even
ueRe
al Pr
opert
y Ass
essm
ent D
ivision
Geog
raphic
Infor
matio
n Sys
tems
Rock
Cree
k
Park Na
tiona
l
Mall
8

TAX YEAR 2022 WASHINGTON, DC OFFICE BUILDING
EFFECTIVE RENT STUDY METHODOLOGY
Market based effective rent is derived from lease abstracts submitted by office property owners. The lease abstract is part of the income and expense report submitted to OTR by property owners. A separate analysis is performed to develop an indicated effective market rent from each new office building lease in the District for the calendar year. The steps are generally as follows:
For each lease, initial base rent, lease term, annual percentage rent increases and size of leased area are utilized to develop an estimate of total income from base rent over the life of the lease. Secondly, If the tenant is responsible for the payment of any operating expenses during the term of the lease (not including excess expenses over an expense stop) an estimate is made of total rent via expense payments/reimbursements over the term of the lease. This is calculated utilizing the lease abstract, the expense history of the subject property and expected rate of expense increases going forward. This estimate of total expense reimbursement (not including expense stop reimbursements) is added to the total estimated base rent for the term. Concessions (usually in the form of free rent) are deducted from that total. The new total rent estimated is divided by the number of years of the lease and the square footage of the space leased to arrive at an average annual estimate of effective rent per square foot.
That figure is then adjusted, if necessary, for any amount of leasing costs to be paid by the property owner which fall outside of the typical range of lease-up costs for the market. These lease-up costs include tenant improvements and leasing commissions. This range is determined by a separate lease up cost study.
The result is an annualized per-square-foot number that represents the indicated effective rent for that lease. When this process is completed for all new leases available, the leases are stratified by submarket, including considerations of building class and location. For each group of leases an indicated effective rent is determined by multiple measures of central tendency, including average, median and weighted average. OTR utilizes prior year’s data. Those indications are then projected forward by one year, utilizing an estimate of percentage increases in market rent. This results in three measures of projected effective rent for a given class and submarket of office buildings.
Consideration is given to other qualitative relevant data, before base rents for the valuation model are chosen.
9

Tax Year 2022 Washington, DC Office Building
Expense Rate Methodology
Expense rates for the various classes of Office buildings were derived from income and expense analysis. The initial analysis is based on the Income and Expense forms completed by office building owners. Growth rates for both income and expenses are reviewed and considered. Expenses as a percentage of effective gross income are calculated for each property with a complete and clear Income and Expense filing. Properties that have not reached stabilization are omitted from the analysis.
Typical expense ratios are developed for each class of office buildings. After the total income for a given property has been determined, and projected forward by one year, a comparison is made to the property’s reported stabilized expenses, also projected forward, to develop an expense ratio for the property. After this is completed for each property, the buildings are stratified by class.
For each class of office, measures of central tendency are reviewed to develop estimates of typical expense ratios. Typical expense ratios are developed as a percentage of effective gross income for various classes of office properties.
Other relevant data is considered and the base expenses for the valuation model are chosen.
10

Tax Year 2022 Washington, DC Office Building
Capitalization Rate Study Methodology
Office capitalization rates were derived from arms-length market sales. The stabilized net operating income was derived within the Vision CAMA income capitalization worksheet. Annual Leasing Reports (Rent Roll) and Income & Expense Statements (I&E), submitted by owners of office buildings in the District, were reviewed and analyzed to determine market rents and expenses for office buildings of various classifications and locations. In addition, surveys and reports of market rents and expenses from notable commercial real estate publications were reviewed for support of the analysis.
Market rents were applied to the net rentable area of sales properties, with exceptions and/or adjustments to leases with longer remaining terms. Market vacancy rates were applied to the resulting gross operating income. Market expenses were compared to historical expenses of sales properties to determine the most appropriate expense deduction. A deduction was also made for reserves to account for upcoming replacement of short-lived building components which typically do not occur on an annual basis.
Stabilized and trended actual performance of properties is utilized to derive adjustments for income items such as parking, storage, and miscellaneous income.
All these factors were utilized to derive an estimate of stabilized net operating income for each sale property. The indicated capitalization rate was calculated for each sale property by dividing the stabilized net operating income by the sale price. The population of sale properties, and their indicated capitalization rates, were analyzed to determine capitalization rate for office properties for the tax year.
Non-arm’s length sales or sales without an adequate reported history of income and expenses are not included in the capitalization rate study.
11

Covid-19
OTR has considered the effects of the current pandemic and the accompanying restrictions. Through discussions with market
participants, review of published articles and industry resources, the effect of COVID 19 was considered and factored into Tax Year
2022 valuation, as of the effective date of January 1, 2021.
12