tax structure work group - wa
TRANSCRIPT
Tax Structure Work Group
Preliminary Report
RESULTS OF ECONOMIC ANALYSES
Prepared for: Washington State Legislature

Letter of Submittal

Letter of Submittal
DECEMBER 31, 2020
Honorable Members, Washington State SenateHonorable Members, Washington State House of Representatives
In the 2019 Legislative Session, the legislature reauthorized the Tax Structure Work Group (TSWG) to expand its membership and direct its scope of work. Broadly, we are tasked with:
• Updating previous research materials exploring changes to the state’s tax structure;
• Facilitating a series of public meetings in geographically dispersed locations of the state and collecting feedback from taxpayers about the tax structure and potential alternatives; and
• Making recommendations to the legislature for changes to the state tax structure.
In 2019, ESHB 1109, Section 137(2)(c), directed the TSWG to produce a preliminary report by the end of 2020. The preliminary report updates previous tax research completed by the 2002 Tax Structure Committee and 2018 House Tax Structure Work Group as required by ESHB 1109.
The current Work Group has met five times over the last year to understand the issues with Washington’s existing tax structure. Each member took time to study and understand data provided by the Department of Revenue, and we are grateful to the department’s staff for their high-quality research. Please accept the preliminary report’s submittal, and we look forward to disseminating its findings in the coming months. In the 2021 Legislative Session, we will be available to deliver presentations to the legislature’s appropriate committees on this report’s findings.
This report’s submittal marks a turning point for the Work Group. We now shift our focus to considering specific alternatives to the state’s current tax structure and engaging taxpayers across the state. The Work Group sincerely appreciates the opportunity to serve in this capacity for the people of the State of Washington.
Respectfully,
Representative Noel Frame, Co-Chair (House Democratic Caucus)Senator Keith Wagoner, Co-Chair (Senate Republican Caucus)Representative Pat Sullivan (House Democratic Caucus)Representative Ed Orcutt (House Republican Caucus)Representative Jesse Young (House Republican Caucus)Senator Joe Nguyen (Senate Democratic Caucus)Senator Lisa Wellman (Senate Democratic Caucus)Scott Merriman (Legislative Liaison, Office of the Governor)Dean Carlson (Senior Tax Policy Coordinator, Department of Revenue)City of Vancouver Mayor Anne McEnerny-Ogle (Association of Washington Cities)Pierce County Councilmember Derek Young (Washington State Association of Counties)
Acknowledgments
The Tax Structure Work Group (TSWG) appreciates the contributions to this report from the Work Group members, the Department of Revenue staff members, and Technical Advisory Group members. We would like to make a special acknowledgment of the contributions of the groups and people named on this page.
The Department employees from the Research & Fiscal Analysis Division and Legislation & Policy Division were the principal staff contributors to the research and analysis of the study (named in the list to the right). These individuals provided original study design and economic analysis as required by state law. Staff members from several divisions played critical roles in supporting the economic research and policy analysis completed as part of this report.
Others members of the Research & Fiscal Analysis division involved in data gathering, meeting coordination, and border state analysis include: Beth Leech, Melissa Howes, Coung (Van) Huynh, and Tyler McLeod. Other members of the Legislation and Policy division involved in border state analysis include: Ryan Anderson, Peter Levine, Trice Konschuh, and Andre Unicume.
A Technical Advisory Group supported the Department’s technical work and should be acknowledged for contributing their valuable time and expertise (named in the list to the right).
Additionally, the Department contracted through an Interagency Agreement with Western Washington University to complete economic analysis regarding Washington’s Economic Competitiveness. The Department is especially thankful to the members of Western Washington University that assisted with this analysis:
Hart L. Hodges, Associate Professor in Economics & Director of Center for Economic and Business Research
Brady Anderson, Research Assistant for Center for Economic and Business Research
Research & Fiscal Analysis Division
Kathy L. Oline, Assistant Director
Don Gutmann, Program Manager
Keri Boyer, Administrative Assistant
Valerie Torres, Tax Policy Manager
Preston Brashers, Tax Policy Specialist
Sara del Moral, Tax Policy Specialist
Kris Bitney, Tax Policy Specialist
Mark Studer, Tax Policy Manager
Legislation & Policy Division
Mark Mullin, Assistant Director
Travis Yonker, Program Manager
Laura Chartoff, Legislative Coordinator
Braden Fraser, Tax Policy Specialist
Steven Lee, Tax Policy Specialist
Technical Advisory Group
Katie Baird, University of Washington TacomaDouglas Conrad, Ph.D., Professor Emeritus at the University of WashingtonLucy Dadayan, Ph.D., Urban InstituteRobert Hamilton, Washington State Department of CommerceRachelle Harris, House Finance CommitteeHart Hodges, Ph.D., Center for Economic and Business Research, Western Washington UniversityD. Patrick Jones, Ph.D., Eastern Washington UniversitySharon Kioko, Ph.D., Evans School of Public Policy and Governance, University of WashingtonMike Nelson, Washington Society of Certified Public AccountantsSteve Lerch, Ph.D., Economic and Revenue Forecast CouncilJeff Mitchell, Senate Ways and Means CommitteeAndy Nicholas, Washington State Budget & Policy CenterPete Parcells, Ph.D., Economics Professor at Whitman CollegeRick Peterson, Retired, former House Finance and DOR ResearchKriss Sjoblom, Ph.D., Washington Research CouncilNick Tucker, House Finance Committee
4TAX STRUCTURE WORK GROUP PRELIMINARY REPORT Results of Economic Analyses | DECEMBER 2020
Table of Contents
01 | Introduction....................................................................07Tax Structure Work Group................................................................................................7
The Preliminary Report Conducts Tax Analyses..................................................7
The Tax Structure Work Group in 2021 and Beyond..............................................7
02 | Timeline of Major Tax Structure Efforts....................08The 2002 Gates Study.............................................................................................................8
The 2018 House Report.........................................................................................................8
03 | Washington’s Current Tax Structures.....................09Major State Taxes.......................................................................................................................9
04 | Common Principles of Tax Policy....................................10Tax Principles.............................................................................................................................10
Taxpayer Perspectives.........................................................................................................10
05 | Research Questions from Tax Reviews...............11
06 | Tax Models & Analysis of 2017-19 Biennium.............122017-19 Biennium is used as the reference time frame for analysis....12
Technical models were createdto answer the questions...............................13
07 | Value-Added Tax.............................................................14What is a Value-Added Tax?.............................................................................................14
What is the Department of Revenue required to update?...........................15
What did the Department of Revenue find?.........................................................15
08 | Margins Tax...................................................................16 What is a Margins Tax?......................................................................................................16
What is the Department of Revenue required to update?......................17
What did the Department of Revenue find?............................................................17
What’s the difference between the VAT and margins tax?..............................17
09 | Corporate Income-Net Receipts Tax.........................18What is a Corporate Income-Net Receipts Tax?..................................................18
What is the Department of Revenue Required to update?......................19
What did the Department of Revenue find?.........................................................19
10 | Personal Income Tax..................................................21What is a Personal Income Tax?...................................................................................21
What is the Department of Revenue Required to update?.......................22
What did the Department of Revenue find?.......................................................22
11 | Alternative Property Tax Growth Limitation............24What is Washington’s property tax growth limitation?.................................24
What was the Department of Revenue required to analyze?...................24
What did the Department of Revenue find?......................................................25
12 | Bordering States Tax Structure.............................26How does Washington’s tax structure compare to border states?..........26
What was the Department of Revenue required to analyze?......................26
What did the Department of Revenue find?...........................................................26
13 | Changes in Household Tax Burden..........................28What are the household tax burdens under current law?........................28
What was the Department of Revenue required to analyze?...............28
What did the Department of Revenue find?.........................................................29
14 | Changes in Business Tax Burden.............................30What are the business tax burdens under current law?..........................30
What was the Department of Revenue required to analyze?.................30
What did the Department of Revenue find?............................................................31
15 | Economic Competitiveness Research.....................32
16 | Technical Notes..............................................................35
5 TAX STRUCTURE WORK GROUP PRELIMINARY REPORTDECEMBER 2020 | Results of Economic Analyses


IntroductionTax Structure Work GroupThe Tax Structure Work Group (TSWG) builds on work that started two decades ago. In 2001, the Washington State Legislature commissioned a group of academic scholars and legislators to study the state’s tax structure and possible alternatives. The committee concluded state taxes were levied disproportionately on low- and middle-income taxpayers, unfair to many businesses, and highly volatile. The committee also found that the tax structure, put in place in 1935, was well-suited for a mid-twentieth century manufacturing economy but did not work well in today’s economy with its greater dependence on the service sector and the rapidly expanding “internet economy”. They concluded that if the trends they observed in the early 2000s continued, the tax structure would be even less adequate in the future.
A House of Representatives work group convened in 2018 to revisit findings from the early 2000s and facilitate four public meetings about the tax system in Spokane, Yakima, Vancouver, and Seattle. Following the feedback from the public meetings and a survey, the 2018 House Tax Structure Work Group (TSWG) recommended the reauthorization of the TSWG with expanded membership to address key challenges of the Washington State tax code including, but not limited to:
• The regressive nature of the tax code;
• The negative impact of businesses and occupation (B&O) tax on small, start-up, and low-margin companies;
• The changing economy and the need to modernize the tax code to reflect it; and
• The excessive number of tax preferences and exemptions.
The Preliminary Report Conducts Tax AnalysesThe 2019-2021 TSWG was convened in 2019, charged with considering ways to assess and improve the state’s tax structure. It engaged the Washington Department of Revenue (DOR) and a technical advisory group to conduct an analysis for this Preliminary Report that assesses alternative tax structures that had been evaluated in two previous tax reform efforts. In 2020, DOR estimated impacts on revenue and tax incidence of the following changes:
• Value-added tax that replaces the Business and Occupation (B&O) tax
• Margins tax that replaces the B&O tax
• Corporate income-net receipt tax (CINR tax) that replaces the B&O tax
• Flat and graduated personal income tax (PIT) that reduces or eliminates the state’s general sales tax and maintains or eliminates the state property tax
• Flat PIT and CINR tax that replaces the B&O tax, reduces the state’s general sales tax, and either maintains or eliminates the state property tax
• An assessment of Washington’s current tax structure’s economic competitiveness compared to those of border states
The Tax Structure Work Group in 2021 and BeyondIn 2021, the TSWG will review the Preliminary Report with appropriate committees of the legislature and stakeholders. It will also prepare for five or more public meetings across the state to engage taxpayers in a conversation about the tax structure and possible alternatives. The TSWG will propose recommended changes to state tax policy for consideration during the 2023 Legislative Session. If the legislature does not enact a tax package, the TSWG will facilitate a series of public meetings to collect feedback on the unsuccessful tax legislation, will modify the legislative proposals to incorporate the feedback, and advance a new proposal in 2024. During the 2024 Legislative Session, it is the intent of the Legislature to consider the modified proposal. By December 31, 2024, the Work Group intends to submit a final report, compiling all reports previously submitted since December 31, 2020.
7 TAX STRUCTURE WORK GROUP PRELIMINARY REPORTDECEMBER 2020 | Results of Economic Analyses

Timeline of Major Tax Structure EffortsThe 2002 Gates StudyThe Washington State Legislature passed legislation in 2001 requiring an examination of the current tax system and development of tax alternatives. Engrossed Substitute House Bill (ESSB) 6153 created the Washington State Tax Structure Study Committee to assess the current tax system and possible options.
The committee, chaired by Bill Gates Sr., produced the 2002 Washington State Tax Structure Report (2002 Gates Study), which concluded that the state’s tax system was inequitable, inadequate, and unstable. The study found:
• Growth in tax revenue lagged behind growth in personal income beginning in the 1980s.
• Retail sales and B&O tax revenues were more volatile than the overall economy — sharply increasing in economic expansions and decreasing in recessions. They concluded that switching to a flat rate PIT or CINR tax would not improve stability.
• Property and public utility taxes were the state’s most stable revenue sources.
• Measured across all taxes, the tax structure was regressive — low-income taxpayers paid higher shares of their incomes on taxes. This regressivity can be attributed to the retail sales tax. Low-income households spend higher shares of their incomes on retail goods and, because the retail sales tax is assessed at a flat rate, they also spend higher shares of their incomes on the tax.
• The B&O tax had a number of design flaws including a “pyramiding” feature that assessed taxes on the same good or service multiple times as it moved through the chain of production, its disproportionate impact on low profit margin businesses, and its lack of transparency for consumers.
Summary of Recommendations
• Replace the B&O tax with a subtraction method business value added tax (VAT) or flat rate CINR tax.
• Introduce a flat-rate PIT to reduce the state sales tax and eliminate the state property tax, in conjunction with a flat rate CINR tax.
The 2018 House ReportThe legislature created the House Tax Structure Work Group (House TSWG) in the 2017-19 Operating Budget to facilitate public discussion about its tax structure. The House TSWG held four public meetings in 2018 and conducted a survey informing its recommendations; one of those recommendations was to conduct economic modeling of tax alternatives (its report is referred to as the 2018 House Report).
Summary of Recommendations
• Reconvene and expand TSWG membership for the 2019-21 Biennium.
• Research the replacement of the B&O tax with a corporate income-net receipts tax or a margins tax.
• Research the replacement of the 1% growth limit on property tax revenue with a limit based on inflation and population growth.
• Research the replacement of a portion of the state property tax with a capital gains tax.
8TAX STRUCTURE WORK GROUP PRELIMINARY REPORT Results of Economic Analyses | DECEMBER 2020
Washington’s Current Tax
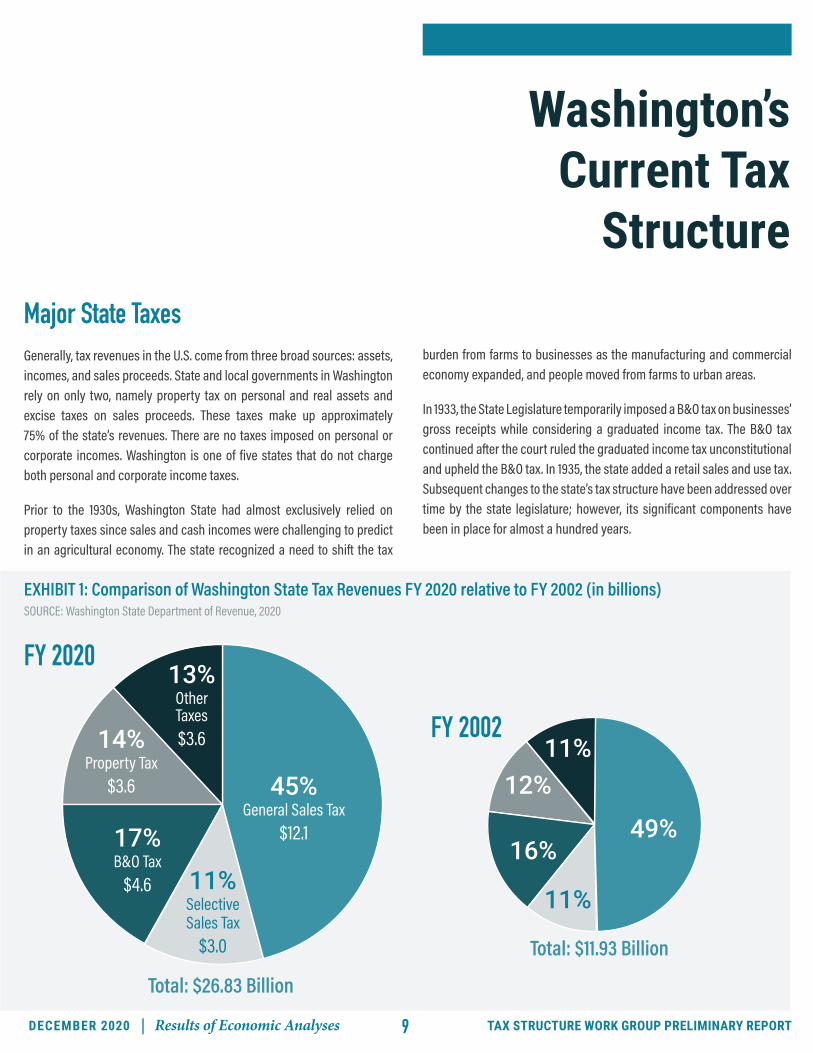
StructureMajor State TaxesGenerally, tax revenues in the U.S. come from three broad sources: assets, incomes, and sales proceeds. State and local governments in Washington rely on only two, namely property tax on personal and real assets and excise taxes on sales proceeds. These taxes make up approximately 75% of the state’s revenues. There are no taxes imposed on personal or corporate incomes. Washington is one of five states that do not charge both personal and corporate income taxes.
Prior to the 1930s, Washington State had almost exclusively relied on property taxes since sales and cash incomes were challenging to predict in an agricultural economy. The state recognized a need to shift the tax
burden from farms to businesses as the manufacturing and commercial economy expanded, and people moved from farms to urban areas.
In 1933, the State Legislature temporarily imposed a B&O tax on businesses’ gross receipts while considering a graduated income tax. The B&O tax continued after the court ruled the graduated income tax unconstitutional and upheld the B&O tax. In 1935, the state added a retail sales and use tax. Subsequent changes to the state’s tax structure have been addressed over time by the state legislature; however, its significant components have been in place for almost a hundred years.
45%General Sales Tax
$12.1
11%Selective Sales Tax
$3.0
17%B&O Tax
$4.6
14%Property Tax
$3.6
13%Other Taxes$3.6
FY 2020
Total: $26.83 Billion
FY 2002
Total: $11.93 Billion
49%
11%12%
11%
16%
EXHIBIT 1: Comparison of Washington State Tax Revenues FY 2020 relative to FY 2002 (in billions)SOURCE: Washington State Department of Revenue, 2020
9 TAX STRUCTURE WORK GROUP PRELIMINARY REPORTDECEMBER 2020 | Results of Economic Analyses

Common Principles of Tax Policy
No tax system is perfect, and each individual or business will be affected differently by a chosen tax policy designed to satisfy the general population’s overall needs. The 2002 Gates Study articulated a number of principles commonly used by tax and policy experts to assess tax system design (see below). Taxpayer perspectives are also relevant in assessing or implementing a new tax system, even if the views do not align with the principles advanced by tax policy experts. The tax principles are not codified in state law and have not been formally adopted by the TSWG. They are included here for reference and as context for the following sections of this report.
Tax PrinciplesADEQUACYThe tax system should raise sufficient tax revenue to pay for established public services without the need to change the tax rates or the tax base. The tax revenue should grow at a rate similar to that of the overall economy.
STABILITYThe tax system should be able to withstand short-term fluctuations in the economy.
ECONOMIC VITALITY AND HARMONY WITH OTHER STATESThe tax system should not create reasons for businesses to selectively move taxable activities outside the state. It should harmonize with other tax systems to avoid double taxation and to minimize opportunities for firms and individuals to avoid taxation by shifting their taxable activities between states.
VERTICAL EQUITYTaxpayers with a greater ability to pay should pay more taxes than taxpayers with a limited ability to pay.
TRANSPARENCY AND ADMINISTRATIVE SIMPLICITYKnowing how much tax to pay, when to pay, and when tax has already been paid should be clear and evident to the taxpayers. Simple rules, record-keeping, and computation requirements make it easier for taxpayers to comply and tax collection agencies to enforce.
HORIZONTAL EQUITYTaxpayers, including businesses, with similar abilities to pay should pay similar amounts of tax. The tax system should avoid arbitrary distributions of tax burdens across taxpayers.
ECONOMIC NEUTRALITY AND EFFICIENCYTo not distort economic decisions, the tax system should minimize opportunities and incentives to take advantage of differential tax treatment of economic activities. Taxpayers should make their decisions based on economic factors rather than tax advantages.
Taxpayer PerspectivesTAX-BENEFIT LINKAGETaxpayers generally prefer taxes that fund government services with direct benefits they can perceive. At the same time, taxpayers are less resistant to less transparent taxes because the changes caused by the taxes are not as easily understood. Although this concept is useful for political feasibility of tax reforms, it conflicts with the principle of transparency.
TIME INCONSISTENCYTaxpayers prefer several smaller tax payments over one, large tax payment (“lumpy taxes”) even if their total values are the same.
LOCAL CONTROLTaxpayers prefer taxes they can or believe they can control, such as taxes on discretionary purchases, rather than on necessary purchases.
10TAX STRUCTURE WORK GROUP PRELIMINARY REPORT Results of Economic Analyses | DECEMBER 2020

Research Questions from
Tax Reviews
Three related efforts to review Washington State’s system of taxation — the 2002 Gates Study, the 2018 House Report, and ESHB 1109 — generated ten specific tax reform concepts that state law required the Department of Revenue to conduct economic analysis on.
2002 GATES STUDY:
1. Eliminate the B&O tax and replace it with a “subtraction method” VAT.
2. Eliminate the B&O tax, reduce the sales tax, and replace with a with a CINR tax (along with a PIT).
3. Eliminate the B&O tax, reduce the sales tax, eliminate the property tax, and replace with a with a CINR tax (along with a PIT).
4. Reduce or eliminate state sales, state property, and B&O taxes and replace with a PIT, estimated with both a graduated and flat rate structure.
2018 HOUSE REPORT:
5. Eliminate the B&O tax and replace it with a margins tax, modeled after the Texas Franchise Tax.
6. Eliminate the B&O tax and replace it with a CINR tax.
7. Replace the 1% revenue growth limit factor in the state property tax with a limit based on the growth rate of population and inflation.
ESHB 1109:
8. Estimate the revenues that would have been generated during the 2017-19 Biennium had Washington adopted the tax structure of the bordering states of Oregon or Idaho.
9. Estimate impact on taxpayers by studying taxes paid by households at various income levels and taxes paid by different types of businesses.
10. Estimate the impact on taxpayers by comparing the effective state and local tax rates of the tax structure during the 2017-19 Biennium with various alternatives under consideration.
ESHB 1109 requested “to the degree it is practicable, conduct tax incidence analysis of the various alternatives under consideration to account for the impacts of tax shifting, such as business taxes passed along to consumers and property taxes passed along to renters” and “to the degree practicable, present findings and alternatives by geographic area, in addition to statewide”. The Department of Revenue found it impractical to address these important questions over the past year, given the complexity of the questions and resources it had available. However, these topics may be incorporated at a later time by the TSWG.
11 TAX STRUCTURE WORK GROUP PRELIMINARY REPORTDECEMBER 2020 | Results of Economic Analyses
1 These numbers are based on DOR’s summary of Washington state tax collections for Fiscal Years 2018 and 2019 (https://dor.wa.gov/sites/default/files/legacy/docs/reports/2019/Tax_Statis-tics_2019/Table1.pdf). For modeling purposes, DOR relied on information from Economic and Revenue Forecast Council for determining replacement targets; this information differs slightly from the numbers in this chart. The numbers in this chart therefore may not be identical to the replacement amounts referenced in later chapters.
Tax Models &Analysis of 2017-19 Biennium
ESHB 1109 tasked DOR with conducting tax analyses that incorporated one or both of these requirements when updating research from the 2002 Gates Study or the 2018 House Report:
1. Estimate how much revenue a respective tax alternative would have generated for the 2017-19 Biennium if implemented on January 1, 2003.
2. Estimate the tax rates necessary to implement the tax alternative to achieve the actual revenues generated during the 2017-19 Biennium.
For the most part, these analyses seek to understand the “revenue generated” or “tax rates needed” relative to the state’s tax revenues and tax bases (i.e., market value of property, taxable spending, business gross receipts, etc.) that existed during the 2017-19 Biennium.
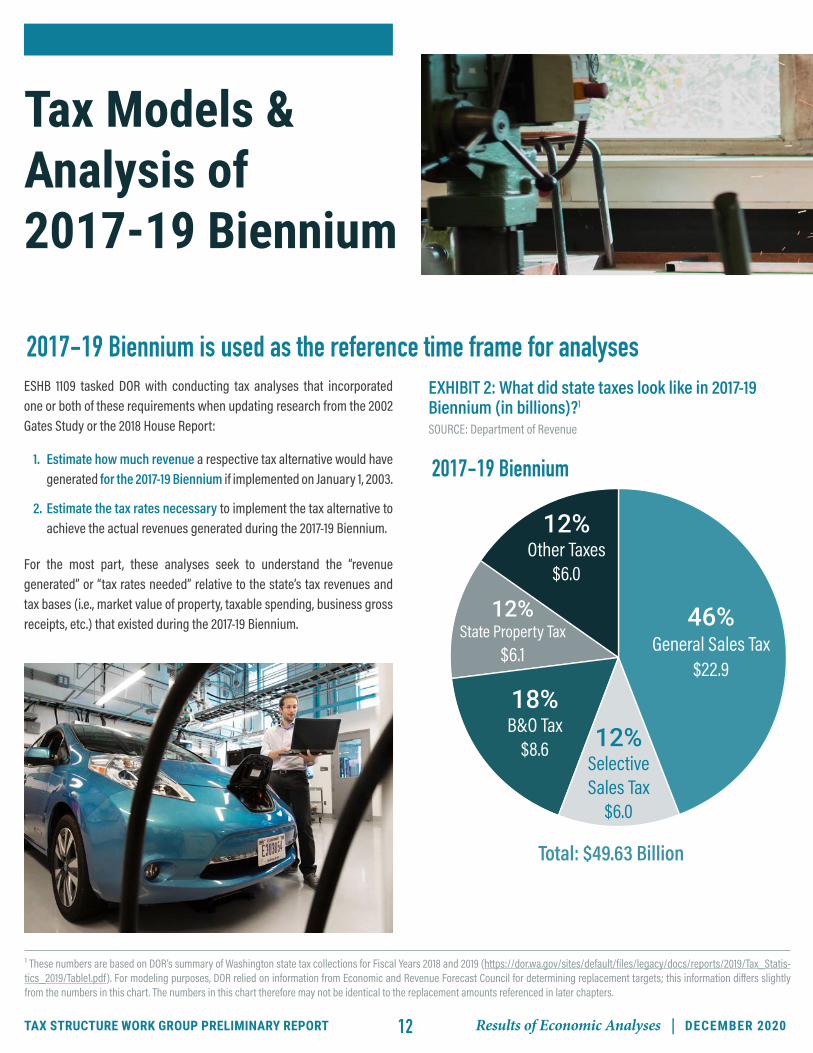
EXHIBIT 2: What did state taxes look like in 2017-19 Biennium (in billions)?1 SOURCE: Department of Revenue
2017-19 Biennium
46%General Sales Tax
$22.9
12%Other Taxes
$6.0
12%State Property Tax
$6.1
12%SelectiveSales Tax
$6.0
18%B&O Tax
$8.6
Total: $49.63 Billion
2017-19 Biennium is used as the reference time frame for analyses
12TAX STRUCTURE WORK GROUP PRELIMINARY REPORT Results of Economic Analyses | DECEMBER 2020

Technical models were created to answer the research questionsTo accomplish this, the Department of Revenue built models and analyses in the following areas. The Department of Revenue is responsible for all tax modeling and results. The Department created a technical advisory group to provide advice and assistance with analyzing and modeling taxes not currently part of Washington’s tax structure such as a corporate income/net receipts tax, value added tax, and personal income tax. These technical advisory group come from a diverse background of academics, trade professionals, and tax policy researchers. They helped the Department brainstorm data sources, develop key assumptions, and refine approaches in developing the tax analyses.
EXHIBIT 3: Tax Analysis Overview
LOCATE REVENUE TARGETSThe law asked DOR to find revenue neutral rates for specific tax alternatives. This required finding target revenue levels in place over the 2017-19 Biennium.
IDENTIFY WASHINGTON TAX BASESince these taxes are not in use in Washing-ton, DOR needed to identify the incomes and revenues that would be subject to the taxes for individuals and businesses.
APPLY APPROPRIATE TAX POLICIESThese taxes allow for the application of differing levels of exemptions, deductions, and credits that DOR accounted for.
DETERMINE RATES THAT MEET TARGETSDOR then solved for the commensurate tax rates needed to meet the revenue replacement targets.
CURRENT STATE TAXES• Business and
Occupation Taxes• Retail Sales Tax• Property Tax• Real Estate Excise Tax• Public Utility Taxes
TAX BASES• Business Gross
Receipts• Personal Income• Corporate Income• Other Incomes/Assets/
Spending
POTENTIAL OPTIONS FOR CHANGE• Corporate Income
/ Net Receipts • Value Added Tax• Margins Tax• Personal Income Tax
COMPARISONS• How might business tax
burdens change?• How might household tax
burdens change?
Please see the Technical Notes section for a fuller discussion of the data, methods, and results of this analysis.
13 TAX STRUCTURE WORK GROUP PRELIMINARY REPORTDECEMBER 2020 | Results of Economic Analyses
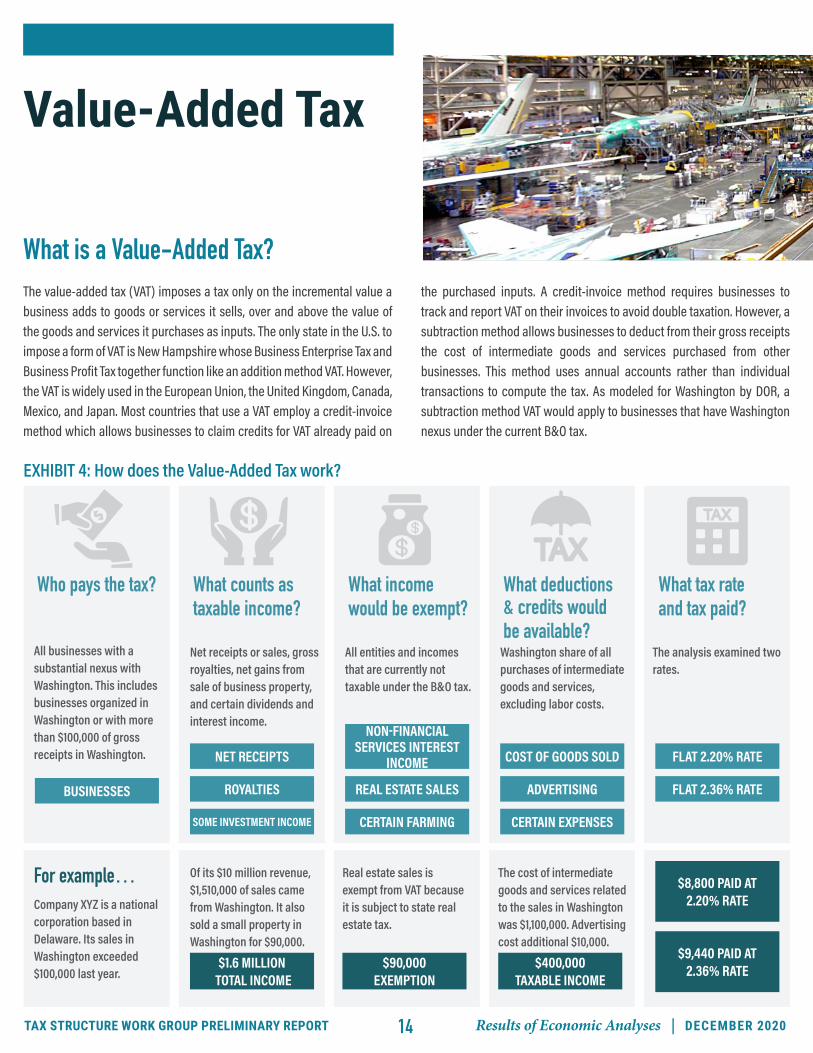
Value-Added Tax
What is a Value-Added Tax?The value-added tax (VAT) imposes a tax only on the incremental value a business adds to goods or services it sells, over and above the value of the goods and services it purchases as inputs. The only state in the U.S. to impose a form of VAT is New Hampshire whose Business Enterprise Tax and Business Profit Tax together function like an addition method VAT. However, the VAT is widely used in the European Union, the United Kingdom, Canada, Mexico, and Japan. Most countries that use a VAT employ a credit-invoice method which allows businesses to claim credits for VAT already paid on
the purchased inputs. A credit-invoice method requires businesses to track and report VAT on their invoices to avoid double taxation. However, a subtraction method allows businesses to deduct from their gross receipts the cost of intermediate goods and services purchased from other businesses. This method uses annual accounts rather than individual transactions to compute the tax. As modeled for Washington by DOR, a subtraction method VAT would apply to businesses that have Washington nexus under the current B&O tax.
EXHIBIT 4: How does the Value-Added Tax work?
All businesses with a substantial nexus with Washington. This includes businesses organized in Washington or with more than $100,000 of gross receipts in Washington.
BUSINESSES
Net receipts or sales, gross royalties, net gains from sale of business property, and certain dividends and interest income.
NET RECEIPTS
Who pays the tax? What counts as taxable income?
Company XYZ is a national corporation based in Delaware. Its sales in Washington exceeded $100,000 last year.
For example…
ROYALTIES
SOME INVESTMENT INCOME
All entities and incomes that are currently not taxable under the B&O tax.
NON-FINANCIAL SERVICES INTEREST
INCOME
What income would be exempt?
REAL ESTATE SALES
CERTAIN FARMING
Washington share of all purchases of intermediate goods and services, excluding labor costs.
COST OF GOODS SOLD
What deductions & credits would be available?
ADVERTISING
CERTAIN EXPENSES
The analysis examined two rates.
FLAT 2.20% RATE
What tax rate and tax paid?
FLAT 2.36% RATE
Of its $10 million revenue, $1,510,000 of sales came from Washington. It also sold a small property in Washington for $90,000.
$1.6 MILLION TOTAL INCOME
Real estate sales is exempt from VAT because it is subject to state real estate tax.
$90,000 EXEMPTION
The cost of intermediate goods and services related to the sales in Washington was $1,100,000. Advertising cost additional $10,000.
$400,000 TAXABLE INCOME
$8,800 PAID AT 2.20% RATE
$9,440 PAID AT 2.36% RATE
14TAX STRUCTURE WORK GROUP PRELIMINARY REPORT Results of Economic Analyses | DECEMBER 2020

EXHIBIT 5: VAT Tax Rates and Revenues Replaced
What is the Department of Revenue required to update?DOR updated research from the 2002 Gates Study that contemplated replacing the B&O tax with a subtraction method VAT. The analysis addressed two questions:
• Find the tax rate to replace $8.59 billion (i.e., the rate required to match the revenue raised through B&O taxes during the 2017-19 Biennium).
• Find the tax revenue raised with a 2.2% Subtraction Method VAT tax rate for 2017-19 Biennium (i.e., the rate recommended in the 2002 Gates Study).
Please see the Technical Notes section for a fuller discussion of the data, methods, and results of this analysis.
What did the Department of Revenue find?During the 2017-2019 Biennium, there would have been $383 billion in taxable business income after deductions in the state under a VAT. A revenue-neutral tax rate of 2.36% would be needed to replace $8.5 billion from the B&O tax, assuming 95% of business tax filers complied with the VAT filing requirements.
VAT rate of 2.20% suggested in the 2002 Gates Study would have generated $8.01 billion, which is $0.58 billion less than what the B&O tax generated during the same time period. This estimate also assumes a 95% compliance factor.
$60
$50
$40
$30
$20
$10
$02017-19
Biennium TaxesRevenue
to ReplaceTax RateNeeded
The B&O Taxwas replaced with a VAT?
What rate would be needed to raise $8.59 billion?
2.36%
Retail Sales & Use B&O Property Tax Public Utility Other Taxes
billio
ns
What if …?2002 Gates Study
$60
$50
$40
$30
$20
$10
$0VAT Rate Revenue
Replaced
The VAT rate was 2.2%(assumed in the 2002 study)?
How muchrevenue wouldit replace?
$8.01 B
billio
ns
What if …?2002 Gates Study
2.2%
15 TAX STRUCTURE WORK GROUP PRELIMINARY REPORTDECEMBER 2020 | Results of Economic Analyses

Margins Tax
What is a Margins Tax?The margins tax is similar to the subtraction method VAT. Businesses are taxed on their gross margins, which are their gross receipts minus returns and allowances and minus cost of goods sold. The Texas Franchise Tax is a form of margins tax that allows deductions for the greater of cost of goods
EXHIBIT 6: How does the Margins Tax work?
All businesses with a substantial nexus with Washington. This includes businesses organized in Washington or with more than $100,000 of gross receipts in Washington.
BUSINESSES
Net receipts or sales, gross royalties, net gains from sale of business property, and certain dividends and interest income.
NET RECEIPTS
Who pays the tax? What counts as taxable income?
Company XYZ is a national corporation based in Delaware. Its sales in Washington exceeded $100,000 last year.
For example…
ROYALTIES
SOME INVESTMENT INCOME
All entities and incomes that are currently not taxable under the B&O tax.
NON-FINANCIAL SERVICES INTEREST
INCOME
What income would be exempt?
REAL ESTATE SALES
CERTAIN FARMING
Maximum of the Washington share of the following:
TOTAL COMPENSATION
What deductions & credits would be available?
$1 MILLION
30% OF REVENUE
The analysis examined one rate.
FLAT 2.70% RATE
What tax rate and tax paid?
Of its $10 million revenue, $1,510,000 of sales came from Washington. It also sold a small property in Washington for $90,000.
$1.6 MILLION TOTAL INCOME
Real estate sales is exempt from VAT because it is subject to state real estate tax.
$90,000 EXEMPTION
The cost of goods sold in the state was $780,000. 15.1% of the $1 million flat deduction is $151,000. The company chooses the $780,000 deduction.
$730,000 TAXABLE INCOME
$19,710 PAID AT 2.70% RATE
COST OF GOODS SOLD
sold, compensation paid, a fixed percentage (30%) of total revenue, or a flat amount ($1 million). The margins tax considered in the 2018 House Report and this preliminary report is modeled after the Texas Franchise Tax.
16TAX STRUCTURE WORK GROUP PRELIMINARY REPORT Results of Economic Analyses | DECEMBER 2020

What is the Department of Revenue required to update?DOR updated research from the 2018 House Report recommendation that contemplated replacing the $8.59 billion generated by the B&O tax in the 2017-19 Biennium with a margins tax.
Please see the Technical Notes section for a more complete discussion of the data, methods, and results of this analysis.
What did the Department of Revenue find?DOR estimated there would have been $335 billion in taxable business income after deductions in the state during the 2017-19 Biennium under the margins tax base. A revenue-neutral tax rate of 2.70% would be needed to replace $8.59 billion from the B&O tax, assuming a 95% compliance factor. The 2002 Gates Study did not suggest any margins tax rates.
What’s the difference between the VAT and margins tax?The two methods are similar in that businesses are taxed on their gross margins, which are their gross receipts minus returns and allowances. However, the allowed deductions are different. The VAT would allow taxpayers to deduct all purchases of intermediate goods and services, which include cost of goods sold (COGS), repairs and maintenance, interest expenses, advertising, and other deductions. Other deductions include expenses such as office supplies, fuel, utilities, insurance, consultant and legal fees, bank charges, meals and entertainment, and travel expenses. Intermediate goods and services do not include the cost of labor related to producing the goods and services.
EXHIBIT 7: Margins Tax Rate to Replace Revenue
$60
$50
$40
$30
$20
$10
$02017-19
Biennium TaxesRevenue
to ReplaceTax RateNeeded
The B&O Taxwas replaced with a VAT?
What rate would be needed to raise $8.59 billion?
2.70%
Retail Sales & Use B&O Property Tax Public Utility Other Taxes
billio
ns
What if …?2018 House Report
The margins tax would allow taxpayers to choose between four possible deductions: COGS, total compensation, $1 million, and 30% of total revenue. The third option would result in no margins tax liabilities for businesses with less than $1 million in gross receipts. The fourth option would ensure no more than 70% of gross receipts is taxed. For taxpayers that choose to deduct COGS from the gross margins, their total deductions under the margins tax would be smaller than under the VAT because deductions under the VAT include purchases other than COGS.
17 TAX STRUCTURE WORK GROUP PRELIMINARY REPORTDECEMBER 2020 | Results of Economic Analyses

Corporate Income-Net Receipts TaxWhat is a Corporate Income-Net Receipts Tax?The corporate income-net receipts tax would apply to businesses that pay the federal corporate income tax. Pass-through entities, such as sole proprietorships and S-corporations taxable through the individual income tax, would not pay the CINR tax. Unlike the B&O tax, a CINR tax would allow
deductions for most of the expenses related to operating a business, such as cost of goods sold, salaries and wages, and rent. Federal and state tax systems include tax credits and minimum tax payments in their calculation of taxes due, but none is considered in the models for simplicity.
EXHIBIT 8: How does the Corporate Income-Net Receipts Tax work?
C-corporations and foreign corporations with a substantial nexus in Washington..
FOREIGN CORPORATIONS
The Washington portion of income taxable under federal corporate net income tax, including:
GROSS PROFIT
Who pays the tax? What counts as taxable income?
XYZ Corp is a national corporation based in Delaware that files a Form 1120 federal income tax. Its sales in Washington exceeded $100,000 last year.
For example…
CAPITAL GAINS
INTEREST INCOME
All entities and income that are currently not taxable under the federal corporate net income tax.
S-CORPORATIONS
What income would be exempt?
SOLE PROPRIETORS
Washington share of deductions under federal corporate net income tax, including:
DEPRECATION
What deductions & credits would be available?
ADVERTISING
PENSION & BENEFITS
The analysis examined three rates. The two lower rates would also apply to individual incomes.
FLAT 4.75% RATE
What tax rate and tax paid?
Its U.S. revenue last year was $550 million, but only 10% can be apportioned to Washington.
$55 MILLION TOTAL INCOME
No exemptions for XYZ corporation in this specific example.
Employees and executives were paid $150 million with other deductible costs coming to $350 million. Only 10% can be apportioned to Washington.
$5 MILLION TAXABLE INCOME
TOTAL COMPENSATION
FLAT 3.59% RATE
FLAT 15.8% RATE
$790,000 PAID AT 15.8% RATE
$237,500 PAID AT 4.75% RATE
$179,500 PAID AT 3.59% RATE
C-CORPORATIONS
18TAX STRUCTURE WORK GROUP PRELIMINARY REPORT Results of Economic Analyses | DECEMBER 2020

What is the Department of Revenue required to update?DOR performed three analyses related to CINR tax from the 2002 Gates Study and 2018 House Report. The analyses extended beyond corporate income and set personal income tax (PIT) rates at the CINR levels for the options discussed in the 2002 Gates Study (described below).
• CINR TAX OPTION A (2002 GATES STUDY): Find the CINR/PIT tax rate to replace $18.79 billion (2017-19 Biennium). This policy option would allow elimination of the B&O tax and reduction of the retail sales tax to 3.5% (from 6.5%), while remaining revenue neutral. The analysis also involved finding the tax revenue raised with a 3.8% CINR/PIT tax rate (2017-19 Biennium).
• CINR TAX OPTION B (2002 GATES STUDY): Find the CINR/PIT tax rate to replace $24.82 billion (2017-19 Biennium). This rate solution would allow elimination of the B&O tax and state property tax and the reduction of the retail sales tax to 3.5% (from 6.5%), while remaining revenue neutral. The analysis also involved finding the tax revenue raised with a 5.0% CINR/PIT tax rate (2017-19 Biennium).
• CINR TAX OPTION C (2018 HOUSE REPORT): Find the CINR tax rate to replace $8.59 billion (2017-19 Biennium). This option would eliminate only the B&O tax and has no PIT component.
Please see the Technical Notes section for a more complete discussion of the data, methods, and results of this analysis.
What did the Department of Revenue find?During the 2017-2019 Biennium, there would have been $57.21 billion in taxable business income after deductions in the state under a CINR tax.
The CINR Tax option A would have required the tax rates of CINR tax and PIT to have been 3.59% in order to have generated $18.79 billion in the 2017-19 Biennium. At that rate, CINR tax would have generated $1.95 billion, or about 10%, of the revenue, and PIT would have generated $16.84 billion, or about 90% of the revenue.
A CINR/PIT rate of 3.80%, advanced in the 2002 Gates Study, would have generated $19.87 billion in the 2017-19 Biennium (CINR tax: $2.07 billion, PIT: $17.80 billion). This amount is $1.08 billion greater than what was generated during the same period by the taxes that would be eliminated or reduced.
The CINR Tax option B would have required the tax rates of CINR tax and PIT to have been 4.75% in order to have generated $24.82 billion in the 2017-19 Biennium (CINR tax: $2.58 billion, PIT: $22.24 billion).
A CINR/PIT rate of 5.00%, advanced in the 2002 Gates Study, would have generated $26.14 billion in revenue during the 2017-19 Biennium (CINR tax: $2.72 billion, PIT: $23.42 billion). This amount is $1.32 billion greater than what was generated during the same period by the taxes that would be eliminated or reduced.
The CINR Tax option C would have required a 15.80% rate for the CINR tax to have fully replaced the $8.59 billion raised by the B&O tax during the 2017-19 Biennium. No PIT is considered with this option.
All tax estimates above assume a 95% compliance factor.
19 TAX STRUCTURE WORK GROUP PRELIMINARY REPORTDECEMBER 2020 | Results of Economic Analyses

EXHIBIT 9: CINR Tax Rates and Revenues Replaced
$60
$50
$40
$30
$20
$10
$02017-19
Biennium TaxesRevenue
to ReplaceTax RateNeeded
The B&O tax was eliminated and the state sales tax reduced to 3.5%?
What flat CINR and PIT rate would be needed to raise $18.79 billion?
3.59%
Retail Sales & Use B&O Property Tax Public Utility Other Taxes
billio
ns
What if …?CINR Tax Option A
$60
$50
$40
$30
$20
$10
$0CINR & PIT Rate Revenue
Replaced
The CINR and PIT rate was 3.8% (assumed in the 2002 study)?
How much revenue would it have replaced?
$19.9 Bbillio
ns
What if …?CINR Tax Option A
3.8%
$60
$50
$40
$30
$20
$10
$02017-19
Biennium TaxesRevenue
to ReplaceTax RateNeeded
The B&O tax and property tax were eliminated and the state sales tax reduced to 3.5%?
What flat CINR and PIT rate would be needed to raise $24.82 billion?
4.75%
Retail Sales & Use B&O Property Tax Public Utility Other Taxes
billio
ns
What if …?CINR Tax Option B
$60
$50
$40
$30
$20
$10
$0CINR & PIT Rate Revenue
Replaced
The CINR and PIT rate was 5.0% (assumed in the 2002 study)?
How much revenue would it have replaced?
$26.1 B
billio
ns
What if …?CINR Tax Option B
5.0%
$60
$50
$40
$30
$20
$10
$02017-19
Biennium TaxesRevenue
to ReplaceTax RateNeeded
The B&O tax was replaced with a CINR tax?
What rate would be needed to raise $8.59 billion?
15.8%
Retail Sales & Use B&O Property Tax Public Utility Other Taxes
billio
ns
What if …?CINR Tax Option C
20TAX STRUCTURE WORK GROUP PRELIMINARY REPORT Results of Economic Analyses | DECEMBER 2020

Personal Income Tax
What is a personal income tax?The personal income tax (PIT) in Washington would work similarly to the federal individual income tax. Each taxpayer’s taxable income would be based on the adjusted gross income (AGI) minus deductions and personal exemptions. Deductions could include a standard deduction and
EXHIBIT 10: How does the Personal Income Tax work?
deductions for the elderly and the disabled. The taxpayers would also have access to an out-of-state credit for income taxes paid outside Washington and a B&O credit for taxpayers with pass-through income from businesses that paid B&O taxes.
The tax would apply to people living and working at least part of the year in Washington.
INDIVIDUALS
Wages, investment income, and income from pass-through entities (i.e., S-corps, partnerships, etc.) would be taxable.
WAGES
Who pays the tax? What counts as taxable income?
Andres and his spouse lived and worked in the state for the entire year.
For example…
INVESTMENT INCOME
PASS-THROUGH INCOME
Filers can reduce their taxable income based on a personal exemption for each household member, including dependents.
PERSONAL
What income would be exempt?
SPOUSE
DEPENDENTS
Filers would be eligible to claim a series of standard deductions and credits.
STANDARD
What deductions & credits would be available?
B&O CREDIT
OUT-OF-STATE CREDIT
The analysis examined a series of flat tax and graduated tax rates.
GRADUATED RATE
What tax rate and tax paid?
Combined, they both made $85,000 in adjusted gross income.
$85,000 ADJUSTED GROSS INCOME
They each take a personal exemption (they have no dependents).
$77,500 TAXABLE INCOME
They take the standard joint deduction as a married couple (they do not own a business or work out of state).
$64,500 TAXABLE INCOME
FLAT RATE
$1,950 PAID WITH A 3.04%
GRADUATED TAX RATE
$2,350 PAID WITH A 3.64% FLAT TAX RATE
21 TAX STRUCTURE WORK GROUP PRELIMINARY REPORTDECEMBER 2020 | Results of Economic Analyses

What is the Department of Revenue required to update?DOR updated the PIT analysis completed in the 2002 Gates Study. The study recommended a flat rate PIT structure, and DOR also included a graduated (higher rates for higher income levels) rate structure. The study suggested that the PIT rate options include iterations to other revenue sources:
• SALES TAX: reduce or eliminate
• PROPERTY TAX: maintain or eliminate
• B&O TAX: maintain or replace with CINR
These options are specified in the graphics below, ultimately relating a rate structure to a revenue replacement target. There are six different options (A-F) put forth in the 2002 Gates Study that have been reproduced as part of this analysis. Tax options A to D reduce or eliminate the retail sales and use tax and the state property tax. Tax alternatives E and F resemble tax alternatives A and B but also include a CINR tax of the same PIT rate that eliminates the B&O tax.
Please see the Technical Notes section for a fuller discussion of the data, methods, and results of this analysis.
EXHIBIT 11: What personal income tax rates would be needed for a flat or graduated rate tax structure?
What did the Department of Revenue find?The rates estimated in the model are in Exhibit 11 (this and the facing page). As expected, higher revenue replacement targets would require relatively higher flat tax rates. As noted in the CINR tax section, options E and F use the same flat rate as the PIT, which generates a higher share of the revenue replacement.
DOR also found tax collections information for tax year 2017 and for each AGI category, with a flat PIT rate of 3.64% (Option B). Total tax collections amounted to $7 billion, with $236 billion of $292 billion in AGI being taxable. The data also shows that the effective rate of the PIT is progressive across income categories, as lower tax rates are associated with lower incomes. There are two reasons for this. First, the deductions and the exemption (i.e. the adjustments) greatly reduce tax liability for those with lower incomes, but figure as a fraction of gross income for those with the highest incomes (see lower chart in Exhibit 12). Second, taxpayers with higher incomes make greater use of the B&O and Out-of-State credits, and because of this, those with an AGI over $500,000 have a lower effective rate than those with slightly lower incomes.
2002 GATES STUDYWhat does the state tax structure look like with a PIT? OPTION A OPTION B OPTION C OPTION D OPTION E OPTION F
Property Tax? No Change Eliminate No Change Eliminate No Change Eliminate
Sales Tax? Reduce: 3.5% Reduce: 3.5% Eliminate Eliminate Reduce: 3.5% Reduce: 3.5%
B&O tax? No Change No Change No Change No Change Eliminate Eliminate
With CINR? No No No No Same PIT rate Same PIT rate
How much revenue is replaced?
What would the flat PIT rate be? 2.30% 3.64% 5.08% 6.40% 3.59% 4.75%
$60
$50
$40
$30
$20
$10
$0
OPTION AOther GF Revenues
Revenue Replaced
billio
ns
OPTION B OPTION C OPTION D OPTION E OPTION F
$11.5$16.9
$24.7$30.2
$19.9$26.1
22TAX STRUCTURE WORK GROUP PRELIMINARY REPORT Results of Economic Analyses | DECEMBER 2020

EXHIBIT 12: Tax Year 2017 Tax Statistics by AGI Level, with Flat Rate PIT at 3.64%
What would the PIT rate be if it was graduated? OPTION A OPTION B OPTION C OPTION D OPTION E OPTION F
TIER 1 1.18% 1.85% 2.58% 3.25% N/A N/A
TIER 2 2.49% 3.90% 5.44% 6.86% N/A N/A
TIER 3 3.80% 5.96% 8.31% 10.47% N/A N/A
What are the income brackets for the tiers? TIER 1 TIER 2 TIER 3
Single Up to $31,275 $31,275 to $75,775 Over $75,775
Joint Up to $62,550 $62,550 to $151,550 Over $151,550
Head of Household Up to $41,850 $41,850 to $75,800 Over $75,800
23 TAX STRUCTURE WORK GROUP PRELIMINARY REPORTDECEMBER 2020 | Results of Economic Analyses

Alternative Property Tax Growth LimitationWhat is Washington’s property tax growth limitation?Until 2017, the state property tax was “budget-based”. Taxing districts determined a budget for each fiscal year and then set a total property tax levy that would be required to fund the budget. State law limited the annual growth in property taxes to the lesser of 1% or the implicit price deflator (commonly referred to as the 1% limit).
In 2017, Washington temporarily switched to a rate-based system for its property tax to increase funding for schools. The levy rate was set at $2.70 per $1,000 of assessed value for tax years 2018, 2020, and 2021 and $2.40 for tax year 2019. The increase in the property tax rate followed the state supreme court’s decision in McCleary v. State of Washington, which found the state was not meeting its constitutional requirement to provide adequate educational services to all children. The state property tax levy returns to the 1% budget-based limitation in the tax year 2022.
What was the Department of Revenue required to analyze?The Department of Revenue estimated how much revenue would have been generated for the 2017-19 Biennium if — rather than having enacted a 1% annual growth limit — the state had tied property tax limits to the growth in population and inflation since January 1, 2003.
The Department of Revenue has created two analyses to understand better the impact of these changes to account for recent changes to the State Property Tax:
• With McCleary changes. The analysis considers the fundamental changes to the state property tax that resulted in a two-part levy that fixed the levy rate over tax years 2018-2021 before returning both parts of the levy to the 1% limit rule in 2022.
• Without McCleary changes. The analysis considers that the changes above never took place and 1% limit rule remained in place.
EXHIBIT 13: How would a population-inflation rate compare to the 1% limit?
Please see the Technical Notes section for a fuller discussion of the data, methods, and results of this analysis.
-2.0%
-1.0%
0.0%
1.0%
2.0%
3.0%
4.0%
5.0%
6.0%
7.0%
2004 2005 2006 2007 2008 2009 2010 2011 2012 2013 2014 2015 2016 2017 2018 2019 2020
Levy
Lim
it Ra
te
1% limit rule Combined population and inflation rate Additional percentage levy growth enabled with population & inflation rate
24TAX STRUCTURE WORK GROUP PRELIMINARY REPORT Results of Economic Analyses | DECEMBER 2020
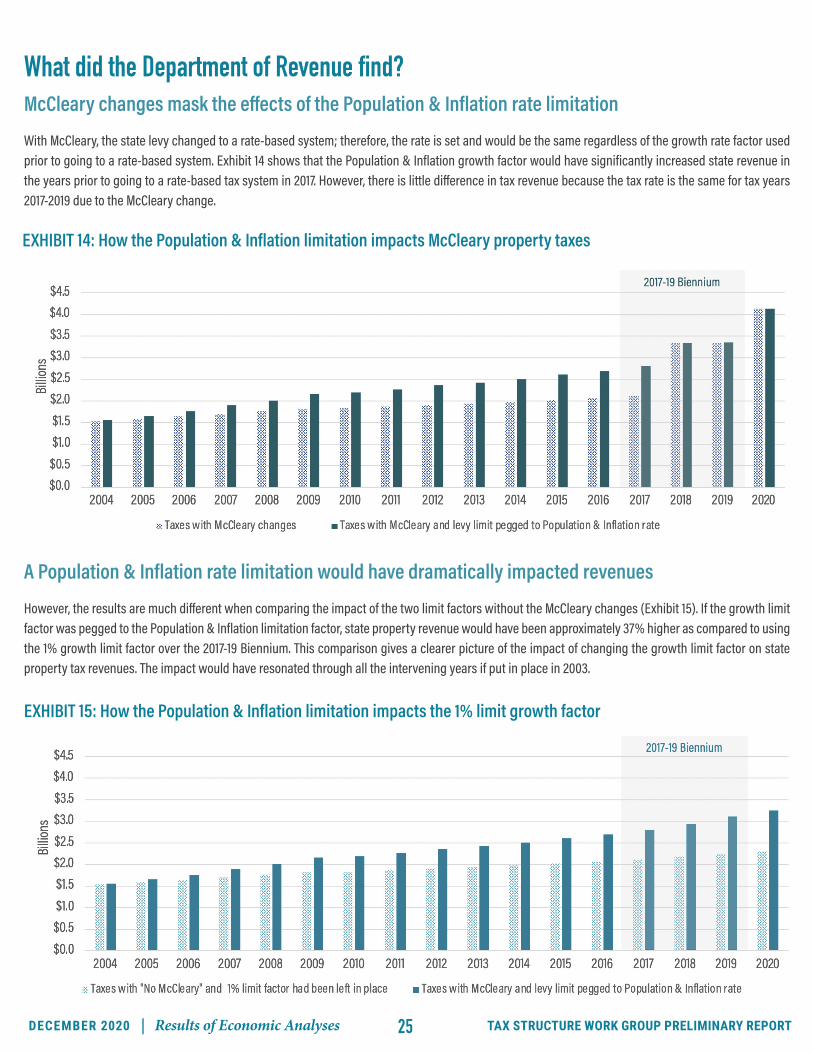
What did the Department of Revenue find?McCleary changes mask the effects of the Population & Inflation rate limitation
With McCleary, the state levy changed to a rate-based system; therefore, the rate is set and would be the same regardless of the growth rate factor used prior to going to a rate-based system. Exhibit 14 shows that the Population & Inflation growth factor would have significantly increased state revenue in the years prior to going to a rate-based tax system in 2017. However, there is little difference in tax revenue because the tax rate is the same for tax years 2017-2019 due to the McCleary change.
EXHIBIT 14: How the Population & Inflation limitation impacts McCleary property taxes
A Population & Inflation rate limitation would have dramatically impacted revenues
However, the results are much different when comparing the impact of the two limit factors without the McCleary changes (Exhibit 15). If the growth limit factor was pegged to the Population & Inflation limitation factor, state property revenue would have been approximately 37% higher as compared to using the 1% growth limit factor over the 2017-19 Biennium. This comparison gives a clearer picture of the impact of changing the growth limit factor on state property tax revenues. The impact would have resonated through all the intervening years if put in place in 2003.
EXHIBIT 15: How the Population & Inflation limitation impacts the 1% limit growth factor
25 TAX STRUCTURE WORK GROUP PRELIMINARY REPORTDECEMBER 2020 | Results of Economic Analyses

Bordering States Tax Structure
How does Washington’s tax structure compare to border states?The tax regimes in Washington, Oregon, and Idaho are varied and complex. A comprehensive analysis of all sources of tax revenues in the three states was infeasible given DOR’s research timeline, so the department focused on important differences in the states’ key sources of revenue. Regardless, the focus on major taxes provides some comparative point of reference of the key differences between the states.
What was the Department of Revenue required to analyze?The Department of Revenue estimated the revenues that would have been generated during the 2017-19 Biennium had Washington adopted the tax structure of Oregon and Idaho. The approach taken by the Department of Revenue analysis generally follows the following methodological structure:
• Document FY 2018 and 2019 Washington State tax revenues for the selected major state taxes.
• Identify and approximate comparative state tax rates applicable to relevant segments of Washington State’s tax base for both state and local portions.
• Transform Washington State respective tax bases to adjust to identified relevant Oregon or Idaho tax law and exemptions and/or deductions.
• Estimate alternative tax revenues by applying Oregon and Idaho rates to the transformed Washington State tax bases.
Please see the Technical Notes section for a fuller discussion of the data, methods, and results of this analysis.
What did the Department of Revenue find?If Washington adopted Idaho or Oregon’s tax codes, total collections would have increased. Idaho’s code would have generated more revenue than Oregon’s. The key driver of the finding are threefold. First, Washington does not have a personal income tax. Second, Washington has experienced strong growth in personal incomes since the late 1980s making the application of Oregon’s and Idaho’s personal income tax rates very revenue productive — this is particularly true in the Oregon context where the highest marginal personal income tax rate is 9.9%. Lastly, Idaho also maintains a state level sales tax. Even though the tax rate is lower than Washington’s, Idaho does not exempt the purchase of “basic food”, which makes the retail sales base effectively larger than is currently the case in Washington.
While not shown in the data here, a large distinction in the Oregon and Idaho tax structure analysis is “who the levier of the tax is”, namely, whether it is a state or local tax. The analysis here just considers the state portion, and not the local portion. Due to the nature of the statewide tax structure in these places, the tax structure may favor the state revenue perspective at the expense of local governments. For example, while the analysis suggests that Washington would generate $1.8 billion more revenue with Oregon’s tax structure, it would do so while also generating $4.0 billion less for local governments. While Oregon does not have a state property tax, it does have a local property tax used to fund local governments such as cities and schools. Similarly, using Idaho’s tax structure in Washington would have generated $12.6 billion more revenue while also generating $3.5 billion less to local governments due to the same issue with the property tax.
26TAX STRUCTURE WORK GROUP PRELIMINARY REPORT Results of Economic Analyses | DECEMBER 2020

EXHIBIT 16: Washington’s current taxes and what taxes might look like if it had Oregon or Idaho’s tax structure
STATE LEVEL TAX WASHINGTON OREGON IDAHO WA OR ID NOTES
Retail Sales Tax $22.93 $0.00 $21.17 Oregon has no retail sales tax. Idaho has a state sales tax (6%), however, basic foods are not exempt as they are in Washington.
Property Tax $6.69 $0.00 $0.00 Washington is the only state with a state level property tax. Property taxes in Oregon and Idaho are limited to local taxing jurisdictions.
Business & Occupation Tax $8.60 $0.00 $0.00 While Oregon and Idaho both tax corporations through an income tax, Washington’s main “business tax” is a gross receipts B&O tax.
Public Utility Tax $0.84 $0.00 $0.00 The public utility tax is a tax on public service businesses engaged in utilities. The tax is in lieu of the B&O tax and it levied on gross receipts.
Real Estate Excise Tax $2.37 $0.00 $0.00 Oregon and Idaho do not have a state level real estate excise tax.
Gas Tax $2.73 $1.95 $1.82Oregon and Idaho both levy a gas tax based on gallons purchased similar to the state of Washington. Washington ($0.495/gallon), Oregon ($0.368/gallon), Idaho ($0.330/gallon).
Cigarette Tax $0.70 $0.46 $0.20Washington, Oregon, and Idaho all levy a tax on cigarettes based on the number of packs purchased. Washington ($3.025/pack), Oregon ($1.330/pack), Idaho ($0.570/pack).
Corporate Income Tax $0.00 $4.86 $4.36Washington does not have a CINR tax. Idaho had a flat tax rate of 6.925% begin-ning in calendar year 2018. For Oregon, a tax rate of 7.6% applies (taxable income less than $1 million is 6.6%).
Personal Income Tax $0.00 $39.36 $27.94Washington does not have a personal income tax. Both Oregon and Idaho levy a personal income tax. Oregon's highest marginal rate is 9.9%. Idaho's highest marginal rate is 6.925%.
TOTAL REVENUES $44.87 $46.63 $56.45 Washington with Idaho’s tax structure would generate more taxes due to having both a personal and corporate income tax, as well as, a state sales tax.
Note: all figures in billions of dollars
27 TAX STRUCTURE WORK GROUP PRELIMINARY REPORTDECEMBER 2020 | Results of Economic Analyses
8.2%
6.5%5.7%
5.1%4.7%
4.2%3.7%
3.3%
1.8%
0%
1%
2%
3%
4%
5%
6%
7%
8%
9%
$0
$1,000
$2,000
$3,000
$4,000
$5,000
$6,000
$7,000
$8,000
$9,000
$10,000
Up to $17 K
$17 K to $30 K
$30 K to $44 K
$44 K to $58 K
$58 K to $74 K
$74 K to $92 K
$92 K to $115 K
$115 K to $146 K
$146 K to $208 K
Over $208 K
Perc
ent o
f Inco
me to
Taxe
s
Aver
age T
ax Pa
id
Income DecilesState Retail Sales Tax State Property Tax Real Estate Excise Tax Gasoline Tax Selective Sales Taxes Other State Taxes Tax as % of Income
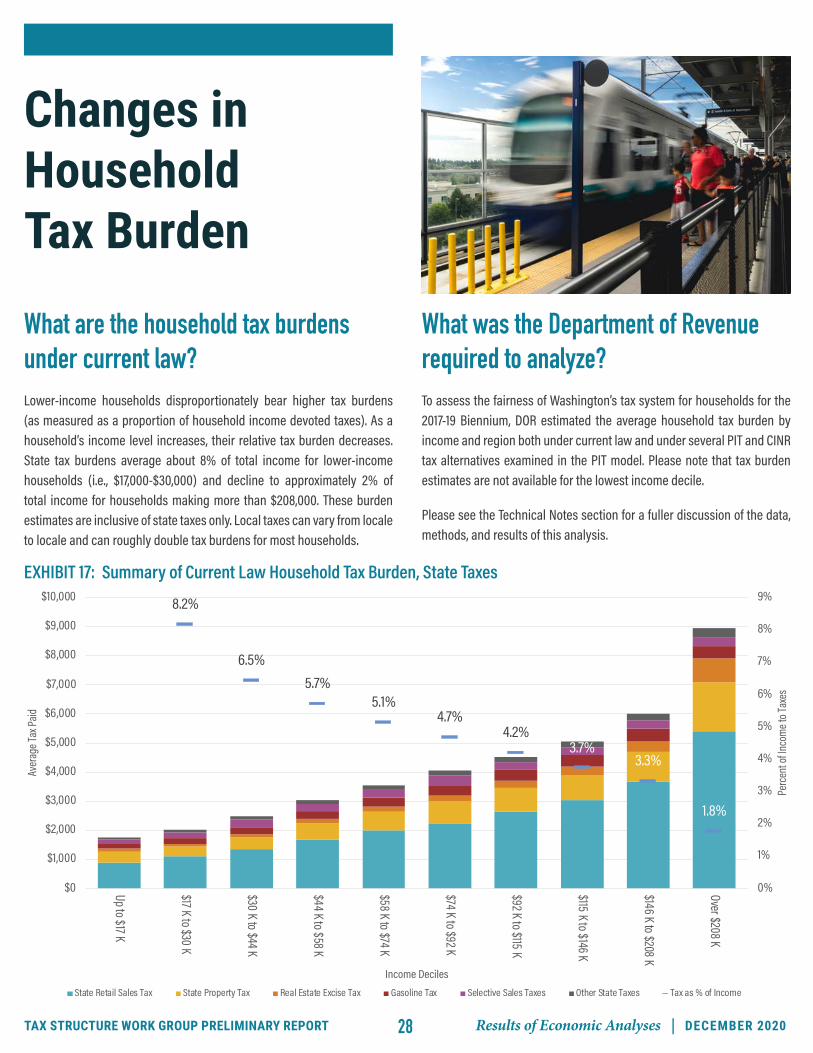
Changes in Household Tax Burden
What are the household tax burdens under current law?Lower-income households disproportionately bear higher tax burdens (as measured as a proportion of household income devoted taxes). As a household’s income level increases, their relative tax burden decreases. State tax burdens average about 8% of total income for lower-income households (i.e., $17,000-$30,000) and decline to approximately 2% of total income for households making more than $208,000. These burden estimates are inclusive of state taxes only. Local taxes can vary from locale to locale and can roughly double tax burdens for most households.
What was the Department of Revenue required to analyze?To assess the fairness of Washington’s tax system for households for the 2017-19 Biennium, DOR estimated the average household tax burden by income and region both under current law and under several PIT and CINR tax alternatives examined in the PIT model. Please note that tax burden estimates are not available for the lowest income decile.
Please see the Technical Notes section for a fuller discussion of the data, methods, and results of this analysis.
EXHIBIT 17: Summary of Current Law Household Tax Burden, State Taxes
28TAX STRUCTURE WORK GROUP PRELIMINARY REPORT Results of Economic Analyses | DECEMBER 2020

What did the Department of Revenue find?Graduated PIT rates, which increase with household income, can produce sizable effects on household tax burdens at the both ends of the income scale. Flat PIT rates have little or no effect on regressivity. For reference, the federal poverty level for a family of four is $21,720 in income for 2020 and the median household income for Washington is estimated at $ 74,992 by the Office of Financial Management for 2019.
EXHIBIT 18: Comparison of Household Tax Burden Changes
• FLAT AND GRADUATED PIT RATES: Option D produced sizable decreases in the tax burden for lower-income households and increases in burdens for higher-income households.
• FLAT AND GRADUATED PIT RATES: Option A had modest effects on household tax burden and was only a small deviation from current law.
• FLAT PIT RATES: Option F would shift the tax burden to be higher across all household income groups and maintain the household tax burden’s regressivity.
9.0%
8.0%
7.0%
6.0%
5.0%
4.0%
3.0%
2.0%
1.0%
Income Deciles
More than $208K
$146K to $208K
$115K to $146K
$92K to $115K
$74K to $92K
$58K to $74K
$44K to $58K
$30K to $44K
$17K to $30K
Income Deciles
Tax a
nd P
erce
nt of
Inco
me
More than $208K
$146K to $208K
$115K to $146K
$92K to $115K
$74K to $92K
$58K to $74K
$44K to $58K
$30K to $44K
$17K to $30K
2002 GATES STUDY FLAT RATES GRADUATED RATES
29 TAX STRUCTURE WORK GROUP PRELIMINARY REPORTDECEMBER 2020 | Results of Economic Analyses

Changes in Business Tax BurdenWhat are the business tax burdens under current law?Businesses take taxes into consideration in the location and expansion decisions, so the level and fairness of business taxes is a top concern for policymakers. The B&O tax falls disproportionately on certain industrial sectors due to the emphasis on gross receipts.
What was the Department of Revenue required to analyze?The Department of Revenue estimated the tax incidence for businesses across sectors and sizes in this analysis. Incidence is a measure of the share of their gross revenue paid in taxes (where gross revenue is based on DOR B&O tax data). The analysis calculates the tax burden based on federal income tax data and DOR B&O tax data for C-corporations, S-corporations, and partnerships. Business tax incidence is shown for the current B&O tax and how the tax incidence shifts under a revenue-neutral subtraction method VAT, margins tax, or CINR tax. DOR’s calculations do not include retail sales tax, property tax, or other taxes currently paid by businesses, other than the B&O tax.
Given that the analyzed tax options are revenue neutral, businesses would spend altogether 0.49% of gross revenue on business taxes, just as they do under the current law.
Please see the Technical Notes section for a more complete discussion of the data, methods, and results of this analysis.
EXHIBIT 19: Summary of Current Business Tax Burdens by Sector
1.27%
1.08%
1.00%
0.97%
0.96%
0.90%
0.84%
0.79%
0.71%
0.69%
0.55%
0.54%
0.51%
0.50%
0.47%
0.45%
0.37%
0.28%
0.28%
0.00% 0.20% 0.40% 0.60% 0.80% 1.00% 1.20% 1.40%
Health Care & Social Services
Real Estate and Rental & Leasing
Utilities
Educational Services
Administrative Support & Waste Management
Finance & Insurance
Arts, Entertainment & Recreation
Professional, Scientific & Technical Services
Information
Other Services
Transportation & Warehousing
Management of Companies
Retail Trade
Accommodation & Food Services
Mining, Oil
Construction
Agriculture, Forestry, Hunting & Fishing
Manufacturing
Wholesale Trade
Current Business & Occupation Tax as a Share of Gross Receipts by Sector
Health Care & Social Services
Real Estate and Rental & LeasingUtilities
Educational ServicesAdministrative Support & Waste Management
Finance & InsuranceArts, Entertainment & Recreation
Professional, Scientific & Technical ServicesInformation
Other Services
Transportation & WarehousingManagement of Companies
Retail TradeAccommodation & Food Services
Mining, OilConstruction
Agriculture, Forestry, Hunting & FishingManufacturing
Wholesale Trade
CURRENT BUSINESS & OCCUPATION TAX AS A SHARE OF GROSS RECEIPTS BY SECTOR
30TAX STRUCTURE WORK GROUP PRELIMINARY REPORT Results of Economic Analyses | DECEMBER 2020
0.00% 0.20% 0.40% 0.60% 0.80% 1.00% 1.20% 1.40%
Business Taxes as a Share of Gross Receipts by Sector
Current Business & Occupation Tax 2.36% Value Added Tax 2.70% Margins Tax3.59% Corporate Income/Net Receipts Tax 4.75% Corporate Income/Net Receipts Tax 15.80% Corporate Income/Net Receipts Tax
4.19%
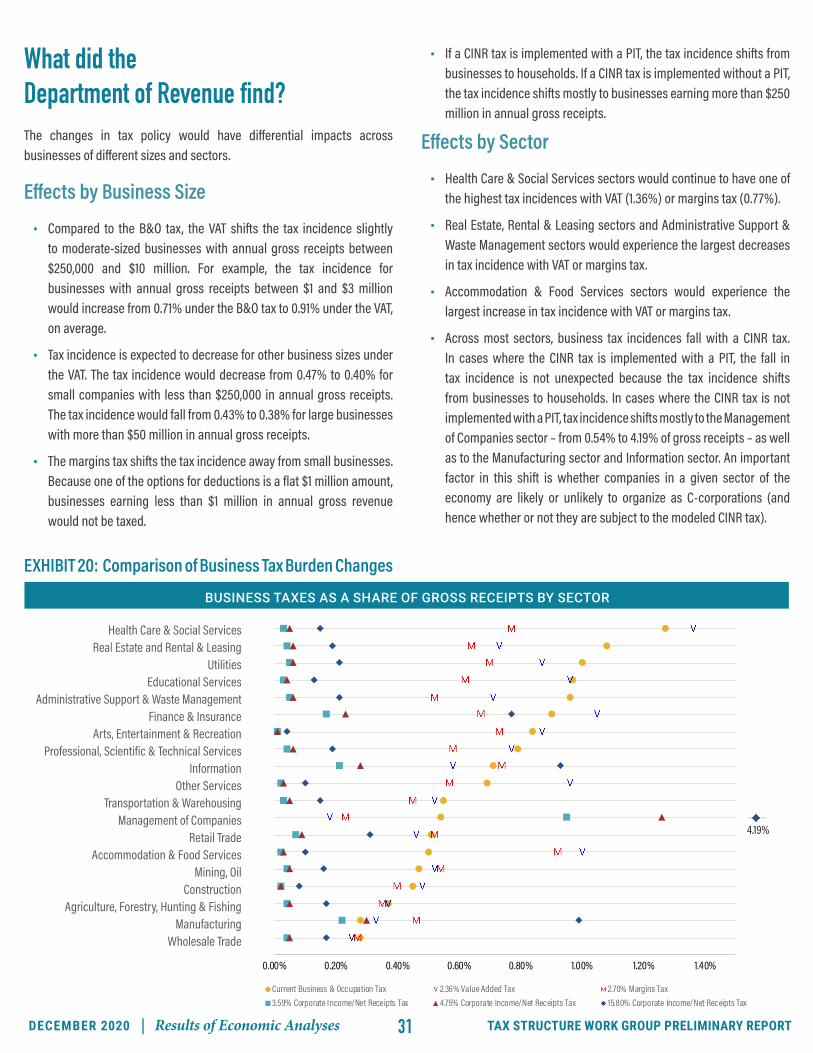
What did the Department of Revenue find?The changes in tax policy would have differential impacts across businesses of different sizes and sectors.
Effects by Business Size
• Compared to the B&O tax, the VAT shifts the tax incidence slightly to moderate-sized businesses with annual gross receipts between $250,000 and $10 million. For example, the tax incidence for businesses with annual gross receipts between $1 and $3 million would increase from 0.71% under the B&O tax to 0.91% under the VAT, on average.
• Tax incidence is expected to decrease for other business sizes under the VAT. The tax incidence would decrease from 0.47% to 0.40% for small companies with less than $250,000 in annual gross receipts. The tax incidence would fall from 0.43% to 0.38% for large businesses with more than $50 million in annual gross receipts.
• The margins tax shifts the tax incidence away from small businesses. Because one of the options for deductions is a flat $1 million amount, businesses earning less than $1 million in annual gross revenue would not be taxed.
• If a CINR tax is implemented with a PIT, the tax incidence shifts from businesses to households. If a CINR tax is implemented without a PIT, the tax incidence shifts mostly to businesses earning more than $250 million in annual gross receipts.
Effects by Sector
• Health Care & Social Services sectors would continue to have one of the highest tax incidences with VAT (1.36%) or margins tax (0.77%).
• Real Estate, Rental & Leasing sectors and Administrative Support & Waste Management sectors would experience the largest decreases in tax incidence with VAT or margins tax.
• Accommodation & Food Services sectors would experience the largest increase in tax incidence with VAT or margins tax.
• Across most sectors, business tax incidences fall with a CINR tax. In cases where the CINR tax is implemented with a PIT, the fall in tax incidence is not unexpected because the tax incidence shifts from businesses to households. In cases where the CINR tax is not implemented with a PIT, tax incidence shifts mostly to the Management of Companies sector – from 0.54% to 4.19% of gross receipts – as well as to the Manufacturing sector and Information sector. An important factor in this shift is whether companies in a given sector of the economy are likely or unlikely to organize as C-corporations (and hence whether or not they are subject to the modeled CINR tax).
EXHIBIT 20: Comparison of Business Tax Burden Changes
BUSINESS TAXES AS A SHARE OF GROSS RECEIPTS BY SECTOR
Health Care & Social ServicesReal Estate and Rental & Leasing
UtilitiesEducational Services
Administrative Support & Waste ManagementFinance & Insurance
Arts, Entertainment & RecreationProfessional, Scientific & Technical Services
InformationOther Services
Transportation & WarehousingManagement of Companies
Retail TradeAccommodation & Food Services
Mining, OilConstruction
Agriculture, Forestry, Hunting & FishingManufacturing
Wholesale Trade
31 TAX STRUCTURE WORK GROUP PRELIMINARY REPORTDECEMBER 2020 | Results of Economic Analyses

Economic Competitiveness Research2
The Department of Revenue entered into an interagency agreement with Western Washington University to address taxation and economic competitiveness for the TSWG. The following section summarizes their report (the full version of the report can be found in the Technical Notes).
The World Economic Forum defines economic competitiveness as “the set of institutions, policies and factors that determine the level of productivity of a country.”3 While that definition focuses on the competitiveness of countries, it is possible to apply it to the competitiveness of regions or states. It is essential to consider that economic competitiveness is too complex
to measure with a single metric. Researchers at Western Washington University (WWU) therefore measured economic competitiveness in this study using several indicators such as Gross Domestic Product (GDP), median income, labor productivity, and net business openings. However, it is not clear how best to combine competitiveness into a single index. Each metric has different strengths and weaknesses, and one metric may be more appropriate to use than the others, depending on the setting.
Washington is Highly Competitive in Comparison to other U.S. States
Washington is highly competitive compared to other states on various potential measures of economic competitiveness, ranking among the top ten states for GDP, median household income, and labor productivity. Other metrics considered in measuring Washington’s economic competitiveness include the cost of living, unemployment rates, and poverty. While Washington is the seventh most expensive state, only seven states had a lower poverty rate than Washington in 2018. It should be noted that not all of these measures considered income inequality in their data and that a considerable portion of the income growth and high cost of living in Washington is centered in urban centers, such as the Seattle metro area.
The WWU research team also compared Washington to other states using the Beacon Hill Index.4 According to this index, Washington is ranked lower on the Beacon Hill Index — precisely 17th in the country. However, researchers at the Economic Policy Institute have criticized the value of this and similar indexes, noting that there are no guidelines for exactly what metrics to consider and how to weigh the different components.
2 This section of the report analyzes Washington’s economic competitiveness relative to other states and explores the relationship between economic competitiveness, tax policies, and tax burden. This information fulfills the budget proviso request to analyze economic competitiveness in the context of the national and global economy, providing comparisons of the current state and local tax structure and various potential alternatives to other states.3 https://www.weforum.org/agenda/2017/09/what-is-economic-competitiveness/ 4 For a detailed description of the index, see: http://beaconhill.org/economic-competitiveness/
32TAX STRUCTURE WORK GROUP PRELIMINARY REPORT Results of Economic Analyses | DECEMBER 2020

Washington has a Low Tax Burden, but the Highest Tax Burden for Low-Income Households
Though Washington ranks higher in economic competitiveness measures, it ranks lower on WalletHub’s amount of personal income that residents pay towards state and local taxes, or tax burden.5 Washington ranked 29 among all other U.S. states, with a total tax burden of 8.32% (2.59% property tax burden and 5.73% sales & excise tax burden). This percentage represents the total tax paid as a share of personal income. However, a low ranking is not necessarily a preferable ranking. The WalletHub rankings do not consider tax effectiveness (whether a state has revenues sufficient to meet the needs it has identified as being important) or equity (whether the tax structure is regressive or progressive).
EXHIBIT 21: Total Tax Burden, Comparison to Other StatesSOURCE: WalletHub 2020 Report
Wallet Hub’s 2020 study noted that Washington had the highest tax burden on low-income households than other states. On the other hand, businesses escape a corporate income tax from Washington but are charged a gross receipts B&O tax instead. The rest of Washington’s revenue is primarily sourced from general sales tax (almost 60%) and property tax (12%). For many states, specific sales taxes (on items ranging from cigarettes and alcohol to amusement) and other particular taxes (including franchise and gross receipts taxes) make up a noticeable portion of total revenue. Note: State ranks for property, income tax, and sales & excise tax burdens are shown within parens .
RANK (1 = HIGHEST) STATE TOTAL
TAX BURDENPROPERTY
TAX BURDENINCOME
TAX BURDENSALES & EXCISE
TAX BURDEN
1 New York 12.28%4.44% 4.40% 3.44%
(6) (1) (26)
13 California 9.27%2.68% 3.56% 3.03%
(30) (5) (34)
22 Massachusetts 8.76%3.60% 3.17% 1.99%
(13) (7) (45)
27 Nevada 8.39%2.17% 0.00% 6.22%
(42) (44) (2)
28 Oregon 8.34%3.09% 4.20% 1.05%
(20) (2) (50)
29 Washington 8.32%2.59% 0.00% 5.73%
(34) (44) (3)
32 Texas 8.20%3.95% 0.00% 4.25%
(9) (44) (9)
37 Idaho 7.93%2.44% 2.31% 3.18%
(36) (24) (31)
41 South Carolina 7.48%2.88% 1.98% 2.62%
(24) (32) (42)
50 Alaska 5.16%3.71% 0.00% 1.45%
(12) (44) (46)
5 https://wallethub.com/edu/states-with-highest-lowest-tax-burden/20494/
33 TAX STRUCTURE WORK GROUP PRELIMINARY REPORTDECEMBER 2020 | Results of Economic Analyses

There is No Robust Relationship Between Taxes or Tax Burden and Economic Competitiveness
In this study, the WWU research team examined the relationship between taxes and economic competitiveness and the relationship between tax burden and economic competitiveness. The findings suggest, first of all, that there is no robust relationship between taxes and economic competitiveness. More specifically, the share of the revenue from sales, income, and corporate taxes, respectively, do not appear to be correlated with median household income. While the percentage of revenue from these sources is associated with employment, the indication is that more tax revenue can lead to more employment. This particular finding counters literature that suggests cutting taxes will lead to economic growth.6
Furthermore, the research team found that the relationship between the tax burden on households and economic competitiveness is also unclear. Some model specifications support literature concluding that reducing taxes on high-income households could improve competitiveness. However, other model specifications point to a different relationship between tax burden and economic competitiveness. Some models suggest it could help to raise taxes on middle-income households, while other models suggest it could be beneficial to reduce taxes on lower-income households.
These different results suggest that one can reach different conclusions about how taxes relate to economic competitiveness, likely because one only needs to change the statistical models in small ways to generate different results. This ambiguity of the connection between tax burden and competitiveness is consistent with the variation of conclusions presented in the literature we reviewed. Specifically, findings discussed in a review by Leachman and Mazerov (2015) add to the general consensus in economic competitiveness literature that tax structure and/or tax burden is, at best, only loosely connected with competitiveness.
On the other hand, non-tax related variables, such as college enrollment and poverty rate are typically significant. It seems that measures that reduce poverty and/or that increase college participation could increase competitiveness.
The combined results suggest no clear, strong relationship between tax burden, tax structure or tax type, and economic competitiveness. In other words, the relationship may not be robust enough to serve as a foundation for policy decisions. Variables other than tax structure or tax burden play vital roles and potentially more potent or more consistent roles in explaining economic competitiveness.
6 See the Economic Competitiveness section of the Technical Appendix for a more in-depth exploration of literature surrounding taxes, tax burden, and economic competitiveness.
Photo credits:
Cover, Washington State Capitol Building, Shutterstock
Page 7, Washington State Capitol Building, Shutterstock
Page 12, Electric car, by Science in HD on Unsplash
Page 12, Shop grinder, by Maxime Agnelli on Unsplash
Page 14, Boeing’s Everett Factory, Wikipedia
Page 16, Port of Seattle, by Kalea Morgan on Unsplash
Page 18, Corporate life, by Negative Space on Pexels
Page 21, Family hiking, Alberto Casetta on Unsplash
Page 24, Seattle Apartments, Shutterstock
Page 26, Industrial worker, by Science in HD on Unsplash
Page 28, Light rail to University of Washington, by Lukas Robertson on Unsplash
Page 32, Port of Seattle, by Andy Li on Unsplash
Page 32, Chess, by Josh Appel on Unsplash
Page 33, Child reading, by Josh Applegate on Unsplash
34TAX STRUCTURE WORK GROUP PRELIMINARY REPORT Results of Economic Analyses | DECEMBER 2020

Technical Notes
Tax Structure Work Group
Preliminary Report
TECHNICAL NOTES
Prepared for: Washington State Legislature
Technical Notes Report
The Department of Revenue provided a more detailed summary of its economic modeling and analyses in the attached “Technical Notes” document. The “Preliminary Report” and “Technical Notes” complement each other.
35 TAX STRUCTURE WORK GROUP PRELIMINARY REPORTDECEMBER 2020 | Results of Economic Analyses

Prepared for Washington State Legislature, December 2020